introduction purpose and scope - cambridge, ma
TRANSCRIPT
Report Summary for the Geotechnical Field Exploration Program and Environmental Site Assessment Tobin School
Memorandum
To: Mr. Michael J. Black Construction Project Manager City of Cambridge, Massachusetts From: Evan Benson Nick Castonguay, P.G.
Vivian Chan, P.E. Reviewed By: Kathleen Murtagh, P.E. Kathleen Murphy, P.E. Date: July 17, 2018 Subject: Geotechnical Field Exploration Program and Environmental Site Assessment Tobin School Assessment Cambridge, Massachusetts
Introduction This memorandum summarizes the results of CDM Smith’s Phase 1 and Phase 2 geotechnical and environmental subsurface exploration and laboratory testing programs, groundwater sampling, and permeability testing conducted from July 2017 to March 2018 for the proposed new Tobin School campus located in Cambridge, Massachusetts. This memorandum includes available subsurface data collected for this project and supplements the previous conceptual geotechnical and environmental assessments included in the following documents: Summary of Geotechnical Field Exploration Programs and Conceptual Geotechnical Engineering Considerations and Recommendations, dated November 17, 2017 and Environmental Site Assessment Summary, dated October 26, 2017.
Purpose and Scope The purpose of this memorandum is to summarize the data gathered during the Phase 1 and Phase 2 geotechnical and environmental field programs for the Tobin and Vassal Lane Upper School campus. This data is intended for use by the City of Cambridge (City) to develop a list of alternative options for design and construction of the new school campus. In particular, the scope of work included the following tasks:

Mr. Michael J. Black July 17, 2018 Page 2
Report Summary for the Geotechnical Field Exploration Program and Environmental Site Assessment Tobin School
Review existing drawings and available subsurface information;
Conduct a Phase 1 subsurface exploration program consisting of fifteen (15) test borings (CDM-1 through CDM-15) to depths ranging from 40 to 94 feet below ground surface (bgs) and obtain soil and rock samples for geotechnical and environmental laboratory testing;
Install five (5) pairs of groundwater monitoring wells for a total of ten (10) wells. Each monitoring well pair included one (1) shallow groundwater monitoring well and one (1) deep groundwater monitoring well for groundwater elevation monitoring and groundwater sampling;
Install and sample twenty-eight (28) landfill gas probes around the entire property line
Screen for the presence of landfill gas at the ten (10) groundwater wells as well as existing on-site and off-site utility manholes.
Conduct a Phase 1 test pit program consisting of two (2) test pits (TP-101 and TP-102) to depths ranging from 12 to 13.5 feet bgs to explore the physical composition of the fill materials;
Conduct a Phase 2 subsurface exploration program consisting of twenty-two (22) test borings (CDM-101A through CDM-120) to depths ranging from 5 to 36 feet bgs to observe the limits of the waste material and obtain soil samples for geotechnical laboratory testing;
Conduct a Phase 2 test pit program consisting of three (3) test pits (TP-201, TP-203, and TP 204) to depths ranging from 16 to 22 feet bgs to further explore the physical composition of the fill and waste materials;
Conduct two rounds of groundwater sampling with environmental laboratory testing;
Conduct in-situ instantaneous change in head (slug) testing in five (5) shallow monitoring wells and five (5) deep monitoring wells to estimate hydraulic conductivity of the subsurface soils and waste materials; and
Prepare this memorandum presenting the data gathered from the Phase 1 and Phase 2 subsurface exploration programs.
Existing Site Conditions The existing Tobin School campus is located at 197 Vassal Lane in Cambridge, Massachusetts. The site is located within a mixed residential and commercial area and is bounded by Vassal Lane to the south, Concord Avenue to the north, residences along Alpine Street to the east, and a gas station, commercial properties and the Cambridge Armory to the west. Fresh Pond water supply reservoir is located approximately 400 feet to the west of the site across Fresh Pond Parkway.

Mr. Michael J. Black July 17, 2018 Page 3
Report Summary for the Geotechnical Field Exploration Program and Environmental Site Assessment Tobin School
The project site is an approximately 9-acre City of Cambridge property. The existing Tobin School is located on the south side of the site and consists of a three-story concrete structure constructed in the early 1970’s with an approximate footprint of 59,000 square feet. The school structure houses pre-K through 8th grade students currently attending the Tobin Montessori School and Vassal Lane Upper School.
The school has three accessible utility rooms (referred to as large crawl spaces on school blueprint plans) located on the first floor at the north, east and west ends of the building. According to available drawings, the existing school structure is supported on a combination of concrete piles and timber piles with the top of pile cap elevations range from approximately elevation (El). 14.0 to El. 29.3. North of the existing school is the Callanan playground and field complex, which extends to Concord Avenue. The site is relatively flat with grades typically ranging from approximately El. 20 to El. 23. A few localized high and low spots exist around landscaped areas, loading dock and patios.
Based on the site history, the area was once used for clay mining. After mining activities ceased, the clay pit was used as an uncontrolled waste pit (1930s through the 1950s) prior to development of the current school and recreational field. Available historical aerial photos and maps dated back to the late 1800’s and early 1900’s are included in Attachment A.
The site is located within an area of known impacts under the Massachusetts Contingency Plan (MCP). Due to the presence of the waste materials beneath the Tobin School property, a sub-slab depressurization and venting system was installed in the early 1990’s at the school to prevent the migration of landfill gas and any volatile organic vapors from migrating into the school building indoor air. In addition, the Tobin School property currently has a Response Action Outcome (RAO) Statement with an activity and use limitation (AUL) which was filed by CDM Smith in 1999. The AUL allowed continued normal use of the school building and grounds, but restricted access to the soil and groundwater beneath the site at depths greater than three feet below ground surface. Thus, typical activities of education, recreation, and temporary maintenance were permitted, and it was required that the pavement, school building foundation, and top layer of soil be maintained as a barrier to the potentially contaminated soil beneath. Any activities that require disturbing the soil below three feet deep are not permitted without a soil management plan prepared by a Licensed Site Professional (LSP).
Elevations noted herein are in feet and referenced to Cambridge City Base (CCB).
Subsurface Exploration Programs Previous Subsurface Exploration Programs 1966 and 1968 Subsurface Exploration Programs (by others) Previous subsurface investigations were conducted at the Tobin School property by New England Test Boring Corporation during October to November 1966 and January 1968. The investigations included twenty-four (24) test borings to depths ranging from 25.5 to 97 feet bgs. The equipment type and methods used to conduct these test borings are unknown. Groundwater levels were

Mr. Michael J. Black July 17, 2018 Page 4
Report Summary for the Geotechnical Field Exploration Program and Environmental Site Assessment Tobin School
measured at the conclusion of drilling. Rock coring was performed at five (5) test boring locations, Borings #2, #17, #18, #19, and #20. Monitoring wells were installed at two (2) test boring locations, Borings #3 and #6. It is unknown if any laboratory testing was performed.
The approximate locations of the 1966 and 1968 test borings were scaled from available drawings and are shown on Figure 1. Test boring logs from the 1966 and 1968 subsurface exploration programs are included in Attachment B.
1997-1998 CDM Investigation Program Between September 1997 and April 1998, a program of soil sampling and analysis was conducted by CDM to characterize the fill beneath the school grounds and playing fields. Based on the results of the soil sampling and analysis program, two contaminated soil hot spots were identified: (1) a polyaromatic hydrocarbon (PAH) hot spot and (2) a lead hot spot. The PAH hot spot was located within the southeastern quadrant of the playing fields and covered an area of approximately 3,200 square feet. The lead hot spot was located near Concord Avenue between the tot lot and the Armory property boundary and covered an area of approximately 100 square feet. These hot spots were removed and confirmatory samples were collected.
Three groundwater monitoring wells were located within the boundaries of the former clay pit and were sampled three times between August 1997 and June 1998. Among the wells, the depth to groundwater ranged from 3.7 feet to 7.5 feet bgs. Groundwater lead concentrations were found to exceed the MCP GW-3 Groundwater Standard.
The approximate locations of the 1997 and 1998 test borings are presented in a plan included in Attachment B.
2000 and 2001 Subsurface Exploration Programs (by others) Previous subsurface investigations were conducted at the adjacent National Guard Armory property by Clean Harbors Environmental Services, Inc. of Weymouth, MA. The subsurface exploration program included seven (7) direct-push method Geoprobe borings, B-1, B-4, B-6, and CHI-4 through CHI-7 in March 2000 and eleven (11) test borings, B-13 through B-18, and CHI-8 through CHI-12, drilled in February 2001. The direct-push method Geoprobe borings were advanced with 2-inch sleeves to depths ranging from 12.0 and 20.0 feet bgs and the test borings were drilled 4-1/4-inch inside diameter hollow stem augers to depths ranging from 8.0 to 22.0 feet bgs. Soil samples were collected during borehole advancement and were screened using a photoionization detector (PID) for volatile organic compounds (VOCs). Soil samples were collected at select intervals at all Geoprobe and test boring locations for volatile petroleum hydrocarbons (VPH), extractable petroleum hydrocarbons (EPH), polyaromatic hydrocarbons (PAHs) and lead.
Groundwater levels were measured at each test boring and geoprobe boring location. In addition, groundwater monitoring wells were installed at nine (9) locations, CHI-4 through CHI-12, for collection of groundwater samples for environmental characterization.

Mr. Michael J. Black July 17, 2018 Page 5
Report Summary for the Geotechnical Field Exploration Program and Environmental Site Assessment Tobin School
The approximate locations of the 2000 and 2001 test borings were scaled from available drawings and are shown on Figure 1. Geoprobe and test boring logs from the 2000 and 2001 subsurface exploration program are included in Attachment B.
Recent Subsurface Exploration Programs A two-phase subsurface exploration program was conducted at the site to further investigate the subsurface soil, rock and groundwater conditions at the site, identify the extent of waste materials and collect samples for geotechnical and environmental laboratory testing. The as-drilled test boring locations for Phase 1 were located in the field by survey, Phase 2 locations were located in the field by taping and line of sight from existing site features and are shown on Figure 1.
2017 Phase 1 Subsurface Exploration Program The Phase 1 subsurface exploration program included fifteen (15) test borings, CDM-1 through CDM-15. The test borings were drilled by New England Boring Contractors of Derry, NH between July 17 and August 9, 2017 using either an ATV-mounted drill rig or a truck-mounted drill rig.
Test borings were advanced using a 4-inch inside diameter (I.D.) steel casing and drive and wash drilling techniques. The depths of the test borings ranged between 40 and 94 feet bgs.
Continuous split spoon sampling was typically conducted in soils located the upper 30 feet or until naturally deposited soils had been encountered, and then at standard, 5-foot intervals below, in accordance with ASTM D1586 (using a 2-inch outside-diameter (O.D.) sampler, driven 24 inches by blows from a 140-pound hammer falling freely for 30-inches). Split spoon samplers were also occasionally driven with a 300-pound hammer falling freely for 30-inches as noted on the test boring logs. The number of blows required to drive the sampler each 6-inch increment was recorded and the Standard Penetration Test (SPT) resistance (N-Value) was determined as the sum of the blows over the middle 12 inches of penetration. Split spoon refusal was encountered at test boring locations CDM-1, CDM-2, CDM-7, CDM-8, CDM-14, and CDM-15 and is defined as less than 6 inches of penetration for 100 blows from a 140-pound hammer. When a refusal condition was encountered, the number of blows at the corresponding depth of penetration was recorded over the length of penetration.
Upon split spoon sampler retrieval, soils were examined for visual evidence (i.e., staining, discoloration) and olfactory indications (i.e., odors) of contamination. Soil samples collected from test borings were screened using a PID to determine the presence of VOCs. A CDM Smith representative visually classified the soil samples recovered in accordance with the Burmister classification system. Representative soil samples from each split spoon were collected, logged and stored in jars for subsequent review and geotechnical laboratory testing. Environmental samples were also collected at select intervals at all test boring locations and were stored in corresponding jars and vials and were relinquished to Alpha Analytical in Westborough, Massachusetts for laboratory testing. Further details related to the environmental sampling and testing are provided in the Environmental Data Summary below.

Mr. Michael J. Black July 17, 2018 Page 6
Report Summary for the Geotechnical Field Exploration Program and Environmental Site Assessment Tobin School
Undisturbed tube sampling was conducted at selected locations in fine-grained (cohesive) soils using standard Shelby tube sampler and in general accordance with ASTM D-1587. Shelby tube samples were trimmed at both ends of the tube and were sealed with plastic caps, tape and wax for subsequent review and laboratory testing.
Rock coring was conducted with an NX core barrel in accordance with ASTM D2113 at five (5) test boring locations. Rock core samples were described and logged in the field by a CDM Smith representative. The rock core description included percent recovery, Rock Quality Designation (RQD), orientation and frequency of fractures, observed fracture infilling or coatings, the weathering state of the core, and other characteristics of note. The RQD was determined for each core run by dividing the total length of the rock core segments longer than 4 inches over the total length of the core run. The time to advance each foot of rock core was also recorded during the rock coring process. All geotechnical soil samples and rock cores were transported to the CDM Smith Geotechnical Laboratory in Somerville, MA for review and geotechnical laboratory testing.
When possible, groundwater levels at the test boring locations were estimated from the condition of the samples obtained (observed soil moisture, staining, etc.) and/or by the observed water levels within the borehole at the time of drilling. However, with the drive and wash drilling method, groundwater level readings taken during drilling are not generally considered reliable due to the introduction of the drilling fluids into the borehole.
All test borings were backfilled with cement grout to the ground surface upon completion. All excess drill cuttings and drilling fluids were placed into 55-gallon drums and subsequently removed from the site at the completion of the drilling program.
Daily temperatures ranged from 61°F to 83°F, with an average of 73°F, during the course of the field program.
Test boring logs and rock core logs, prepared by CDM Smith, are included as Attachment C. Photographs of rock cores are included in Attachment D.
2018 Phase 2 Subsurface Exploration Program The Phase 2 subsurface exploration program included twenty-two (22) test borings, CDM-101A, CDM-101B, CDM-102A, and CDM-102B through CDM-120. The test borings were drilled by New England Boring Contractors of Derry, NH between January 22 and February 2, 2018 using an ATV-mounted drill rig.
Test borings were advanced using a 4-inch inside diameter (I.D.) steel casing and drive and wash drilling techniques. The depths of the test borings ranged between 5 and 36 feet bgs.
Continuous split spoon sampling was conducted generally from ground surface until termination at all test boring locations, in accordance with ASTM D1586 (using a 2-inch outside-diameter (O.D.) sampler, driven 24 inches by blows from a 140-pound hammer falling freely for 30-inches). The number of blows required to drive the sampler each 6-inch increment was recorded and the SPT N-

Mr. Michael J. Black July 17, 2018 Page 7
Report Summary for the Geotechnical Field Exploration Program and Environmental Site Assessment Tobin School
Value was determined as the sum of the blows over the middle 12 inches of penetration. Split spoon refusal was encountered at test boring locations CDM-102A, CDM-112, and CDM-116 and is defined as less than 6 inches of penetration for 100 blows from a 140-pound hammer. When a refusal condition was encountered, the number of blows at the corresponding depth of penetration was recorded over the length of penetration.
Upon split spoon sampler retrieval, soils were examined for visual evidence (i.e., staining, discoloration) and olfactory indications (i.e., odors) of contamination. All soil samples collected from the test borings were screened using a PID to determine the presence of VOCs. A CDM Smith representative visually classified the soil samples recovered in accordance with the Burmister classification system. Representative soil samples from each split spoon were collected, logged and stored in jars for subsequent review and geotechnical laboratory testing. No additional environmental sampling was conducted during this second Phase of borings.
When possible, groundwater levels at the test boring locations were estimated from the condition of the samples obtained (observed soil moisture, staining, etc.) and/or by the observed water levels within the borehole at the time of drilling. However, with the drive and wash drilling method, groundwater level readings taken during drilling are not generally considered reliable due to the presence of the drilling fluids in the borehole.
All geotechnical soil samples were transported to the CDM Smith Geotechnical Laboratory in Somerville, MA for review and geotechnical laboratory testing.
All test borings were backfilled with cement grout or hydrated bentonite chips to the ground surface upon completion. All excess drill cuttings and drilling fluids were placed into 55-gallon drums and subsequently removed from site at the completion of the drilling program.
Daily temperatures ranged from 24°F to 44°F, with an average of 32°F, during the course of the program. Test boring logs, prepared by CDM Smith, are included as Attachment E.
2017 Phase 1 Groundwater Monitoring Well Installation During Phase 1 of the subsurface exploration field program, a total of 5 groundwater monitoring well couplets (one shallow well and one deep well per location) were installed nearby five (5) test boring locations, CDM-3, CDM-4, CDM-7, CDM-9, CDM-14 to allow for collection of the following information:
Groundwater quality within and downgradient of the waste/fill deposits.
Groundwater elevation, groundwater flow direction, flow rates, vertical gradients.
Landfill gas concentrations in the shallow sub-surface and within deeper waste/fill.
Each groundwater monitoring well couplet consisted of one (1) shallow groundwater monitoring well (designated as MW-S) and one (1) deep groundwater monitoring well (designated as MW-D)

Mr. Michael J. Black July 17, 2018 Page 8
Report Summary for the Geotechnical Field Exploration Program and Environmental Site Assessment Tobin School
located about 3 to 5 feet apart. The shallow monitoring wells were screened across the water table and generally across the granular fill/waste interface at about 2 to 18 feet bgs. The deeper wells were generally screened within the waste materials at depths ranging from 17 to 30 feet bgs. All monitoring wells are installed in separate boreholes offset from the original test boring locations.
The monitoring wells were constructed using 10 to 15-foot long, 2-inch diameter, schedule 40 polyvinyl chloride (PVC) pipe with 0.01-inch machine slots. The monitoring well riser pipe was constructed of 2-inch diameter, schedule 40 threaded PVC. The annulus around the well screen was backfilled with a filter pack to approximately 2 feet above the well screen. Above the filter pack, the wells annular space were backfilled with a 1-foot minimum bentonite clay seal and the remaining annular space around the PVC backfilled with cement grout. The surface was sealed with approximately 6 inches of concrete and a protective flush-mount road box was installed at each well location. The monitoring well installation/construction logs, prepared by CDM Smith, are included in Attachment H.
Recent Test Pit Programs To further investigate and identify the limits, physical composition, and extent of subsurface fill and waste materials, a two-phase test pit program was conducted in December 2017 and February 2018. Test pit locations were located in the field by taping and line of sight from existing site features and are shown on Figure 1.
2017 Phase 1 Test Pit Program The Phase 1 test pit program included two (2) test pits, TP-101 and TP-102. The test pits were excavated by Charter Contracting, LLC. of Boston, MA on December 28, 2017. Each test pit was excavated using a Takeuchi TB-290 mini-excavator to depths between 12 to 13.5 feet bgs. Each of the test pits were approximately 5 feet wide and 12 feet long. A CDM Smith field representative visually classified and logged excavated soil in general accordance with the Burmister classification system. A description of debris encountered during the excavation was recorded. The observed groundwater levels were measured within each test pit at the time of excavation.
During excavation, soils were examined for visual evidence (i.e., staining, discoloration) and olfactory indications (i.e., odors) of contamination. Representative soil samples collected from each test pit were screened using a PID to determine the presence of VOCs. Four (4) multi-gas monitors were placed approximately 20 feet at different directions from each test pit to screen for the presence of hazardous gas in ambient air that might be released during excavation. In addition, the PID was also used to determine the presence of VOCs in ambient air.
All excavated soils were segregated and placed on polyethylene sheeting. Each test pit was backfilled to the ground surface upon completion with soils being placed in the general order in which they were removed, capping the excavation with the excavated upper granular fill material and topsoil. The average daily temperature was 9°F during the test pit program. Phase 1 test pit logs, prepared by CDM Smith, are included as Attachment F.

Mr. Michael J. Black July 17, 2018 Page 9
Report Summary for the Geotechnical Field Exploration Program and Environmental Site Assessment Tobin School
2018 Phase 2 Test Pit Program The Phase 2 test pit program included three (3) test pits, TP-201, TP-203, and TP-204. The test pits were excavated by Charter Contracting, LLC. of Boston, MA between February 20 and February 23, 2018. Each test pit was excavated using a Komatsu PC-228 excavator to depths between 16 and 22 feet bgs. The test pits varied from approximately 5 to 8 feet wide and 12 to 14 feet long.
A CDM Smith field representative visually classified and logged excavated soil in general accordance with the Burmister classification system. A description of debris encountered during the excavation was recorded. The observed groundwater levels were measured within each test pit at the time of excavation.
During excavation, soils were examined for visual evidence (i.e., staining, discoloration) and olfactory indications (i.e., odors) of contamination. Representative soil samples collected from each test pit were screened using a PID for VOCs to assess the possible presence of organic vapors. Four (4) multi-gas monitors were placed approximately 20 feet at different locations from each test pit to screen for the presence of hazardous gas in ambient air that may be released during excavation.
All excavated soils were segregated and placed on polyethylene sheeting. Each test pit was backfilled to the ground surface upon completion with soils being placed in the order in which they were removed, capping the excavation with the excavated upper granular fill and topsoil.
Average daily temperatures ranged from 56°F to 57°F during the test pit program. Phase 2 test pit logs, prepared by CDM Smith, are included as Attachment G.
Geotechnical Laboratory Testing Geotechnical laboratory tests were completed on select soil samples obtained from Phase 1 and Phase 2 test borings to characterize the physical and engineering properties. All geotechnical laboratory test was performed at the CDM Smith Geotechnical Testing Laboratory in Somerville, Massachusetts.
2017 Phase 1 Geotechnical Laboratory Testing Moisture content analyses were performed on sixty-five (65) soil samples in accordance with ASTM D2216. Gradation analyses were performed on twenty-three (23) soil samples in accordance with ASTM D-6913 and ASTM D-7928. Atterberg Limits were performed on forty-two (42) soil samples in accordance with ASTM D-4318. Organic content analyses were performed on two (2) soil samples in accordance with ASTM D-2974. Laboratory Mini Vane Shear analyses were performed on nine (9) soil samples in accordance with ASTM D-4648. Constant Rate of Strain (CRS) consolidation tests were performed on five (5) soil samples in accordance with ASTM D-4186. Isotropically Consolidated Undrained (CIU) triaxial compression tests were performed on three (3) soil samples in accordance with ASTM D-4767.

Mr. Michael J. Black July 17, 2018 Page 10
Report Summary for the Geotechnical Field Exploration Program and Environmental Site Assessment Tobin School
A summary of the geotechnical index test results is presented in Table 1. A summary of the consolidation test results is presented in Table 2. A summary of the triaxial compression test results is presented in Table 3. The geotechnical laboratory test results are included as Attachment I.
2018 Phase 2 Geotechnical Laboratory Testing Moisture content analyses were performed on twenty-five (25) soil samples in accordance with ASTM D2216. Gradation analyses were performed on fifteen (15) soil samples in accordance with ASTM D-6913 and ASTM D-7928. Atterberg Limits were performed on six (6) soil samples in accordance with ASTM D-4318. Organic content analyses were performed on six (6) soil samples in accordance with ASTM D-2974.
A summary of the geotechnical index test results is presented in Table 1. The geotechnical laboratory test results are included as Attachment J.
In-Situ Permeability Slug Testing As part of the Phase 2 geotechnical and environmental investigations, instantaneous change in head (slug) testing was performed at the five (5) shallow monitoring wells and five (5) deep monitoring wells to estimate the hydraulic conductivity of the shallow fill and deeper waste materials. Slug testing was performed and logged in the field by a CDM Smith representative on March 1, 2018.
At each groundwater monitoring well location, a 5 foot long weighted PVC cylinder (slug) was introduced to the well to displace the water as a data logger (pressure transducer) recorded the water level response. Initially, a falling head test was performed by quickly lowering the slug into the well to temporarily elevate the water level while the time for water level recovery to static condition was recorded. Subsequently, a rising head test was performed by quickly removing the slug from the well to temporarily lower the water level while the time for water level recovery to static condition was recorded. The rate at which the water level rises or falls is used to estimate the horizontal hydraulic conductivity. The water level response data measured by a pressure transducer was analyzed using a software package for aquifer test data plotting and evaluation (AQTESOLV ™), which applied the Bouwer and Rice (1976) and Springer-Gelhar (1991) methods to calculate horizontal hydraulic conductivity.
A summary of the hydraulic conductivity test results is presented in Table 4. The slug test logs and results are included as Attachment K.
Geotechnical Site Assessment Subsurface Conditions In general, subsurface conditions encountered during the recent test boring program conducted within the proposed project site are consistent with those encountered during previous subsurface investigations. The subsurface condition generally consisted of Pavement or Topsoil, Granular Fill, Waste Fill, Organic Soils, Clay & Silt, Glacial Till, Weathered Rock, and Bedrock.

Mr. Michael J. Black July 17, 2018 Page 11
Report Summary for the Geotechnical Field Exploration Program and Environmental Site Assessment Tobin School
Pavement Pavement consisting of asphalt or concrete was encountered at the ground surface at five (5) Phase 1 test boring locations (CDM-7, CDM-8, CDM-9, CDM-10 and CDM-12), and ten (10) Phase 2 test boring locations (CDM-101A through CDM-103, CDM-108 through CDM-110, CDM-117, and CDM-120). Where encountered, the pavement layer ranged in thickness of approximately 4 to 6 inches.
Topsoil Topsoil was encountered at the ground surface at eight (8) Phase 1 test boring locations (CDM-1 through CDM-6, CDM-13, and CDM-15), nine (9) Phase 2 test boring locations (CDM-104 through CDM-106, CDM-111 through CDM-113, CDM-115, CDM-116, CDM-118, and CDM-119), one previous test boring (Boring #15), and at all recent test pit locations. Where encountered, the topsoil layer ranged in thickness of approximately 3 to 12 inches at recent test boring and test pit locations and 1.5 feet in previous test boring locations. This layer typically consisted of light to dark brown, fine SAND and SILT, trace to no fine gravel.
Granular Fill Granular Fill was encountered at all recent test boring and test pit locations, and at sixteen (16) previous test borings (Boring #2, Boring # 8 through Boring #12, Boring #14 and Boring #16, B-13 through B-15, B-17, CHI-8, CHI-9, CHI-11, CHI-12). Granular Fill was encountered at the ground surface or just below pavement or topsoil. The Granular Fill layer ranged between 1.2 and 11.5 feet thick at recent test boring locations and 2.5 to 7.0 feet thick at the previous test boring locations. This layer typically consisted of very loose to very dense, dark to light brown, gray, tan, or black, fine to coarse SAND with varying amounts of gravel and silt. SPT N-values ranges from 3 blows/foot (bl/ft) to 127 bl/ft, with an average of 38 bl/ft at recent test boring locations.
Waste Fill Waste Fill was encountered at nine (9) of the Phase 1 test boring locations (CDM-1, CDM-3 through CDM-5, CDM-7 through CDM-9, CDM-11, and CDM-14), fifteen (15) of the Phase 2 test boring locations (CDM-101B, CDM-102A, CDM-103, CDM-104, CDM-106, CDM-108 through CDM-113, CDM-116, CDM-118 through CDM-120), thirty-two (22) of the previous test boring locations (Boring #1, Boring #2A, Boring #3 through Boring #7, Boring #9 through Boring #15A, and Boring #17 through Boring #24, B-13, B-14, B-15 through B-18, CHI-8 through CHI-12), seven (7) of the previous Geoprobe locations (B-1, B-4, B-6, CHI-4 through CHI-7), and at all of the recent test pit locations. Figure 2 shows the approximate extent of the waste fill material based on the soil borings and test pits conducted to date.
Waste Fill was encountered just below the Granular Fill at all locations with the exception of the previous 2000 Geoprobe locations and at three (3) previous 2001 test boring locations (B-16, B-18, and CHI-10) where Waste Fill was encountered at the ground surface. This layer ranged between 2.3 and 30 feet thick at test boring locations, and 6 to 25 feet thick at previous test boring locations. This layer typically consisted of very loose to very dense, dark brown to brown, light gray to gray, or black, fine to coarse SAND, with varying amounts of gravel, silt, brick, concrete, coal, ash, cinders,
Mr. Michael J. Black July 17, 2018 Page 12
Report Summary for the Geotechnical Field Exploration Program and Environmental Site Assessment Tobin School
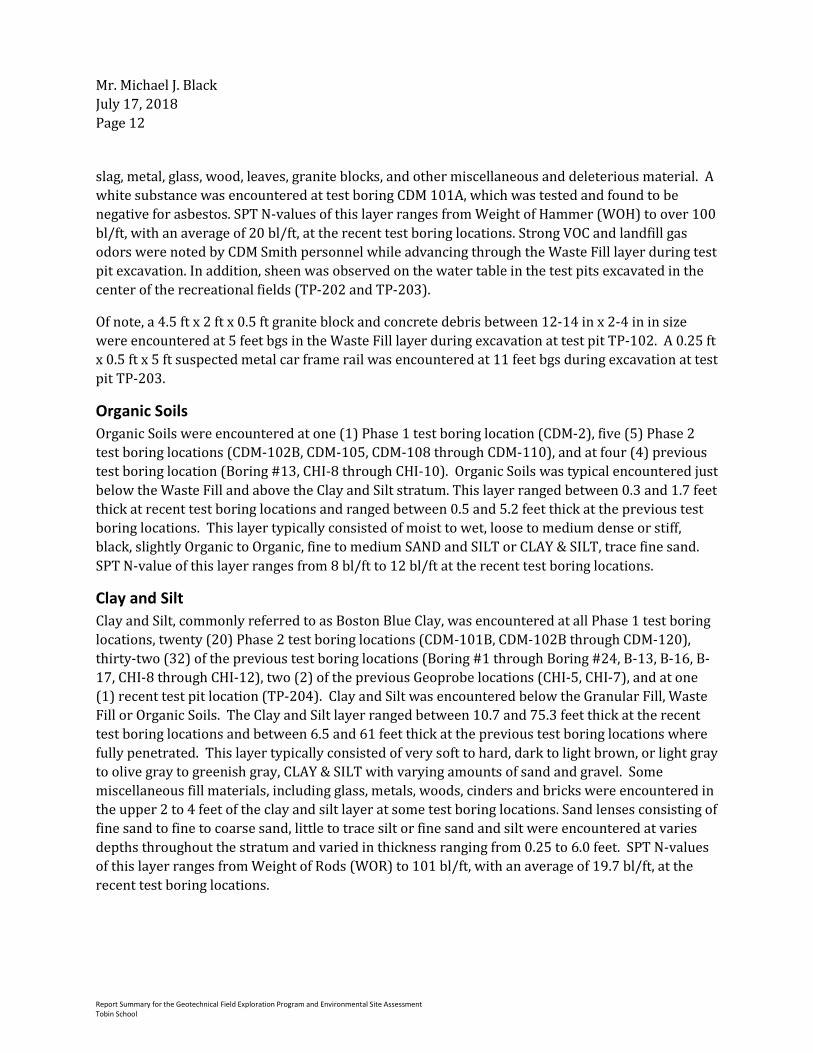
slag, metal, glass, wood, leaves, granite blocks, and other miscellaneous and deleterious material. A white substance was encountered at test boring CDM 101A, which was tested and found to be negative for asbestos. SPT N-values of this layer ranges from Weight of Hammer (WOH) to over 100 bl/ft, with an average of 20 bl/ft, at the recent test boring locations. Strong VOC and landfill gas odors were noted by CDM Smith personnel while advancing through the Waste Fill layer during test pit excavation. In addition, sheen was observed on the water table in the test pits excavated in the center of the recreational fields (TP-202 and TP-203).
Of note, a 4.5 ft x 2 ft x 0.5 ft granite block and concrete debris between 12-14 in x 2-4 in in size were encountered at 5 feet bgs in the Waste Fill layer during excavation at test pit TP-102. A 0.25 ft x 0.5 ft x 5 ft suspected metal car frame rail was encountered at 11 feet bgs during excavation at test pit TP-203.
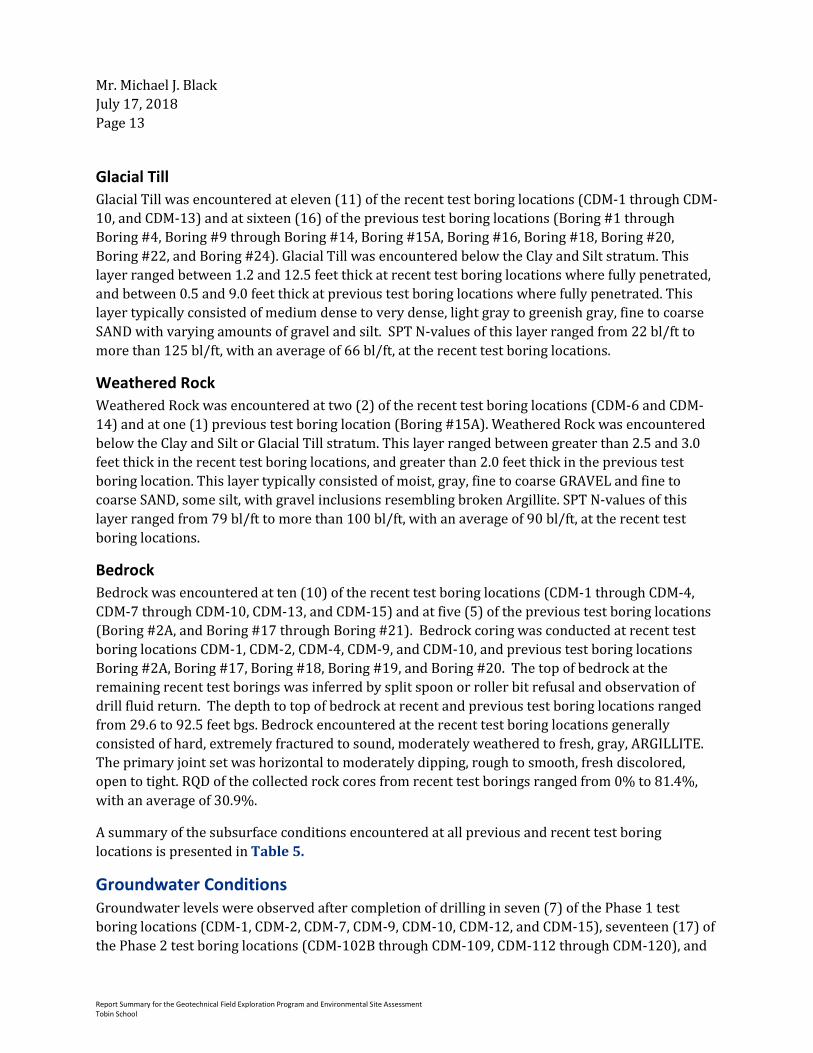
Organic Soils Organic Soils were encountered at one (1) Phase 1 test boring location (CDM-2), five (5) Phase 2 test boring locations (CDM-102B, CDM-105, CDM-108 through CDM-110), and at four (4) previous test boring location (Boring #13, CHI-8 through CHI-10). Organic Soils was typical encountered just below the Waste Fill and above the Clay and Silt stratum. This layer ranged between 0.3 and 1.7 feet thick at recent test boring locations and ranged between 0.5 and 5.2 feet thick at the previous test boring locations. This layer typically consisted of moist to wet, loose to medium dense or stiff, black, slightly Organic to Organic, fine to medium SAND and SILT or CLAY & SILT, trace fine sand. SPT N-value of this layer ranges from 8 bl/ft to 12 bl/ft at the recent test boring locations.
Clay and Silt Clay and Silt, commonly referred to as Boston Blue Clay, was encountered at all Phase 1 test boring locations, twenty (20) Phase 2 test boring locations (CDM-101B, CDM-102B through CDM-120), thirty-two (32) of the previous test boring locations (Boring #1 through Boring #24, B-13, B-16, B-17, CHI-8 through CHI-12), two (2) of the previous Geoprobe locations (CHI-5, CHI-7), and at one (1) recent test pit location (TP-204). Clay and Silt was encountered below the Granular Fill, Waste Fill or Organic Soils. The Clay and Silt layer ranged between 10.7 and 75.3 feet thick at the recent test boring locations and between 6.5 and 61 feet thick at the previous test boring locations where fully penetrated. This layer typically consisted of very soft to hard, dark to light brown, or light gray to olive gray to greenish gray, CLAY & SILT with varying amounts of sand and gravel. Some miscellaneous fill materials, including glass, metals, woods, cinders and bricks were encountered in the upper 2 to 4 feet of the clay and silt layer at some test boring locations. Sand lenses consisting of fine sand to fine to coarse sand, little to trace silt or fine sand and silt were encountered at varies depths throughout the stratum and varied in thickness ranging from 0.25 to 6.0 feet. SPT N-values of this layer ranges from Weight of Rods (WOR) to 101 bl/ft, with an average of 19.7 bl/ft, at the recent test boring locations.
Mr. Michael J. Black July 17, 2018 Page 13
Report Summary for the Geotechnical Field Exploration Program and Environmental Site Assessment Tobin School
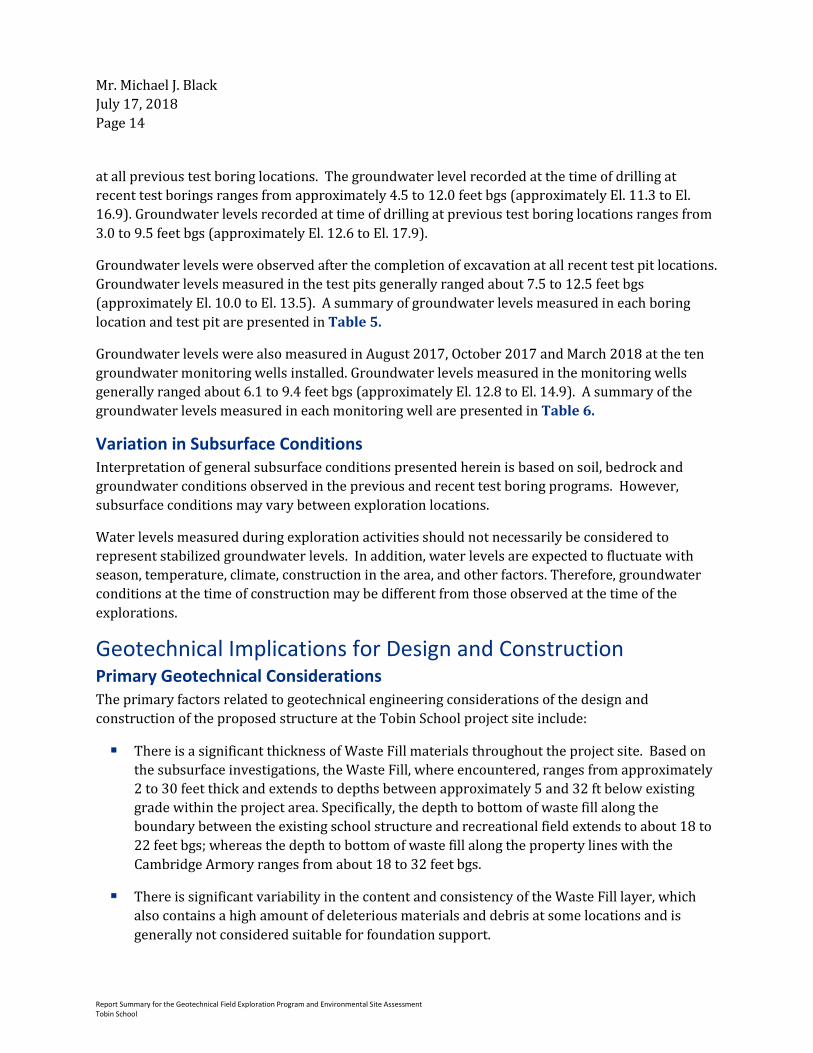
Glacial Till Glacial Till was encountered at eleven (11) of the recent test boring locations (CDM-1 through CDM-10, and CDM-13) and at sixteen (16) of the previous test boring locations (Boring #1 through Boring #4, Boring #9 through Boring #14, Boring #15A, Boring #16, Boring #18, Boring #20, Boring #22, and Boring #24). Glacial Till was encountered below the Clay and Silt stratum. This layer ranged between 1.2 and 12.5 feet thick at recent test boring locations where fully penetrated, and between 0.5 and 9.0 feet thick at previous test boring locations where fully penetrated. This layer typically consisted of medium dense to very dense, light gray to greenish gray, fine to coarse SAND with varying amounts of gravel and silt. SPT N-values of this layer ranged from 22 bl/ft to more than 125 bl/ft, with an average of 66 bl/ft, at the recent test boring locations.
Weathered Rock Weathered Rock was encountered at two (2) of the recent test boring locations (CDM-6 and CDM-14) and at one (1) previous test boring location (Boring #15A). Weathered Rock was encountered below the Clay and Silt or Glacial Till stratum. This layer ranged between greater than 2.5 and 3.0 feet thick in the recent test boring locations, and greater than 2.0 feet thick in the previous test boring location. This layer typically consisted of moist, gray, fine to coarse GRAVEL and fine to coarse SAND, some silt, with gravel inclusions resembling broken Argillite. SPT N-values of this layer ranged from 79 bl/ft to more than 100 bl/ft, with an average of 90 bl/ft, at the recent test boring locations.
Bedrock Bedrock was encountered at ten (10) of the recent test boring locations (CDM-1 through CDM-4, CDM-7 through CDM-10, CDM-13, and CDM-15) and at five (5) of the previous test boring locations (Boring #2A, and Boring #17 through Boring #21). Bedrock coring was conducted at recent test boring locations CDM-1, CDM-2, CDM-4, CDM-9, and CDM-10, and previous test boring locations Boring #2A, Boring #17, Boring #18, Boring #19, and Boring #20. The top of bedrock at the remaining recent test borings was inferred by split spoon or roller bit refusal and observation of drill fluid return. The depth to top of bedrock at recent and previous test boring locations ranged from 29.6 to 92.5 feet bgs. Bedrock encountered at the recent test boring locations generally consisted of hard, extremely fractured to sound, moderately weathered to fresh, gray, ARGILLITE. The primary joint set was horizontal to moderately dipping, rough to smooth, fresh discolored, open to tight. RQD of the collected rock cores from recent test borings ranged from 0% to 81.4%, with an average of 30.9%.
A summary of the subsurface conditions encountered at all previous and recent test boring locations is presented in Table 5.
Groundwater Conditions Groundwater levels were observed after completion of drilling in seven (7) of the Phase 1 test boring locations (CDM-1, CDM-2, CDM-7, CDM-9, CDM-10, CDM-12, and CDM-15), seventeen (17) of the Phase 2 test boring locations (CDM-102B through CDM-109, CDM-112 through CDM-120), and
Mr. Michael J. Black July 17, 2018 Page 14
Report Summary for the Geotechnical Field Exploration Program and Environmental Site Assessment Tobin School
at all previous test boring locations. The groundwater level recorded at the time of drilling at recent test borings ranges from approximately 4.5 to 12.0 feet bgs (approximately El. 11.3 to El. 16.9). Groundwater levels recorded at time of drilling at previous test boring locations ranges from 3.0 to 9.5 feet bgs (approximately El. 12.6 to El. 17.9).
Groundwater levels were observed after the completion of excavation at all recent test pit locations. Groundwater levels measured in the test pits generally ranged about 7.5 to 12.5 feet bgs (approximately El. 10.0 to El. 13.5). A summary of groundwater levels measured in each boring location and test pit are presented in Table 5.
Groundwater levels were also measured in August 2017, October 2017 and March 2018 at the ten groundwater monitoring wells installed. Groundwater levels measured in the monitoring wells generally ranged about 6.1 to 9.4 feet bgs (approximately El. 12.8 to El. 14.9). A summary of the groundwater levels measured in each monitoring well are presented in Table 6.
Variation in Subsurface Conditions Interpretation of general subsurface conditions presented herein is based on soil, bedrock and groundwater conditions observed in the previous and recent test boring programs. However, subsurface conditions may vary between exploration locations.
Water levels measured during exploration activities should not necessarily be considered to represent stabilized groundwater levels. In addition, water levels are expected to fluctuate with season, temperature, climate, construction in the area, and other factors. Therefore, groundwater conditions at the time of construction may be different from those observed at the time of the explorations.
Geotechnical Implications for Design and Construction Primary Geotechnical Considerations The primary factors related to geotechnical engineering considerations of the design and construction of the proposed structure at the Tobin School project site include:
There is a significant thickness of Waste Fill materials throughout the project site. Based on the subsurface investigations, the Waste Fill, where encountered, ranges from approximately 2 to 30 feet thick and extends to depths between approximately 5 and 32 ft below existing grade within the project area. Specifically, the depth to bottom of waste fill along the boundary between the existing school structure and recreational field extends to about 18 to 22 feet bgs; whereas the depth to bottom of waste fill along the property lines with the Cambridge Armory ranges from about 18 to 32 feet bgs.
There is significant variability in the content and consistency of the Waste Fill layer, which also contains a high amount of deleterious materials and debris at some locations and is generally not considered suitable for foundation support.
Mr. Michael J. Black July 17, 2018 Page 15
Report Summary for the Geotechnical Field Exploration Program and Environmental Site Assessment Tobin School
There is significant variation of thickness and stiffness of the Clay & Silt stratum. The thickness of the Clay & Silt stratum varies from approximately 7 to 76 feet at test boring locations where fully penetrated, with the thinner stratum located around the middle of the site and thicker stratum located along the south and west side of the site. The Clay & Silt layer is also generally softer at test borings conducted in the southern and western part of the site.
There is significant variation in the elevation of top of bedrock across the site. Bedrock was encountered approximately 79 to 93 feet bgs along the south side of the site along Vassal Lane and sloped up to approximately 32 feet bgs in the middle of the site, and down again to approximately 47 to 75 feet bgs along the north side of the site along Concord Avenue.
Relatively shallow groundwater was encountered at the site, at depths between approximately 4.5 and 12 feet bgs, which is generally well above the bottom of the waste fill layer.
Based on these factors, below are the primary geotechnical considerations related to the design and construction of the proposed structure at the Tobin School project site.
Structure Foundation Due to the thickness and compressibility of the Clay & Silt stratum located towards the
southern and western side of the site, it is anticipated that if the new school structure is to be located on the southern side of the site (same as the existing school structure), the structure is more likely to be supported on a deep foundation system, similar to the existing school structure.
If the proposed new school building is located on the center to northern part of the site over the existing recreational field where the Clay & Silt stratum is thinner and stiffer, and all of the existing waste fill were removed and replaced with compacted fill materials, it may be possible for the new school structure to be supported on shallow foundation system.
If the proposed new school building is located over the existing recreational field, but some of the waste fill were to remain in place below the school structure, the new structure may either have to be supported on deep foundation system or ground modification of the remaining waste fill would be needed to stabilize and improve the engineering properties of the materials left in place for the new structure to bear on top. Other environmental mitigation measures would also be needed as part of this option. The new structure should not be supported on shallow foundations over untreated waste fill.
The use of a shallow foundation system for the new structure would also depend on the level of structural loading and whether the new structure would have a basement or below grade parking, which can be evaluated upon further development on the proposed school structure.

Mr. Michael J. Black July 17, 2018 Page 16
Report Summary for the Geotechnical Field Exploration Program and Environmental Site Assessment Tobin School
Excavation and Excavation Support Based on the depths and thickness of Waste Fill encountered, excavation to remove all Waste
Fill will create a deep excavation that is well below the groundwater level. The total volume of the Waste Fill is expected to be substantial. The excavation would also be over 30 feet deep and would require excavation support. Installation of excavation support through waste fill containing obstructions will likely require some level of pre-excavation to remove large obstructions prior to installation.
Based on the depth and thickness of the Waste Fill between the existing school and recreational fill, if the existing school is to remain in place during construction, an excavation support system would be required to protect the existing school structure.
Given the shallower bedrock encountered at the central-east part of the site, support for the excavation system may encounter or even be installed into bedrock. The excavation support system type selection and design would need to take into account shallow rock.
The location and geometry of the proposed construction and excavation limits will have a significant impact on the type, complexity and cost of the excavation support system required for this project.
Ground Improvement for Waste Stabilization Ground improvement methods (i.e., deep soil mixing, jet grouting, etc.) may be used as a
method of waste stabilization in lieu of waste removal, to improve the engineering properties of any waste left in place for foundation support of the new structure, as a groundwater cut-off where existing waste/contaminated groundwater at adjacent sites will not be removed (e.g., the Armory), and as a means of excavation support.
Suitability of various ground improvement methods will depend on the composition of the waste to be treated, landfill gas potential, site access, costs, etc. The depth of waste (~32 ft bgs) is within the range of many improvement methods. The general composition of the waste which is primarily sand and gravel with various amounts of debris is generally treatable with several methods. However, obstructions can inhibit effective treatment and may require pre-excavation prior to treatment.
Construction Dewatering Due to the depth of the Waste Fill layer, excavation for full removal of waste will extend well
below the water table. A dewatering system would be required for the removal. A significant treatment process is also anticipated as part of the dewatering system to treat the effluent prior to discharge.
Given the relatively thin Clay & Silt layer encountered underlying the Waste Fill in some areas, the hydraulic conductivity of the Glacial Till layer may affect the amount of

Mr. Michael J. Black July 17, 2018 Page 17
Report Summary for the Geotechnical Field Exploration Program and Environmental Site Assessment Tobin School
groundwater flow into the excavation. To limit the flow, care would need to be taken to not over-excavate the less permeable Clay & Silt at the excavation subgrade level.
Environmental Site Assessment The objective of the environmental site assessment investigations was to evaluate the nature and extent of contamination within subsurface fill and waste materials, shallow and deep groundwater, and subsurface landfill gas at the Tobin School property in support of the proposed excavation of existing fill and waste materials and construction of the new school and recreational fields. In addition, supplemental investigations were also conducted to evaluate whether the presence of waste materials underlying the school and recreational fields are currently impacting indoor air in the school and the surrounding utilities at the property. This information will be documented in a separate technical memorandum.
Soil Sampling The Phase 1 (July-September 2017) and Phase 2 (January-February 2018) environmental field investigations were conducted to evaluate the overall extent of waste/fill materials and to determine the concentrations of contaminants in subsurface soils and fill and waste materials.
During the Phase 1 subsurface exploration program, environmental soil samples were collected at select intervals at all Phase 1 test boring locations (CDM-1 through CDM-15) and relinquished to Alpha Analytical in Westborough, Massachusetts for laboratory testing. No analytical soil samples were collected during the Phase 2 subsurface exploration program During the Phase 1 drilling program, laboratory analytical samples were collected at all fifteen soil boring locations in the shallow soil (0-8 feet bgs, fill/waste materials (8-30 feet bgs) and from the shallow clay directly beneath the waste materials. All soil samples were analyzed for the following parameters:
VOCs (including 1,4-dioxane) using Environmental Protection Agency (EPA) Method 8260C,
Semi-volatile organic compounds (SVOCs) using EPA Method 8270D,
(MCP) 14 Metals using EPA Method 6010C/7471B,
Polychlorinated biphenyls (PCBs) using EPA Method 8082A, and
Massachusetts Department of Environmental Protection (MassDEP) Extractable Petroleum Hydrocarbon (EPH) Method carbon ranges.
Duplicate samples were collected for quality assurance/quality control purposes. Excess soil generated during drilling and drilling fluids were containerized into 55-gallon drums and temporarily stored on-site. Based on the results of soil samples submitted for analytical testing, the waste was profiled and transported off site by Clean Harbors, Inc. Phase 1 drums were transported off site between August and September 2017 and Phase 2 drums were transported off site in February 2018. The drum disposal manifest for both phases are included in Attachment L.
Mr. Michael J. Black July 17, 2018 Page 18
Report Summary for the Geotechnical Field Exploration Program and Environmental Site Assessment Tobin School
The subsurface soils at the Tobin School are categorized as S-1 (from 0-15 ft-BGS), S-1/S-2 (3-15 ft-BGS) and S-3 (>15 feet-bgs). Several metals were detected above their respective soil standards as shown in the soil analytical table (Table 7). Arsenic was detected in sample CDM-9 (14-16 feet bgs) at a concentration of 64.4 mg/kg exceeding the S-2 standard (20 mg/kg) and S-3 standard (50 mg/kg). Zinc was detected in sample CDM-7 (6-8 feet bgs) at a concentration of 18,500 mg/kg exceeding the S-1 standard (1,000 mg/kg) and S-2 standard (3,000 mg/kg). Zinc was detected in sample CDM-9 (14-16 feet bgs) at a concentration of 1,590 mg/kg exceeding the S-1 standard of 1,000 mg/kg. Zinc was also detected in sample CDM-14 (20-22 feet bgs) at a concentration of 18,500 mg/kg exceeding the S-3 standard of 5,000 mg/kg.
Lead was detected in sample CDM-1 (8-10 feet bgs) at a concentration of 417 mg/kg and was also detected in sample CDM-11 (2-4 feet bgs) at a concentration of 550 mg/kg, exceeding the S-1 standard of 200 mg/kg. Lead was detected in sample CDM-1 (24-28 feet bgs), CDM-7 (6-8 ft BGS), CDM-7 (16-18 feet bgs), CDM-8 (6-8 feet bgs), CDM-9 (14-16 feet bgs), CDM-13 (8-12 feet bgs) and CDM-14 (8-10 feet bgs) with concentrations ranging from 816 to 5200 mg/kg, exceeding the applicable S-2 and S-3 standard of 800 mg/kg. Due to the elevated concentrations of lead, toxicity characteristic leaching procedure (TCLP) analysis was completed at locations where the analysis criteria were triggered. At soil sample locations CDM-1 (24-28 feet bgs), CDM-7 (6-8 feet bgs), CDM-8 (8-10 feet bgs), CDM-9 (14-16 feet bgs), and CDM-11 (2-4 feet bgs), leachable lead was detected with concentrations ranging from 7.62 mg/L (CDM-11) to 138 mg/L (CDM-1), exceeding the TCLP Environmental Protection Agency (EPA) hazardous waste limit of 5 mg/L.
SVOCs were also measured above applicable soil standards in several samples. Benzo(a)pyrene was detected in sample CDM-1 (8-10 feet bgs) at a concentration of 2.5 mg/kg, exceeding the S-1 standard of 2 mg/kg. Benzo(a)pyrene was detected in sample CDM-4 (8-10 feet bgs), CDM-8 (8-10 feet bgs), CDM-9 (14-16 feet bgs) and CDM-14 (8-10 feet bgs) with concentrations ranging from 13 to 17 mg/kg, exceeding the applicable S-2 standard of 7 mg/kg. Benzo(a)anthracene was detected in sample CDM-4 (8-10 feet bgs) at a concentration of 28 mg/kg and was also detected in sample CDM-8 (8-10 feet bgs) at a concentration of 17 mg/kg, exceeding the S-1 standard of 7 mg/kg. Dibenzo(a,h)anthracene was detected in sample CDM-8 (8-10 feet bgs) at a concentration of 1.5 mg/kg and was also detected in sample CDM-9 (14-16 feet bgs) at a concentration of 1.7 mg/kg, exceeding the S-1 standard of 0.7 mg/kg. Ideno(1,2,3-cd)perylene was detected in sample CDM-4 (8-10 feet bgs) at a concentration of 8.5 mg/kg, exceeding the S-1 standard of 7.0 mg/kg. EPH compound C11-C22 aromatic was detected in sample CDM-7 (6-8 feet bgs) at a concentration of 1,060 mg/kg, exceeding the S-2/GW-1 standard of 1,000 mg/kg. EPH compound C19-C36 aliphatic was detected in sample CDM-7 (6-8 feet bgs) at a concentration of 3,060 mg/kg, exceeding the S-1 standard of 3,000 mg/kg.
Overall, fill and waste materials contain elevated concentrations of heavy metals (lead, zinc, arsenic), EPH compounds and SVOCs. Some samples exceeded the regulatory limit for TCLP lead indicating that without treatment, this material would be considered a hazardous waste. This material could be treated and disposed of as a non-hazardous waste. Other heavy metals, VOC,

Mr. Michael J. Black July 17, 2018 Page 19
Report Summary for the Geotechnical Field Exploration Program and Environmental Site Assessment Tobin School
SVOC and EPH compounds were detected, however, all detections were below applicable standards. PCB compounds were reported below the laboratory method detection limit at all sampling locations below applicable standards.
Groundwater Sampling Groundwater sampling was conducted in August 2017 and March 2018 at the five well couplets (MW-3S/3D, MW-4S/4D, MW-7S/7D, MW-9S/9D, & MW-14S/14D) to determine the chemical quality of the groundwater at the site with respect to MassDEP groundwater standards and to evaluate potential discharge options associated with dewatering of the site during excavation/construction. Sampling and testing occurred in two phases to evaluate seasonal variability of concentrations. Groundwater sampling was performed by CDM Smith representatives between August 16 and August 17, 2018 for Phase 1 and on March 1, 2018 for Phase 2. A summary of the August 2017 and March 2018 groundwater analytical data is presented in Table 8 and Table 9, respectively and the laboratory reports are included in Attachment M.
Groundwater sampling was conducted using low flow groundwater sampling procedures in accordance with U.S Environmental Protection Agency’s (EPA) low flow guidance document (Revised September 19, 2017). The static depth to water and depth to the well bottom were recorded prior to sampling. An adjustable rate peristaltic pump was used to purge each well and collect the samples. While purging, field parameters including conductivity, specific conductance, pH, temperature, dissolved oxygen (DO), and oxidation-reduction potential (ORP) were measured and recorded. Analytical samples for were collected after field parameter stabilization and preserved in the field prior to relinquishment to Alpha Analytical in Westborough, Massachusetts for laboratory analysis.
Groundwater samples were analyzed for the following parameters:
Volatile Organic Compounds (VOCs) (8260/5053);
Semivolatile Organics (SVOCs) (8270D/SIM);
Polychlorinated Biphenyls (PBCs) (8082);
MCP Extractable Petroleum Hydrocarbons (EPHs), Carbon-ranges only (EPH-04-1.1);
MCP 14 Total Metals (6010C/7471B) – Phase 1;
MCP 14 Dissolved Metals (6010C/7471B) - Phase 2.
Groundwater at the site is categorized as GW-1 only in the far western portion of the site (area of MW-7S/7D) due to the Zone A surface water protection zone for the Fresh Pond Reservoir. Groundwater is categorized as GW-2 for any location within 30 feet of the school building where the water table depth is less than 15 feet bgs (MW-9S/9D and MW-14S/14D). Groundwater at the entire site is categorized as GW-3 due to the potential for discharge to the Fresh Pond Reservoir,

Mr. Michael J. Black July 17, 2018 Page 20
Report Summary for the Geotechnical Field Exploration Program and Environmental Site Assessment Tobin School
located to the west and downgradient of the Tobin School property. Due to the total metal exceedances at select well locations during Phase 1, samples were collected for dissolved metals during Phase 2. A well location plan identifying the surface water protection zones are presented on Figure 3. During the August 2017 monitoring round, total barium was detected at a concentration of 3,660 ug/L and 2,060 ug/L in the samples collected from MW-7S and MW-7D, respectively, exceeding the applicable GW-1 standard of 2,000 ug/L. In March 2018, dissolved barium was detected greater than the GW-1 standard in the sample collected from MW-7D (2,140 ug/L) and was below the GW-1 standard of 2,000 ug/L in the sample collected from MW-7S (526 ug/L). The total and dissolved barium concentrations at MW-7D are consistent (2,060 ug/L vs 2,140 ug/L, respectively) suggesting that the elevated barium concentrations are not related to the presence of suspended solids from the groundwater sample. The dissolved barium concentration at MW-7S is one-order of magnitude lower than the total barium concentration from August 2017 suggesting that suspended solids from the August 2017 groundwater sample may have contributed to elevated total barium concentration and GW-1 exceedance (August 2017). Dissolved barium was also detected at the remaining groundwater monitoring well sampling locations with concentrations ranging from 49 to 1,150 ug/L which is consistent or slightly lower that the August 2017 total barium results.
During the August 2017 monitoring round, total lead was detected greater than the GW-3 standard of 10 ug/L in samples collected from MW-3D (67 ug/L), MW-4D (31 ug/L), MW-9S (26 ug/L), MW-9D (11 ug/L) and MW-14S (65 ug/L). In March 2018, dissolved lead was detected greater than the GW-3 standard of 10 ug/L in the samples collected from MW-4D (77 ug/L) and MW-9S (54 ug/L). Lead was reported below the laboratory method detection limit of 10 ug/L at the remaining groundwater monitoring well sample locations which suggests that these previous detections and GW-3 exceedances appear to have been related to the presence of suspended solids in the groundwater sample. The dissolved lead concentrations and associated GW-3 exceedances at MW-4D and MW-7D are slightly lower than the total lead concentrations from the August 2017 monitoring round but do not appear to be related to the presence of suspended solids from the groundwater sample.
During the August 2017 monitoring round, total arsenic was detected at groundwater monitoring wells MW-3S, MW-4S/4D, MW-9S/9D and MW-14S with concentrations ranging 6-28 ug/L, all below the applicable GW-3 standard of 900 ug/L. During the March 2018 monitoring round, dissolved arsenic was detected in the groundwater samples collected from MW-3D (6.6 ug/L), MW-9D (40.2 ug/L) and MW-14S (5.5 ug/L), all below the applicable GW-3 standard of 900 ug/L. The March 2018 dissolved arsenic detections are consistent with August 2017 total arsenic concentrations at MW-3D, MW-9D and MW-14S. During the August 2017 monitoring, total zinc was detected in the groundwater samples collected from MW-3D (54 ug/L) and MW-14S (234 ug/L), below the applicable GW-3 standard of 900 ug/L. During the March 2018 round, dissolved zinc was reported below the laboratory method detection limit of 50 ug/L at MW-3D and MW-14S. Dissolved zinc was detected in the sample collected from MW-7S (60 ug/l) below the GW-1 standard of 5,000 ug/L and GW-3 standard of 900 ug/L. Dissolved zinc was also detected in the sample collected

Mr. Michael J. Black July 17, 2018 Page 21
Report Summary for the Geotechnical Field Exploration Program and Environmental Site Assessment Tobin School
from MW-9S at a concentration of 224 ug/L which is below the GW-3 standard. The presence of elevated concentrations of heavy metals in soil and groundwater such as barium and lead appears to be attributed to the interaction of buried waste material and groundwater at the site.
In both the August 2017 and March 2018 monitoring rounds, other VOCs and SVOC compounds were detected at all groundwater well locations, however, the concentrations were reported below applicable standards. In the sample collected from MW-9D during the March 2018 round, methyl-tert-butyl-ether and tertiary-amyl methyl ether were detected consistent with the August 2017 concentrations and well below applicable GW-2 and GW-3 standards. Benzene was detected in the sample collected from MW-14D (6.7 ug/l), however the concentration is well below GW-2 and GW-3 standards. Numerous SVOCs compounds, primarily PAHs, were detected at all groundwater monitoring wells but were below the applicable standards in both sampling rounds. During both the August 2017 and March 2018 round, 1,4-dioxane was detected in the sample collected from MW-9D (0.198 ug/L and 0.158 ug/L, respectively), however, the detected concentrations are well below the applicable GW-2 and GW-3 standard. PCBS were below the laboratory method detection limit in samples collected from all groundwater monitoring wells. In August 2017 and March 2018, select VOC, SVOC compounds were detected in groundwater samples collected from the two well couplets as noted above (MW-7S/7D and MW-9S/9D) located approximately within 30 feet of the building, however, none of the detections exceeded applicable GW-2 standards.
Hydrogeology Interpretation Depth to water level measurements were recorded at the ten (10) groundwater monitoring wells in August 2017, October 2017 and in March 2018. Overall, water table depth from ground surface ranged from approximately 6 to 9 feet bgs. Water table and groundwater elevations were calculated using the field data and well location survey data (see Table 6). Based on the calculated groundwater elevations, groundwater flows to the west/southwest towards Fresh Pond Reservoir (City of Cambridge public water supply) and the average hydraulic gradient across the site is equal to 0.0003. As shown on Table 4, the estimated horizontal hydraulic conductivity values from the testing at the shallow wells screened across the waste/fill interface (shallow waste materials) ranged from 0.21 to 27.0 feet/day (7.24E-5 to 9.54E-3 cm/sec) and the estimated horizontal hydraulic conductivity values measured from the testing of the deeper wells screened to the bottom of the waste materials ranged from 2.35 to 18.6 feet per day (8.28E-4 to 6.56E-3 cm/sec). The range of hydraulic conductivity values appear to be consistent across the site with the exception of MW-14S which had lower values.
Using the recent hydraulic conductivity data, the geometric mean of the hydraulic conductivity values for the wells screened across the fill/waste interface is equal to 5.34 feet/day and the geometric mean of the hydraulic conductivity values for the wells screened to the bottom of the waste materials is equal to 8.60 feet/day. Based on the average hydraulic gradient, geometric mean of the shallow and deep well hydraulic conductivity values and porosity of the waste materials, the average linear groundwater velocity across the site is equal to 0.0040 ft/day (1.5 feet/year) within

Mr. Michael J. Black July 17, 2018 Page 22
Report Summary for the Geotechnical Field Exploration Program and Environmental Site Assessment Tobin School
the fill/waste materials. Despite the groundwater flow direction towards Fresh Pond Reservoir, the City of Cambridge Water Department keeps the surface water elevation higher than the adjacent ambient water table to prevent local groundwater discharge into the Reservoir, therefore, it is unlikely that impacted groundwater from the Tobin school property is discharging into the Reservoir.
Landfill Gas Monitoring On August 16-17, 2017, CDM Smith installed/sampled a total of 28 landfill gas probe locations and screened the 10 newly installed groundwater wells for the presence of landfill gas (see Figure 4). For all landfill gas sampling locations, concentrations of methane (CH4), carbon dioxide (CO2), oxygen (O2), Lower Explosive Limit (LEL) and atmospheric pressure were obtained using a Landtec GEM 2000 Gas Analyzer. VOC concentrations were obtained using a PID. Hydrogen sulfide (H2S) concentrations were obtained using an Interscan Gas Analyzer. Landfill gas sampling locations were purged for 10 minutes with the Landtec Gas Analyzer prior to collection of final readings. Due to the elevated concentrations of methane observed at SGP-27, SGP-28 and groundwater monitoring wells MW-3S/3D and MW-4S/4D during the August 2017 sampling event (see Table 10), CDM Smith returned to the Tobin School on October 2, 2017 to screen on-site utilities adjacent the recreational fields (see Figure 5) and to complete sub-slab and indoor air sampling at the Tobin School.
Due to the history of the landfilling operations at the Tobin School property, landfill gas migration investigations were completed to determine the nature and extent of landfill gas in the shallow and deeper sub-surface and to confirm there was no gas migration off-site beyond the property boundary. A total of 28 landfill gas probes were installed in August 2017 with a majority of the gas probes installed around the perimeter of the site at the property boundary. Methane was not detected at any of the perimeter landfill gas probes except at SGP-27 which is located at the Armory property boundary, where the initial methane (as an indicator of landfill gas) concentration was detected at 2.9 % (58% LEL) and the final methane concentration was detected at 2.8% (56% LEL). This is not an unexpected finding since it is believed that the waste material extends underneath the Armory property. One landfill gas probe was installed in the center of the recreational fields (SGP-28) to evaluate shallow sub-surface landfill gas conditions in the center of the recreational field. At landfill gas probe, SGP-28, methane was initially detected at 63.8 % (1,276 % LEL) and the final concentration was detected at 50.2 % (1,004 % LEL). These LEL readings are considered very high and comparable to what may be observed at a municipal solid waste landfill. Carbon dioxide was detected at all landfill gas probes with concentrations ranging from 0.5 to 5.4%. Oxygen concentrations ranged from 0.9 to 20.3% at all landfill gas probe locations. VOC concentrations were non-detect (0.0 ppm) at all landfill gas probe locations except SGP-26 where the initial VOC concentration was detected at 111.7 ppmv and the final VOC concentration was detected at 58.8 ppmv. Hydrogen sulfide was not detected at any landfill gas probe location.
The ten (10) groundwater monitoring wells installed during Phase 1 were also screened for the presence of landfill gas during the August 2017 landfill gas sampling event. Methane was detected at groundwater monitoring wells MW-3S, MW-3D, MW-4S, MW-4D, MW-7S and MW-14D. Methane

Mr. Michael J. Black July 17, 2018 Page 23
Report Summary for the Geotechnical Field Exploration Program and Environmental Site Assessment Tobin School
was initially detected at MW-3S at a concentration of 13.5 % (270% LEL) and the final methane concentration was detected at 13.4 (268 % LEL). Methane was initially detected at MW-3D at a concentration of 1.9 % (38 % LEL) and the final methane concentration was detected at 0.8 % (16% LEL). Methane was initially detected at MW-4S at a concentration of 73 % (1,460% LEL) and the final methane concentration was detected at 71.6 % (1,432 % LEL). Methane was initially detected at MW-4D at a concentration of 0.6 % (12% LEL) and the final methane concentration was detected at 0.3 % (6% LEL). Methane was initially detected at MW-7S at a concentration of 2.4% (48 % LEL) and the final concentration was detected 2.3 % (46% LEL). Methane was initially detected at MW-14D at a concentration of 0.4% (8 % LEL) and the final methane concentration was detected at 0.3 % (6% LEL).
Due to the elevated landfill gas readings across the site, a supplemental gas investigation was completed by CDM Smith on October 2, 2017. During the October 2, 2017 sampling, CDM Smith re-screened the 10 groundwater monitoring wells for the presence of landfill gas. Results were similar to the August 2017 monitoring (see Table 11 for August and October 2017 gas results). The most significant difference between the two rounds was that methane was detected at MW-9S with elevated concentrations in October 2017, whereas, it was not detected in August 2017. Methane was detected at MW-9S at an initial concentration of 22.8 % (456 % LEL) and the final methane concentration was detected at 23.9% (478 % LEL). Simultaneously on October 2, 2017, CDM Smith collected sub-slab and indoor air samples inside the Tobin School to confirm there was no indoor air quality problems inside the school. The conclusion of the Tobin School assessment was that the sub-slab monitoring results showed low levels of contaminants below MassDEP thresholds. The indoor air (within the crawl spaces) did show some commonly found constituents in indoor air, however, they do not appear to be attributed to the underlying waste material. A summary of the results of the Tobin School sub-slab and air sampling in October 2017 and the recent round completed in February 2018 will be included in a separate memorandum.
In addition to the screening of the groundwater monitoring wells for landfill gas, 30-minute grab soil vapor samples were collected from groundwater monitoring well MW-4S and MW-9S where the highest concentrations of methane were observed and were analyzed for VOCs, fixed gases (methane, carbon dioxide, carbon monoxide, nitrogen and oxygen), sulfide analysis and mercaptans. Overall, there were some VOC detections, however, none of the concentrations exceeded MassDEP sub-slab soil gas screening criteria (see Table 12). Fixed gas concentrations were consistent with concentrations observed when collecting field analyzed gas samples using the Landtec GEM 2000. Sulfide and mercaptan compounds including hydrogen sulfide, methyl mercaptans, dimethyl sulfate and carbon disulfide were detected in the soil vapor samples collected from MW-4S and 9S with concentrations ranging from 4.43 to 6.38 ug/m3.
Due to the elevated methane concentrations within the subsurface of the recreational fields, deeper landfill gas probes were attempted along the eastern property line to confirm there was no gas migration beyond the eastern property line, however, due to subsurface conditions, continuous refusal was encountered at multiple locations and the gas probes could not be installed below 5 feet
Mr. Michael J. Black July 17, 2018 Page 24
Report Summary for the Geotechnical Field Exploration Program and Environmental Site Assessment Tobin School
bgs. Due to the clean corridor of no waste between the recreational fields and the eastern property line and no observed gas detections from the August 2017 gas sampling, it does not appear gas is migrating towards the eastern property line.
A total of twenty-six (26) utility locations on the Tobin School property and adjacent to the Tobin School property boundary (catch basins, manholes, electrical boxes) as shown on Figure 5 were screened for the presence of landfill gas on October 2, 2017. The results of the screening are summarized in Table 13. Methane was only detected in the water meter pit manhole located directly north of recreational fields. Methane was detected in the water meter pit manhole initially at 296 % LEL of methane and at 16% LEL of methane after venting with the manhole cover off. Under the MCP, an LEL reading greater than 10% LEL in a utility is a 2-hour reporting condition. Since the LEL of methane results were greater than 10% LEL in the Water Meter Pit Manhole, the results were reported to MassDEP Bureau of Waste Site Cleanup (BWSC) by Kathleen Murphy (LSP), (CDM Smith). A release tracking number (RTN) was assigned by MassDEP (RTN 3-34521). As a mitigation measure, the City of Cambridge determined that the water vault was no longer in use and backfilled the manhole with flowable fill on October 18, 2017 and re-screened the manhole with a 4-gas meter which resulted with an LEL of reading of 0.0%.
CDM Smith completed confirmation methane screening of utilities adjacent to the abandoned water meter pit and on Concord Ave on November 30, 2017. During the supplemental screening event, methane was not detected at any of the utility locations. Since the water meter pit was abandoned and methane was not detected during the supplemental screening, CDM Smith submitted an Immediate Response Action (IRA) Completion Report to MassDEP on December 7, 2017 closing out RTN 3-34521 linking it to the overall RTN for the Tobin School property (3-01658).
During the Phase 1 and Phase 2 Test Pit programs, multi-gas monitors were placed approximately 20 feet at different directions from each test pit to monitor ambient air for oxygen, carbon monoxide, hydrogen sulfide and lower explosive limit (LEL). During both phases of test pits, there were no detections of any gases and oxygen concentration remained at approximately 20.9%. A PID was also used during test pitting to determine the presence of VOCs in ambient air, and values ranged from non-detectable to 8.2 parts per million (ppm).
Environmental Implications for Design and Construction Removal and Disposal of Soil/Waste Materials Based on the results of the soil/waste fill concentrations, the fill/waste material would need to go either to an out-of-state facility or to an in-state landfill. In order to obtain a clean closure with no deed restrictions, i.e., AUL, on the school property, the entire limits of the waste material would need to be removed. Complete removal of the waste material on the school property may not be possible given the depth of the waste at the property line with the abutting Armory facility and the potential to impact the existing Armory structure. In addition, removal of waste along the remaining property lines may impact abutting properties. Measures such as excavation support

Mr. Michael J. Black July 17, 2018 Page 25
Report Summary for the Geotechnical Field Exploration Program and Environmental Site Assessment Tobin School
may be considered to allow for removal of as much waste material as possible along the property boundaries.
Removal of the waste material will present considerable challenges including the depth of material requiring removal (up to 32 feet bgs), dewatering during removal, control of landfill gases during removal, proximity of nearby residents and occupied school (if the school is kept open during construction). If it is not feasible or cost effective to remove all of the waste material, mitigation measures will need to be considered regarding potential indoor air issues, e.g., sub-slab depressurization system or a barrier between waste material and buildings or overlying soil. These options for leaving some waste material in place would require an AUL and potential capping of waste with permanent active landfill gas controls as part of the closure of the site.
Dewatering, Groundwater Treatment and Discharge The water table depth from ground surface ranged from approximately 6 to 9 feet bgs based on the August and October 2017 and March 2018 water level gauging data. The maximum depth of waste encountered within the footprint of the recreational fields is 32 feet bgs, therefore, dewatering for removal of the waste would require an extensive effort due to the shallow water table and depth of waste.
Based on the August 2017 and March 2018 groundwater sampling results, an active remediation system for groundwater collected as part of a dewatering program would be required prior to discharge to the local stormwater system or the local stormwater combined sewer system. If local stormwater discharge is feasible, then an EPA National Pollutant Discharge Elimination System (NPDES) Remediation General Permit would be required. If local stormwater/combined sewer overflow discharge is feasible, then a Massachusetts Water Resource Authority (MWRA) Construction Dewatering Permit would be required.
Landfill Gas Control Elevated concentrations of landfill gas exist beneath the Tobin School property. Landfill gas concentrations were detected in excess of 1000% LEL of methane at some locations. Due to the elevated concentrations of landfill gas in the shallow and deeper sub-surface strata, active landfill gas controls would be required to ensure the safety of the contractors and nearby residents, minimize gas migration during excavation, and to suppress excessive landfill gas odors.
Based on the soil vapor sample results (sulfide and VOC detections) and observations during drilling and test pit excavations, there is potential for excessive odors migrating in the ambient air during construction/excavation. Landfill gas migration controls required to control landfill gas and odors could consist of an active gas trench system (under vacuum) installed into the shallow waste across the recreational fields. The active gas trench system could utilize a temporary gas flare to burn off the methane and to control landfill gas odors.

Mr. Michael J. Black July 17, 2018 Page 26
Potential Risks for Safety, Human Health, and the Environment The greatest potential risk for safety, human health and the environmental is primarily due to the elevated concentrations of landfill gases beneath the Tobin School property. Due to the methane concentrations, there exists the potential for an explosion hazard due to the generation of any sparks given that the explosive range of methane exists from 5 to 15%. This hazard would need to be mitigated during the construction activities.
Due to nature of waste material, low oxygen conditions also exist in the sub-surface, therefore, excavation contractors could potentially be exposed to low oxygen conditions. Another concern with excavating waste is the potential for landfill gas/odors to migrate in the sub-surface to sensitive receptors such as residential homes on the eastern property line, utilities located on-site and directly adjacent to the site and towards the Tobin School which would potentially be operating during construction.
MCP Requirements The site has an existing AUL and Permanent Solution which would need to be retracted and revised following completion of the construction of the school. Prior to any excavation activities, a Release Abatement Measure (RAM) Plan would need to be submitted to MassDEP summarizing proposed excavation work, soil management, engineering controls and safety measures to protect human health and the environment. As part of the soil management for off-site disposal, additional sampling will be required to meet the requirements of the disposal facilities.
Closing These considerations and presented data has been prepared for the proposed Tobin School project located in Cambridge, Massachusetts as understood at this time and described in this memorandum. The presented data has been prepared in accordance with generally accepted engineering practices. No other warranty, express or implied, is made. In the event that changes in the design or location of the proposed development occur, the interpretation of data and considerations contained herein should not be considered valid unless verified in writing by CDM Smith.
Attachments: FIGURE 1 – Test Boring Location Plan FIGURE 2 – Extent of Waste FIGURE 3 – Surface Water Protection Zones FIGURE 4 – Landfill Gas Probe and Well Monitoring Locations FIGURE 5 – Landfill Gas Utility Screening Locations
TABLE 1 – Summary of Geotechnical Index Test Results TABLE 2 – Summary of Consolidation Test Results
Report Summary for the Geotechnical Field Exploration Program and Environmental Site Assessment Tobin School

Mr. Michael J. Black July 17, 2018 Page 27
Report Summary for the Geotechnical Field Exploration Program and Environmental Site Assessment Tobin School
TABLE 3 – Summary of Triaxial Compression Test Results TABLE 4 – Summary Hydraulic Conductivity Test Results TABLE 5 – Summary of Subsurface Exploration Programs TABLE 6 – Summary of Monitoring Well Readings TABLE 7 – Soil Sampling Results – July-August 2017 TABLE 8 – Groundwater Sampling Results – August 2017 TABLE 9 – Groundwater Sampling Results – March 2018 TABLE 10 – Soil Gas Probe and Groundwater Well Landfill Gas Monitoring Results – August 16-17, 2017 TABLE 11 – Groundwater Well Landfill Gas Monitoring Results – August and October 2017 TABLE 12 – Soil Vapor Sampling Results (VOCs, Sulfides, Mercaptans) – October 2, 2017 TABLE 13 – Utility Landfill Gas Monitoring Results – October 2, 2017 ATTACHMENT A – Historical Aerial Photos, Topographic Maps, and Sanborn Maps ATTACHMENT B – Previous Test Boring Logs ATTACHMENT C – Phase 1 - Test Boring Logs ATTACHMENT D – Phase 1 - Rock Core Photographs ATTACHMENT E – Phase 2 – Test Boring Logs ATTACHMENT F – Phase 1 – Test Pit Logs ATTACHMENT G – Phase 2 – Test Pit Logs ATTACHMENT H – Phase 1 - Monitoring Well Logs ATTACHMENT I – Phase 1 - Geotechnical Laboratory Test Results ATTACHMENT J – Phase 2 - Geotechnical Laboratory Test Results ATTACHMENT K – Slug Testing Results ATTACHMENT L – Drum Disposal Manifest ATTACHMENT M – Soil and Groundwater Analytical Laboratory Data

CDM-101A
CDM-101B
CDM-102A
CDM-102B
CDM-103
CDM-104
CDM-105
CDM-106
CDM-107
CDM-108
CDM-109
CDM-110
CDM-111
CDM-112 CDM-113
CDM-114
CDM-115
CDM-116
CDM-117
CDM-118
CDM-119
CDM-120
TP-101
TP-102
TP-204
TP-203
TP-201
MW-7S
MW-7D
MW-9D
MW-9S
MW-4S
MW-4D
MW-3S
MW-3D
CDM-12
MW-14S
MW-14D
CDM-1
CDM-2
CDM-4
CDM-3
CDM-5
CDM-6
CDM-8
CDM-7
CDM-11
CDM-13
CDM-15
CDM-10
CDM-9
CDM-14
B-1
B-4
B-6
CHI-4
CHI-5
CHI-6
CHI-7
B-13
B-14
B-15
B-16
B-17
B-18
CHI-8
CHI-9
CHI-10
CHI-11
CHI-12
FIGURE 1
TEST BORING LOCATION PLAN
CITY OF CAMBRIDGE, MASSACHUSETTS
TOBIN SCHOOL
CAMBRIDGE, MASSACHUSETTS
pw
:\\p
w.cd
msm
ith
.co
m:P
W_
PL
1\0
13
9\2
20
81
3\0
2 P
ro
je
ct In
fo
rm
atio
n\0
3 D
ata
\4
0 F
ie
ld
D
ata
\C
AD
\T
est B
orin
g L
oca
tio
n P
la
n.d
wg
N
“
”
”
© 2
01
7
CDM-101
TP-201
TP-101
B-1/CHI-1

CDM-1
CDM-3
CDM-4
CDM-5
CDM-6
CDM-7
CDM-8CDM-9
CDM-10
CDM-11
CDM-12
CDM-15
CDM-13CDM-14
CDM-2
MW-4S
MW-3S
MW-7DMW-9D
MW-14D
MW-7S MW-9S
MW-4D
MW-3D
MW-14S
CDM-101ACDM-101B CDM-102A
CDM-102B
CDM-103
CDM-104
CDM-105
CDM-106
CDM-107
CDM-108
CDM-109
CDM-110
CDM-111CDM-112 CDM-113
CDM-114
CDM-115CDM-116
CDM-117
CDM-118
CDM-119
CDM-120
ALPIN
E ST
REET
VASSAL LANE
CHILT
ON ST
REET
CONCORD AVENUE
FRESH POND PARKWAY
LAKEVIEW
AVENUE
SOZIO ROTARY
Basemap: Google Earth Pro Imagery (April 2017)Source: Google, MassGIS, and ESRI ArcGIS OnlineCoordinate Sys: NAD83 Mass. State Plane Mainland (feet)
F:\Projects\Project_data\Cambridge\TobinSchool\MXD\TobinSchool_ExtentofWaste.mxd BillingsMC April-2018
FIGURE 2Horizontal Edge of Waste
April 2018Legend
Geotechnical/Environmental Borings (Completed Jan-Feb 2018)Geotechnical/Environmental Boring Location (July-August 2017)Groundwater Monitoring Well Couplet Installation Location (July-August 2017)Approximate Boundary of Former Clay Pit/Edge of Waste (updated April 2018 for Tobin School Property Only)
Tobin School197 Vassal LaneCambridge, MA
0 9045Feet
1 " = 90 '
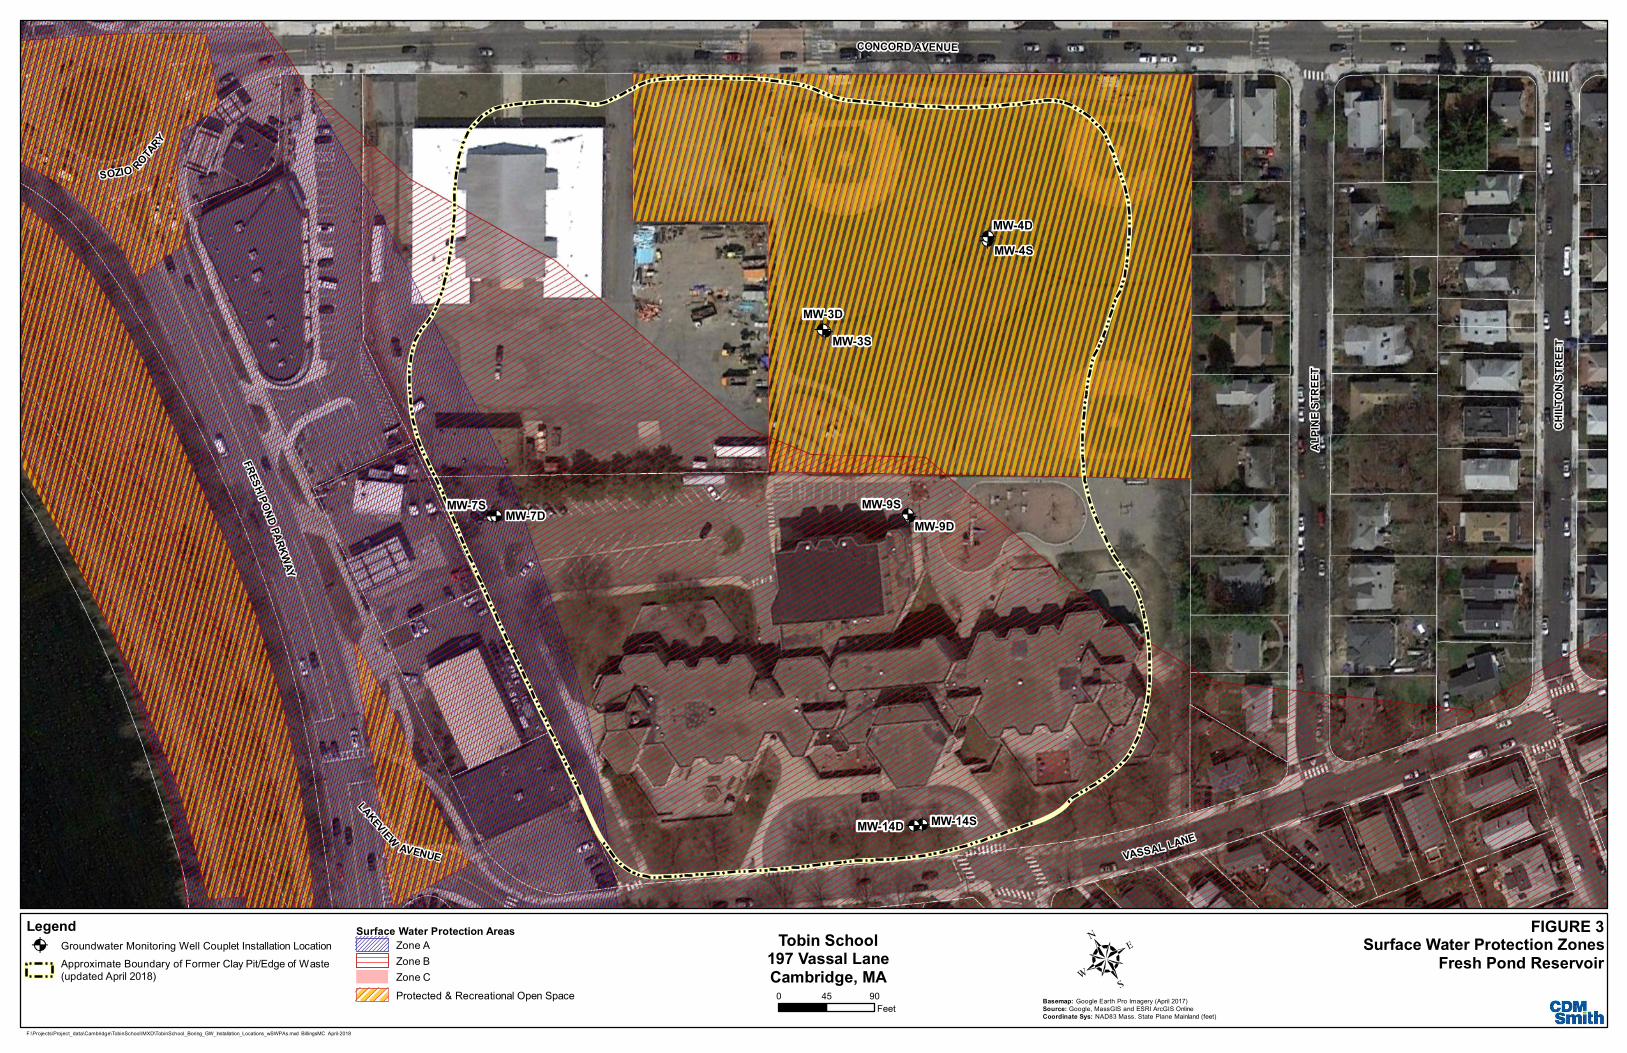
MW-7S MW-9S
MW-4D
MW-3D
MW-14SMW-14D
MW-7D MW-9D
MW-4S
MW-3S
ALPIN
E ST
REET
CHILT
ON ST
REET
VASSAL LANE
CONCORD AVENUE
FRESHPOND PARKWAY
LAKEVIEW
AVENUE
SOZIO ROTARY
Tobin School197 Vassal LaneCambridge, MA
0 9045Feet Basemap: Google Earth Pro Imagery (April 2017)
Source: Google, MassGIS and ESRI ArcGIS OnlineCoordinate Sys: NAD83 Mass. State Plane Mainland (feet)
F:\Projects\Project_data\Cambridge\TobinSchool\MXD\TobinSchool_Boring_GW_Installation_Locations_wSWPAs.mxd BillingsMC April-2018
FIGURE 3Surface Water Protection Zones
Fresh Pond ReservoirSurface Water Protection Areas
Zone AZone BZone CProtected & Recreational Open Space
LegendGroundwater Monitoring Well Couplet Installation LocationApproximate Boundary of Former Clay Pit/Edge of Waste(updated April 2018)
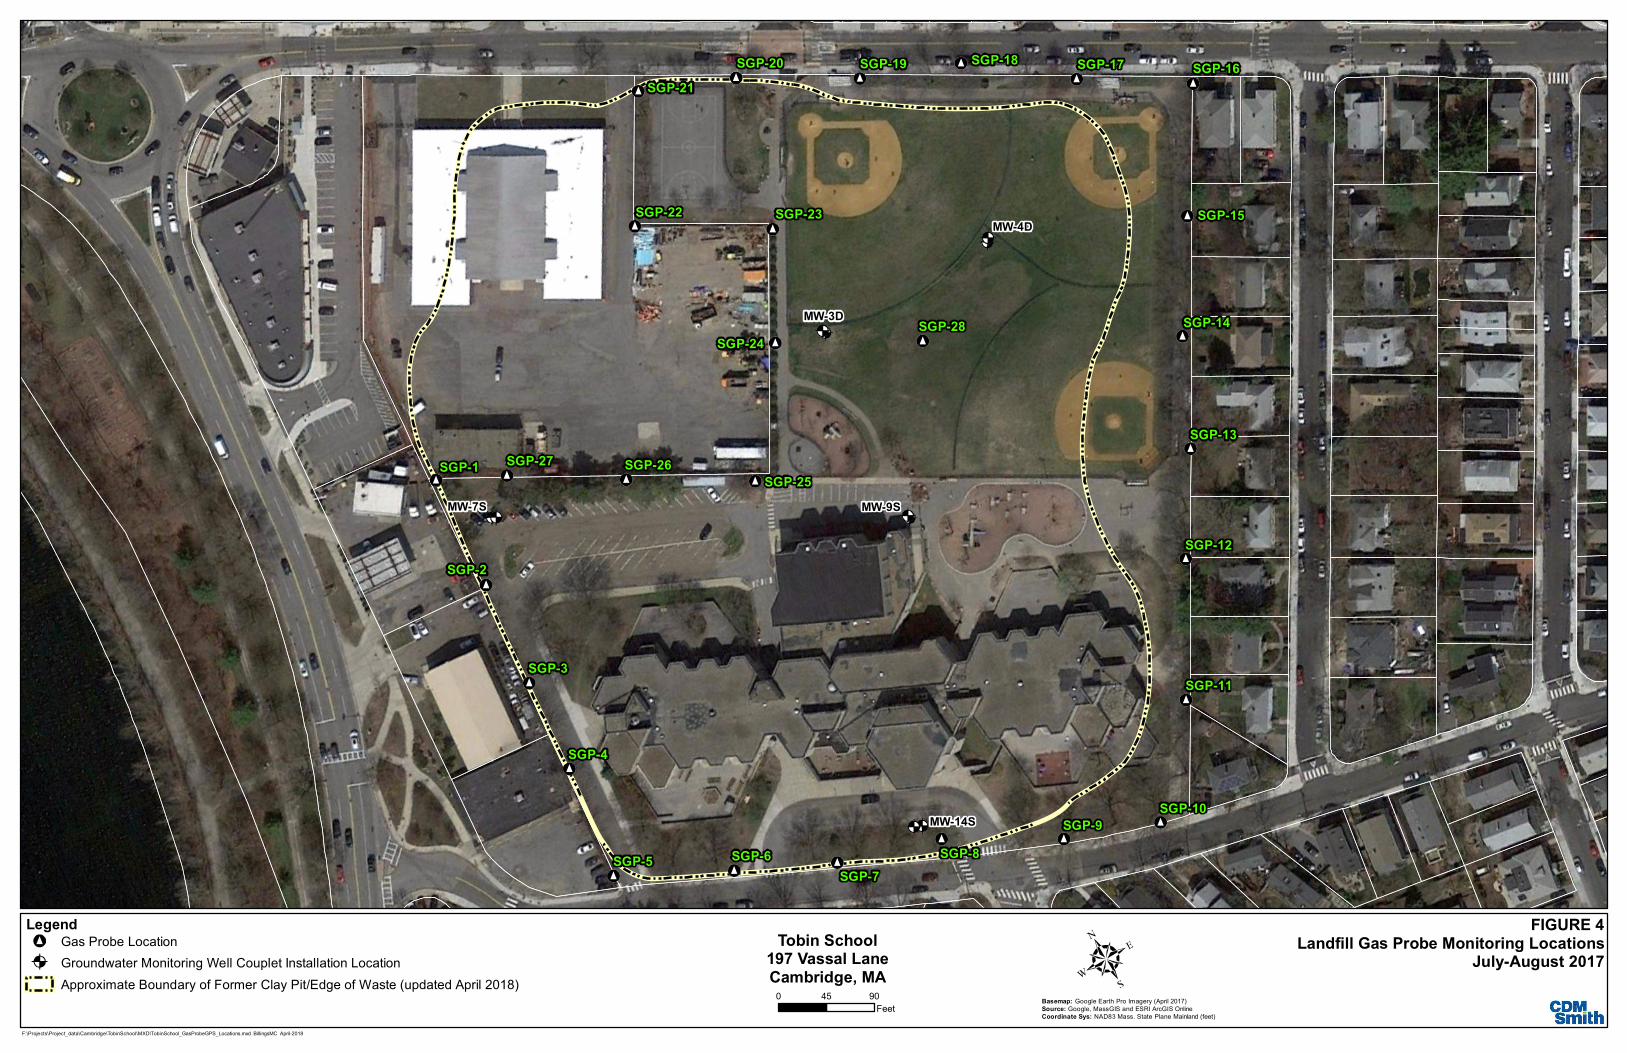
MW-7S MW-9S
MW-4D
MW-3D
MW-14S
SGP-26SGP-25
SGP-24
SGP-23SGP-22
SGP-21SGP-20 SGP-19 SGP-18 SGP-17 SGP-16
SGP-15
SGP-14
SGP-13
SGP-12
SGP-11
SGP-10SGP-9
SGP-7SGP-6SGP-5
SGP-4
SGP-3
SGP-2
SGP-1 SGP-27
SGP-28
SGP-8
Tobin School197 Vassal LaneCambridge, MA
0 9045Feet Basemap: Google Earth Pro Imagery (April 2017)
Source: Google, MassGIS and ESRI ArcGIS OnlineCoordinate Sys: NAD83 Mass. State Plane Mainland (feet)
F:\Projects\Project_data\Cambridge\TobinSchool\MXD\TobinSchool_GasProbeGPS_Locations.mxd BillingsMC April-2018
FIGURE 4Landfill Gas Probe Monitoring Locations
July-August 2017Legend
Gas Probe LocationGroundwater Monitoring Well Couplet Installation LocationApproximate Boundary of Former Clay Pit/Edge of Waste (updated April 2018)


Coarse Fine Coarse Medium Fine Silt Clay
CDM-1 S-3 4-6 Granular Fill SM 4.6 24.9 8.9 19.8 20.8 -- -- -- 9.1 -- --
CDM-1 S-7 12-14 Waste Fill SM 0.0 38.2 17.4 18.1 13.3 -- -- -- 23.8 -- --
CDM-1 S-20 44-46 Clay & Silt CL -- -- -- -- -- 39 19 20 29.9 -- --
CDM-1 ST-1 46-48 Clay & Silt CL -- -- -- -- -- 38 19 19 27.5 478 --
CDM-1 S-23 59-61 Clay & Silt CL -- -- -- -- -- 40 21 19 34.9 -- --
CDM-1 S-25 69-71 Glacial Till SM 0.0 15.4 12.4 11.4 14.4 23.4 23.0 -- -- -- 14.5 -- --
CDM-2 S-3B 4-6 Granular Fill CL -- -- -- -- -- 40 21 19 23.0 -- --
CDM-2 S-4A 6-8 Granular Fill SM 0.0 13.9 8.5 16.8 30.1 16.2 14.5 -- -- -- 23.0 -- --
CDM-2 S-4B 6-8 Organic Soils OL -- -- -- -- -- -- -- -- 90.0 -- 17.7
CDM-2 S-5A 8-10 Organic Soils OL -- -- -- -- -- -- -- -- 90.9 -- 14.0
CDM-2 S-8 14-16 Clay & Silt CL -- -- -- -- -- 41 20 21 25.9 -- --
CDM-2 S-15 34-36 Clay & Silt CL -- -- -- -- -- 33 18 15 28.2 -- --
CDM-2 ST-1 41-43 Clay & Silt CL -- -- -- -- -- 45 20 25 34.3 1558 --
CDM-2 S-18 49-51 Glacial Till GM 7.4 34.1 10.0 10.3 11.7 12.9 13.6 -- -- -- 10.3 -- --
CDM-2 S-19 54-55 Glacial Till CL-ML -- -- -- -- -- 16 12 4 10.8 -- --
CDM-3 S-15 35-37 Clay & Silt CL -- -- -- -- -- 41 19 22 28.3 -- --
CDM-4 S-2 2-4 Granular Fill SM 6.2 18.0 9.3 23.3 27.5 -- -- -- 10.6 -- --
CDM-4 S-10 18-20 Waste Fill SP 0.0 34.0 12.1 27.7 22.2 -- -- -- 38.5 -- --
CDM-4 ST-1 36-38 Clay & Silt CL -- -- -- -- -- 45 21 24 30.7 1643 --
CDM-4 S-20 44-46 Clay & Silt CL -- -- -- -- -- 45 21 24 36.0 -- --
CDM-4 ST-2 48-50 Clay & Silt CL -- -- -- -- -- 30 19 11 25.8 1381 --
CDM-5 S-2 2-4 Granular Fill SM 0.0 7.2 8.0 34.0 36.8 -- -- -- 8.6 -- --
CDM-5 S-4 6-8 Waste Fill SM 8.4 27.1 10.4 23.6 16.6 -- -- -- 32.5 -- --
CDM-5 ST-1 30-32 Clay & Silt CH -- -- -- -- -- 52 21 31 45.0 247 --
CDM-5 S-17 44-46 Clay & Silt CL -- -- -- -- -- 41 20 21 43.9 -- --
CDM-6 S-6 9-11 Clay & Silt CL -- -- -- -- -- 39 20 19 25.2 -- --
CDM-6 S-12B 35-37 Clay & Silt ML 0.0 0.0 0.0 0.4 29.8 65.4 4.4 -- -- -- 22.3 -- --
CDM-7 S-2 2-4 Granular Fill SM 0.0 25.6 7.7 29.9 23.0 -- -- -- 15.2 -- --
CDM-7 S-15 39-41 Clay & Silt CL -- -- -- -- -- 36 20 16 28.6 -- --
CDM-7 S-19 59-61 Clay & Silt CL -- -- -- -- -- 33 18 15 31.6 -- --
CDM-7 S-21A 69-71 Clay & Silt CL 0.0 0.0 0.0 0.3 20.4 56.3 23.0 -- -- -- 32.2 -- --
CDM-7 S-21B 69-71 Clay & Silt ML -- -- -- -- -- 37 21 16 33.3 -- --
CDM-7 S-23 79-81 Glacial Till GM 22.4 27.9 11.9 16.0 8.8 -- -- -- 8.2 -- --
--
--
--
--
--
--
--
--
--
1450
2869
2306
1604
401
--
--
--
--
--
--
--
--
--
--
--
--
--
--
--
--
--
--
--
--
--
Phase 1 - Subsurface Exploration Program (CDM Smith, Jul-Aug 2017)
13.0
--
--
--
--
13.9
13.0
--
--
--
14.0
--
--
--
--
Sample
No.
Sample
Depth (ft)Stratum
USCS
Classification (1)
21.0
Gravel (%)
Grain Size Analysis (2)
Sand (%)
City of Cambridge
Tobin School
Cambridge, Massachusetts
Table 1
Summary of Geotechnical Index Test Results
Organic
Content
(%)(6)PI (%)
Remolded Shear
Strength (psf)
Atterberg Limits (3)
Moisture
Content
(%) (4)LL (%) PL (%)
Exploration
No.Initial Shear Strength
(psf)
Fines (%)
Mini-Vane Shear Test(5)
13.8
4.0
--
--
--
--
--
--
--
15.7
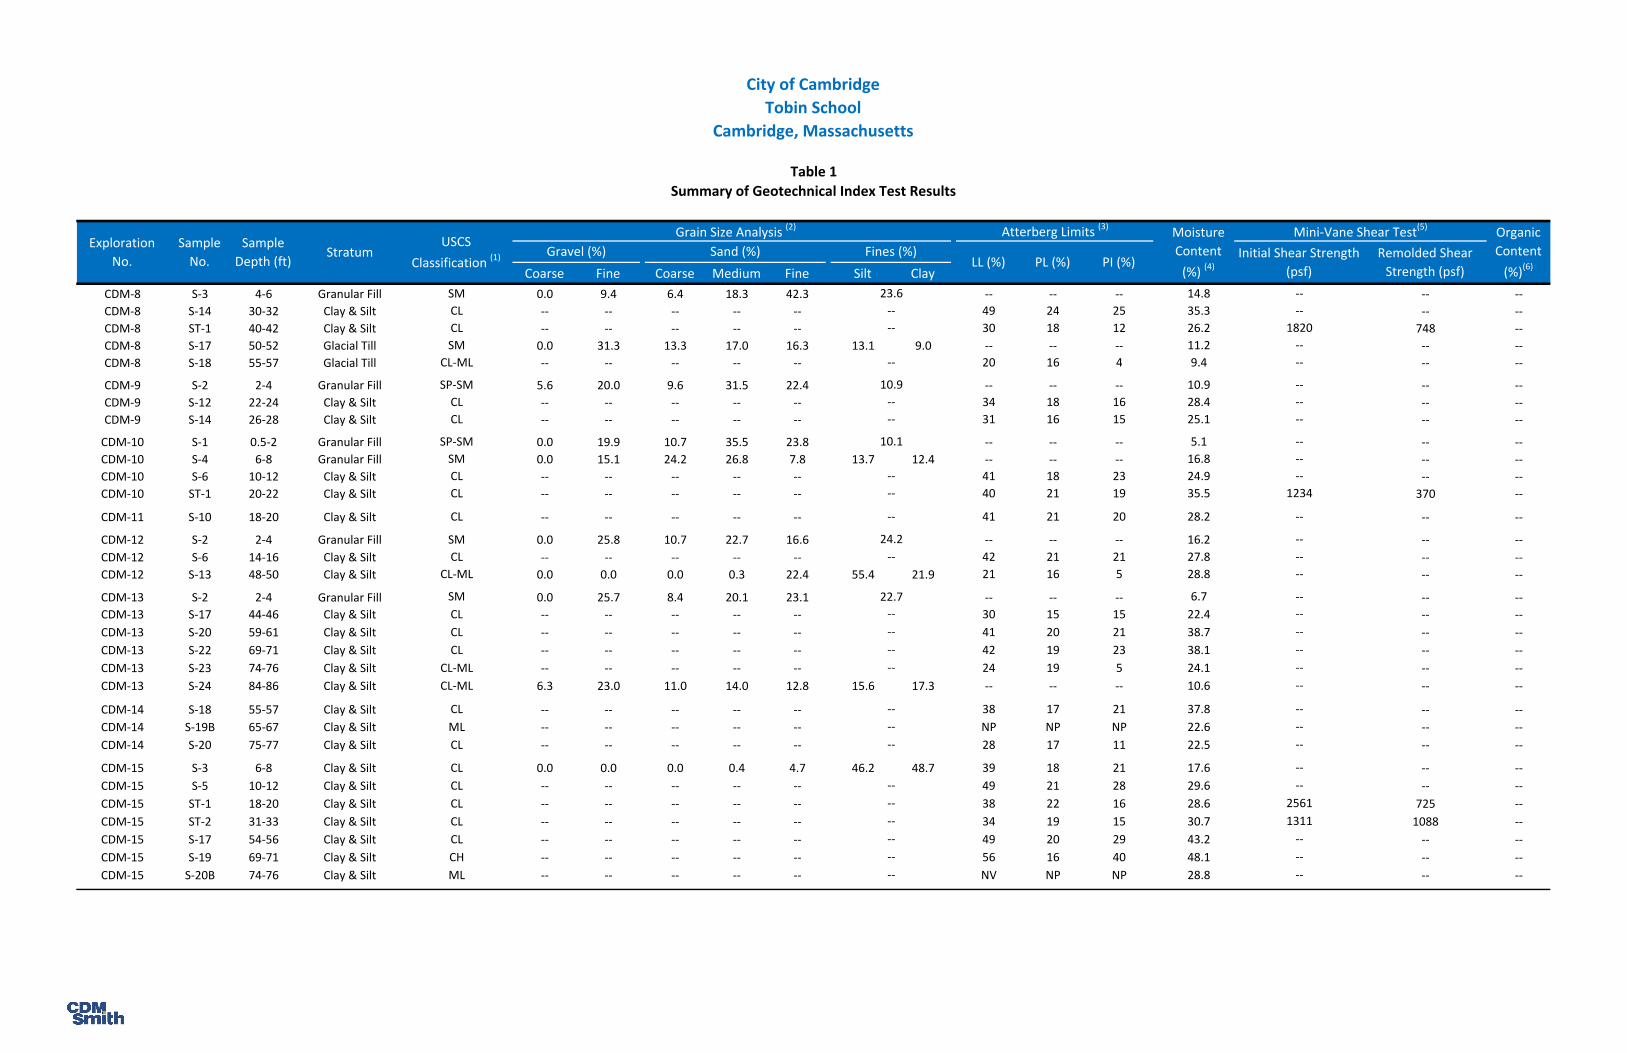
Coarse Fine Coarse Medium Fine Silt Clay
Phase 1 - Subsurface Exploration Program (CDM Smith, Jul-Aug 2017)
Sample
No.
Sample
Depth (ft)Stratum
USCS
Classification (1)
Gravel (%)
Grain Size Analysis (2)
Sand (%)
City of Cambridge
Tobin School
Cambridge, Massachusetts
Table 1
Summary of Geotechnical Index Test Results
Organic
Content
(%)(6)PI (%)
Remolded Shear
Strength (psf)
Atterberg Limits (3)
Moisture
Content
(%) (4)LL (%) PL (%)
Exploration
No.Initial Shear Strength
(psf)
Fines (%)
Mini-Vane Shear Test(5)
CDM-8 S-3 4-6 Granular Fill SM 0.0 9.4 6.4 18.3 42.3 -- -- -- 14.8 -- --
CDM-8 S-14 30-32 Clay & Silt CL -- -- -- -- -- 49 24 25 35.3 -- --
CDM-8 ST-1 40-42 Clay & Silt CL -- -- -- -- -- 30 18 12 26.2 748 --
CDM-8 S-17 50-52 Glacial Till SM 0.0 31.3 13.3 17.0 16.3 13.1 9.0 -- -- -- 11.2 -- --
CDM-8 S-18 55-57 Glacial Till CL-ML -- -- -- -- -- 20 16 4 9.4 -- --
CDM-9 S-2 2-4 Granular Fill SP-SM 5.6 20.0 9.6 31.5 22.4 -- -- -- 10.9 -- --
CDM-9 S-12 22-24 Clay & Silt CL -- -- -- -- -- 34 18 16 28.4 -- --
CDM-9 S-14 26-28 Clay & Silt CL -- -- -- -- -- 31 16 15 25.1 -- --
CDM-10 S-1 0.5-2 Granular Fill SP-SM 0.0 19.9 10.7 35.5 23.8 -- -- -- 5.1 -- --
CDM-10 S-4 6-8 Granular Fill SM 0.0 15.1 24.2 26.8 7.8 13.7 12.4 -- -- -- 16.8 -- --
CDM-10 S-6 10-12 Clay & Silt CL -- -- -- -- -- 41 18 23 24.9 -- --
CDM-10 ST-1 20-22 Clay & Silt CL -- -- -- -- -- 40 21 19 35.5 370 --
CDM-11 S-10 18-20 Clay & Silt CL -- -- -- -- -- 41 21 20 28.2 -- --
CDM-12 S-2 2-4 Granular Fill SM 0.0 25.8 10.7 22.7 16.6 -- -- -- 16.2 -- --
CDM-12 S-6 14-16 Clay & Silt CL -- -- -- -- -- 42 21 21 27.8 -- --
CDM-12 S-13 48-50 Clay & Silt CL-ML 0.0 0.0 0.0 0.3 22.4 55.4 21.9 21 16 5 28.8 -- --
CDM-13 S-2 2-4 Granular Fill SM 0.0 25.7 8.4 20.1 23.1 -- -- -- 6.7 -- --
CDM-13 S-17 44-46 Clay & Silt CL -- -- -- -- -- 30 15 15 22.4 -- --
CDM-13 S-20 59-61 Clay & Silt CL -- -- -- -- -- 41 20 21 38.7 -- --
CDM-13 S-22 69-71 Clay & Silt CL -- -- -- -- -- 42 19 23 38.1 -- --
CDM-13 S-23 74-76 Clay & Silt CL-ML -- -- -- -- -- 24 19 5 24.1 -- --
CDM-13 S-24 84-86 Clay & Silt CL-ML 6.3 23.0 11.0 14.0 12.8 15.6 17.3 -- -- -- 10.6 -- --
CDM-14 S-18 55-57 Clay & Silt CL -- -- -- -- -- 38 17 21 37.8 -- --
CDM-14 S-19B 65-67 Clay & Silt ML -- -- -- -- -- NP NP NP 22.6 -- --
CDM-14 S-20 75-77 Clay & Silt CL -- -- -- -- -- 28 17 11 22.5 -- --
CDM-15 S-3 6-8 Clay & Silt CL 0.0 0.0 0.0 0.4 4.7 46.2 48.7 39 18 21 17.6 -- --
CDM-15 S-5 10-12 Clay & Silt CL -- -- -- -- -- 49 21 28 29.6 -- --
CDM-15 ST-1 18-20 Clay & Silt CL -- -- -- -- -- 38 22 16 28.6 725 --
CDM-15 ST-2 31-33 Clay & Silt CL -- -- -- -- -- 34 19 15 30.7 1088 --
CDM-15 S-17 54-56 Clay & Silt CL -- -- -- -- -- 49 20 29 43.2 -- --
CDM-15 S-19 69-71 Clay & Silt CH -- -- -- -- -- 56 16 40 48.1 -- --
CDM-15 S-20B 74-76 Clay & Silt ML -- -- -- -- -- NV NP NP 28.8 -- --
--
--
--
2561
1311
--
--
--
--
--
--
--
--
--
--
--
--
--
1234
--
--
--
--
--
--
--
1820
--
--
--
--
--
--
22.7
--
23.6
--
10.9
--
--
--
--
--
--
--
10.1
--
--
--
--
--
--
--
24.2
--
--
--
--
--

Coarse Fine Coarse Medium Fine Silt Clay
Phase 1 - Subsurface Exploration Program (CDM Smith, Jul-Aug 2017)
Sample
No.
Sample
Depth (ft)Stratum
USCS
Classification (1)
Gravel (%)
Grain Size Analysis (2)
Sand (%)
City of Cambridge
Tobin School
Cambridge, Massachusetts
Table 1
Summary of Geotechnical Index Test Results
Organic
Content
(%)(6)PI (%)
Remolded Shear
Strength (psf)
Atterberg Limits (3)
Moisture
Content
(%) (4)LL (%) PL (%)
Exploration
No.Initial Shear Strength
(psf)
Fines (%)
Mini-Vane Shear Test(5)
CDM-101B S-4 7-9 Waste Fill OL -- -- -- -- -- -- -- -- 82.4 -- 17.0
CDM-102B S-4B 7-9 Organic Soils OL -- -- -- -- -- -- -- -- 74.2 -- 18.8
CDM-103 S-8 15-17 Waste Fill SM 0.0 40.8 19.9 14.5 10.3 9.9 4.6 -- -- -- 45.4 -- --
CDM-103 S-11 21-23 Clay & Silt ML -- -- -- -- -- NV NP NP 25.1 -- --
CDM-104 S-7 12-14 Waste Fill GW-GM 17.7 32.2 11.9 17.0 11.7 -- -- -- 29.8 -- --
CDM-104 S-15 28-30 Waste Fill GP-GM 1.6 52.1 16.8 13.8 6.0 -- -- -- 28.2 -- --
CDM-104 S-17 32-34 Clay & Silt CL -- -- -- -- -- 40 21 19 32.3 -- --
CDM-105 S-4B 6-8 Organic Soils CL -- -- -- -- -- -- -- -- 22.9 -- 2.4
CDM-106 S-6 10-12 Waste Fill GP 14.0 54.6 21.4 5.5 2.7 -- -- -- 22.1 -- --
CDM-106 S-9 16-18 Clay & Silt CL -- -- -- -- -- 44 22 22 29.9 -- --
CDM-108 S-4B 7-9 Organic Soils OL -- -- -- -- -- -- -- -- 71.1 -- 17.5
CDM-109 S-2B 3-5 Waste Fill SM 9.1 19.3 8.6 21.4 19.8 -- -- -- 32.5 -- --
CDM-109 S-4A 7-9 Organic Soils OL -- -- -- -- -- -- -- -- 48.9 -- 10.6
CDM-109 S-4B 7-9 Clay & Silt ML 0.0 0.0 0.0 5.5 41.8 45.7 7.0 NV NP NP 24.6 -- --
CDM-109 S-5B 9-11 Clay & Silt SM 0.0 0.5 2.9 21.8 62.7 -- -- -- 18.9 -- --
CDM-110 S-3 5-7 Waste Fill SM 0.0 10.3 7.6 34.7 34.1 -- -- -- 29.7 -- --
CDM-110 S-4A 7-9 Organic Soils SM -- -- -- -- -- -- -- -- 24.4 -- 9.4
CDM-112 S-3 4-6 Waste Fill SM 0.0 17.5 11.1 23.7 22.5 -- -- -- 10.1 -- --
CDM-115 S-4 6-8 Sand & Silt SM 0.0 0.0 0.1 2.8 56.7 17.2 23.2 -- -- -- 18.1 -- --
CDM-115 S-7 12-14 Clay & Silt CL 0.0 0.0 0.5 2.4 16.5 29.8 50.8 27 15 12 28.0 -- --
CDM-118 S-4 6-8 Waste Fill SM 20.3 6.7 6.8 28.9 23.6 -- -- -- 16.4 -- --
CDM-118 S-10A 18-20 Waste Fill SM 0.0 35.2 20.0 22.4 10.3 -- -- -- 55.3 -- --
CDM-119 S-11 20-22 Waste Fill SW-SM 0.0 27.8 17.6 31.3 14.2 -- -- -- 54.1 -- --
CDM-119 S-18 34-36 Clay & Silt CL -- -- -- -- -- 39 20 19 28.4 -- --
CDM-120 S-5 9-11 Waste Fill SM 0.0 23.2 11.7 19.7 17.6 -- -- -- 77.6 -- --
Notes: Abbreviations:
1. USCS classifications were performed in accordance with ASTM D-2487. -- Test Not Performed CL-ML Lean, silty clay GW-GM Well-Graded Gravel with Silt
2. Grain size analysis tests performed in accordance with ASTM D-7928 & D-6913 and ASTM D-1140 SM Silty Sand CH Fat Clay GP-GM Poorly-Graded Gravel with Silt
3. Atterberg limit tests performed in accordance with ASTM D-4318. SP Poorly-Graded Sand CL Lean Clay GP Poorly-Graded Grave
4. Moisture content analysis performed in accordance with ASTM D-2216. SW-SM Well-Graded Sand with Silt ML Silt GM Silty Gravel
5. Miniature Vane Shear Test performed in accordance with ASTM D-4648. SP-SM Poorly-Graded Sand with Silt NV No Value
6. Organic content tests performed in accordance with ASTM D-2974. OL Organic Sand or Silt NP Non Plastic
--
--
--
--
--
--
--
--
--
--
--
--
--
--
--
--
--
9.7
--
--
1.8
--
Phase 2 - Subsurface Exploration Program (CDM Smith, Jan-Feb 2018)
--
--
--
9.5
--
--
--
--
--
--
--
--
--
27.8
--
25.2
13.7
12.1
9.1
--
21.8
--
12.1
13.3

Initial,
wo
Final,
wf
Initial,
eo
Final,
ef
Ccε(2)
Crε(3) Min
(Typical)
Max
(Typical)
CDM-1 ST-1 47 Clay & Silt 96.0 27.5 24.4 0.76 0.61 3,168 5,000 1.58 0.110 0.018 -- --
CDM-4 ST-1 37 Clay & Silt 100.2 24.5 22.8 0.68 0.52 2,575 6,000 2.33 0.131 0.015 80 1040
CDM-4 ST-2 49 Clay & Silt 99.8 26.6 24.9 0.69 0.57 3,205 5,500 1.72 0.080 0.018 42 3323
CDM-8 ST-1 41 Clay & Silt 93.0 28.9 28.8 0.81 0.76 2,448 6,000 2.45 0.117 0.011 8 245
CDM-15 ST-2 32 Clay & Silt 95.9 27.5 23.8 0.76 0.59 2,160 3,500 1.62 0.107 0.017 3 100
Notes: Abbreviations:
1. OCR = Overconsolidation Ratio, σ'p / σ'vo ST indicates Shelby Tube sample
2. Ccε = Virgin compression ratio -- indicates data not recorded
3. Crε = Recompression ratio
4. Constant Rate of Strain (CRS) tests were performed in accordance with ASTM D4186.
Interpreted
Pre-consolidation
Pressure, σ'p (psf)
OCR (1)
Initial Dry
Density, γd
(pcf)
Moisture
Content (%)Void Ratio
Estimated
Effective Vertical
Stress, σ'vo (psf)
Subsurface Exploration Program (CDM Smith, Jul-Aug 2017)
Exploration
No.
Sample
No.
City of Cambridge
Tobin School
Cambridge, Massachusetts
Table 2
Summary of Consolidation Test Results
Sample
Depth (ft)Stratum
Recompression
Ratio
Coefficient of
Consolidation, Cv
(ft2/yr)
Compression
Ratio
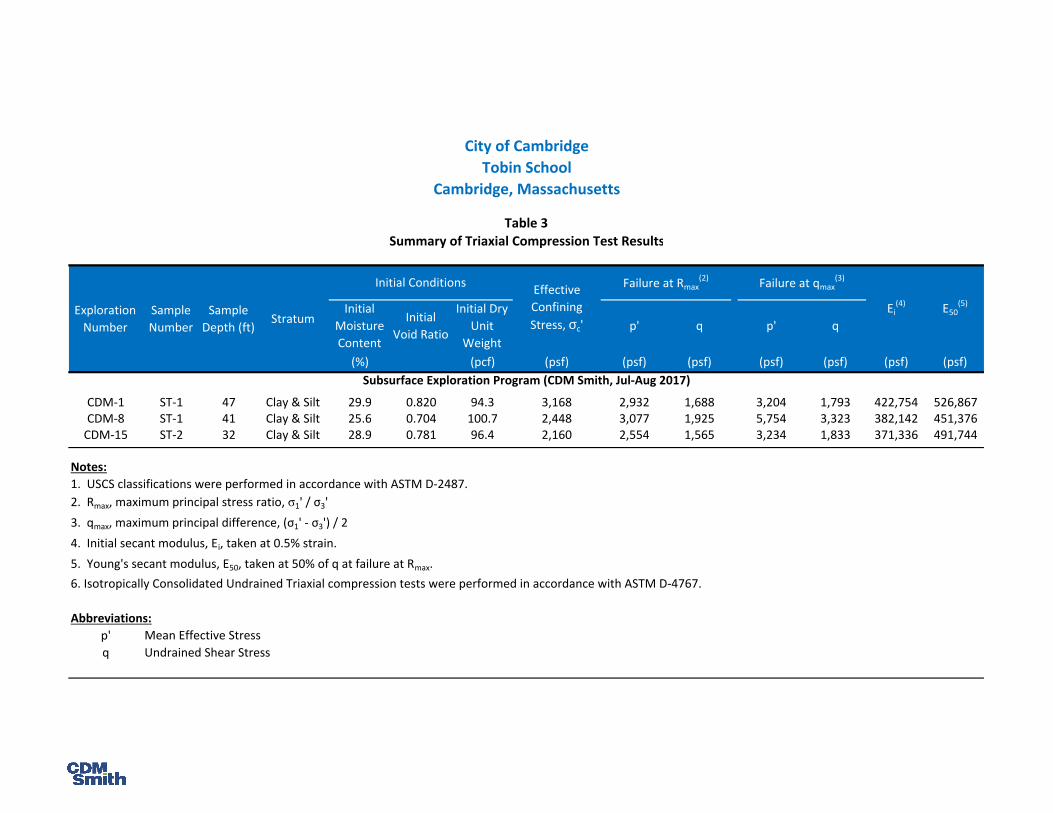
Initial
Moisture
Content
Initial
Void Ratio
Initial Dry
Unit
Weight
p' q p' q
(%) (pcf) (psf) (psf) (psf) (psf) (psf) (psf) (psf)
CDM-1 ST-1 47 Clay & Silt 29.9 0.820 94.3 3,168 2,932 1,688 3,204 1,793 422,754 526,867
CDM-8 ST-1 41 Clay & Silt 25.6 0.704 100.7 2,448 3,077 1,925 5,754 3,323 382,142 451,376
CDM-15 ST-2 32 Clay & Silt 28.9 0.781 96.4 2,160 2,554 1,565 3,234 1,833 371,336 491,744
Notes:
1. USCS classifications were performed in accordance with ASTM D-2487.
2. Rmax, maximum principal stress ratio, σ1' / σ3'
3. qmax, maximum principal difference, (σ1' - σ3') / 2
4. Initial secant modulus, Ei, taken at 0.5% strain.
5. Young's secant modulus, E50, taken at 50% of q at failure at Rmax.
6. Isotropically Consolidated Undrained Triaxial compression tests were performed in accordance with ASTM D-4767.
Abbreviations:
p' Mean Effective Stress
q Undrained Shear Stress
City of Cambridge
Tobin School
Cambridge, Massachusetts
Table 3
Summary of Triaxial Compression Test Results
Subsurface Exploration Program (CDM Smith, Jul-Aug 2017)
Ei(4)
E50(5)
Sample
Depth (ft)
Initial ConditionsEffective
Confining
Stress, σc'
Failure at Rmax(2)
Failure at qmax(3)
Exploration
Number
Sample
NumberStratum

Depth (bgs) Strata Falling Rising Falling Rising
MW-3S 3-13 FILL/WASTE 13.60 27.05 4.80E-03 9.54E-03
MW-3D 14-24 WASTE 7.57 18.59 2.67E-03 6.56E-03
MW-4S 3-18 Fill/WASTE 6.27 6.53 2.21E-03 2.31E-03
MW-4D 20-30 WASTE 14.05 10.02 4.96E-03 3.53E-03
MW-7S 3-13 FILL/WASTE 8.78 22.85 3.10E-03 8.06E-03
MW-7D 7-17 WASTE 8.85 11.40 3.12E-03 4.02E-03
MW-9S 2-12 FILL/WASTE 2.50 8.38 8.82E-04 2.96E-03
MW-9D 12-22 WASTE 6.47 4.57 2.28E-03 1.61E-03
MW-14S 2-12 FILL/WASTE 0.21 1.45 7.24E-05 5.12E-04
MW-14D 12-22 WASTE 2.35 15.90 8.28E-04 5.61E-03
Notes:
1. All wells constructed using 2 " Schedule 40 PVC Riser and 2" (.01") Slot Schedule 40 PVC Screen
2. Slug Testing completed on 3/1/2018
Screened Interval Hydraulic Conductivity (cm/sec)
Well Identification
Hydraulic Conductivity (ft/day)
City of Cambridge
Tobin School
Cambridge, Massachusetts
Summary of Hydraulic Conductivity Test Results
Table 4

Topsoil PavementGranular
Fill
Waste
Fill
Organic
Soils
Clay
& Silt
Glacial
Till
Weathered
RockBedrock
Boring #1 22.6 66.5 -- -- -- 6.5 -- 52.5 >7.5 -- -- -- -- --
Boring #2 22.7 11.0 -- -- 5.5 -- -- >5.5 -- -- -- -- -- --
Boring #2A 22.7 39.5 -- -- -- 6.0 -- 23.0 0.5 -- >10.0 29.6 -- --
Boring #3 21.1 46.3 -- -- -- 25.0 -- 13.5 >7.8 -- -- -- 8.1 13.0
Boring #4 21.6 52.5 -- -- -- 18.0 -- 26.5 >8 -- -- -- 5.8 15.8
Boring #5 21.6 33.0 -- -- -- 19.0 -- >14.0 -- -- -- -- 8.5 13.1
Boring #6 21.7 25.5 -- -- -- 21.5 -- >4.0 -- -- -- -- 5.5 16.2
Boring #7 21.8 41.0 -- -- -- 21.0 -- >20.0 -- -- -- -- 5.5 16.3
Boring #8 22.6 30.0 -- -- 2.5 -- -- >27.5 -- -- -- -- 7.5 15.1
Boring #9 21.8 41.5 -- -- 5.5 15.5 -- 19.5 >1.0 -- -- -- 5.5 16.3
Boring #10 21.6 27.0 -- -- 6.5 13.0 -- 6.5 >1.0 -- -- -- 5.5 16.1
Boring #11 21.3 33.0 -- -- 6.0 15.0 -- 10.0 >2.0 -- -- -- 5.0 16.3
Boring #12 22.0 32.0 -- -- 5.0 9.0 -- 16.0 >2.0 -- -- -- 6.6 15.4
Boring #13 21.4 50.0 -- -- -- 25.0 1.5 17.5 >6.0 -- -- -- 5.5 15.9
Boring #14 22.7 51.0 -- -- 5.0 8.0 -- 34.5 >3.5 -- -- -- 9.0 13.7
Boring #15 21.2 10.0 -- -- -- 10.0 -- -- -- -- -- -- 6.0 15.2
Boring #15A 21.2 66.0 1.5 -- -- 18.5 -- 42.0 2.0 >2.0 NE -- 6.0 15.2
Boring #16 22.0 58.0 -- -- 7.0 -- -- 42.0 >9.0 -- -- -- 6.5 15.5
Boring #17 21.9 87.0 -- -- -- 16.0 -- 61.0 -- -- >10.0 77.0 6.5 15.4
Boring #18 21.6 88.0 -- -- -- 16.5 -- 52.5 9.0 -- >10.0 78.0 6.8 14.8
Boring #19 21.3 49.0 -- -- -- 14.5 -- 24.5 -- -- >10.0 39.0 7.3 14.0
Boring #20 21.8 97.0 -- -- -- 15.5 -- 65.5 6.0 -- >10.0 87.0 7.8 14.0
Boring #21 21.7 66.0 -- -- -- 14.0 -- >52.0 -- -- -- -- 4.5 17.2
Boring #22 21.5 69.5 -- -- -- 14.5 -- 49.0 >6.0 -- -- -- 5.8 15.7
Boring #23 22.3 75.5 -- -- -- 18.5 -- >57.0 NE -- -- -- 8.5 13.8
Boring #24 22.1 73.5 -- -- -- 13.0 -- 52.5 >8.0 -- -- -- 9.5 12.6
B-1 20.7 16.0 -- -- -- >16.0 -- -- -- -- -- -- -- --
B-4 20.6 16.0 -- -- -- >16.0 -- -- -- -- -- -- 5.0 15.6
B-6 21 20.0 -- -- -- >20.0 -- -- -- -- -- -- 5.0 16.0
CHI-4 20.3 16.0 -- -- -- >16.0 -- -- -- -- -- -- 5.0 15.3
CHI-5 20.5 16.0 -- -- -- 14.0 -- >2.0 -- -- -- -- 5.0 15.5
CHI-6 20.4 16.0 -- -- -- >16.0 -- -- -- -- -- -- 5.0 15.4
CHI-7 21.8 12.0 -- -- -- 10.0 -- >2.0 -- -- -- -- 5.0 16.8
Depth to
Groundwater
(ft)(2)
Approximate
Groundwater
Elevation
(ft)
Exploration
Number
Approximate
Ground Surface
Elevation (ft)(1)
Exploration
Depth
(ft)
Depth to Top
of Bedrock (ft)
Stratum Thickness (ft)
Previous Subsurface Exploration Program (New England Test Boring Corporation, Oct-Nov 1966)
Previous Subsurface Exploration Program (New England Test Boring Corporation, Jan 1968)
Previous Subsurface Exploration Program (Clean Harbors Environmental Services, Inc., Mar 2000)
City of Cambridge
Tobin School
Cambridge, Massachusetts
Table 5
Summary of Subsurface Exploration Programs

Topsoil PavementGranular
Fill
Waste
Fill
Organic
Soils
Clay
& Silt
Glacial
Till
Weathered
RockBedrock
Depth to
Groundwater
(ft)(2)
Approximate
Groundwater
Elevation
(ft)
Exploration
Number
Approximate
Ground Surface
Elevation (ft)(1)
Exploration
Depth
(ft)
Depth to Top
of Bedrock (ft)
Stratum Thickness (ft)
Previous Subsurface Exploration Program (New England Test Boring Corporation, Oct-Nov 1966)
City of Cambridge
Tobin School
Cambridge, Massachusetts
Table 5
Summary of Subsurface Exploration Programs
B-13 20.4 22.0 -- -- 10.0 8.0 -- >4.0 -- -- -- -- 4.5 15.9
B-14 20.5 8.0 -- -- 6.0 >2.0 -- -- -- -- -- -- 3.0 17.5
B-15 20.5 8.0 -- -- >8.0 -- -- -- -- -- -- 3.0 17.5
B-16 20.5 22.0 -- -- -- 20.3 -- >1.8 -- -- -- -- 4.8 15.8
B-17 20.5 22.0 -- -- 3.0 17.1 -- >1.9 -- -- -- -- 4.8 15.8
B-18 20.7 16.0 -- -- -- >16.0 -- -- -- -- -- -- 3.8 17.0
CHI-8 21.6 17.0 -- -- 5.0 3.0 0.5 >8.5 -- -- -- -- 5.0 16.6
CHI-9 21.8 17.0 -- -- 0.8 4.3 2.0 >10.0 -- -- -- -- 4.8 17.1
CHI-10 21.4 17.0 -- -- -- 10.0 5.2 >2.8 -- -- -- -- 4.8 16.7
CHI-11 21.1 22.0 -- -- 10.0 9.5 -- >2.5 -- -- -- -- 7.0 14.1
CHI-12 22.6 17.0 -- -- 3.0 7.0 -- >7.0 -- -- -- -- 4.8 17.9
CDM-1 21.5 83.0 0.3 -- 7.7 22.4 -- 32.1 12.2 -- >8.3 74.7 7.7 13.8
CDM-2 22.2 62.5 0.2 -- 7.3 -- 1.5 38.5 7.5 -- >7.5 55.0 5.3 16.9
CDM-3 20.7 55.0 0.8 -- 1.2 26.0 -- 20.5 3.5 -- >3.0 52.0 NR --
CDM-4 21.4 63.5 0.8 -- 5.2 24.0 -- 23.0 5.5 -- >5.0 58.5 NR --
CDM-5 22.0 50.0 0.7 -- 3.3 24.0 -- 19.0 >3.0 -- -- -- NR --
CDM-6 22.9 50.0 0.5 -- 2.5 -- -- 40.5 4.0 >2.5 -- -- NR --
CDM-7 20.8 81.5 -- 0.4 5.6 10.2 -- 58.3 7.0 -- 0.0 81.5 4.5 16.3
CDM-8 19.4 59.1 -- 0.5 7.5 10.0 -- 29.0 11.0 -- >1.1 58.0 NR --
CDM-9 21.3 40.0 -- 0.5 3.5 14.0 -- 10.7 2.8 -- >8.5 31.5 7.0 14.3
CDM-10 23.9 41.0 -- 0.4 7.6 -- -- 22.8 1.2 -- >9.0 32.0 8.5 15.4
CDM-11 22.9 52.0 -- -- 3.0 5.2 -- >43.8 -- -- -- -- NR --
CDM-12 23.6 50.0 -- 0.5 11.5 -- -- 38.0 -- -- -- -- 7.0 16.6
CDM-13 22.8 94.0 0.3 -- 5.7 8.0 -- 66.0 12.5 -- >1.5 92.5 NR --
CDM-14 22.3 85.5 -- -- 2.0 18.0 -- 62.5 -- >3.0 -- -- NR --
CDM-15 23.3 80.5 0.3 -- 3.7 -- -- 75.3 -- -- >1.2 79.3 6.5 16.8
TP-101 21.0 13.5 1.0 -- 6.0 >6.5 -- -- -- -- -- -- 11.0 10.0
TP-102 21.0 12.0 1.0 -- 2.5 >8.5 -- -- -- -- -- -- 9.5 11.5
TP-201 23.5 22.0 1.0 -- 3.0 >18.0 -- -- -- -- -- -- 12.5 11.0
TP-203 21.0 18.0 0.5 -- 5.5 >12.0 -- -- -- -- -- -- 9.0 12.0
TP-204 21.0 16.0 0.5 -- 5.5 9.0 -- >1.0 -- -- -- -- 7.5 13.5
Previous Subsurface Exploration Program (Clean Harbors Environmental Services, Inc., Feb 2001)
Phase 1 - Subsurface Exploration Program (CDM Smith, Jul-Aug 2017)
Phase 1 - Test Pit Program (CDM Smith, Dec 2017)
Phase 2 - Test Pit Program (CDM Smith, Feb 2018)

Topsoil PavementGranular
Fill
Waste
Fill
Organic
Soils
Clay
& Silt
Glacial
Till
Weathered
RockBedrock
Depth to
Groundwater
(ft)(2)
Approximate
Groundwater
Elevation
(ft)
Exploration
Number
Approximate
Ground Surface
Elevation (ft)(1)
Exploration
Depth
(ft)
Depth to Top
of Bedrock (ft)
Stratum Thickness (ft)
Previous Subsurface Exploration Program (New England Test Boring Corporation, Oct-Nov 1966)
City of Cambridge
Tobin School
Cambridge, Massachusetts
Table 5
Summary of Subsurface Exploration Programs
CDM-101A 21.5 5.0 -- 0.3 4.2 >0.5 -- -- -- -- -- -- NE --
CDM-101B 21.5 15.0 -- 0.3 2.7 7.7 -- >4.3 -- -- -- -- NR --
CDM-102A 21.2 9.0 -- 0.4 2.6 >4.8 -- -- -- -- -- -- NE --
CDM-102B 21.2 15.0 -- 0.4 8.1 -- 0.5 >6.0 -- -- -- -- 8.5 12.7
CDM-103 21.5 23.0 -- 0.3 2.7 16.2 -- >3.8 -- -- -- -- 6.5 15.0
CDM-104 20.2 34.0 0.5 -- 7.2 24.1 -- >2.2 -- -- -- -- 6.5 13.7
CDM-105 (3) 22.5 12.0 0.3 -- 3.7 -- 0.3 >7.8 -- -- -- -- 7.0 15.5
CDM-106 21.3 18.0 0.5 -- 2.5 11.3 -- >3.7 -- -- -- -- 7.3 14.1
CDM-107 23.2 12.0 -- -- 4.0 -- -- >8.0 -- -- -- -- 6.5 16.7
CDM-108 21.2 15.0 -- 0.4 2.3 6.1 0.3 >6.0 -- -- -- -- 7.2 14.0
CDM-109 22.7 15.0 -- 0.4 4.3 2.3 1.0 >7.0 -- -- -- -- 8.1 14.6
CDM-110 22.5 13.0 -- 0.4 2.1 4.5 1.7 >4.3 -- -- -- -- NR --
CDM-111 21.8 12.0 0.5 -- 2.8 3.7 -- >5.0 -- -- -- -- NE --
CDM-112 21.8 18.0 0.5 -- 1.5 10.8 -- >5.2 -- -- -- -- 9.8 12.0
CDM-113 22.0 18.0 0.5 -- 1.5 9.5 -- >6.5 -- -- -- -- 6.8 15.2
CDM-114 22.5 20.0 -- -- 6.0 -- -- >14.0 -- -- -- -- 8.0 14.5
CDM-115 22.2 16.0 0.5 -- 3.5 -- -- >12.0 -- -- -- -- 8.8 13.4
CDM-116 24.0 14.0 0.5 -- 3.5 5.8 -- >4.3 -- -- -- -- 12.0 12.0
CDM-117 20.8 19.0 -- 0.3 4.7 -- -- >14.0 -- -- -- -- 9.5 11.3
CDM-118 22.3 24.0 0.5 -- 2.8 16.2 -- >4.5 -- -- -- -- 9.8 12.5
CDM-119 21.2 36.0 0.3 -- 2.3 30.0 -- >3.3 -- -- -- -- 8.5 12.7
CDM-120 21.2 21.0 -- 0.3 2.7 15.6 -- >2.4 -- -- -- -- 6.8 14.4
Notes:
1. Elevations are referenced to the Cambridge City Base (CCB). Elevations from previous borings from 1966 and 1968 are estimated based on a historical plan entitled "Existing Conditions", dated 01/20/1969.
Elevations for borings from Phase 1 Subsurface Exploration Program were surveyed. Elevations for all other borings are estimated based on a site plan entitled "Exisitng Conditions Survey" by Surveying
and Mapping Consultants, dated 10/02/2017.
2. Groundwater depths were measured inside borehole or test pit at completion of test borings or excavation and may not necessarily represent stabilized levels.
3. Clay & Silt encountered above and below Organic Soils. Layer thickness indicates total thickness of both upper and lower Clay & Silt.
-- indicates no value NR indicates not recorded
> indicates strata not fully penetrated NE indicates not encountered
Abbreviations:
Phase 2 - Subsurface Exploration Program (CDM Smith, Jan-Feb 2018)

Date of Reading
Groundwater Depth
Below Ground
Surface (ft)
Groundwater El.
(ft)
8/17/2017 6.6 14.4
10/2/2017 7.0 14.0
3/1/2018 6.1 14.9
8/17/2017 6.8 14.2
10/2/2017 7.2 13.8
3/1/2018 6.3 14.7
8/17/2017 7.1 14.4
10/2/2017 7.6 13.9
3/1/2018 6.7 14.8
8/17/2017 7.0 14.3
3/1/2018 6.6 14.7
8/16/2017 6.7 14.3
10/2/2017 7.2 13.8
3/1/2018 6.3 14.7
8/16/2017 6.7 14.3
10/2/2017 7.2 13.8
3/1/2018 6.5 14.5
8/16/2017 6.7 14.6
10/2/2017 7.4 13.9
3/1/2018 6.5 14.9
8/16/2017 6.9 14.5
10/2/2017 7.5 14.0
3/1/2018 6.5 14.9
8/16/2017 8.1 14.3
10/2/2017 8.5 13.9
3/1/2018 7.6 14.8
8/16/2017 9.0 13.3
10/2/2017 9.4 12.8
3/1/2018 8.6 13.7
Notes:
1. See Figure 1 for Monitoring Well locations.
2. Elevations are referenced to the Cambridge City Base (CCB).
3. MW-S is abbreviated for Monitoring Well-Shallow and represents the monitoring well with the shallower screen interval
at the specified boring location.
4. MW-D is abbreviated for Monitoring Well-Deep and represents the monitoring well the deeper screen interval at the
specified boring location.
Subsurface Exploration Program (CDM Smith, Jul-Aug 2017)
City of Cambridge
Tobin School
Cambridge, Massachusetts
Table 6
Summary of Monitoring Well Readings
Exploration
No. (1)
Approximate Ground
Surface El. (ft)(2)
Screen Depth
Interval
(ft bgs)
CDM-3 (MW-S) 21.0 3 - 13
CDM-3 (MW-D) 21.0 14 - 24
CDM-4 (MW-S) 21.5 3 -18
CDM-4 (MW-D) 21.3 20 -30
CDM-7 (MW-S) 21.0 3 - 13
CDM-7 (MW-D) 21.0 7 - 17
CDM-14 (MW-D) 22.2 12 - 22
CDM-9 (MW-S) 21.3 2 - 12
CDM-9 (MW-D) 21.4 12 - 22
CDM-14 (MW-S) 22.4 2 - 12

City of Cambridge
Tobin School
Cambridge, Massachusetts
Table 7
Soil Sampling Results July-August 2017
CDM-1 (8-10') CDM-1 (24-28') CDM-2 (0-4') CDM-2 (2-4') CDM-3 (0-1') CDM-3 (1-2') CDM-3 (8-10') CDM-3 (8-12') CDM-3 (22-24') CDM-3 (24-26) CDM-4 (8-10') CDM-4 (22-24') CDM-4 (32-34')
8/4/2017 8/7/2017 8/1/2017 8/1/2017 7/27/2017 7/27/2017 7/27/2017 7/27/2017 7/27/2017 7/27/2017 8/2/2017 8/2/2017 8/2/2017
L1727138-05 L1727484-01 L1726673-01 L1726673-02 L1726151-01 L1726151-02 L1726151-03 L1726151-04 L1726151-05 L1726151-09 L1726673-03 L1726673-04 L1726673-05
Extractable Petroleum Hydrocarbons
C11-C22 Aromatics mg/kg 266 248 71.3 - - 53.8 7.08 U - - 68 25.7 8.62 U 1280 215 11.6
C11-C22 Aromatics, Adjusted mg/kg 1000 1000 1000 1000 3000 3000 1000 5000 5000 198 227 53.7 - - 40.5 7.08 U - - 63.7 25.7 8.62 U 978 214 11.6
C19-C36 Aliphatics mg/kg 3000 3000 3000 5000 5000 5000 5000 5000 5000 164 177 26.2 - - 20.3 8.83 - - 76.5 68.8 8.62 U 446 109 7.93 U
C9-C18 Aliphatics mg/kg 1000 1000 1000 3000 3000 3000 5000 5000 5000 12 61.9 7.26 U - - 14 8.82 - - 19.3 12.6 U 8.62 U 79.5 U 85.2 7.93 U
General Chemistry
Solids, Total % 84.3 58.4 89.7 89.7 82.6 92.7 73.1 73.1 74.6 76.3 82.9 77.2 79.4
MCP Semivolatile Organics
2-Methylnaphthalene mg/kg 0.7 80 300 1 80 500 1 80 500 0.92 U 0.54 0.22 U - - 0.24 U 0.21 U - - 0.27 U 0.26 U 0.26 U 3.4 0.26 U 0.25 U
3-Methylphenol/4-Methylphenol mg/kg 1.1 U 0.41 0.26 U - - 0.29 U 0.25 U - - 0.32 U 0.31 U 0.31 U 2.8 U 0.31 U 0.3 U
Acenaphthene mg/kg 4 1000 1000 4 3000 3000 4 5000 5000 0.9 0.32 0.15 - - 0.16 U 0.14 U - - 0.18 U 0.17 U 0.17 U 11 0.17 U 0.16 U
Acenaphthylene mg/kg 1 600 10 1 600 10 1 600 10 0.62 U 0.22 U 0.14 U - - 0.16 U 0.14 U - - 0.18 U 0.17 U 0.17 U 2.3 0.17 U 0.16 U
Anthracene mg/kg 1000 1000 1000 3000 3000 3000 5000 5000 5000 2.3 0.81 0.56 - - 0.17 0.11 U - - 0.15 0.13 U 0.13 U 22 0.2 0.12 U
Benzo(a)anthracene mg/kg 7 7 7 40 40 40 300 300 300 3.5 1.4 2 - - 0.6 0.11 U - - 0.35 0.13 U 0.13 U 28 0.39 0.12 U
Benzo(a)pyrene mg/kg 2 2 2 7 7 7 30 30 30 2.5 1.6 2 - - 0.58 0.14 U - - 0.34 0.17 U 0.17 U 17 0.38 0.16 U
Benzo(b)fluoranthene mg/kg 7 7 7 40 40 40 300 300 300 3.2 1.3 2.4 - - 0.72 0.11 U - - 0.41 0.13 U 0.13 U 20 0.42 0.12 U
Benzo(ghi)perylene mg/kg 1000 1000 1000 3000 3000 3000 5000 5000 5000 1.5 0.84 1.1 - - 0.33 0.14 U - - 0.2 0.17 U 0.17 U 6.9 0.2 0.16 U
Benzo(k)fluoranthene mg/kg 70 70 70 400 400 400 3000 3000 3000 1.1 0.38 0.81 - - 0.27 0.11 U - - 0.14 0.13 U 0.13 U 8.1 0.16 0.12 U
Bis(2-ethylhexyl)phthalate mg/kg 90 90 90 600 600 600 2000 2000 2000 0.77 U 0.28 U 0.58 - - 0.2 U 0.18 U - - 0.23 U 0.22 U 0.22 U 2 U 0.21 U 0.21 U
Chrysene mg/kg 70 70 70 400 400 400 3000 3000 3000 3 1.4 1.8 - - 0.62 0.11 U - - 0.34 0.13 U 0.13 U 26 0.38 0.12 U
Dibenzo(a,h)anthracene mg/kg 0.7 0.7 0.7 4 4 4 30 30 30 0.46 U 0.5 0.18 U - - 0.12 U 0.11 U - - 0.14 U 0.13 U 0.13 U 2 U 0.21 U 0.21 U
Dibenzofuran mg/kg 0.78 0.4 0.18 U - - 0.2 U 0.18 U - - 0.23 U 0.22 U 0.22 U 2 U 0.21 U 0.21 U
Diethyl phthalate mg/kg 10 200 300 10 200 300 10 200 300 0.77 U 0.28 U 0.28 - - 0.2 U 0.18 U - - 0.23 U 0.22 U 0.22 U 2 U 0.13 U 0.12 U
Dimethyl phthalate mg/kg 0.7 50 600 0.7 50 600 0.7 50 600 0.77 U 0.28 U 0.18 U - - 0.2 U 0.18 U - - 0.23 U 0.22 U 0.22 U 7.3 0.21 U 0.21 U
Fluoranthene mg/kg 1000 1000 1000 3000 3000 3000 5000 5000 5000 7.8 2 4.2 - - 1.2 0.11 U - - 0.79 0.22 0.13 U 57 0.86 0.12 U
Fluorene mg/kg 1000 1000 1000 3000 3000 3000 5000 5000 5000 1.5 0.53 0.2 - - 0.2 U 0.18 U - - 0.23 U 0.22 U 0.22 U 14 0.21 U 0.21 U
Indeno(1,2,3-cd)pyrene mg/kg 7 7 7 40 40 40 300 300 300 1.8 0.68 1.2 - - 0.37 0.14 U - - 0.22 0.17 U 0.17 U 8.5 0.19 0.16 U
Naphthalene mg/kg 4 20 500 4 20 1000 4 20 3000 0.77 U 0.62 0.18 U - - 0.2 U 0.18 U - - 0.23 U 0.22 U 0.22 U 3.1 0.21 U 0.21 U
Phenanthrene mg/kg 10 500 500 20 1000 1000 20 3000 3000 7.5 2.9 2 - - 0.75 0.11 U - - 0.67 0.2 0.13 U 62 0.54 0.12 U
Pyrene mg/kg 1000 1000 1000 3000 3000 3000 5000 5000 5000 6.5 1.7 3.8 - - 1 0.11 U - - 0.74 0.18 0.13 U 51 0.73 0.12 U
MCP Total Metals
Antimony, Total mg/kg 20 20 20 30 30 30 30 30 30 2.26 U 3.38 U 2.18 U - - 2.3 U 2.13 U - - 2.7 U 2.63 U 2.5 U 2.37 U 2.48 U 2.46 U
Arsenic, Total mg/kg 20 20 20 20 20 20 50 50 50 5.35 7.26 6.97 - - 5.9 18.6 - - 5.99 15 10.2 4.11 5.39 8.46
Barium, Total mg/kg 1000 1000 1000 3000 3000 3000 5000 5000 5000 85 292 32.9 - - 45.1 15.7 - - 67.4 271 78.6 32.4 48.2 67.9
Beryllium, Total mg/kg 90 90 90 200 200 200 200 200 200 0.236 0.338 U 0.257 - - 0.318 0.213 U - - 0.427 0.394 0.744 0.237 U 0.248 0.674
Cadmium, Total mg/kg 70 70 70 100 100 100 100 100 100 1.06 2.02 0.435 U - - 0.461 U 0.426 U - - 0.541 U 0.525 U 0.709 1.4 0.604 0.581
Chromium, Total mg/kg 100 100 100 200 200 200 200 200 200 10.1 16 14 - - 16.7 12.9 - - 14.6 25.1 41.8 8.5 22.6 32.7
Lead, Total mg/kg 200 200 200 600 600 600 600 600 600 417 5200 111 - - 76 6.07 - - 71.7 524 11.7 86.4 52.3 19.7
Mercury, Total mg/kg 20 20 20 30 30 30 30 30 30 0.414 1.54 0.207 - - 0.201 0.068 U - - 0.389 0.243 0.084 U 0.124 0.081 U 0.081 U
Nickel, Total mg/kg 600 600 600 1000 1000 1000 1000 1000 1000 8.98 7.78 9.75 - - 10.5 15.4 - - 11.4 16.6 27 26.6 26.8 23.9
Selenium, Total mg/kg 400 400 400 700 700 700 700 700 700 2.26 U 3.38 U 2.18 U - - 2.3 U 2.13 U - - 2.7 U 2.63 U 2.5 U 2.37 U 2.48 U 2.46 U
Silver, Total mg/kg 100 100 100 200 200 200 200 200 200 0.453 U 0.676 U 0.435 U - - 0.461 U 0.426 U - - 0.541 U 0.525 U 0.499 U 0.474 U 0.495 U 0.492 U
Vanadium, Total mg/kg 400 400 400 700 700 700 700 700 700 17 15 16.9 - - 21.3 8.65 - - 19.6 24.4 46.8 158 19.2 40.5
Zinc, Total mg/kg 1000 1000 1000 3000 3000 3000 5000 5000 5000 205 1000 90.6 - - 77.4 19.4 - - 281 515 62 268 104 61.1
TCLP Metals by EPA 1311
*Lead, TCLP mg/L 0.992 138 0.5 U - - - - - - - - - - 0.5 U - - - - - - - -
MCP Volatile Organics by 8260/5035
Acetone mg/kg 6 50 400 6 50 400 6 50 400 1.7 U 0.16 U - - 0.048 U 0.11 U 0.063 U 5.1 U - - 0.065 U 0.071 U 3.9 U 5.2 U 0.087 U
Benzene mg/kg 2 40 40 2 200 200 2 400 1000 0.047 U 0.0045 U - - 0.0013 U 0.003 U 0.0017 U 0.14 U - - 0.0018 U 0.002 U 0.11 U 0.15 U 0.0024 U
Chloroform mg/kg 0.4 0.2 500 0.4 0.2 1000 0.4 0.2 1000 0.071 U 0.0068 U - - 0.002 U 0.0045 U 0.0026 U 0.21 U - - 0.0027 U 0.003 U 0.16 U 0.22 U 0.0036 U
Isopropylbenzene mg/kg 0.047 U 0.0045 U - - 0.0013 U 0.003 U 0.0017 U 0.14 U - - 0.0018 U 0.002 U 0.11 U 0.15 U 0.0024 U
Methyl ethyl ketone mg/kg 4 50 400 4 50 400 4 50 400 0.47 U 0.045 U - - 0.013 U 0.03 U 0.017 U 1.4 U - - 0.018 U 0.02 U 1.1 U 1.5 U 0.024 U
Methyl tert butyl ether mg/kg 0.1 100 100 0.1 100 500 0.1 100 500 0.095 U 0.009 U - - 0.0026 U 0.006 U 0.0035 U 0.28 U - - 0.0036 U 0.004 U 0.22 U 0.29 U 0.0048 U
n-Butylbenzene mg/kg 0.047 U 0.0045 U - - 0.0013 U 0.003 U 0.0017 U 0.14 U - - 0.0018 U 0.002 U 0.11 U 0.15 U 0.0024 U
n-Propylbenzene mg/kg 0.047 U 0.0045 U - - 0.0013 U 0.003 U 0.0017 U 0.14 U - - 0.0018 U 0.002 U 0.11 U 0.15 U 0.0024 U
Naphthalene mg/kg 4 20 500 4 20 1000 4 20 3000 0.52 0.021 - - 0.0053 U 0.012 U 0.007 U 0.57 U - - 0.0072 U 0.0079 U 1.6 0.58 U 0.0097 U
p-Isopropyltoluene mg/kg 0.047 U 0.0045 U - - 0.0013 U 0.003 U 0.0017 U 0.14 U - - 0.01 0.002 U 0.11 U 0.15 U 0.0024 U
sec-Butylbenzene mg/kg 0.047 U 0.0045 U - - 0.0013 U 0.003 U 0.0017 U 0.14 U - - 0.0018 U 0.002 U 0.11 U 0.15 U 0.0024 U
Tetrachloroethene mg/kg 1 10 30 1 10 200 1 10 1000 0.047 U 0.0045 U - - 0.0013 U 0.003 U 0.0017 U 0.14 U - - 0.0018 U 0.002 U 0.11 U 0.15 U 0.0024 U
MCP Volatile Organics by 5035 High
Naphthalene mg/kg 4 20 500 4 20 1000 4 20 3000 - - - - - - - - - - - - - - - - - - - - - - - - - -
Notes:
Underlined values exceed S-1 Soil Standards (only applicable for samples from 0-15' BGS.
Shaded Values: Exceed S-2 Standards
Bold Values Exceed S-3 Soil Standards
Italicized Value : Reporting limits greater than applicable MassDEP standards
mg/kg - micrograms per kilogram
# U: Not detected to the limit indicated
# E: Concentraction of analyte exceeds the range of the calibration curve and/or linear range of the instrument
* - Lead Toxity Leaching Characteristic Leaching Procedure EPA Hazardous Waste Limit = 5.0 mg/L.
Sample ID
Sample Collection Date
Laboratory Order Number
ParameterReporting
UnitsS-1/GW-1 S-1/GW-2 S-1/GW-3 S-2/GW-1 S-2/GW-2 S-2/GW-3 S-3/GW-1 S-3/GW-2 S-3/GW-3
Results Results Results Results Results Results Results Results Results Results Results Results Results

City of Cambridge
Tobin School
Cambridge, Massachusetts
Table 7
Soil Sampling Results July-August 2017
CDM-5 (9-11') CDM-5 (9-13') CDM-5 (24-26') CDM-5 (24-28') CDM-6 (0-2') CDM-6 (20-22') CDM-7 (6-8') CDM-7 (16-18') CDM-8 (8-10') CDM-8 (16-18') CDM-8 (22-24') CDM-9 (10-12') CDM-9 (14-16') CDM-9 (14-16') CDM-9 (20-22') CDM-10 (2-4')
8/4/2017 8/4/2017 8/4/2017 8/4/2017 7/26/2017 7/26/2017 7/17/2017 7/17/2017 7/18/2017 7/18/2017 7/18/2017 7/27/2017 7/27/2017 7/27/2017 7/27/2017 7/31/2017
L1727138-01 L1727138-02 L1727138-03 L1727138-04 L1725718-04 L1725718-05 L1724532-01 L1724532-02 L1724532-05 L1724532-06 L1724532-07 L1726151-06 L1726151-07 L1726151-07 R1 L1726151-08 L1726486-01
- - 2140 - - 61.3 17.1 8.46 U 1060 - - 1050 294 8.25 U 67.9 854 - - 9.38 25.7
- - 2080 - - 59.8 16 8.46 U 1060 - - 774 226 8.25 U 50.7 727 - - 9.38 25.7
- - 1590 - - 96.3 7.37 U 8.46 U 3070 - - 414 299 8.25 U 67.2 1630 - - 19.4 28.2
- - 431 - - 13.5 7.37 U 8.46 U 92.1 - - 80 33.5 8.25 U 7.65 U 299 - - 8.66 U 7.42 U
70.8 70.8 80.7 80.7 89.3 75.4 84.1 75 67.7 70.5 79.1 86.9 34.7 - - 73.4 87.3
- - 0.3 - - 0.28 0.22 U 0.26 U 2.4 U - - 2.9 U 0.8 0.25 U 0.28 1.1 - - 0.26 U 0.22 U
- - 0.47 - - 0.29 U 0.26 U 0.31 U 2.8 U - - 3.5 U 0.34 U 0.3 U 0.27 U 0.67 U - - 0.32 U 0.27 U
- - 0.57 - - 0.97 0.15 U 0.17 U 1.6 U - - 5 1.6 0.17 U 0.58 3.3 - - 0.18 U 0.15 U
- - 0.19 U - - 0.37 0.15 U 0.17 U 1.6 U - - 1.9 U 0.2 0.17 U 0.15 U 0.72 - - 0.18 U 0.15 U
- - 1.6 - - 1.5 0.15 0.13 U 1.2 U - - 17 2.8 0.13 U 1.4 7.3 - - 0.13 U 0.11 U
- - 1.8 - - 1.8 0.33 0.13 U 1.2 U - - 17 4.3 0.13 U 1.4 13 - - 0.13 U 0.11
- - 1.1 - - 1.4 0.36 0.17 U 1.6 U - - 14 2.9 0.17 U 1.2 13 - - 0.18 U 0.15 U
- - 1.5 - - 1.7 0.43 0.13 U 1.2 U - - 19 3.8 0.13 U 1.4 15 - - 0.13 U 0.13
- - 0.58 - - 0.61 0.31 0.17 U 1.6 U - - 5.6 1.9 0.17 U 0.66 7 - - 0.18 U 0.15 U
- - 0.5 - - 0.61 0.12 0.13 U 1.2 U - - 6.6 1.3 0.13 U 0.5 5.3 - - 0.13 U 0.11 U
- - 0.23 U - - 0.2 U 0.18 0.22 U 2 U - - 2.4 U 0.23 U 0.21 U 0.19 U 0.46 U - - 0.22 U 0.19 U
- - 2 - - 1.6 0.33 0.13 U 1.2 U - - 15 3.7 0.13 U 1.2 13 - - 0.13 U 0.11 U
- - 0.2 - - 0.2 0.11 U 0.13 U 1.2 U - - 1.5 0.57 0.13 U 0.16 U 1.7 - - 0.13 U 0.11 U
- - 0.41 - - 0.73 0.18 U 0.22 U 2 U - - 3.8 1.1 0.21 U 0.56 U 2.1 - - 0.22 U 0.19 U
- - 0.23 U - - 0.2 U 0.18 U 0.22 U 2 U - - 2.4 U 0.23 U 0.21 U 0.19 0.46 U - - 0.22 U 0.19 U
- - 0.23 U - - 0.2 U 0.18 U 0.22 U 2 U - - 2.4 U 0.23 U 0.21 U 0.19 0.46 U - - 0.22 U 0.19 U
- - 3.9 - - 3.8 0.76 0.13 U 1.2 U - - 40 8 0.13 U 3.7 35 E 34 0.24 0.17
- - 1.2 - - 1.7 0.18 U 0.22 U 2 U - - 7.5 1.7 0.21 U 0.9 4.3 - - 0.22 U 0.19 U
- - 0.7 - - 0.73 0.31 0.17 U 1.6 U - - 6.4 2.1 0.17 U 0.72 7.8 - - 0.18 U 0.15 U
- - 0.55 - - 0.2 U 0.18 U 0.22 U 2 U - - 2.4 U 3.2 0.21 U 0.34 1.8 - - 0.22 U 0.19 U
- - 4.8 - - 5.9 0.57 0.13 U 1.2 U - - 47 8.1 0.13 U 4.3 33 E 34 0.23 0.11 U
- - 3.4 - - 3.1 0.64 0.13 U 1.2 U - - 31 6.3 0.13 U 3 31 E 31 0.2 0.16
- - 2.76 U - - 24.3 U 2.16 U 2.6 U 7.3 4.84 13.5 4.84 2.53 U 3.26 15.8 - - 2.6 U 2.19 U
- - 6.54 - - 8.55 8.75 7.96 8.51 12.5 8.55 8.46 9.7 10.4 64.4 - - 7.47 5.13
- - 85.5 - - 270 27.9 76.4 502 226 531 523 78.5 89.6 548 - - 96.2 19.2
- - 0.282 - - 2.43 U 0.216 U 0.74 0.232 U 0.257 U 0.354 0.286 0.698 0.222 U 0.651 - - 0.734 0.298
- - 1.45 - - 8.99 0.432 U 0.724 8.06 0.514 U 0.59 U 0.562 U 0.506 U 0.444 U 1.12 U - - 0.52 U 0.438 U
- - 18.7 - - 25.4 12.6 52.2 19.8 39 35.8 36.2 38.3 27.6 45.9 - - 39.1 15.4
- - 199 - - 200 32.9 9.23 3950 888 915 596 8.8 97.3 1620 - - 24.7 30.6
- - 0.384 - - 0.152 0.07 U 0.087 U 0.122 0.098 1.55 16.7 0.083 U 0.072 U 1.07 - - 0.085 U 0.075
- - 15.7 - - 22.2 9.97 32.7 32.3 38.7 14.2 19.8 26 30.4 30.6 - - 25.5 8.74
- - 2.76 U - - 24.3 U 2.16 U 2.6 U 4.72 2.69 2.95 U 2.81 U 2.53 U 2.22 U 5.62 U - - 2.6 U 2.19 U
- - 0.552 U - - 4.86 U 0.432 U 0.521 U 2.35 0.514 U 0.696 0.562 U 0.506 U 0.444 U 11.3 - - 0.52 U 0.438 U
- - 33.7 - - 16.9 11.4 48.9 17.4 9.66 17.8 17.2 45 15.6 23.8 - - 45.3 12.1
- - 571 - - 636 43.4 59.7 18500 815 749 545 59.1 181 1590 - - 66.1 37.1
- - 4.99 - - 0.5 U - - - - 8.48 0.5 U 14.5 1.03 - - - - 17.1 - - - - - -
3.3 U - - 2.1 U - - 0.067 U 0.057 U 0.051 U 6.9 U 8.5 U 0.065 U 0.062 U 0.049 U 0.54 - - 0.15 0.053 U
0.11 - - 0.14 - - 0.0019 U 0.0016 U 0.0014 U 0.29 0.24 U 0.0018 U 0.0017 U 0.0014 U 0.0053 U - - 0.0016 U 0.0015 U
0.14 U - - 0.086 U - - 0.0028 U 0.0024 U 0.0021 U 0.29 U 0.36 U 0.0049 0.0026 U 0.002 U 0.008 U - - 0.0024 U 0.0022 U
0.091 U - - 0.058 U - - 0.0019 U 0.0016 U 0.0014 U 0.19 U 0.24 U 0.0018 U 0.0017 U 0.0014 U 0.017 - - 0.0016 U 0.0015 U
0.91 U - - 0.58 U - - 0.019 U 0.016 U 0.014 U 1.9 U 2.4 U 0.018 U 0.017 U 0.014 U 0.053 U - - 0.016 U 0.015 U
0.18 U - - 0.12 U - - 0.0037 U 0.0032 U 0.0028 U 0.38 U 0.47 U 0.0036 U 0.0034 U 0.0027 U 0.011 U - - 0.034 0.0029 U
0.26 - - 0.058 U - - 0.0019 U 0.0016 U 0.0014 U 0.19 U 0.24 U 0.0018 U 0.0017 U 0.0014 U 0.1 - - 0.0016 U 0.0015 U
0.091 U - - 0.058 U - - 0.0019 U 0.0016 U 0.0014 U 0.19 U 0.24 U 0.0018 U 0.0017 U 0.0014 U 0.018 - - 0.0016 U 0.0015 U
0.59 - - 0.23 U - - 0.0075 U 0.0063 U 0.0057 U 15 0.95 U 0.027 0.0068 U 0.0055 U 0.043 - - 0.0065 U 0.0059 U
0.091 U - - 0.79 - - 0.0019 U 0.0016 U 0.0014 U 0.19 U 0.24 U 0.009 0.0017 U 0.0014 U 0.0053 U - - 0.0016 U 0.0015 U
0.15 - - 0.058 U - - 0.0019 U 0.0016 U 0.0014 U 0.19 U 0.24 U 0.0018 U 0.0017 U 0.0014 U 0.086 - - 0.0016 U 0.0015 U
0.091 U - - 0.058 U - - 0.0019 U 0.0016 U 0.0014 U 0.19 U 0.24 U 0.0018 U 0.0025 0.0014 U 0.0053 U - - 0.0016 U 0.0015 U
- - - - - - - - - - - - - - - - - - - - - - - - - - - - - - - -
Results Results Results Results Results Results Results Results Results Results Results Results Results Results Results Results
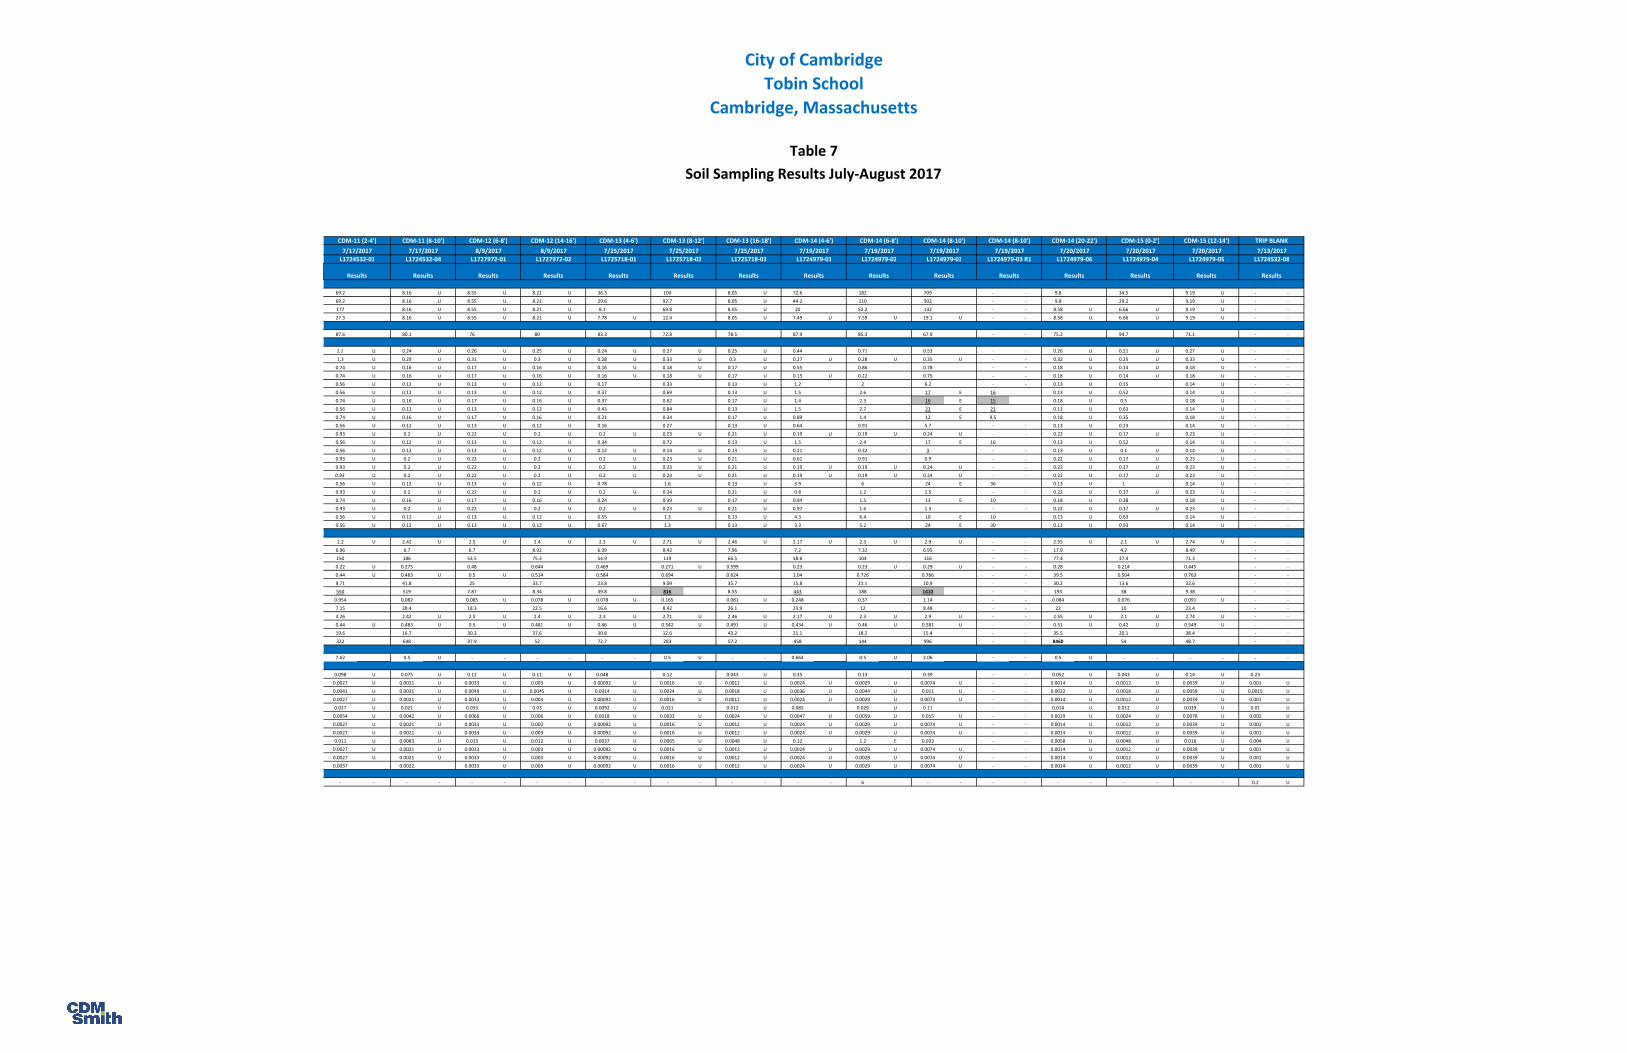
City of Cambridge
Tobin School
Cambridge, Massachusetts
Table 7
Soil Sampling Results July-August 2017
CDM-11 (2-4') CDM-11 (8-10') CDM-12 (6-8') CDM-12 (14-16') CDM-13 (4-6') CDM-13 (8-12') CDM-13 (16-18') CDM-14 (4-6') CDM-14 (6-8') CDM-14 (8-10') CDM-14 (8-10') CDM-14 (20-22') CDM-15 (0-2') CDM-15 (12-14') TRIP BLANK
7/17/2017 7/17/2017 8/9/2017 8/9/2017 7/25/2017 7/25/2017 7/25/2017 7/19/2017 7/19/2017 7/19/2017 7/19/2017 7/20/2017 7/20/2017 7/20/2017 7/13/2017
L1724532-03 L1724532-04 L1727972-01 L1727972-02 L1725718-01 L1725718-02 L1725718-03 L1724979-01 L1724979-02 L1724979-03 L1724979-03 R1 L1724979-06 L1724979-04 L1724979-05 L1724532-08
69.2 8.16 U 8.55 U 8.21 U 36.3 100 8.05 U 72.6 182 709 - - 9.8 34.5 9.19 U - -
69.2 8.16 U 8.55 U 8.21 U 29.6 92.7 8.05 U 44.2 110 502 - - 9.8 29.2 9.19 U - -
177 8.16 U 8.55 U 8.21 U 8.1 69.8 8.05 U 20 52.2 132 - - 8.58 U 6.66 U 9.19 U - -
27.3 8.16 U 8.55 U 8.21 U 7.78 U 12.4 8.05 U 7.49 U 7.59 U 19.1 U - - 8.58 U 6.66 U 9.19 U - -
87.6 80.1 76 80 83.3 72.8 78.5 87.9 85.3 67.9 - - 75.2 94.7 71.1 - -
1.1 U 0.24 U 0.26 U 0.25 U 0.24 U 0.27 U 0.25 U 0.44 0.71 0.53 - - 0.26 U 0.21 U 0.27 U - -
1.3 U 0.29 U 0.31 U 0.3 U 0.28 U 0.33 U 0.3 U 0.27 U 0.28 U 0.35 U - - 0.32 U 0.25 U 0.33 U - -
0.74 U 0.16 U 0.17 U 0.16 U 0.16 U 0.18 U 0.17 U 0.55 0.86 0.78 - - 0.18 U 0.14 U 0.18 U - -
0.74 U 0.16 U 0.17 U 0.16 U 0.16 U 0.18 U 0.17 U 0.15 U 0.22 0.75 - - 0.18 U 0.14 U 0.18 U - -
0.56 U 0.12 U 0.13 U 0.12 U 0.17 0.33 0.13 U 1.2 2 6.2 - - 0.13 U 0.15 0.14 U - -
0.56 U 0.12 U 0.13 U 0.12 U 0.37 0.69 0.13 U 1.5 2.6 17 E 16 0.13 U 0.52 0.14 U - -
0.74 U 0.16 U 0.17 U 0.16 U 0.37 0.62 0.17 U 1.4 2.3 16 E 15 0.18 U 0.5 0.18 U - -
0.56 U 0.12 U 0.13 U 0.12 U 0.43 0.84 0.13 U 1.5 2.7 23 E 21 0.13 U 0.63 0.14 U - -
0.74 U 0.16 U 0.17 U 0.16 U 0.21 0.34 0.17 U 0.89 1.4 12 E 9.5 0.18 U 0.35 0.18 U - -
0.56 U 0.12 U 0.13 U 0.12 U 0.16 0.27 0.13 U 0.64 0.91 5.7 - - 0.13 U 0.23 0.14 U - -
0.93 U 0.2 U 0.22 U 0.2 U 0.2 U 0.23 U 0.21 U 0.19 U 0.19 U 0.24 U - - 0.22 U 0.17 U 0.23 U - -
0.56 U 0.12 U 0.13 U 0.12 U 0.34 0.72 0.13 U 1.5 2.4 17 E 16 0.13 U 0.52 0.14 U - -
0.56 U 0.12 U 0.13 U 0.12 U 0.12 U 0.14 U 0.13 U 0.21 0.32 3 - - 0.13 U 0.1 U 0.14 U - -
0.93 U 0.2 U 0.22 U 0.2 U 0.2 U 0.23 U 0.21 U 0.61 0.91 0.9 - - 0.22 U 0.17 U 0.23 U - -
0.93 U 0.2 U 0.22 U 0.2 U 0.2 U 0.23 U 0.21 U 0.19 U 0.19 U 0.24 U - - 0.22 U 0.17 U 0.23 U - -
0.93 U 0.2 U 0.22 U 0.2 U 0.2 U 0.23 U 0.21 U 0.19 U 0.19 U 0.24 U - - 0.22 U 0.17 U 0.23 U - -
0.56 U 0.12 U 0.13 U 0.12 U 0.78 1.6 0.13 U 3.9 6 24 E 36 0.13 U 1 0.14 U - -
0.93 U 0.2 U 0.22 U 0.2 U 0.2 U 0.24 0.21 U 0.8 1.2 1.5 - - 0.22 U 0.17 U 0.23 U - -
0.74 U 0.16 U 0.17 U 0.16 U 0.24 0.39 0.17 U 0.94 1.5 13 E 10 0.18 U 0.38 0.18 U - -
0.93 U 0.2 U 0.22 U 0.2 U 0.2 U 0.23 U 0.21 U 0.97 1.6 1.3 - - 0.22 U 0.17 U 0.23 U - -
0.56 U 0.12 U 0.13 U 0.12 U 0.55 1.3 0.13 U 4.3 6.4 10 E 10 0.13 U 0.63 0.14 U - -
0.56 U 0.12 U 0.13 U 0.12 U 0.67 1.3 0.13 U 3.3 5.2 24 E 30 0.13 U 0.93 0.14 U - -
2.2 U 2.42 U 2.5 U 2.4 U 2.3 U 2.71 U 2.46 U 2.17 U 2.3 U 2.9 U - - 2.55 U 2.1 U 2.74 U - -
6.96 6.7 6.7 8.92 6.39 8.42 7.96 7.2 7.32 6.95 - - 17.9 4.2 8.49 - -
150 186 53.5 75.3 54.9 119 66.5 58.6 104 116 - - 77.4 37.4 71.3 - -
0.22 U 0.275 0.48 0.644 0.469 0.271 U 0.599 0.23 0.23 U 0.29 U - - 0.28 0.214 0.445 - -
0.44 U 0.483 U 0.5 U 0.514 0.584 0.694 0.624 1.04 0.726 0.766 - - 39.5 0.504 0.763 - -
9.71 41.8 25 33.7 23.8 9.09 35.7 15.8 21.1 10.9 - - 30.2 13.6 32.6 - -
550 519 7.87 8.34 39.8 816 8.55 443 188 1410 - - 193 38 9.38 - -
0.954 0.082 0.085 U 0.078 U 0.078 U 0.165 0.081 U 0.248 0.37 1.14 - - 0.084 0.076 0.091 U - -
7.15 28.4 18.3 22.5 16.6 8.42 26.1 23.9 12 8.48 - - 22 10 23.4 - -
4.26 2.42 U 2.5 U 2.4 U 2.3 U 2.71 U 2.46 U 2.17 U 2.3 U 2.9 U - - 2.55 U 2.1 U 2.74 U - -
0.44 U 0.483 U 0.5 U 0.481 U 0.46 U 0.542 U 0.491 U 0.434 U 0.46 U 0.581 U - - 0.51 U 0.42 U 0.549 U - -
19.6 16.7 30.3 37.6 30.8 12.6 43.2 21.1 18.2 15.4 - - 35.5 20.1 38.4 - -
322 648 37.9 52 72.7 283 57.2 458 144 996 - - 8460 54 48.7 - -
7.62 0.5 U - - - - - - 0.5 U - - 0.664 0.5 U 2.06 - - 0.5 U - - - - - -
0.098 U 0.075 U 0.12 U 0.11 U 0.048 0.12 0.043 U 0.35 0.13 0.39 - - 0.052 U 0.043 U 0.14 U 0.23
0.0027 U 0.0021 U 0.0033 U 0.003 U 0.00092 U 0.0016 U 0.0012 U 0.0024 U 0.0029 U 0.0074 U - - 0.0014 U 0.0012 U 0.0039 U 0.001 U
0.0041 U 0.0031 U 0.0049 U 0.0045 U 0.0014 U 0.0024 U 0.0018 U 0.0036 U 0.0044 U 0.011 U - - 0.0022 U 0.0018 U 0.0059 U 0.0015 U
0.0027 U 0.0021 U 0.0033 U 0.003 U 0.00092 U 0.0016 U 0.0012 U 0.0024 U 0.0029 U 0.0074 U - - 0.0014 U 0.0012 U 0.0039 U 0.001 U
0.027 U 0.021 U 0.033 U 0.03 U 0.0092 U 0.021 0.012 U 0.085 0.029 U 0.11 - - 0.014 U 0.012 U 0.039 U 0.01 U
0.0054 U 0.0042 U 0.0066 U 0.006 U 0.0018 U 0.0033 U 0.0024 U 0.0047 U 0.0059 U 0.015 U - - 0.0029 U 0.0024 U 0.0078 U 0.002 U
0.0027 U 0.0021 U 0.0033 U 0.003 U 0.00092 U 0.0016 U 0.0012 U 0.0024 U 0.0029 U 0.0074 U - - 0.0014 U 0.0012 U 0.0039 U 0.001 U
0.0027 U 0.0021 U 0.0033 U 0.003 U 0.00092 U 0.0016 U 0.0012 U 0.0024 U 0.0029 U 0.0074 U - - 0.0014 U 0.0012 U 0.0039 U 0.001 U
0.011 U 0.0083 U 0.013 U 0.012 U 0.0037 U 0.0065 U 0.0048 U 0.12 1.2 E 0.033 - - 0.0058 U 0.0048 U 0.016 U 0.004 U
0.0027 U 0.0021 U 0.0033 U 0.003 U 0.00092 U 0.0016 U 0.0012 U 0.0024 U 0.0029 U 0.0074 U - - 0.0014 U 0.0012 U 0.0039 U 0.001 U
0.0027 U 0.0021 U 0.0033 U 0.003 U 0.00092 U 0.0016 U 0.0012 U 0.0024 U 0.0029 U 0.0074 U - - 0.0014 U 0.0012 U 0.0039 U 0.001 U
0.0037 0.0022 0.0033 U 0.003 U 0.00092 U 0.0016 U 0.0012 U 0.0024 U 0.0029 U 0.0074 U - - 0.0014 U 0.0012 U 0.0039 U 0.001 U
- - - - - - - - - - - - - - - - 6 - - - - - - - - - - 0.2 U
Results Results Results Results Results Results Results Results ResultsResults Results Results Results Results Results

MW-3S MW-3D MW-4S MW-4D DUP-1 (MW-4D) MW-7S MW-7D MW-9S MW-9D MW-14S MW-14D
16-AUG-17 17-AUG-17 17-AUG-17 17-AUG-17 17-AUG-17 16-AUG-17 16-AUG-17 16-AUG-17 16-AUG-17 16-AUG-17 16-AUG-17
L1728873-01 L1728873-04 L1728873-06 L1728873-05 L1728873-07 L1728684-01 L1728684-02 L1728873-02 L1728873-01 L1728684-03 L1728684-04
EPH
C11-C22 Aromatics ug/l NA NA NA < 100 < 100 173 140 109 127 < 100 < 100 < 100 NA < 100
C11-C22 Aromatics, Adjusted ug/l 200 50000 5000 < 100 < 100 149 140 109 105 < 100 < 100 < 100 NA < 100
C19-C36 Aliphatics ug/l 14000 NA 50000 < 100 < 100 < 100 < 100 < 100 < 100 < 100 < 100 < 100 NA < 100
C9-C18 Aliphatics ug/l 700 5000 50000 < 100 < 100 < 100 < 100 < 100 < 100 < 100 < 100 < 100 NA < 100
GC Volatiles by MAVPH
Acetone ug/l 6300 50000 50000 < 5 < 5 < 5 < 5 < 5 < 5 < 5 < 5 < 10 21 < 5
Methyl tert-butyl ether ug/l 70 50000 50000 < 2 < 2 < 2 < 2 < 2 < 2 2.7 < 2 400 < 2 < 2
Naphthalene ug/l 140 700 20000 < 2 < 2 4.5 9.4 9.9 26 < 2 < 2 < 4 < 2 < 2
Tertiary-Amyl Methyl Ether ug/l NA NA NA < 2 < 2 < 2 < 2 < 2 < 2 < 2 < 2 25 < 2 < 2
Tetrachloroethene ug/l 5 50 30000 < 1 < 1 < 1 < 1 < 1 < 1 < 1 < 1 4.4 < 1 < 1
MCP Semivolatile Organics
3-Methylphenol/4-Methylphenol ug/l < 5 < 5 < 5 < 5 < 5 < 5 < 5 < 5 < 5 19 < 5
Dibenzofuran ug/l < 2 < 2 < 2 < 2 < 2 2.6 < 2 < 2 < 2 < 2 < 2
2-Methylnaphthalene ug/l 10 2000 20000 0.56 < 0.1 1.2 2.0 2.1 2.8 0.14 0.12 < 0.1 0.29 0.14
Acenaphthene ug/l 20 NA 10000 3.8 0.42 11 4.5 4.8 5.7 1.6 1.0 0.57 2.0 3.0
Acenaphthylene ug/l 30 10000 40 0.10 < 0.1 0.20 0.34 0.34 < 0.1 < 0.1 < 0.1 < 0.1 < 0.1 0.13
Anthracene ug/l 60 NA 30 0.78 < 0.1 1.5 0.94 1.1 2 0.23 0.21 < 0.1 0.78 0.55
Benzo[a]anthracene ug/l 1 NA 1000 < 0.1 < 0.1 < 0.1 0.12 0.18 0.11 < 0.1 < 0.1 < 0.1 0.32 0.33
Benzo[a]pyrene ug/l 0.2 NA 500 < 0.1 < 0.1 < 0.1 < 0.1 0.12 < 0.1 < 0.1 < 0.1 < 0.1 0.25 0.28
Benzo[b]fluoranthene ug/l 1 NA 400 < 0.1 < 0.1 < 0.1 0.10 0.16 < 0.1 < 0.1 < 0.1 < 0.1 0.32 0.40
Benzo[g,h,i]perylene ug/l 50 NA 20 < 0.1 < 0.1 < 0.1 < 0.1 < 0.1 < 0.1 < 0.1 < 0.1 < 0.1 0.16 0.27
Benzo[k]fluoranthene ug/l 1 NA 100 < 0.1 < 0.1 < 0.1 < 0.1 < 0.1 < 0.1 < 0.1 < 0.1 < 0.1 0.13 0.16
Chrysene ug/l 2 NA 70 < 0.1 < 0.1 < 0.1 0.14 0.21 0.13 < 0.1 < 0.1 < 0.1 0.36 0.37
Dibenz(a,h)anthracene ug/l 0.5 NA 40 < 0.1 < 0.1 < 0.1 < 0.1 < 0.1 < 0.1 < 0.1 < 0.1 < 0.1 < 0.1 < 0.1
Fluoranthene ug/l 90 NA 200 1.0 < 0.1 0.84 0.93 1.1 1.8 0.27 0.32 0.15 1.3 0.91
Fluorene ug/l 30 NA 40 3.2 0.15 6.6 3.3 3.4 4.1 0.80 0.64 0.17 2.6 1.4
Indeno[1,2,3-cd]pyrene ug/l 0.5 NA 100 < 0.1 < 0.1 < 0.1 < 0.1 < 0.1 < 0.1 < 0.1 < 0.1 < 0.1 0.18 0.26
Naphthalene ug/l 140 700 20000 1.3 0.14 2.8 5.8 6.1 10 0.39 0.69 0.13 0.96 0.26
Phenanthrene ug/l 40 NA 10000 3.4 0.34 9.3 5.4 6.0 9.9 1.1 0.42 0.50 4.2 1.9
Pyrene ug/l 60 NA 20 0.75 < 0.1 0.56 0.63 0.75 1.3 0.21 0.22 0.11 0.90 0.66
MCP 1,4 Dioxane by 8270D-SIM
1,4-Dioxane ug/l 0.3 6000 50000 < 0.142 < 0.142 < 0.147 < 0.142 < 0.144 < 0.147 < 0.144 < 0.147 0.198 < 0.144 < 0.144
Metals by 6010 (Total)
Arsenic ug/l 10 NA 900 < 5 8 9 6 6 < 5 < 5 6 28 11 < 5
Barium ug/l 2000 NA 50000 170 303 716 608 600 3660 2060 114 70 492 795
Lead ug/l 15 NA 10 < 10 67 < 10 31 29 < 10 14 26 11 65 < 10
Zinc ug/l 5000 NA 900 < 50 54 < 50 < 50 < 50 < 50 < 50 < 50 < 50 234 < 50
Notes:
All wells compared to GW-1 and GW-3
Wells MW-9S/9D and MW-14S/14D are also compared to GW-2
Shaded Values: Exceed GW-1 Standards
Underlined Values: Exceed GW-2 Standards
Bolded Value: Exceeds GW-3 Standards
< #: Not detected to the limit indicated
Italicized Value : Reporting limits greater than applicable MassDEP standards
ug/l - micrograms/liter
NA - Not Applicable
GW1 - Concentrations based on the use of groundwater as drinking water, either currently or in the foreseeable future.
GW2 - Concentrations based on the potential for volatile material to migrate into indoor air.
GW3 - Concentrations based on the potential environmental effects resulting from contaminated groundwater discharging to surface water.
City of CambridgeTobin School
Groundwater Sampling Results August 2017
Laboratory Order Number
GW-3GW-2
Sample Collection Date
Reporting
Units
Cambridge, Massachusetts
Parameter
Sample ID
GW-1
Table 8
MCP Semivolatile Organics by SIM
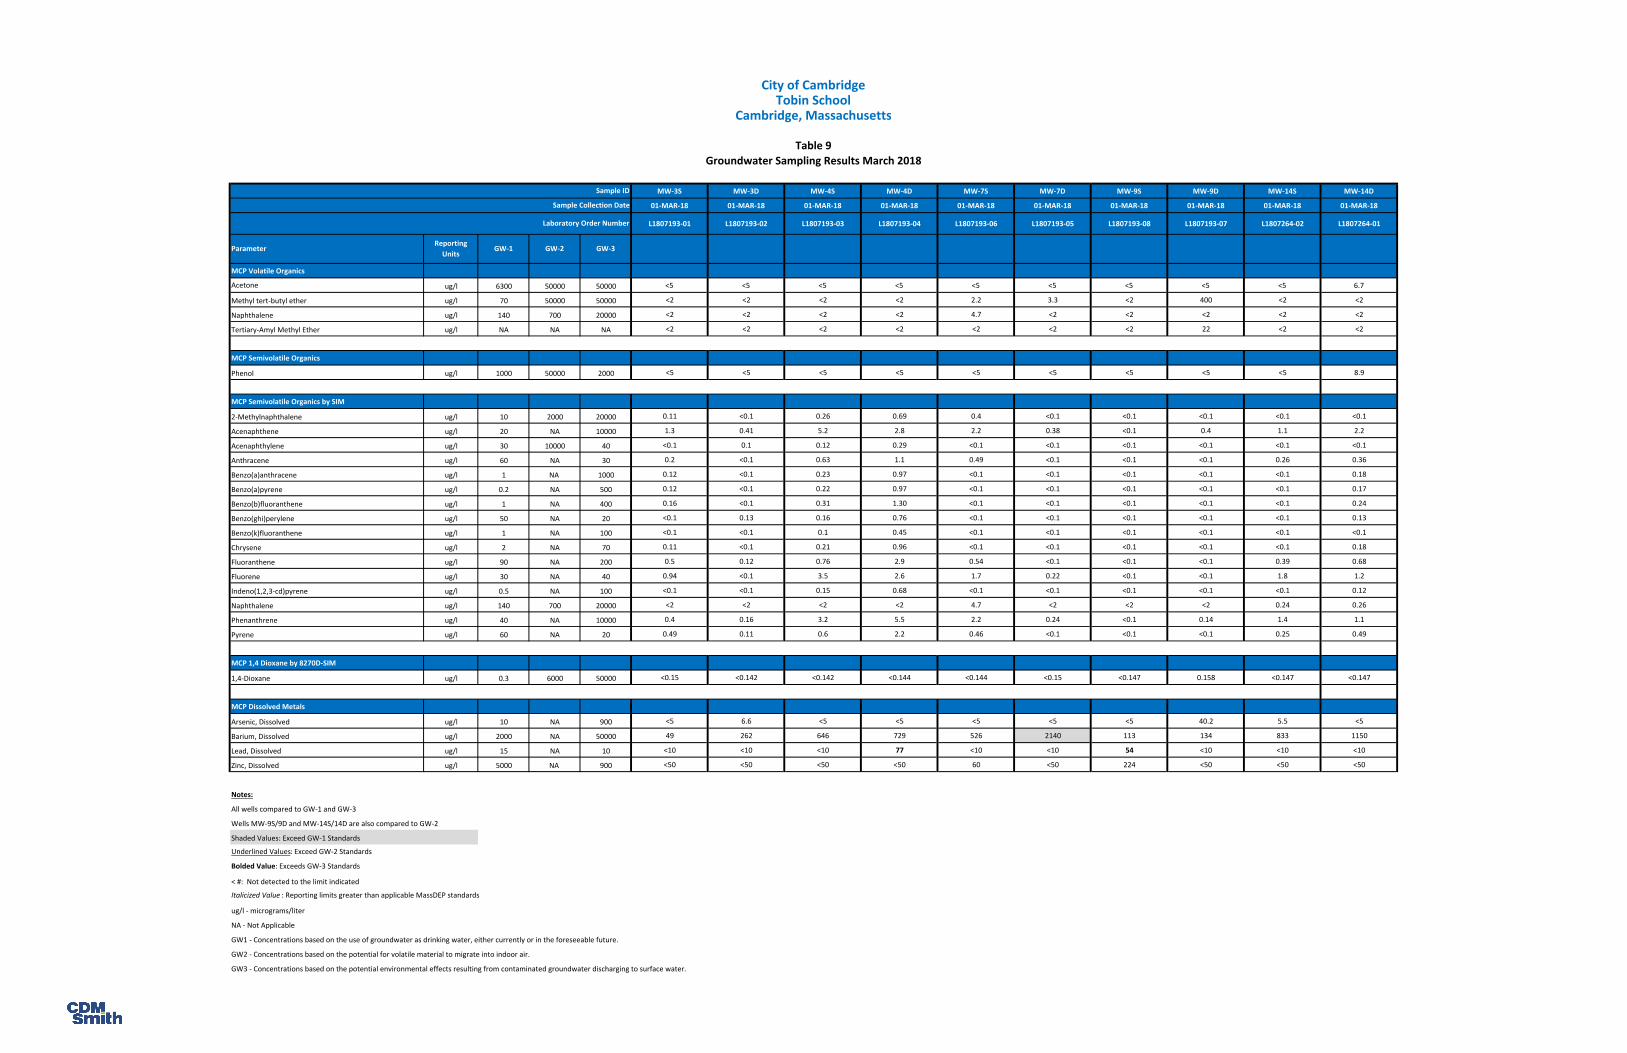
MW-3S MW-3D MW-4S MW-4D MW-7S MW-7D MW-9S MW-9D MW-14S MW-14D
01-MAR-18 01-MAR-18 01-MAR-18 01-MAR-18 01-MAR-18 01-MAR-18 01-MAR-18 01-MAR-18 01-MAR-18 01-MAR-18
L1807193-01 L1807193-02 L1807193-03 L1807193-04 L1807193-06 L1807193-05 L1807193-08 L1807193-07 L1807264-02 L1807264-01
MCP Volatile Organics
Acetone ug/l 6300 50000 50000 <5 <5 <5 <5 <5 <5 <5 <5 <5 6.7
Methyl tert-butyl ether ug/l 70 50000 50000 <2 <2 <2 <2 2.2 3.3 <2 400 <2 <2
Naphthalene ug/l 140 700 20000 <2 <2 <2 <2 4.7 <2 <2 <2 <2 <2
Tertiary-Amyl Methyl Ether ug/l NA NA NA <2 <2 <2 <2 <2 <2 <2 22 <2 <2
MCP Semivolatile Organics
Phenol ug/l 1000 50000 2000 <5 <5 <5 <5 <5 <5 <5 <5 <5 8.9
MCP Semivolatile Organics by SIM
2-Methylnaphthalene ug/l 10 2000 20000 0.11 <0.1 0.26 0.69 0.4 <0.1 <0.1 <0.1 <0.1 <0.1
Acenaphthene ug/l 20 NA 10000 1.3 0.41 5.2 2.8 2.2 0.38 <0.1 0.4 1.1 2.2
Acenaphthylene ug/l 30 10000 40 <0.1 0.1 0.12 0.29 <0.1 <0.1 <0.1 <0.1 <0.1 <0.1
Anthracene ug/l 60 NA 30 0.2 <0.1 0.63 1.1 0.49 <0.1 <0.1 <0.1 0.26 0.36
Benzo(a)anthracene ug/l 1 NA 1000 0.12 <0.1 0.23 0.97 <0.1 <0.1 <0.1 <0.1 <0.1 0.18
Benzo(a)pyrene ug/l 0.2 NA 500 0.12 <0.1 0.22 0.97 <0.1 <0.1 <0.1 <0.1 <0.1 0.17
Benzo(b)fluoranthene ug/l 1 NA 400 0.16 <0.1 0.31 1.30 <0.1 <0.1 <0.1 <0.1 <0.1 0.24
Benzo(ghi)perylene ug/l 50 NA 20 <0.1 0.13 0.16 0.76 <0.1 <0.1 <0.1 <0.1 <0.1 0.13
Benzo(k)fluoranthene ug/l 1 NA 100 <0.1 <0.1 0.1 0.45 <0.1 <0.1 <0.1 <0.1 <0.1 <0.1
Chrysene ug/l 2 NA 70 0.11 <0.1 0.21 0.96 <0.1 <0.1 <0.1 <0.1 <0.1 0.18
Fluoranthene ug/l 90 NA 200 0.5 0.12 0.76 2.9 0.54 <0.1 <0.1 <0.1 0.39 0.68
Fluorene ug/l 30 NA 40 0.94 <0.1 3.5 2.6 1.7 0.22 <0.1 <0.1 1.8 1.2
Indeno(1,2,3-cd)pyrene ug/l 0.5 NA 100 <0.1 <0.1 0.15 0.68 <0.1 <0.1 <0.1 <0.1 <0.1 0.12
Naphthalene ug/l 140 700 20000 <2 <2 <2 <2 4.7 <2 <2 <2 0.24 0.26
Phenanthrene ug/l 40 NA 10000 0.4 0.16 3.2 5.5 2.2 0.24 <0.1 0.14 1.4 1.1
Pyrene ug/l 60 NA 20 0.49 0.11 0.6 2.2 0.46 <0.1 <0.1 <0.1 0.25 0.49
MCP 1,4 Dioxane by 8270D-SIM
1,4-Dioxane ug/l 0.3 6000 50000 <0.15 <0.142 <0.142 <0.144 <0.144 <0.15 <0.147 0.158 <0.147 <0.147
MCP Dissolved Metals
Arsenic, Dissolved ug/l 10 NA 900 <5 6.6 <5 <5 <5 <5 <5 40.2 5.5 <5
Barium, Dissolved ug/l 2000 NA 50000 49 262 646 729 526 2140 113 134 833 1150
Lead, Dissolved ug/l 15 NA 10 <10 <10 <10 77 <10 <10 54 <10 <10 <10
Zinc, Dissolved ug/l 5000 NA 900 <50 <50 <50 <50 60 <50 224 <50 <50 <50
Notes:
All wells compared to GW-1 and GW-3
Wells MW-9S/9D and MW-14S/14D are also compared to GW-2
Shaded Values: Exceed GW-1 Standards
Underlined Values: Exceed GW-2 Standards
Bolded Value: Exceeds GW-3 Standards
< #: Not detected to the limit indicated
Italicized Value : Reporting limits greater than applicable MassDEP standards
ug/l - micrograms/liter
NA - Not Applicable
GW1 - Concentrations based on the use of groundwater as drinking water, either currently or in the foreseeable future.
GW2 - Concentrations based on the potential for volatile material to migrate into indoor air.
GW3 - Concentrations based on the potential environmental effects resulting from contaminated groundwater discharging to surface water.
City of Cambridge
Tobin School
Groundwater Sampling Results March 2018
Sample ID
Sample Collection Date
ParameterReporting
UnitsGW-1 GW-2 GW-3
Cambridge, Massachusetts
Table 9
Laboratory Order Number

Methane (% vol.) LEL (% vol.) Carbon Dioxide (% vol.) Oxygen (% vol.) PID Reading (ppmv) Hydrogen Sulfide (ppmv)
Sample
Location
Sample
Date Initial Final Initial Final Initial Final Initial Final Initial Final Initial Final Initial Final
SGP-1 8/16/2017 0.0 0.0 0.0 0.0 1.2 0.9 19.8 20.3 0.0 0.0 0.0 0.0 29.84 29.84
SGP-2 8/16/2017 0.0 0.0 0.0 0.0 3.5 3.3 17.6 18.0 0.0 0.0 0.0 0.0 29.78 29.78
SGP-3 8/16/2017 0.0 0.0 0.0 0.0 2.2 2.3 19.1 19.2 0.0 0.0 0.0 0.0 29.77 29.77
SGP-4 8/16/2017 0.0 0.0 0.0 0.0 2.5 2.6 18.9 19.0 0.0 0.0 0.0 0.0 29.77 29.77
SGP-5 8/16/2017 0.0 0.0 0.0 0.0 4.7 4.8 16.3 16.2 0.0 0.0 0.0 0.0 29.78 29.78
SGP-6 8/16/2017 0.0 0.0 0.0 0.0 2.9 3.2 18.6 18.4 0.0 0.0 0.0 0.0 29.76 29.76
SGP-7 8/16/2017 0.0 0.0 0.0 0.0 5.9 6.0 15.1 14.9 0.0 0.0 0.0 0.0 29.76 29.76
SGP-8 8/16/2017 0.0 0.0 0.0 0.0 3.8 3.6 17.4 17.0 0.0 0.0 0.0 0.0 29.76 29.76
SGP-9 8/17/2017 0.0 0.0 0.0 0.0 3.7 3.9 18.6 18.1 0.0 0.0 0.0 0.0 30.00 30.00
SGP-10 8/17/2017 0.0 0.0 0.0 0.0 1.3 1.7 19.6 19.2 0.0 0.0 0.0 0.0 30.00 30.00
SGP-11 8/17/2017 0.0 0.0 0.0 0.0 2.6 4.1 18.8 17.9 0.0 0.0 0.0 0.0 30.15 30.15
SGP-12 8/17/2017 0.0 0.0 0.0 0.0 3.0 2.7 18.6 18.8 0.0 0.0 0.0 0.0 30.15 30.15
SGP-13 8/17/2017 0.0 0.0 0.0 0.0 2.7 3.6 18.6 18.1 0.0 0.0 0.0 0.0 30.15 30.15
SGP-14 8/17/2017 0.0 0.0 0.0 0.0 2.6 2.8 18.1 18.5 0.0 0.0 0.0 0.0 30.15 30.15
SGP-15 8/17/2017 0.0 0.0 0.0 0.0 1.7 1.6 19.6 19.7 0.0 0.0 0.0 0.0 30.15 30.15
SGP-16 8/17/2017 0.0 0.0 0.0 0.0 2.0 2.0 19.4 19.4 0.0 0.0 0.0 0.0 30.13 30.13
SGP-17 8/17/2017 0.0 0.0 0.0 0.0 1.7 1.3 19.3 19.6 0.0 0.0 0.0 0.0 30.13 30.13
SGP-18 8/17/2017 0.0 0.0 0.0 0.0 0.5 0.8 19.2 19.5 0.0 0.0 0.0 0.0 30.13 30.13
SGP-19 8/17/2017 0.0 0.0 0.0 0.0 1.2 1.4 19.4 19.3 0.0 0.0 0.0 0.0 30.13 30.13
SGP-20 8/17/2017 0.0 0.0 0.0 0.0 0.7 0.9 19.8 19.7 0.0 0.0 0.0 0.0 30.13 30.13
SGP-21 8/17/2017 0.0 0.0 0.0 0.0 2.2 2.3 18.4 18.3 0.0 0.0 0.0 0.0 30.13 30.13
SGP-22 8/17/2017 0.0 0.0 0.0 0.0 0.6 0.5 19.5 19.9 0.0 0.0 0.0 0.0 30.13 30.13
SGP-23 8/17/2017 0.0 0.0 0.0 0.0 3.3 1.4 17.4 19.1 0.0 0.0 0.0 0.0 29.91 29.91
SGP-24 8/17/2017 2.9 2.8 58 56 0.8 0.7 19.1 19.1 0.0 0.0 0.0 0.0 29.91 29.91
SGP-25 8/17/2017 0.0 0.0 0.0 0.0 1.8 1.8 19.3 19.4 0.0 0.0 0.0 0.0 29.84 29.84
SGP-26 8/17/2017 0.0 0.0 0.0 0.0 1.2 0.5 19.2 19.8 117.7 58.8 0.0 0.0 29.84 29.84
SGP-27 8/17/2017 0.0 0.0 0.0 0.0 2.1 2.3 17.9 17.7 0.0 0.0 0.0 0.0 29.84 29.84
SGP-28 8/17/2017 63.8 50.2 1276 1004 5.4 4.9 0.9 4.0 0.2 0.2 0.0 0.0 29.78 29.78
MW-3S 8/16/2017 13.5 13.4 270 268 8.4 8.4 0.3 0.3 0.0 0.0 0.0 0.0 29.73 29.73
MW-3D 8/16/2017 1.9 0.8 38 16 1.8 0.7 17.4 19.6 0.0 0.0 0.0 0.0 29.73 29.73
MW-4S 8/16/2017 73.0 71.6 1460 1432 4.3 4.1 2.1 2.2 0.0 0.0 0.0 0.0 29.74 29.74
MW-4D 8/16/2017 0.6 0.3 12 6 0.0 0.0 20.3 20.4 0.0 0.0 0.0 0.0 29.76 29.76
MW-7S 8/16/2017 2.4 2.3 48 46 6.5 7.0 0.4 0.0 3.7 4.0 0.0 0.0 29.84 29.84
MW-7D 8/16/2017 0.0 0.0 0.0 0.0 1.5 0.2 16.7 20.0 0.0 0.0 0.0 0.0 29.84 29.84
MW-9S 8/16/2017 0.0 0.0 0.0 0.0 1.1 0.4 12.1 17.6 0.0 0.0 0.0 0.0 29.77 29.77
MW-9D 8/16/2017 0.0 0.0 0.0 0.0 0.4 0.3 19.3 20.5 0.2 0.0 0.3 0.0 29.77 29.77
MW-14S 8/16/2017 0.0 0.0 0.0 0.0 2.1 2.4 19.0 18.6 0.0 0.0 0.0 0.0 29.78 29.78
MW-14D 8/16/2017 0.4 0.3 8 6 0.0 0.0 19.8 19.9 0.0 0.0 0.0 0.0 29.78 29.78
Notes:
City of Cambridge
Tobin School
Cambridge, Massachusetts
Soil Gas Probe and Groundwater Well Landfill Gas Monitoring Results - August 16-17, 2017
Atmospheric Pressure (in Hg)
Landfill Gas Probes
Monitoring Wells
1. PID= Photoionization Detector, which measures concentrations of volatile organic compounds
2. LEL = Lower explosive limit
Table 10

PID Reading (ppmv) Hydrogen Sulfide (ppmv) Methane (% vol.) Carbon Dioxide (% vol.) Oxygen (% vol.) LEL (% vol.)
Sample
Location
Sample
Date Initial Final Initial Final Initial Final Initial Final Initial Final Initial Final Initial Final
Groundwater Monitoring Wells
MW-3S 8/16/2017 0.0 0.0 0.0 0.0 13.5 13.4 8.4 8.4 0.3 0.3 270 268 29.73 29.73
10/2/2017 4.1 3.0 0.0 0.0 5.8 6.7 7.8 8.3 2.9 1.7 116 134 30.46 30.46
MW-3D 8/16/2017 0.0 0.0 0.0 0.0 1.9 0.8 1.8 0.7 17.4 19.6 38 16 29.73 29.73
10/2/2017 2.9 2.8 0.0 0.0 10.7 6.5 0.8 0.6 17.6 18.8 214 130 30.46 30.46
MW-4S 8/16/2017 0.0 0.0 0.0 0.0 73.0 71.6 4.3 4.1 2.1 2.2 1460 1432 29.74 29.74
10/2/2017 0.4 0.3 0.0 0.0 72.9 78.0 6.0 6.0 1.8 0.5 1458 1560 30.46 30.46
MW-4D 8/16/2017 0.0 0.0 0.0 0.0 0.6 0.3 0.0 0.0 20.3 20.4 12 6 29.76 29.76
*10/2/2017 -- -- -- -- -- -- -- -- -- -- -- -- -- --
MW-7S 8/16/2017 3.7 4.0 0.0 0.0 2.4 2.3 6.5 7.0 0.4 0.0 48 46 29.84 29.84
10/2/2017 2.0 2.3 0.0 0.0 0.9 1.0 7.1 7.2 0.6 0.1 18 20 30.46 30.46
MW-7D 8/16/2017 0.0 0.0 0.0 0.0 0.0 0.0 1.5 0.2 16.7 20.0 0 0 29.84 29.84
10/2/2017 0.0 0.0 0.0 0.0 0.0 0.0 1.5 0.8 17.9 19.4 0 0 30.46 30.46
MW-9S 8/16/2017 0.0 0.0 0.0 0.0 0.0 0.0 1.1 0.4 12.1 17.6 0 0 29.77 29.77
10/2/2017 0.3 0.4 0.0 0.0 22.8 23.9 4.7 4.7 2.6 1.2 456 478 30.46 30.46
MW-9D 8/16/2017 0.2 0.0 0.3 0.0 0.0 0.0 0.4 0.3 19.3 20.5 0 0 29.77 29.77
10/2/2017 0.9 0.4 0.0 0.0 0.0 0.0 0.2 0.1 20.7 20.8 0 0 30.46 30.46
MW-14S 8/16/2017 0.0 0.0 0.0 0.0 0.0 0.0 2.1 2.4 19.0 18.6 0 0 29.78 29.78
10/2/2017 0.0 0.0 0.0 0.0 0.0 0.0 3.0 8.9 17.2 9.3 0 0 30.46 30.46
MW-14D 8/16/2017 0.0 0.0 0.0 0.0 0.4 0.3 0.0 0.0 19.8 19.9 8 6 29.78 29.78
10/2/2017 0.2 0.4 0.0 0.0 0.0 0.0 0.2 0.2 20.7 20.7 0 0 30.46 30.46
Notes:
* Not Sampled - Roadbox Under Shallow Water
City of Cambridge
Tobin School
Cambridge, Massachusetts
Groundwater Well Landfill Gas Monitoring Results - August and October 2017
Atmospheric Pressure (in Hg)
1. PID= Photoionization Detector, which measures concentrations of volatile organic compounds
2. LEL = Lower Explosive Limit
Table 11

Vinyl chloride 19 ug/m3 2.56 U 5.11 U
Bromomethane 42 ug/m3 3.88 U 7.77 U
Acetone 6400 ug/m3 11.9 U 23.8 U
1,1-Dichloroethene 56 ug/m3 3.96 U 7.93 U
Methylene chloride 770 ug/m3 8.69 U 17.4 U
trans-1,2-Dichloroethene 56 ug/m3 3.96 U 7.93 U
1,1-Dichloroethane 56 ug/m3 4.05 U 8.09 U
Methyl tert butyl ether 2700 ug/m3 3.61 U 7.21 U
2-Butanone 850 ug/m3 7.37 U 14.7 U
cis-1,2-Dichloroethene 56 ug/m3 3.96 U 7.93 U
Chloroform 130 ug/m3 29.5 9.77 U
1,2-Dichloroethane 6.3 ug/m3 4.05 U 8.09 U
1,1,1-Trichloroethane 210 ug/m3 5.46 U 10.9 U
Benzene 160 ug/m3 4.03 6.39 U
Carbon tetrachloride 38 ug/m3 6.29 U 12.6 U
1,2-Dichloropropane 8.6 ug/m3 4.62 U 9.24 U
Bromodichloromethane 9.2 ug/m3 6.7 U 13.4 U
1,4-Dioxane 33 ug/m3 3.6 U 7.21 U
Trichloroethene 28 ug/m3 5.37 U 10.7 U
cis-1,3-Dichloropropene 41 ug/m3 4.54 U 9.08 U
4-Methyl-2-pentanone 150 ug/m3 10.2 U 20.5 U
trans-1,3-Dichloropropene 41 ug/m3 4.54 U 9.08 U
1,1,2-Trichloroethane 10 ug/m3 5.46 U 10.9 U
Toluene 3800 ug/m3 20.6 17.3
Dibromochloromethane 6.8 ug/m3 8.52 U 17 U
1,2-Dibromoethane 0.54 ug/m3 7.69 U 15.4 U
Tetrachloroethene 98 ug/m3 18.7 13.6 U
Chlorobenzene 160 ug/m3 4.61 U 9.21 U
Ethylbenzene 520 ug/m3 4.34 U 8.69 U
p/m-Xylene ug/m3 13.6 17.4 U
Bromoform 150 ug/m3 10.3 U 20.7 U
Styrene 95 ug/m3 4.26 U 8.52 U
1,1,2,2-Tetrachloroethane 2.8 ug/m3 6.87 U 13.7 U
o-Xylene ug/m3 5.65 8.69 U
1,3-Dichlorobenzene 42 ug/m3 6.01 U 12 U
1,4-Dichlorobenzene 35 ug/m3 6.01 U 12 U
1,2-Dichlorobenzene 50 ug/m3 6.01 U 12 U
1,2,4-Trichlorobenzene 28 ug/m3 7.42 U 14.8 U
Naphthalene 42 ug/m3 5.24 U 10.5 U
Hexachlorobutadiene 7.4 ug/m3 10.7 U 21.3 U
Hydrogen Sulfide NA ug/m3 2.79 U 4.43
Carbonyl sulfide NA ug/m3 4.91 U 4.91 U
Methyl mercaptan NA ug/m3 3.94 U 6.38
Ethyl mercaptan NA ug/m3 1.27 U 1.27 U
Dimethyl sulfide NA ug/m3 1.27 U 5.24
Carbon disulfide NA ug/m3 4.73 5.79
Isopropyl Mercaptan NA ug/m3 1.56 U 1.56 U
tert-Butyl Mercaptan NA ug/m3 1.84 U 1.84 U
N-Propyl Mercaptan NA ug/m3 1.56 U 1.56 U
Ethyl Methyl Sulfide NA ug/m3 1.56 U 1.56 U
Thiophene NA ug/m3 1.72 U 1.72 U
Isobutyl Mercaptan NA ug/m3 1.84 U 1.84 U
Diethyl Sulfide NA ug/m3 1.84 U 1.84 U
n-Butyl Mercaptan NA ug/m3 7.38 U 7.38 U
Dimethyl Disulfide NA ug/m3 1.93 U 1.93 U
3-Methylthiophene NA ug/m3 2.01 U 2.01 U
Tetrahydrothiophene NA ug/m3 1.8 U 1.8 U
2-Ethylthiophene NA ug/m3 2.29 U 2.29 U
2,5-Dimethylthiophene NA ug/m3 2.29 U 2.29 U
Diethyl disulfide NA ug/m3 2.5 U 2.5 U
Notes:
*MA-VIG-RSSGV: Vapor Intrusion Guidance: Residential Sub-slab Soil Gas Screening Values (2016) Criteria
per MassDEP Vapor Intrusion Guidance, Policy #WSC-16-435, October 14, 2016.
All units are ug/m3
U = compound was not detected above stated laboratory method detection limit
Italized Values = < Reporting Limits are greater than applicable standards
NA - Not Applicable
City of Cambridge
Tobin School
Table 12
Soil Vapor Sampling Results (VOCs, Sulfides, Mercaptans) - October 2, 2017
Sample ID
Sample Collection Date
MW-4S SOIL VAPOR
10/2/2017
Cambridge, Massachusetts
Reporting
Units
MCP Volatile Organics in Air by SIM
MA-VIG-RSSGV
MW-9S SOIL VAPOR
10/2/2017
L1735464-14 L1735464-15
Results Results
Mercaptans & Sulfides in Air
Laboratory Order Number
Parameter
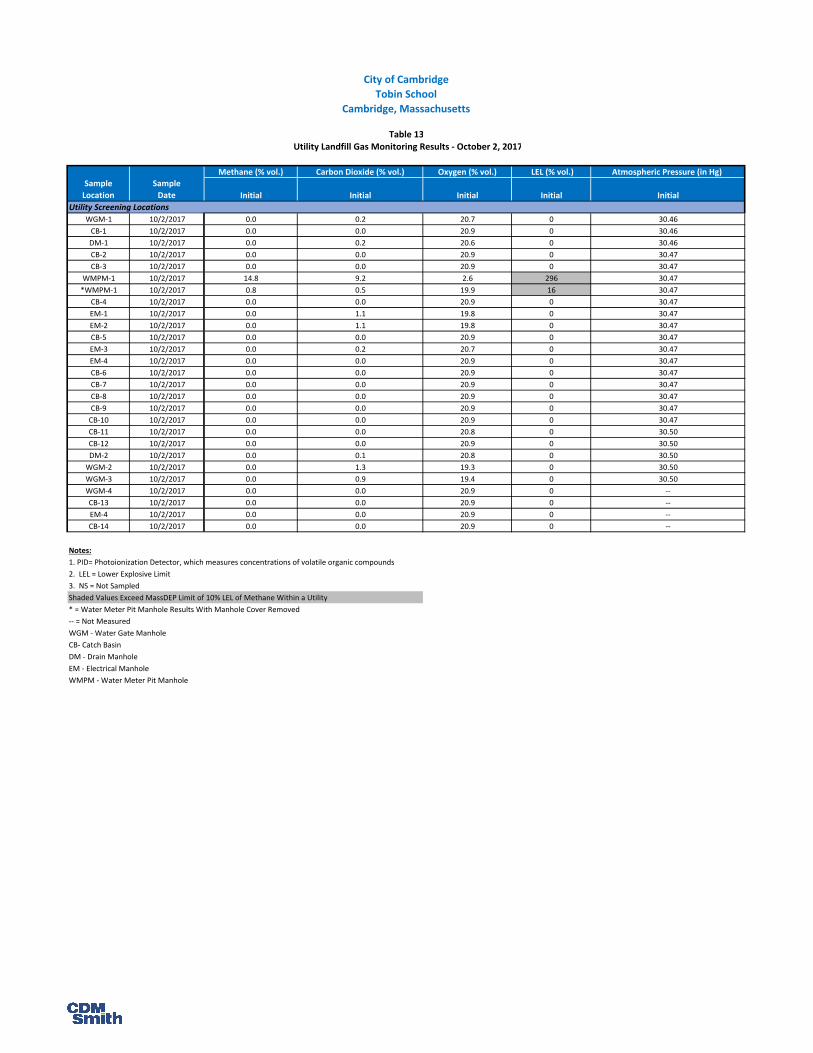
Methane (% vol.) Carbon Dioxide (% vol.) Oxygen (% vol.) LEL (% vol.) Atmospheric Pressure (in Hg)
Sample
Location
Sample
Date Initial Initial Initial Initial Initial
Utility Screening Locations
WGM-1 10/2/2017 0.0 0.2 20.7 0 30.46
CB-1 10/2/2017 0.0 0.0 20.9 0 30.46
DM-1 10/2/2017 0.0 0.2 20.6 0 30.46
CB-2 10/2/2017 0.0 0.0 20.9 0 30.47
CB-3 10/2/2017 0.0 0.0 20.9 0 30.47
WMPM-1 10/2/2017 14.8 9.2 2.6 296 30.47
*WMPM-1 10/2/2017 0.8 0.5 19.9 16 30.47
CB-4 10/2/2017 0.0 0.0 20.9 0 30.47
EM-1 10/2/2017 0.0 1.1 19.8 0 30.47
EM-2 10/2/2017 0.0 1.1 19.8 0 30.47
CB-5 10/2/2017 0.0 0.0 20.9 0 30.47
EM-3 10/2/2017 0.0 0.2 20.7 0 30.47
EM-4 10/2/2017 0.0 0.0 20.9 0 30.47
CB-6 10/2/2017 0.0 0.0 20.9 0 30.47
CB-7 10/2/2017 0.0 0.0 20.9 0 30.47
CB-8 10/2/2017 0.0 0.0 20.9 0 30.47
CB-9 10/2/2017 0.0 0.0 20.9 0 30.47
CB-10 10/2/2017 0.0 0.0 20.9 0 30.47
CB-11 10/2/2017 0.0 0.0 20.8 0 30.50
CB-12 10/2/2017 0.0 0.0 20.9 0 30.50
DM-2 10/2/2017 0.0 0.1 20.8 0 30.50
WGM-2 10/2/2017 0.0 1.3 19.3 0 30.50
WGM-3 10/2/2017 0.0 0.9 19.4 0 30.50
WGM-4 10/2/2017 0.0 0.0 20.9 0 --
CB-13 10/2/2017 0.0 0.0 20.9 0 --
EM-4 10/2/2017 0.0 0.0 20.9 0 --
CB-14 10/2/2017 0.0 0.0 20.9 0 --
Notes:
Shaded Values Exceed MassDEP Limit of 10% LEL of Methane Within a Utility
-- = Not Measured
WGM - Water Gate Manhole
CB- Catch Basin
DM - Drain Manhole
EM - Electrical Manhole
WMPM - Water Meter Pit Manhole
City of Cambridge
Cambridge, Massachusetts
3. NS = Not Sampled
* = Water Meter Pit Manhole Results With Manhole Cover Removed
Tobin School
Table 13
Utility Landfill Gas Monitoring Results - October 2, 2017
1. PID= Photoionization Detector, which measures concentrations of volatile organic compounds
2. LEL = Lower Explosive Limit