introduction to adequate yearly progress (ayp) michigan department of education office of...
TRANSCRIPT

Introduction to Adequate Yearly Progress (AYP)
Michigan Department of EducationOffice of Psychometrics, Accountability, Research, &
Evaluation
Summer 2012

What’s New for 2011-12?
• Proficiency targets aligned with MEAP and MME College and Career Ready cut scores– Still need to reach 100% proficiency in 2013-14 unless
Michigan is granted flexibility with ESEA
– 2011-12 targets reset to 20th percentile of 2010-11 MEAP/MME proficiency keyed to CCR cut scores
• District report cards treated like school report cards– District is treated as one large building
– Graduation is used in lieu of attendance
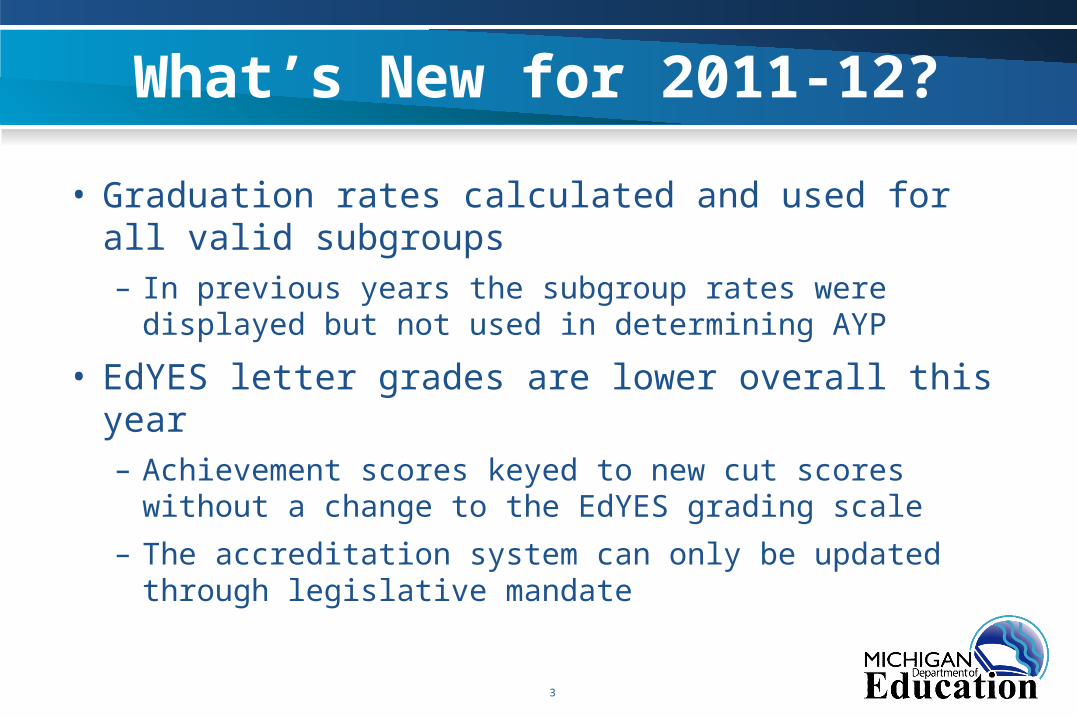
What’s New for 2011-12?
• Graduation rates calculated and used for all valid subgroups– In previous years the subgroup rates were displayed but not
used in determining AYP
• EdYES letter grades are lower overall this year– Achievement scores keyed to new cut scores without a
change to the EdYES grading scale
– The accreditation system can only be updated through legislative mandate
3

4
Adequate Yearly Progress
• Participation - 95% tested• MEAP, MME, MI-Access, or MEAP-Access
• Achievement - Proficiency• Meet state objective or “safe harbor” target for improvement
– Participation and Proficiency• Must meet in both Math and Reading• Must meet for whole school and subgroups
• Additional Academic Indicator• Graduation Rate – 80% - high schools• Attendance – 90% - elementary and middle schools

5
Student Groups for AYP
• Racial/Ethnic Groups– Black or African American
– American Indian or Alaska Native
– Asian, Hawaiian Native, or Pacific Islander
– Hispanic or Latino
– White
– Multi-racial
• Limited English Proficient
• Students With Disabilities (Special Education)
• Economically Disadvantaged (Free & Reduced Lunch)

6
2009-10 2010-11 2011-12 2012-13 2013-14
Elementary
Mathematics 65% 74% 20% 60% 100%
Reading 69% 77% 48% 74% 100%
Middle School
Mathematics 54% 66% 10% 55% 100%
Reading 66% 74% 34% 67% 100%
High School
Mathematics 55% 67% 8% 54% 100%
Reading 71% 79% 33% 67% 100%
Michigan AYP Targets

7
50 “cells” for AYP
Math Reading Math Reading
Black or African AmericanAmerican Indian or Alaska NativeAsian American Native Hawaiian or Other Pacific IslanderHispanic or LatinoCaucasian or WhiteMultiracial
Additional Indicator -
Attendance or Graduation
Economically Disadvantaged
Whole School
Achievement Participation
Racia
l/E
thnic
Gro
ups
Limited English ProficientStudents With Disabilities

8
AYP Participation
• Aggregate percent tested across all grades tested at the school
Total Number Tested (grades 3+4+5)
Total Number Enrolled (grades 3+4+5)

9
Full Academic Year
• Students enrolled in the school for the three most recent semi-annual official count days– MME uses four most recent count days
• Prior Enrollment lookup is used• Less than full academic year excluded for
achievement (proficiency), not for participation

10
Feeder Codes
• Because the Elementary and Middle School assessment window is in the fall, feeder codes are used to attribute scores to the school where the student was enrolled in 2010-11
• MSDS was used to look-up enrollment in 2010-11 for the student

11
Feeder Codes
• Feeder codes are used for PROFICIENCY–Participation is based on the school
where the student tested –All full academic year students should
have feeder codes• Feeder codes used for school AYP,
not for district AYP

12
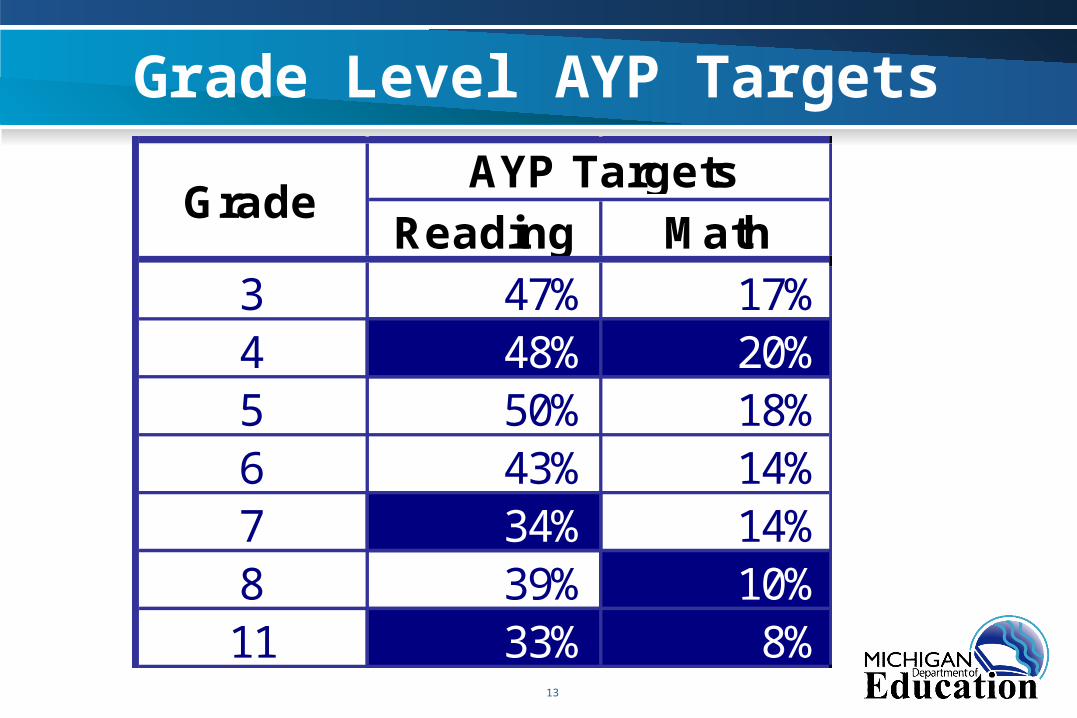
AYP Targets
• MDE has set separate statewide AYP targets for each grade
• A Proficiency Index is used to combine the grade level proficiency data and grade level targets to make an AYP decision across the grades
13
Grade Level AYP Targets
Reading Math3 47% 17%4 48% 20%5 50% 18%6 43% 14%7 34% 14%8 39% 10%11 33% 8%
GradeAYP Targets

14
Proficiency Index Reading
Grade TargetNumberTested
NumberProficient
PercentProficient
Difference From
Target
Grade Level
Weight
ProficiencyIndex
3 86% 30 28 93.3% 7.3 0.09 0.664 85% 40 35 87.5% 2.5 0.11 0.285 84% 100 89 89.0% 5.0 0.29 1.456 83% 10 3 30.0% -53.0 0.03 -1.597 82% 30 25 83.3% 1.3 0.09 0.128 82% 40 38 95.0% 13.0 0.11 1.4311 86% 100 79 79.0% -7.0 0.29 -2.03
Total 350 297 84.9% 1.01 0.32

15
Group Size
• ALL schools are given an AYP status
• Group Size applies to subgroups – NOT to all students

16
Group Size
• Minimum Group Size – Across Grades Tested is 30
• If total enrollment is more than 3,000– 1% Percent of Total Enrollment
– District AYP
– Maximum subgroup size is 200

17
AYP Reliability - Margin of Error
– Measurement Error• Would the student score the same if tested
again?
• Standard Error of Measurement
– Provisional Proficient• Two times the standard error >= grade level cut
score

18
Progress/Growth
• AYP proficient/provisional proficient classifies a student at a single point in time (status)
• Teachers often work students and make improvements in achievement
• Status models alone do not allow student improvement, which may be attributable to teacher intervention, to be tracked
• Growth Model gives credit in the AYP decision for growth from year-to-year by demonstrating that improvement in the student’s achievement is on a trajectory such that the student is expected to attain proficiency within the next three years.

19
MEAP Progress Value Table

20
“On Trajectory” Toward Proficiency

21
Growth Model Message
• Focus on “improvement”–Don’t work only with “bubble” students
–Getting from 4-L to 3-L is enough improvement to be “on trajectory”
• The growth model provides modest adjustments

22
Safe Harbor
• An additional way to meet the AYP achievement target
• School/district must reduce the percent of FAY students not proficient by 10% of the prior year’s percent not proficient– A school that had 50% of its students as not proficient in
2010-11 would need to have 45% of its students not proficient in 2011-12 for Safe Harbor
• Only used after multi-year proficiency indices are calculated

23
Student Attendance
• Student attendance is taken from the End-of-Year MSDS submission of the prior school year
• Attendance is computed by summing the scheduled and actual days of attendance and then dividing the sum of the actual by the sum of scheduled

24
NCLB Graduation Rate
• NCLB requires that AYP include a graduation rate based on the percentage of students that– Receive a REGULAR high school diploma
– In the STANDARD number of years
• AYP (including a graduation rate) is required for ALL schools

25
Graduation Rates for 2011-12 AYP
• The Graduation/Dropout Review and Comment Application from CEPI provides the graduation rates used for AYP for the class of 2011
• The application was open in late summer of 2011
• Appeals only through GAD

26
Five/Six Year Graduation Rates
• 2011 cohort (2007 9th graders) four-year grad rate >= 79.5%
• 2010 cohort five-year grad rate >= 79.5%
• 2009 cohort six-year grad rate >= 79.5%
• Graduation rate “Safe Harbor” using four year cohort rates

27
AYP and Graduation Rate
• The AYP target graduation rate will remain at 80%
• 3-step improvement calculation:– 1.) calculate gap: 80 – previous 4-year rate
– 2.) calculate improvement target: (gap x 0.25) + previous 4-year rate = improvement target
– 3.) compare improvement target with current 4-year rate: current 4-year rate >= improvement target
28
MI-Access
• All students taking current MI-Access assessments are counted as tested
• Cap of 1% on MI-Access proficient scores
• Cap is district-wide–Some schools might exceed the cap
29
MEAP-Access
• 2% cap applies to “Modified Achievement Standards”– reflect reduced breadth or depth of grade-
level content
– Starts in 2011-12
• States are NOT allowed to approve exceptions to the 2% cap