introduction to economics the us economy. economics in the news
Post on 22-Dec-2015
217 views
TRANSCRIPT

Introduction to Economics
The US Economy

Economics in the News
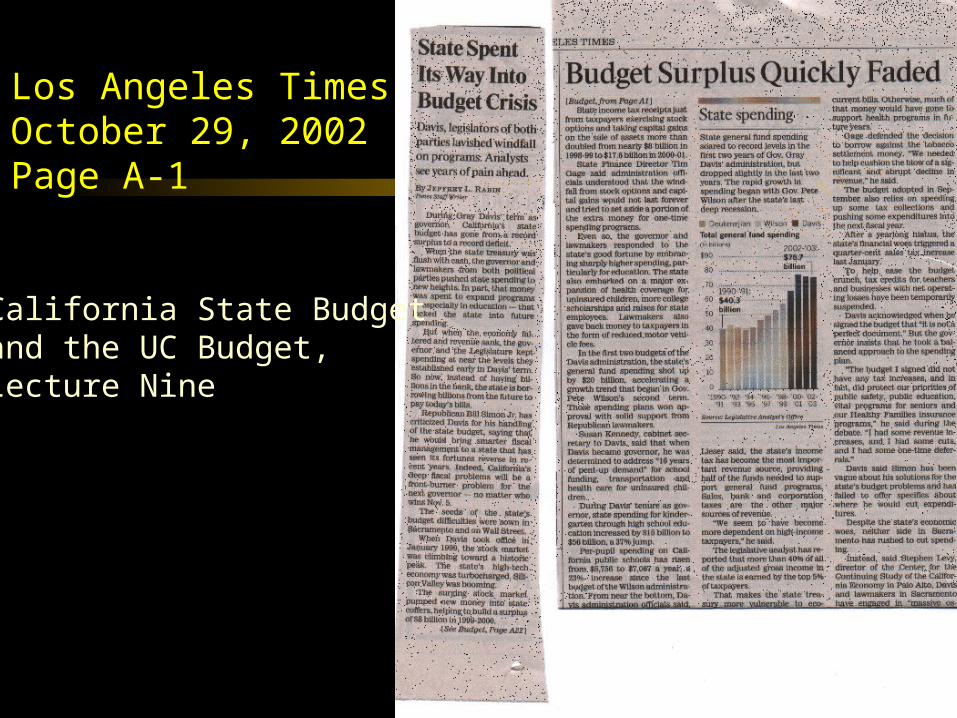
Los Angeles TimesOctober 29, 2002Page A-1
California State Budgetand the UC Budget,Lecture Nine

Wall Street JournalOctober 30, 2002Page

Chapter 25
• Keynesian Economics

Determining GDP• GDP is determined
where the C + I line intersects the 45˚ line.
• At that level of output, At that level of output, yy*, desired spending *, desired spending equals output.equals output.

Chapter 30
• The Dynamics of Inflation and Unemployment
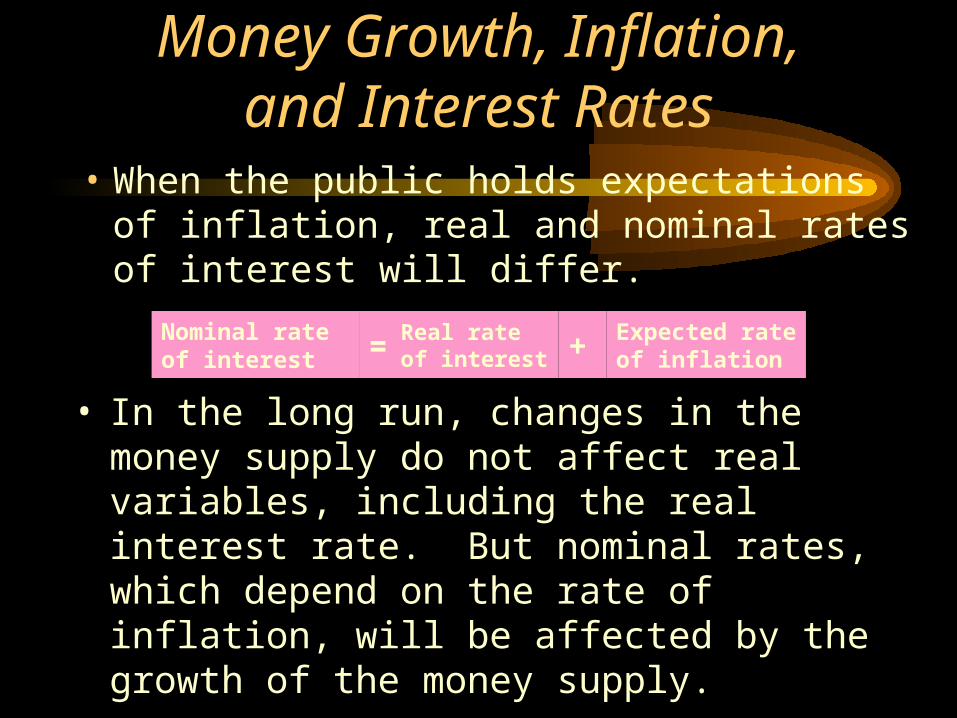
Money Growth, Inflation,and Interest Rates
• When the public holds expectations of inflation, real and nominal rates of interest will differ.
Expected rate of inflation+Real rate of
interest=Nominal rate of interest
• In the long run, changes in the money supply do In the long run, changes in the money supply do not affect real variables, including the real not affect real variables, including the real interest rate. But nominal rates, which depend interest rate. But nominal rates, which depend on the rate of inflation, will be affected by the on the rate of inflation, will be affected by the growth of the money supply.growth of the money supply.

The Quantity Equation• The equation of exchange, or quantity equation, links
the money supply and velocity to nominal GDP:
m o ney sup p ly ve lo c ity no m inal G D Px
• If velocity is predictable, we can use the quantity If velocity is predictable, we can use the quantity equation and the supply of money to predict nominal equation and the supply of money to predict nominal GDP, or the value of spending, on the right side of the GDP, or the value of spending, on the right side of the equation.equation.
M V P yx x
Chapter 27
• Money, the Banking System and the Fed
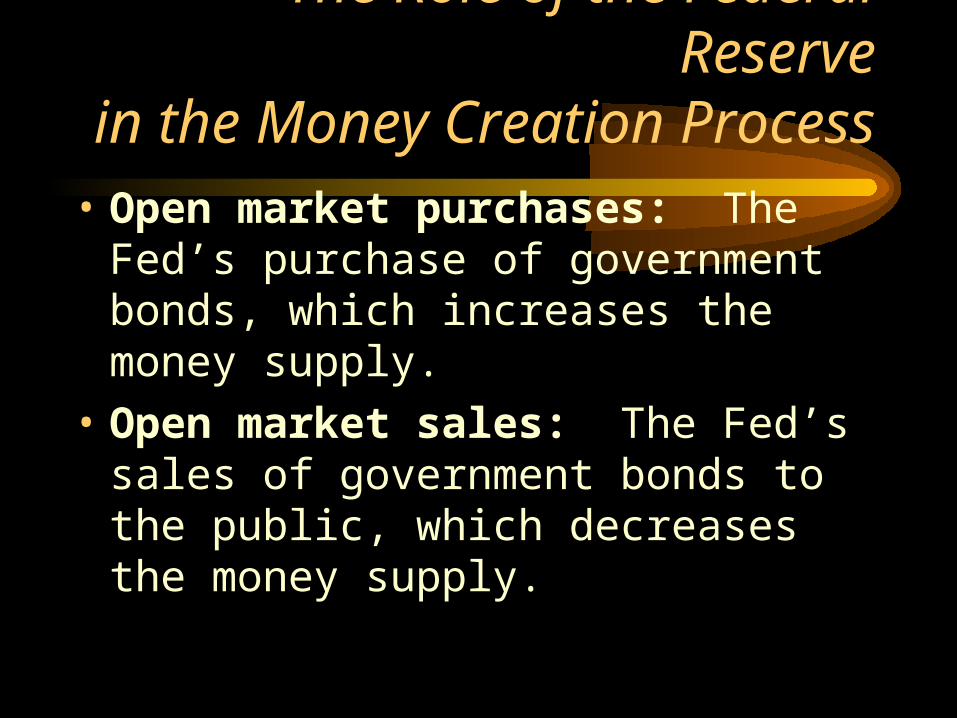
The Role of the Federal Reservein the Money Creation Process
• Open market purchases: The Fed’s purchase of government bonds, which increases the money supply.
• Open market sales: The Fed’s sales of government bonds to the public, which decreases the money supply.

Using Concepts to Illustrate the US Economy in Fall 2002
• Production Possibility Frontier Tool: Illustrate the War on Terrorism– Lecture Eight

Guns or Butter
Home Front: “Butter”
War Front: “Guns”
Production PossibilityFrontier: Real GDP
Govt.: Tax it awayor borrow to buy it away
Last Year
This year
Opportunity cost of war
in“butter”

Using Concepts to Illustrate the US Economy in Fall 2002
• Production Possibility Frontier Tool: Illustrate that the Government wants more guns and butter, and spends on both increasing nominal GDP faster then real GDP– Lecture Eight

Guns or Butter
Home Front: “Butter”
War Front: “Guns”
Production PossibilityFrontier: Real GDP
Govt.: Tax it awayor borrow to buy it away
Nominal GDPGovernment. Wish

Is Inflation on the Way?
• Measure GDP in current (nominal) $
• But how much of the change from year to year is a change in output and how much is a change in prices?
• GDP(nominal) = GDP Deflator x GDP(real)
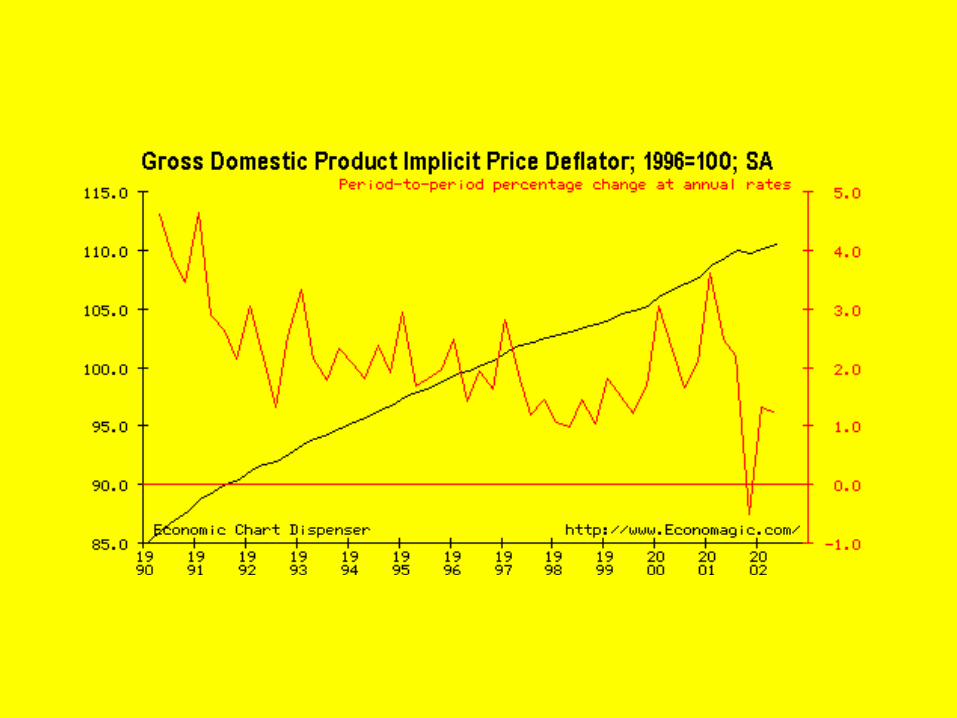

GDP Deflator: Percentage Change
Source: http://www.yardeni.com Lecture Eight

Inflation
Http://stats.bls.gov/eag/eag.us.htm
Lecture 5

Using Concepts to Illustrate the US Economy in Fall 2002
• Production Possibility Frontier: Real GDP Could be Getting Ready to Decline-Double Dip Recession?
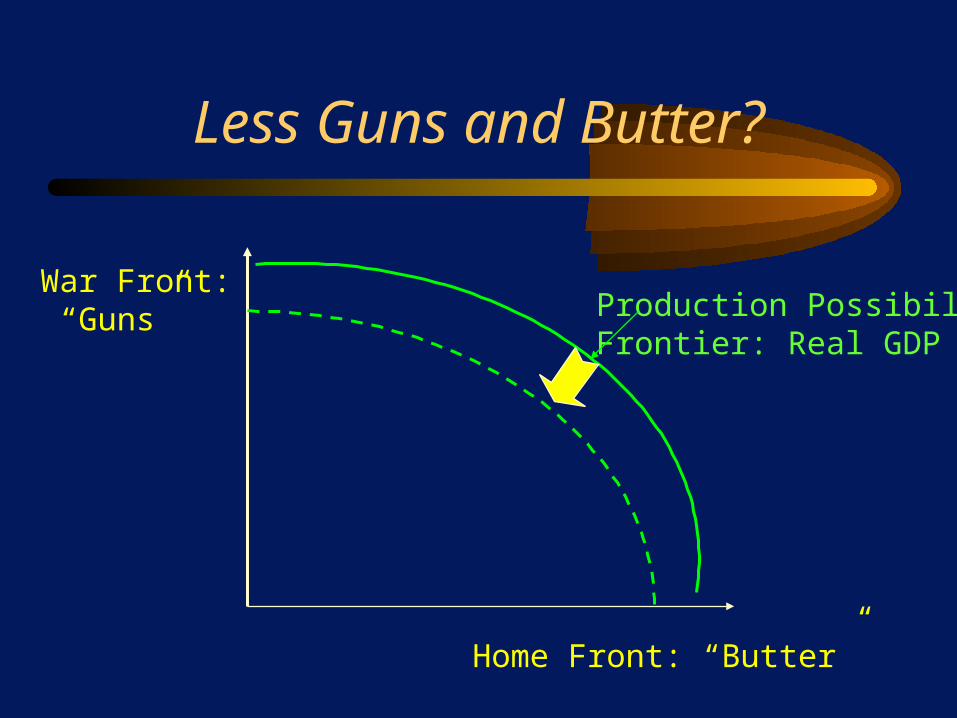
Less Guns and Butter?
Home Front: “Butter”
War Front: “Guns” Production Possibility
Frontier: Real GDP

Lab Five: Http://www.economagic.com

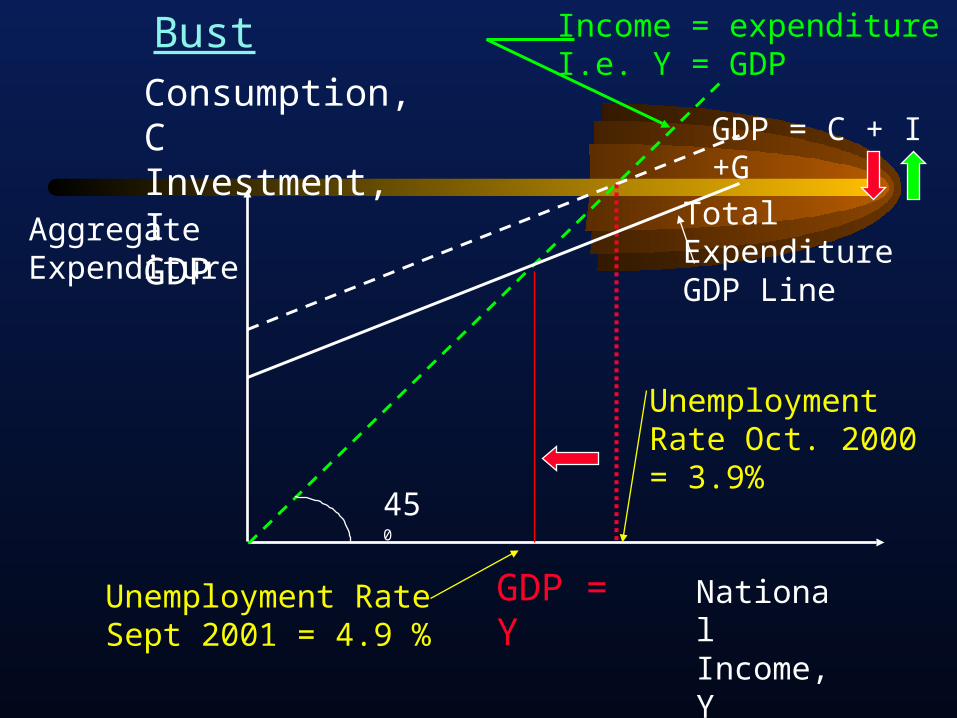
Using Concepts to Illustrate the US Economy in Fall 2002
• What are the Policy Options to Fight Recession– Fiscal Policy: Lecture Seven
Consumption, CInvestment, IGDP
National Income, Y
GDP = C + I +G
450
GDP = Y
Income = expenditureI.e. Y = GDP
TotalExpenditureGDP Line
AggregateExpenditure
Unemployment Rate Oct. 2000= 3.9%
Bust
Unemployment RateSept 2001 = 4.9 %

Consumption, CInvestment, IGDP
National Income, Y
GDP = C + I +G
450
GDP = Y
Income = expenditureI.e. Y = GDP
TotalExpenditureGDP Line
AggregateExpenditure
Bust
Lecture Seven


National Income and Product Accounts (NIPA)-Ch. 20
National Income and Product Accounts (NIPA)-Ch. 20
01 II 01 III 01 IV 02 I 02 II
Consumption 1.4 1.5 6.0 3.1 1.8
Investment -17.6 -5.2 -17.3 18.2 7.9
Government 5.6 -1.1 10.5 5.6 1.4
Net Exports -
Total: GDP -1.6 -0.3 2.7 5.0 1.3
Percent Change in Real (Constant $) GDP with Component

Source: http://www.yardeni.com
Federal Government Spending
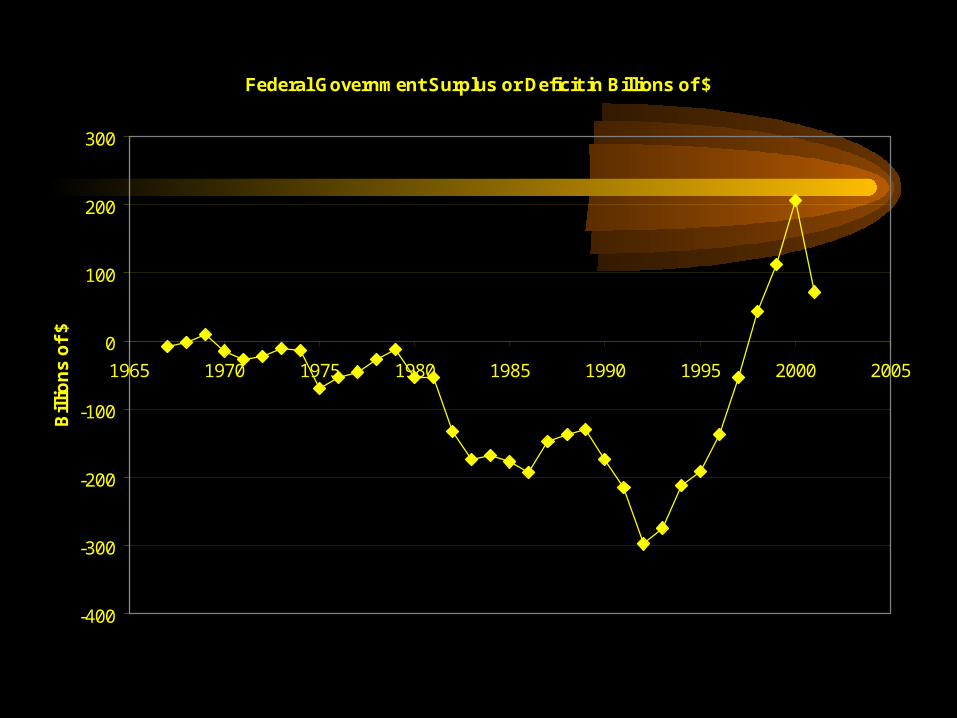
Federal Government Surplus or Deficit in Billions of $
-400
-300
-200
-100
0
100
200
300
1965 1970 1975 1980 1985 1990 1995 2000 2005
Year
Bill
ion
s o
f $
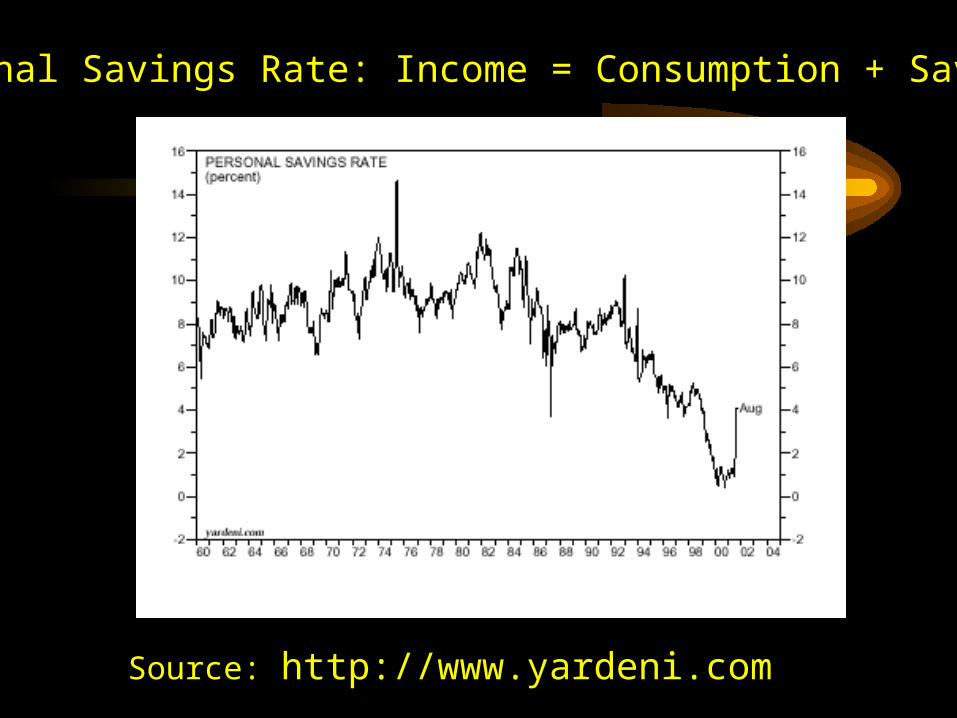
Personal Savings Rate: Income = Consumption + Savings
Source: http://www.yardeni.com

Retail Sales in Trillions of Dollars
Source: http://www.yardeni.com

Policy Option: Reassure the PublicPolicy Option: Reassure the Public
“The only thing we have to fear is fear itself”
Franklin Delano Roosevelt
Lecture Seven

Consumption, CInvestment, IGDP
National Income, Y
GDP = C + I +G
450
GDP = Y
Income = expenditureI.e. Y = GDP
TotalExpenditureGDP Line
AggregateExpenditure
Unemployment Rate Oct. 2000= 3.9%
Bust
Unemployment RateSept 2001 = 4.9 %
Lecture Seven
Using Concepts to Illustrate the US Economy in Fall 2002
• What are the Policy Options to Fight Recession– Monetary Policy: Lecture Nine

The Federal Reserve System: Purposes & Functions
http://www.bog.frb.fed.us/ PDF format: Adobe Acrobat

The Federal Reserve System: Purposes & Functions
http://www.bog.frb.fed.us/ PDF format: Adobe Acrobat
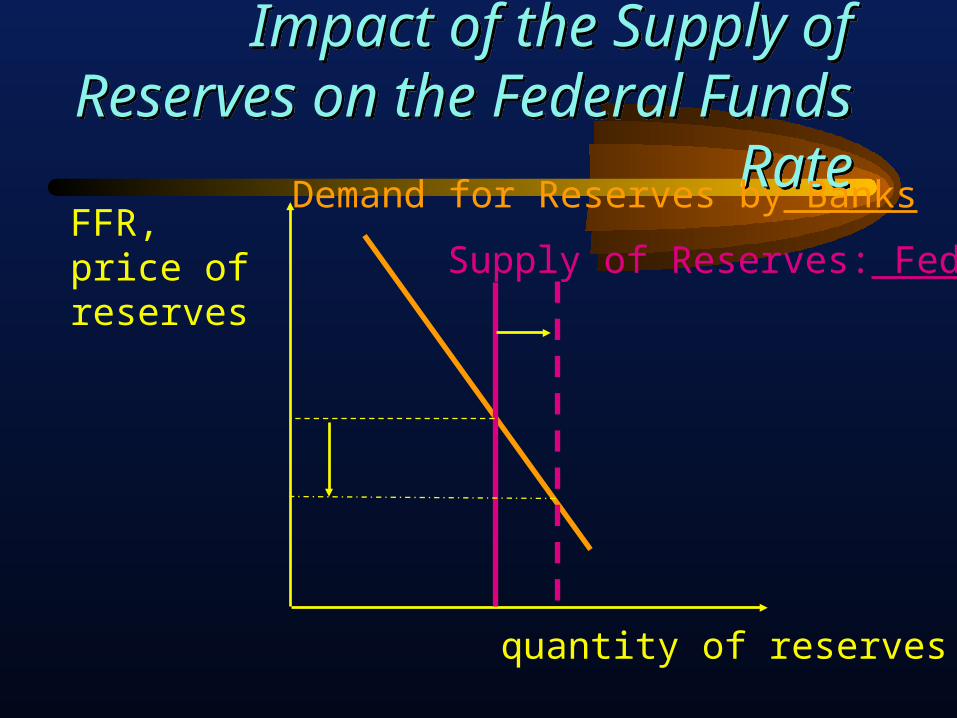
Impact of the Supply of Reserves on the Federal Funds Rate
Impact of the Supply of Reserves on the Federal Funds Rate
FFR,price ofreserves
quantity of reserves
Demand for Reserves by Banks
Supply of Reserves: Fed
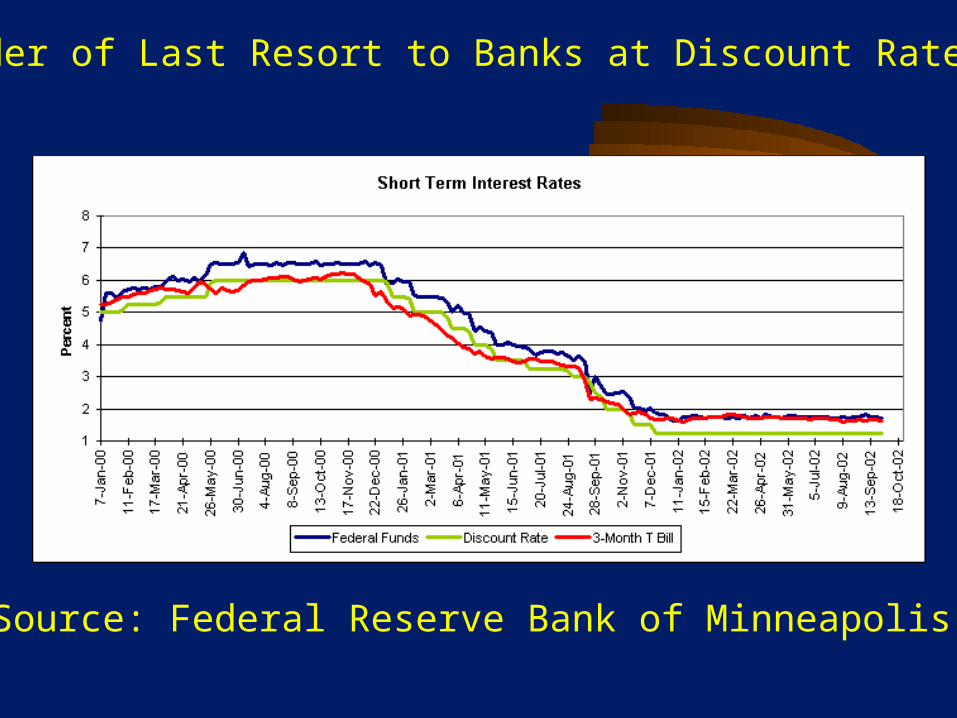
Fed: Lender of Last Resort to Banks at Discount Rate, 00-02
Source: Federal Reserve Bank of Minneapolis
The Federal Reserve
• Maintaining Liquidity: The Growth of the Money Supply

The Annual Rate of Growth of M1
Source: http://www.yardeni.com

Definitions of MoneyDefinitions of Money• M1(a measure of media of exchange) =
– currency held by the public, outside of banks– checkable deposits
• demand deposits
• NOW (negotiable order of withdrawal) accounts– savings & loans, mutual savings banks
– traveler’s checks
• M2 = M1 +– money market accounts at banks– money market mutual fund accounts– certificates of deposit, CD’s, less than $100,000
• M3 = M2 + CD’s over $100,000
Lecture Nine

Consumer Credit Outstanding as a % of Disposable Personal Income (Ch. 25)
Source: http://www.yardeni.com

Using Concepts to Illustrate the US Economy in Fall 2002
• What has been the economic impact of the “War on America”?– Destruction of income (flow)– Destruction of wealth (stock)

The Direct Loss of Income
• 3000 fatalities
• @ $100,000 per year income
• $ 0.3 billion

The Indirect Loss of Income: Potential GDP
• Full employment of labor
• Full employment of capital


Lab Three: National Income and Product Accounts (NIPA)-Ch. 20Lab Three: National Income and Product Accounts (NIPA)-Ch. 20
01 III 01 IV 02 I 02 II
Consumption 6983.7 7099.9 7174.2 7254.7
Investment 1574.9 1500.7 1559.4 1588.0
Government 1851.7 1896.8 1939.5 1959.8
Net Exports -312.6 -344.5 -360.1 -425.6
Total: GDP 10097.7 10152.9 10313.1 10376.9
Billions of Current $, Seasonally Adjusted at Annual Rates
GDP is Gross Domestic Product
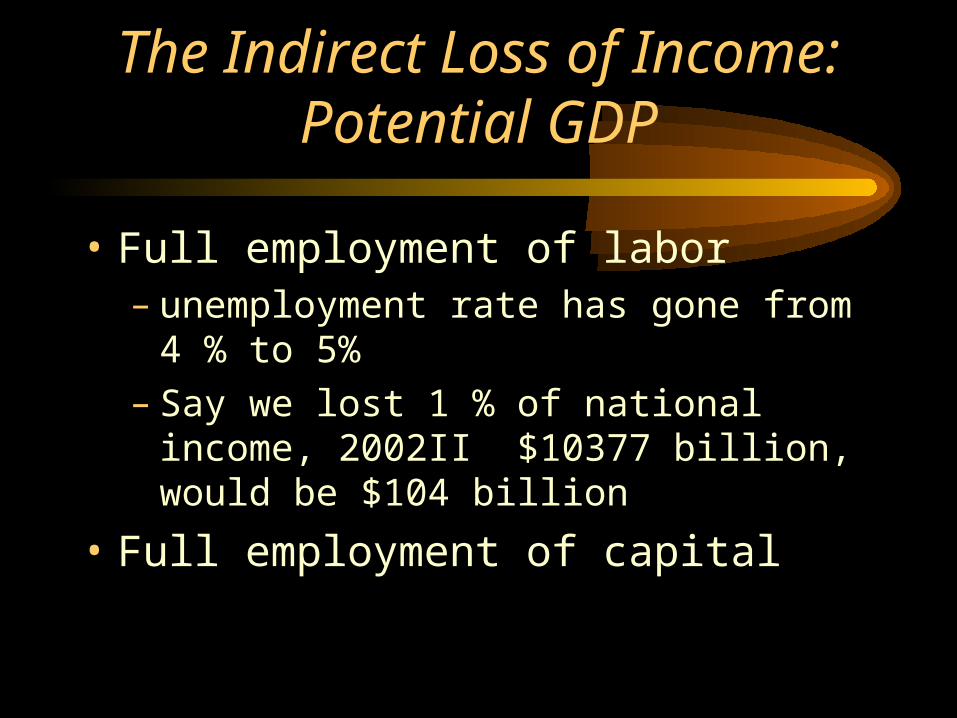
The Indirect Loss of Income: Potential GDP
• Full employment of labor– unemployment rate has gone from 4 % to 5%– Say we lost 1 % of national income, 2002II
$10377 billion, would be $104 billion
• Full employment of capital
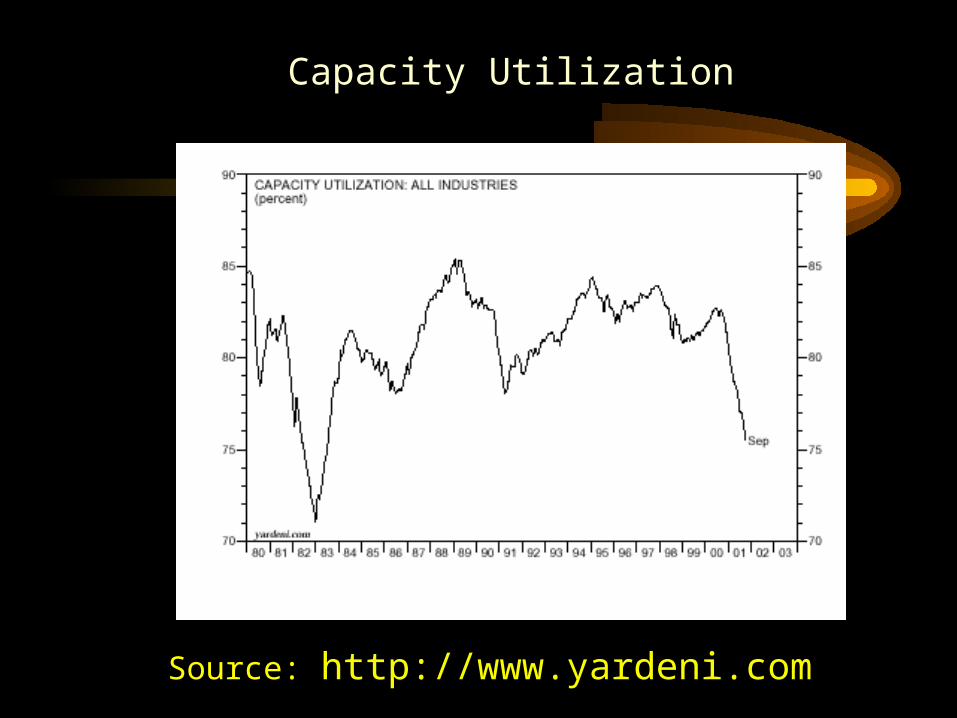
Source: http://www.yardeni.com
Capacity Utilization

How Much of the Loss is Attributable to the Attack
• As of August 22, the Survey of Professional Forecasters were still relatively optimistic– Calling for a growth rate in real GDP of 2.4%
in 2002QIII– calling for a growth rate in real GDP of 2.6% in
2002 QIV
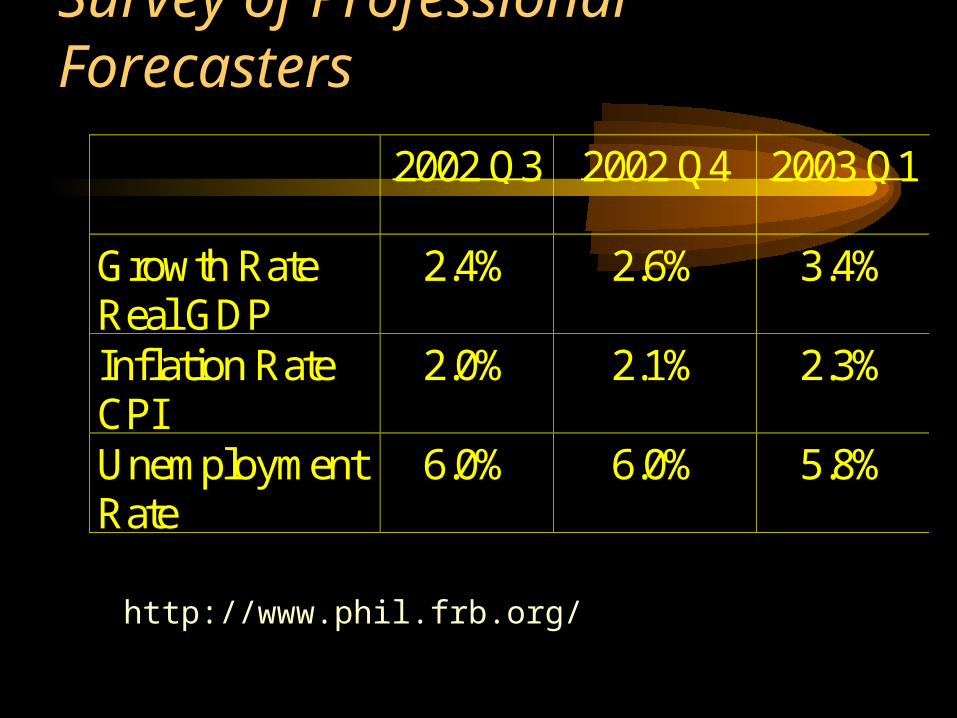
Survey of Professional Forecasters
2002 Q3 2002 Q4 2003 Q1
Growth RateReal GDP
2.4% 2.6% 3.4%
Inflation RateCPI
2.0% 2.1% 2.3%
UnemploymentRate
6.0% 6.0% 5.8%
http://www.phil.frb.org/

Survey of Consumer Confidence
• For October 79.4, down 14.3 point dive in one month (1985 =100). Lowest index in nine years
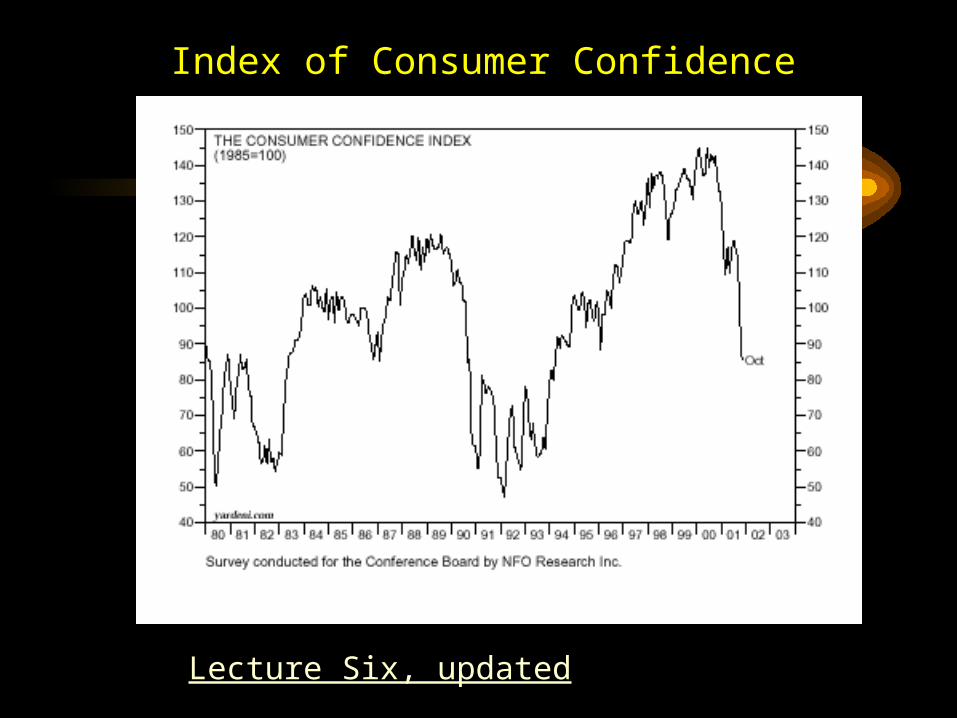
Index of Consumer Confidence
Lecture Six, updated

Midterms
• Essay Questions
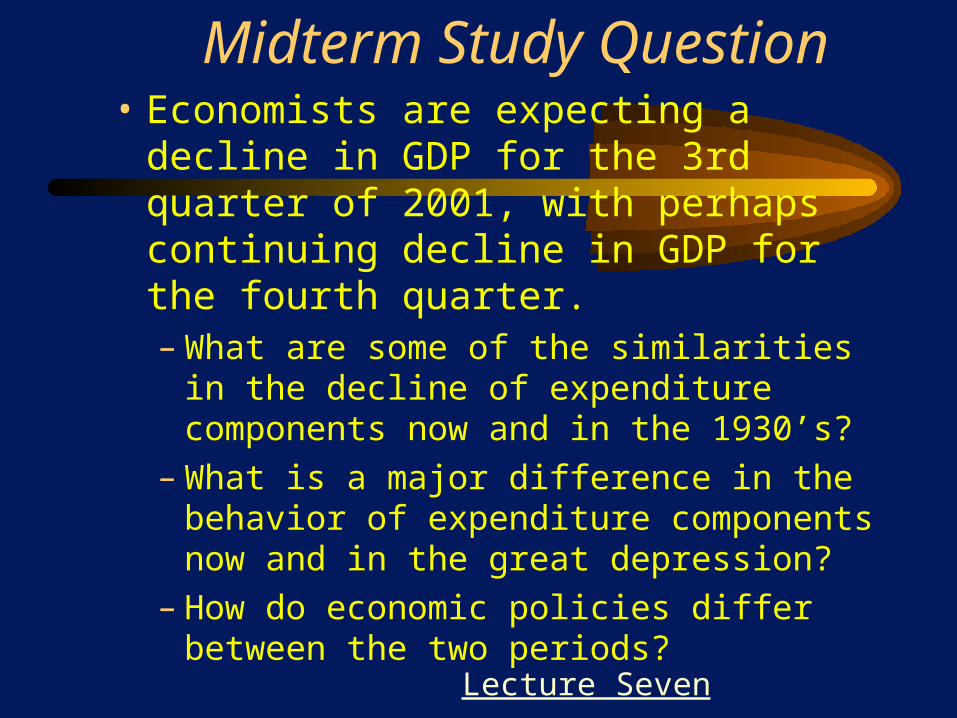
Midterm Study Question• Economists are expecting a decline in GDP
for the 3rd quarter of 2001, with perhaps continuing decline in GDP for the fourth quarter.– What are some of the similarities in the decline
of expenditure components now and in the 1930’s?
– What is a major difference in the behavior of expenditure components now and in the great depression?
– How do economic policies differ between the two periods?
Lecture Seven
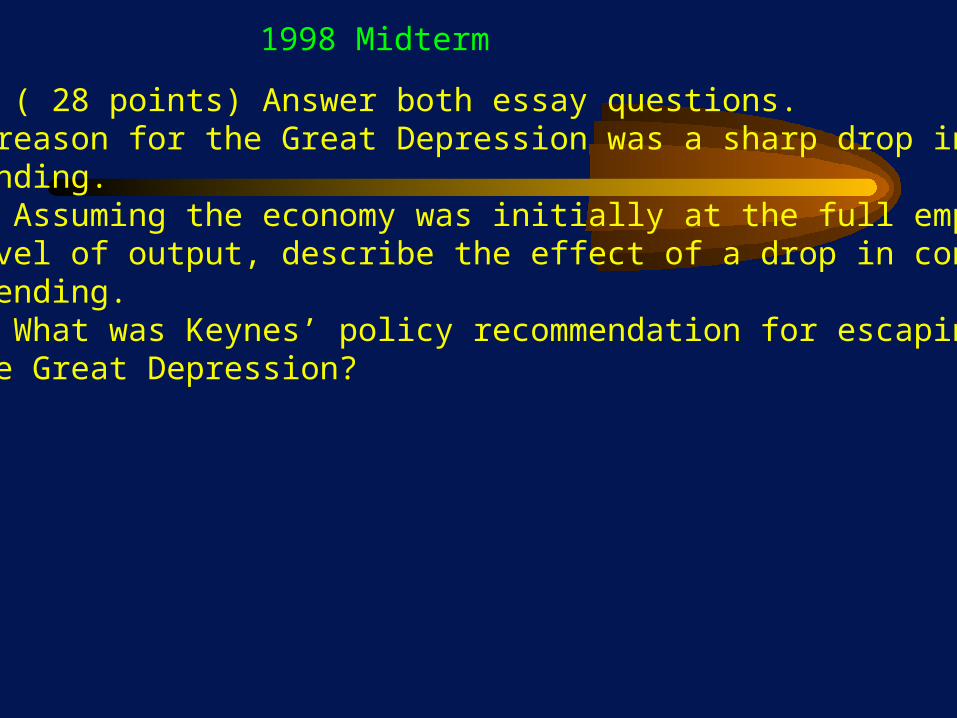
Part IV ( 28 points) Answer both essay questions.1. One reason for the Great Depression was a sharp drop in consumer spending.
a. Assuming the economy was initially at the full employment level of output, describe the effect of a drop in consumer spending.b. What was Keynes’ policy recommendation for escaping from the Great Depression?
1998 Midterm

2. Opinions about the US economy have been quite changeable this Fall quarter. At the moment, the rate of growth of the economy is slowing, but growth is still positive. How would you satisfy yourself whether a recession might be coming or not? How would you assess whether the likelihood of a recession in 1999 is low? or high?
a. What conceptual framework would you use to answer this question about a prospective recession?b. What data and which economic measures or statistics would you look at?c. How would you deal with the fact that you need a “crystal
ball” to see into 1999 and the future?
Midterms
• Graphical Questions
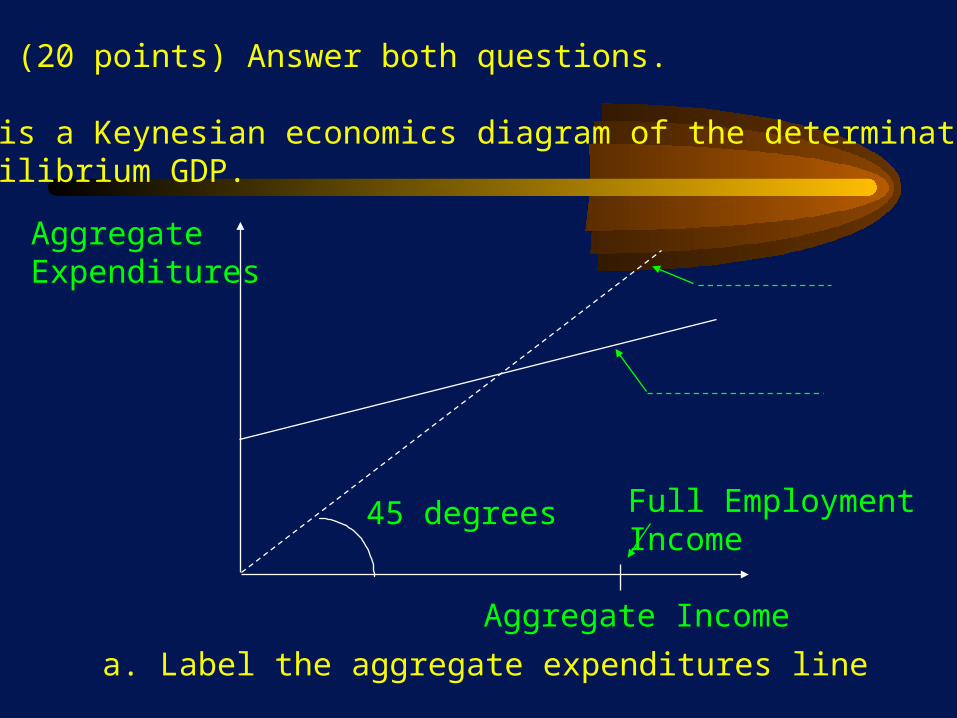
Part III (20 points) Answer both questions.
1. This is a Keynesian economics diagram of the determination of equilibrium GDP.
Aggregate Expenditures
Aggregate Income
a. Label the aggregate expenditures line
Full Employment Income
45 degrees

b. Label the equilibrium condition line, for which aggregate expenditures equals aggregate income, i.e. GDP = Y.c. On this diagram, indicate the equilibrium level of
aggregate income, Yeq .d. Is this equilibrium level of income higher or lower than
the full employment level of income? ________________.e. Given your answer to part d, does this indicate a
recession or an inflationary boom? ____________________.

2. This diagram illustrates the market for reserves and the determination of the federal funds rate. This is the rate which commercial banks charge one another for borrowing, usually overnight.
FederalFundsRate
Quantity of Reserves
a. Label the demand curve for reserves.

b. Which institution(s) demand(s) reserves?______________c. Label the supply curve for reserves.d. Which institution(s) affect(s) the supply curve for reserves?_______________e. If the Federal Reserve raises the ratio of required reserves to deposits, which curve will shift to the right,
resulting in a _______________ federal funds rate? ____________..
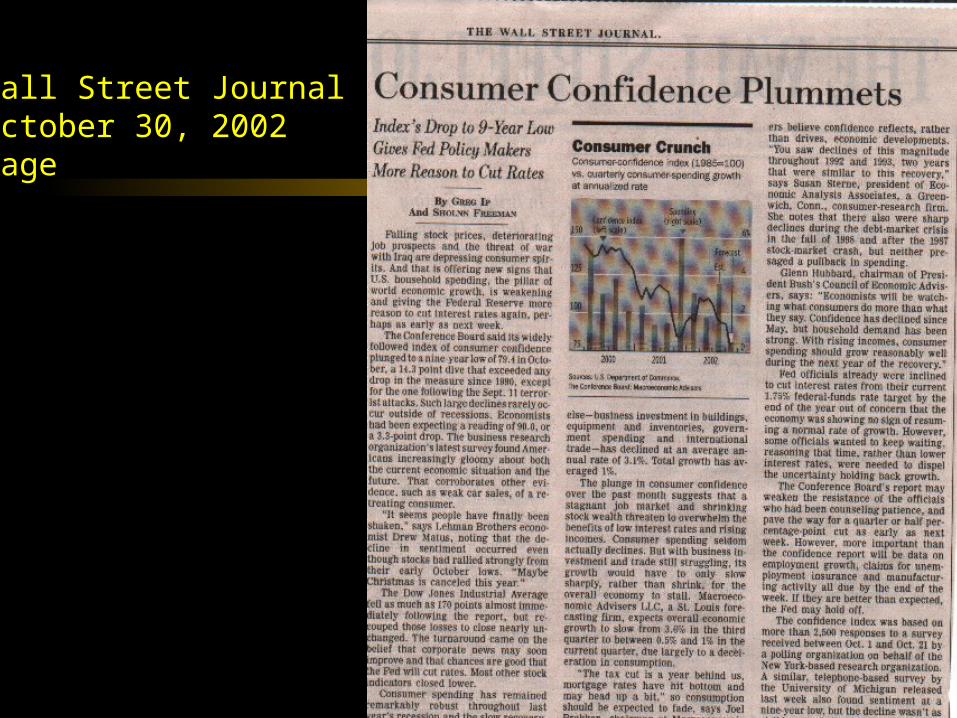
Wall Street JournalOctober 30, 2002Page