introduction to kbc group€¦ · • this presentation is provided for informational purposes...
TRANSCRIPT

1

2
Contact information
Investor Relations Office
e-mail: [email protected]
Surf to www.kbc.com for the latest update.

3
Important information for investors
• This presentation is provided for informational purposes only. It does not constitute an offer to sell or the solicitation to buy any security issued by the KBC Group.
• KBC believes that this presentation is reliable, although some information is condensed and therefore incomplete.
• This presentation contains forward-looking statements with respect to the strategy, earnings and capital trends of KBC, involving numerous assumptions and uncertainties. The risk exists that these statements may not be fulfilled and that future developments differ materially. Moreover, KBC does not undertake any obligation to update the presentation in line with new developments.
• By reading this presentation, each investor is deemed to represent that it possesses sufficient expertise to understand the risks involved.

4
Table of contents
• Company profile and strategy• 1Q 2008 financial performance
• Highlights• Analysis of results, Group• Underlying profit performance per business unit• Subprime loan exposure
• Structured credit exposure• Solvency situation• Wrap Up

5
Company profileand strategy

6
• KBC is a top-3 player in Belgium and in CEE-4; 75-80% of revenue is generated in markets with leading market share (which provides over-the-cycle strength)
• Moreover, KBC pursues some niche strategies in private banking and selected merchant banking activities (mainly European focus)
23%
19%
58%Belgium:- retail bancassurance- wealth management- local merchant banking
activities
CEE:- 4 main markets: Czech Republic,
Poland, Hungary, Slovakia- new markets added in 2007
(Russia, Bulgaria, Serbia)
Other- commercial and private banking, mostly in
Belgium’s neighbours (NL, LU, FR,GE, UK)- capital market activities
Business profile
Revenue breakdown per geographical area (FY 2007)

7
Shareholder structure
*Including ESOP hedge and shares bought backaccording to the share buyback plan
Staff3%
Institutional, Belgium
8%
Retail, Belgium
14%
Institutional, UK
19%
Institutional, Cont.
Europe31%
Institutional, N. America
24%
Institutional, R/o world
1%
Shareholder identification surveyas of 31 Dec 2007
Situation as at 31 March, 2008
CERA/KBC Ancora30.3%
KBC(Treasury shares: 4.9%*)
Other coreshareholders 12%
MRBB12%
Free float40.8%
Free float
KBC is ±50%-owned by a syndicate of shareholders, providing continuity to pursue long-term strategic goals. Committed holders include the Cera/KBC Ancora Group (co-operative investment company), a farmers’ association (MRBB) and a group of industrialist families
The free float is chiefly held by a large variety of international institutional investors (close to 50% UK- or US-based)
54.3%

8
HSB
C
BSC
H S
ANTA
ND
ER
UN
ICR
EDIT
BNP
BBVA
INTE
SA ING
UBS
RBS
CR
EDIT
SU
ISSE
DEU
TSC
HE
BAR
CLA
YS
FOR
TIS
CA SG
STN
D C
HAR
TER
ED
LLO
YDS
KBC
NO
RD
EA B
ANK
HBO
S
DEX
IA
NAT
BAN
K G
REE
CE
RAI
FFEI
SEN
INT'
L
DAN
SKE
CO
MM
ERZ
ERST
E
NAT
IXIS
BCO
PO
P ES
P
ALLI
ED IR
ISH
DN
B
KBC:31 bn euros
Ranking based on market capitalization, European Financials
Situation as at 7 May 2008. Current KBC share price: 86.9 euros

9
The financial track record is very solid, based on strong cross-selling performance in Belgium (bancassurance) and increasing earnings momentum in CEE (the region represents 50% of the group’s 2007 profit growth)
22%
43%
12% 18%
FY04 FY05 FY06 FY07
Underlying earnings-per-share growth per year
Financial track record
Underlying net profitCAGR 10y: 16%

10
Dividend policy
8.47
7.196.42
4.483.683.423.39 3.78
3.312.51
1.841.641.521.48
2001 2002 2003 2004 2005 2006 2007
EPS DPS
Steadily increasing dividend for more than 20 consecutive years
Gross DPS growth was 20% CAGR over the last 5 years
Historical average cash payout stands at 40-45%
Note: EPS based on an underlying basis from 2005

11
Return level per business units
16%
2%
21%
FY 06 FY 07 1Q 08
24%28%25%
FY 06 FY 07* 1Q 08*
32%35%
29%
FY 06 FY 07 1Q 08
Belgium CEE R
Merchant Banking European Private Banking
Return on Allocated Capital
29%33%
29%
FY 06 FY 07 1Q 08
All figures are on an underlying basis * Return in CEE, excluding new acquisitions. Return incl. new entities: FY07: 24%, 1Q08: 20%
12
Strategy development
Over the last 18 months, we have been carrying out what we promised in order to underpin future growth and profitability:
• Focusing on cross-selling and customer satisfaction in Belgium (average return on allocated capital targeted of > 26% for 2007-2009)
• Strengthening the sales networks in key CEE-4 markets (2 new branch openings/week)
• Entry into new CEE markets further East (2 bn euros invested in 2007-08)
• Achieving cross-border business synergies (another 180m euros pre-tax/ year synergies to come by 2009)
• Optimising the capital structure (reducing excess capital)

13
• Our organic growth has been strong, mainly on the back of sustained wealth inflows and the low level of indebtedness in Belgium and converging purchasing power in CEE
• Although we expect to see an impact from an economic downturn, we believe growth momentum will remain resilient, especially in CEE
Customer loans Customer wealth2006 2007 1Q 08 2006
+8% +14%
+12%
-
+5%
+26%
+13%
-
2007 1Q 08
Belgium (retail) +14% +16% +11% +9%
CEE +23% +26% +16% +17%
Commercial banking +16% +4% - -
Private banking - - +0% -4%
Growth expected to remain resilient
y/y organic growth trends; customer wealth = banking deposits + AUM + life insurance

14
Growth potential in CEE
RussiaTotal banking assets KBC: 3 bn* (entry in 2007)
Baltic subregionNo KBC presence
Balkan subregionTotal banking assets KBC: 0.6 bn(entry in 2007)
Central subregionTotal banking assets KBC: 30 bnB
NLUK
AUSW
• Our 4 CEE key markets are in the central subregion (90% of our CEE banking assets)
• The economy is doing well and, in our view, the ‘macro’ risk is more limited here
• We are more concerned about the Baltic & Balkan areas – where our combined exposure is very limited –due to the high levels of private debt, real estate prices, C/A
deficits… SPP
PL
FR
NW
FL
RU
UK
BR
IT
G
Assets in bn euros
* Top-10 mortgage lender in Russia

15
Nominal GDP growth in KBC’s CEE markets (in %)
% Real GDP growth (bottom) and % inflation (top), weighted-average based on KBC presences
Growth potential in CEE (2)
4.9 5.0 5.7 6.0 5.3 4.8
4.3 6.9 4.5 2.9 2.5 4.4
2004 2005 2006 2007 2008e 2009e
9.2 8.97.8
10.112.0
9.1
• As the cycle turns, (our) CEE economies will continue to outgrow mature markets. We expect economic growth for 2008 to be similar to that of 2007 (albeit with higher inflation)
• Although we prefer to remain cautious, we may have seen ‘the worst’ during the course of 2007 in Hungary, which has been the region’s economic outlier since mid-2006

16
Growth potential in CEE (3)
KBC, loan growth, CEE (y/y, in %)
• CEE’s growth momentum is supported by our enhanced competitive abilities (except in Hungary, where we decided mid-2006 to be more cautious)
KBC
Market
Poland42%
29%
16%
-5%
15%
29%29%23%
Q2 06 Q4 06 Q2 07 Q4 07
Hungary
18%
10%5%
-7%
9%
28%
18%
26%
Q2 06 Q4 06 Q2 07 Q4 07
Czech Republic
20%
26%32%
28% 29%32%
19%
28%
Q2 06 Q4 06 Q2 07 Q4 07
Slovakia
21% 22%26%
49%
64%
41%
26%31%
Q2 06 Q4 06 Q2 07 Q4 07

17
0 0 3 1 1 311
40
PolandHungary
Stress test: expected losses from FX loans in Poland and Hungary in function of the depreciation of PLN and HUF
10% depreciation
20% depreciation
30% depreciation
40% depreciation
Impact on KBC 2008 net profit* 0.03% 0.1% 0.4% 1.3%
after-tax,in m euros
There is no material FX consumer credit business in the Czech Republic and Slovakia
• For KBC, FX lending is an “issue” in Hungary only
• Given our conservative approach here, a 30% HUF depreciation would cost <0.5% of Group net profit (i.e. 11m euros after tax)
No material FX lending issues in CEE
(*Sell-side consensus)

18
Publication of 9M 2008 results
Financial calendar
Investor Day, Moscow5 & 6 June, 20085 & 6 June, 2008
Publication of 1H 2008 results7 Aug, 20087 Aug, 2008
6 Nov, 20086 Nov, 2008
Publication of FY 2008 results12 Feb, 200912 Feb, 2009

19
Analysts’ opinionsSituation as at 13 May 2008 (current share price: 83.7)
BANK/BROKER ANALYST PHONE RATING TARGET PRICE UPSIDEJan-Kees Mons +31 20 573 06 66 + 100 20%Natasha Oliver +44 20 7155 6664 + 108 29%Kiri Vijayarajah +44 20 7986 4258 + 101 21%Guillaume Tiberghien +44 20 7883 7515 + 108 29%Ivan Lathouders +32 2 287 91 76 + 109 30%Gaelle Cibelly +33 1 44 95 66 28 + 109 30%Jaap Meijer +44 20 747 55 664 + 107 28%François Boissin +33 1 42 99 25 12 + 107 28%Kurt Debaenst +32 2 565 60 42 + 103 23%Jonathan Tyce +44 20 7663 6058 = 100 20%Marcel Mballa-Ekobena +44 20 7991 6809 + 108 29%Albert Ploegh +31 20 563 8748 + 110 32%Christophe Ricetti +33 1 58 55 05 22 + 98 18%Paul Formanko +44 20 7325 6028 + 110 31%Aurelia Faure +44 20 7102 4681 + 115 37%Jean-Pierre Lambert +44 20 7663 5292 - 70 -16%Manus Costello +44 20 7996 1953 + 100 20%Scander Bentchikou +33 1 44 51 83 08 + 94 12%Thomas Stögner +49 69 7134 5602 + 101 21%Ton Gietman +31 20 573 54 63 = 100 20%Georg Krijgh +31 20 460 48 60 = 101 21%Omar Fall +44 20 7678 0442 + 110 31%Sabrina Blanc +33 1 42 13 47 32 - 76 -9%Marco Troiano +44 20 7176 3964 = 95 14%Gert Van Rooyen +44 20 7568 2131 + 115 37%Ralf Breuer +49 211 826 4987 + 110 31%
CONSENSUS: 103 23%

20
1Q 2008financial performance

21
Highlights

22
Quarter under review -Financial highlights
Note: All of the following slides of this presentation refer to underlying P&L figuresAll figures are in m euros
Reported net profit
980
736634
997 936
639708
554
1 081
1Q 06 2Q 06 3Q 06 4Q 06 1Q 07 2Q 07 3Q 07 4Q 07 1Q 08
Underlying net profit
573 676
574 634
776
601
781
564
880
1Q 06 2Q 06 3Q 06 4Q 06 1Q 07 2Q 07 3Q 07 4Q 07 1Q 08
Exceptional items
-19 32 38
204 102
56
216
70
507
1Q 06 2Q 06 3Q 06 4Q 06 1Q 07 2Q 07 3Q 07 4Q 07 1Q 08

23
1Q 08 P&L impact of subprime exposure
Note: EPB stands for European Private BankingAll figures are in m euros
Underlying net profit
573
387
-364326154
Belgium CEE R MerchantBanking
EPB GroupCenter
GroupTotal
MtM adjustment related to subprime exposure (after tax)
-19
-93
-21-46 -7
Belgium CEE RMerchantBanking EPB
GroupCenter Group Total
Underlying net profit excl. MtM adjustment related to subprime exposure
666
406
-36
17572 50
Belgium CEE R MerchantBanking
EPB GroupCenter
Group Total
y/y growth: +24% +17% -73% -4%

24
Quarter under review –Financial headlines
• Underlying net profit at 573m
• Encouraging volume growth: mortgages in Belgium up 10% y/y, up 50% in CEE
• Underlying NII up 10% y/y in Belgium and 21% in CEE
• Life insurance sales up 54% y/y
• Decline in broad equity indices (-17% q/q) weighed on trading and asset management operations
• Limited markdowns of structured credit investments portfolio (after-tax P&L impact: 93m, impact on equity: 61 m). No further accrual of provisions to cover exposure to monoline insurers
• Very low loan losses only, YTD LLR at 6 bps
• Solvency remained robust. Tier-1 ratio, stood at 8.6% according to Basel II (8.0% under Basel I). Solvency ratio, insurance stood at 191%
• Notwithstanding the robust solvency, but just to be cautious the share buyback has been temporarily suspended

25
Developments in 2Q 2008
• The second quarter up to now has shown a strong performance
• André Bergen, CEO:
“As investment yields fell across asset classes and volatility remained high, merchant banking and asset management performances suffered. However, we were happy to see that the performances of the second half of the quarter showed clear signs of improvement. These improvements have accelerated further during the first half of the second quarter.”

26
Analysis of resultsGroup

27
Volumes y/y
Growth, y/y +19% +20% +5% +5%+14% +7%
+20%+15%+42%+23% +29%
Merchant Banking +4% - -25% - -Private Banking - - - -7% +9%
+8%+8%+24%+1% +9%
+6%Belgium +16% +10% +5%CEE R- Czech Republic - Slovakia- Hungary- Poland
+26%+27%+23%+11% +48%
+50%+51%+43%+28% +87%
+15%+7%+24%+34% +24%
Outstanding (in bn) 149 49 197 227 23
Total loans Of which mortgages
Customer deposits
AUM Life reserves
Notes:
- Organic growth rates only- Growth rates excluding repo and reverse repo actvities- Trends for CEE in local currency

28
Volumes q/q – non-annualised
Growth, q/q +2% +5% +2% -2%+3% -1%
+2%+4%+15%+2% -7%
---
Merchant Banking -1% - -3% - -Private Banking - - - -6% +1%
+0%+2%-9%-4% +8% -14% -14% -11%
+0%Belgium +1% +3% +2%CEE R- Czech Republic - Slovakia- Hungary- Poland - Serbia - Russia - Bulgaria
+4%+2%+11%+0% +10% +19% +11% +16%
+10%+7%+8%+9% +13% +10% +16% +12%
+1%+1%+2%-2% -1%
--
+ 4%
Outstanding (in bn) 149 49 197 227 23
Total loans Of which mortgages
Customer deposits
AUM Life reserves
Notes:- Organic growth rates only- Growth rates excluding repo and reverse repo actvities- Trends for CEE in local currency

29
Revenue trend - Group
1 020 1 034 1 039 1 063 1 0811 116
1 199 1 202
979
1Q2006
2Q2006
3Q2006
4Q2006
1Q2007
2Q2007
3Q2007
4Q2007
1Q2008
1.74%
1.69% 1.67% 1.70% 1.71% 1.71% 1.68% 1.69%1.81%
1Q2006
2Q2006
3Q2006
4Q2006
1Q2007
2Q2007
3Q2007
4Q2007
1Q2008
NIM*
* Net Interest Margin equals Net Interest Income divided by Total Interest Bearing Assets excl. reverse repos
NIIin m euros
• NII (1 202 m) up 13% y/y (excl. new acquisitions +10%) and roughly flat q/q as a balance of:• Rising volumes throughout the group, e.g.: loans up 19% y/y and 2% q/q• NIM (1.74%) slightly up y/y, but down 7 bps q/q on account of a change in
accounting of lease finance and ALM derivatives (- 40m impact, recurring)
Impact of change in methodology(7 bps)

30
Revenue trend - Group
612 561 475622 608 626 626 646 586
-80 -77 -72 -97 -85 -87 -101 -122-321Q
20062Q
20063Q
20064Q
20061Q
20072Q
20073Q
20074Q
20071Q
2008
Banking InsuranceF&C
208 204216
229 232 231 227213 209
1Q2006
2Q2006
3Q2006
4Q2006
1Q2007
2Q2007
3Q2007
4Q2007
1Q2008
AUMin bn eurosin m euros
• Net F&C (464m) -15% q/q and -9% y/y on a comparable basis, as the result of: • Lower fees received for banking and asset management (-9% q/q, -4% y/y) due to the
stock market volatility• Higher commissions paid for higher insurance sales
• AUM (227 bn) down 2% q/q and up 5% y/y. Net inflows at 3% q/q and 9% y/y, offest by negative price effect

31
482
284
201
384 359404
154
-28
154
1Q2006
2Q2006
3Q2006
4Q2006
1Q2007
2Q2007
3Q2007
4Q2007
1Q2008
Revenue trend - Group
754852
946 869 824969
1 2361 328
768
1Q2006
2Q2006
3Q2006
4Q2006
1Q2007
2Q2007
3Q2007
4Q2007
1Q2008
Premium income FV gains
• Earned premium, insurance (1 236m) down 7% q/q due to 13% drop in life insurance sales (4Q 07 boosted by traditional marketing campaign for investment and life insurance products)
• Earned premiums up 42% y/y (life insurance sales up 72% y/y, on a like-for-like basis)• FV gains (-28m) significantly down q/q and y/y:
difficult capital market situationMTM adjustments on CDO portfolio: 141m pre-tax (vs. 114m in 4Q 07), 93m after-tax (vs. 70m in 4Q 07)
All figures are in m euros
32
12
71
15 18 12
112
23 1929
1Q2006
2Q2006
3Q2006
4Q2006
1Q2007
2Q2007
3Q2007
4Q2007
1Q2008
Revenue trend - Group
6286
7096 107 115
198
143
108
1Q2006
2Q2006
3Q2006
4Q2006
1Q2007
2Q2007
3Q2007
4Q2007
1Q2008
AFS realized gains Dividend incomeAll figures are in m euros
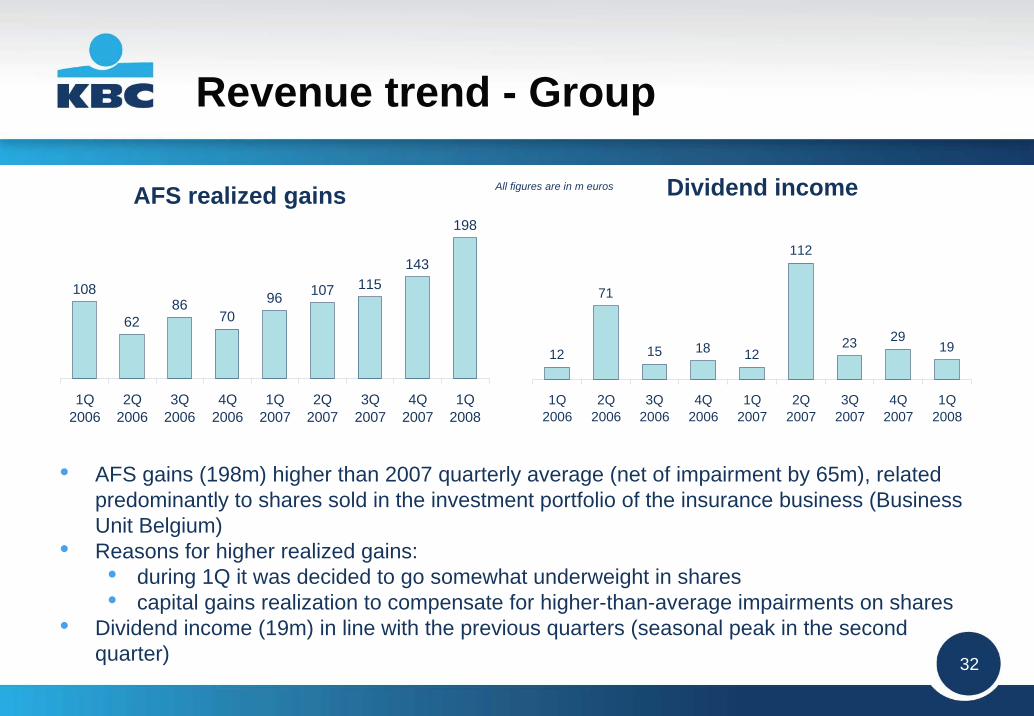
• AFS gains (198m) higher than 2007 quarterly average (net of impairment by 65m), related predominantly to shares sold in the investment portfolio of the insurance business (Business Unit Belgium)
• Reasons for higher realized gains:• during 1Q it was decided to go somewhat underweight in shares• capital gains realization to compensate for higher-than-average impairments on shares
• Dividend income (19m) in line with the previous quarters (seasonal peak in the second quarter)

33
Operating expenses - Group
1 223 1 1261 388
1 208 1 314 1 266 1 2781 3671 238
1Q2006
2Q2006
3Q2006
4Q2006
1Q2007
2Q2007
3Q2007
4Q2007
1Q2008
427444 452
501
432
471461 464
485
1Q2006
2Q2006
3Q2006
4Q2006
1Q2007
2Q2007
3Q2007
4Q2007
1Q2008
Operating expenses, consolidated
311 328397
321 352 363406
454
302
1Q2006
2Q2006
3Q2006
4Q2006
1Q2007
2Q2007
3Q2007
4Q2007
1Q2008
Operating expenses, Belgium
Operating expenses, CEE R
All figures are in m euros
C/I, banking FY 06 FY 07 1Q 08
Belgium 58%
57%Slovakia - - 60%
63%Poland 72% 70% 66%Russia - 72% 68%
50%
73%
58%
Czech Republic
59%59%
53%
59%
Merchant Banking 53% 85%
65%
51%
58%
52%
65%
66%
Hungary
Private Banking
Total

34
Operating expenses - Group
• q/q evolution: expenses down 7% on comparable basis, thanks to:strict cost control,lower profit-related remuneration
• 1Q 08 expenses contain 22m take-back of redundant provisions of risks and charges (41m in 4Q 07)
• y/y developments: increase less than 1% on a comparable basis (6% including new acquisitions and FX changes)
• YTD C/I ratio at 66% (underlying), up from FY 07 level (58%), essentially due to lower total banking income

35
Impairment - Group
67
19
92
27
56 62
98121
-3
1Q2006
2Q2006
3Q2006
4Q2006
1Q2007
2Q2007
3Q2007
4Q2007
1Q2008
10 612 15
9 11
52
-2
62
1Q2006
2Q2006
3Q2006
4Q2006
1Q2007
2Q2007
3Q2007
4Q2007
1Q2008
Impairment, consolidated
44
10
64
25 2738 39
1
19
1Q2006
2Q2006
3Q2006
4Q2006
1Q2007
2Q2007
3Q2007
4Q2007
1Q2008
Impairment, Belgium
Impairment, CEE RLoan loss ratio FY 06 FY 07 1Q 08
0.07% 0.13%
0.18%
Slovakia - 0.96% 0.60%
0.62%
0.00%
Russia - 0.21% 0.82%
0.02%
0.13%
0.36%
0.03%
0.29%
0.05%
0.64%
0.00%
0.06%
1.50%
0.00%
0.00%
0.13%
Belgium
Czech Republic
Hungary
Poland
Merchant Banking
Total
All figures are in m euros
loan imp: 27m
AFS imp: 71m
loan imp: 4m
AFS imp: 48m
loan imp: 35m
AFS imp: 4m

36
Impairment - Group
• 1Q 08 total impairment: 98m, of which:27m related to the loan portfolio71m related to AFS securities
• YTD LLR 6 bps on Group level: still very low (13 bps in FY 07)
• Overall loan quality continues to be sound. NPL ratio stable at 1.5%
Note: All figures are before tax

37
Underlying profitperformance per business unit

38
883 846 819 854 881 989
8721 012
899
1Q2006
2Q2006
3Q2006
4Q2006
1Q2007
2Q2007
3Q2007
4Q2007
1Q2008
Business Unit Belgium
275 266241
327
417
303
387
274323
1Q2006
2Q2006
3Q2006
4Q2006
1Q2007
2Q2007
3Q2007
4Q2007
1Q2008
Net profit Total IncomeAll figures are in m euros
• 1Q underlying net profit at 387m, up 41% q/q, 18% y/y• Net profit supported by higher-than-average realised gains on investments (200m), net of
impairment charges 65m higher than 2007 quarterly average• Underlying YTD C/I ratio at 59% (in line with FY 07)• YTD net combined ratio, non life insurance at low 88%• YTD return on allocated capital 35% (26% with normalised level of capital gains)

39
1.72%1.69%1.77%1.84%1.81%1.82%1.92%1.96%1.76%
1Q2006
2Q2006
3Q2006
4Q2006
1Q2007
2Q2007
3Q2007
4Q2007
1Q2008
Business Unit Belgium (2)
489 481 478 483 479 478
532511
479
1Q2006
2Q2006
3Q2006
4Q2006
1Q2007
2Q2007
3Q2007
4Q2007
1Q2008
NII NIM
• NII (532m) up 4% q/q – continuing the strong trend started in 4Q 07• NII up 10% y/y, resulted from:
• brisk volume growth of loan and deposit (+16% and +14%, respectively)• positive impact from the capital increase in KBC Bank in 4Q 2007
• NIM stood at 1.72%, down 4 bps q/q (strong growth of low-margin deposits) and 12 bps y/y(flattening of yield curve and higher share of low-margin deposits)
in m euros

40
135 134141 143
149158 160 162 160
1Q2006
2Q2006
3Q2006
4Q2006
1Q2007
2Q2007
3Q2007
4Q2007
1Q2008
Business Unit Belgium (3)
227 219278 276 276 255 249
-46 -56
279262
-42-38-37 8 -33 -29 -45
1Q2006
2Q2006
3Q2006
4Q2006
1Q2007
2Q2007
3Q2007
4Q2007
1Q2008
Banking Insurance F&C AUM
• F&C income (192m) down both q/q and y/y by 8% and 16%, respectively, due to:• High volatility in equity markets which led inter alia to decreased fees from sales of
investment funds• increased fees and commissions paid to insurance agents
• AUM (160bn) down 1 % q/q (+3% net inflows, -4% price effect), up 7% y/y (12% net new inflows and -5% price effect)
in m eurosin bn euros

41
10 612 15
-29 11
5262
1Q2006
2Q2006
3Q2006
4Q2006
1Q2007
2Q2007
3Q2007
4Q2007
1Q2008
Operating expenses Impairment
Business Unit Belgium (4)
• Operating expenses (464m) down 4% q/q, mainly thanks to lower bonus accruals• Costs up 7% y/y, as a result of:
• inflationary pressure• number of one-offs, incl. 6m negative impact from staff hospitalisation costs (vs. 5m
positive impact from retrieval of cost provisions in 1Q 07)• Impairments on loans remained limited (4m, 2007 quarterly average: 15m), YTD LLR at
3bps (13 bps in 2007)• Impairment on AFS assets impacted by difficult stock markets became relevant as
of 4Q 07
427 444 452501
432471 461 464485
1Q2006
2Q2006
3Q2006
4Q2006
1Q2007
2Q2007
3Q2007
4Q2007
1Q2008
All figures are in m euros
loan imp: 4m
AFS imp: 48m

42
126117
10948
126157
106160
-722112123818 1-2
152
1Q2006
2Q2006
3Q2006
4Q2006
1Q2007
2Q2007
3Q2007
4Q2007
1Q2008
bankinginsurance
19 2022
23 25
29
34
24
32
1Q2006
2Q2006
3Q2006
4Q2006
1Q2007
2Q2007
3Q2007
4Q2007
1Q2008
Net profit RWA
• Underlying net profit (154m), down 11% q/q, up 3% y/y• Contribution of Czech Republic: 95m, Slovakia: 14m, Hungary: 40m, Poland: 31m, Russia: 6m,
-33m for the remainder (incl. funding costs)• Impact of ABS/CDO MtM: -28m pre-tax, -21m after-tax (in 4Q 07: -29m, -21m respectively)• For the region as a whole, banking profit up 27% y/y, while insurance results down to -7m due
to non-recurring factors, such as:• Changes in life insurance deficiency reserves in Czech Republic (11m q/q, 36m y/y)• First-time consolidation adjustments of DZI Insurance, Bulgaria
in m euros
in bn euros
Business Unit CEE R

43
3.08%3.04%3.04%3.03%2.98%3.09%
2.93%2.90%
3.13%
1Q2006
2Q2006
3Q2006
4Q2006
1Q2007
2Q2007
3Q2007
4Q2007
1Q2008
247 236 247271 274 283
319
390361
1Q2006
2Q2006
3Q2006
4Q2006
1Q2007
2Q2007
3Q2007
4Q2007
1Q2008
NII NIM*
• Significant rise in NII (390m, by far the most important income item): up 5% q/q and 21% y/y on an organic basis, essentially thanks to continued robust volume growth throughout the region:• loan volumes: +26%, of which mortgages: +50%, • deposits: +8% (all figures above are organic growth y/y; exchange rate changes excluded)
• NIM up 4bps q/q and 10bps y/y
* Net Interest Margin equals Net Interest Income divided by Total Interest Bearing Assets excl. reverse repos
in m euros
Business Unit CEE R (2)

44
7,8 7,99,2 10,0
11,112,4
13,6
10,6
13,0
1Q2006
2Q2006
3Q2006
4Q2006
1Q2007
2Q2007
3Q2007
4Q2007
1Q2008
102 106 105 113 109 118 116 129
-27 -29 -29 -30 -34 -34 -34-53
129
-47
1Q2006
2Q2006
3Q2006
4Q2006
1Q2007
2Q2007
3Q2007
4Q2007
1Q2008
Banking Insurance
F&C AUM
• Net F&C stood at 76m, as a result of:• F&C received (banking) down 1% q/q, up 5% y/y on a comparable basis • Increased commissions paid to insurance agents (organically: +11% q/q and +26% y/y),
resulting from higher sales• AUM up 2% q/q, 20% y/y on an organic basis, half of which thanks to new inflows (10 % points
price effect)
in m euros
in bn euros
Business Unit CEE R (3)

45
Business Unit CEE R (4)
311 328
397
321352 363
406454
302
1Q2006
2Q2006
3Q2006
4Q2006
1Q2007
2Q2007
3Q2007
4Q2007
1Q2008
Operating expenses Impairment
• Operating expenses (406m) down 13% q/q:• 4Q 07 burdened by seasonality and start-up costs for consumer finance in Romania • 1Q 08 benefited from the write-back of a litigation provision in Hungary (impact +13m)
• Costs up 6% y/y, due to wage inflation and costs related to branch openings, among other things• YTD C/I ratio (banking) at 61% (63% in FY 07)• Impairments (39m) up q/q and y/y; 4Q 07 benefited from a retrieval of portfolio-based provisions
(21m) • YTD LLR for the region: 38 bps (26 bps in FY 07)
All figures are in m euros
44
10
64
25 2738 39
1
19
1Q2006
2Q2006
3Q2006
4Q2006
1Q2007
2Q2007
3Q2007
4Q2007
1Q2008

46
Business Unit CEE R (5)
• Deficiency reserves built up to avoid negative consequences of a sustained decline in interest rates on long-term Life insurance liabilities
• Reserves set primarily for those products that are most susceptible to interest rate risk (i.e. guaranteed rate insurance products)
• Liabilities are re-invested in bonds, valued at market value• Volatility between value changes in the asset side (FV book) and liability side (reserves)
caused by valuing asset side on bond yield curve, but liabilities on swap yield curve
3 26
32
6 6-9-34 -27 -5
1Q 2007 2Q 2007 3Q 2007 4Q 2007 1Q 2008Change in liability side (Deficiency reserves) Change in asset side (FV book)
Changes in Life insurance deficiency reserves, CEE R
47
789
668
522
773715
544
346
696583
1Q2006
2Q2006
3Q2006
4Q2006
1Q2007
2Q2007
3Q2007
4Q2007
1Q2008
153 135 130 108
13032
26107
113112
-81
143156120168 129
1050
1Q2006
2Q2006
3Q2006
4Q2006
1Q2007
2Q2007
3Q2007
4Q2007
1Q2008
Investment banking
Commercial banking
Net profit Total IncomeAll figures are in m euros
Business Unit Merchant Banking
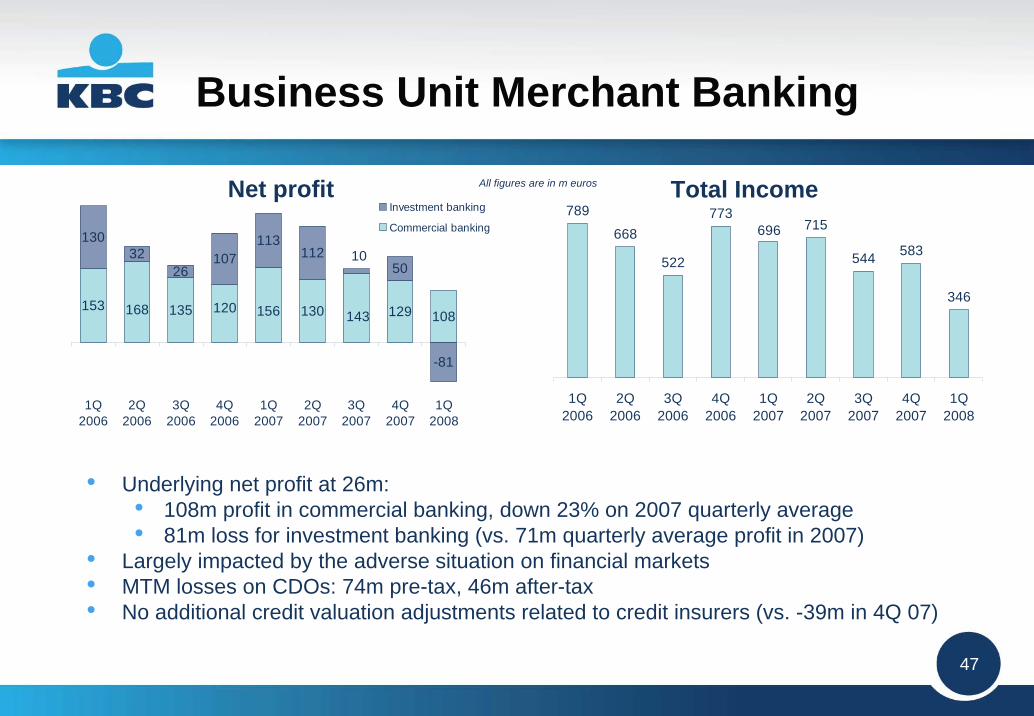
• Underlying net profit at 26m:• 108m profit in commercial banking, down 23% on 2007 quarterly average• 81m loss for investment banking (vs. 71m quarterly average profit in 2007)
• Largely impacted by the adverse situation on financial markets• MTM losses on CDOs: 74m pre-tax, 46m after-tax• No additional credit valuation adjustments related to credit insurers (vs. -39m in 4Q 07)

48
208245
284 279 273 277249
275 279
1Q2006
2Q2006
3Q2006
4Q2006
1Q2007
2Q2007
3Q2007
4Q2007
1Q2008
5545 50 51 54
4548 53 54
1Q2006
2Q2006
3Q2006
4Q2006
1Q2007
2Q2007
3Q2007
4Q2007
1Q2008
RWA (Commercial banking) NII (Commercial banking)
• NII (249m, related to commercial banking) up 4% q/q and 5% y/y, disregarding the negative impact of a methodological change in the booking of lease finance and ALM derivatives (-40m per quarter, recurring as of now)
• RWA of commercial banking down 1% q/q, not on account of strains in funding, but due to ensuring an adequate risk-return level in light of a possible global economic slowdown
in bn eurosin m euros
Business Unit Merchant Banking (2)
Impact of change in methodology(40m)

49
340
180132
294 288
87
-17
278
165
1Q2006
2Q2006
3Q2006
4Q2006
1Q2007
2Q2007
3Q2007
4Q2007
1Q2008
79105
85 76
28
96121
9673
1Q2006
2Q2006
3Q2006
4Q2006
1Q2007
2Q2007
3Q2007
4Q2007
1Q2008
F&C FV gains (Investment banking)in m euros
All figures are in m euros
Business Unit Merchant Banking (3)
• Net F&C (79m) down 25% q/q due to lower equity brokerage and corporate finance activities;slightly up y/y
• Negative 32m Fair Value income (commercial banking: -16m, investment banking: -17m)contains, amongst others:• 74m negative value adjustments on CDO/ABSs (pre-tax, 63m in 4Q 07, nil in 1Q 07)• Weak sales and trading performance• Higher funding costs

50
17
212
199 5
22
5-33
1Q2006
2Q2006
3Q2006
4Q2006
1Q2007
2Q2007
3Q2007
4Q2007
1Q2008
295313336
299242
357311
367322
1Q2006
2Q2006
3Q2006
4Q2006
1Q2007
2Q2007
3Q2007
4Q2007
1Q2008
Operating expenses Impairment
• Significant improvement in operating expenses (295m), both q/q and y/y, predominantly related to lower profit-related remuneration
• More significant drop in income than costs resulted in an 85% C/I ratio (53% in FY 07)• Net retrieval of loan loss impairments (13m)• Due to deteriorated market situation, AFS-assets related impairment 17m (48m in 4Q 07, 1m in
1Q 07) • YTD LLR: zero (2 bps in FY 07)
All figures are in m euros
Business Unit Merchant Banking (4)

51
43
57
44
55
4452
3844 41
1Q2006
2Q2006
3Q2006
4Q2006
1Q2007
2Q2007
3Q2007
4Q2007
1Q2008
Net profit AUM
• Underlying net profit (43m) up 5% q/q, down 17% y/y• YTD return on allocated capital at 29% (33 % in FY 07)• AUM (51bn) down 6% q/q, and 7% y/y:
• negative price effect both q/q and y/y (-4%, -12% respectively)• net new inflow: 1% y/y, 0.3% q/q• the drop was most outspoken in the non-core, low-yielding assets - in line with expectations• +2.4% q/q and +4% y/y net inflows of on-shore private banking (total: 24 bn)
in m euros
In bn euros
Business Unit Private Banking
54 52 53 55 58 5651
56 54
1Q2006
2Q2006
3Q2006
4Q2006
1Q2007
2Q2007
3Q2007
4Q2007
1Q2008

52
107119104
135116121111
132112
1Q2006
2Q2006
3Q2006
4Q2006
1Q2007
2Q2007
3Q2007
4Q2007
1Q2008
F&C Operating expenses
• The unfavorable market circumstances were predominantly reflected in net F&C (107m), down both q/q (-4%) and y/y (-12%)
• Expenses (95 m) down 26% q/q and 23% y/y, included a 19m write-back of a redundant early-retirement provision. Excluding this item expenses down 8% y/y and 11% q/q
• C/I at 65% (78% excluding provision take-back) • MtM adjustment re CDOs at -10m, pre-tax (-7m, after-tax)
All figures are in m euros
Business Unit Private Banking (2)
147 144
118127
115 120
95
124 128
1Q2006
2Q2006
3Q2006
4Q2006
1Q2007
2Q2007
3Q2007
4Q2007
1Q2008

53
Structuredcredit exposure

54
Manageable impact of subprime assets
• No material change since YE-07 as to size and composition of exposure• No actual losses, but 527m MtM impact on P/L and B/S over the last 3 quarters (306m and
221m, before tax respectively of which 141m and 91m in 1Q 2008)• Updated stress test results as at 31 March 2008:
effective subprime loss at pre-tax 133m assuming 20% net loss on subprime content (vs. 171m as tested per 31-Dec-2007, thanks to asset-substitution)pre-tax 209m loss assuming 25% net loss on subprime content
31 March 2008 Portfoliototal
(euros)
Asset type AAA-rated AAA/AA-rated
Allocation to subprime
RMBS
13%
32%
Other portfolios 7.4 bn Mostly European ABS/CDO without subprime assets
94% 98% 0%
Total 16.0 bn All 92% 98% 10%
99%
96%
88%
96%
Corporate CDO notes with limited ABS underlying
US ABS of former KBC conduit “Atomium”
6.9 bn
1.7 bn
Main CDO portfolio
“Atomium”portfolio

55
Earnings impact, detailed overview
No impairment (no actual losses); however, a negative impact:• on net profit (P&L) due to the marking-to-market of synthetic CDOs and a MBS
portfolio qualified as held-for-trading and the provisioning for the counterparty risk forthe credit insurance received for CDOs
• on shareholder’s equity (B/S) due to the marking-to-market of all other ABS/CDO positions
P&L impact Impairmentloss (P&L)
Mark-to-marketvalue
adjustment(P&L)
Credit insurers’ risk
provision(P&L)
Post-taxP&L impact
( P&L)
Pre-taximpact on
equity(B/S)
-39 m -49 m-81 m
FY 07 Nil -165 m -39 m -109 m -130 m -88 m
1Q 08 Nil -141 m - -93 m -91 m -61 m
April 2008 Nil +39 m - +26 m -13 m -9 m
-70 m
Post-taximpact on
equity(B/S)
-51 m -38 m-51 m-114 m
3Q 07 Nil -4Q 07 Nil -39 m

56
Manageable impact of subprime (2)
A combination of factors explains KBC’s low subprime risk vs. peers:
1. Limited size of subprime portion (only 10% of total ABS/CDO portfolio)
2. High “attachment points” of CDO notes , allowing substantial losses of underlying assets before being impacted (avg. attachment point 17%)
3. Active management of CDOs held, allowing asset substitution
4. Low quality pieces of CDOs (equity/junior) completely “provisioned”(i.e. not recognised in profit) at the time of issue in the amount of 750m euros
5. Hedges are in place (via short positions, not with monolines) and offset somewhat the MtM volatility of CDOs
DO NOT COMPARE APPLES WITH ORANGES!
Reminder:

57
Solvencysituation

58
Capital position
• KBC intends to keep its Tier-1 banking capital level at >8% (and >200% solvency margin, insurance)
• At the end of 1Q 2008, the capital was in excess of that level in the amount of 0.2bn euros
0.6 bn0.1 bn0.6 bnOther group subsidiaries
-0.3 bn
-
0.2 bn
Excess
1.7 bnInsurance (excl. AFS)
12.4 bn12.4 bnBanking (Basel I)
14.5 bn14.7 bn
RequiredAvailableCapital position,
31 March 2008
2.0 bn
Total, Group (Basel I)
Total, Group (Basel II) 14.1 bn 13.0 bn 1.1 bn
Impact Basel II -0.6 bn -1.5 bn 0.9 bn

59
Excess capital position
0.20.4
0.70.8
1.61.6
3.1
2.3
2.8
3.3
4Q05 1Q06 2Q06 3Q06 4Q06 1Q07 2Q07 3Q07 4Q07 1Q08
Basel II effect: +0.9 bn
• The excess capital has been largely put at work or returned to shareholders:RWA growth 1Q06 -1Q 08 1Q: +33% (3.1 bn extra capital required) Total amount of acquisitions 1Q 06 -1Q08: 2.5 bnShare buyback 1Q06 – 1Q08: 2.2 bn
• Gearing ratio stood at 100.03% by the end of 1Q 08
Capital in excess of 8% banking Tier-1and 200% insurance solvency(according to the Basel I banking and Solvency I insurance capital adequancy
frameworks)

60
Evolution of revaluation reserves
616
581807
754825
357
348144
70
-271 -217 -389 -386 -460
1 733 4221 2001 4341 6371 824 765 829 1 154 1 304 1 5881 312 157
40
1Q2005
2Q2005
3Q2005
4Q2005
1Q2006
2Q2006
3Q2006
4Q2006
1Q2007
2Q2007
3Q2007
4Q2007
1Q2008
Apr-08
For bondsFor shares
1 346
1 636
1 9082 129
514
1 352
1 936 1 968
1 707 1 462
1 217
811
36157
• The adverse market environment has had a significant impact on the revaluationreserves, and hence, on the solvency of the insurance business in 1Q 08

61
Suspension of share buyback
• Share buyback programme temporarily suspended as of today, 15 May 2008, motivated by:
Uncertain market outlook period still appliesTalk of increased capital requirements by both regulators and rating agencies
• Share buyback has always been communicated as subordinated to better growth alternatives:
continued expansion in organic RWA-growthPossible additional acquisition opportunities

62
Wrap up

63
Wrap Up
• Encouraging volume trends across the board
• Solid underlying performance in CEE banking, testifying to the region’s role as a growth-driver for the group
• Difficult market environment weighed on trading and asset management operations
• Limited markdowns of our structured credit investments portfolio. P&L impact: 93m euros, impact on equity: 61 m (after-tax)
• The second quarter up to now has shown a strong performance, even in reference to the record 2Q 07 levels
• Solvency remained robust, but just to be cautious the share buyback has been temporarily suspended so as to ideally position KBC for growth from a position of strength
64

65
Annex

66
Annex: earnings impact per Business Unit
ABS / CDO MtM Belgium CEE RMerchant Banking
Private Banking
Group Centre
KBC Group consolidated
Pre-tax 3Q 2007 -8 -16 -22 -6 - -514Q 2007 -25 -13 -63 -13 - -114FY 2007 -33 -29 -85 -18 - -1651Q 2008 -29 -28 -74 -10 - -141
After-tax 3Q 2007 -6 -12 -17 -4 - -394Q 2007 -17 -10 -35 -9 - -70FY 2007 -22 -22 -52 -13 - -1091Q 2008 -19 -21 -46 -7 - -93
CDO credit value adjustments (related to monoline insurers)Pre-tax FY 2007 - - -39 - - -39
1Q 2008 - - - - - - After-tax FY 2007 - - 23 - - - -23
1Q 2008 - - - - - -