introduction to roofit...4 introduction to roofit institut für kernphysik, kit principles of...
TRANSCRIPT

KIT – Universität des Landes Baden-Württemberg undnationales Forschungszentrum in der Helmholtz-Gemeinschaft
Lukas Hehn, Institut für Kernphysik, KIT
www.kit.edu
Introduction to RooFitLukas HehnKSETA PhD Workshop Freudenstadt, October 16th to 18th 2003

Institut für Kernphysik, KIT2 Introduction to RooFit
RooFit ...
… is a library which provides a toolkit for data analysis
… is included in ROOT framework
… is used to model expected event distributions in physics analysis
… can perform (un)binned maximum likelihood fits, produce plots and study goodness-of-fit with toy Monte Carlo samples
… was originally developed for the BaBar collaboration @ Stanford Linear Accelerator Center
To use RooFit in ROOT CINT
Load library as:gSystem->Load("libRooFit") ;using namespace RooFit ;
OR
Load prepared macro file.x path-to-file

Institut für Kernphysik, KIT3 Introduction to RooFit
RooFit & ROOT
RooFit library comes with and depends on ROOT

Institut für Kernphysik, KIT4 Introduction to RooFit
Principles of maximum likelihood estimation
you have a data set D(x) with observables x (i.e. x & y or Energy & time)
possible to construct an estimator: Likelihood function L
with probability density function (PDF) F:
best fit parameters p given by maximizing likelihood L orminimizing negative log likelihood (NLL)
estimator of the parameter variance:
L( p⃗)=∏ F ( p⃗ , x⃗n)⋅Poisson (N exp , N obs)n=0
N
∫ F ( x⃗ ; p⃗)d x⃗≡1, F ( x⃗ ; p⃗)>0
d ln L( p⃗)d p⃗
=0p= p̂
−ln L( p±σ)=−ln Lmin+0.5
(for extended ML only)
neg
ativ
e lo
g li
kelih
oo
d
parameter p
σupper
σlower

Institut für Kernphysik, KIT5 Introduction to RooFit
Principle of RooFit
you define everything with RooFit classes:
your PDF-model
your data and its observables
the parameter in your PDF you want to fit (and all other parameters)
the likelihood function you want to minimize

Institut für Kernphysik, KIT6 Introduction to RooFit
Available documentation
Official Websites
http://root.cern.ch/drupal/content/roofit
http://roofit.sourceforge.net/
Class documentation:http://root.cern.ch/root/html/ROOFIT_ROOFITCORE_Index.html
Tutorial macros (83)
http://root.cern.ch/root/html/tutorials/roofit/index.html
$ROOTSYS/tutorials/roofit
User Manual 134 pages from 2008
Conference Talk: Strasbourg School of Statistics 2008 (200 slides)http://dx.doi.org/10.1051/epjconf/20100402005
Conference Procedings:Wouter Verkerke, David Kirkby: “The RooFit toolkit for data modeling”(arXiv:0306116)
Quick Start Guide: 24 pages from 2009 http://root.cern.ch/drupal/sites/default/files/roofit_quickstart_3.00.pdf

Institut für Kernphysik, KIT7 Introduction to RooFit
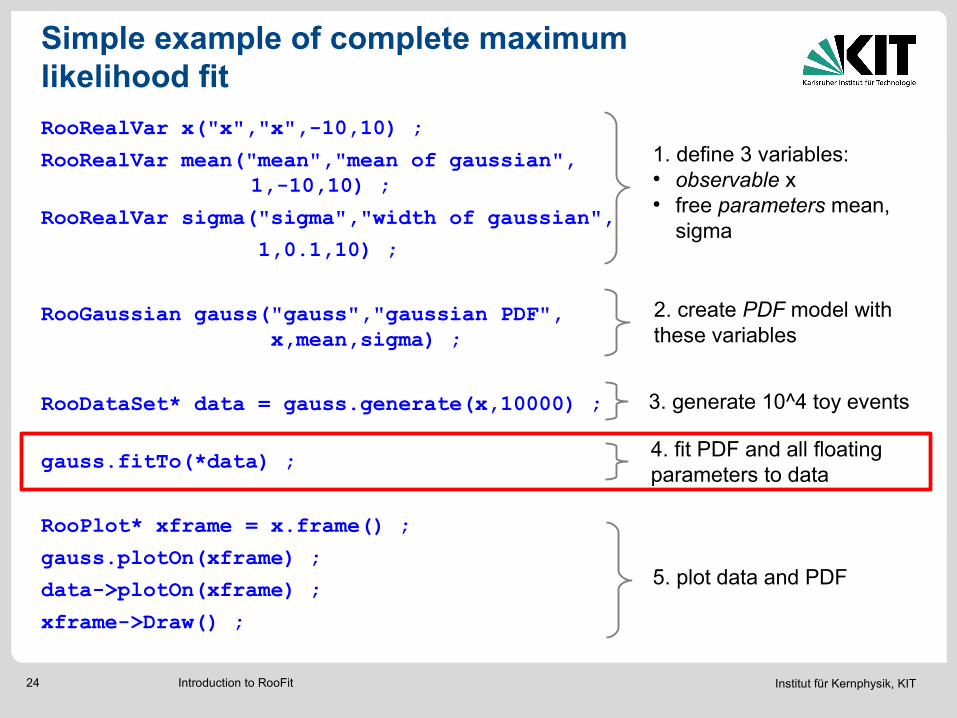
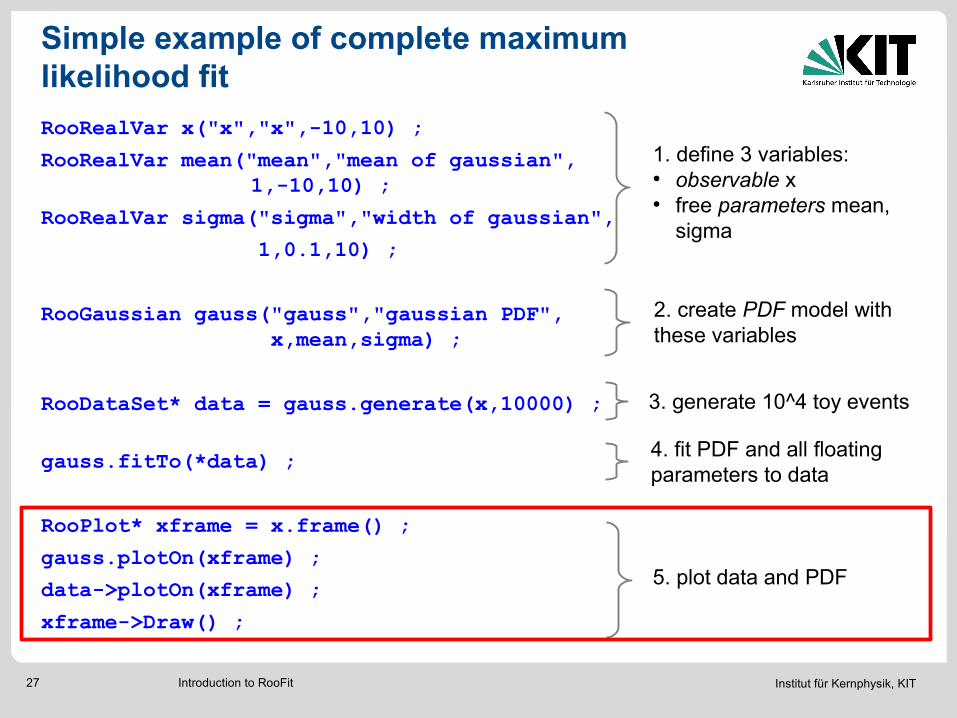
Simple example of complete maximum likelihood fit
RooRealVar x("x","x",-10,10) ;
RooRealVar mean("mean","mean of gaussian", 1,-10,10) ;
RooRealVar sigma("sigma","width of gaussian",
1,0.1,10) ;
RooGaussian gauss("gauss","gaussian PDF", x,mean,sigma) ;
RooDataSet* data = gauss.generate(x,10000) ;
gauss.fitTo(*data) ;
RooPlot* xframe = x.frame() ;
gauss.plotOn(xframe) ;
data->plotOn(xframe) ;
xframe->Draw() ;
1. define 3 variables:● observable x● free parameters mean,
sigma
5. plot data and PDF
3. generate 10^4 toy events
2. create PDF model with thesevariables
4. fit PDF and all floatingparameters to data

Institut für Kernphysik, KIT8 Introduction to RooFit
Tutorial macro rf101_basics.C

Institut für Kernphysik, KIT9 Introduction to RooFit
Simple example of complete maximum likelihood fit
RooRealVar x("x","x",-10,10) ;
RooRealVar mean("mean","mean of gaussian", 1,-10,10) ;
RooRealVar sigma("sigma","width of gaussian",
1,0.1,10) ;
RooGaussian gauss("gauss","gaussian PDF", x,mean,sigma) ;
RooDataSet* data = gauss.generate(x,10000) ;
gauss.fitTo(*data) ;
RooPlot* xframe = x.frame() ;
gauss.plotOn(xframe) ;
data->plotOn(xframe) ;
xframe->Draw() ;
1. define 3 variables:● observable x● free parameters mean,
sigma
5. plot data and PDF
3. generate 10^4 toy events
2. create PDF model withthese variables
4. fit PDF and all floatingparameters to data

Institut für Kernphysik, KIT10 Introduction to RooFit
1. Defining variables
variables are defined as
RooRealVar(“name”, “title”, value, minValue, maxValue, “unit”)
observables (i.e. x, y, energy, time) and parameters of a PDF (i.e. mean, sigma, slope) are both variables→ the data set “tells” a PDF what it's observable is→ all other variables must be parameters
when fitting a PDF model to data: all free floating (= not fixed) parameters are fitted
you can later on define and exclude a parameter from being fitted by the methodRooRealVar.setValue(value) and RooRealVar.setConstant()
construct flexible variable:RooFormulaVar mean_shifted(“mean_shifted”,”@0+@1”,RooArgList(mean,shift))
construct with either a fixed value / or a range / or starting value + range
RooRealVar'sROOT TFormula expression

Institut für Kernphysik, KIT11 Introduction to RooFit
Simple example of complete maximum likelihood fit
RooRealVar x("x","x",-10,10) ;
RooRealVar mean("mean","mean of gaussian", 1,-10,10) ;
RooRealVar sigma("sigma","width of gaussian",
1,0.1,10) ;
RooGaussian gauss("gauss","gaussian PDF", x,mean,sigma) ;
RooDataSet* data = gauss.generate(x,10000) ;
gauss.fitTo(*data) ;
RooPlot* xframe = x.frame() ;
gauss.plotOn(xframe) ;
data->plotOn(xframe) ;
xframe->Draw() ;
1. define 3 variables:● observable x● free parameters mean,
sigma
5. plot data and PDF
3. generate 10^4 toy events
2. create PDF model withthese variables
4. fit PDF and all floatingparameters to data

Institut für Kernphysik, KIT12 Introduction to RooFit
2. About PDFs
construction of PDF is one of the most important steps
bad PDF → bad fit
the PDF contains the parameters which are fitted:this can either be parameters defining the shape of a PDF (like decay constant, Gaussian width, …) or often fractions of different PDF components (i.e. signal vs. background component)
PDFs are automatically normalized within RooFit

Institut für Kernphysik, KIT13 Introduction to RooFit
Build in PDFs
~20 predefined PDFs to build models from
Basic functions:
RooGaussian: normal Gaussian
RooBifurGauss: different width on low and high side of mean
RooExponential: standard exponential decay
RooPolynomial: standard polynoms
RooChebychev: Chebychev polynomials (recommended because of higher fit stability due to little correlation)
RooPoisson: Poisson distribution
Physics inspired functions:
Landau (RooLandau), Breit-Wigner, Crystal Ball, …
Specialized functions for B physics:
Decay distributions with mixing, CP violation, …
all one parameter less than normal because for a PDF→ integral != 1

Institut für Kernphysik, KIT14 Introduction to RooFit
More on PDFs
Other non-parametric functions:
RooHistPdf: from external ROOT histogram, optional interpolation for smoothing
RooKeysPdf: Kernel estimation, superposition of Gaussians on external unbinned data
Writing your own PDF class
from a formula expression:RooGenericPdf gp(“gp”,”Generic PDF”,”exp(x*y+a)-b*x”, RooArgSet(x,y,a,b)) ;
RooClassFactory to write and compile own C++ code for PDFs

Institut für Kernphysik, KIT15 Introduction to RooFit
Composite PDF models
realistic models are often a sum of multiple PDFs, i.e.Gaussian signal + flat background
class RooAddPdf adds N PDFs with (N-1) RooRealVar fraction coefficients
caveat: total PDF can become negative in some cases!
all methods work normally on such a PDF (fitTo(), plotOn(), ...)
exemplary tree view of such a PDF

Institut für Kernphysik, KIT16 Introduction to RooFit
Tutorial macro rf201_composite.C

Institut für Kernphysik, KIT17 Introduction to RooFit
Convoluting PDFs
typical for experiments: expected observable behaviour (physics) is smeared with a (Gaussian) resolution function (detector)→ convolution of 2 different PDFs
RooFit offers several different methods to achieve this:
RooNumConv: brute force numeric convolution
RooFFTConvPdf: convolution based on fast fourier transformation (FFT)
(other predefined particle physics convolutions)

Institut für Kernphysik, KIT18 Introduction to RooFit
Multidimensional PDF models
replace parameter in 1D PDF with another PDF in another observable:
create model for more than 1 Observable (i.e. energy & time, x & y) with RooProdPdf class
with RooGenericPdf gp(“gp”,”sqrt(x+y)*sqrt(x-y)”,RooArSet(x,y)) ;

Institut für Kernphysik, KIT19 Introduction to RooFit
Tutorial macro rf301_composition.C

Institut für Kernphysik, KIT20 Introduction to RooFit
Simple example of complete maximum likelihood fit
RooRealVar x("x","x",-10,10) ;
RooRealVar mean("mean","mean of gaussian", 1,-10,10) ;
RooRealVar sigma("sigma","width of gaussian",
1,0.1,10) ;
RooGaussian gauss("gauss","gaussian PDF", x,mean,sigma) ;
RooDataSet* data = gauss.generate(x,10000) ;
gauss.fitTo(*data) ;
RooPlot* xframe = x.frame() ;
gauss.plotOn(xframe) ;
data->plotOn(xframe) ;
xframe->Draw() ;
1. define 3 variables:● observable x● free parameters mean,
sigma
5. plot data and PDF
3. generate 10^4 toy events
2. create PDF model withthese variables
4. fit PDF and all floatingparameters to data
Institut für Kernphysik, KIT21 Introduction to RooFit
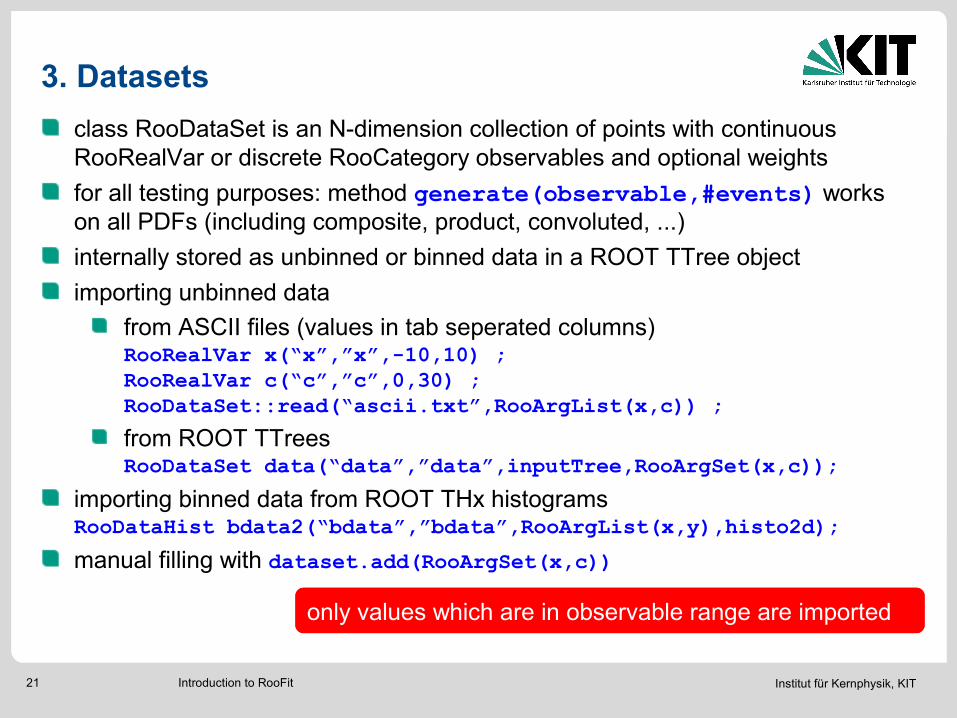
3. Datasets
class RooDataSet is an N-dimension collection of points with continuous RooRealVar or discrete RooCategory observables and optional weights
for all testing purposes: method generate(observable,#events) works on all PDFs (including composite, product, convoluted, ...)
internally stored as unbinned or binned data in a ROOT TTree object
importing unbinned data
from ASCII files (values in tab seperated columns)RooRealVar x(“x”,”x”,-10,10) ;RooRealVar c(“c”,”c”,0,30) ; RooDataSet::read(“ascii.txt”,RooArgList(x,c)) ;
from ROOT TTreesRooDataSet data(“data”,”data”,inputTree,RooArgSet(x,c));
importing binned data from ROOT THx histogramsRooDataHist bdata2(“bdata”,”bdata”,RooArgList(x,y),histo2d);
manual filling with dataset.add(RooArgSet(x,c))
only values which are in observable range are importedonly values which are in observable range are imported

Institut für Kernphysik, KIT22 Introduction to RooFit
Operations on unbinned data sets
Appending:d1.append(d2)
Reducingi.e. RooDataSet* d2 = d1.reduce(RooArgSet(x,y));
Merging:d1.merge(d2)

Institut für Kernphysik, KIT23 Introduction to RooFit
Tutorial macro rf102_dataimport.C
Institut für Kernphysik, KIT24 Introduction to RooFit
Simple example of complete maximum likelihood fit
RooRealVar x("x","x",-10,10) ;
RooRealVar mean("mean","mean of gaussian", 1,-10,10) ;
RooRealVar sigma("sigma","width of gaussian",
1,0.1,10) ;
RooGaussian gauss("gauss","gaussian PDF", x,mean,sigma) ;
RooDataSet* data = gauss.generate(x,10000) ;
gauss.fitTo(*data) ;
RooPlot* xframe = x.frame() ;
gauss.plotOn(xframe) ;
data->plotOn(xframe) ;
xframe->Draw() ;
1. define 3 variables:● observable x● free parameters mean,
sigma
5. plot data and PDF
3. generate 10^4 toy events
2. create PDF model withthese variables
4. fit PDF and all floatingparameters to data
Institut für Kernphysik, KIT25 Introduction to RooFit
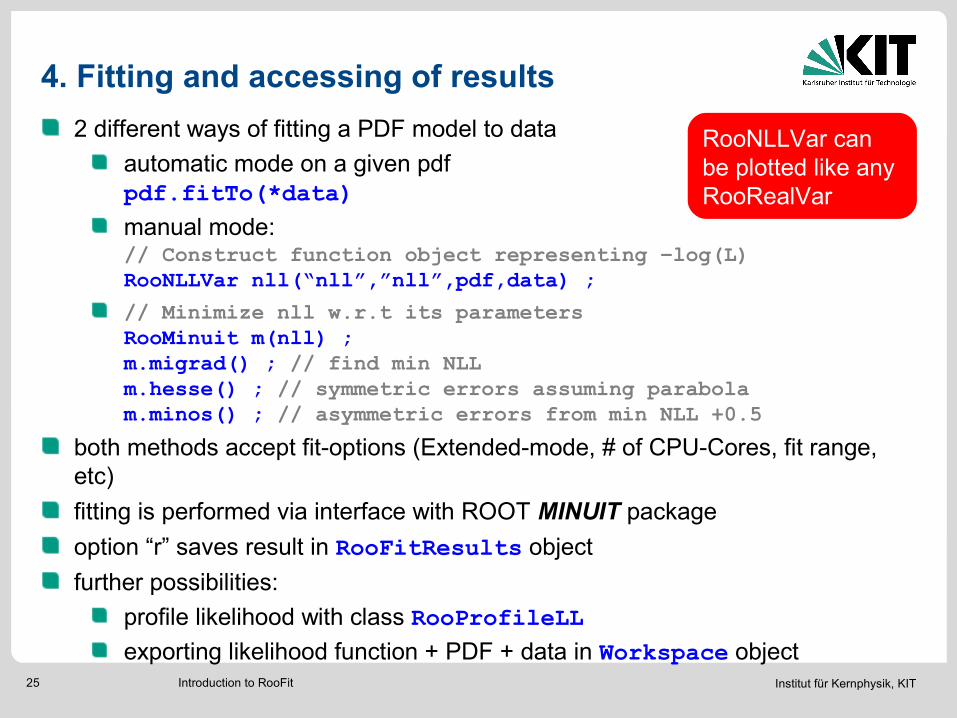
4. Fitting and accessing of results
2 different ways of fitting a PDF model to data
automatic mode on a given pdfpdf.fitTo(*data)
manual mode:// Construct function object representing –log(L)RooNLLVar nll(“nll”,”nll”,pdf,data) ;
// Minimize nll w.r.t its parameters RooMinuit m(nll) ;m.migrad() ; // find min NLL m.hesse() ; // symmetric errors assuming parabolam.minos() ; // asymmetric errors from min NLL +0.5
both methods accept fit-options (Extended-mode, # of CPU-Cores, fit range, etc)
fitting is performed via interface with ROOT MINUIT package
option “r” saves result in RooFitResults object
further possibilities:
profile likelihood with class RooProfileLL
exporting likelihood function + PDF + data in Workspace object
RooNLLVar can be plotted like any RooRealVar

Institut für Kernphysik, KIT26 Introduction to RooFit
Exemplary fit outputprogressinformation
error &correlation matrix
status, distance tominimum (EDM)fit values and errors
min NLL
Institut für Kernphysik, KIT27 Introduction to RooFit
Simple example of complete maximum likelihood fit
RooRealVar x("x","x",-10,10) ;
RooRealVar mean("mean","mean of gaussian", 1,-10,10) ;
RooRealVar sigma("sigma","width of gaussian",
1,0.1,10) ;
RooGaussian gauss("gauss","gaussian PDF", x,mean,sigma) ;
RooDataSet* data = gauss.generate(x,10000) ;
gauss.fitTo(*data) ;
RooPlot* xframe = x.frame() ;
gauss.plotOn(xframe) ;
data->plotOn(xframe) ;
xframe->Draw() ;
1. define 3 variables:● observable x● free parameters mean,
sigma
5. plot data and PDF
3. generate 10^4 toy events
2. create PDF model withthese variables
4. fit PDF and all floatingparameters to data

Institut für Kernphysik, KIT28 Introduction to RooFit
5. Plotting
first: create empty RooPlot frame for an observable (i.e. “x”)
an unbinned dataset is automatically shown as binned histogram when drawn on the frame with data->plotOn()
customizeable with Binning(int nbins, double xlo, double xhi)
Markerstyle/color/width etc can of course be changed too
PDF drawn with pdf.plotOn()
gets automatically normalized to data set
gets automatically projected over all other observables if necessary
RooPlot-frames can hold any other ROOT drawable objects (arrows, text boxes, …): i.e. xframe.addObject(TArrow)
useful information about PDF an data:pdf.paramOn(xframe,data) ;data.statOn(xframe) ;
further possibilities: plot small slice or larger range of a data set and a PDF
for >1D PDFs & data: createHistogram() method gives a ROOT TH2/TH3

Institut für Kernphysik, KIT29 Introduction to RooFit
Tutorial macrosrf106_plotdecoration.C, rf107_plotstyles.C

Institut für Kernphysik, KIT30 Introduction to RooFit
Simple example of complete maximum likelihood fit
RooRealVar x("x","x",-10,10) ;
RooRealVar mean("mean","mean of gaussian", 1,-10,10) ;
RooRealVar sigma("sigma","width of gaussian",
1,0.1,10) ;
RooGaussian gauss("gauss","gaussian PDF", x,mean,sigma) ;
RooDataSet* data = gauss.generate(x,10000) ;
gauss.fitTo(*data) ;
RooPlot* xframe = x.frame() ;
gauss.plotOn(xframe) ;
data->plotOn(xframe) ;
xframe->Draw() ;
1. define 3 variables:● observable x● free parameters mean,
sigma
5. plot data and PDF
3. generate 10^4 toy events
2. create PDF model withthese variables
4. fit PDF and all floatingparameters to data
goodness-of-fit test

Institut für Kernphysik, KIT31 Introduction to RooFit
Testing the Goodness-of-fit (1)
How do you know if your fit was good?
for 1-D fit:
calculate χ²/d.o.f. of a curve w.r.t. data:frame->chiSquare()
make pull and residual histogram:frame->makePullHist() ;frame->makeResidHist() ;

Institut für Kernphysik, KIT32 Introduction to RooFit
Tutorial macro rf109_chi2residpull

Institut für Kernphysik, KIT33 Introduction to RooFit
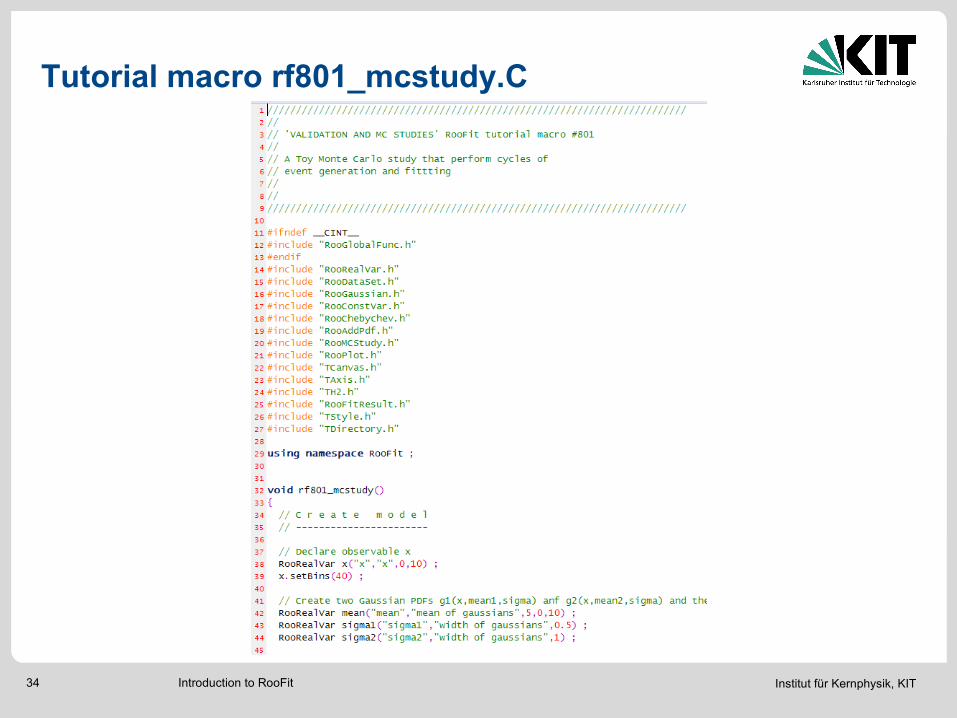
Testing the Goodness-of-fit (2)
for > 1-D: toy Monte Carlo study using class RooMCstudy// Instantiate MC study manager
RooMCStudy mgr(inputModel) ;
// Generate and fit 100 samples of 1000 events
mgr.generateAndFit(100,1000) ;
// Plot distribution of sigma parameter
mgr.plotParam(sigma)->Draw()
principle:
Institut für Kernphysik, KIT34 Introduction to RooFit
Tutorial macro rf801_mcstudy.C
Institut für Kernphysik, KIT35 Introduction to RooFit
Some examples of how I use RooFit

Institut für Kernphysik, KIT36 Introduction to RooFit
PDF for γ-background in EDELWEISS detectorTotal PDFRooAddPdf
Flat partRooHistPdf
Peak 1RooProdPdf
Peak 2RooProdPdf
Peak 3RooProdPdf + ….
Gauss in Eion
RooGaussianGauss in E
rec
RooGaussian
sigma Eion
RooRealVarsigma E
rec
RooRealVar
pos. in Eion
RooRealVarpos. in E
rec
RooFormulaVar

Institut für Kernphysik, KIT37 Introduction to RooFit
Fit of real data to background and signal

Institut für Kernphysik, KIT38 Introduction to RooFit
RooFit Summary
RooFit is a powerful tool for maximum likelihood fits
… but the documentation could be better :(
it can be used easily from within ROOT
there are lots of different possibilities to create the PDF describing your data
… in the worst case by importing a root histogram
some difficult tmethods are already implemented and very easy to use at first
(i.e. toy MC statistics)
not shown in this introduction: short comings and pitfalls of RooFit (how to
interpret goodness-of-fit for small signal/noise ratio, convolution in >1D, ...)