introduction_to_rcm
TRANSCRIPT

M. Rausand and J. Vatn. Reliability Centered Maintenance. In C. G. Soares, editor, Risk and Reliability inMarine Technology. Balkema, Holland, 1998
Reliability Centered Maintenance
6800$5<This report summarizes the main elements of Reliability centered maintenance (RCM). Thepresentation is to a great extent based on the outline of the RCM methodology by Rausand & Vatn(1998). In this presentation we have made effort to include ideas and examples from railwayapplications.
RCM is a method for maintenance planning developed within the aircraft industry and later adapted toseveral other industries and military branches. This report presents a structured approach to RCM, anddiscusses the various steps in the approach. The availability of reliability data and operating experienceis of vital importance for the RCM method. The RCM method provides a means to utilize operatingexperience in a more systematic way. Aspects related to utilization of operating experience are thereforeaddressed specifically. In this paper, RCM is put into a risk analysis framework, taking advantages ofreliability modelling in a more structured way than in more traditional RCM approaches.
7$%/(�2)�&217(17SUMMARY.............................................................................................................................................. 1TABLE OF CONTENT............................................................................................................................ 11 INTRODUCTION ............................................................................................................................. 22 A CONCEPTUAL MODEL FOR RCM ........................................................................................... 23 MAIN STEPS OF AN RCM ANALYSIS......................................................................................... 3
Step 1: Study preparation................................................................................................................. 4Step 2: System selection and definition........................................................................................... 5Step 3: Functional failure analysis (FFA)........................................................................................ 6Step 4: Critical item selection........................................................................................................ 10Step 5: Data collection and analysis .............................................................................................. 12Step 6: Failure modes, effects and criticality analysis................................................................... 14Step 7: Selection of Maintenance Actions..................................................................................... 16Step 8: Determination of Maintenance Intervals ........................................................................... 18Step 9: Preventive maintenance comparison analysis ................................................................... 21Step 10: Treatment of non-MSIs ..................................................................................................... 22Step 11: Implementation.................................................................................................................. 22Step 12: In-service data collection and updating ............................................................................. 22
4 DISCUSSIONS AND CONCLUSIONS ......................................................................................... 23General benefits:.............................................................................................................................. 23Problem areas in the analysis: ......................................................................................................... 24Conclusions: .................................................................................................................................... 25
REFERENCES ....................................................................................................................................... 26
2
���,1752'8&7,21The reliability centered maintenance (RCM)concept has been on the scene for more than 20years, and has been applied with considerablesuccess within the aircraft industry, the militaryforces, the nuclear power industry, and morerecently within the offshore oil and gas industry.Experiences from the use of RCM within theseindustries (see e.g. Sandtorv & Rausand 1991)show significant reductions in preventive main-tenance (PM) costs while maintaining, or evenimproving, the availability of the systems.According to the Electric Power ResearchInstitute (EPRI) RCM is:
“a systematic consideration of systemfunctions, the way functions can fail,and a priority–based consideration ofsafety and economics that identifiesapplicable and effective PM tasks.”
The main focus of RCM is hence on the systemfunctions, and not on the system hardware.
Several textbooks and reports presenting theRCM concept have been published. The mostimportant books are Nowlan and Heap (1978),Moubray (1991), Smith (1993), Anderson &Neri (1990), and Moss (1985). These textbooksprovide a good introduction to RCM, but mostof them are a bit inaccurate regarding stringencyof definitions of the basic concepts. The mainideas presented in these textbooks are more orless the same, but the detailed procedures arerather different.
In all these books there are generally more focuson maintenance than on reliability. The use ofreliability data sources like OREDA (1997) isnot at all emphasized. Smith (1993) states forexample on page 103 that: “. . . , it is the author’sexperience that any introduction of quantitativereliability data or models into the RCM processonly clouds the PM issue and raises credibilityquestions that are of no constructive value”.
The main objective of this paper is to present astructured approach to RCM, and to put morefocus on reliability models and methods in theRCM process.
���$� &21&(378$/� 02'(/� )255&0Most of the available PM models (Valdez-Floresand Feldman 1989) are based on the assumptionthat; (1) only single units are considered, andthat (2) the cost of a single unit failure can easilybe quantified in (discounted) monetary units. InRCM we have to consider the entire PMprogram, i.e. several units simultaneously. It isfurther required to consider failure consequenceswhich cannot be measured directly in monetaryunits. In the present paper, we will split thepossible failure consequences into the followingfour consequence classes:
S: Safety of personnel
E: Environmental impact
A: Production availability
C: Material losses (costs)
Undesiredevent
C
C
C
:
:
Risk analysis
B
B
B
:
:
M
M
M
:
:
. .M
Barrieres
Fault treeanalysis
Event treeanalysis
Totalloss
. .
1
2
3
3
2
1
k
1
2
3
Figure 1 A conceptual model for RCM based on risk analysis

3
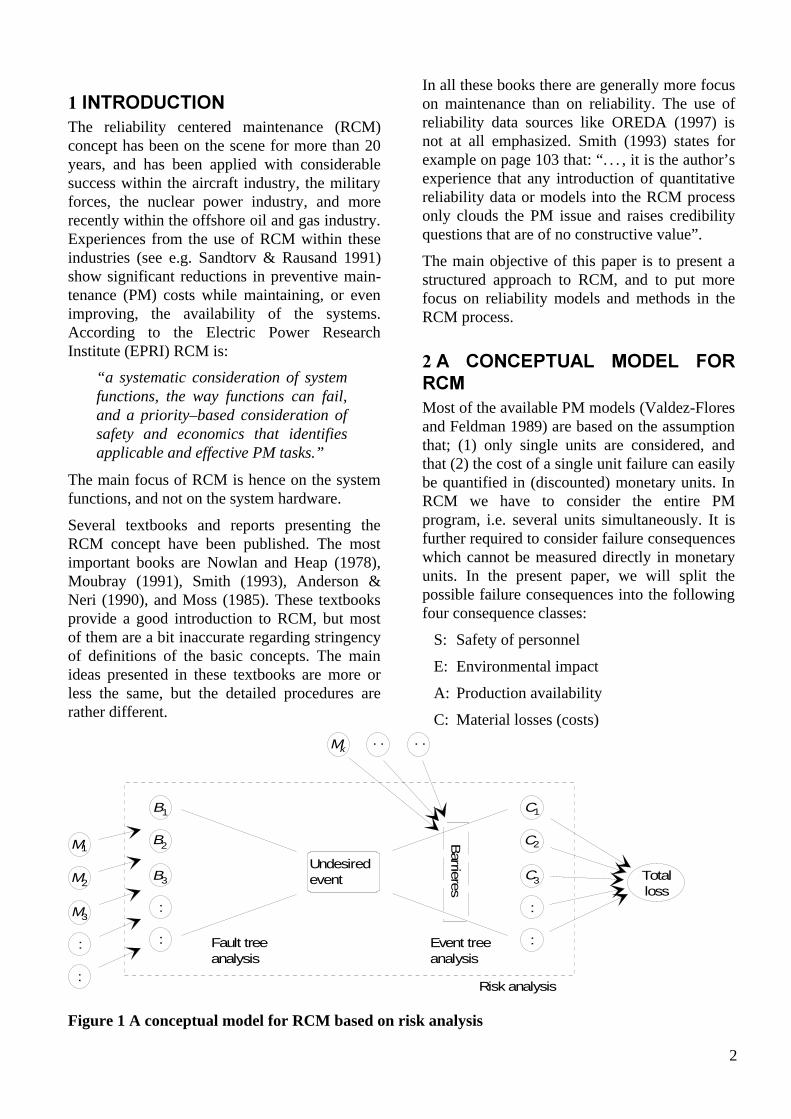
To measure all the consequences in monetaryunits, we have to define economic values of thelife and health of persons, and of differentenvironmental aspects. This is at best a difficultand controversial task. A new conceptual modelfor the RCM approach is illustrated in Figure 1.
This model is based on the ideas presented byVatn et. al (1996). The basis for the newconceptual model is a traditional risk analysis.The risk analysis approach is based on a numberof so–called “undesired events” in the system.An undesired event is typically an outset of apossible accident, for example a gas leakage oran unintended stop of a compressor. In thiscontext the term accident is defined in a verybroad sense, including all events causing a lossrelated to one of the consequence classes definedabove.
An undesired event may be caused by a numberof basic events B1, B2, . . . . The basic events maycomprise failures of technical items, humanerrors, and environmental impacts. The basicevents are often identified and modeled by faulttree analysis.If failure rates and other necessarydata are available for the basic events, the faulttree analysis will provide estimates of thefrequency of occurrence of the various undesiredevents.
The consequences of an undesired event willnormally depend on the barriers that areestablished to prevent escalation of theundesired event. On an oil production plattformthe barriers may comprise emergency shutdown(ESD) systems, pressure relief systems, firewalls, fire fighting systems, etc. The use of twoor more parallell tracks in the railwayinfrastructure can be considered as a barrier toprevent consequence of a turnout failure.Thepossible consequence chains starting from anundesired event are often identified and modeledby event tree analysis, supplemented by variousphysical models, like fire and explosion models.The output of the event tree analysis will be a setof possible consequences C1, C2, . . . . Ifnecessary input data is available for the barriersand physical models, the event tree analysis willprovide frequencies or probabilities of thevarious consequences. In order to build modelsfor railway applications a key element will be to
know the time table, the configuration of the lineetc.
By analyzing all the undesired events in this waywe will in principle end up with a completeconsequence spectrum for the system, i.e. alisting of all possible consequences togetherwith an estimated frequency of eachconsequence.
A traditional risk analysis stops with theconsequence spectrum. If possible we should,however, combine the effects of theconsequences into a total loss measure (lossfunction). This can in some cases be donewithout too strong controversies.
The system maintenance activities M1, M2, . . .will affect the frequencies of both the basicevents and the barrier failures. An effective PMtask may prevent a failure of a process unit or abarrier (e.g. a safety valve).
On the other hand, failures may also be causedby human or procedural errors duringmaintenance. Experience has shown that manymajor accidents have occurred either duringmaintenance or because of wrongly executedmaintenance.
The overall objective of RCM is to establish PMtasks that are applicable and effective withrespect to the consequence classes definedabove. To be effective, a PM task must thereforeprovide a reduced expected loss related to one ormore of the four consequence classes.
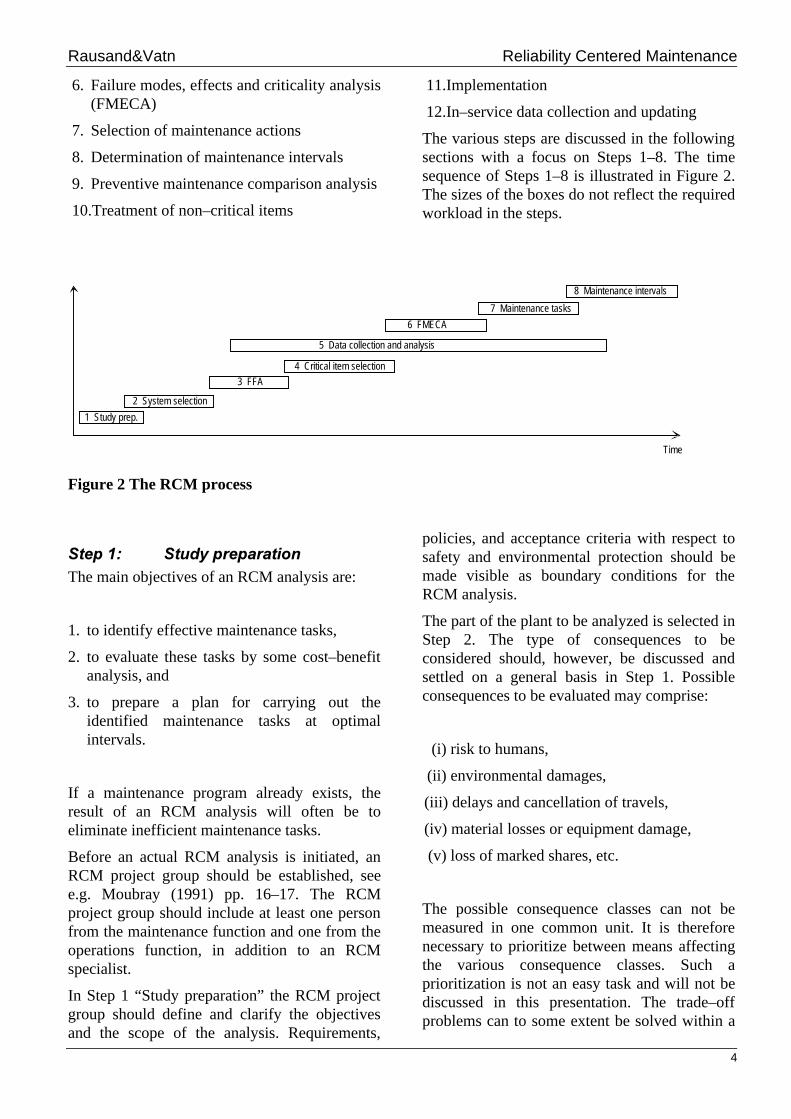
���0$,1� 67(36� 2)� $1� 5&0$1$/<6,6The RCM analysis may be carried out as asequence of activities. Some of these activities,or steps, are overlapping in time, as illustrated inFigure 2. The RCM process comprises thefollowing steps:
1. Study preparation
2. System selection and definition
3. Functional failure analysis (FFA)
4. Critical item selection
5. Data collection and analysis
Rausand&Vatn Reliability Centered Maintenance
4
6. Failure modes, effects and criticality analysis(FMECA)
7. Selection of maintenance actions
8. Determination of maintenance intervals
9. Preventive maintenance comparison analysis
10. Treatment of non–critical items
11. Implementation
12. In–service data collection and updating
The various steps are discussed in the followingsections with a focus on Steps 1–8. The timesequence of Steps 1–8 is illustrated in Figure 2.The sizes of the boxes do not reflect the requiredworkload in the steps.
Time
1 Study prep.
2 System selection
5 Data collection and analysis
4 Critical item selection
6 FMECA
7 Maintenance tasks
8 Maintenance intervals
3 FFA
Figure 2 The RCM process
6WHS��� 6WXG\�SUHSDUDWLRQThe main objectives of an RCM analysis are:
1. to identify effective maintenance tasks,
2. to evaluate these tasks by some cost–benefitanalysis, and
3. to prepare a plan for carrying out theidentified maintenance tasks at optimalintervals.
If a maintenance program already exists, theresult of an RCM analysis will often be toeliminate inefficient maintenance tasks.
Before an actual RCM analysis is initiated, anRCM project group should be established, seee.g. Moubray (1991) pp. 16–17. The RCMproject group should include at least one personfrom the maintenance function and one from theoperations function, in addition to an RCMspecialist.
In Step 1 “Study preparation” the RCM projectgroup should define and clarify the objectivesand the scope of the analysis. Requirements,
policies, and acceptance criteria with respect tosafety and environmental protection should bemade visible as boundary conditions for theRCM analysis.
The part of the plant to be analyzed is selected inStep 2. The type of consequences to beconsidered should, however, be discussed andsettled on a general basis in Step 1. Possibleconsequences to be evaluated may comprise:
(i) risk to humans,
(ii) environmental damages,
(iii) delays and cancellation of travels,
(iv) material losses or equipment damage,
(v) loss of marked shares, etc.
The possible consequence classes can not bemeasured in one common unit. It is thereforenecessary to prioritize between means affectingthe various consequence classes. Such aprioritization is not an easy task and will not bediscussed in this presentation. The trade–offproblems can to some extent be solved within a

Rausand&Vatn Reliability Centered Maintenance
5
decision theoretical framework (Vatn 95 andVatn et al. 1996).
RCM analyses have traditionally concentratedon PM strategies. It is, however, possible toextend the scope of the analysis to cover topicslike corrective maintenance strategies, spare partinventories, logistic support problems, etc. TheRCM project group must decide what should bepart of the scope and what should be outside.
The resources that are available for the analysisare usually limited. The RCM group shouldtherefore be sober with respect to what to lookinto, realizing that analysis cost should notdominate potential benefits.
In many RCM applications the plant already haseffective maintenance programs. The RCMproject will therefore be an upgrade project toidentify and select the most effective PM tasks,to recommend new tasks or revisions, and toeliminate ineffective tasks. Then apply thosechanges within the existing programs in a waythat will allow the most efficient allocation ofresources.
When applying RCM to an existing PMprogram, it is best to utilize, to the greatestextent possible, established plant administrativeand control procedures in order to maintain thestructure and format of the current program.This approach provides at least three additionalbenefits:
(i) It preserves the effectiveness andsuccessfulness of the current program.
(ii) It facilitates acceptance and implement-ation of the project’s recommendationswhen they are processed.
(iii) It allows incorporation of improvementsas soon as they are discovered, without thenecessity of waiting for major changes tothe PM program or analysis of everysystem.
6WHS��� 6\VWHP� VHOHFWLRQ� DQG� GHI�LQLWLRQBefore a decision to perform an RCM analysis ata plant is taken, two questions should beconsidered:
• To which systems are an RCM analysisbeneficial compared with more traditionalmaintenance planning?
• At what level of assembly (plant, system,subsystem . . . ) should the analysis beconducted?
Regarding the first question, all systems may inprinciple benefit from an RCM analysis. Withlimited resources, we must, however, usuallymake priorities, at least when introducing theRCM approach in a new plant. We should startwith the systems that we assume will benefitmost from the analysis. The following criteriamay be used to prioritize systems for an RCManalysis:
(i) The failure effects of potential systemfailures must be significant in terms ofsafety, environmental consequences,production loss, or maintenance costs.
(ii) The system complexity must be aboveaverage.
(iii) Reliability data or operating experiencefrom the actual system, or similar systems,should be available.
Most operating plants have developed anassembly hierarchy, i.e. an organization of thesystem hardware elements into a structure thatlooks like the root system of a tree. In theoffshore oil and gas industry this hierarchy isusually referred to as the tag number system.Several other names are also used. Moubray(1991) for example refers to the assemblyhierarchy as the plant register.
The following terms will be used in this paperfor the levels of the assembly hierarchy:
Plant: A logical grouping of systems thatfunction together to provide an output or productby processing and manipulating various inputraw materials and feed stock. An offshore gasproduction platform may e.g. be considered as aplant. For railway application a plant might be amaintenance area, where the main function ofthat “plant” is to ensure satisfactioryinfrastructure functionality in that area. Moubray(1991) refers to the plant as a cost center.

Rausand&Vatn Reliability Centered Maintenance
6
System: A logical grouping of subsystems thatwill perform a series of key functions, whichoften can be summarized as one main function,that are required of a plant (e.g. feed water,steam supply, and water injection). Thecompression system on an offshore gasproduction platform may e.g. be considered as asystem. Note that the compression system mayconsist of several compressors with a highdegree of redundancy. Redundant unitsperforming the same main function should beincluded in the same system. It is usually easy toidentify the systems in a plant, since they areused as logical building blocks in the designprocess.
The system level is usually recommended as thestarting point for the RCM process. This isfurther discussed and justified for example bySmith (1993) and in MIL–STD 2173. Thismeans that on an offshore oil/gas platform thestarting point of the analysis should be forexample the compression system, the waterinjection system or the fire water system, andnot the whole platform.
The systems may be further broken down insubsystems, and subsubsystems, etc. For thepurpose of the RCM–process the lowest level ofthe hierarchy should be what we will call anRCM analysis item:
RCM analysis item: A grouping or collection ofcomponents which together form someidentifiable package that will perform at leastone significant function as a stand–alone item(e.g. pumps, valves, and electric motors). Forbrevity, an RCM analysis item will in thefollowing be called an analysis item. By thisdefinition a shutdown valve, for example, isclassified as an analysis item, while the valveactuator is not. The actuator is a supportingequipment to the shutdown valve, and only has afunction as a part of the valve. The importanceof distinguishing the analysis items from theirsupporting equipment is clearly seen in theFMECA in Step 6. If an analysis item is foundto have no significant failure modes, then noneof the failure modes or causes of the supportingequipment are important, and therefore do notneed to be addressed. Similarly if an analysisitem has only one significant failure mode thenthe supporting equipment only needs to be
analyzed to determine if there are failure causesthat can affect that particular failure mode(Paglia et al. 1991). Therefore only the failuremodes and effects of the analysis items need tobe analyzed in the FMECA in Step 6. Ananalysis item is usually repairable, meaning thatit can be repaired without replacing the wholeitem. In the offshore reliability databaseOREDA (1992) the analysis item is called anequipment unit. The various analysis items of asystem may be at different levels of assembly.On an offshore platform, for example, a hugepump may be defined as an analysis item in thesame way as a small gas detector. If we haveredundant items, e.g. two parallel pumps, eachof them should be classified as analysis items.
When we in Step 6 of the RCM process identifycauses of analysis item failures, we will oftenfind it suitable to attribute these failure causes tofailures of items on an even lower level ofindenture. The lowest level is normally referredto as components.
Component: The lowest level at whichequipment can be disassembled without damageor destruction to the items involved. Smith(1993) refers to this lowest level as LeastReplaceable Assembly (LRA), while OREDA(1997) uses the term maintainable item.
It is very important that the analysis items areselected and defined in a clear and unambiguousway in this initial phase of the RCM–process,since the following analysis will be based onthese analysis items. If the OREDA database isto be used in later phases of the RCM process, itis recommended as far as possible to define theanalysis items in compliance with the“equipment units” in OREDA.
6WHS��� )XQFWLRQDO� IDLOXUH� DQDO\VLV�))$�The objectives of this step are:
(i) to identify and describe the systems’srequired functions,
(ii) to describe input interfaces required for thesystem to operate, and
(iii) to identify the ways in which the systemmight fail to function.

Rausand&Vatn Reliability Centered Maintenance
7
Step 3(i): Identification of system functions
The objective of this step is to identify anddescribe all the required functions of the system.
In many guidelines and textbooks (e.g. Cross1994), it is recommended that the variousfunctions are expressed in the same way, as astatement comprising a verb plus a noun – forexample, “close flow”, “contain fluid”, “transmitsignal”.
A complex system will usually have a highnumber of different functions. It is often difficultto identify all these functions without achecklist. The checklist or classification schemeof the various functions presented below mayhelp the analyst in identifying the functions. Thesame scheme will be used in Step 6 to identifyfunctions of analysis items. The term item istherefore used in the classification scheme todenote either a system or an analysis item.
1. Essential functions: These are the functionsrequired to fulfill the intended purpose ofthe item. The essential functions are simplythe reasons for installing the item. Often anessential function is reflected in the name ofthe item. An essential function of a pump isfor example to pump a fluid.
2. Auxiliary functions: These are the functionsthat are required to support the essentialfunctions. The auxiliary functions areusually less obvious than the essentialfunctions, but may in many cases be asimportant as the essential functions. Failureof an auxiliary function may in many casesbe more critical than a failure of an essentialfunction. An auxiliary function of a pump isfor example containment of the fluid.
3. Protective functions: The functions intendedto protect people, equipment and theenvironment from damage and injury. Theprotective functions may be classifiedaccording to what they protect, as:
• safety functions
• environment functions
• hygiene functions
Safety protective functions are furtherdiscussed e.g. by Moubray (1991) pp. 40–
42. An example of a protective function isthe protection provided by a rupture disk ona pressure vessel (e.g. a separator).
4. Information functions: These functionscomprise condition monitoring, variousgauges and alarms etc.
5. Interface functions: These functions apply tothe interfaces between the item in questionand other items. The interfaces may beactive or passive. A passive interface is forexample present when an item is a supportor a base for another item.
6. Superfluous functions: According toMoubray (1991) “Items or components aresometimes encountered which arecompletely superfluous. This usuallyhappens when equipment has been modifiedfrequently over a period of years, or whennew equipment has been overspecified”.Superfluous functions are sometimes presentwhen the item has been designed for anoperational context that is different from theactual operational context. In some casesfailures of a superfluous function may causefailure of other functions.
For analysis purposes the various functions of anitem may also be classified as:
(a) On–line functions: These are functionsoperated either continuously or so often thatthe user has current knowledge about theirstate. The termination of an on–line functionis called an evident failure.
(b) Off–line functions: These are functions thatare used intermittently or so infrequently thattheir availability is not known by the userwithout some special check or test. Theprotective functions are very often off–linefunctions. An example of an off–linefunction is the essential function of anemergency shutdown (ESD) system on an oilplattform. Many of the protective functionsare off-line functions. The termination of anoff–line function is called a hidden failure.
Note that this classification of functions shouldonly be used as a checklist to ensure that allrelevant functions are revealed. Discussionsabout whether a function should be classified as

Rausand&Vatn Reliability Centered Maintenance
8
“essential” or “auxiliary” etc. should be avoided.Also note that the classification of functionshere is used at the system level. Later the sameclassification of functions is used in the failuremodes, effects and criticality analysis (FMECA)in Step 6 at the analysis item level.
The system may in general have severaloperational modes (e.g. running, and standby),and several functions for each operating state.
The essential functions are often obvious andeasy to establish, while the other functions maybe rather difficult to reveal.
Step 3(ii): Functional block diagrams
The various system functions identified in Step3(i) may be represented by functional diagramsof various types. The most common diagram isthe so–called functional block diagram. Asimple functional block diagram of a pump isshown in Figure 3.
Pump fluid
Control systemSystem boundary
Fluid in
El. power
Environment
Fluid out
Figure 3 Functional block diagram for apump
The necessary inputs to a function are illustratedin the functional block diagram together with thenecessary control signals and the variousenvironmental stressors that may influence thefunction.
It is generally not required to establishfunctional block diagrams for all the systemfunctions. The diagrams are, however, oftenconsidered as efficient tools to illustrate theinput interfaces to a function. The functionalblock diagram is recommended for RCM bySmith (1993). A detailed description of this type
of diagrams is given by e.g. Pahl and Beitz(1984).
In some cases we may want to split systemfunctions into subfunctions on an increasinglevel of detail, down to functions of analysisitems. The functional block diagrams may beused to establish this functional hierarchy in apictorial manner, illustrating series–parallelrelationships, possible feedbacks, and functionalinterfaces (Blanchard & Fabrycky 1981).Alternatives to the functional block diagram arereliability block diagrams and fault trees.
Functional block diagrams are alsorecommended by IEC812 as a basis for failuremodes, effects and criticality analysis (FMECA)and will therefore be a basis for Step 6 in theRCM procedure.
Step 3(iii): System failure modes
The next step of the FFA is to identify anddescribe how the various system functions mayfail.
Since we will need the following concepts alsoin the FMECA in Step 6, we will use the termitem to denote both the system and the analysisitems. According to accepted standards (IEC50(191)) failure is defined as “the terminationof the ability of an item to perform a requiredfunction”.
British Standard BS 5760, Part 5 defines failuremode as “the effect by which a failure isobserved on a failed item”. It is important torealize that a failure mode is a manifestation ofthe failure as seen from the outside, i.e. thetermination of one or more functions.
In most of the RCM references the systemfailure modes are denoted functional failures.
Failure modes may be classified in three maingroups related to the function of the item:
(i) Total loss of function: In this case a functionis not achieved at all, or the quality of thefunction is far beyond what is considered asacceptable.
(ii) Partial loss of function: This group may bevery wide, and may range from the nuisancecategory almost to the total loss of function.

Rausand&Vatn Reliability Centered Maintenance
9
(iii) Erroneous function: This means that theitem performs an action that was notintended, often the opposite of the intendedfunction.
A variety of classifications schemes for failuremodes have been published. Some of theseschemes, e.g. Blache & Shrivastava (1994), maybe used in combination with the functionclassification scheme in Step 3(ii) to secure thatall relevant system failure modes (functionalfailures) are identified.
In the following we will need to classify failuresas:
Sudden failures: Failures that could not beforecast by prior testing or examination.
Gradual failures: Failures that could be forecastby testing or examination. A gradual failure willrepresent a gradual “drifting out” of thespecified range of performance values. Therecognition of gradual failures requirescomparison of actual device performance with aperformance specification, and may in somecases be a difficult task. An example of agradual failure situation is illustrated in Figure 4.
The specified performance is illustrated by thetarget value, together with the acceptabledeviation from this target value. As soon as theactual performance drifts outside the acceptabledeviation, we have a failure.
An important type of failures are the so–calledageing failures:
Time
Target value
Acceptabledeviation
Failure
Performance
Figure 4 Example of a gradual failure
Ageing failures: Failures whose probability ofoccurrence increases with the passage of time, asa result of processes inherent in the item. Ageingfailures are also sometimes called wearoutfailures.
An ageing failure is normally caused by somephysical, chemical or other processes that aredeteriorating the item. These processes areusually referred to as failure mechanisms. Theageing failure is sometimes a gradual failure,meaning that the performance of the item isgradually drifting out of the specified range. Inother cases the ageing failure will be sudden.The inherent resistance of the item maygradually be reduced until a failure occurs. Theperformance of the item may in such cases beperfect until the failure occurs.
The system failure modes (functional failures)may be recorded on a specially designed FFA-form, that is rather similar to a standard FMECAform. An example of an FFA-form is presentedin Figure 5
.
System: Performed by:Ref. drawing no.: Date: Page: of:
Operational Function Function System Criticality
mode requirements failure mode S E A C
Figure 5 Example of an FFA-form

Rausand&Vatn Reliability Centered Maintenance
10
In the first column of Figure 5 the variousoperational modes of the system are recorded.For each operational mode, all the relevantfunctions of the system are recorded in column2. The performance requirements to thefunctions, like target values and acceptabledeviations (ref. Figure 4) are listed in column 3.For each system function (in column 2) all therelevant system failure modes are listed incolumn 4. In column 5 a criticality ranking ofeach system failure mode (functional failure) inthat particular operational mode is given. Thereason for including the criticality ranking is tobe able to limit the extent of the further analysisby disregarding insignificant system failuremodes. For complex systems such a screening isoften very important in order not to waste timeand money.
The criticality ranking depends on both thefrequency/probability of the occurrence of thesystem failure mode, and the severity of thefailure. The severity must be judged at the plantlevel.
In the conceptual RCM model in Figure 1 thesystem failure modes will be “undesired events”.In addition the “undesired events” will alsoinclude accidental events (like external impacts)that are not normally identified as a loss ofsystem function. Such events are usuallyidentified by using various risk identificationchecklists.
The severity ranking should be given in the fourconsequence classes; (S) safety of personnel, (E)environmental impact, (A) productionavailability, and (C) economic losses. For eachof these consequence classes the severity shouldbe ranked as for example (H) high, (M) medium,or (L) low. How we should define theborderlines between these classes, will dependon the specific application.
If at least one of the four entries are (M) mediumor (H) high, the severity of the system failuremode should be classified as significant, and thesystem failure mode should be subject to furtheranalysis.
The frequency of the system failure mode mayalso be classified in the same three classes. (H)high may for example be defined as more thanonce per 5 years, and (L) low less than once per
50 years. As above the specific borderlines willdepend on the application.
The frequency classes may be used to prioritizebetween the significant system failure modes.
If all the four severity entries of a system failuremode are (L) low, and the frequency is also (L)low, the criticality is classified as insignificant,and the system failure mode is disregarded in thefurther analysis. If, however, the frequency is(M) medium or (H) high the system failuremode should be included in the further analysiseven if all the severity ranks are (L) low, butwith a lower priority than the significant systemfailure modes.
If we were able to define a total loss function inthe conceptual model in Figure 1, the criticalityof the various system failure modes (undesiredevents) could be assessed explicitly. Thisapproach will, however, not be cost–efficient inmost practical applications.
6WHS��� &ULWLFDO�LWHP�VHOHFWLRQThe objective of this step is to identify theanalysis items that are potentially critical withrespect to the system failure modes (functionalfailures) identified in Step 3(iii). These analysisitems are denoted functional significant items(FSI). Note that some of the less critical systemfailure modes have been disregarded at this stageof the analysis. Further, the two failure modes“total loss of function” and “partial loss offunction” will often be affected by the sameitems (FSIs).
For simple systems the FSIs may be identifiedwithout any formal analysis. In many cases it isobvious which analysis items that have influenceon the system functions.
For complex systems with an ample degree ofredundancy or with buffers, we may need aformal approach to identify the functionalsignificant items. In the conceptual model inFigure 1 the analysis item failures are classifiedas basic events. This means that the causalanalysis in the conceptual model should bepursued down to the analysis item level and notfurther. As explained in section 2, the basicevents will also comprise events that are notclassified as analysis item failures, like human
Rausand&Vatn Reliability Centered Maintenance
11
errors and environmental impacts. In theconceptual model, fault tree analysis issuggested as a suitable technique foridentification and modeling of basic events.Depending on the complexity of the system,other techniques like reliability block diagrams,or Monte Carlo simulation (see e.g. Høyland andRausand 1994) may be more suitable. In anpetroleum production plant there are often avariety of buffers and rerouting possibilities.Rerouting will also be possible in railwayapplications. For such systems, Monte Carlonext event simulation may often be the onlyfeasible approach.
If failure rates and other necessary input data areavailable for the various analysis items, it isusually a straightforward task to calculate therelative importance of the various analysis itemsbased on a fault tree model or a reliability blockdiagram. A number of importance measures arediscussed by Høyland and Rausand (1994). In aMonte Carlo model it is also ratherstraightforward to rank the various analysisitems according to criticality.
The main reason for performing this task is toscreen out items that are more or less irrelevantfor the main system functions, i.e. in order not towaste time and money analyzing irrelevantitems.
In addition to the FSIs, we should also identifyitems with high failure rate, high repair costs,low maintainability, long lead time for spareparts, or items requiring external maintenance
personnel. These analysis items are denotedmaintenance cost significant items (MCSI).
The sum of the functional significant items andthe maintenance cost significant items aredenoted maintenance significant items (MSI).
Some authors, e.g. Smith (1993), claim that sucha screening of critical items should not be done,others e.g. Paglia et al. (1991) claim that theselection of critical items is very important inorder not to waste time and money. We tend toagree with both. In some cases it may bebeneficial to focus on critical items, in othercases we should analyze all items.
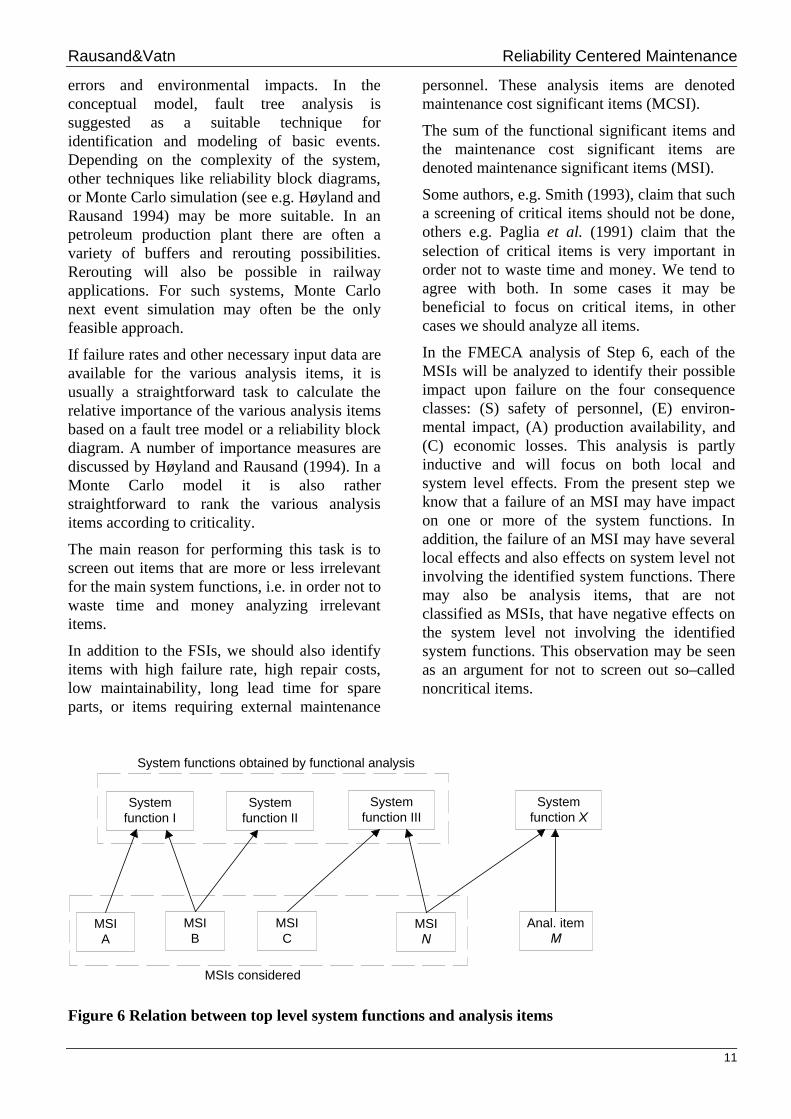
In the FMECA analysis of Step 6, each of theMSIs will be analyzed to identify their possibleimpact upon failure on the four consequenceclasses: (S) safety of personnel, (E) environ-mental impact, (A) production availability, and(C) economic losses. This analysis is partlyinductive and will focus on both local andsystem level effects. From the present step weknow that a failure of an MSI may have impacton one or more of the system functions. Inaddition, the failure of an MSI may have severallocal effects and also effects on system level notinvolving the identified system functions. Theremay also be analysis items, that are notclassified as MSIs, that have negative effects onthe system level not involving the identifiedsystem functions. This observation may be seenas an argument for not to screen out so–callednoncritical items.
Systemfunction I
Systemfunction II
Systemfunction III
Systemfunction ;
MSIA
MSIB
MSIC
MSI1
Anal. item0
System functions obtained by functional analysis
MSIs considered
Figure 6 Relation between top level system functions and analysis items

12
In Step 6 a complete FMECA is carried out forall the MSIs. The FMECA is partly an inductiveanalysis that identifies all the local and systemlevel consequences of the MSI failure modes.This means that other (top level) functions thanthose identified may be considered in theFMECA. This is illustrated in
Figure 6, where the system function X is affectedby analysis item N.
On the other hand, there might be importantitems which are omitted from the FMECAbecause the corresponding top level functionswere overlooked. This is the case for analysisitem M in
Figure 6 that has an impact on system functionX. The only way to ensure that all functions areconsidered, is to include all items in the FMECAanalysis. However, this will often lead to a toocomprehensive analysis.
6WHS��� 'DWD�FROOHFWLRQ�DQG�DQDO\VLVThe data necessary for the RCM analysis mayaccording to (Sandtorv & Rausand 1991) becategorized in the following three groups:
1. Design data
• System definition: a description of thesystem boundaries including all sub-systems and equipment to fulfill the mainfunctions of the system.
• System breakdown: the assembly hier-archy as described in Step 2.
• A technical description of each subsystem,such as the structure of the subsystem,capacity and functions (e.g. input andoutput).
• System performance requirements, e.g. de-sired system availability, environmentalrequirements.
• Requirements related to maintenance/test-ing e.g. according to rules and regulations.
2. Operational data
• Performance requirements
• Operating profile (continuous or inter-mittent operation)
• Control philosophy (remote/local andautomatic/manual)
• Environmental conditions
• Maintainability
• Calendar– and accumulated operating timefor overhauls
• Maintenance and downtime costs
• Recommended maintenance for eachanalysis item based on manufacturerspecification, general guidelines orstandards, or in–house recommendedpractice.
• Failure information, when a failure occursthe following registrations are relevant:
− System number (tag number) of theanalysis item
− Calendar time
− Accumulated operating time to thefailure
− Failure event
− Failure mode
− Failure cause
− Failure consequences
− Repair time (active and passive)
− Downtime
3. Reliability data
Reliability data may be derived from theoperational data. The reliability data is usedto decide the criticality, to mathematicallydescribe the failure process and to optimizethe time between PM–tasks. The reliabilitydata includes:
• Mean time to failure (MTTF).
• Mean time to repair (MTTR).
• Failure rate function z(t).
Rausand&Vatn Reliability Centered Maintenance
13
• A functional relation between the value ofcondition monitoring information and thefailure rate z(t).
The failure rate function is briefly described inthe following. Let T denote the time from anitem is put into operation at time t = 0 until apotential failure occurs. The item may be eithernew or used when it is put into operation. Inmany cases the item will be re–put intooperation after a refurbishment or a failure hasbeen corrected. The uncertainties in the time tofailure T may be described by the distributionfunction F(t) = Pr(T ≤ t), or the probabilitydensity function f(t) = F’( t). The probabilitydensity function f(t) may be expressed as:
f(t)∆t ≈Pr(t < T ≤ t+∆t )
Hence, f(t)∆t is approximately equal to theprobability that the item will fail in the timeinterval ⟨t,t+∆t].
The life distribution is often most effectivelycharacterized by the so–called failure rate, orforce of mortality (FOM). The failure ratefunction z(t) may be expressed as:
z(t) ∆t ≈ Pr(t < T ≤ t+∆t T > t)
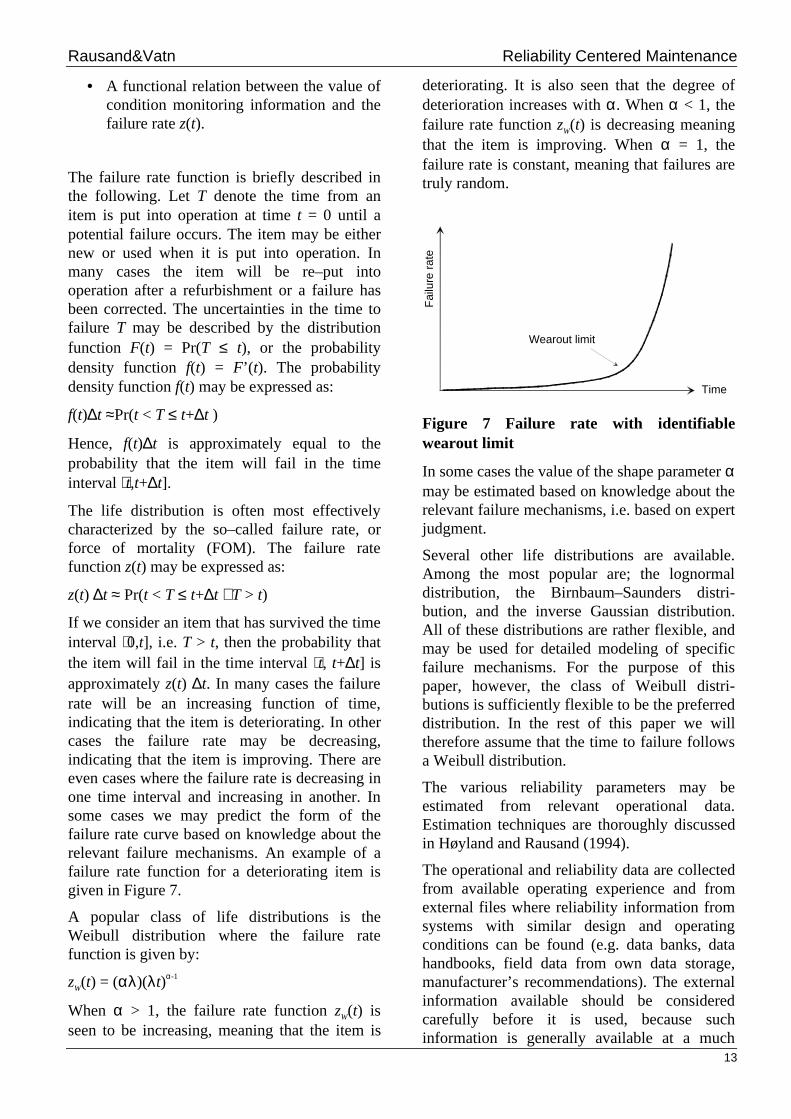
If we consider an item that has survived the timeinterval ⟨0,t], i.e. T > t, then the probability thatthe item will fail in the time interval ⟨t, t+∆t] isapproximately z(t) ∆t. In many cases the failurerate will be an increasing function of time,indicating that the item is deteriorating. In othercases the failure rate may be decreasing,indicating that the item is improving. There areeven cases where the failure rate is decreasing inone time interval and increasing in another. Insome cases we may predict the form of thefailure rate curve based on knowledge about therelevant failure mechanisms. An example of afailure rate function for a deteriorating item isgiven in Figure 7.
A popular class of life distributions is theWeibull distribution where the failure ratefunction is given by:
zW(t) = (αλ)(λt)α-1
When α > 1, the failure rate function zW(t) isseen to be increasing, meaning that the item is
deteriorating. It is also seen that the degree ofdeterioration increases with α. When α < 1, thefailure rate function zW(t) is decreasing meaningthat the item is improving. When α = 1, thefailure rate is constant, meaning that failures aretruly random.
Time
Fai
lure
rat
e
Wearout limit
Figure 7 Failure rate with identifiablewearout limit
In some cases the value of the shape parameter αmay be estimated based on knowledge about therelevant failure mechanisms, i.e. based on expertjudgment.
Several other life distributions are available.Among the most popular are; the lognormaldistribution, the Birnbaum–Saunders distri-bution, and the inverse Gaussian distribution.All of these distributions are rather flexible, andmay be used for detailed modeling of specificfailure mechanisms. For the purpose of thispaper, however, the class of Weibull distri-butions is sufficiently flexible to be the preferreddistribution. In the rest of this paper we willtherefore assume that the time to failure followsa Weibull distribution.
The various reliability parameters may beestimated from relevant operational data.Estimation techniques are thoroughly discussedin Høyland and Rausand (1994).
The operational and reliability data are collectedfrom available operating experience and fromexternal files where reliability information fromsystems with similar design and operatingconditions can be found (e.g. data banks, datahandbooks, field data from own data storage,manufacturer’s recommendations). The externalinformation available should be consideredcarefully before it is used, because suchinformation is generally available at a much

Rausand&Vatn Reliability Centered Maintenance
14
coarser level than what is indicated in point (2)and (3) above. The following three points shouldbe considered before reliability data is used:
• What are the system boundaries for thesystem (analysis item) from which the dataarrives?
• What are the specific operating andmaintenance features that may influence onthe data validity?
• Is the time scale used calendar time,operating time, or some other timeconcept?
A most valuable source of reliability data is theOREDA handbook (1997) and the OREDAdatabase. OREDA contains data from a widerange of offshore equipment. The data has beencollected mainly from platform maintenancerecords from the whole North Sea area and fromthe Mediterranean Sea. The handbook presentsgeneric data, while more detailed, manufacturerspecific data is available in the database. TheOREDA database is, however, available only forthe participants in the OREDA project.
At the outset of the analysis, the relevantreliability may often be scarce, because of littleor no operating experience. The initialinformation used may, however, later be
adjusted based on updated information andexperience.
In some situations there is a complete lack ofreliability data. This is the fact when developinga maintenance program for new systems. Themaintenance program development starts longbefore the equipment enters service. Helpfulsources of information can then be experiencedata from similar equipment, directions frommanufacturers and results from testing. TheRCM method will even in this situation provideuseful information. A successful application ofRCM requires an extensive amount ofinformation. Both qualitative and quantitativedata are required. A systematic approach to thecollection phase is essential. The results of thetotal RCM process depend highly on the qualityof the input data.
6WHS��� )DLOXUH� PRGHV�� HIIHFWV� DQGFULWLFDOLW\�DQDO\VLVThe objective of this step is to identify thedominant failure modes of the MSIs identifiedduring Step 4.
6\VWHP� 3HUIRUPHG�E\�
5HI��GUDZLQJ�QR�� 'DWH� � ��3DJH����RI�
'HVFULSWLRQ�RI�XQLW Failure (IIHFW�RI�IDLOXUH MTTF Criticality Failure Failure %MTTF Failure Maintenance Failure RecommendedMSI Operational
modeFunction mode Consequence
class“Worst case”probability
cause mechanism characteristic action characteristicmeasure
interval
S E A C S E A C
Figure 8 RCM FMECA-form
A wide variety of different FMECA forms areused in the main RCM references. The FMECAform used in our approach is presented in Figure8. The various columns in this FMECA form arediscussed below:
MSI: This will typically be the analysis itemnumber in the assembly hierarchy (tag number),optionally with a descriptive text.
Operational mode: The MSI may have variousoperational modes, for example running andstandby.
Function: For each operational mode, the MSImay have several functions. A function of astandby water supply pump is for example tostart upon demand.

Rausand&Vatn Reliability Centered Maintenance
15
Failure mode: A failure mode is the manner bywhich a failure is observed, and is defined asnon–fulfillment of one of the equipmentfunctions.
Effect of failure/Severity class: The effect of afailure is described in terms of the “worst case”outcome with respect to safety (S),environmental impact (E), productionavailability (A), and direct economic cost (C).The effect can either be specified by means ofconsequence classes, or some numerical severitymeasure. A failure of an MSI will notnecessarily give a “worst case” outcome due toe.g. redundancy, buffer capacities, etc. Aconditional likelihood field is thereforeintroduced.
“Worst case” probability: The “worst case”probability is defined as the probability that anequipment failure will give the “worst case”outcome. To obtain a numerical probabilitymeasure, a system model is required. This willoften be inappropriate at this stage of theanalysis, and a descriptive measure may be used.Proposed classes are “serial”,“redundancy”,“cold standby”, “hot standby”,and “buffer”.
MTTF:Mean time to failure for each failuremode is recorded. Either a numerical measure orlikelihood classes may be used.
Criticality: The criticality field is used to tag offthe dominant failure mode according somecriticality measure. A criticality measure shouldtake failure effect, “worst case” probability andMTTF into account. “Yes” is used to tag off thedominant failure modes.
The information described so far should beentered for all failure modes. A screening maynow be appropriate, giving only dominantfailure modes, i.e. items with high criticality.For the dominant failure modes the followingfields are required:
Failure cause: For each failure mode there maybe several failure causes. An MSI failure modewill typically be caused by one or morecomponent failures. Note that supportingequipment to the MSIs entered in the FMECAform is for the first time considered at this step.In this context a failure cause may therefore be a
failure mode of a supporting equipment. A “failto close” failure of a safety valve may forexample be caused by a broken spring in thefailsafe actuator.
Failure mechanism: For each failure cause, thereis one or several failure mechanisms. Examplesof failure mechanisms are fatigue, corrosion, andwear.
% MTTF: The MTTF was entered on an MSIfailure mode level. It is also relevant to enter theMTTF for each failure mechanism. To simplify,a per cent is given, and MTTF can be calculatedfor each failure mechanism. The %MTTF willobviously be only an approximation since thefailure mechanisms usually are stronglyinterdependent.
Failure characteristic: Failure propagation maybe divided into three classes.
1. The failure propagation can be measured byone or several (condition monitoring)indicators. The failure is referred to as a“gradual failure”.
2. The failure probability is age–dependent, i.e.there is a predictable wearout limit. Thefailure is referred to as an “ageing failure”.
3. Complete randomness. The failure cannot bepredicted by either condition monitoringindicators or by measuring the age of theitem. The time to failure can only bedescribed by an exponential distribution, andthe failure is referred to as a “sudden failure”.
Maintenance action: For each failuremechanism, an appropriate maintenance actionmay hopefully be found by the decision logic inStep 7. This field can thus not be completeduntil Step 7 is performed.
Failure characteristic measure: For “gradualfailures”, the condition monitoring indicators arelisted by name. ”Ageing failures are describedby an ageing parameter, i.e. the “shape”parameter (α) in the Weibull distribution isrecorded.
Recommended maintenance interval: Theidentified maintenance action is performed atintervals of fixed length. The length of theinterval is found in Step 8.

Rausand&Vatn Reliability Centered Maintenance
16
6WHS��� 6HOHFWLRQ� RI� 0DLQWHQDQFH$FWLRQVThis phase is the most novel compared to othermaintenance planning techniques. A decisionlogic is used to guide the analyst through aquestion–and–answer process. The input to theRCM decision logic is the dominant failuremodes from the FMECA in Step 6. The mainidea is for each dominant failure mode to decidewhether a preventive maintenance task issuitable, or it will be best to let the itemdeliberately run to failure and afterwards carryout a corrective maintenance task. There aregenerally three reasons for doing a preventivemaintenance task:
(a) to prevent a failure
(b) to detect the onset of a failure
(c) to discover a hidden failure
Only the dominant failure modes are subjectedto preventive maintenance. To obtainappropriate maintenance tasks, the failure causesor failure mechanisms should be considered. Theidea of performing a maintenance task is toprevent a failure mechanism to cause a failure.Hence, the failure mechanisms behind each ofthe dominant failure modes should be enteredinto the RCM decision logic to decide which ofthe following basic maintenance tasks that isapplicable:
1. Continious on–condition task (CCT)
2. Scheduled on–condition task (SCT)
3. Scheduled overhaul (SOH)
4. Scheduled replacement (SRP)
5. Scheduled function test (SFT)
6. Run to failure (RTF)
Continuous on–condition task (CCT) is acontinuous monitoring of an item to find anypotential failures. An on–condition task isapplicable only if it is possible to detect reducedfailure resistance for a specific failure modefrom the measurement of some quantity.
Example:
A distance gauge might be used to measure thedistance between the switch point and stockrail to detect that the 3mm limit will bereached. At a predefined level (i.e. 2.7 mm),the system alerts the maintenance crew, whichcarry out an appropriate maintenance action.
Scheduled on–condition task (SCT) is ascheduled inspection of an item at regularintervals to find any potential failures. There arethree criteria that must be met for an on–condition task to be applicable:
1. It must be possible to detect reduced failureresistance for a specific failure mode.
2. It must be possible to define a potentialfailure condition that can be detected by anexplicit task.
3. There must be a reasonable consistent ageinterval between the time of potential failureand the time of failure.
Example:
A manual inspection every second month willreveal whether the “3 mm limit” is soon beingreached. Appropriate maintenance action canbe issued.
There are two disadvantage of a scheduledversus a continuous on-condition task:
• The man-hour cost of inspection is oftenlarger than the cost of installing the sensor
• Since the scheduled inspection is carried outat fixed points of time, one might “miss”situations where the degradation is fasterthan anticipated.
An advantage of a scheduled on-condition taskis that the human operator is then able to “sense”information that a physical sensor will not beable to detect. This means that traditional “Walkaround checks” should not be totally skippedeven if sensors are installed.
Condition monitoring is discussed in Nowlan &Heap (1978), and statistical models arepresented in e.g. Aven (1992) and Valdez-Flores& Feldman (1989).
Rausand&Vatn Reliability Centered Maintenance
17
Scheduled overhaul (SOH) is a scheduledoverhaul of an item at or before some specifiedage limit, and is often called “hard timemaintenance”.
An overhaul task can be considered applicable toan item only if the following criteria are met(Nowlan & Heap 1978):
1. There must be an identifiable age at whichthe item shows a rapid increase in the item’sfailure rate function.
2. A large proportion of the units must surviveto that age.
3. It must be possible to restore the originalfailure resistance of the item by reworking it.
Examples:
Rehabilitation of wooden sleepers boringsevery three year. Lubrication of the char-/slideplate every three day. Cleaning everymonth.
Scheduled replacement (SRP) is scheduleddiscard of an item (or one of its parts) at orbefore some specified age limit. A scheduledreplacement task is applicable only under thefollowing circumstances (Nowlan & Heap1978):
1. The item must be subject to a critical failure.
2. Test data must show that no failures areexpected to occur below the specified lifelimit.
3. The item must be subject to a failure that hasmajor economic (but not safety)consequences.
4. There must be an identifiable age at whichthe item shows a rapid increase in the failurerate function.
5. A large proportion of the units must surviveto that age.
Example:
Replacement of the motor every one year Themotor is then either overhauled to “a god asnew” condition, or replaced in themaintenance depot.
Scheduled function test (SFT) is a scheduledinspection of a hidden function to identify anyfailure. A scheduled function test task isapplicable to an item under the followingconditions (Nowlan & Heap 1978):
1. The item must be subject to a functionalfailure that is not evident to the operatingcrew during the performance of normalduties.
2. The item must be one for which no other typeof task is applicable and effective.
Example:
Sighting or hammer blow every year to detectloose lockspikes fastening chars/baseplates onwooden sleepers.
Run to failure (RTF) is a deliberate decision torun to failure because the other tasks are notpossible or the economics are less favorable.
In many situations one maintenance task mayprevent several failure mechanisms. Forexample function testing of an ESD-valve (withan off–line function) will reveal any failuremechanisms causing a hidden failure. Hence insome situations it is better to put failure modesrather than failure mechanisms into the RCMdecision logic.
Note also that if a failure cause for a dominantfailure mode corresponds to a supportingequipment, the supporting equipment should bedefined as the “item” to be entered into theRCM decision logic.
The criteria given for using the various tasksshould only be considered as guidelines forselecting an appropriate task. A task might befound appropriate even if some of the criteria arenot fulfilled.

Rausand&Vatn Reliability Centered Maintenance
18
The RCM decision logic is shown in Figure 9.Note that this logic is much simpler than thosefound in standard RCM references, e.g.Moubray (1991). It should be emphasized that
such a logic can never cover all situations. Forexample in the situation of a hidden functionwith ageing failures, a combination of scheduledreplacements and function tests is required.
Does a failure alertingmeasurable indicator
exist?
Is ageing parameterα>1?
Is the functionhidden?
Is overhaulfeasible?
Scheduled overhaul(SOH)
Scheduledreplacement
(SRP)
Scheduled functiontest (SFT)
No
Yes
Yes
Yes
No
No
No
No PM activityfound (RTF)
Yes Is continiousmonitoringfeasible?
Yes
NoScheduled on-
conditiontask (SCT)
Continious on-condition
task (CCT)
Figure 9 Maintenance Task Assignment/Decision logic
6WHS��� 'HWHUPLQDWLRQ� RI� 0DLQWH�QDQFH�,QWHUYDOVThe RCM decision logic was qualitatively usedto establish preventive maintenance tasks. Thesetasks are performed at times kτ, k=1,2, . . . , .Hence, for each task, the optimal interval τshould be decided. When balancing costs, werealize that the preventive maintenance costincreases with decreasing τ, and the cost ofunplanned failures decreases with decreasing τ.In this presentation, only tree simple models arediscussed. Model 1 and Model 2 are appropriatemodels for scheduled rework/replacement task,while Model 3 may be used for scheduledfunction testing. For more general models, seeValdez-Flores & Feldman (1989).
To determine the optimal interval t some crucialinformation is required. First we needinformation about cost structures, i.e. the totalcost of the preventive maintenance action andthe total cost of a failure which the maintenanceaction was supposed to prevent. Note that themodels are developed for single unit systems,thus for redundant systems we realize that afailure needs not necessarily give a systemfailure. If the cost of a system failure is cs, thenthe cost element to use in the model should be cs
= p + cr where p is the probability that the(redundant) unit will cause a system failure, andcr is the repair/replacement cost of the unit.
In addition to cost structures, information aboutthe actual failure distribution is necessary. Thisinformation will typically be mean time tofailure (MTTF), and the shape parameter forunits where ageing, wear, corrosion etc. are

Rausand&Vatn Reliability Centered Maintenance
19
present. Note that the failure information shouldbe obtained at a failure cause level, i.e.corresponding to the failure cause the preventivemaintenance task is designed for.
Model 1 – Minimal repair policy
The minimal repair policy describes a single–unit system subjected to preventive replacementat periods of fixed lengths. To be formal the unitis put into operation at time t = 0, and replacedat times kτ for k = 1,2, . . . . If the unit fails in aninterval ⟨(k-1)τ, kτ] a minimal repair, see e.g.Høyland and Rausand (1994), is performed. Thesituation where the unit is replaced upon afailure in ⟨(k-1)τ, kτ], i.e. a block replacementpolicy is discussed in Model 2.
The total cost of a minimal repair is denoted cm
and the total cost of a replacement is cp. It willbe convenient to introduce ρ = cp/cm. Typically ρ>> 1, or at least ρ > 1. In special situations wecan even have ρ < 1.
The expected cost per unit time is:
&F F : WS P
( )( )
ττ
=+
where W(t) = E(N(t)) is the expected number offailures in ⟨0, t].
We will consider a so–called Weibull processwith W(t) = (λt)α. In this case the time from t = 0until the first failure has a Weibull distributionwith survivor function R(t) = exp(-(λt)α).
It can be shown that the expected cost per unittime, C(t), is minimized when:
τ λρ
αα
=−
1
1
1
provided α > 1.
Hence, to optimize the replacement interval,estimates for the parameters; cm, cp, α and λ arerequired. cm is the total cost of a minimal repair,including any harm to material, personnel andenvironment. Assessing a value of cm maytherefore cause controversies. α and λ are theparameters in the failure distribution of the item.Often it is more convenient to specify the failuredistribution in terms of mean time to failure(MTTF) and the shape parameter α, yielding:
τρ
αα
α=
+ −
077)
Γ( )1
1
1 1
Table 1 Optimal replacement interval relative to MTTF. For a given value of α and ρ, the tableentry should be multiplied with MTTF to give the optimum replacement interval length
α Cost ratio ρ = cu /cp
2 3 4 5 7 10 20 50 100 200
1.2 13.40 12.20 12.95 12.62 2.050 .897 .393 .165 .090 .050
1.5 8.19 7.97 1.22 .85 .590 .432 .253 .133 .083 .052
1.7 6.60 1.59 .83 .66 .503 .389 .247 .141 .093 .061
2.0 4.84 .86 .67 .57 .464 .377 .259 .161 .113 .080
2.5 .99 .71 .60 .54 .461 .394 .294 .202 .152 .115
3.0 .82 .67 .59 .54 .478 .421 .331 .242 .192 .152
4.0 .75 .66 .61 .57 .523 .476 .398 .316 .265 .223
Model 2 – Block replacement policy
The block replacement policy describes asingle–unit system put into operation at time t =
0. The unit is replaced at times kt for k=1,2,. . .and at failures. The cost of a plannedreplacement is denoted cp, and the total cost of
Rausand&Vatn Reliability Centered Maintenance
20
an unplanned replacement, i.e. a failure is cu. LetW(t) denote the renewal function, see e.g.Høyland and Rausand (1994), for the lifetimedistribution of the unit. The average cost per unittime is:
&F F : WS X
( )( )
ττ
=+
If the times between failures are Weibulldistributed, W(t) can be found by the algorithmgiven by Smith and Leadbetter (1963).Numerical methods are, however, required tofind the optimal interval τ. In Table 1, numericalvalues for the optimal replacement interval isgiven relative to MTTF.
In order to use Table 1 the value of α must bespecified. During the data analysis in Step 5 thevalue of α should have been found by e.g. expertjudgment.
Model 3 - Functional testing
This model is appropriate for scheduled functiontesting. Consider a protective device with aconstant failure rate λ. A functional test of thedevice is performed at times kτ for k=1,2,. . .The cost of a Functional test is ct. If a failure isdetected upon a test, the device is replaced at acost of cr. Further assume that the device isdemanded with a frequency f, i.e. the rate ofcritical situations. A hazardous situation occursif the protective device fails upon a demand. Thetotal cost of such a situation is ch.
The expected cost per unit time is:
&F
F I FW
U Kτ τ λλ τ λτ
≈ + −
+ ⋅
2
2 2
yielding an optimal interval τ:
τλ λ
���� F
�I F � F �� �
�077) FI F � F � 077)
W
K U
W
K U
=⋅ ⋅
⋅⋅
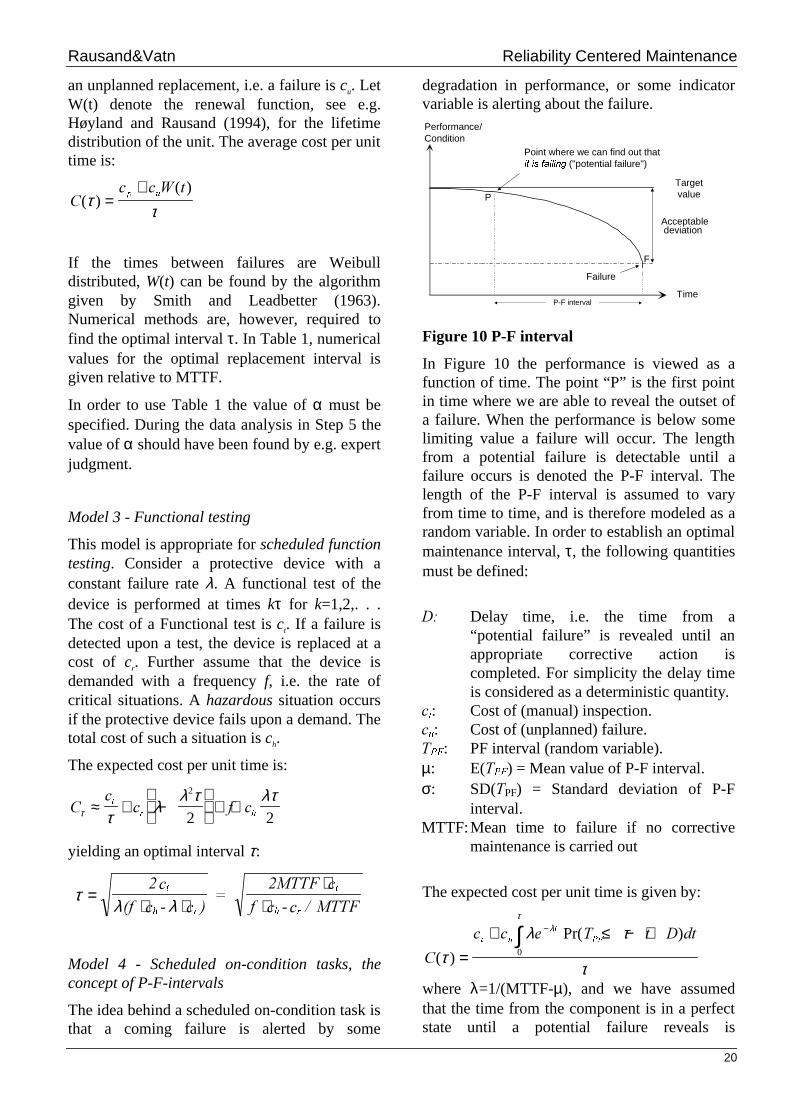
Model 4 - Scheduled on-condition tasks, theconcept of P-F-intervals
The idea behind a scheduled on-condition task isthat a coming failure is alerted by some
degradation in performance, or some indicatorvariable is alerting about the failure.
Time
Targetvalue
Acceptabledeviation
Failure
Performance/Condition
Point where we can find out thatLW�LV�IDLOLQJ�("potential failure")
P
F
P-F interval
Figure 10 P-F interval
In Figure 10 the performance is viewed as afunction of time. The point “P” is the first pointin time where we are able to reveal the outset ofa failure. When the performance is below somelimiting value a failure will occur. The lengthfrom a potential failure is detectable until afailure occurs is denoted the P-F interval. Thelength of the P-F interval is assumed to varyfrom time to time, and is therefore modeled as arandom variable. In order to establish an optimalmaintenance interval, τ, the following quantitiesmust be defined:
'� Delay time, i.e. the time from a“potential failure” is revealed until anappropriate corrective action iscompleted. For simplicity the delay timeis considered as a deterministic quantity.
FL: Cost of (manual) inspection.FX: Cost of (unplanned) failure.73): PF interval (random variable).µ: E(73)) = Mean value of P-F interval.σ: SD(7PF) = Standard deviation of P-F
interval.MTTF:Mean time to failure if no corrective
maintenance is carried out
The expected cost per unit time is given by:
&
F F H 7 W ' GWL X
W
3)
( )
Pr( )
τλ τ
τ
λτ
=+ ≤ − +−∫
0
where λ=1/(MTTF-µ), and we have assumedthat the time from the component is in a perfectstate until a potential failure reveals is

Rausand&Vatn Reliability Centered Maintenance
21
exponentially distributed.
In order to optimize Eq. (1) numerical values arerequired for ci, cu, MTTF, D, µ and σ. Numericalmethods are usually required to optimize Eq.(1). The calculations will be simplified if wechoose a distribution for TPF with a closed formof the cumulative distribution function.
Model 5 - Continuos on-condition tasks
The idea of continuos on-condition monitoringis to measure one or more indicator variable.The reading of the component in this mannercan be used to detect a coming failure. Thevariable being monitored is denoted X(t) inFigure 11.
Time
X(t)
"Failure Limit"
Failure
"Action Limit"
Figure 11 Continuos monitoring
In Figure 11 the deteriorating process is shown.Here X(t) is can be interpreted as the cumulativedamage at time t. When the damage exceedssome limit, a failure occurs. In Figure 11 wehave also shown an “action limit”, upon whereto take a maintenance action. The challenge hereis to decide the optimal “action limit”. Nogeneral approach seems applicable here since thesolution is highly dependent on how X(t) ismodeled. Aven (1992) discusses one methodwhere an underlying chock model is assumed.
6WHS��� 3UHYHQWLYH� PDLQWHQDQFHFRPSDULVRQ�DQDO\VLVTwo overriding criteria for selectingmaintenance tasks are used in RCM. Each taskselected must meet two requirements:
• It must be applicable
• It must be effective
Applicability: meaning that the task is applicablein relation to our reliability knowledge and inrelation to the consequences of failure. If a taskis found based on the preceding analysis, itshould satisfy the Applicability criterion.
A PM task will be applicable if it can eliminate afailure, or at least reduce the probability ofoccurrence to an acceptable level (Hoch 1990) -or reduce the impact of failures!
Cost-effectiveness: meaning that the task doesnot cost more than the failure(s) it is going toprevent.
The PM task's effectiveness is a measure of howwell it accomplishes that purpose and if it isworth doing. Clearly, when evaluating theeffectiveness of a task, we are balancing the“cost” of “performing the maintenance with thecost of not performing it. In this context, wemay refer to the cost as follows (Hoch 1990):
1. The “cost” of a PM task may include:
• the risk of maintenance personnel error,e.g. “maintenance introduced failures”
• the risk of increasing the effect of a failureof another component while the one is outof service
• the use and cost of physical resources
• the unavailability of physical resourceselsewhere while in use on this task
• production unavailability duringmaintenance
• unavailability of protective functionsduring maintenance of these
• “The more maintenance you do the morerisk you will expose your maintenancepersonnel to”
2. On the other hand, the “cost” of a failure mayinclude:
• the consequences of the failure should itoccur (i.e. loss of production, possibleviolation of laws or regulations, reductionin plant or personnel safety, or damage toother equipment)
• the consequences of not performing thePM task even if a failure does not occur

Rausand&Vatn Reliability Centered Maintenance
22
(i.e., loss of warranty)
• increased premiums for emergency repairs(such as overtime, expediting costs, orhigh replacement power cost).
Balancing the various cost elements to achieve aglobal optimum will always be a challenge. Theconceptual RCM model in Figure 1 may be astarting point. If such a model could beestablished, and the various cost elementsincorporated, the trade-off analysis is reduced toan optimization problem with a preciselydefined mathematical model.
Often the resources available for the RCManalysis do not permit building such an overallmodel, hence we can not expect to achieve aglobal optimum. Sub-optimization can to someextent be achieved by simplifying the model inFigure 1. For example one could consider onlyone consequence at a time and/or only onemaintenance task at a time.
6WHS���� 7UHDWPHQW�RI�QRQ�06,VIn Step 4 critical items (MSIs) were selected forfurther analysis. A remaining question is what todo with the items which are not analyzed. Forplants already having a maintenance program itis reasonable to continue this program for thenon-MSIs. If a maintenance program is not ineffect, maintenance should be carried outaccording to vendor specifications if they exist,else no maintenance should be performed. SeePaglia et al (1991). for further discussion.
6WHS���� ,PSOHPHQWDWLRQA necessary basis for implementing the result ofthe RCM analysis is that the organizational andtechnical maintenance support functions areavailable. A major issue is therefore to ensurethe availability of the maintenance supportfunctions. The maintenance actions are typicallygrouped into maintenance packages, eachpackage describing what to do, and when to doit.
As indicated in the outset of this paper, manyaccidents are related to maintenance work.
When implementing a maintenance program it istherefore of vital importance to consider the riskassociated with the execution of the maintenancework. Checklists could be used to identifypotential risk involved with maintenance work:
• Can maintenance people be injured duringthe maintenance work?
• Is work permit required for execution of themaintenance work?
• Are means taken to avoid problems relatedto re-routing, by-passing etc.?
• Can failures be introduced duringmaintenance work?
• etc.
Task analysis, see e.g. Kirwan & Ainsworth(1992) may be used to reveal the risk involvedwith each maintenance job. See Hoch (1990) fora further discussion on implementing the RCManalysis results.
6WHS���� ,Q�VHUYLFH� GDWD� FROOHFWLRQDQG�XSGDWLQJAs mentioned earlier, the reliability data wehave access to at the outset of the analysis maybe scarce, or even second to none. In ouropinion, one of the most significant advantagesof RCM is that we systematically analyze anddocument the basis for our initial decisions, and,hence, can better utilize operating experience toadjust that decision as operating experience datais collected. The full benefit of RCM is thereforeonly achieved when operation and maintenanceexperience is fed back into the analysis process.
The process of updating the analysis results isalso important due to the fact that nothingremain constant, best seen considering thefollowing arguments (Smith 1993):
• The system analysis process is not perfectand requires periodic adjustments.
• The plant itself is not a constant sincedesign, equipment and operating proceduresmay change over time.
• Knowledge grows, both in terms ofunderstanding how the plant equipmentbehaves and how technology can increase
Rausand&Vatn Reliability Centered Maintenance
23
availability and reduce costs.
Reliability trends are often measured in terms ofa non-constant ROCOF (rate of occurrence offailures), see e.g. Høyland & Rausand (1994).The ROCOF measures the probability of failureas a function of calendar time, or global timesince the plant was put into operation. TheROCOF may change over time, but within onecycle the ROCOF is assumed to be constant.This means that analysis updates should be sofrequent that the ROCOF is fairly constantwithin one period.
Opposite to the ROCOF, the failure rate orFOM, is measuring the probability of failure as afunction of local time, i.e. the time elapsed sincelast repair/replacement. However, the FOM cannot be considered constant, if so there is norationale for performing scheduled replace-ment/repair.
The updating process should be concentrated onthree major time perspectives (Sandtorv &Rausand 1991):
• Short term interval adjustments
• Medium term task evaluation
• Long term revision of the initial strategy
The short term update can be considered as arevision of previous analysis results. The inputto such an analysis is updated reliability figureseither due to more data, or updated data becauseof reliability trends. This analysis should notrequire much resources, as the framework for theanalysis is already established. Only Step 5 andStep 8 in the RCM process will be affected byshort term updates.
The medium term update will also review thebasis for the selection of maintenance actions inStep 7. Analysis of maintenance experience mayidentify significant failure causes not consideredin the initial analysis, requiring an updatedFMECA analysis in Step 6. The medium termupdate therefore affects Step 5 to 8.
The long term revision will consider all steps inthe analysis. It is not sufficient to consider onlythe system being analyzed, it is required toconsider the entire plant with it's relations to theoutside world, e.g. contractual considerations,new laws regulating environmental protectionetc.
���',6&866,216� $1'&21&/86,216The following summarizes some main benefits,drawbacks and problems encountered duringapplication of the RCM method in someoffshore case studies.
*HQHUDO�EHQHILWV�Cross-discipline utilization of knowledge: Tofully utilize the benefits of the RCM concept,one needs contributions from a wider scope ofdisciplines than what is common practice. Thismeans that an RCM analysis requirescontribution from the three following disciplinecategories working closely together:
1. System/reliability analyst
2. Maintenance/operation specialist
3. Designer/manufacturer
All these categories do not need to take part inthe analysis on a full time engagement. Theyshould, however, be deeply involved in theprocess during pre- and post-analysis reviewmeetings, and quality review of final results.The result of this is that knowledge is extractedand commingled across traditional disciplineborders. It may, however, cost more at the outsetto engage all these personnel categories.
Traceability of decisions: Traditionally, PMprograms tend to be “cemented”. After sometime one hardly knows on what basis the initialdecisions were made and therefore do not wantto change those decisions. In the RCM conceptall decisions are taken based on a set ofanalytical steps, all of which should bedocumented in the analysis. When operatingexperience accumulates, one may go back andsee on what basis the initial decisions weretaken, and adjust the tasks and intervals asrequired based on the operating experience. Thisis especially important for initial decisions basedon scarce data.
Recruitment of skilled personnel formaintenance planning and execution: The RCMway of planning and updating maintenance

Rausand&Vatn Reliability Centered Maintenance
24
requires more professional skills, and istherefore a greater challenge for skilledengineers. It also provides the engineers with abroader and more attractive way of working withmaintenance than what sometimes is commontoday.
Cost aspects: As indicated, RCM will requiremore efforts both in skills and manhours whenfirst being introduced in a company. It is,however, documented by many companies andorganizations that the long term benefits will faroutweigh the initial extra costs. One problem isthat the return of investment has to be lookedupon in a long term perspective, something thatthe management is not always willing to take achance on.
Benefits related to PM-program achievement:Based on the case studies we have carried out,and experience published by others, the generalachievements of RCM in relation to a traditionalPM-programs may be summarized as follows:
• By careful analysis of the failureconsequences, the amount of PM tasks canoften be reduced, or replaced by correctivetasks or more dedicated tasks. We havetherefore chosen to include correctivemaintenance as a possible outcome of theRCM analysis.
• Emphasis has been changed from periodicrework or overhaul tasks of the largeassemblies/units to more dedicated objectoriented tasks. Consequently, conditionmonitoring has been more frequently used todetect specific failure modes.
• Requirement for spare parts has beenreduced as a result of a better justificationfor replacements.
• Design solutions have been discovered thatwere not optimal from a safety and planteconomic point of view.
3UREOHP�DUHDV�LQ�WKH�DQDO\VLV�Identification of Maintenance Significant Items:In some cases there may be very little to achieveby limiting the analysis to only include theMSIs. Smith (1993) argues that concentrating oncritical components (MSIs) is directly wrong
and that it in most analyses exclude importantequipment from appropriate attention. He writes(page 82):
“. . . we should be very carefulnot to prematurely discardcomponents as non-critical untilwe have truly identified theirproper tie and priority status tothe functions and functionalfailures”.
Other authors argue that the main objective ofthe RCM process is to create a basis formaintenance evaluation and task adjustment.The selection of MSIs will reduce this basis andresult in an insufficient evaluation process.
The rationale for working with the MSIs onlywas to reduce the analysis work. Thus there isalways a risk of an insufficient analysis whenthe non-MSIs are not subjected to a formalanalysis. In our presentation the criterion forclassifying an analysis item as “non-MSI” is:“The item should not affect any of the criticalsystem failure modes (Step 4)”. By using suchan approach the criterion for disregarding anitem is traceable, and may be reevaluated later.Further we believe that this criterion makes verygood sense.
Lack of reliability data: As indicated the fullbenefit of the RCM concept can only beachieved when we have access to reliability datafor the items being analyzed. Is now RCMworthless if we have no or very poor data at theoutset? The answer to this question is no, evenin this case the RCM approach will providesome useful information for assessingmaintenance tasks. PM intervals will, however,not be available. As a result of the analysis, weshould at least have identified the following:
• We know whether the failure involves asafety hazard to personnel, environment orequipment
• We know whether the failure affectsproduction availability
• We know whether the failure is evident orhidden
• We have a better criterion for evaluatingcost-effectiveness

Rausand&Vatn Reliability Centered Maintenance
25
Lack of reliability data will always be aproblem. First of all there are problems withgetting access to operational data with sufficientquality. Next, even if we have data, it is notstraight-forward to obtain reliability data fromthe operational data. Before we discuss someproblems with collecting and using operationaldata, it should be emphasized that there willnever be a complete lack of reliability figures.Even if no operational data is available, expertjudgment will be available. However, theuncertainty in the reliability figures can be verylarge.
Based on our various engagements in theOREDA project and other data collectionprojects on offshore installations, we haveexperienced the following common difficultiesrelated to acquisition of failure data:
• Data is generally very repair oriented and notdirected towards describing failure causes,modes and effects.
• How the failure was detected is rarely stated(e.g. by inspection, monitoring, PM, tests,casual observation). This information is veryuseful in order to select applicable tasks.
• Failure modes can sometimes be deduced,but this is generally left to the data collectorto interpret.
• The true failure cause is rarely found, but thefailure symptom can to some extent betraced.
• Failure effect on the lower indenture level isreasonably well described, but may often bemissing on higher indenture level (systemlevel).
• Operating conditions when the failureoccurred is frequently missing or vaguelystated.
As mentioned above, there are often problemswith estimating reliability data from theoperational data. Reliability data comprisesMTTR and MTTF figures together with thefailure rate function. Reasonable estimates forMTTR and MTTF may be found by variousaveraging techniques. The failure rate function,i.e. the ageing parameter is much harder toobtain. Available estimation techniques requireno reliability trend (in calendar time) for the
unit(s) being considered. Further if several unitsare used to enlarge the data set, these unitsshould be operated identically under the sameenvironmental conditions. The requirementsabove are very seldom fulfilled, hence theestimation techniques may collapse. Wetherefore recommend use of expert judgment toestablish appropriate ageing parameters. Theageing parameter is a measure of “howdeterministic” a failure is, and it is reasonable tobelieve that this measure is relatively constantfor each failure cause. On the other hand, itseems meaningless to establish a general set ofrecommended MTTF-figures for the variousfailure mechanisms.
Trade-off analyses: There are four major criteriafor the assessment of the consequences of afailure: safety, environment, productionavailability, and economic losses. During theanalysis, we have to quantify these measures tosome extent to be able to use them as decisioncriteria. Further, a trade-off analysis is requiredto balance each means against the differentconsequences. Referring to Figure 1 we need toconsider the effect of the maintenance tasksM1,M2,.., on the consequences C1,C2,..,. This willrequire comprehensive reliability models.Further, the transformation of the consequencesC1,C2,.., into a unidimensional loss function is atbest a difficult and controversial task. Aframework for dealing with these problems isgiven in Vatn et al. 1996.
Assessing proper interval: The RCM concept isvery valuable in assessing the proper type of PMtask, but traditionally RCM does not basicallyinclude any “tool” for deciding optimalintervals. The "new” framework for RCM givenin Figure 1 together with standard PM-modelslisted under Step 8 are believed to form a verysound basis for deciding optimal intervals.
&RQFOXVLRQV�RCM is not a simple and straightforward way ofoptimizing maintenance, but ensures that onedoes not jump to conclusions before all the rightquestions are asked and answers given. RCMcan in many respects be compared with QualityAssurance. By rephrasing the definition of QA,RCM can be defined

Rausand&Vatn Reliability Centered Maintenance
26
All systematic actionsrequired to plan and verifythat the efforts spent onpreventive maintenance areapplicable and cost-effective.
Thus, RCM does not contain any basically newmethod. Rather, RCM is a more structured wayof utilizing the best of several methods anddisciplines. Quoting Malik (1990) the authorpostulates: “. . .there is more isolation betweenpractitioners of maintenance and theresearchers than in any other professionalactivity”. We see the RCM concept as a way toreduce this “isolation” by closing the gapbetween the traditionally more design relatedreliability methods, and the practical relatedoperating and maintenance personnel.
5()(5(1&(6
R. T. Anderson and L. Neri. Reliability-CenteredMaintenance. Management and EngineeringMethods. Elsevier Applied Science, London,1990.
T. Aven. Reliability and Risk Analysis. ElsevierScience Publishers, London, 1992.
K. M. Blache and A. B. Shrivastava. Definingfailure of manufacturing machinery &equipment. Proceedings Annual Reliabilityand Maintainability Symposium, pages 69-75, 1994.
B. S. Blanchard and W. J. Fabrycky. SystemEngineering and Analysis. Prentice-Hall,Inc., Englewood Cliffs, New Jersey 07632,1981.
BS 5760-5. Reliability of systems, equipments andcomponents; Part 5: Guide to failure modes,effects and criticality analysis (FMEA andFMECA). British Standards Institution,London, 1991.
N. Cross. Engineering Design Methods: Strategiesfor Product Design. John Wiley & Sons,Chichester, 1994.
R. R. Hoch. A Practical Application of ReliabilityCentered Maintenance. The AmericanSociety of Mechanical Engineers, 90-JPGC/Pwr-51, Joint ASME/IEEE PowerGen. Conf., Boston, MA, 21-25 Oct., 1990.
A. Høyland and M. Rausand. Reliability Theory;Models and Statistical Methods. John Wiley& Sons, New York, 1994.
IEC 50(191). International ElectrotechnicalVocabulary (IEV) - Chapter 191 -Dependability and quality of service.International Electrotechnical Commission,Geneva, 1990.
IEC 812. Analysis Techniques for System Reliability- Procedures for Failure Modes and EffectsAnalysis (FMEA). InternationalElectrotechnical Commission, Geneva,1985.
B. Kirwan and L. K. Ainsworth. A Guide to TaskAnalysis. Taylor & Francis, London, 1992.
M.A. Malik. Reliable preventive maintenancescheduling. AIEE Trans., 11:221-228, 1990.
M. A. Moss. Designing for Minimal MaintenanceExpense. The Practical Application ofReliability and Maintainability. MarcelDekker, Inc., New York, 1985.
J. Moubray. Reliability-centred Maintenance.Butterworth-Heinemann, Oxford, 1991.
F. S. Nowlan and H. F. Heap. Reliability-centeredMaintenance. Technical Report AD/A066-579, National Technical InformationService, US Department of Commerce,Springfield, Virginia, 1978.
NPD. Regulations concerning implementation anduse of risk analyses in the petroleumactivities. Norwegian Petroleum Directorate,P.O.Box 600, N-4001 Stavanger, Norway,1991.
OREDA-97. Offshore Reliability Data. Distributedby Det Norske Veritas, P.O.Box 300, N-1322 Høvik, Norway, 3 edition, 1997.Prepared by SINTEF IndustrialManagement. N-7034 Trondheim, Norway.
A.M. Paglia, D.D. Barnard, and D.E. Sonnett. ACase Study of the RCM Project at V.C.Summer Nuclear Generating Station. 4thInternational Power Generation Exhibitionand Conference, Tampa, Florida, US,5:1003-1013, 1991.
G. Pahl and W. Beitz. Engineering Design. TheDesign Council, London, 1984.
M. Rausand and J. Vatn. Reliability CenteredMaintenance. In C. G. Soares, editor, Riskand Reliability in Marine Technology.Balkema, Holland, 1997.
H. Sandtorv and M. Rausand. RCM - closing theloop between design and operationreliability. Maintenance, 6, No.1:13-21,1991.
A. M. Smith. Reliability-Centered Maintenance.McGraw-Hill, Inc, New York, 1993.
D. J. Smith. Reliability, Maintainability and Risk,Practical methods for engineers.

Rausand&Vatn Reliability Centered Maintenance
27
Butterworth Heinemann, Oxford, 4thedition, 1993.
W. L. Smith and M. R. Leadbetter. On the renewalfunction for the Weibull distribution.Technometrics, 5:393-396, 1963.
Weapon Systems and Support Equipment.Reliability-Centered Maintenance.Requirements for Naval Aircraft. USDepartment of Defense, Washington DC20301, 1986.
C. Valdez-Flores and R.M. Feldman. A survey ofpreventive maintenance models forstochastically deteriorating single-unitsystems. Naval Research LogisticsQuarterly, 36:419-446, 1989.
J. Vatn. Maintenance Optimization from a DecisionTheoretical Point of View. In Proceedings,ESREL’95, pages 273-285, London, 1995.Chameleon Press Limited.
J. Vatn, P. Hokstad, and L. Bodsberg. An overallmodel for maintenance optimization.Reliability Engineering and System Safety,51:241-257, 1996.