investigating energy expenditure in wheelchair athletes · investigating energy expenditure in...
TRANSCRIPT
Loughborough UniversityInstitutional Repository
Investigating energyexpenditure in wheelchair
athletes
This item was submitted to Loughborough University's Institutional Repositoryby the/an author.
Additional Information:
• A Doctoral Thesis. Submitted in partial fulfillment of the requirementsfor the award of Doctor of Philosophy of Loughborough University.
Metadata Record: https://dspace.lboro.ac.uk/2134/9788
Publisher: c© L.E. Croft
Please cite the published version.

This item was submitted to Loughborough’s Institutional Repository (https://dspace.lboro.ac.uk/) by the author and is made available under the
following Creative Commons Licence conditions.
For the full text of this licence, please go to: http://creativecommons.org/licenses/by-nc-nd/2.5/
Investigating energy expenditure in
wheelchair athletes
Louise Croft
A Doctoral Thesis
Submitted in partial fulfilment of the requirements for the award of Doctor of
Philosophy of Loughborough University
October 2011
© by L.E. Croft (2011)
Abstract
The increased participation in elite wheelchair sport has provided the need to
investigate the physiological requirements of wheelchair sporting competition and daily
wheelchair propulsion. However, from a nutritional perspective, guidelines that have been
established from the able-bodied population tend to be used by the practitioners working in
disability sport and it is not known whether this information is directly transferable to the
wheelchair athlete. Wheelchair sport is complex and athletes differ with respect to their
sports classification based on factors relating to disability and functional capacity.
Therefore, if nutritional guidance is required to optimise performance then information
regarding energy expenditure (EE) in the wheelchair sports population becomes important
for specific feedback. The aim of this thesis was to investigate EE in wheelchair athletes.
The results from Chapter 3 found resting energy expenditure (REE) in tetraplegic
athletes to be lower than that calculated using predictive equations derived from an able-
bodied cohort. However, paraplegic athletes showed comparable values to those which
were predicted, suggesting these equations may be of use in paraplegic athletes. Chapter 4
extended this work and found similarities in the REE of the two aforementioned cohorts.
This could have been due to the similarities that were found in their total-body fat free
mass (FFM). The results from Chapter 5 showed EE reduced after both a short 36 minute
exposure of wheelchair propulsion and after 3 weeks of wheelchair propulsion practice in
novice wheelchair users. Temporal parameters improved after the practice period,
suggesting there is an association between EE and propulsion technique. Chapter 6
extended these findings with results confirming that experienced wheelchair users
expended significantly less energy during wheelchair propulsion than novice individuals
who had up to 3 weeks practice. It is clear that EE of daily wheelchair ambulation should
not be a generic value and different levels of experience must be considered so that the
nutritional needs can be tailored accordingly.
Chapters 7 and 8 examined the physiological demands of elite competitive
wheelchair basketball players in relation to the International Wheelchair Basketball
Federation (IWBF) classification categories and identified differences in the physiological
demands and physiological fitness of wheelchair basketball and tennis players. These
results found that IWBF Class 3 – 4.5 (high point) players expended more energy per hour
during competition than those with a lower classification (IWBF Class 1 – 2.5). However,
when actual playing time was considered the low classification group showed a similar EE
to the higher classification group. Furthermore, wheelchair basketball players had a higher
EE per hour than wheelchair tennis players during elite competition. However, the
wheelchair tennis players spent a significantly longer duration on court resulting in similar
EE during a typical competition within each sport. This suggests nutritional advice should
be tailored both to the duration of competitive play (where EE may be similar between
sports (basketball vs. tennis)); and to training (where athletes with a higher functional
capacity may have higher EE). This thesis revealed several important physiological
considerations to appreciate when investigating the EE of wheelchair sportsmen and
women. Findings would suggest that type of disability, wheelchair propulsion experience
and sport classification are all important considerations for the accurate assessment of EE
in this cohort of athletes.
Key Words: Paralympic athletes, wheelchair propulsion, energy cost, physiology, fat free
mass, sports performance.
i

Acknowledgements
Throughout my PhD there have been many challenges and completion of this thesis
would not have been possible without the help of many important individuals. I owe so
much gratitude to my supervisor, Dr Vicky Tolfrey. Through her calm and positive
approach, she allowed me to complete this research and provided many opportunities to
work with Paralympic sports teams. I have learnt so much and have grown as a sports
physiologist and as an academic in the last three years. I am tremendously grateful to
Vicky for this opportunity. I am also very grateful to Dr Keith Tolfrey for the consistent
support and feedback he provided over the three years. His thoughtful advice helped the
completion of this thesis. I owe an enormous amount of thanks to John Lenton who helped
with the data collection, assisted in analysis and provided helpful advice throughout. The
input of Dr Barry Mason and Christof Leicht must be acknowledged for the support they
provided during data collection and writing.
I was fortunate during my studies to have met several European experts in spinal
cord injury rehabilitation and sport. My discussions with Professor Lucas van der Woude,
Professor Thomas Janssen and Dr Claudio Perrett have helped shape this thesis and I am
very grateful for their generous advice. I am also grateful to Jeanette Crosland who
initiated many of the ideas behind this research and Dr Katherine Brooke-Wavell for her
valued input to the earlier part of my work. I am indebted to ParalympicsGB, the School of
Sport, Exercise and Health Sciences at Loughborough, and the Peter Harrison Centre for
Disability Sport, who supported and financially contributed to this PhD. Mhairi Keil and
Dr Rachel Duckham must be thanked for their assistance and expertise during data
collection. Thanks also go to Bob Budge, John and Marta for their technical assistance and
the help of Suzanne Dybrus, Katie Griggs and Alicia Lauckner was paramount for data
collection. The staff at Bromakin wheelchairs have all been extremely generous with the
provision of wheelchairs for data collection and appreciation goes to them.
I am forever grateful to my friends who have helped calm me down and provide
help with my PhD but, equally as important, have provided a lot of fun times and great
company over these 3 years. Jules, Steve, Tom, Mel, Tracey and Charlotte, thank you!
Finally, a huge thank you goes to the athletes, coaches and support staff from the Great
Britain wheelchair basketball and rugby squads, alongside the individual Paralympic
athletes who have sacrificed their time to participate in my studies; I wish you the best of
luck for London 2012.
ii

Dedication
This thesis is dedicated to my Mum and Dad whose tireless support and
encouragement has helped me through the three years. Their advice is used every day in
the way I approach work and life. Thank you for everything.
iii
Preface
Part of the research presented throughout the current thesis has been peer reviewed
through the following publications and communications:
Publications
Chapter 8: Appendix I
Croft, L., Dybrus, S., Lenton, J. and Goosey-Tolfrey, V. (2010). A comparison of the
physiological demands of wheelchair basketball and wheelchair tennis. International
Journal of Sports Physiology and Performance, 5, 301-315.
Conference communications
Chapter 4:
Resting energy expenditure in relation to fat-free mass in elite wheelchair sportsmen
(Poster). British Association of Sport and Exercise Sciences Annual Conference 2010,
University of Glasgow, UK.
Chapter 7:
Energy expenditure and physiological responses between classification groups in
wheelchair basketball (Oral). International Paralympic Committee, VISTA conference.
2011, Bonn, Germany.
iv

Contents
Page
Abstract……………………………………………………………………………..
Acknowledgements…………………………………………………………………
Dedication……….……………………………………………………………….....
Preface……………………………………………………………………………....
Contents……………………………………………………………………………..
List of Tables………………………………………………………………………..
List of Figures……………………………………………………………………....
List of Abbreviations……………………………………………………………….
Chapter One Introduction…………………………………………………… 1
1.1 Aims and objectives of the thesis……………………………... 2
1.2 Organisation of thesis.....................................………………… 3
Chapter Two Literature Review……………………………………………... 5
2.1 Metabolism and EE…...........................……………………… 5
2.1.1 Metabolism…………………………………………………….. 5
2.1.2 Indirect calorimetry……………………………………………. 6
2.1.3 Total EE………………………………………………………… 8
2.2 Introduction to wheelchair sports……………………………. 9
2.2.1 Amputation…………………………………………………….. 10
2.2.2 Spinal cord injury………………………………………………. 11
2.2.3 Post-polio (Poliomyelitis)……………………………………… 12
2.2.4 Spina bifida……………………………………………………... 12
v
i
ii
iii
iv
v
x
xii
xv

2.3 Physiological changes with SCI and amputation……………. 15
2.3.1 Spinal cord injury and body composition………………………. 15
2.3.2 Spinal cord injury and the physiological responses to exercise… 17
2.3.3 Amputation and the response to exercise…………………….... 19
2.4 Physiology of exercise in wheelchair users…………………... 19
2.4.1 Maximal cardiovascular capacity……………………………… 19
2.4.2 Physiological parameters of wheelchair users during sub-…….…
maximal exercise……………………………………………….. 24
2.5 Resting energy expenditure……………………………………. 25
2.5.1 Resting energy expenditure in the able-bodied population…….. 25
2.5.2 Resting energy expenditure in the disabled population………… 26
2.5.3 Resting energy expenditure and FFM in the able-bodied athletic………..
population……………………………………………………… 27
2.5.4 Resting energy expenditure and FFM in the disabled athletic………..
population………………………………………………………. 31
2.6 Energy expenditure during daily living……………………… 32
2.6.1 Energy expenditure during daily activities in wheelchair users.. 33
2.6.2 Daily speeds in wheelchair propulsion………………………… 34
2.6.3 Energy expenditure of wheelchair propulsion in different ………
populations……………………………………………………… 36
2.7 Energy expenditure and O2 cost during wheelchair sports… 39
2.7.1 Wheelchair basketball………………………………………….. 40
2.7.2 Wheelchair rugby………………………………………………. 40
2.7.3 Wheelchair tennis………………………………………………. 40
2.7.4 Endurance performance………………………………………… 41
2.7.5 Classification of wheelchair sport………………………………. 41
2.8 Summary………………………………………………………... 43
vi
Chapter Three Resting energy expenditure in elite sportsmen with a disability 45
3.1 Abstract…………………………………………………………… 45
3.2 Introduction………………………………………………………. 46
3.3 Methods…………………………………………………………... 48
3.4 Results……………………………………………………………. 51
3.5 Discussion………………………………………………………... 53
3.6 Conclusions………………………………………………………. 55
Chapter Four Resting energy expenditure in relation to fat free mass in………
wheelchair sportsmen…………………………………………... 56
4.1 Abstract………………………………………………………….... 56
4.2 Introduction………………………………………………………. 57
4.3 Methods…………………………………………………………... 58
4.4 Results…………………………………………………………….. 61
4.5 Discussion………………………………………………………... 63
4.6 Conclusions………………………………………………………. 68
Chapter Five Energy expenditure of wheelchair propulsion in novice
individuals after three weeks practice………………………… 69
5.1 Abstract……………………………………………………………. 69
5.2 Introduction……………………………………………………….. 70
5.3 Methods…………………………………………………………… 71
5.4 Results…………………………………………………………….. 76
5.5 Discussion………………………………………………………… 80
5.6 Conclusions………………………………………………………. 85
vii

Chapter Six Energy expenditure of wheelchair propulsion at fixed power
outputs: effect of experience…………………………..…………. 86
6.1 Abstract……………………………………………………………. 86
6.2 Introduction……………………………………………………….. 87
6.3 Methods…………………………………………………………… 88
6.4 Results…………………………………………………………….. 90
6.5 Discussion………………………………………………………… 94
6.6 Conclusions…………………………………………………… 99
Chapter Seven Energy expenditure and physiological responses between
classification groups in wheelchair basketball………………... 100
7.1 Abstract…………………………………………………………… 100
7.2 Introduction………………………………………………………. 101
7.3 Methods…………………………………………………………… 103
7.4 Results…………………………………………………………….. 106
7.5 Discussion………………………………………………………… 111
7.6 Conclusions………………………………………………………. 116
Chapter Eight A comparison of the physiological demands and energy………
expenditure of wheelchair basketball and wheelchair tennis…. 117
8.1 Abstract……………………………………………………………. 117
8.2 Introduction……………………………………………………….. 118
8.3 Methods…………………………………………………………… 119
8.4 Results…………………………………………………………….. 124
8.5 Discussion………………………………………………………… 131
8.6 Conclusions………………………………………………………. 137
viii
Chapter Nine General Discussion………………………………………………. 138
9.1 Resting energy expenditure in relation to predictive equations………
and body composition……………………………………………. 139
9.2 The effect of practice and experience on the EE of wheelchair………
propulsion during daily ambulation……………………………… 140
9.3 Physiological variables and EE of wheelchair sports competition…..….
with comparisons between sports and between classifications…. 142
9.4 Practical Implications…………………………………………….. 144
9.5 Future directions…………………………………………………. 146
Chapter Ten References……………………………………………………….. 148
Appendix...…………………………………………………………………………….. 176
ix

List of Tables
Page
2.1 Energy balance for glucose and palmitate (taken directly from Ferrannini,
1988)……………………………………………………………………………. 7
2.2 A comparison of DXA-determined body composition between an ambulant
male wheelchair athlete and a male wheelchair athlete with an SCI…………..
2.3 A selection of studies reporting mean (± 2peak and HRpeak of
paraplegic and tetraplegic individuals during upper body exercise…………..
2.4 A selection of studies reporting mean (± 2peak and HRpeak of wheelchair
basketball players and a review of the literature for mean (± 2peak and
HRpeak of wheelchair tennis and rugby players………..……….
2.5 Resting energy expenditure prediction equations and corresponding estimated
value..…………………………………………………………………………..
2.6 Measured and predicted REE of athletic and non-athletic disabled individuals.
2.7 Energy expenditure of daily wheelchair propulsion in experienced wheelchair
users…………………………………………………………………………….
2.8 Mean O2 at fixed speeds for novice able-bodied individuals during
wheelchair propulsion………………………………………………………….
2.9 Mean O2 at fixed speeds during wheelchair propulsion for experienced
wheelchair users………………………………………………………………...
3.1 Participant characteristics with respect to the disability classification of
tetraplegia, paraplegia and non-spinal cord injured (non-SCI). Values are
means (±SD)…………………………………………………………………….
3.2 Measured and predicted REE in tetraplegic, paraplegic and non-SCI
participants. Values are means (±SD)…………………………………………..
4.1 Participant characteristics with respect to the disability classification of
tetraplegia and paraplegia. Values are means (±SD)…………………………...
4.2 Absolute REE (kcal∙h-1
) and covariate adjusted REE in tetraplegic and
paraplegic participants. Values are means (±SD)………………………………
5.1 Participant characteristics for PRAC (n=11) and CON (n=11). Values are
means (±SD)…………………………………………………………………….
x
16
22
23
28
29
35
37
38
49
52
59
62
77
5.2 Gross efficiency, HR, RPE and ·VO2 for PRAC and CON at the 3 speeds and
results of the 2x2 (time x group) mixed design ANOVA. Values are means
(±SD)…………………………………………………………………………....
6.1 Participant characteristics and 2peak of NOV, PRAC and EXP. Values are
means (±SD)……………………………………………………………………..
6.2 ea t ate 2 and RPE for NOV, PRAC and EXP at 10, 18 and 26 W.
Results of the (PO x group) mixed design ANOVA are shown. Values are means
(±SD)……………………………………………………………………………...
7.1 Participant characteristics for LOW & HIGH groups. The LOW group consists
of players from the IWBF Classification (1.0 – 2.5) and the HIGH group of
players from the IWBF Classification (3.0– 4.5). Values are means (±SD)…….
7.2 2peak, HRpeak and peak [BLa] for LOW and HIGH groups during the
laboratory physiological testing. Values are means (±SD)……………………….
7.3 a) bsolute alues a e ce ta e o es ect e eak alues o t ea ll s ee
2 and HR at LT and the reference 2 mmol.L-1
[BLa], b) [BLa], RER and
RPE at LT. Values are means (±SD)……………………………………………..
8.1 Participant characteristics of wheelchair basketball and wheelchair tennis
players. Group values are means (±SD)………………………………………….
8.2 The training zones classification in relation to LT and LTP (adapted from
Bourdon 2000; Godfrey and Whyte 2006)………………………………………
8.3 Individual physiological profile of the basketball and tennis players. Group
values are means (±SD)………………………………………………………….
xi
79
91
93
103
107
108
121
122
125

List of Figures
Page
2.1 Sympathetic nervous division. Taken from Tortora & Grabowski, (2003)…… 13
2.2 Parasympathetic nervous division. Taken from Tortora & Grabowski, (2003)... 14
2.3 Dual energy X-ray absorptiometry scans of an ambulant male wheelchair
athlete (left) and a male wheelchair athlete with an SCI (right)………………..
3.1 Cosmed K4b2 (Cosmed, Rome, Italy) and face mask attachment……………… 50
4.1 Compartmental FFM of tetraplegic and paraplegic participants. * Denotes a
significant difference between groups (p < 0.05)……………………………...
5.1 Illustration of the wheelchair during the drag test for the calculation of drag
force……………………………………………………………………………..
5.2 Illustration of the experimental pulley system set-up to ensure that a constant
PO (10 and 18W) was achieved during each practice session…………………..
5.3 Mean (±SD) EE for pre-test and post-test in the PRAC and CON at 1.1 ∙s-1
,
1.5 ∙s-1
and 1.9 ∙s-1
. * Significant difference (p < 0.01) and # (p < 0.05)
between base-line and post-test (main effect of time)…………………………
5.4 Mean (±SD) push frequency for both PRAC and CON from pre- to post-test
at 1.1 ∙s-1 1.5 ∙s
-1 a 1.9 ∙s
-1. * Significant difference (p <0.01)
between pre- and post-test at all speeds……………………………………….
5.5 Mean (±SD) for (a) resultant force (Fres), (b) tangential force (Ftan), (c)
fractional effective force (FEF), (d) work per cycle, (e) push time and (f)
recovery time during wheelchair propulsion at 1.1 ∙s-1
for PRAC and CON
for pre-test and post-test trials. *Significant difference from pre- to post-test
(p < 0.01)………………………………………………………………………..
6.1 Mean (±SD) EE (kcal·h-1
) and GE (%) for NOV, PRAC and EXP groups
during wheelchair propulsion at 10, 18 and 26 (W). *denotes a significant
main effect for group (p < 0.01); a denotes a significant main effect for PO (p
< 0.01); b denotes a significant group by PO interaction (p < 0.01)……………
xii
16
63
75
76
78
80
81
92

6.2 Mean (±SD) push frequency during wheelchair propulsion at 10, 18 and 26
W for NOV, PRAC and EXP groups. *denotes a significant main effect of
group; a denotes a significant main effect of PO………………………………...
7.1 Mean (±SD) 2 as a measure of pushing economy during wheelchair
o uls o at 2.6 ∙s-1
a 3.6 ∙s-1
ex esse as a L∙ -1
and b) relative to
body mass. Note: values were interpolated from individual regression
equations between a range of speeds completed by all participants. ………….
7.2 Mean (±SD) EE (kcalh-1
) during WBP and APT between LOW and HIGH
classification groups, WBP, p = 0.09, ES = 0.47, 95% CI -295 to 25; APT, p
= 0.11, ES = 0.44, 95% CI -308 to 36………………………………………….
7.3 Mean (±SD) HR (b∙ -1
) during WBP and APT between LOW and HIGH
classification groups. *denotes a significant difference between LOW and
HIGH groups in APT, p = 0.05. # denotes a trend towards significance in
WBP, p = 0.07, ES = 0.50, 95% CI -16.3 to 0.61……………………………...
8.1 Mean (±SD) [BLa] concentration of wheelchair basketball and wheelchair
tennis players at fixed exercise intensities…………………………………….
8.2 a) Mean (±SD) EE (kcal∙h-1
) b) duration of game play (minutes) and c) total
EE (kcal) during each game in WTP, WBP, and B-APT.*denotes a significant
difference p < 0.05 and # denotes p = 0.06…………………………………….
8.3 exa le o a basketball laye ’s R t ace u a atch show Rpeak,
average HR, and playing time. HRpeak (black horizontal line), average HR
(grey line), and time spent on court (dashed line)…………………………….
8.4 a) Mea R u co et t o (b∙ -1
), and b) % HRpeak during
competition in WTP, WBP, and B-APT. *denotes a significant difference p <
0.05 and # denotes p = 0.07……………………………………………………
8.5 A comparison of the percentage of time spent in each training zone during
wheelchair basketball actual playing time (B-APT), whole match play
(including rests, WBP) and whole match wheelchair tennis play (WTP).
alues a e ea s (± ……………………………………………………..
xiii
94
109
110
110
126
127
128
130
131

9.1 Energy expenditure values of wheelchair basketball players during training,
simulated competition and international competition…………………………
143
xiv

List of Abbreviations
Frequently used terms throughout the thesis are abbreviated below. All abbreviations
were defined in full the first time they were used in the text.
º
95% CI
AB
ANOVA
APT
ATP
B-APT
[BLa]
b∙min-1
BMR
CO2
CON
DIT
DXA
EE
ES
EXP
Fdrag
FEF
FFM
Fres
Ftan
GE
HR
h·wk-1
IWBF
IWRF
IWTF
Kcal·h-1
L·min-1
LT
LTP
m
mmol∙L-1
m∙s-1
N
O2
PO
PRAC
REE
RER
Degrees
95% confidence intervals
Able-bodied
Analysis of variance
Actual playing time
Adenosine triphosphate
Basketball actual playing time
Blood lactate
Beats per minute
Basal metabolic rate
Carbon dioxide
Control
Diet induced thermogenesis
Dual X-ray absorptiometry
Energy expenditure
Effect size
Experimental
Drag force
Fractional effective force
Fat free mass
Resultant force
Tangential force
Gross mechanical efficiency
Heart rate
Hours per week
International Wheelchair
Basketball Federation
International Wheelchair
Rugby Federation
International Wheelchair
Tennis Federation
Kilocalories an hour
Litres per minute
Lactate threshold
Lactate turn point
Minutes
Millimoles per litre
Metres per second
Newtons
Oxygen
Power output
Practice
Resting energy expenditure
Respiratory exchange ratio
( 2 2)
xv
RPE
s
SCI
2
2
VT
W
WBP
WHO
WTP
Rating of perceived exertion
Seconds
Spinal cord injury
Oxygen uptake
Carbon dioxide production
Ventilatory threshold
Watts
Wheelchair basketball play
World Health Organisation
Wheelchair tennis play
xvi

Chapter 1 Introduction
1
Chapter 1
1.0 Introduction
The Great Britain Paralympic athletes were highly successful at the Beijing 2008
Paralympic Games, the team returning with 102 medals and being placed second in the
medals table. This world-class performance may be attributed to the increased training,
professionalism and commitment to the demands of their sport by the athletes, along with
increased knowledge and sports science practice. That said, many of these athletes are still
using nutritional advice and training methods based on what is known about their able-
bodied counterparts. Through investigating the energy expenditure (EE) of daily living and
sporting competition within this cohort, specific nutritional advice can then be given. The
total daily EE of an individual includes basal metabolism (60–75%) and the thermic effect
of food (10%) alongside the energy produced through physical activity (15-30%)
(McArdle et al., 2001). Examining the various components of total EE will allow a greater
understanding of the health status and metabolic requirements of an individual. This is of
particular importance in sports performers, as these individuals need to account for energy
used during competition and regular training on top of that necessary for a normal daily
routine (Westerterp, 1998). Consequently, sports practitioners and health care professionals
can advise individuals about optimal combinations of fuel selection and training regimes in
order to maintain energy balance in relation to an individual’s lifestyle.
In the able-bodied literature, in terms of resting energy expenditure (REE),
prediction equations and general recommendations are given in relation to age, sex and
body mass (Schofield, 1985) and the energy cost of specific activities is provided in terms
of body mass (McArdle et al., 2001; Ainsworth et al., 2011). When considering the
wheelchair user population, in addition to the other key variables that can determine EE,
disability must also be accounted for. Using able-bodied values may overestimate the EE
of wheelchair users due to the latter’s reduced active muscle mass and the type of activity
completed (Davis et al., 1981; Maynard et al., 1997). Yet, the contribution of sports
training to the EE of wheelchair users could provide us with different values to those found
in a sedentary setting because of the potential for an increase in the athlete’s fat-free mass
(FFM; the sum of lean mass and bone mineral content). It is therefore essential to establish
whether able-bodied EE guidelines and recommendations used by the general and athletic
Chapter 1 Introduction
2
populations are applicable to wheelchair athletes. A greater understanding of these athletes’
EE will help increase the knowledge of the practitioners who work with them.
Whilst specific advice according to sport is necessary, understanding the general
health aspects of accurate EE calculation is also an important factor to consider, especially
in the disabled population. Paffenbarger et al. (1986) suggested that physical activity EE of
2000-2500 kcal (or more) a week can reduce the risk of mortality in a male, able-bodied
population (45-84 years). However it is questionable whether or not these
recommendations are applicable to disabled populations. This is in light of the evidence
that individuals with a chronic spinal cord injury (SCI) have lower levels of physical
activity compared to able-bodied populations (Dearwater et al., 1985; Jacobs and Nash,
2004). Accordingly, sports participation is promoted in specialist SCI units in the UK so
physical activity can be re-introduced to offset the potential negative effects of sedentary
behaviour.
The focus of the present PhD is on athletes with a disability who are not necessarily
the target group for inactivity and low fitness levels. However, this thesis will provide an
understanding of total EE in an athletic cohort and serve as a foundation to build on health-
related topics. The objective is to give athletes and practitioners information for training
practices directly for their own use, and also provide data relating to disabled sports and
wheelchair propulsion which can be used to guide individuals across the rehabilitation -
elite sports continuum. To develop the topic of EE in wheelchair athletes this thesis was
divided into three main themes (i) resting; (ii) daily propulsion; and (iii) sports competition
EE.
1.1 Aims and objectives of the thesis
The aim of the thesis was to examine the EE of wheelchair athletes. In order to
achieve this the following objectives were formulated:
1) To investigate the relationship between body composition and REE in athletes with
a disability and to compare measured values of REE to predicted equations for the
able-bodied population.
2) To explore the effect of wheelchair propulsion practice and experience on the EE of
wheelchair propulsion during daily ambulatory speeds.
Chapter 1 Introduction
3
3) To analyse the physiological variables and the EE of wheelchair sports competition,
with comparisons between sports and between disability classifications.
1.2 Organisation of the thesis
The literature review (Chapter 2) will explore the basic principles of EE in humans
and then introduce wheelchair sports and the individuals who take part in these sports. The
review will then explore the physiology of specific disabilities and how these contribute to
changes in body composition and EE. The physiological capacities wheelchair athletes can
reach will add to the understanding of differences between individuals who take part in
disability sports. The literature review will then consider the research that has investigated
EE in resting conditions and daily activities of wheelchair users and finish by examining
EE during wheelchair sports and what is needed to further this topic of interest. Three
themes will then be established for the development of the experimental chapters. These
are (a) REE in elite disabled athletes; (b) EE during daily wheelchair propulsion, exploring
the effects of manual wheelchair experience; and (c) EE during wheelchair sports
competition.
Investigating the REE of wheelchair athletes (Chapters 3 and 4) will establish
whether able-bodied predictive equations are of use in this population group. Exploring
FFM and its relationship with REE will provide a clearer picture regarding the contribution
of active metabolic mass to EE in this sporting population group. This relationship has
been established in both the healthy able-bodied and rehabilitation settings (Monroe et al.,
1998; Heymsfield et al., 2002; Buchholz et al., 2003a; Johnstone et al., 2005). Considering
the differences in FFM and REE between two separate wheelchair sports teams will
ascertain if any distinctions exist in REE due to nature of the different physiology between
the two groups.
Another aspect of the wheelchair athlete’s metabolism is related to the wheelchair
itself. Exploring the EE of wheelchair propulsion (Chapters 5 and 6) helps provide
information regarding daily activity in wheelchair users, an important consideration for the
athletes who use a wheelchair for daily living. Investigating the effect of experience on the
EE of wheelchair propulsion will provide further explanation of the EE patterns shown
during the process of learning this skill. This is an important consideration as single values

Chapter 1 Introduction
4
of EE during wheelchair activities may not be applicable to both novice individuals and
habitual wheelchair users.
Focusing on the EE of wheelchair sports competition (Chapters 7 and 8) will help
establish physiological values for these sports to help coaches and practitioners understand
more about the demands of specific Paralympic sport. Aside from the comparison between
sports, one of the biggest influences on the physiology of wheelchair athletes is
classification. Detailed information regarding the EE of separate disability classification
groups within sport can help provide more specific and individualised feedback for further
nutritional and training advice.
A general discussion and practical implications (Chapter 9) will help provide
information that practitioners and athletes can use. Future directions will lead on from the
conclusion about the important findings of this thesis and how it has contributed to the
understanding of EE in wheelchair athletes. The disabled participants recruited for these
studies all represent the Paralympic community with the majority involved in wheelchair
sports. Subsequently, the primary disabilities include SCI and amputation, with the former
as the main disability focus for this thesis. Furthermore, whilst recruitment centred on male
participants, the comparison of wheelchair sports (Chapter 8) involved four females across
the sports of wheelchair basketball and tennis.
Chapter 2 Literature Review
5
Chapter Two
2.0 Literature Review
2.1 Metabolism and EE
Measuring the EE of humans helps in the provision of nutritional requirements
needed for health and survival. Metabolic equations to predict EE in the able-bodied
population are continually being developed to provide the recommended calorie intake per
day based on an individual’s physiology (WHO, 2001).
2.1.1 Metabolism
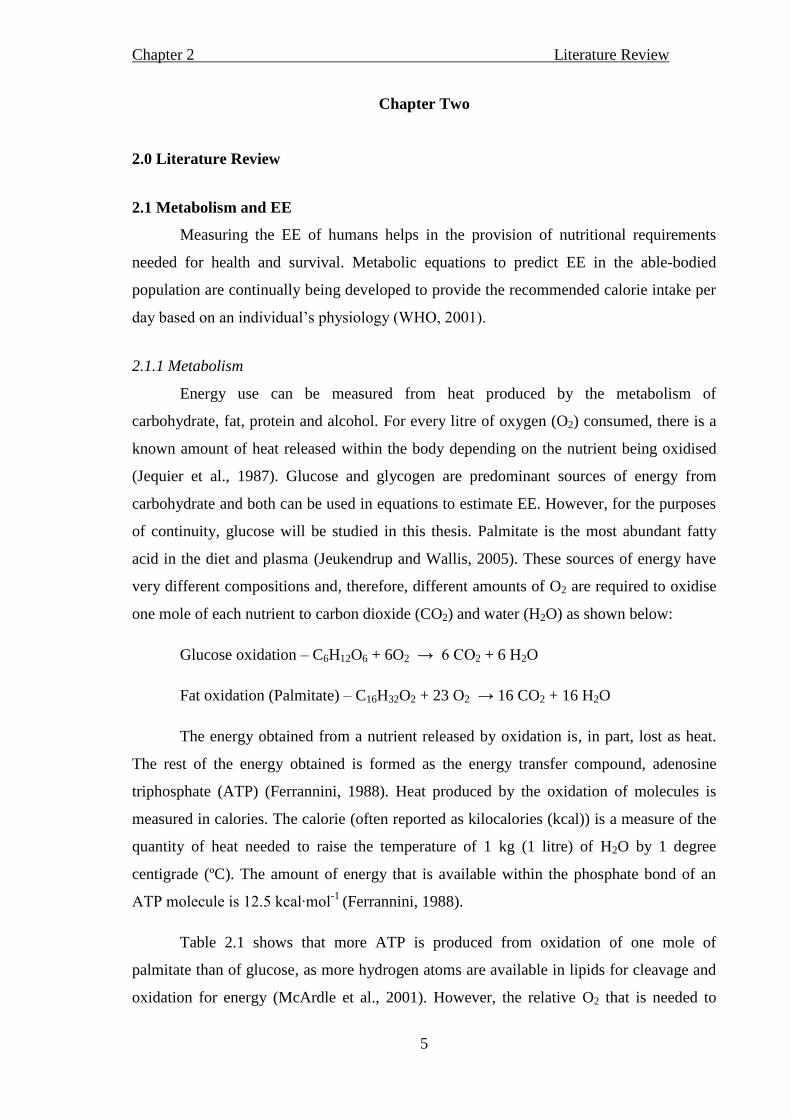
Energy use can be measured from heat produced by the metabolism of
carbohydrate, fat, protein and alcohol. For every litre of oxygen (O2) consumed, there is a
known amount of heat released within the body depending on the nutrient being oxidised
(Jequier et al., 1987). Glucose and glycogen are predominant sources of energy from
carbohydrate and both can be used in equations to estimate EE. However, for the purposes
of continuity, glucose will be studied in this thesis. Palmitate is the most abundant fatty
acid in the diet and plasma (Jeukendrup and Wallis, 2005). These sources of energy have
very different compositions and, therefore, different amounts of O2 are required to oxidise
one mole of each nutrient to carbon dioxide (CO2) and water (H2O) as shown below:
Glucose oxidation – C6H12O6 + 6O2 → 6 CO2 + 6 H2O
Fat oxidation (Palmitate) – C16H32O2 + 23 O2 → 16 CO2 + 16 H2O
The energy obtained from a nutrient released by oxidation is, in part, lost as heat.
The rest of the energy obtained is formed as the energy transfer compound, adenosine
triphosphate (ATP) (Ferrannini, 1988). Heat produced by the oxidation of molecules is
measured in calories. The calorie (often reported as kilocalories (kcal)) is a measure of the
quantity of heat needed to raise the temperature of 1 kg (1 litre) of H2O by 1 degree
centigrade (ºC). The amount of energy that is available within the phosphate bond of an
ATP molecule is 12.5 kcal∙mol-1
(Ferrannini, 1988).
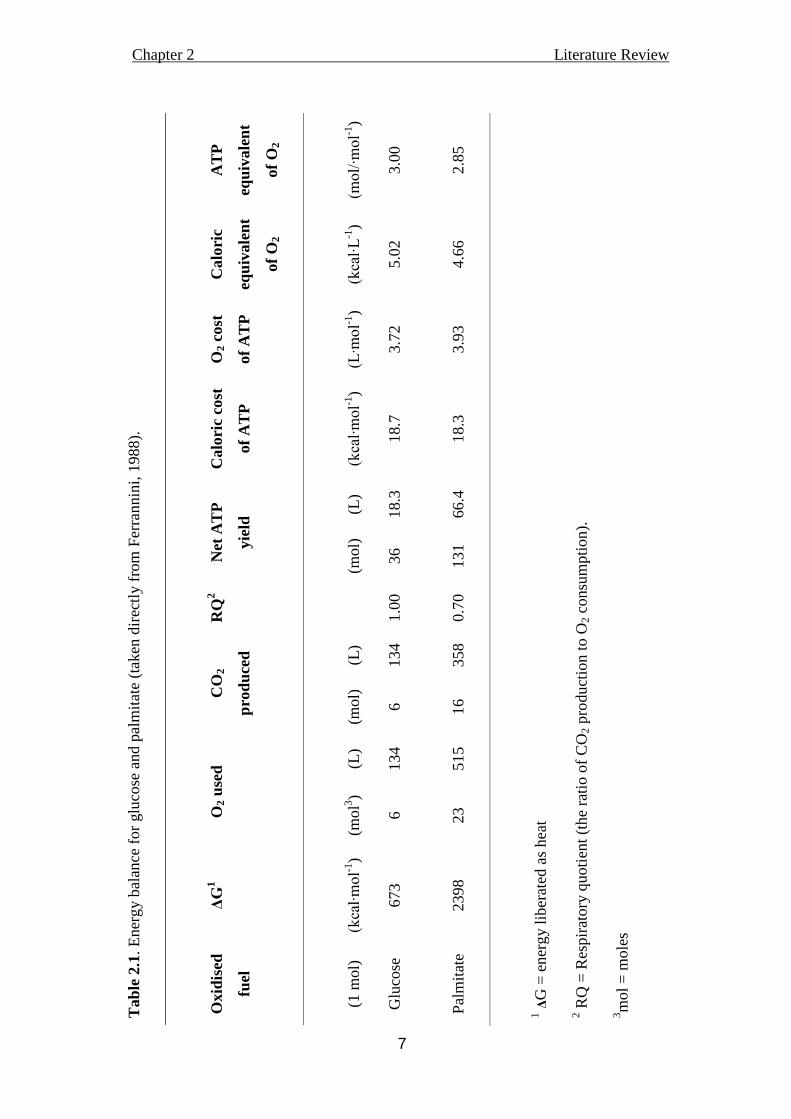
Table 2.1 shows that more ATP is produced from oxidation of one mole of
palmitate than of glucose, as more hydrogen atoms are available in lipids for cleavage and
oxidation for energy (McArdle et al., 2001). However, the relative O2 that is needed to
Chapter 2 Literature Review
6
produce the ATP from 1 mole of palmitate is higher than that of glucose. Therefore,
glucose oxidation is the most efficient way of using O2 to produce energy (Ferrannini,
1988).
2.1.2 Indirect calorimetry
Metabolic rate can be calculated through both direct and indirect calorimetry.
Direct calorimetry measures the absolute heat dissipated by the human body. However, the
response is delayed as it is measuring the actual heat loss of the body (Jequier et al., 1987).
Indirect calorimetry is the measurement of the estimated heat released by oxidative
processes, using equations based on O2 consumption ( O2), CO2 production ( CO
2), and
urinary nitrogen excretion during the measured time of metabolism. Expired gas must be
obtained for an estimation of O2 and CO2, and the changes in the O2 and CO2 in the
exhaled air along with the volume of expired gas and the ambient conditions are used to
calculate the energy metabolism of that individual. The contribution of protein to the
calculation of EE is considered negligible (McArdle et al., 2001), so often only the non-
protein calculations are implemented. Ferrannini (1988) suggested that although protein
measurement was an important consideration, if protein oxidation was misjudged by 50%
there would only be a 1.2% error in the estimation of energy production.
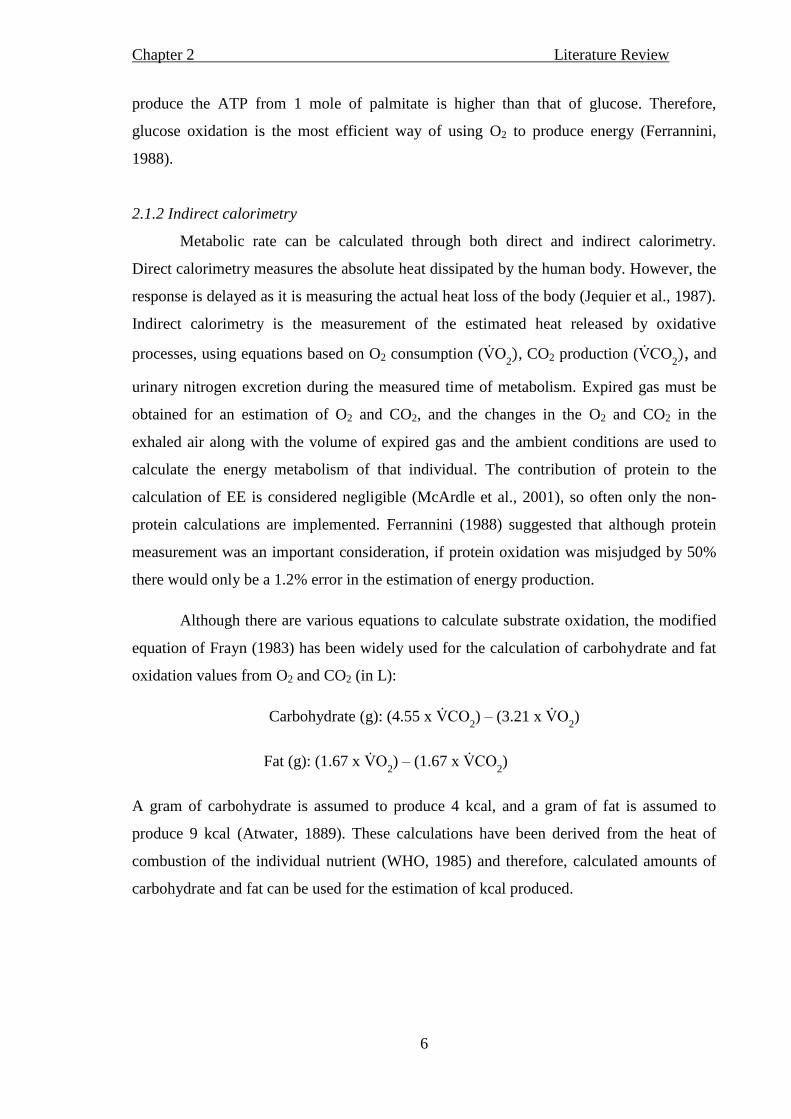
Although there are various equations to calculate substrate oxidation, the modified
equation of Frayn (1983) has been widely used for the calculation of carbohydrate and fat
oxidation values from O2 and CO2 (in L):
Carbohydrate (g): (4.55 x CO2) – (3.21 x O
2)
Fat (g): (1.67 x O2) – (1.67 x CO
2)
A gram of carbohydrate is assumed to produce 4 kcal, and a gram of fat is assumed to
produce 9 kcal (Atwater, 1889). These calculations have been derived from the heat of
combustion of the individual nutrient (WHO, 1985) and therefore, calculated amounts of
carbohydrate and fat can be used for the estimation of kcal produced.
Chapter 2 Literature Review
7
Tab
le 2
.1. E
ner
gy b
alan
ce f
or
glu
cose
and p
alm
itat
e (t
aken
dir
ectl
y f
rom
Fer
rannin
i, 1
988).
Oxid
ised
fuel
ΔG
1
O2 u
sed
CO
2
pro
du
ced
RQ
2
Net
AT
P
yie
ld
Calo
ric
cost
of
AT
P
O2 c
ost
of
AT
P
Calo
ric
equ
ivale
nt
of
O2
AT
P
equ
ivale
nt
of
O2
(1 m
ol)
(kcal∙mol-1
)
(mo
l3)
(L)
(mol)
(L)
(mol)
(L)
(kcal∙mol-1
)
(L∙mol-1
)
(kcal∙L
-1)
(mol/∙mol-1
)
Glu
cose
673
6
134
6
134
1.0
0
36
18.3
18.7
3.7
2
5.0
2
3.0
0
Pal
mit
ate
2398
23
515
16
358
0.7
0
131
66.4
18.3
3.9
3
4.6
6
2.8
5
1 Δ
G =
ener
gy l
iber
ated
as
hea
t
2 R
Q =
Res
pir
atory
quoti
ent
(the
rati
o o
f C
O2 p
roduct
ion t
o O
2 c
onsu
mpti
on).
3m
ol
= m
ole
s
Chapter 2 Literature Review
8
Indirect calorimetry requires certain assumptions to be met in order to obtain
accurate measurements. Expired gas measured from the mouth is assumed to be
representing what is happening in the body. Oxygen consumption measured from expired
gas immediately follows whole body O2 consumption as there is no O2 reserve within the
body (Ferrannini, 1988). However, at a cellular level, CO2 is produced and enters a
bicarbonate pool (Ferrannini, 1988). If hyper or hypo-ventilation occurs, the O2 and CO2
values in expired gas will not be a true reflection of the metabolism in the body and may
cause error in EE estimation. An increase in lactate from anaerobic glycolysis during
exercise leads to its hydrogen being buffered by bicarbonate. Bicarbonate is then converted
to H2O and CO2. This excess CO2 is reflected in expired gas (Beaver et al., 1986). On the
other hand, a decrease in lactate causes a reduction in hydrogen ions, and CO2 is used to
then replenish bicarbonate. This could cause an under-estimation of the body’s CO2 from
the expired gas (Ferrannini 1988). To minimise these errors, measurement of expired gas is
obtained during rest or steady state metabolism, where O2 metabolism is sufficient to meet
the energy demand of the exercising muscle (Brown et al., 2006).
2.1.3 Total EE
Total EE during a 24 hour period consists of EE at rest, the energy used to digest a
meal (diet-induced thermogenesis; DIT), and the energy used during physical activity.
Basal metabolic rate (BMR) is the energy used to maintain essential bodily functions,
reflecting the body’s heat production at rest. It represents the rate of EE of an individual
who is awake, physically and mentally rested, post-absorptive and thermo-neutral. Of the
different components of total EE, BMR accounts for 45 - 70% of total EE, depending on
age and lifestyle (WHO, 2001).
Diet-induced thermogenesis increases energy metabolism. Factors such as body
size, macronutrient and energy composition of the meal as well as the time elapsed since
the previous meal, affects the DIT (McArdle et al., 2001; Westerterp et al., 2004). For
example, protein has a high thermic effect due to the digestion of this nutrient within the
body (Westerterp et al., 2007). This means that fewer calories become available from
protein ingestion compared to fat and carbohydrate. Diet-induced thermogenesis can
account for 10% of total EE and a high protein and carbohydrate diet induces a greater
thermic response in healthy individuals compared to a diet high in fat (Westerterp, 2007).
Chapter 2 Literature Review
9
Physical activity in the able-bodied population accounts for between 15% - 30%
total daily EE. It is the component that has the greatest effect on the EE of an individual
during a 24 hour period (McArdle et al., 2001; Westerterp, 2007). It is the element which
varies the most when compared to REE and DIT (Westerterp, 2007). As this component
varies inter and intra-individually, the correct assessment of the demands of activities
becomes paramount to be able to assess an individual’s active EE. As this knowledge has
been driven through an able-bodied focus, consideration of the influence disability has on
physical activity in relation to total EE becomes an important topic.
2.2 Introduction to wheelchair sports
Wheelchair sport has grown from its rehabilitation origins at Stoke Mandeville
Hospital in England over 50 years ago to the present Paralympic games (Tweedy and
Diaper, 2010). Within the Paralympics there are twenty summer sports. However, it is
beyond the scope of the thesis to discuss all these sports and the associated disabilities.
Instead, the aim is to introduce the wheelchair sports of basketball, rugby and tennis and to
provide a brief background to these three sports in the following section.
A wheelchair basketball team comprises five players and seven substitutes. A game
is made up of four, 10-minute periods of play, typically lasting 75 minutes at international
standard (Pérez et al., 2007). As with the running game, the players must dribble the ball
and score a basket within 24 seconds of team possession (IWBF, 2010). Classification in
wheelchair basketball (points 1.0 – 4.5) is sport specific and players are classed on their
functional ability. A classification of 1.0 relates to an athlete with least functional ability
and classification 4.5 the greatest functional capacity. At any one time on the court, a value
of 14 points from the classification of five players cannot be exceeded (IWBF, 2010).
Athletes who qualify to play wheelchair basketball have a range of disabilities and any
individual who is unable to play able-bodied basketball due to their physiology or
biomechanics is eligible. The range of disabilities found in a team of wheelchair basketball
makes this cohort heterogeneous (ranging from club foot and lower limb amputation to
SCI). Therefore, when studying the physiology of a wheelchair basketball team, there will
be a large range of functional ability and disabilities to consider.
Wheelchair rugby, on the other hand, is mainly played by a homogenous group of
individuals who have an SCI with a cervical lesion level of C6 - C8 and who have limited
or no function in at least three limbs. Wheelchair rugby is played on an indoor court (28 x

Chapter 2 Literature Review
10
15 m), with a white ball identical to a volleyball and both men and women play on the
same team according to the International Wheelchair Rugby Federation (IWRF). Players
have to score a goal in between two markers at one end of the court. They must defend the
‘goal’ at the other end of the court. The game consists of four 8-min quarters (IWRF, 2009)
and typically lasts just under 70 minutes (Sarro et al., 2010). Classification is in accordance
with an individual’s functional ability in relation to the sport, alongside their physiological
capacities such as balance, muscle tone and flexibility (IWRF, 2009).
Wheelchair tennis is played by a range of individuals who are eligible to play in
one of two categories. The open classification includes individuals with disabilities such as
paraplegia, amputation, spina bifida, post-polio, brittle bones and club foot. (IWTF, 2011a).
The ‘Quad’ classification includes individuals with an SCI, lesion level of C6 – C8, or by
an individual who has a substantial loss of function in one or both of their upper limbs.
Often, the racquet is strapped to the hand during game play to help stabilise it (IWTF,
2011b). The game of wheelchair tennis is played to the same rules of the International
Tennis Federation with the exception of the ball being allowed to bounce twice. The length
of a wheelchair tennis match varies considerably with match lengths ranging from 1-3
hours (Diaper and Goosey-Tolfrey, 2009).
As previously mentioned, wheelchair sports encourage people with a variety of
disabilities to participate. The focus of the next section will be to describe some of the
eligible physical impairments of the three aforementioned wheelchair sports. The term SCI
is used in this following section to describe the consequence of a traumatic event resulting
in paralysis. It is also used as a term to include post-polio and spina bifida in the later
sections of this work. These two latter disabilities are described separately in this following
section.
2.2.1 Amputation
Amputation is performed to remove a limb due to pain or disease. Lower limb
amputations are performed on individuals with limb ischaemia (dysvascular amputation),
diabetic feet, venous ulceration or after a major trauma (Harker, 2006). Complications
associated with wound healing from an amputation are infection, pain, wound breakdown,
bone erosion, haematoma and stump oedema (Harker, 2006). For the newly amputated
individual, prostheses are often required and the stump-to-prosthesis interface is an
important issue in an amputee’s health and wellbeing. The soft tissue of the stump may

Chapter 2 Literature Review
11
become irritated or develop ulcers due to the stress it is put under from the load of the rest
of the body (Dou et al., 2006). An uncomfortable or even painful interface may result in a
reduction in physical activity and movement until the stump has healed. Depending on the
level of amputation, the limb amputated and the number of limbs removed, an individual
may use a wheelchair as their form of ambulation.
2.2.2 Spinal cord injury
Traumatic SCI results in varying types of motor, sensory and autonomic damage
(Jacobs and Nash, 2004). A loss of motor and/or sensory function in the cervical area of
the spine leads to impairment in all four limbs and the trunk (tetraplegia). A loss of motor
and/or sensory function in the thoracic, lumbar or sacral area of the spine results in
impairment of the lower limbs and/or the trunk (paraplegia) (Jacobs and Nash, 2004). The
spinal cord is part of the central nervous system and is protected by the spinal column. The
spinal column consists of eight cervical, twelve thoracic, five lumbar, five sacral and one
coccygeal vertebrae (Tweedy and Diaper, 2010). Sensory neurons enter and motor neurons
leave the spinal cord via segmental nerves which are numbered according to where they lie
in the vertebral column (Maynard et al., 1997). The central nervous system consists of the
brain and the spinal cord while the peripheral nervous system includes nerves that connect
with organs outside of the brain. The somatic nervous system controls the voluntary
contraction of skeletal muscle and this control originates from the spinal cord, brain stem
and cerebral cortex. The autonomic nervous system controls the involuntary actions of
smooth muscle, cardiac muscle and glands with SCI potentially affecting both of these
nervous systems (Maynard et al., 1997; Totora and Graboski, 2003).
When the spinal cord is damaged, excitatory impulses are prevented from travelling
past the level of the lesion. Within the sympathetic nervous system (Figure 2.1), excitatory
impulses are unable to reach the distal end of the spinal cord (Hopman et al., 1994;
Maynard et al., 1997). Therefore, skeletal muscles controlled by sections of the central
nervous system below the level of the damaged spinal cord become paralysed. However,
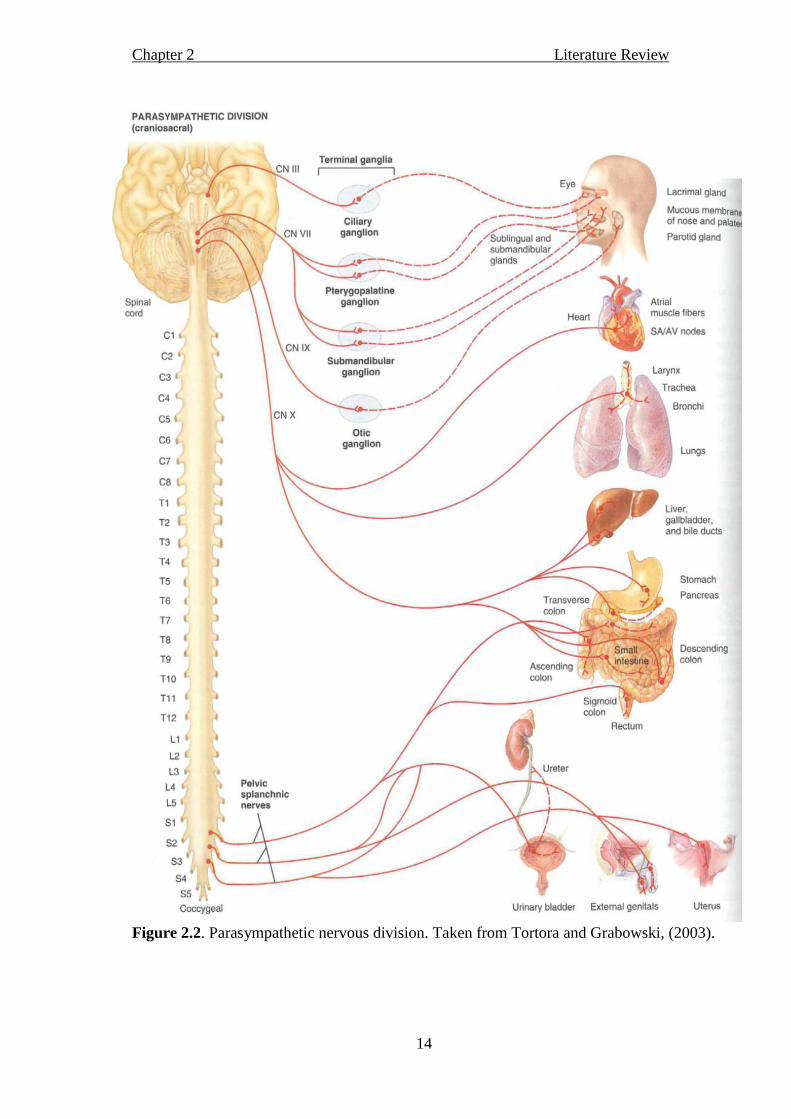
the parasympathetic nervous system has preganglionic neurons located in the brain stem
(Figure 2.2). Consequently, all SCI individuals have intact parasympathetic nerves
affecting the heart, lungs, intestine and liver. The parasympathetic nervous system
affecting the pelvis however has splanchnic nerves located in the spinal cord region of
(sacral) S2 – S5, and an individual with a lesion level above S2 may have limited

Chapter 2 Literature Review
12
parasympathetic nervous control of the bladder, genitals and uterus (Figure 2.2). The
physiological consequences of a complete SCI versus an incomplete SCI may differ
considerably. An incomplete lesion results when some of the connection between the brain
and the area below the lesion level stays intact. Some individuals who have an incomplete
SCI may use some of the muscles below the level of injury and thus have a varied
physiological response to certain stimuli (Tweedy and Diaper, 2010).
2.2.3 Post-polio (Poliomyelitis)
Post-polio (poliomyelitis) is a virus that often affects children. This virus gains
access to its human host through the mouth or pharynx where it then moves to the blood
stream (Neumann, 2004). There is a great variety of physiological consequences to polio.
However, in its most aggressive form, this disease attacks motor-neurons in the spinal cord
and the brainstem, which can lead to permanent paralysis or weakness of the muscles
(Laffont et al., 2010). Depending on the affected area of the spinal cord, an individual may
acquire permanent tetraplegia or paraplegia (Neumann, 2004).
2.2.4 Spina bifida
Spina bifida (bifida is latin for the phrase ‘left in two parts’) is a congenital defect
which occurs when a section of the vertebral arch within the spinal column either partly
fuses or does not fuse at all. The incomplete spinal cord results in paralysis of the lower
limbs in affected individuals (Foster, 2009). Myelomeningocele is the most common form
of spina bifida, accounting for 94% of cases causing neural damage due to the protrusion
of the spinal cord through the un-fused spinal column. This often leads to paralysis in the
lumbosacral segment of the spinal cord (Foster, 2009). Neurological damage in the lumbar
region of the spine can cause denervation to the bladder (see Figure 2.1). In certain
circumstances this can lead to a blockage of urine caused by neurogenic bladder, a
diseased bladder due to nerve damage of the spinal cord as a result of spina bifida (Foster,
2009).

Chapter 2 Literature Review
13
Figure 2.1. Sympathetic nervous division. Taken from Tortora and Grabowski, (2003).
Chapter 2 Literature Review
14
Figure 2.2. Parasympathetic nervous division. Taken from Tortora and Grabowski, (2003).

Chapter 2 Literature Review
15
2.3 Physiological changes with SCI and amputation
2.3.1 Spinal cord injury and body composition
Spinal cord injury results in changes in body composition due to muscle atrophy
below the level of lesion alongside bone demineralisation and joint deterioration (Wilmet
et al., 1995; Jacobs and Nash, 2004). When comparing individuals with an SCI to able-
bodied controls matched for age, a lower FFM or lean mass is shown in the former group
(Monroe et al., 1998; Spungen et al., 2000; 2003; Jones et al., 2003; Maggioni et al., 2003;
Dionyssiotis et al., 2008). Actual values of FFM have shown to vary considerably, from
51.6 kg in both tetraplegic and paraplegic individuals to 64.1 kg in an able-bodied group
(Monroe et al., 1998). Buchholz et al. (2003a) also demonstrated a lower FFM value of
64.1 kg in paraplegic individuals compared to 77.2 kg in an able-bodied cohort. Other
authors have noted a lower value of lean muscle mass in SCI when individuals with an SCI
were compared to the able-bodied population (Spungen et al., 2000; Jones et al., 2003;
Spungen et al., 2003; Dionyssiotis et al., 2008). Within the SCI rehabilitation setting,
tetraplegic individuals have a lower total lean body mass when compared to paraplegic
individuals (Spungen et al., 2003).
Results from analysis of segmental body composition suggest that lean mass in the
upper body increases by up to 15% during the first year after onset of an SCI due to
intensive rehabilitation (Wilmet et al., 1995). Although the absolute lean mass in the upper
limbs of sedentary paraplegic individuals is similar to the able-bodied population (Spungen
et al., 2000; 2003; Dionyssiotis et al., 2008), FFM in the upper body of an elite sporting
population with a disability is actually greater than that of an able-bodied cohort (Sutton et
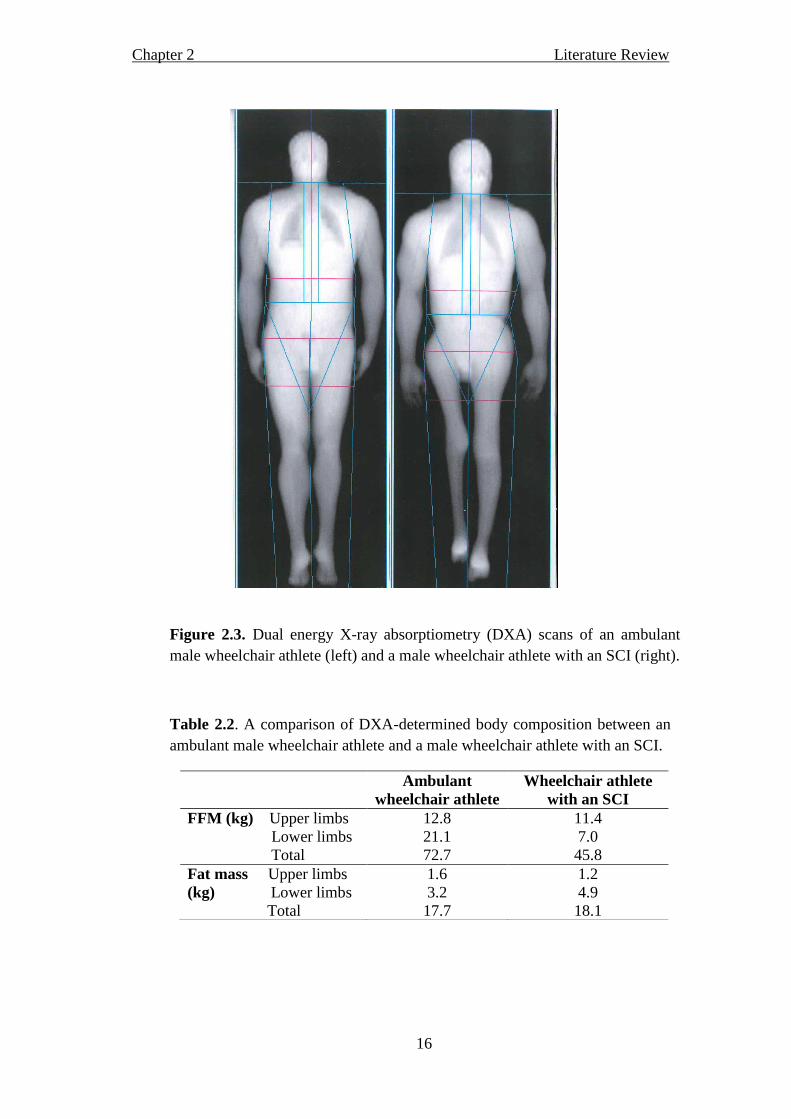
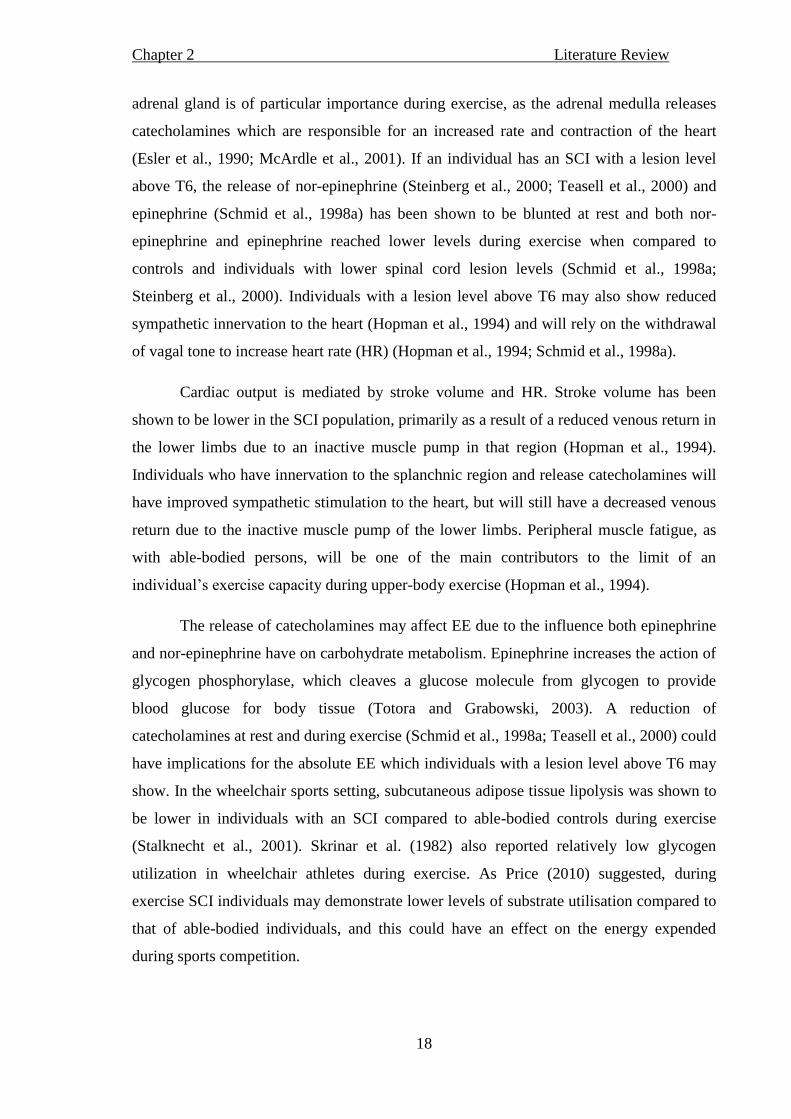
al., 2009). Figure 2.3 shows an example of body composition from dual energy X-ray
absorptiometry (DXA) scans in two wheelchair athletes, one of whom is ambulant and one
who has an SCI. There are clear differences shown in body composition in the lower limbs
of the two athletes in Figure 2.3. Table 2.2 highlights the larger amount of FFM in the
lower limbs and total body in the ambulant athlete, and the larger fat mass in the lower
limbs of the athlete with an SCI. However, the values presented here also highlight the
similarities in upper limb body composition in the two wheelchair athletes, emphasising the
impact specific sports training has on the upper body.
Chapter 2 Literature Review
16
Figure 2.3. Dual energy X-ray absorptiometry (DXA) scans of an ambulant
male wheelchair athlete (left) and a male wheelchair athlete with an SCI (right).
Table 2.2. A comparison of DXA-determined body composition between an
ambulant male wheelchair athlete and a male wheelchair athlete with an SCI.
Ambulant
wheelchair athlete
Wheelchair athlete
with an SCI
FFM (kg) Upper limbs 12.8 11.4
Lower limbs 21.1 7.0
Total 72.7 45.8
Fat mass Upper limbs 1.6 1.2
(kg) Lower limbs 3.2 4.9
Total 17.7 18.1

Chapter 2 Literature Review
17
Monitoring body composition is an important aspect from both a wheelchair sports
setting and a health perspective. Excess body mass may lead to increased rolling resistance
of the wheelchair and athlete interface which may be detrimental to performance (Reilly
and Crosland, 2010). Exploring seasonal changes in body composition or gaining a
snapshot at a particular part of the season can be an integral part of any athlete’s
preparation for competition, as it can be used to inform whether training or nutritional
interventions have been successful (Carling et al., 2009). From a health perspective, as
FFM has been shown to be an important determinant of REE in individuals with an SCI
(Buchholz et al., 2003a) the assessment of FFM should be of interest in future work. In
light of this, there are various methods for the assessment of body composition.
Traditionally, underwater weighing has been used as the most accurate estimate of body
composition. This has been achieved through the calculation of known densities of fat
mass and FFM alongside the measurement of whole-body density (Hawes and Martin,
2004). Aside from the obvious limitations of measuring individuals with a disability by
underwater weighing, it is emerging that the use of DXA, which is becoming more readily
available to researchers, is also becoming the criterion method of body composition
measurement in the able-bodied population (Hawes and Martin, 2004). However, the DXA
scan produces low levels of ionising radiation and for this reason unnecessary exposure
must be eliminated alongside rigorous ethical approval. Individuals with a disability may
be more exposed to X-rays if these are required for routine hospital check-ups, so
measuring body composition through DXA to aid metabolic research may not always be
straightforward. In light of this, skin-fold thickness assessment, a common and practical
estimation of body composition is often used. This technique involves the measurement of
subcutaneous fat which is used to represent total body fat. Skin-fold assessment is
suggested to be useful for monitoring wheelchair athletes if sum of skin-folds are used
rather than predicted body fat percentage from equations that have been calculated from
the able-bodied population (Reilly and Crosland, 2010).
2.3.2 Spinal cord injury and the physiological responses to exercise
The autonomic nervous system has a large effect on the outcome of an individual’s
physiological responses to exercise when considering central limitations to exercise. The
celiac ganglion is part of the sympathetic ganglia which lie anterior to the spinal column
close to the abdominal arteries (with innervation from T6 – T8 in the spinal column, Figure
2.1). The celiac ganglia innervate the adrenal gland and other splanchnic organs. The
Chapter 2 Literature Review
18
adrenal gland is of particular importance during exercise, as the adrenal medulla releases
catecholamines which are responsible for an increased rate and contraction of the heart
(Esler et al., 1990; McArdle et al., 2001). If an individual has an SCI with a lesion level
above T6, the release of nor-epinephrine (Steinberg et al., 2000; Teasell et al., 2000) and
epinephrine (Schmid et al., 1998a) has been shown to be blunted at rest and both nor-
epinephrine and epinephrine reached lower levels during exercise when compared to
controls and individuals with lower spinal cord lesion levels (Schmid et al., 1998a;
Steinberg et al., 2000). Individuals with a lesion level above T6 may also show reduced
sympathetic innervation to the heart (Hopman et al., 1994) and will rely on the withdrawal
of vagal tone to increase heart rate (HR) (Hopman et al., 1994; Schmid et al., 1998a).
Cardiac output is mediated by stroke volume and HR. Stroke volume has been
shown to be lower in the SCI population, primarily as a result of a reduced venous return in
the lower limbs due to an inactive muscle pump in that region (Hopman et al., 1994).
Individuals who have innervation to the splanchnic region and release catecholamines will
have improved sympathetic stimulation to the heart, but will still have a decreased venous
return due to the inactive muscle pump of the lower limbs. Peripheral muscle fatigue, as
with able-bodied persons, will be one of the main contributors to the limit of an
individual’s exercise capacity during upper-body exercise (Hopman et al., 1994).
The release of catecholamines may affect EE due to the influence both epinephrine
and nor-epinephrine have on carbohydrate metabolism. Epinephrine increases the action of
glycogen phosphorylase, which cleaves a glucose molecule from glycogen to provide
blood glucose for body tissue (Totora and Grabowski, 2003). A reduction of
catecholamines at rest and during exercise (Schmid et al., 1998a; Teasell et al., 2000) could
have implications for the absolute EE which individuals with a lesion level above T6 may
show. In the wheelchair sports setting, subcutaneous adipose tissue lipolysis was shown to
be lower in individuals with an SCI compared to able-bodied controls during exercise
(Stalknecht et al., 2001). Skrinar et al. (1982) also reported relatively low glycogen
utilization in wheelchair athletes during exercise. As Price (2010) suggested, during
exercise SCI individuals may demonstrate lower levels of substrate utilisation compared to
that of able-bodied individuals, and this could have an effect on the energy expended
during sports competition.
Chapter 2 Literature Review
19
For this thesis, within the sport of wheelchair basketball, individuals with post-
polio had paralysis in the lower limbs. The majority of individuals with spina bifida also
have a defect in the lumbar region of the spine (Foster, 2009) and, therefore, the
sympathetic nervous system will not be affected at the thoracic level and normal regulation
of the heart and catecholamine release will persist. As shown in Figure 2.1, the denervation
of the lumbar region will affect the bladder, colon, genitals and uterus. Consequently,
individuals with post-polio and spina bifida who regularly take part in exercise and elite
competition will potentially be subjected to the same limitations to exercise as low lesion
level paraplegics.
2.3.3 Amputation and the physiological response to exercise
Reduced movement and changes to an individual’s biomechanics due to an
amputation has obvious detriments to sport and physical activity. The limitations to
exercise that an individual with a lower limb amputation may be subject to will be focused
mainly on the lack of a lower extremity muscular pump. Consequently this may limit
venous return, and therefore cardiac output, during wheelchair exercise. Harker (2006)
stated that stump wounds occur mainly in the unhealthy population. Therefore, if an
individual is healthy, the limitations to exercise will not be related to an unhealed stump.
Research that has had an interest in the EE of individuals with a lower limb amputation
focuses on the increase in EE during ambulation due to extra upper-extremity weight
bearing if crutches are used, or increased EE of the remaining muscle to move the
prosthesis (Waters and Mulroy, 1999). This must be considered as part of an amputee’s
total daily EE. However, this is not the focus of the thesis, and individuals with an
amputation will be considered in regards to the energy expended during wheelchair sport.
2.4 Physiology of exercise in wheelchair users
2.4.1 Maximal cardiovascular capacity
Various physiological aspects need to be considered in relation to the small muscle
mass of the upper body during wheelchair exercise. To estimate EE during sub-maximal
exercise, the energy demand of the exercising muscle must be met by sufficient O2
metabolism (Brown et al., 2006). When this is achieved, it is termed steady state exercise.
Wheelchair propulsion has been shown to elicit a high metabolic and cardiovascular stress
when compared to lower-body exercise at a given workload (Glaser et al., 1979), so a
Chapter 2 Literature Review
20
higher O2 demand on the upper body is shown during sub-maximal exercise. This must be
considered when estimating the EE of an individual during wheelchair propulsion if
comparisons were to be made with other exercise modalities.
Maximal O2 uptake during exercise is defined as a plateau in O2 uptake even
though exercise intensity increases (McArdle et al., 2001). However, during exercise
where a small muscle mass is being used to move the whole body, peripheral fatigue may
often occur before cardiovascular fatigue. The definition of maximal O2 uptake is then
termed O2peak (Goosey-Tolfrey and Price, 2010). This may occur in upper-body exercise,
and especially during wheelchair propulsion due to the likelihood of fatigue occurring in
the small muscle mass responsible for propelling the whole body forwards (Hopman et al.,
1994). It is worthy of note that the O2peak reduces during upper-body exercise when
compared to leg exercise (Colivicchi et al., 2002).
Due to the extensive research area of O2peak in wheelchair users and wheelchair
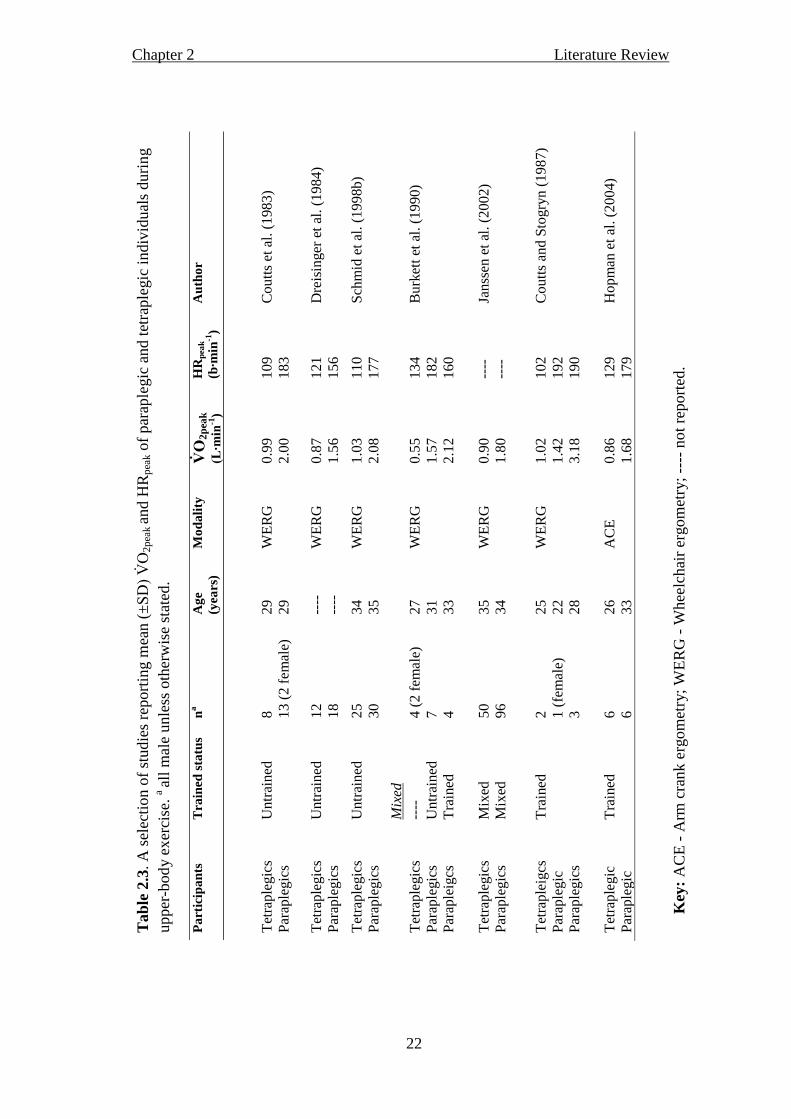
athletes, for the purposes of this review, a selection of studies are presented in Tables 2.3
and 2.4. Both tables show the O2peak and peak HR (HRpeak) of wheelchair users and
individuals completing upper-body exercise to highlight comparisons between selected
population groups. A larger physiological capacity has been shown in the able-bodied
athletic population compared to their sedentary counterparts (McArdle et al., 2001) and in
trained wheelchair athletes when compared to sedentary wheelchair users (Zwiren and Bar-
Or, 1975; Huonoker et al., 1998). Table 2.3 highlights a greater O2peak in paraplegic
compared to tetraplegic individuals (Coutts et al., 1983; Dreisinger et al., 1984; Coutts and
Stogryn, 1987; Burkett et al., 1990; Janssen et al., 2002; Hopman et al., 2004). Janssen et
al. (2002) reported the aerobic capacity of 166 SCI male individuals and produced
guidelines to suggest that tetraplegics with a O2peak of > 1.19 L∙min-1 and paraplegics
with a O2peak of > 2.31 L∙min-1
had excellent physical capacity. This highlights the greater
capacity of the paraplegic individuals with a value nearly twice that of the tetraplegic
individuals. Coutts et al. (1983) suggested the increase in functional muscle mass as SCI
lesion level decreases leads to an increased O2 delivery and/ or utilisation. A greater
functional muscle mass in the upper body of trained wheelchair athletes when compared to
un-trained able-bodied individuals (Sutton et al., 2009) may also be responsible for the
higher O2peak seen in the former group (Huonoker et al., 1998).
Chapter 2 Literature Review
21
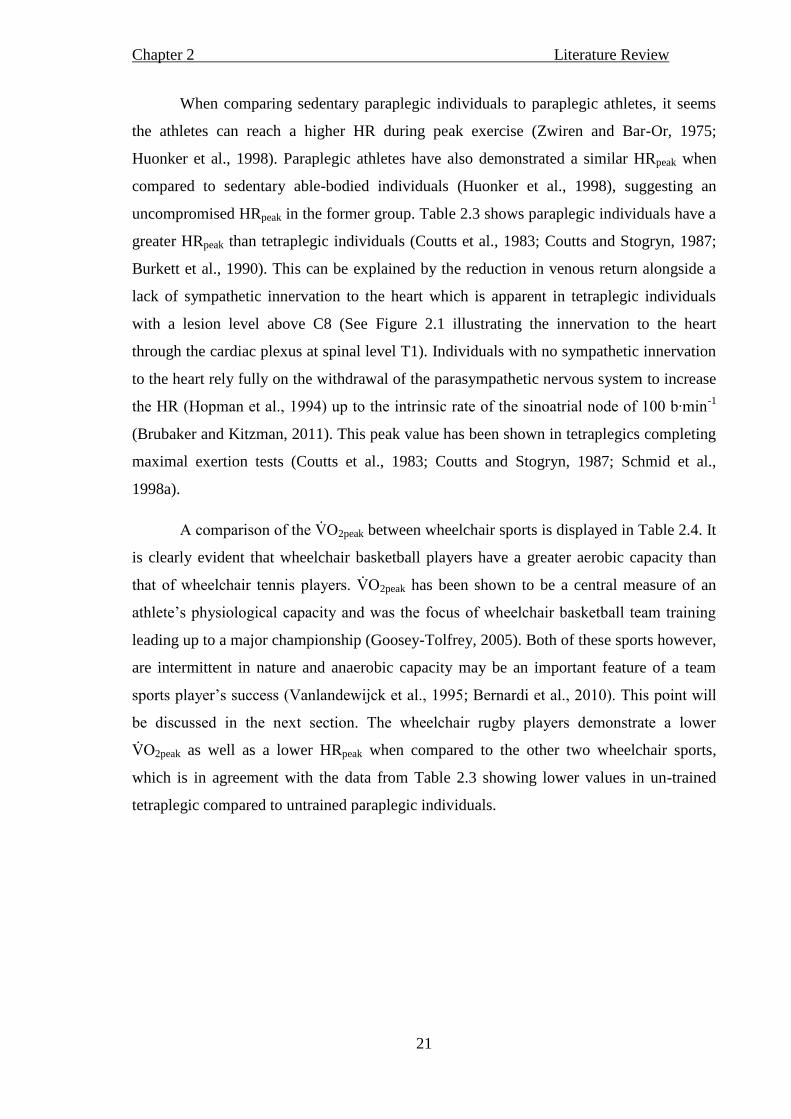
When comparing sedentary paraplegic individuals to paraplegic athletes, it seems
the athletes can reach a higher HR during peak exercise (Zwiren and Bar-Or, 1975;
Huonker et al., 1998). Paraplegic athletes have also demonstrated a similar HRpeak when
compared to sedentary able-bodied individuals (Huonker et al., 1998), suggesting an
uncompromised HRpeak in the former group. Table 2.3 shows paraplegic individuals have a
greater HRpeak than tetraplegic individuals (Coutts et al., 1983; Coutts and Stogryn, 1987;
Burkett et al., 1990). This can be explained by the reduction in venous return alongside a
lack of sympathetic innervation to the heart which is apparent in tetraplegic individuals
with a lesion level above C8 (See Figure 2.1 illustrating the innervation to the heart
through the cardiac plexus at spinal level T1). Individuals with no sympathetic innervation
to the heart rely fully on the withdrawal of the parasympathetic nervous system to increase
the HR (Hopman et al., 1994) up to the intrinsic rate of the sinoatrial node of 100 b∙min-1
(Brubaker and Kitzman, 2011). This peak value has been shown in tetraplegics completing
maximal exertion tests (Coutts et al., 1983; Coutts and Stogryn, 1987; Schmid et al.,
1998a).
A comparison of the O2peak between wheelchair sports is displayed in Table 2.4. It
is clearly evident that wheelchair basketball players have a greater aerobic capacity than
that of wheelchair tennis players. O2peak has been shown to be a central measure of an
athlete’s physiological capacity and was the focus of wheelchair basketball team training
leading up to a major championship (Goosey-Tolfrey, 2005). Both of these sports however,
are intermittent in nature and anaerobic capacity may be an important feature of a team
sports player’s success ( anlandewijck et al., 1995; ernardi et al., 2010). This point will
be discussed in the next section. The wheelchair rugby players demonstrate a lower
O2peak as well as a lower HRpeak when compared to the other two wheelchair sports,
which is in agreement with the data from Table 2.3 showing lower values in un-trained
tetraplegic compared to untrained paraplegic individuals.
Chapter 2 Literature Review
22
Tab
le 2
.3. A
sel
ecti
on o
f st
udie
s re
port
ing m
ean (
±SD) O
2p
eak a
nd H
Rp
eak o
f p
arap
legic
an
d t
etra
ple
gic
in
div
idu
als
du
rin
g
upper
-bod
y e
xer
cise
. a al
l m
ale
unle
ss o
ther
wis
e st
ated
.
Pa
rtic
ipa
nts
T
rain
ed s
tatu
s n
a
Ag
e
(yea
rs)
Mo
da
lity
V̇
O2
pea
k
(L∙m
in-1
)
HR
pea
k
(b∙m
in-1
)
Au
tho
r
Tet
rap
legic
s P
arap
legic
s U
ntr
ained
8
13
(2 f
emal
e)
29
29
WE
RG
0.9
9
2.0
0
10
9
18
3
Co
utt
s et
al.
(1
98
3)
Tet
rap
legic
s P
arap
legic
s U
ntr
ained
1
2
18
----
--
--
WE
RG
0.8
7
1.5
6
12
1
15
6
Dre
isin
ger
et
al. (1
98
4)
Tet
rap
legic
s P
arap
legic
s U
ntr
ained
2
5
30
34
35
WE
RG
1.0
3
2.0
8
11
0
17
7
Sch
mid
et
al.
(19
98
b)
M
ixed
T
etra
ple
gic
s P
arap
legic
s P
arap
leig
cs
----
U
ntr
ained
T
rain
ed
4 (
2 f
emal
e)
7
4
27
31
33
WE
RG
0.5
5
1.5
7
2.1
2
13
4
18
2
16
0
Bu
rket
t et
al.
(1
99
0)
Tet
rap
legic
s P
arap
legic
s M
ixed
M
ixed
5
0
96
35
34
WE
RG
0.9
0
1.8
0
----
--
--
Jan
ssen
et
al.
(20
02)
Tet
rap
leig
cs
Par
aple
gic
P
arap
legic
s
Tra
ined
2
1 (
fem
ale)
3
25
22
28
WE
RG
1.0
2
1.4
2
3.1
8
10
2
19
2
19
0
Co
utt
s an
d S
togry
n (
19
87)
Tet
rap
legic
P
arap
legic
T
rain
ed
6
6
26
33
AC
E
0.8
6
1.6
8
12
9
17
9
Ho
pm
an e
t al
. (2
00
4)
Key
: A
CE
- A
rm c
rank e
rgom
etry
; W
ER
G -
Whee
lchai
r er
gom
etry
; --
-- n
ot
report
ed.

Chapter 2 Literature Review
23
T
ab
le 2
.4.
A s
elec
tion o
f st
udie
s re
port
ing m
ean (
±SD) O
2p
eak a
nd H
Rp
eak o
f w
hee
lch
air
bas
ket
bal
l pla
yer
s an
d a
rev
iew
of
the
lite
ratu
re f
or
mea
n (
±SD) O
2p
eak a
nd H
Rp
eak o
f w
hee
lchai
r te
nnis
and r
ugb
y p
layer
s a al
l m
ale
un
less
oth
erw
ise
stat
ed.
Pa
rtic
ipa
nts
Im
pa
irm
en
t n
a
Mea
n a
ge
(yea
rs)
Mo
da
lity
V̇̇
O2
pea
k
(L∙m
in-1
)
HR
pea
k
(b∙m
in-1
)
Au
tho
r
WC
BB
M
ixed
52
30
MD
T
2.2
9
----
V
anla
ndew
ijck
et
al. (1
995)
WC
BB
M
ixed
12
32
WE
RG
2.8
3
185
Goose
y-T
olf
rey (
2005)
WC
BB
M
ixed
5
34
WE
RG
2.9
4
180
Pér
ez e
t al
. (2
007)
WC
BB
M
ixed
13
31
AC
E
2.7
0
189
Ber
nar
di
et a
l. (
2010)
WC
BB
M
ixed
17
25
MD
T
1.9
2
186
de
Lir
a et
al.
(2010)
WC
T
Tet
raple
gia
4
30
AC
E
1.0
3
133
Goose
y-T
olf
rey e
t al
. (2
006)
WC
T
Mix
ed
6
40
AC
E
2.1
0
144
Ro
y e
t al
. (2
006
)
WC
T
Par
aple
gic
4
39
AC
E
2.2
7
177
Ber
nar
di
et a
l. (
20
10)
WC
R
Tet
raple
gia
4
29
AC
E
0.8
9
136
Goose
y-T
olf
rey e
t al
. (2
006)
WC
R
Tet
raple
gia
8
29
MD
T
1.7
7
136
Lei
cht
et a
l. (
2011)
WC
R
Tet
raple
gia
30
31
MD
T
1.9
0
----
M
org
ule
c-A
dam
ow
icz
et a
l. (
2011)
Key
: W
CB
B –
Whee
lch
air
bas
ket
bal
l; W
CT
– W
hee
lchai
r te
nnis
; W
CR
– W
hee
lchai
r ru
gb
y;
AC
E -
Arm
cra
nk e
rgom
etry
; M
DT–
Whee
lchai
r pro
puls
ion o
n a
moto
r dri
ven
tre
adm
ill;
WE
RG
- W
hee
lchai
r er
gom
etry
; --
- not
avai
lable
.

Chapter 2 Literature Review
24
A point worthy of note is that consideration must be taken when comparing values
obtained from arm crank ergometry and wheelchair propulsion. It has been acknowledged
that gross mechanical efficiency (GE) is greater during arm crank ergometry due to the
constant force application during this movement (Price and Campbell, 1999). Although
wheelchair ergometry has a discontinuous force application, thus resulting in a less
efficient movement, it is a greater replication of wheelchair sports performance.
Wheelchair ergometry or wheelchair propulsion on a motorised treadmill therefore
provides a useful measurement tool for applicable testing to the field. Nevertheless, a large
majority of the studies that investigate wheelchair sport have used arm crank ergometry as
a form of physiological assessment. These studies are considered and compared to data
presented in this thesis because of the individuals and sports these studies represent.
2.4.2 Physiological parameters of wheelchair users during sub-maximal exercise
As expected, trained wheelchair athletes appear to show higher aerobic capacities
when compared to both sedentary wheelchair users and sedentary able-bodied individuals
(Zwiren and Bar-Or, 1975; Hooker and Wells, 1992; Huonker et al., 1998). This however,
only explains a small part of an athlete’s overall physiological capacity, and reference to
other sub-maximal physiological parameters such as ventilatory threshold and blood lactate
reference points should be made. Ventilatory threshold occurs at a workload where a
greater increase in CO2 production in respect to O2 consumption is shown (Bernardi et
al., 2010). It has also been described as occurring when a rapid rise in blood lactate is seen,
which can be observed at higher intensities than the LT (Bourdon et al. 2000).
Values of 1.35 - 2.46 L∙min-1
O2 have been shown at ventilatory threshold in
paraplegic athletes (Coutts and MacKenzie, 1995; Vinet et al., 1997; Bloxham et al., 2001;
Bernardi et al., 2010 de Lira et al., 2010) and relative values have been shown to
correspond to 5 - 4 of O2peak (Vinet et al., 1997; Bloxham et al., 2001; Bernardi et
al., 2010; de Lira et al., 2010). The relative values are lower than those reported for able-
bodied athletes during running (e.g. ventilatory threshold occurred at 65-85 of O2peak;
Suriano and Bishop, 2010). When the same exercise modality is compared (e.g. arm crank
ergometry), paraplegic athletes display a higher relative exercise intensity at anaerobic
threshold than able-bodied individuals (Schneider et al., 1999). The higher relative values
may be due to greater training in arm exercise in these athletes.

Chapter 2 Literature Review
25
From the previous literature it seems that wheelchair athletes have a superior
physiological capacity when compared to untrained able-bodied and disabled individuals
during upper body exercise. It will be of great advantage to link the physiological variables
that define wheelchair athletes in their particular sport to the EE of those sports. The
importance of descriptive physiology in this area is to establish the capacity wheelchair
athletes are achieving in relation to their sport and to their disability. However, the addition
of EE can provide data for the practitioner to help the individual athlete achieve energy
balance for optimal performance. It can also provide data on typical EE of wheelchair
sports, an important information tool when trying to encourage sedentary individuals to
become more active.
2.5 Resting energy expenditure
2.5.1 Resting energy expenditure in the able-bodied population
The energy intake requirements for the general, able-bodied population are
recommended according to sex, body mass and physical activity level (WHO, 2001). Thus,
physically active individuals will require a higher energy intake when compared to the
sedentary population for weight maintenance. To illustrate this point, it has been
recommended that a 70 kg male athlete who trains for > 90 min∙day-1
consumes 3500
kcal∙day-1
(Economos et al., 1993), which is higher than that for the inactive general
population (2450 - 2550 kcal∙day-1
) and those engaged in moderate work (3200 - 3300
kcal∙day-1
) (WHO, 2001). By obtaining accurate EE, advice may be given regarding energy
intake and nutrition necessary to maintain energy balance.
During waking hours, BMR is the minimum amount of energy needed for chemical
reactions in the body to take place to maintain functions vital to the health of the individual
(McArdle et al., 2001). This baseline measurement has conditions that need to be met for
the correct calculation of a true basal state. Measurement is completed after a 12 hour fast
in the post-absorptive state. The individual must not complete physical activity or smoke
for up to 24 hours preceding the measurement. The individual must be rested in the supine
position in a quiet, thermoneutral environment for at least 30 minutes. The terms BMR and
REE have been used interchangeably within the literature (Ravussin and Bogardus, 1989;
Zurlo et al., 1990). Although the measurement criteria for REE measurement is similar to
BMR (Compher et al., 2006), usually BMR is measured after an overnight stay in the clinic
or laboratory where the research is being completed (Figueroa-Colon, 1996). The
Chapter 2 Literature Review
26
importance of REE came to light when the World Health Organisation (WHO, 1985)
published a document providing information on using EE to estimate energy requirements
(Henry, 2005). The percentage of total EE that REE accounts for is up to 75% (McArdle et
al., 2001), the largest portion of daily EE (Ravussin et al., 1982), and is therefore an
important component of an individual’s daily energy cost.
The average value of REE in the able-bodied male population has been reported
extensively in the literature with various metabolic equations devised for individual
prediction from large databases using body mass as a predictor variable (see Table 2.5).
However, there is literature to suggest similar REEs may be obtained through application
of equations from different studies in individuals with varying body masses. In the general
male population values of REE have been reported as 74.0 kcal∙h-1
(mean body mass; 87.5
kg Mifflin et al., 1990) and 75.7 kcal∙h-1
(mean body mass; 78.0 kg, Westerterp and Goran,
1997). Although some research (Clark and Hoffer, 1991; Ramirez-Zea, 2005) has reported
a slight over-estimation from Schofield’s equations (Schofield, 1985), there is no other as
widely accepted model for estimating REE. All of the World Health Organisation (WHO)
(2001), the Department of Health (1991) and authors investigating disabled individuals
(Buchholz et al., 2003a) have used the Schofield prediction equations, which use
regression analysis on over 7393 able-bodied individuals collected from sources that the
author deemed scientifically sound. Schofield (1985) based the prediction of REE in MJ/24
h on age, sex and body mass. When taking body mass into account, the different equations
in Table 2.5 predict similar REE for a typical male able-bodied individual, and these
equations have helped inform clinical and athletic populations regarding important
metabolic information.
2.5.2 Resting energy expenditure in the disabled population
Measured REE in individuals with a disability is lower than values derived from
validated prediction equations in able-bodied samples (Cox et al., 1985; Mollinger et al.
1985; Sedlock and Laventure, 1990). Also, REE has been shown to be lower as level of
SCI increases (Mollinger et al., 1985). Lower values have also been reported for the SCI
population when compared to able-bodied individuals (Monroe et al. 1998; Buchholz et al.,
2003a; Jeon et al. 2003; Bertoli et al., 2006; Liusuwan et al., 2007). Although regression
equations provide an estimation of REE and can be easily accessed by the wider public
(Table 2.5), the differences shown between actual measurements and predictive equations
Chapter 2 Literature Review
27
(Table 2.6) suggest actual measurement of REE is an important consideration for
metabolic analysis in populations with a disability.
Due to paralysis and loss of limbs, a reduced metabolically active mass is available
in individuals with a disability when compared to the able-bodied population (Buchholz et
al., 2003a; Maggioni et al. 2003). However, as section 2.3.1 discussed, SCI athletes have
been shown to have a more favourable body composition to that of sedentary individuals
with an SCI (Olle et al., 1993) and even a similar upper-body FFM when compared with
the untrained able-bodied population (Sutton et al., 2009). Furthermore, the REE of elite
disabled athletes has shown a close comparison with predicted equations when each
disability group was considered separately (Thompson et al., 1995). When disability
groups were pooled however, able-bodied predictive equations overestimated REE in
athletes (Abel et al., 2003; 2008). It seems that there is clear evidence to support the lower
REE values of SCI individuals during rehabilitation. However, the REE of the disabled
athlete population is an area that needs further investigation. The REE may be greater in
the athletic disabled population compared to a rehabilitation cohort due to the potential
increase in FFM, the largest predictor of EE at rest (Johnstone et al., 2005).
2.5.3 Resting energy expenditure and FFM in the able-bodied athletic population
Within the general male able-bodied population it seems as though there is a range
of fat percentage from 12-24% (Westerterp and Goran, 1997; McArdle et al., 2001;
Jackson et al., 2002). However, fat percentage in a range of male able-bodied athletes was
reported at 11% (Stewart and Hannan, 2010) and other studies have shown 6 – 18% in
team sports, 5 – 11% in cycling, 6 – 12% in swimming, and as low as 5 – 12% in running
(Wilmore and Costill, 1999). Fat-free mass has shown to range from 63 – 66 kg (Gallagher
et al., 1998; Jackson et al., 2002; Bosy-Westphal et al., 2003) in the general able-bodied
male population but when taking sports training into account, lean mass alone has been
shown to increase to values ranging from 60 – 72 kg, in a variety of sports including judo,
water polo karate, weight lifting, swimmers, runners and skiers (Šprynarová and Pařízková,
1971; Andreoli et al., 2001). The difference in FFM due to trained status has been shown
by Whalley et al. (2004) who reported a higher FFM in endurance trained individuals (63
kg) when compared to untrained individuals (58 kg).

Chapter 2 Literature Review
28
Tab
le 2
.5. R
esti
ng e
ner
gy e
xpen
dit
ure
pre
dic
tion e
quat
ions
and c
orr
espond
ing e
stim
ated
val
ue.
Au
tho
r
Pa
rtic
ipa
nts
n
E
qu
ati
on
E
stim
ate
d
RE
E (
kca
l∙h
-1)1
Har
ris-
Ben
edic
t eq
uati
on
(Ro
za e
t al
., 1
98
4)
Mal
es &
fem
ales
; ra
nge
of
ages
16
9
88
.362
+ 4
.799
(h
eight)
+ 1
3.3
97
(w
eight)
- 5
.67
7 (
age)
71
.7
Sch
ofi
eld
et
al.
(19
85
)
Mal
e &
fem
ale
adult
s &
ch
ild
ren;
range
of
ages
7,3
93
Ad
ult
s 1
8 –
30
yea
rs 0
.06
3*w
eigh
t+2
.89
6 /
(2
4*2
38
.86
)
Ad
ult
s 3
0 –
60
yea
rs 0
.04
8*w
eigh
t+3
.65
3 /
(2
4*2
38
.86
)
72
.7
69
.8
WH
O (
19
85
)
Mal
e &
fem
ale
adult
s &
ch
ild
ren;
range
of
ages
11
,000
Ad
ult
s 1
8 –
30
yea
rs 1
5.3
*w
eight+
67
9 /
(2
4)
Ad
ult
s 3
0 –
60
yea
rs 1
1.6
*w
eight+
87
9 /
(2
4)
72
.9
70
.5
Ow
en e
t al
. (1
98
7)
Lea
n &
ob
ese
male
s; r
ange
of
ages
60
87
9+
10
.2*w
eight
( /2
4)
66
.4
Mif
flin
et
al.
(19
90
)
Mal
e &
fem
ale
adult
s and
chil
dre
n;
range
of
ages
49
8
Mal
es 1
0*w
eight+
6.2
5*hei
ght-
5*age+
5
69
.6
Mull
er e
t al
. (2
00
4)
Mal
e &
fem
ale
adult
s and
chil
dre
n;
range
of
ages
2,5
28
0.0
47
*w
eig
ht
(kg)+
1.0
09
*se
x-
0.0
14
52
*ag
e (y
rs)
+ 3
.21
(*2
38
.86
)
70
.4
Key
: 1E
stim
ated
RE
E f
or
a 70 k
g m
an, 180 c
m a
nd a
ged
30 y
rs.

Chapter 2 Literature Review
29
Tab
le 2
.6. M
easu
red a
nd
pre
dic
ted R
EE
of
athle
tic
and n
on
-ath
leti
c dis
able
d i
ndiv
idual
s. a m
ale
unle
ss o
ther
wis
e st
ated
.
Au
tho
r P
art
icip
an
ts
n
a
Pro
toco
l R
EE
(kca
l∙h
-1)
Pre
dic
ted
RE
E/
co
mp
ari
son
wit
h
con
tro
l g
rou
p (
kca
l∙h
-1)
Tho
mp
son e
t al
. (1
99
5)
Eli
te w
hee
lch
air
ath
lete
s
Tra
ck a
thle
tes
(Par
aple
gic
)
Tra
ck a
thle
tes
(Tet
rap
legic
)
Wei
ght
lift
ers
(Par
aple
gic
)
6
2
3
Mea
sure
d o
n 3
co
nse
cuti
ve
mo
rnin
gs
68
.7
64
.4
79
.0
Pre
dic
ted
(H
arr
is a
nd
Ben
edic
t, 1
919
)
69
.0
69
.5
78
.4
Ab
el e
t al
. (2
00
3)
Han
d-b
iker
s (S
CI)
WC
rac
ers
(
SC
I)
17
(3 f
emal
e)
10
(3 f
em
ale)
BM
R m
easu
red
aft
er a
n
over
nig
ht
fast
fo
r 3
0 m
inute
s
wit
h a
met
abo
lic
cart
65
.4
60
.3
Pre
dic
ted
(W
HO
, 1
99
8)
74
.2
Ab
el e
t al
. (2
00
8)
WC
Ru
gb
y (
Tet
rap
legic
)
WC
Ten
nis
(P
arap
legic
)
WC
Bas
ket
bal
l (P
arap
legic
)
12
14
10
RE
E m
easu
red
aft
er a
n
over
nig
ht
fast
fo
r 3
0 m
inute
s
mea
sure
d w
ith t
he
K4
b2
63
.5
66
.8
62
.7
Pre
dic
ted
(W
HO
, 1
99
8)
73
.9
Sed
lock
& L
aven
ture
(1
99
0)
No
n-a
thle
tic
pop
ula
tio
n
Par
aple
gic
s
4
RE
E m
easu
red
fo
r 1
ho
ur
by
ind
irec
t ca
lori
met
ry
(ven
tila
ted
ho
od
)
63
.7
Pre
dic
ted
(C
un
nin
gh
am
, 19
80)
71
.6
Mo
nro
e et
al.
(1
99
8)
SC
I in
div
idual
s
AB
co
ntr
ols
10
59
RE
E m
easu
red
wit
h t
he
ven
tila
ted
ho
od
fo
r 2
1 m
inu
tes
72
.9
Co
ntr
ol
91
.7
Buch
ho
lz e
t al
. (2
003
a)
Par
aple
gic
s
AB
co
ntr
ols
26
(11
fem
ale)
34
(10
fem
ale)
RE
E m
easu
red
aft
er a
12
ho
ur
fast
fo
r 6
0 m
inute
s w
ith o
pen
circ
uit
ind
irec
t ca
lori
met
ry
(ven
tila
ted
can
op
y)
61
.1
Co
ntr
ol
69
.6
Jeo
n e
t al
. (2
00
3)
Par
aple
gic
s
AB
co
ntr
ols
7
7
RE
E m
easu
red
fo
r 3
0 m
inute
s
by i
nd
irec
t ca
lori
met
ry
(ven
tila
ted
ho
od
)
60
.5
Co
ntr
ol
77
.0
Key
: A
B –
Able
-bodie
d;
WC
- W
hee
lchai
r

Chapter 2 Literature Review
30
Tab
le 2
.6. co
nti
nued
Au
tho
r
Pa
rtic
ipa
nts
na
Pro
toco
l R
EE
(kca
l∙h
-1)
Pre
dic
ted
RE
E/
co
mp
aris
on
wit
h
con
tro
l g
rou
p (
kca
l∙h
-1)
Liu
suw
an e
t al
.
(20
07
)
Yo
un
g i
nd
ivid
ua
ls (
11–
21
yea
rs)
SC
I in
div
idual
s
Sp
ina
bif
ida
AB
co
ntr
ols
33
(m
ixed
sex
)
66
85
RE
E m
easu
red
fo
r 3
0 m
inute
s b
y
ind
irec
t ca
lori
met
ry (
met
abo
lic
cart
)
51
.2
54
.1
Co
ntr
ol
60
.6
Mo
llin
ger
et
al.
(19
85
)
Reh
ab
ilit
ati
on
b
Hig
h T
etra
ple
gia
Lo
w T
etra
ple
gia
Hig
h P
arap
legia
Lo
w P
arap
legia
14
13
16
5
BM
R m
easu
red
fro
m a
met
eoro
logic
bal
loo
n o
n t
hre
e co
nse
cuti
ve
mo
rnin
gs
50
.3
55
.4
62
.6
65
.4
P
red
icte
d(H
arr
is a
nd
Ben
edic
t, 1
91
9)
70
.7
69
.2
73
.5
74
.6
Key
: A
B –
Able
-bodie
d b
Hig
h t
etra
ple
gia
, in
div
idual
s w
ith a
les
ion l
evel
of
C6 o
r hig
her
. L
ow
tet
raple
gia
, in
div
idual
s w
ith a
les
ion
bet
wee
n C
6 –
T1. H
igh p
arap
legia
, in
div
idual
s w
ith a
les
ion b
etw
een T
1 –
T10.
Low
par
aple
gia
, in
div
idual
s w
ith a
les
ion o
f T
10 o
r lo
wer
.
Chapter 2 Literature Review
31
A positive relationship between FFM and REE has been demonstrated in the able-
bodied population (Cunningham, 1991; Weinsier et al., 1992; Arciero et al., 1993;
Heymsfield et al., 2002; Johnstone et al., 2005). So, as able-bodied athletes have shown the
potential to gain a greater FFM than the general population, a higher REE can then be
expected. This higher REE has been found in healthy males, with REE increasing from 66
to 72 kcal∙h-1
after a 24-week strength training programme alongside an increase in FFM of
3% (Lemmer et al., 2001). Resting energy expenditure also increased in healthy elderly
individuals after endurance training (Goran and Poehlman, 1992). Poehlman et al. (1988)
reported a higher REE in exercise-trained individuals (77.4 kcal∙h-1
) when compared to
non-exercise trained individuals (70.2 kcal∙h-1
). Although FFM was not significantly
higher in the trained group (67.0 kg) compared to the untrained group (64.6 kg) in the
study this marginally higher FFM may have caused the higher value in REE (Poehlman et
al., 1988). The REE and FFM has been shown in other studies to not be significantly
different after an exercise training regime in able-bodied individuals (Bingham et al., 1989;
Broeder et al., 1992). Broeder et al. (1992) did however, find a non-significant increase in
FFM in conjunction with an increase in REE in weight-trained individuals. So it seems
higher FFM is related to a rise in REE in the able-bodied population.
2.5.4 Resting energy expenditure and FFM in the disabled athletic population
The positive relationship between FFM and REE in the able-bodied population has
also been found in the disabled population (Sedlock and Laventure, 1990; Monroe et al.,
1998; Buchholz et al., 2003a). Furthermore, when FFM or lean mass is accounted for, REE
values are similar between SCI and able-bodied groups (Buchholz et al., 2003a; Liusuwan
et al., 2007). Fat-free mass values in the SCI population are lower than those shown in the
able-bodied population (Monroe et al., 1998; Bucholz et al., 2003a; Maggioni et al., 2003;
please refer to section 2.3.1).
In athletic cohorts, there is very little data to suggest the FFM of elite disabled
athletes differs from that of sedentary disabled individuals. Olle et al. (1993) demonstrated
a similar FFM value between the two groups. These authors did however report a lower %
of fat mass in the athletes. From the limited data on elite disabled populations it has been
reported that paraplegic athletes have a higher % body fat (22%) than healthy able-bodied
males who have between 8 – 11% body fat (Bulbulian et al., 1987). Inukai et al. (2006)
reported that wheelchair basketball players had 24.7%, wheelchair track and field athletes
Chapter 2 Literature Review
32
21%, and wheelchair tennis players 27% fat, which are higher values to those established
in able-bodied athletes (Wilmore and Costill, 1999; Stewart and Hannan, 2010). These
limited data suggest disabled athletes carry more fat than both the able-bodied elite athletes
and the general able-bodied population.
As mentioned above, data on the relationship between FFM and REE in the general
SCI population concludes that these individuals have lower FFM and lower REE than the
able-bodied population but the relationship between the two is similar. However, to date
the relationship between REE and FFM has not been examined in the elite SCI population
and warrants attention.
2.6 Energy expenditure during daily living
Quantifying daily EE in disabled, athletic individuals is important to better
understand the nutritional requirements for this population. Many widely used databases
have reported values of EE for walking and other daily activities in humans with limited
information regarding wheelchair activities (Passmore and Durnin, 1955; McArdle et al.,
2001; Ainsworth et al., 2011). The American Heart Foundation have recommended
individuals expend an extra 150 – 200 kcal through moderate intensity exercise on most
days of the week to reduce the risk of cardiovascular disease (Hayes et al., 2005).
Paffenbarger et al. (1986) suggested that a higher physical activity EE of 2000-2500 kcal
(or more) a week can reduce the risk of mortality in a male, able-bodied population (45-84
years). It remains a challenge however, to provide generic values of the required EE on a
daily basis for a variety of populations that may differ in dietary patterns, activity levels
and body composition. Investigating the metabolic cost of different activities will allow a
greater understanding of suitable EE and will help individuals to understand how much
activity is needed to balance their daily energy intake.
In recent years there has been a rise in non-communicable diseases which may be
associated with changes in lifestyle, physical inactivity, diet and smoking (Amuna and
Zotor, 2008). Individuals who use a wheelchair may be more susceptible to these diseases
as, although smoking prevalence in individuals with SCI has been shown to be similar to
the able-bodied population (Bauman and Spungen, 2008), inactivity levels are known to be
higher in the former group (Jacobs and Nash, 2004). With this in mind, there is a drive to
find ways to help reduce obesity, with literature focusing on energy balance in
rehabilitation patients (Cox et al., 1985; Mollinger et al., 1985), sedentary individuals in a

Chapter 2 Literature Review
33
controlled respiratory chamber (Monroe et al., 1998), and in free-living populations
(Yamasaki et al., 1992; Buchholz et al., 2003b; Hayes et al., 2005; Collins et al., 2010).
Alongside the EE of these individuals, direct measures of physical activity of the sedentary
SCI population have been calculated through validated self-report techniques (Ginnis et al.,
2005; 2008), activity monitors (Dearwater et al., 1985), HR monitoring (Janssen et al.,
1994) and wheelchair data loggers (Tolerico et al., 2007).
2.6.1 Energy expenditure during daily activities in wheelchair users
Studies that have measured the daily EE of wheelchair users report sedentary or
moderately active wheelchair users expend less energy than their able-bodied counterparts
(Yamasaki et al., 1992; Monroe et al., 1998) or complete less activity than is recommended
by the WHO (Buchholz et al., 2003b). However, during ‘active’ days, wheelchair
dependent individuals who complete over 3 hours of sport each week displayed a daily EE
that did not differ to that of an able-bodied control group (Yamasaki et al., 1992). This
suggests that active wheelchair users may benefit from the nutritional recommendations of
the able-bodied population if they expend a similar amount of energy. The importance of
energy balance or even energy manipulation in very active and elite trained athletes is vital
for optimal, individual sports performance. However, when investigating elite trained
athletes, it becomes harder to provide generic EE recommendations. Training programmes
and diet become individualised and varying disabilities bring about potential differences in
REE. We can therefore start to appreciate the need to quantify wheelchair propulsion
activities.
The 24-hour EE of SCI individuals has been reported in the range of 1863-2656
kcal∙day-1
(Yamasaki et al., 1992; Monroe et al., 1998; Buchholz et al., 2003b). In a
comparison study SCI individuals displayed lower daily EE by 21% when compared to
able-bodied controls (Monroe et al., 1998). Although daily 24-hour EE is useful to
understand, athletes have variable training structures and daily routines, dependent on
competition and ‘down time’. Therefore, measuring EE during fixed daily propulsion
speeds in elite wheelchair athletes may help provide data on the energy they use during
everyday propulsion. Using exact speeds when measuring EE allows athletes to be able to
replicate the chosen speeds with knowledge of the metabolic cost. The EE of wheelchair
activity has been quantified at particular given speeds, to help understand the metabolic
demands of wheelchair propulsion. Researchers have found that the O2 cost of pushing at

Chapter 2 Literature Review
34
speeds between 1.2 – 1.3 m∙s-1
in an ultra-light wheelchair is 0.13 – 0.14 ml∙kg∙m-1
( eekman et al., 1999) and in a normal manual wheelchair is 0.22 ml∙kg∙m-1
(Mukherjee et
al., 2002) These studies however, did not report absolute EE and so cannot be directly
related to the nutrition an athlete would take in during these activities.
Hayes et al. (2005) provided information regarding daily living tasks in the
wheelchair user population and Collins et al. (2010) produced a comprehensive database
describing the EE of various wheelchair activities in a larger cohort of SCI individuals (see
Table 2.7). Despite the latter research providing an insight into EE during propulsion over
various floor surface conditions, pushing was completed at ‘normal speeds’ which were
not recorded and therefore unknown. This work can be developed by collecting data during
wheelchair propulsion at a selection of daily speeds encountered by wheelchair users.
Energy expenditure will change with increasing intensity of a task and so quantifying this
intensity is an important component of investigating calorie expenditure in wheelchair
propulsion.
2.6.2. Daily speeds in wheelchair propulsion
There seems to be very limited data confirming the actual daily speeds of
wheelchair users during their normal routines. In this context, both Dearwater et al. (1985)
and Janssen et al. (1994) reported the activity levels of sedentary wheelchair users through
motion sensors but did not calculate the wheelchair propulsion speeds. Other studies
quantifying the O2 cost and EE of daily wheelchair propulsion have employed
experimental designs that ask participants to push at ‘normal speeds’ ( eekman et al. 1999;
Mukerjee et al. 2002; Collins et al. 2010). Clearly, if we want to estimate EE during daily
propulsion speeds, we must first know exactly what these speeds are which is difficult to
ascertain from the aforementioned studies. Table 2.7 shows a selection of studies that have
looked at EE over a selection of daily pushing speeds.
Tolerico and colleagues (2007) examined the speeds and distances covered over a
period of 2 to 3 weeks in a large cohort of wheelchair users (n = 52) with a custom-made
data logger. The data logger measured the rotation of the wheel with the use of 3 reed
switches which record a date and time stamp at each wheel rotation. The results of this
study found daily speeds to range between 0.72 – 0.93 m∙s-1
. This study confirmed the
chosen speeds in earlier work of Hildebrant et al. (1970) who examined the energy cost of
wheelchair propulsion at 0.28 – 1.1 m∙s-1
. The authors concluded that the daily propulsion

Chapter 2 Literature Review
35
Tab
le 2
.7.
Ener
gy e
xpen
dit
ure
of
dai
ly w
hee
lchai
r pro
puls
ion i
n e
xper
ience
d w
hee
lch
air
use
rs.
a m
ale
unle
ss o
ther
wis
e st
ated
.
Au
tho
r
Pa
rtic
ipa
nts
n
a
Pro
toco
l (S
pee
d m
∙s-1
) E
E v
alu
e (
kca
l∙h
-1)
Hil
deb
rand
t et
al.
(19
70
)
Whee
lchai
r use
rs w
ith
po
st-p
oli
o,
SC
I &
ost
eogen
esi
s im
per
fect
a
10
(4 f
em
ale)
0.28 m∙s
-1
0.56 m∙s
-1
0.83 m∙s
-1
1.10 m∙s
-1
Net
ener
gy w
as c
alcula
ted
wit
h n
o r
epo
rt o
f th
e
RE
E v
alue
48
66
96
10
8
Hayes
et
al.
(20
05
)
Tet
rap
legic
& p
arap
legic
wh
eelc
hai
r use
rs
13
(1 f
emal
e)
Push
ing o
n t
ile
at u
nk
no
wn s
pee
d
17
9
Co
llin
s et
al.
(2
01
0)
Tet
rap
legic
& p
arap
legic
wh
eelc
hai
r use
rs
35
(m
ixed
sex
)
EE
val
ues
duri
ng a
var
iety
of
wh
eelc
hai
r ac
tivit
ies
(no
sp
eed
s giv
en)
Til
e
Tet
rap
legic
(n=
8):
bH
igh P
arap
legic
(n=
20
):
bL
ow
Par
aple
gic
(n=
7):
15
7
18
2
15
8
Outs
ide
Tet
rap
legic
(n=
3):
bH
igh P
arap
legic
(n=
14
):
bL
ow
Par
aple
gic
(n
=4
):
17
4
20
4
23
9
Key
: b
Hig
h p
arap
legia
, in
div
idu
als
wit
h a
les
ion b
etw
een T
1 –
T10.
Lo
w p
arap
legia
, in
div
idual
s w
ith a
les
ion o
f T
10 o
r lo
wer
.

Chapter 2 Literature Review
36
of wheelchair users is not strenuous enough to elicit any training effect so extra physical
activity is needed.
Interestingly the speeds recorded by Tolerico et al. (2007) are lower than those that
have typically been used in laboratory studies where speeds of 1.34 – 2.20 m∙s-1
have been
reported (Boninger et al., 1997; van der Woude et al., 1999; Hiremath, 2009; Rice et al.,
2010). Furthermore, they were also found to be lower than the ‘normal’ pace around a
sports hall which was described in a study conducted by Washburn and Copay (1999),
where descriptors of ‘slow’, ‘normal’ and ‘fast’ pushing corresponded to 1.36 m∙s-1
,1.89
m∙s-1 and 2.4 m∙s
-1 respectively.
Tolerico et al. (2007) provided information on the average speeds participants
encountered over a 2 – 3 week period. It is likely that there would be occasions that
individuals reach higher speeds during the day. Health programmes and measurement of
physiological parameters during wheelchair propulsion can progress if actual propulsion
speeds – including the full range and peak speeds achieved are known. Although Tolerico
et al. (2007) provide a good estimate of average wheelchair propulsion speed over a large
period of time, there is information lacking about the range of and maximum speeds
wheelchair users complete every day. There was also no record of the trained status of the
individuals in the study by Tolerico et al. (2007). Different fitness levels and trained status
could influence average and maximum speeds and amount of activity done between
individuals who use a wheelchair.
2.6.3. Energy expenditure of wheelchair propulsion in different populations
There has been a large focus in the literature on the metabolic cost of wheelchair
propulsion in the laboratory focusing on individuals going through rehabilitation after an
SCI (Dallmeijer et al., 1999a; de Groot et al., 2005; de Groot et al., 2007) and in novice
able-bodied individuals learning the skill of wheelchair propulsion (Dallmeijer et al.,
1999b; van der Woude et al., 1999; de Groot et al., 2002a; de Groot et al., 2008; van den
Berg et al., 2010). As shown in Table 2.8 and Table 2.9 this research has predominantly
focused on the O2 and GE of wheelchair propulsion rather than the absolute EE of this
skill. Using the working definition of GE as the ratio of external work accomplished
(power output; PO) over metabolic power needed to do that work (Stainsby et al., 1980), it
has been shown that wheelchair propulsion is an inefficient mode of exercise. Typically
GE values rarely reach over 12% in daily wheelchair use (van der Woude, et al., 1986;

Chapter 2 Literature Review
37
Tab
le 2
.8. M
ean O
2 a
t fi
xed
spee
ds
for
novic
e ab
le-b
odie
d i
ndiv
idual
s duri
ng w
hee
lch
air
pro
puls
ion
. a m
ale
unle
ss o
ther
wis
e st
ated
.
Au
tho
r
Pa
rtic
ipa
nts
n
a
Pro
toco
l
Sp
eed
V̇
O2
(L
∙min
-1)
van
der
Wo
ud
e et
al.
(1
98
9b
)
AB
par
tici
pan
ts
10
(sex
no
t sp
ecif
ied
)
Speed at 0 ° incline 0.96 m∙s
-1
0.7
5
de
Gro
ot
et a
l. (
200
8)
AB
par
tici
pan
ts
pre
and
po
st a
7-w
eek l
ow
inte
nsi
ty w
hee
lchai
r
pro
puls
ion p
ract
ice
14
Exer
cise
blo
cks
wer
e
completed before & 1.39 m∙s
-1
afte
r p
ract
ice
at 2
0%
and
40
% m
axim
um
PO
20
%
40
%
Pre
=
0.8
6
1.1
7
Po
st =
0
.68
0
.92
van
den
Ber
g e
t al
. (2
01
0)
AB
par
tici
pan
ts p
re
and
po
st a
7-w
eek l
ow
inte
nsi
ty w
hee
lchai
r
pro
puls
ion p
ract
ice
9
Bef
ore
tra
inin
g a
t 1
1 W
15 W
1.39 m∙s
-1
Aft
er t
rain
ing a
t
23
W
30
W
0.8
5
1.1
6
0.6
9
0.9
5
Key
: A
B =
Able
-bodie
d.
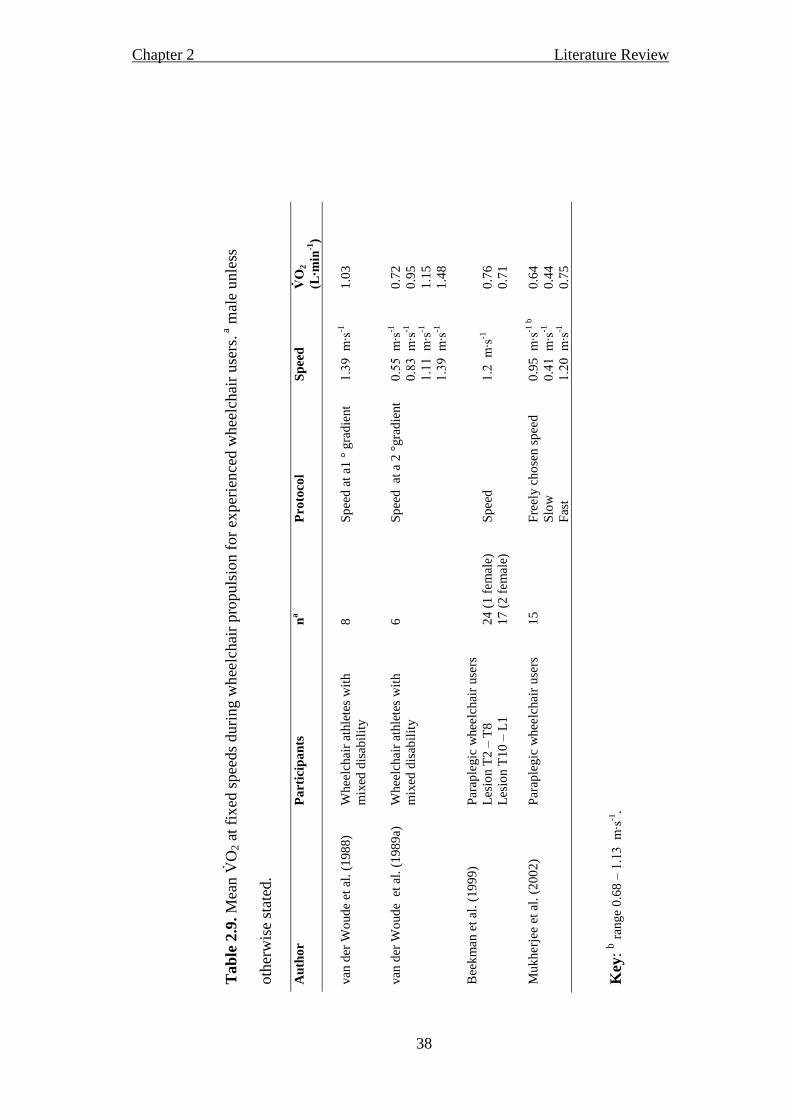
Chapter 2 Literature Review
38
Tab
le 2
.9. M
ean O
2 a
t fi
xed
spee
ds
duri
ng w
hee
lchai
r pro
puls
ion f
or
exper
ience
d w
hee
lchai
r use
rs. a
mal
e u
nle
ss
oth
erw
ise
stat
ed.
Au
tho
r
Pa
rtic
ipa
nts
n
a
Pro
toco
l S
pee
d
V̇O
2
(L∙m
in-1
)
van
der
Wo
ud
e et
al.
(1
98
8)
Whee
lchai
r at
hle
tes
wit
h
mix
ed d
isab
ilit
y
8
Sp
eed
at
a1 °
gra
die
nt
1.39 m∙s
-1
1.0
3
van
der
Wo
ud
e e
t al
. (1
98
9a)
Whee
lchai
r at
hle
tes
wit
h
mix
ed d
isab
ilit
y
6
Sp
eed
at
a 2
°gra
die
nt
0.55 m∙s
-1
0.83 m∙s
-1
1.11 m∙s
-1
1.39 m∙s
-1
0.7
2
0.9
5
1.1
5
1.4
8
Bee
km
an e
t al
. (1
99
9)
Par
aple
gic
whee
lchai
r use
rs
Les
ion T
2 –
T8
Les
ion T
10
– L
1
24
(1 f
em
ale)
17
(2 f
em
ale)
Sp
eed
1.2 m∙s
-1
0.7
6
0.7
1
Muk
her
jee
et a
l. (
200
2)
Par
aple
gic
whee
lchai
r use
rs
15
Fre
ely c
ho
sen s
pee
d
Slo
w
Fas
t
0.9
5 m∙s
-1 b
0.41 m∙s
-1
1.20 m∙s
-1
0.6
4
0.4
4
0.7
5
Key
: b r
ange
0.6
8 –
1.13 m∙s
-1.

Chapter 2 Literature Review
39
Veeger et al., 1992a; Vanlandewijk et al., 1994a). Consequently, the importance of
learning wheelchair propulsion and the pattern of O2 utilisation as individuals become
accustomed to the skill may assist our understanding of EE during this critical time-frame.
The energy cost of wheelchair propulsion has been shown to be influenced by the
properties of the wheelchair and its user (van der Woude et al., 1989a; Beekman et al.,
1999; van der Woude et al., 2009). To highlight this, Beekman et al. (1999) reported a
higher O2 cost per distance travelled pushing a standard wheelchair when compared to an
ultra-light weight wheelchair. Seat height of the wheelchair has also had an effect on the
O2 values of wheelchair propulsion with low values being shown at 110 – 130º elbow
angle (van der Woude et al., 2009). The push strategy of the user influences the O2 cost of
wheelchair ambulation with ‘freely chosen frequency’ resulting in the lowest O2 cost of
propulsion (van der Woude et al., 1989b; Goosey et al., 2000). The process of learning the
skill of wheelchair propulsion is a topical area in the current literature, and reductions in
O2 and improvements in GE in both novice able-bodied individuals and individuals with
an SCI have been noted (de Groot et al., 2002a; 2005; 2007; 2008; van den Berg et al.,
2010). These studies clearly show that many confounding factors can influence the O2 cost
of wheelchair propulsion. Therefore, where possible, establishing homogenous cohorts and
consideration to the wheelchair-user interface and selected propulsion speeds is paramount
in providing accurate data for these groups.
2.7 Energy expenditure and O2 cost during wheelchair sports
Databases exist in the literature providing detailed outlines of the demands and
metabolic cost of particular able-bodied sports (Seliger, 1968; Reilly, 1990a; Reilly, 1990b;
McLaren, 1990; McArdle et al., 2001). From a disability perspective, these generic
databases do not exist. Yet specific, smaller individual studies have examined the EE or O2
cost during wheelchair basketball training (Burke et al., 1985; Bernardi et al., 1988; Abel
et al., 2008; Bernardi et al., 2010), disabled fencing and table tennis (Bernardi et al., 1988;
2010), 5 km time trial (Lakomy et al., 1987; Bernardi et al., 2010), 10km time trial
(Campbell et al., 2002), wheelchair tennis training (Roy et al., 2006; Abel et al., 2008;
Bernardi et al., 2010) and wheelchair rugby training (Abel et al., 2008). EE during actual
wheelchair sporting competition has been studied but with low sample sizes (n = 4

Chapter 2 Literature Review
40
(Bernardi et al., 1988); n = 6 (Roy et al., 2006)). The following sections will provide an
overview of these disability sport specific studies.
2.7.1 Wheelchair basketball
Previous wheelchair basketball research has reported average game play HRs of
128 to 155 b∙min-1
male players (Burke et al., 1985; Bernardi et al., 1988; Coutts, 1988;
Bloxham et al., 2001, Pérez et al., 2007; Bernardi et al., 2010) which is lower than the
recorded average of 165 b∙min-1
for able-bodied male basketball players (Drinkwater et al.,
2008). Average game O2 consumption has been recorded for male wheelchair basketball
competition and simulated competition between 1.3 and 2.3 L∙min-1
(Bernardi et al., 1988;
Bernardi et al., 2010). Moreover, the EE of wheelchair basketball training in various male
paraplegic players is limited and ranges from 246 to 516 kcal∙h-1
(Burke et al., 1985; Usita
et al., 2003; Abel et al., 2008). These values are much lower than the EE of able-bodied
basketball competition which is estimated at 636 kcal∙h-1
for a 71 kg man (McArdle et al.,
2001). Further investigation into the EE of wheelchair basketball competition is needed
before conclusions can be drawn as to whether the noted difference could be due to: a) the
nature of the competitive environment vs. the training environment or b) the physiological
differences between wheelchair and able-bodied athletes.
2.7.2 Wheelchair rugby
Abel et al. (2008) reported the EE of wheelchair rugby training to be 250 kcal∙h-1
, a
much smaller value to that approximated during a game in able-bodied rugby league
players of 1100 kcal∙h-1
(Coutts et al., 2003). The large difference seen between able-
bodied rugby and wheelchair rugby could be due to the lower FFM shown in the
tetraplegic wheelchair rugby players (Price, 2010) and the obvious movement differences
between the running and wheelchair game play.
2.7.3 Wheelchair tennis
Studies investigating the physiology of wheelchair tennis have found typical
average HR’s during a game in both male and female players to be between 121-128
b∙min-1
(Coutts, 1988; Roy et al., 2006; Barfield et al., 2009). Higher values of 140 – 160
b∙min-1
have been shown in trained able-bodied tennis players (König et al., 2001;
Fernandez-Fernandez et al., 2009). The EE of a tennis match in male able-bodied players
was reported as 526 kcal∙h-1
(Fernandez-Fernandez et al., 2009) which is higher than the
Chapter 2 Literature Review
41
EE during wheelchair tennis competition (301 kcal∙h-1
) or training (324 kcal∙h-1
) (Roy et
al., 2006; Abel et al., 2008 respectively).
2.7.4 Endurance performance
The O2 of endurance performance has been studied in tetraplegic and paraplegic
wheelchair athletes (Lakomy et al., 1987; Campbell et al., 2002). An average of 1.03 and
1.12 L∙min-1
was reported in tetraplegic athletes completing a 5km and 10km wheelchair
propulsion time trial respectively (Lakomy et al., 198 Campbell et al., 2002). This
corresponded to 90 and 88 O2peak. Paraplegic athletes consumed more O2 (1.50 and
1.60 L∙min-1
) than their tetraplegic counterparts during both the 5km trial (Lakomy et al.,
1987) and a 10km trial (Campbell et al., 2002) respectively. However, when normalised to
their O2peak, the intensity they were working at was lower than the tetraplegic athletes (at
76% respectively) suggesting a higher physiological capacity in the paraplegic athletes.
Data obtained from able-bodied endurance runners is hard to compare with the different
activity of wheelchair propulsion. However, in a comparison of upper-body exercise at
6 of their O2peak, able-bodied individuals would use 1.88 L∙min-1
during a continuous
and increasing arm crank ergometry protocol (Price et al., 2011). This value of O2 is
higher than that of paraplegic athletes during a 10km trial (Campbell et al., 2002),
suggesting even non-specifically trained able-bodied individuals consume a greater O2
during upper-body exercise than paraplegic athletes. Again, this could be due to a potential
for a greater functional mass in the able-bodied individuals being utilised, but may also
have been related to a difference in protocol between studies of which the limitations are
highlighted in section 2.4.1.
2.7.5 Classification of wheelchair sport
The EE and physiological responses of able-bodied athletes have been shown to be
dependent on the playing position (Duthie et al., 2003; Stolen et al., 2005; Drinkwater et al.,
2008) and demands of the sport (McArdle et al., 2001). Whilst these considerations are
necessary also for the disabled sporting populations, another important factor to consider is
the impact that specific disability and level of impairment will have on sports performance
(Price, 2010). As described previously in section 2.2, within disability sport athletes are
classified according to their sport-specific functional capacity (Tweedy and Diaper, 2010).
Classification systems are used to reduce the impact of a disability on competition
outcomes and each sport has a separate classification system (Tweedy and Diaper, 2010).

Chapter 2 Literature Review
42
Disability classification and the physiology of each classification is a useful tool for
monitoring the capabilities of individuals within a team and for a team as a whole. Values
for EE between classification groups during a match will aid nutrition advice for players
alongside other parameters of daily EE. However, to date this data is not available.
Studies investigating classification in wheelchair sport have established
physiological differences between classification groups, supporting the functional
classification systems of each sport or athletic competition (Vanlandewijck et al., 1994b;
1995; van der Woude et al., 1998; 2002; de Lira et al., 2010). In wheelchair basketball,
significant correlations have been found between the IWBF classification and O2peak,
O2 at ventilatory threshold, PO and sport-specific performance on court (Vanlandewijck
et al., 1994b; 1995; de Lira et al., 2010). This basketball classification system (IWBF, 2009)
provides a platform to provide grouping into classes based on wheelchair basketball
players’ ability to complete basketball movements, including wheelchair propulsion,
dribbling, shooting, passing, rebounding and reaction time (IWBF, 2009). It also ensures
that a basketball team will win on the basis of athletic ability and skill rather than an
unbalanced advantage or disadvantage purely based on disability (IWBF, 2009). For
wheelchair tennis two classifications exist; Quad and open, as described in section 2.2. To
date, no research has compared the physiology of wheelchair tennis players in relation to
their classification, and the research that has reported the physiology of wheelchair tennis
players involves individuals from the open class (Roy et al., 2006; Abel et al., 2008;
Barfield et al., 2009; Bernardi et al., 2010).
Interestingly, when comparing physiological parameters between wheelchair
athletes, other classification categories have been used. The most common of these has
grouped SCI athletes according to the level of lesion or completeness (Coutts et al., 1983;
Lakomy et al., 1987; Wells and Hoooker, 1990; Veeger et al., 1991; Hooker et al., 1993;
Campbell et al., 1997; Schmid et al., 1998a; 1998b; van der Woude et al., 1998; 2002;
Haisma et al., 2006). With the large heterogeneity within and between experimental groups
with respect to lesion level, a limited statistical power in many of the aforementioned
studies has been evident. It seems the physiology of wheelchair athletes depends on sport
and classification within that sport. Developing the concept of categories will assist our
understanding of EE with respect to different wheelchair sports and between disability
classification. Knowledge of the EE would help provide a greater insight into the
nutritional advice during training and competition in wheelchair athletes.
Chapter 2 Literature Review
43
2.8 Summary
Having reviewed the literature that was relevant towards understanding EE in
wheelchair users during daily and sports-specific situations, it is clear that further
investigation is needed. In this review the following points have been highlighted:
1. There is a paucity of data regarding the REE of elite wheelchair athletes. Resting
energy cost is a fundamental aspect of an individual’s daily EE and literature has
shown how REE may be influenced by disability when compared to able-bodied
control groups or predicted values. In relation to this, there is a need to explore the
FFM of elite wheelchair athletes as clearly, disability alters body composition and
the relationship between FFM and REE remains an unexplored area of research in
this cohort.
2. It appears that the majority of studies investigating the wheelchair propulsion of
both novice and experienced users typically used the measurement of O2 uptake for
the calculation of GE. This calculation has been fundamental to these studies to
show how improvements in propulsion technique following practice and years of
experience may be associated with physiological adaptations. However, of this
work, only a small number of studies have explored the EE of manual wheelchair
propulsion. To be able to inform individuals of the direct nutritional consequences
of wheelchair propulsion during rehabilitation and during everyday life, direct
values of EE are needed.
3. Many studies have either a) investigated the physiological consequences of
various disability athletic groups without accounting for the sport or training that
they do or b) focused on the physiology of the sports (e.g. wheelchair basketball)
without accounting for the nature of the individual disabilities involved. That said,
to be able to provide specific physiological feedback and absolute values of EE,
data from homogenous groups of wheelchair athletes is needed. Classification
within wheelchair sport which is designed to make sports competition equitable
provides us with a system which is based around an individual’s functional capacity.
It is essential that we use and develop our physiological knowledge from a
disability classification perspective to further our understanding of the nutritional
requirements during competition and training.

Chapter 2 Literature Review
44
4. Finally, relatively few studies exploring wheelchair sports performance have
used a wheelchair ergometer or motor-driven treadmill to profile the athlete in the
laboratory when comparisons are made to game play. Alternative methodologies
such as arm crank ergometry have been employed which could be considered as
being methodologically flawed, as there are clear GE differences between this
exercise modality and wheelchair locomotion. It is important that the choice of
experimental design for testing wheelchair athletes can be transferred to the
performance setting of wheelchair sports propulsion.

Chapter 3 Resting energy expenditure
45
Chapter 3
Resting energy expenditure in elite athletes with a disability
3.1 Abstract
Purpose: This study examined REE in athletes with a disability in relation to predicted
REE values taken from prediction equations verified in able-bodied individuals. Methods:
Fourteen tetraplegic and 16 paraplegic individuals alongside six athletes with a disability
but without a spinal cord injury (non-SCI) took part in this study. Following a 12-hour fast,
REE was determined over a continuous 35-min period using the Cosmed K4b2 portable
spirometric system (Cosmed, Rome, Italy). Results: There was no significant difference in
REE between participants in the tetraplegic, paraplegic and non-SCI groups (mean (±SD)
63.4(14.3), 70.0(13.4) and 77.7(7.5) kcal·h-1
respectively; p = 0.09). However, further
analysis reported a mean difference of 14 kcal·h-1
(95% CI 1 to 27 kcal·h-1
) between the
tetraplegic group and the non-SCI group which provided a moderate effect size (ES) of
0.47. In terms of predicted values, there was a significant difference in measured REE in
participants with tetraplegia (63.4(14.3) kcal·h-1
) compared to predicted values based on
equations from an able-bodied cohort (73.2(8.3) kcal∙h-1
) (p = 0.01, ES = 0.64). A
moderate ES was shown between measured and predicted values for the non-SCI group (p
= 0.26; ES = 0.49) but no difference and a small ES for the paraplegic group (p = 0.31; ES
= 0.26). Conclusions: These data provide an evaluation of REE in a large cohort of
athletes with a disability. The findings suggest that the REE of non-SCI participants is
higher than tetraplegics, implying energy intake would need to be greater for weight-
maintenance in the former group. However, the results do not support a similar disparity
when comparing tetraplegic and paraplegic athletes. To further our understanding, the
relationship between metabolically active tissue and REE must be explored.
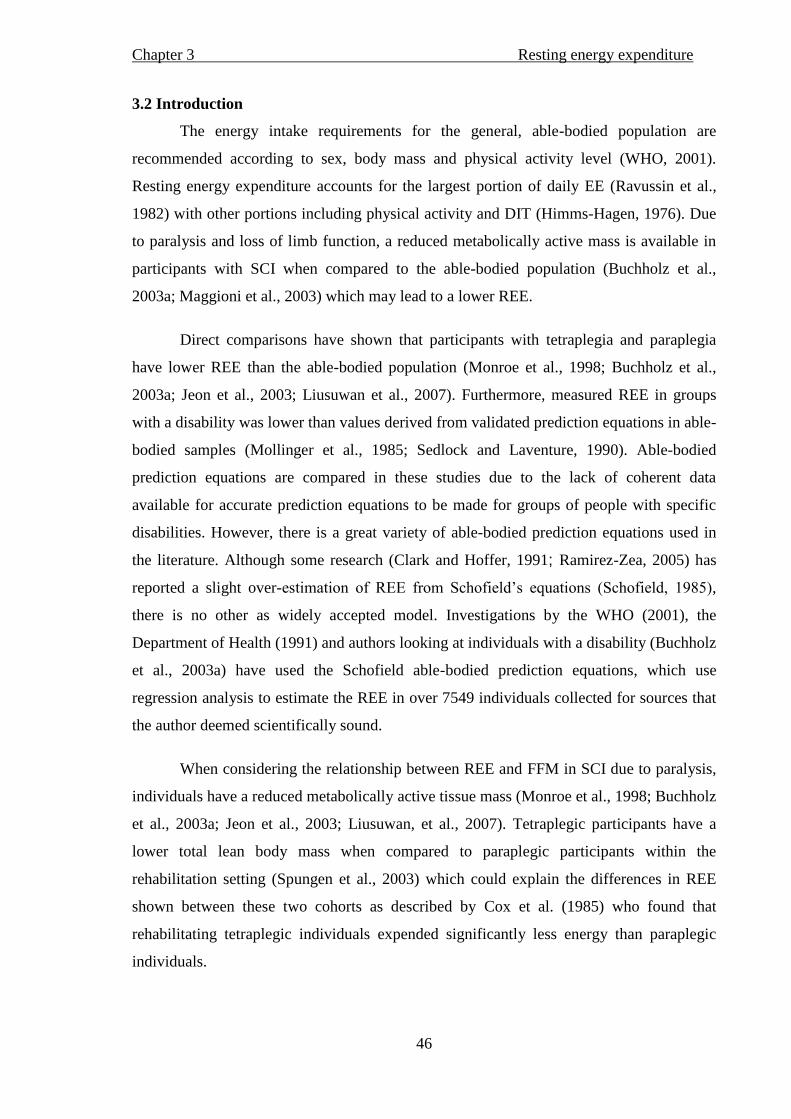
Chapter 3 Resting energy expenditure
46
3.2 Introduction
The energy intake requirements for the general, able-bodied population are
recommended according to sex, body mass and physical activity level (WHO, 2001).
Resting energy expenditure accounts for the largest portion of daily EE (Ravussin et al.,
1982) with other portions including physical activity and DIT (Himms-Hagen, 1976). Due
to paralysis and loss of limb function, a reduced metabolically active mass is available in
participants with SCI when compared to the able-bodied population (Buchholz et al.,
2003a; Maggioni et al., 2003) which may lead to a lower REE.
Direct comparisons have shown that participants with tetraplegia and paraplegia
have lower REE than the able-bodied population (Monroe et al., 1998; Buchholz et al.,
2003a; Jeon et al., 2003; Liusuwan et al., 2007). Furthermore, measured REE in groups
with a disability was lower than values derived from validated prediction equations in able-
bodied samples (Mollinger et al., 1985; Sedlock and Laventure, 1990). Able-bodied
prediction equations are compared in these studies due to the lack of coherent data
available for accurate prediction equations to be made for groups of people with specific
disabilities. However, there is a great variety of able-bodied prediction equations used in
the literature. Although some research (Clark and Hoffer, 1991; Ramirez-Zea, 2005) has
reported a slight over-estimation of REE from Schofield’s equations (Schofield, 1985),
there is no other as widely accepted model. Investigations by the WHO (2001), the
Department of Health (1991) and authors looking at individuals with a disability (Buchholz
et al., 2003a) have used the Schofield able-bodied prediction equations, which use
regression analysis to estimate the REE in over 7549 individuals collected for sources that
the author deemed scientifically sound.
When considering the relationship between REE and FFM in SCI due to paralysis,
individuals have a reduced metabolically active tissue mass (Monroe et al., 1998; Buchholz
et al., 2003a; Jeon et al., 2003; Liusuwan, et al., 2007). Tetraplegic participants have a
lower total lean body mass when compared to paraplegic participants within the
rehabilitation setting (Spungen et al., 2003) which could explain the differences in REE
shown between these two cohorts as described by Cox et al. (1985) who found that
rehabilitating tetraplegic individuals expended significantly less energy than paraplegic
individuals.
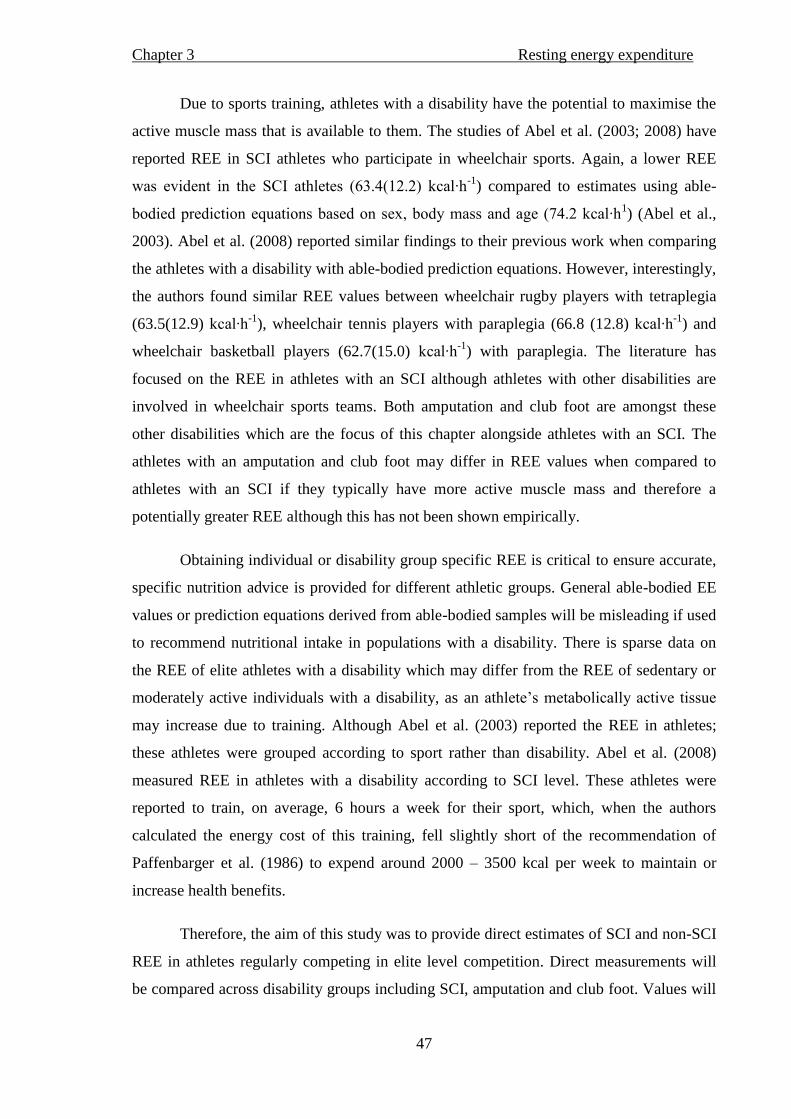
Chapter 3 Resting energy expenditure
47
Due to sports training, athletes with a disability have the potential to maximise the
active muscle mass that is available to them. The studies of Abel et al. (2003; 2008) have
reported REE in SCI athletes who participate in wheelchair sports. Again, a lower REE
was evident in the SCI athletes (63.4(12.2) kcal∙h-1
) compared to estimates using able-
bodied prediction equations based on sex, body mass and age (74.2 kcal∙h1) (Abel et al.,
2003). Abel et al. (2008) reported similar findings to their previous work when comparing
the athletes with a disability with able-bodied prediction equations. However, interestingly,
the authors found similar REE values between wheelchair rugby players with tetraplegia
(63.5(12.9) kcal∙h-1
), wheelchair tennis players with paraplegia (66.8 (12.8) kcal∙h-1
) and
wheelchair basketball players (62.7(15.0) kcal∙h-1
) with paraplegia. The literature has
focused on the REE in athletes with an SCI although athletes with other disabilities are
involved in wheelchair sports teams. Both amputation and club foot are amongst these
other disabilities which are the focus of this chapter alongside athletes with an SCI. The
athletes with an amputation and club foot may differ in REE values when compared to
athletes with an SCI if they typically have more active muscle mass and therefore a
potentially greater REE although this has not been shown empirically.
Obtaining individual or disability group specific REE is critical to ensure accurate,
specific nutrition advice is provided for different athletic groups. General able-bodied EE
values or prediction equations derived from able-bodied samples will be misleading if used
to recommend nutritional intake in populations with a disability. There is sparse data on
the REE of elite athletes with a disability which may differ from the REE of sedentary or
moderately active individuals with a disability, as an athlete’s metabolically active tissue
may increase due to training. Although Abel et al. (2003) reported the REE in athletes;
these athletes were grouped according to sport rather than disability. Abel et al. (2008)
measured REE in athletes with a disability according to SCI level. These athletes were
reported to train, on average, 6 hours a week for their sport, which, when the authors
calculated the energy cost of this training, fell slightly short of the recommendation of
Paffenbarger et al. (1986) to expend around 2000 – 3500 kcal per week to maintain or
increase health benefits.
Therefore, the aim of this study was to provide direct estimates of SCI and non-SCI
REE in athletes regularly competing in elite level competition. Direct measurements will
be compared across disability groups including SCI, amputation and club foot. Values will
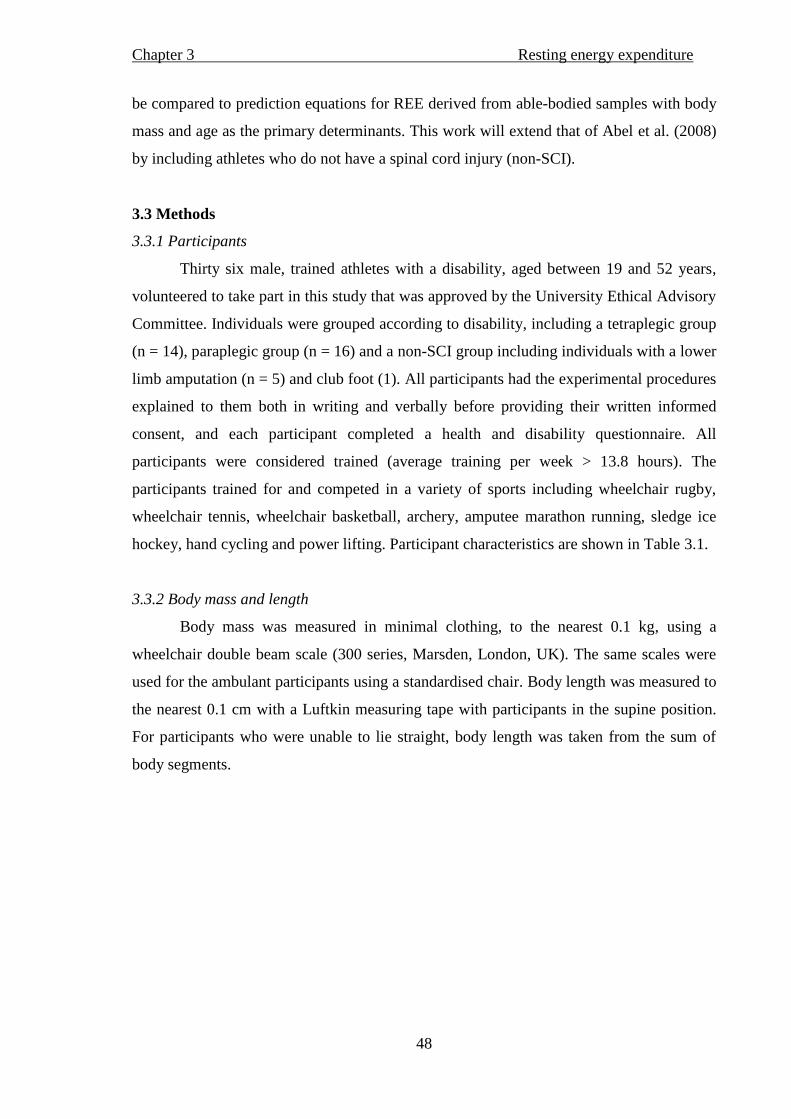
Chapter 3 Resting energy expenditure
48
be compared to prediction equations for REE derived from able-bodied samples with body
mass and age as the primary determinants. This work will extend that of Abel et al. (2008)
by including athletes who do not have a spinal cord injury (non-SCI).
3.3 Methods
3.3.1 Participants
Thirty six male, trained athletes with a disability, aged between 19 and 52 years,
volunteered to take part in this study that was approved by the University Ethical Advisory
Committee. Individuals were grouped according to disability, including a tetraplegic group
(n = 14), paraplegic group (n = 16) and a non-SCI group including individuals with a lower
limb amputation (n = 5) and club foot (1). All participants had the experimental procedures
explained to them both in writing and verbally before providing their written informed
consent, and each participant completed a health and disability questionnaire. All
participants were considered trained (average training per week > 13.8 hours). The
participants trained for and competed in a variety of sports including wheelchair rugby,
wheelchair tennis, wheelchair basketball, archery, amputee marathon running, sledge ice
hockey, hand cycling and power lifting. Participant characteristics are shown in Table 3.1.
3.3.2 Body mass and length
Body mass was measured in minimal clothing, to the nearest 0.1 kg, using a
wheelchair double beam scale (300 series, Marsden, London, UK). The same scales were
used for the ambulant participants using a standardised chair. Body length was measured to
the nearest 0.1 cm with a Luftkin measuring tape with participants in the supine position.
For participants who were unable to lie straight, body length was taken from the sum of
body segments.
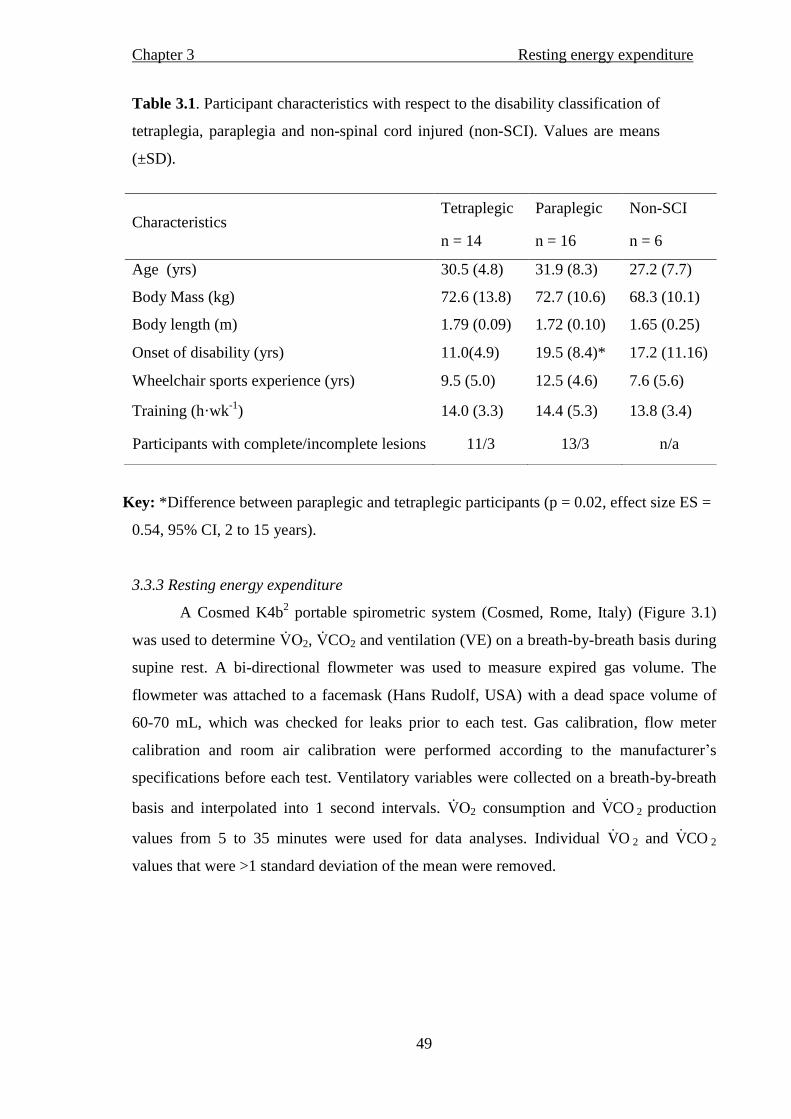
Chapter 3 Resting energy expenditure
49
Table 3.1. Participant characteristics with respect to the disability classification of
tetraplegia, paraplegia and non-spinal cord injured (non-SCI). Values are means
(±SD).
Key: *Difference between paraplegic and tetraplegic participants (p = 0.02, effect size ES =
0.54, 95% CI, 2 to 15 years).
3.3.3 Resting energy expenditure
A Cosmed K4b2 portable spirometric system (Cosmed, Rome, Italy) (Figure 3.1)
was used to determine 2, CO2 and ventilation (VE) on a breath-by-breath basis during
supine rest. A bi-directional flowmeter was used to measure expired gas volume. The
flowmeter was attached to a facemask (Hans Rudolf, USA) with a dead space volume of
60-70 mL, which was checked for leaks prior to each test. Gas calibration, flow meter
calibration and room air calibration were performed according to the manufacturer’s
specifications before each test. Ventilatory variables were collected on a breath-by-breath
basis and interpolated into 1 second intervals. 2 consumption and COV 2 production
values from 5 to 35 minutes were used for data analyses. Individual OV 2 and COV 2
values that were >1 standard deviation of the mean were removed.
Characteristics Tetraplegic Paraplegic Non-SCI
n = 14 n = 16 n = 6
Age (yrs) 30.5 (4.8) 31.9 (8.3) 27.2 (7.7)
Body Mass (kg) 72.6 (13.8) 72.7 (10.6) 68.3 (10.1)
Body length (m) 1.79 (0.09) 1.72 (0.10) 1.65 (0.25)
Onset of disability (yrs) 11.0(4.9) 19.5 (8.4)* 17.2 (11.16)
Wheelchair sports experience (yrs) 9.5 (5.0) 12.5 (4.6) 7.6 (5.6)
Training (h·wk-1
) 14.0 (3.3) 14.4 (5.3) 13.8 (3.4)
Participants with complete/incomplete lesions 11/3 13/3 n/a

Chapter 3 Resting energy expenditure
50
Figure 3.1 Cosmed K4b2
(Cosmed, Rome, Italy) and face mask attachment.
Participants arrived in the laboratory after a 12-hour fast, but ad libitum water
intake, and were asked to avoid vigorous exercise 24-hours prior to testing (Compher,
2006). They rested in a supine position for a 35-minute period in a quiet, thermo-neutral
environment (range 18.1 – 23.2 ºC) and were asked not to fall asleep during data
collection. The first five minutes of data collection were excluded from the analysis.
3.3.4 Calculation of REE
Five minute rolling averages were established for ventilatory variables, and the
lowest five minute rolling average of OV 2 along with the corresponding COV 2 value were
used to calculate REE. The equation by Frayn (1983) was used to estimate carbohydrate
and fat oxidation in grams per minute (g∙min-1
) using the values of OV 2 and COV 2 in
litres per minute (L∙min-1
):
Carbohydrate: (4.55 × COV 2) – (3.21 × OV 2)
Fat: (1.67 × OV 2) – (1.67 × COV 2)
The Atwater factors (Atwater, 1889) were used to convert the grams of
carbohydrate and fat used into EE (grams of carbohydrate x 4; grams of fat x 9) and
establish kilocalories used in one minute. This value was reported in kilocalories per hour
(kcal∙h-1
) for comparison with previous literature. Schofield’s (1985) prediction equations
based on age, body mass and sex were used to predict REE:
Chapter 3 Resting energy expenditure
51
18 – 30 yrs males: (0.063 × body mass) + 2.896.
31 – 60 yrs males: (0.048 × body mass) + 3.653.
3.3.5 Pilot work
Data was collected to look at the variation in O2 consumption and CO2 production between
the Cosmed K4b2 and the Douglas Bag technique. There was a consistently higher value of
2 and C 2 when expired gas is collected with the K4b2 (difference range 0.02 – 0.12
L·min-1
). These data suggest that assumptions made about the similarity of absolute values
of REE measured with the K4b2 and the Douglas bag may need to be interpreted with
caution. However, this should not affect the comparisons of REE between the different
groups studied in this thesis.
3.3.6 Statistical analyses
Data were reported as mean (±SD). The statistical package for social sciences
(SPSS; version 16.0 Chicago, Illinois, USA) was used for data analyses. Normal
distribution was verified using the Shapiro-Wilk test (p ≥ 0.53) and Levene’s test
confirmed the variances were homogeneous between groups (p ≥ 0.19). Between group
differences in the characteristics displayed in Table 3.1 and the measured REE (Table 3.2)
were examined using separate one-way between-group analysis of variance (ANOVA).
Differences between the measured and predicted (method) REE (Table 3.2) across the
three disability groups were analysed using a 3 x 2 (group x method) mixed measures
ANOVA. The significance level was set at p ≤ 0.05 for all analyses. Effect sizes (ES) and
95% confidence intervals of the differences (95% CI) are provided where appropriate in
addition to alpha (p) values. The ES of the difference between groups and between actual
and predicted REE was calculated as )( 2
2
dft
t
, with 95% CI of the difference between
the means where t = the t value from the SPSS output and df = degrees of freedom
(population – 2). A low (0.1), medium (0.3) and large (0.5) ES was reported according to
Cohen (1992).
3.4 Results
Table 3.1 displays the characteristics and physical values of the participants. There
were no differences in age, body mass, body length, years playing disability sport and

Chapter 3 Resting energy expenditure
52
weekly training times. The paraplegic athletes, however, had a disability for longer than
the tetraplegic athletes (p = 0.02). Correlational analysis revealed no relationship between
age and REE (R2 = -0.1, p = 0.55) thus the inclusion of the age range of participants was
justified. There was also no relationship found when correlating predicted and actual REE
in participants with complete lesions and also in participants with incomplete lesions (R2 =
0.28 and R2 = 0.16 respectively). The measured and predicted REE are shown in Table 3.2.
A trend for differences in measured REE between groups was evident (p = 0.09), but the
combined ES was low (ES = 0.37). The mean difference of 14 kcal·h-1
(95% CI 1 to 27
kcal·h-1
) between the tetraplegics and non-SCI was the largest, providing an ES of 0.47
with only small effects for the other between-group comparisons (ES ≤ 0.28; 95% CI -4 to
20 kcal·h- 1).
Table 3.2. Measured and predicted REE in tetraplegic, paraplegic and non-SCI
participants. Values are means (±SD).
Key: 1
Schofield’s (1985) equation was used to predict REE using body mass and
age.
† Within group paired difference between REE and predicted REE in
tetraplegic participants; p = 0.01.
The (3 x 2) group by method interaction (p = 0.02) suggested that differences between
the measured and predicted REE were dependent on disability group. Follow-up pair-wise
Parameter
Tetraplegic Paraplegic Non-SCI
n = 14 n = 16 n = 6
Measured REE (kcal∙h-1
) 63.4 (14.3)† 70.0 (13.4) 77.7 (7.5)
Predicted1 REE (kcal∙h
-1) 73.2 (8.3) 72.3 (5.1) 70.6 (5.8)
Effect size 0.62 0.22 0.51
95% CI of the difference -17 to -3 -8 to 3 -7 to 21

Chapter 3 Resting energy expenditure
53
comparisons revealed moderate to large ES for the tetraplegics and non-SCI groups
whereas the difference for the paraplegic athletes was small (Table 3.2).
3.5 Discussion
The main finding from this study is that the three groups of non-SCI, tetraplegic
and paraplegic athletes did not have significantly different measured REE values.
However, the moderate ES between the REE of the non-SCI and the tetraplegic
participants suggests the 14 kcal∙h-1
difference between the groups is an important finding.
The moderate ES for the tetraplegic and non-SCI athletes when comparing the measured
and predicted REE in each group separately suggest that using the equation provided by
Schofield (1985) may result in invalid estimations for these two groups of elite wheelchair
athletes. In the rehabilitation setting, Mollinger et al. (1985) reported a significantly lower
REE in individuals with tetraplegia with a lesion level of C6 and below (55.4 kcal∙h-1
)
compared to individuals with paraplegia with a lesion level of T10 and below (65.4 kcal∙h-
1). It has been suggested that the lower REE in tetraplegic individuals compared to
paraplegic individuals is due to physiological differences between the disability groups
(Mollinger et al., 1985; Cox et al., 1985). Active tissue mass is denervated below the level
of a spinal cord lesion in an individual depending on the type of disability and the sensory
and motor input to tissue (Maynard et al., 1997). Therefore, individuals with tetraplegia
may not be able to recruit as much active tissue as individuals with paraplegia, leading to
the former group having a lower metabolic rate. That said, a more recent study reported
that the REE of 32 tetraplegic individuals (58.8 kcal∙h-1
) was similar to 34 paraplegic
individuals (59.7 kcal∙h-1
) (Collins et al., 2010). These authors however, reported a large
variation in time since injury and did not report activity levels, precluding an examination
of the data relative to training status. Our findings support those of Abel et al. (2008) who
found no difference in REE between wheelchair rugby players with tetraplegia and
wheelchair tennis and basketball players with paraplegia. The difference shown in the REE
values between rehabilitation groups may be reduced in SCI participants who are post-
rehabilitation (Collins et al., 2010), although this cannot be confirmed.
A difference in REE between individuals with an SCI and able-bodied control
groups of between 8 – 9 kcal∙h-1
has been shown previously (Buchholz et al., 2003a;
Liusuwan et al., 2007). Mollinger et al. (1985) also reported a significant 10 kcal∙h-1
difference in REE between individuals with tetraplegia and individuals with low lesion

Chapter 3 Resting energy expenditure
54
level paraplegia (lesion below T10) in the rehabilitation setting. A lack of statistical power
in the small non-SCI sample in the current study contributed to the ES and explains the
large 95% CIs. It is important to note, however, that if the mean difference between the
tetraplegic and non-SCI groups of ~14 kcal∙h-1
is extrapolated over longer time periods, it
could have an impact on nutritional requirements for these athletes.
No study, to the authors’ knowledge, has compared directly the REE of athletes
with an SCI to athletes with a disability without an SCI. However, previous research has
found that non-athletic tetraplegic and paraplegic individuals have a lower REE than able-
bodied matched controls, due to a lower FFM or lean body mass (Monroe et al., 1998;
Buchholz et al., 2003a; Jeon et al., 2003; Liusuwan et al., 2007). Therefore, the lower REE
in the tetraplegics compared to non-SCI in the present study could be a consequence of
higher FFM in the latter group. This may warrant further study to confirm.
In agreement with the concept that participants with an SCI have a lower REE than
their able-bodied counterparts, the predicted REE was 10.2 kcal·h-1
(95% CI: -17 to -3
kcal) higher than measured REE for the tetraplegic athletes in our study. Many studies are
in agreement that widely used prediction equations over-estimate REE in sedentary SCI
participants and those undergoing rehabilitation for SCI (Mollinger et al., 1985; Sedlock
and Laventure, 1990). Moreover, this appears to extend to wheelchair athletes (Abel et al.,
2003; 2008). In contrast, the results of the current study suggest that Schofield’s prediction
equation for REE might provide a reasonable prediction for paraplegic athletes compared
to a direct measurement. These participants were highly trained, with potentially larger
metabolically active tissue mass than sedentary individuals with a disability, which could
account for the group similarity in measured and predicted REE. This notion is
strengthened by the non-SCI participants having a non-significantly higher measured REE
than predicted REE, suggesting the need for actual measurement. This is especially
important when considering both individuals with a disability and individuals from athletic
populations. It should be noted however, that the slight increase in estimated 2 and
C 2 with the K4b2 when compared to the Douglas bag technique may have caused this
increase in EE. Although prediction equations have been acquired from many pieces of
equipment, values might need to be interpreted with caution when comparing REE
measured with the K4b2 and the Douglas bag technique.

Chapter 3 Resting energy expenditure
55
To increase our understanding of REE in athletes with a disability, accurate
quantification of metabolically active tissue in these groups is warranted, in conjunction
with direct measurements of REE. Reduced FFM is evident in sedentary paraplegics
compared to able-bodied controls (Spungen, et al., 2000; Buchholz et al., 2003a; Maggioni
et al., 2003). Moreover, lean tissue appears to be lower in trained populations with a
disability compared to able-bodied sedentary controls (Mojtahedi, et al., 2008). Future
directions should explore the relationship between REE values and metabolically active
tissue in specific disability groups.
3.6 Conclusions
This study examined the REE of a large cohort of athletes with a disability,
consisting of tetraplegics, paraplegics and a small mixed non-SCI group. The findings
suggest that the REE of non-SCI participants is higher than tetraplegics, implying energy
intake would need to be greater for weight-maintenance in the former group. However, the
results do not support a similar disparity when comparing tetraplegic and paraplegic
athletes. The results also suggest the use of able-bodied predictive equations would lead to
an over estimation of REE in tetraplegic athletes but may provide a reasonable prediction
for paraplegic athletes.
Chapter 4 Resting energy expenditure in relation to fat free mass
56
Chapter 4
Resting energy expenditure in relation to fat free mass in elite wheelchair athletes.
4.1 Abstract
Purpose: Sedentary tetraplegic individuals have lower REE than sedentary paraplegic
individuals, but similar values have been shown in sports trained individuals irrespective of
SCI classification. The explanation of these findings may lie with variations in FFM. The
aim of the study was to examine the relationship between REE and FFM in highly trained
SCI athletes. Methods: Twenty-four wheelchair athletes were assigned to two groups (13
tetraplegics and 11 paraplegics). Resting respiratory gas exchange was measured using the
Cosmed K4b2 portable spirometric system (Cosmed, Rome, Italy) and REE
2 consumption and 2 production. Fat free mass was estimated using dual
energy X-ray absorptiometry. Values for FFM in the arms (left and right), the trunk, the
upper body (trunk + arms) and the lower limbs were obtained from lean mass and bone
mineral content in each participant. Results: Absolute REE (63.4 (14.9) vs. 71.8 (15.0)
kcal∙h-1
), total-body FFM (53.1 (9.0) vs. 52.1 (7.0) kg) and upper-body FFM (33.6 (5.6) vs.
35.9 (4.6) kg) were not significantly different between tetraplegic and paraplegic
individuals respectively. The REE, adjusted for upper-body FFM (with analysis of
covariance), was similar between groups (p = 0.42). Differences were shown in REE
between groups when adjusted for total-body (62.7 (10.9) vs. 72.5 (10.9) kc l∙h-1
) and
lower-body FFM (59.2 (14.0) vs. 76.8 (14.2) kc l∙h-1
) in the tetraplegic and paraplegic
participants respectively; p < 0.05). Conclusions: REE adjusted for upper-body FFM did
not differ between groups. The comparable upper-body FFM values may be a consequence
l p n ng p c c h u y’ c h .
Chapter 4 Resting energy expenditure in relation to fat free mass
57
4.2 Introduction
Comparisons of REE, whether objectively measured or estimated from predictive
equations, are lower for SCI than able-bodied individuals (Mollinger et al., 1985; Sedlock
and Laventure, 1990; Monroe et al., 1998; Buchholz et al., 2003a; Jeon et al., 2003;
Liusuwan et al., 2007). When considering the level of SCI, REE is lower in tetraplegics
than paraplegics within the rehabilitation setting (Cox et al., 1985; Mollinger et al., 1985).
Conversely, measured REE was similar in a large cohort of tetraplegic and paraplegic
males (Collins et al., 2010) and similar in tetraplegic and paraplegic athletes (Abel et al.,
2008). The fact that similarities in REE have been noted in active/trained wheelchair
athletes of differing levels of SCI raises important questions regarding the physiology of
specific disabilities in relation to trained status, classification and functional capacity.
Variations or indeed similarities in REE between individuals with different
disabilities may be explained by FFM, which itself could be determined by severity of
disability or cardio-respiratory fitness levels. This is due to the positive relationship
between FFM and REE which is apparent in able-bodied populations (Cunningham, 1991;
Weinsier et al., 1992; Arciero et al., 1993; Heymsfield et al., 2002; Johnstone et al., 2005).
A positive relationship has also been identified in populations with a disability (Sedlock
and Laventure, 1990; Monroe et al., 1998; Buchholz et al., 2003a), with FFM accounting
for 70% of the variation in REE in healthy paraplegics (Buchholz et al., 2003a). When
REE values were scaled to account for differences in total FFM, they were similar between
SCI and able-bodied groups (65.3(5.0) vs. 66.2(5.0) kc l∙h-1
respectively) (Buchholz et al.,
2003a). Similarities are also evident when expressed relative to lean mass (Liusuwan et al.,
2007).
From the majority of both able-bodied and SCI literature, the consensus is that
there is a positive relationship between FFM and REE (Sedlock and Laventure, 1990;
Cunningham, 1991; Weinsier et al., 1992; Arciero et al., 1993; Monroe et al., 1998;
Heymsfield et al., 2002; Buchholz et al., 2003a; Johnstone et al., 2005). An explanation for
similarities in REE in the trained SCI population could be due to the level of sports training
of these groups. Abel et al. (2003; 2008) showed comparable REE values in highly trained
tetraplegic and paraplegic participants and suggested that the similarity may be due to a
greater fitness in the tetraplegics leading to a similar musculature in the active tissue shown
in both groups. The authors did not however, quantify these results by determining the

Chapter 4 Resting energy expenditure in relation to fat free mass
58
metabolically active tissue within trained athletes with a disability. By scaling REE to FFM
we can further develop our understanding of REE between tetraplegic and paraplegic
athletes.
To extend our understanding of the relationship between FFM and REE within a
population with a disability, it is important to examine potential differences in FFM
between populations with and without a disability. Studies have shown lower lean mass or
lower FFM in sedentary SCI compared with able-bodied controls (Monroe et al., 1998;
Spungen et al., 2000; 2003; Buchholz et al., 2003a; Jones et al., 2003; Maggioni et al.,
2003; Dionyssiotis et al., 2008). Taking lesion level into account, limited but empirical
evidence has shown that tetraplegic participants have a lower total lean body mass when
compared to paraplegic participants within the rehabilitation setting (Spungen et al., 2003).
When training status is considered, larger FFM values are shown in trained
compared to sedentary able-bodied participants (Whalley et al., 2004). However, in a
population with a disability, whilst a higher percentage body fat was shown between
sedentary participants compared to those who are active, they demonstrated similar FFM
values (Olle et al., 1993). This suggests that, while being active compared to being
sedentary may reduce body fat in individuals with a disability (Olle et al., 1993), a higher
level of training may be required to show improvements in FFM as shown in the able-
bodied population (Whalley et al., 2004). What is still not clear is how a similar standard
of training affects FFM in athletes who have different levels of SCI. This is important to
consider due to the similarity found in the REE between tetraplegic and paraplegic athletes
who are trained to an elite level (Abel et al., 2008). Therefore, the aim of this study was to
compare standardised fasting REE between tetraplegic and paraplegic elite athletes relative
to FFM as derived from dual energy X-ray absorptiometry (DXA). The research
hypothesis was that REE and FFM would be similar in tetraplegic and paraplegic athletes
who have comparable training schedules.
4.3 Methods
4.3.1 Participants
Twenty-four trained SCI athletes (13 tetraplegic and 11 paraplegic individuals)
aged 22 to 45 years volunteered to take part in this study that was approved by the
University Ethical Advisory Committee. All participants had procedures explained to them

Chapter 4 Resting energy expenditure in relation to fat free mass
59
in writing and verbally before informed consent was given, and a health questionnaire and
disability questionnaire were completed. Individual disabilities included SCI (C6 – T12),
spina bifida and post-polio. All participants were eligible for Paralympic sport and trained
n l l v l (≤ 20 hours a week) regularly for wheelchair rugby and wheelchair
basketball. Participant characteristics are shown in Table 4.1.
4.3.2 Measurements
4.3.2.i Body mass and body length
Body mass was measured in minimal clothing, to the nearest 0.1 kg, using a
wheelchair double beam scale (300 series, Marsden, London, UK). Body length was
measured in the supine position to the nearest 0.1 cm (Luftkin tape). For participants who
were unable to lie straight, body length was taken from the sum of body segments.
4.3.2.ii Resting energy expenditure
Measurement and calculation of REE was obtained according to the methods in the
previous chapter (Chapter 3, section 3.3.3 and 3.3.4).
Table 4.1. Participant characteristics with respect to the disability classification of
tetraplegia and paraplegia. Values are means (±SD).
Key: *denotes a between-group difference (p = 0.01)
1 All participants in this chapter were used in Chapter 3 and their data reanalysed.
Variable Tetraplegics
1 Paraplegics
1
n = 13 n = 11
Age (yrs) 30.8 (4.8) 31.3 (5.9)
Body mass (kg) 71.5 (13.7) 73.6 (11.5)
Body length (m) 1.79 (0.1) 1.73 (0.1)
Body fat percentage (%) 24.6 (6.9) 28.6 (6.5)
Onset of disability (yrs) 10.4 (4.7)* 20.3 (9.2)
Wheelchair sports experience (yrs) 8.8 (4.5) 12.7 (5.4)
Training (h·wk-1
) 13.9 (3.4) 16.5 (4.4)
Participants with complete/incomplete lesions 11/2 11/0

Chapter 4 Resting energy expenditure in relation to fat free mass
60
4.3.3 Body composition measurement
Dual energy x-ray absorptiometry (Lunar Prodigy Advance, GE Medical Systems
Lunar, Belgium) was used to estimate body composition. Participants were in a
postprandial, euhydrated state, and were asked if they had any metal implants that may
affect the scan. They lay as still as possible in a supine position for the duration of the 10
minute scan. The beam quantified the body compartments in one measurement (Lohman,
1996) and all scans were conducted and analysed by a trained technician. The three
compartments measured were bone mineral content, fat mass and lean mass. The FFM was
estimated from the lean mass and the bone mineral content in each participant and
segmental values were given for FFM in the arms (left and right), the trunk, the upper-
body (trunk + arms) and the lower limbs. A value of total-body FFM was derived from the
summation of segmental values, and total-body percentage fat mass was obtained from the
fat mass divided by the total-body mass.
4.3.4 Statistical analyses
Data were reported as mean (±SD). The SPSS version 16.0 (Chicago, IL, USA)
was used for data analyses. Normal distribution was verified using the Shapiro-Wilk test (p
≥ 0.05) n L v n ’ u ch ck v nc h g n u b n
groups (p ≥ 0.05). In p n n S u n ’ -tests were used to locate differences in
participant characteristics, REE and FFM between disability groups. Studies report that
dividing REE by FFM through ratio scaling is not a suitable expression of the relationship
between these two variables as the regression line does not have a zero intercept (Ravussin
and Bogardus, 1989; Heshka et al., 1990; Weinsier et al., 1992; Gallagher et al., 1998;
Wang et al., 2000). With this in mind analysis of covariance, with FFM as the between
group covariate, was used to report any differences in adjusted REE values. Analysis found
that tetraplegic participants had a larger lower-body FFM than paraplegic participants, so
further examination of the results was conducted to see if this finding was related to time
since injury. Therefore, the relationship between years since disability and lower-body
FFM was examined with regression analysis. Statistical significance was assumed at p ≤
0.05; ES and 95% CI were also provided to complement the more traditional statistics as
previously described in Chapter 3 section 3.3.5. Using GPower 3.1.2, and the work of
Mollinger et al. (1985), calculations showed 10 participants would be needed in each group
to detect a similar change in REE, with an alpha of 0.05, power of 80%.
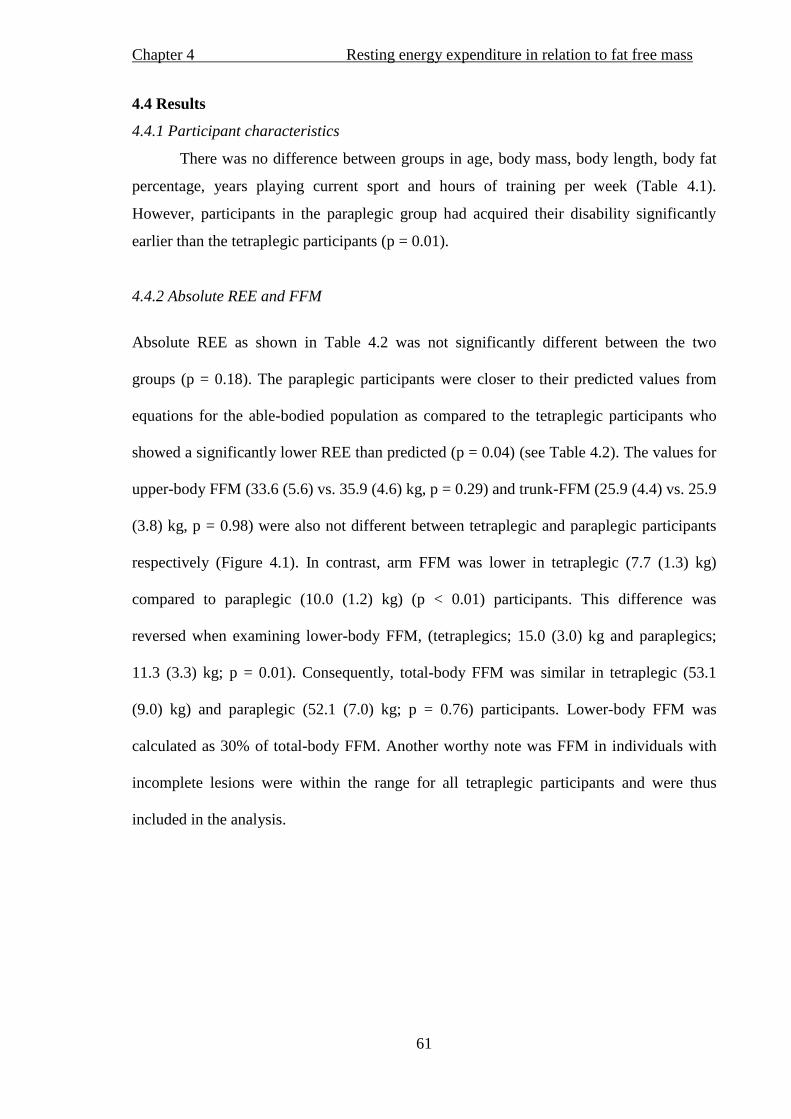
Chapter 4 Resting energy expenditure in relation to fat free mass
61
4.4 Results
4.4.1 Participant characteristics
There was no difference between groups in age, body mass, body length, body fat
percentage, years playing current sport and hours of training per week (Table 4.1).
However, participants in the paraplegic group had acquired their disability significantly
earlier than the tetraplegic participants (p = 0.01).
4.4.2 Absolute REE and FFM
Absolute REE as shown in Table 4.2 was not significantly different between the two
groups (p = 0.18). The paraplegic participants were closer to their predicted values from
equations for the able-bodied population as compared to the tetraplegic participants who
showed a significantly lower REE than predicted (p = 0.04) (see Table 4.2). The values for
upper-body FFM (33.6 (5.6) vs. 35.9 (4.6) kg, p = 0.29) and trunk-FFM (25.9 (4.4) vs. 25.9
(3.8) kg, p = 0.98) were also not different between tetraplegic and paraplegic participants
respectively (Figure 4.1). In contrast, arm FFM was lower in tetraplegic (7.7 (1.3) kg)
compared to paraplegic (10.0 (1.2) kg) (p < 0.01) participants. This difference was
reversed when examining lower-body FFM, (tetraplegics; 15.0 (3.0) kg and paraplegics;
11.3 (3.3) kg; p = 0.01). Consequently, total-body FFM was similar in tetraplegic (53.1
(9.0) kg) and paraplegic (52.1 (7.0) kg; p = 0.76) participants. Lower-body FFM was
calculated as 30% of total-body FFM. Another worthy note was FFM in individuals with
incomplete lesions were within the range for all tetraplegic participants and were thus
included in the analysis.

Chapter 4 Resting energy expenditure in relation to fat free mass
62
Tab
le 4
.2. Ab lu REE (kc l∙h
-1)
and c
ovar
iate
adju
sted
RE
E i
n t
etra
ple
gic
and p
arap
legic
par
tici
pan
ts.
Val
ues
are
mea
ns
(±S
D).
A
bso
lute
RE
E
Pre
dic
ted
RE
E1
RE
E
ad
just
ed f
or
Bo
dy
ma
ss
RE
E
ad
just
ed f
or
Up
per
-bo
dy
FF
M
RE
E
ad
just
ed f
or
Tru
nk
FF
M
RE
E
ad
just
ed
fo
r
Arm
FF
M
RE
E
ad
just
ed f
or
To
tal-
bo
dy
FF
M
RE
E
ad
just
ed f
or
Lo
wer
-bo
dy
FF
M
Tet
rap
leg
ic
63
.4 (
14
.9)
72
.5 (
8.1
)†
64
.0 (
11
.9)
65
.4 (
11
.4)
63
.4 (
11
.4)
70
.7 (
14
.6)
62
.7 (
10
.9)*
5
9.2
(1
4.0
)*
Pa
rap
leg
ic
71
.8 (
15
.0)
72
.6 (
5.0
) 7
1.0
(1
1.9
) 6
9.4
(1
1.4
) 7
1.7
(1
1.4
) 6
3.1
(1
5.0
) 7
2.5
(1
0.9
) 7
6.8
(1
4.2
)
ES
0
.28
0
.29
0.1
7
0.3
6
0.2
3
0.4
2
0.5
2
95
% C
I -2
1.0
to
4.3
-17
.0 t
o 3
.2
-13
.8 t
o 5
.9
-18
.0 t
o 1
.4
-6.9
to
22
.0
-19
.1 t
o -
0.4
-3
0.5
to
-4
.7
Key
: *
Den
ote
s a
signif
ican
t dif
fere
nce
(p <
0.0
5)
in a
dju
sted
RE
E b
etw
een t
etra
ple
gic
and p
arap
legic
par
tici
pan
ts.
1
Pre
dic
ted v
alues
fro
m S
chofi
eld (
1985).
†
Den
ote
s a
signif
ican
t dif
fere
nce
bet
wee
n m
easu
red a
nd p
redic
ted R
EE
val
ues
.

Chapter 4 Resting energy expenditure in relation to fat free mass
63
Figure 4.1. Compartmental FFM of tetraplegic and paraplegic participants.
* Denotes a significant difference between groups (p < 0.05).
4.4.3 REE corrected for body mass and FFM
Analysis of covariance suggested that there was no difference in REE between
tetraplegic and paraplegic participants when upper-body FFM was included as a covariate
(Table 4.2, p = 0.42). There was no difference in REE when arm FFM and trunk FFM were
used as covariates (p > 0.09). When total and lower-body FFM were used as covariates,
tetraplegic participants had lower REE values than paraplegic participants (p = 0.04 and p =
0.01 respectively; Table 4.2). Regression analysis was used to confirm a significant,
negative relationship between years since onset of disability and lower-body FFM (r2
= 0.38;
p = 0.001).
4.5 Discussion
The results of the current study support the hypothesis to show that there was no
significant difference between tetraplegic and paraplegic wheelchair athletes in absolute
REE or absolute upper-body FFM, and no difference when REE was adjusted for upper-
*
*

Chapter 4 Resting energy expenditure in relation to fat free mass
64
body FFM. The tetraplegic participants had a larger lower-body FFM, and consequently this
led to a lower REE when adjusted for this FFM segment. A lower REE was also shown in
the tetraplegic athletes when adjusted for total FFM, which may have also been a
consequence of larger lower-body FFM.
4.5.1 Characteristics of elite wheelchair athletes.
It was noted that the training (of up to 20 hours per week) in both tetraplegic and
paraplegic athletes consisted of comparable drills including short sprints, chair agility drills
and general pushing. These observations complemented the recent pilot work of Sporner et
al. (2009), who found similarities between wheelchair basketball players (paraplegic) and
wheelchair rugby players (tetraplegic), in the distance covered (2680 vs. 2365 m
respectively) and time spent on court (30.3 vs 30.0 minutes respectively) during match play.
The amount of training and the involvement by all participants at an international
competitive level highlights the elite trained status of this cohort. The mean percentage body
fat of the current participants (26.4 (6.9)%) suggests that the tetraplegics and paraplegics in
this study compare well to other cohorts of trained male wheelchair athletes (Inukai et al.,
2006; Miyahara et al., 2008; Mojtahedi et al., 2008). Yet participants in the present study
displayed higher total lean mass (49.4 kg) in comparison with published data from other
trained male wheelchair athletes (41.7 – 45.1 kg) whose training averaged 8.7-15 h∙ k-1
(Miyahara et al., 2008; Mojtahedi et al., 2008). With this in mind, the current study found no
difference in trunk, upper-body and total-body FFM between the two groups of elite athletes
when grouped according to disability (tetraplegia vs. paraplegia).
4.5.2 Absolute REE and FFM.
The REE of the paraplegic participants n h cu n u y (71.8 kc l∙h-1
) is higher
than non-athletic paraplegic participants with reported REE of 59.0 – 65.4 kc l∙h-1
(Mollinger et al., 1985; Buchholz et al., 2003a; Buchholz et al., 2003b; Collins et al., 2010)
and also higher than athletic paraplegics with reported values of 60.3 – 66.8 kc l∙h-1
(Abel et
al., 2003; Abel et al., 2008). The athletes in the studies by Abel et al. (2003; 2008), however,
took p n ≤ 8.9 h u training a week, a significantly lower amount of training when
compared to the cohort in the current study. The absolute values of REE between
tetraplegics and paraplegics of 63.4 and 71.8 kcal∙h-1
in the current study were not
statistically different, which is in agreement with the similarities shown in REE of post-
rehabilitation or athletically trained paraplegic and tetraplegic individuals (Abel et al., 2008;
Chapter 4 Resting energy expenditure in relation to fat free mass
65
Collins et al., 2010). Conversely, this 8.4 kcal∙h-1
difference in REE between groups in the
current study could be meaningful if extrapolated over a 24 hour period. It is evident that,
within a rehabilitation setting, REE in tetraplegic individuals is lower than that in paraplegic
individuals (Cox et al., 1985), and Mollinger et al. (1985) reported REE values of 55.4 vs
64.0 kc l∙h-1
for tetraplegic (with lesion C6-C8) and paraplegic individuals (with a lesion of
T10 or below) respectively during rehabilitation. This difference between groups is similar
to the non-significant 8.4 kcal difference reported in the current study between tetraplegic
and paraplegic individuals. To help try and explain this finding, it is important to explore the
possible influence of segmental FFM on the value of REE.
The differences found in REE between disability groups (Cox et al., 1985; Mollinger
et al., 1985) could be due to tetraplegic participants having greater denervation to metabolic
tissue when compared to participants with paraplegia (Maynard et al., 1997), leading to
muscle atrophy below the spinal cord lesion level (Jacobs and Nash, 2004). Strengthening
this concept, reduced function in the elbow, wrist and finger extensors has been shown in
tetraplegia compared to individuals with paraplegia who have full upper-limb nervous
function (Maynard et al., 1997). Spungen et al. (2003) reported lower FFM in sedentary
tetraplegics when compared to sedentary paraplegics and, within the different body
compartments, reported lower arm FFM values in the tetraplegic participants. The elite
tetraplegics in the current study were shown to have significantly lower FFM in the arms
when compared to the paraplegic participants, which supports the notion of muscle atrophy
following an SCI found within a clinical setting (Jacobs and Nash, 2004).
4.5.3 Resting energy expenditure adjusted for FFM.
When REE was adjusted for total-body FFM, the REE values became statistically
different (tetraplegic; 62.7 (10.9) kc l∙h-1
and paraplegic; 72.5 (10.9) kc l∙h-1
). However,
when individual FFM segments in the upper-body were analysed, adjusted REE was similar
between groups. Total-body FFM is important to consider as this whole value will determine
the overall REE of an individual. Nevertheless, upper-body FFM is an imperative variable to
consider in the sports setting due to the ability to increase this mass through sports training.
When REE in the current study was adjusted for trunk and arm FFM, REE values show a
greater similarity between groups due to the slightly higher arm FFM in the paraplegic
participants and the slightly lower REE in the tetraplegic participants. This is in agreement
with previous literature that shows REE is similar between paraplegic and able-bodied
Chapter 4 Resting energy expenditure in relation to fat free mass
66
individuals when FFM is adjusted for (Buchholz et al., 2003a; Jones et al., 2003). This
would suggest the higher FFM in the arms of the paraplegic group may be the cause of their
non-significantly higher REE.
However, the total-body FFM values were similar between groups, suggesting total-
body FFM may not be responsible for the 8.4 kcal variance shown in REE. The higher FFM
in the lower body of the tetraplegic individuals is also not easily explained. As the REE was
slightly lower in the tetraplegic group, the difference in REE between groups increased after
adjustment of this FFM variable. It could also be speculated that the change in the adjusted
REE value, which occurred when using total-body FFM, could be due to lower-body FFM
influencing the measured outcome. This cohort of trained tetraplegic and paraplegic athletes
allows us to explore REE in relation to unique body compositions, arguably different to that
of the rehabilitation population in which both paraplegic and tetraplegic individuals may
have been injured for a similar amount of time (Cox et al., 1985; Mollinger et al., 1985).
4.5.4 Years since onset of disability.
Tetraplegic participants in the current study have a significantly shorter time since
onset of disability when compared to paraplegic participants. A greater atrophy in the lower
limbs of the paraplegic individuals when compared to the tetraplegics could be explained by
duration of time effect. Lean tissue mass had a significant negative correlation with duration
of injury in a study comparing able-bodied and SCI monozygotic twins (Spungen et al.,
2000), which is also in agreement with the moderate but significant negative relationship
shown in the current study between years since onset of disability and lower-body FFM (r =
0.62; p = 0.001). Inukai et al. (2006) reported higher whole body fat mass in paraplegic
athletes who had a disability longer than 15 years when compared to paraplegic athletes who
had their disability less than 15 years and a reduction in total-body FFM in another study
was shown to be related to duration of injury in SCI individuals (Spungen et al., 2003). Due
to the nature of recruitment of elite tetraplegic athletes, who in this study play wheelchair
rugby, and of paraplegic athletes, the majority of whom play wheelchair basketball, this may
not be an isolated finding. Some paraplegic participants within a wheelchair basketball
squad have a congenital disability, so the wasting of muscle (or FFM) will have been taking
place since birth. Within a wheelchair rugby squad, the majority of the players have
tetraplegia, with young men being the most likely to have an SCI resulting in this level of
spinal cord injury (Gall et al., 2008). What appeared as a potential confounding variable

Chapter 4 Resting energy expenditure in relation to fat free mass
67
(difference in time since onset of disability) may be a unique characteristic of the difference
between wheelchair basketball players and wheelchair rugby players. To further the research
in this area, it may be useful to understand the pattern of REE in tetraplegic and paraplegic
individuals who have the same time since onset of disability. However, this may mean the
study of sub-elite wheelchair athletes, whereas the primary focus of this study was elite
athletes.
4.5.5 Elite training and body composition.
Although time since injury may have a large effect on segmental FFM and therefore
on REE, the elite training these participants take part in could also influence the physiology
of individuals with tetraplegia and paraplegia. Inukai et al. (2006) reported that paraplegic
participants who trained > 7 h·wk-1
have significantly less fat mass in the upper extremities,
trunk and total-body but not the legs when compared to paraplegics who trained < 7 h·wk-1
.
Sutton et al. (2009) found a greater lean mass in the upper body of elite female wheelchair
basketball players when compared to a matched able-bodied group who did not take part in
competitive sport. The able-bodied group however had a greater lower-body lean mass.
These findings suggest that upper-body FFM could be changed with training, but muscle
wastage due to time since injury is more likely to influence values of body composition in
the lower body. Elite sports training of up to 20 h·wk-1
c ul p n n v u l’
potential FFM, and the nature of both wheelchair basketball and rugby training could be
causing similar FFM values in certain segments of the body in these athletes. In agreement
with this concept, the results of this study show similarities in REE corrected for all FFM
segments of the upper-body.
4.5.6 Spinal cord injury and body composition.
Skeletal muscle has a low metabolic activity when compared to the organs in the
trunk (Wang et al., 2000). However, muscle mass is large and has been shown to be one of
the major contributors to REE (Illner et al., 2000) along with the brain and the liver
(Gallagher et al., 1998). No changes in mass are reported in the liver after an SCI
(Sugarman, 1985), and the contribution of heart mass to total REE is small (Gallagher et al.,
1998). With this in mind, the concept of skeletal muscle contributing to the differences in
metabolism in different disability groups is strong. An important point to note is that
completeness of lesion level would potentially have a greater effect on FFM than time since
injury. Individuals with an incomplete lesion level show a higher percentage of FFM per

Chapter 4 Resting energy expenditure in relation to fat free mass
68
body mass than individuals with complete lesions (Buchholz et al., 2003a). However, as
there were only 2 tetraplegic individuals out of 13 who had incomplete lesions, this would
not likely have had a significant effect on the FFM between the two groups.
4.5.7 Limitations
The results show a non-significant yet meaningful difference in absolute REE
between tetraplegic and paraplegic athletes. Although power analysis suggested 10
participants in each group was adequate for significance to be found, the finding of no
significant difference in REE may be due to a large variation in participants. A potential lack
of true rested state must also be acknowledged, as these elite athletes, although fasted, may
have elevated REE due to unrecorded sports participation the day prior to testing. As
described previously, a greater lower-body FFM was shown in the tetraplegic, when
compared to the paraplegic athletes. Although this may have been due to the time since
disability, as discussed earlier, it must be noted that 4 out of 11 participants in the paraplegic
group had a congenital disability leading to potentially different body composition of the
lower limbs.
4.6 Conclusions
The body composition and large amount of sports training of this unique cohort
suggests the results of the current study are applicable to the elite wheelchair sport setting.
The absolute REE results of the current study are in disagreement with previous reports that
REE is significantly lower in tetraplegic when compared to paraplegic individuals (Cox et
al., 1985; Mollinger et al., 1985). In this respect it is hard to generalise the outcome of the
current study to the non-athlete rehabilitation setting. It is important to account for the
various segments of FFM when comparing REE between groups so we can understand how
each segment is affecting the overall REE of an individual. However, it is imperative to
consider absolute values of both FFM and REE for practitioners to be able to give advice to
athletes. The greater lower-body FFM in the tetraplegic group may lead to differences in
REE when correcting for this FFM segment. However, lower-body FFM as a percentage of
total-body FFM is smaller than that of upper-body FFM. With this in mind, it can be
suggested that the REE of elite athletes with tetraplegia and paraplegia is similar when
adjusted for upper-body FFM. The comparable upper-body FFM values may be a
consequence of elite sports training specific to this u y’ c h .
Chapter 5 Energy expenditure of wheelchair propulsion after 3 weeks practice
69
Chapter 5
Energy expenditure of wheelchair propulsion in novice individuals after 3 weeks
practice
5.1 Abstract
Purpose: To firstly investigate the effect of 3 weeks practice on EE during wheelchair
propulsion in novices and secondly, to examine any effects of practice on temporal and
force application parameters. Methods: Twenty-two male, able-bodied participants were
pair-matched according to push frequency between two groups: practice (PRAC; n=11)
and control (CON; n=11). Pre- and post-test measures consisted of three 4-minute stages at
1.1, 1.5 and 1.9 m·s-1
at a 0% gradient on a motor driven treadmill. During the final minute
of each stage, 2 and push frequency were recorded, and HR was monitored
continuously throughout the test. The PRAC group took part in wheelchair propulsion
three times a week for 3 weeks. Each practice session consisted of two 4-minute stages at
fixed PO of 10 and 18 watts (W) at a speed of 1.1 m·s-1
. Before the main protocol, a 4-
minute exercise stage was completed using a 0.614m SMARTWheel
which collected kinetic
measures from each participant. 2
measurement at each speed. Results: For the EE data across all speeds, there was a
significant main effect of time (p < 0.05) but no main effect of group or interaction
between time and group. Trends in the data suggested that EE decreased as a result of
practice with relative reductions of 10%, 13% and 9%. In comparison, the CON group
showed smaller reductions of 5% 8% and 6% at 1.1, 1.5 1.9 ∙ -1
respectively. In
terms of push frequency, there was a significant main effect of time showing a reduction in
push frequency between pre- and post-test across all three speeds ( ≤ 0.001). T c
of practice on temporal and force application parameters at 1.1 ∙ -1
show mean work per
cycle, stroke time and recovery time all increased significantly from pre- to post-test (p <
0.001). Comparable to push frequency findings, both groups reported similar responses
over the 3-wk practice regardless of intervention. Conclusions: Energy expenditure, HR,
2 and push frequency all reduced, and GE, cycle time, recovery time and work per cycle
increased, from pre- to post-test. These changes appear to be related not only to 3 weeks
practice but also after 36 minutes of propulsion by the CON group during the pre-test
protocol.
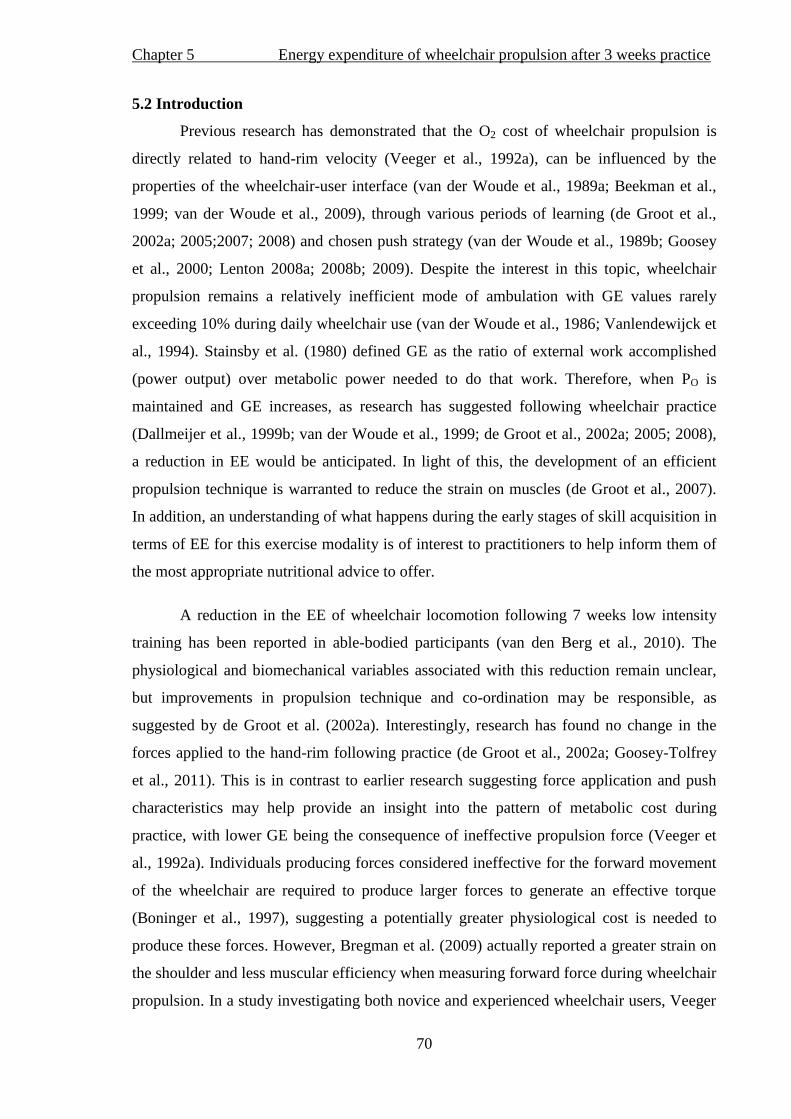
Chapter 5 Energy expenditure of wheelchair propulsion after 3 weeks practice
70
5.2 Introduction
Previous research has demonstrated that the O2 cost of wheelchair propulsion is
directly related to hand-rim velocity (Veeger et al., 1992a), can be influenced by the
properties of the wheelchair-user interface (van der Woude et al., 1989a; Beekman et al.,
1999; van der Woude et al., 2009), through various periods of learning (de Groot et al.,
2002a; 2005;2007; 2008) and chosen push strategy (van der Woude et al., 1989b; Goosey
et al., 2000; Lenton 2008a; 2008b; 2009). Despite the interest in this topic, wheelchair
propulsion remains a relatively inefficient mode of ambulation with GE values rarely
exceeding 10% during daily wheelchair use (van der Woude et al., 1986; Vanlendewijck et
al., 1994). Stainsby et al. (1980) defined GE as the ratio of external work accomplished
(power output) over metabolic power needed to do that work. Therefore, when PO is
maintained and GE increases, as research has suggested following wheelchair practice
(Dallmeijer et al., 1999b; van der Woude et al., 1999; de Groot et al., 2002a; 2005; 2008),
a reduction in EE would be anticipated. In light of this, the development of an efficient
propulsion technique is warranted to reduce the strain on muscles (de Groot et al., 2007).
In addition, an understanding of what happens during the early stages of skill acquisition in
terms of EE for this exercise modality is of interest to practitioners to help inform them of
the most appropriate nutritional advice to offer.
A reduction in the EE of wheelchair locomotion following 7 weeks low intensity
training has been reported in able-bodied participants (van den Berg et al., 2010). The
physiological and biomechanical variables associated with this reduction remain unclear,
but improvements in propulsion technique and co-ordination may be responsible, as
suggested by de Groot et al. (2002a). Interestingly, research has found no change in the
forces applied to the hand-rim following practice (de Groot et al., 2002a; Goosey-Tolfrey
et al., 2011). This is in contrast to earlier research suggesting force application and push
characteristics may help provide an insight into the pattern of metabolic cost during
practice, with lower GE being the consequence of ineffective propulsion force (Veeger et
al., 1992a). Individuals producing forces considered ineffective for the forward movement
of the wheelchair are required to produce larger forces to generate an effective torque
(Boninger et al., 1997), suggesting a potentially greater physiological cost is needed to
produce these forces. However, Bregman et al. (2009) actually reported a greater strain on
the shoulder and less muscular efficiency when measuring forward force during wheelchair
propulsion. In a study investigating both novice and experienced wheelchair users, Veeger

Chapter 5 Energy expenditure of wheelchair propulsion after 3 weeks practice
71
et al. (1992b) found no difference in force application to the hand-rim between these two
cohorts. Effective force application was shown not to change after 8 minutes of propulsion
in novice individuals (de Groot et al., 2003) or after 3 weeks practice in novice individuals
(de Groot et al., 2002a). Therefore, further research is warranted to explore the adaptations
during the course of practice alongside other propulsion-related variables.
To further investigate the improvements in GE and therefore the potential reduction
in EE following practice, temporal parameters exhibited during the propulsive cycle may
be of interest. In contrast to most other activities, wheelchair propulsion provides
individuals the opportunity to self-select an arm frequency and propulsion technique which
suits them and the task requirements (Lenton et al., 2008a). It has become evident,
following 3 weeks practice, that there is a reduction in push frequency and an increase in
cycle/ push time (de Groot et al., 2002a; Goosey-Tolfrey et al., 2011). Since these
adaptations are shown alongside improvements in GE, there is a potential link between
these parameters (de Groot et al., 2002a; de Groot et al., 2008).
Therefore, the purpose of the study was, firstly, to investigate the effect of 3 weeks
practice on EE during wheelchair propulsion and, secondly, to examine the effects of 3
weeks practice on temporal and force application parameters. The research hypotheses
were: i) Three weeks practice significantly reduces EE and other physiological variables
during wheelchair propulsion, and ii) Practice significantly reduces push frequency,
increasing the cycle/ push time.
5.3 Methods
5.3.1 Participants
Twenty-two able-bodied male participants with no prior wheelchair propulsion
experience gave written informed consent prior to participation. Approval for the study
was obtained from Loughborough University’ Ethical Committee. Body mass was
recorded to the nearest 0.1 kg using double beam wheelchair scales (300 series, Marsden,
London, UK). Body length was recorded using a Leicester height measure (SECA Ltd).
Body composition was measured using the skin-fold technique with Harpenden skin
calipers (FitnessAssist, Wrexham, UK). Measurements were taken on the right hand side
of the body (Marfell-Jones et al., 2006), and the four sites measured were the triceps,
biceps, sub-scapular and iliac crest.

Chapter 5 Energy expenditure of wheelchair propulsion after 3 weeks practice
72
5.3.2 Design
Participants were pair matched according to push frequency between two groups:
practice (PRAC; n=11) and control (CON; n=11). Participant characteristics are shown in
Table 5.1. All participants were tested in the same wheelchair (Invacare Top End Crossfire
Titanium; Bromakin, UK), configured with 0.592 m diameter wheels, 4° camber, solid
tyres and a total mass of 12.5kg. All testing took part on a motor driven treadmill (HP
Cosmos Saturn, Nussdorf-Traunstein, Germany). The PRAC group took part in wheelchair
propulsion three times a week for 3 weeks. Before (pre-) and after (post-) the 3 week
practice period, participants attended the laboratory between 08:00 – 09:00 hours after a
12-hour fast to perform a sub-maximal exercise test. Data obtained included sub-maximal
EE, GE and propulsion technique parameters. The CON group participated in both pre-
and post-tests but received no wheelchair propulsion practice in between. The participants
were asked not to change their normal daily activity patterns during this experimental
period.
5.3.3 Test protocol
The sub-maximal exercise test consisted of four 4-min stages at 0.7, 1.1, 1.5 and
1.9 m·s-1
(0% gradient) with a 5-minute rest period between stages. Speeds used were in
accordance with previous literature (van der Woude et al., 1988; 1999; Washburn and
Copay 1999; de Groot et al., 2002a). A pilot study was also completed, which recorded the
speeds of daily propulsion. Using wheelchair data loggers described in Tolerico et al.
(2007), the data revealed that speeds ranged from 1.0 – 2.1 m·s-1
, further supporting the
selected speeds for the current investigation. The data obtained during the 0.7 m·s-1
stage
was not used in subsequent analysis due to high respiratory exchange ratio (RER) values
measured in individuals. A further four exercise stages were completed for separate
analysis (as part of Chapter 6) and these results were not included in the current study. This
resulted in an extra 16 minutes of propulsion equalling 36 minutes in total for the pre-test.
During the pre- and post-tests, push frequency and ratings of perceived exertion (RPE)
were recorded in the final minute of each stage. Each participant received detailed
instructions about the use of the 15-point Borg scale (Borg, 1970) and given an example of
how to score their RPE. Expired gas was collected using the Douglas bag technique.
Oxygen uptake and CO2 concentrations in expired gas were measured using a
paramagnetic oxygen analyser and infrared CO2 analyser (Series 1400, Servomex Ltd.,
Sussex, UK), which was calibrated with known gas concentrations. A dry gas meter

Chapter 5 Energy expenditure of wheelchair propulsion after 3 weeks practice
73
(Harvard Apparatus, Kent, UK) was used to determine the volume of the expired gas
samples, which were corrected to standard temperature and pressure (dry). Heart rate was
recorded continuously (PE4000 Polar Sport Tester, Kempele, Finland) using radio
telemetry.
On completion of the post-test sub-maximal stages, all participants had a 20-minute
recovery period. Following this, participants performed a O2peak test. This test to
volitional exhaustion involved an incremental gradient protocol starting at 1% gradient,
with increments every minute at a constant speed which ranged from 1.3 - 1.7 ∙ -1
. All
participants satisfied the criteria for a valid O2peak of a peak RER 1.10 and an RPE
score of 19 or 20 (Borg, 1970). However, 4 PRAC and 3 CON participants did not reach
the HRpeak 95% of the age-predicted maximum (200 b∙ -1
minus age in years)
(Goosey-Tolfrey and Price, 2010). This is most likely as a result of exercise termination
due to peripheral fatigue rather than maximal cardiovascular values (Bar-Or and Zwiren,
1975).
5.3.4 Practice
The practice period completed by PRAC consisted of two 4-minute exercise stages
at a fixed PO of 10 and 18 W and propulsion speed of 1.1 m·s-1
. This was to ensure all
participants received the same volume of exercise. Practice was conducted at the same time
of day on three separate days of the week for a 3-week period.
5.3.5 Energy expenditure
The equation by Frayn (1983) was used to estimate carbohydrate and fat oxidation
∙ -1
using the values of O2 and O2 L∙ -1
:
Carbohydrate: (4.55 × 2) – (3.21 × 2)
Fat: (1.67 × 2) – (1.67 × 2)
The Atwater factors (Atwater, 1889) were used to convert oxidised carbohydrate
and fat into EE (kcal·h-1
) as described in Chapter 3, section 3.3.4. The original O2 and
O2 were used when the RER was between 0.7 and 1.05 (de Groot et al., 2007).
However, when the RER was out of this range, regression analysis was performed between
EE and HR of preceding and subsequent stages to predict the EE for the given stage.

Chapter 5 Energy expenditure of wheelchair propulsion after 3 weeks practice
74
5.3.6 Gross mechanical efficiency
Gross efficiency was calculated for each of the sub-maximal exercise blocks
according to the following equation:
GE (%) = (external work / EE) * 100 (Stainsby et al., 1980).
5.3.7 Kinetic measurements
Prior to the sub-maximal testing protocol, a separate 4-minute exercise stage at 1.1
m·s-1
(0% gradient) was completed using a 0.614 m SMARTWheel
(Three Rivers Holdings
LLC, Phoenix, AZ). The wheel was positioned on the right side of the chair to collect force
application data. This data was collected via a wireless transmitter and filtered with a
frequency of 20 Hz to enable hand-rim forces and moments around the wheel axis to be
measured. From the data, torque (M), velocity (v) and components of force (Fx
(horizontally forwards), Fy (vertically down) and Fz (horizontally inwards)) were used to
calculate forces. The total force (Fres) was calculated according to Veeger et al. (1992c):
Fres (N) = √ Fx2 + Fy2 + Fz2
The tangential force (Ftan), described as the force contributing to the effective movement
of the wheel, was calculated according to Veeger et al. (1992c):
Ftan (N) = M
rr
where rr is the radius of the hand-rim (0.276 m).
The fractional effective force (FEF) can be determined:
FEF (%) = (Ftan/Fres) × 100
All forces and moments were expressed as mean values per stroke and were then averaged
over the total number of strokes produced during the final minute of data collection. The
push time was defined as the time a positive torque was exerted by the wheelchair user.
Recovery time was defined as the period between pushes, and cycle time was the total time
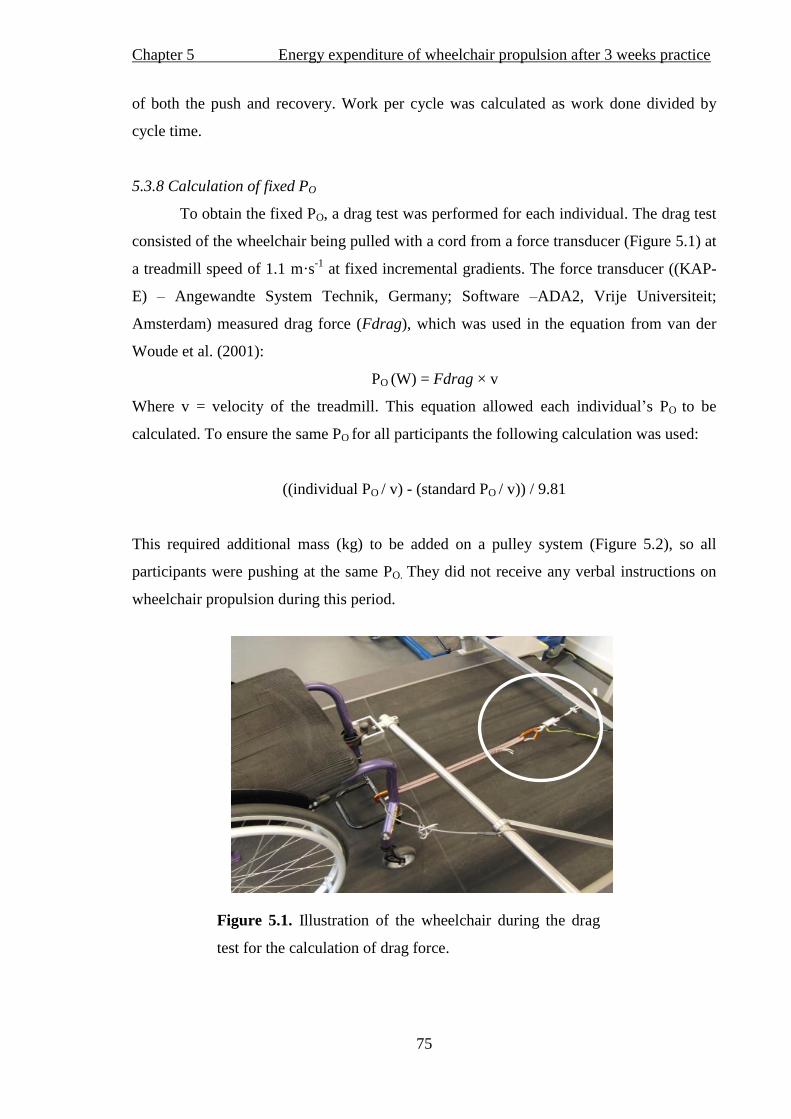
Chapter 5 Energy expenditure of wheelchair propulsion after 3 weeks practice
75
of both the push and recovery. Work per cycle was calculated as work done divided by
cycle time.
5.3.8 Calculation of fixed PO
To obtain the fixed PO, a drag test was performed for each individual. The drag test
consisted of the wheelchair being pulled with a cord from a force transducer (Figure 5.1) at
a treadmill speed of 1.1 m·s-1
at fixed incremental gradients. The force transducer ((KAP-
E) – Angewandte System Technik, Germany; Software –ADA2, Vrije Universiteit;
Amsterdam) measured drag force (Fdrag), which was used in the equation from van der
Woude et al. (2001):
PO (W) = Fdrag × v
Where v = velocity of the treadmill. This equation allowed each individual’s PO to be
calculated. To ensure the same PO for all participants the following calculation was used:
((individual PO / v) - (standard PO / v)) / 9.81
This required additional mass (kg) to be added on a pulley system (Figure 5.2), so all
participants were pushing at the same PO. They did not receive any verbal instructions on
wheelchair propulsion during this period.
Figure 5.1. Illustration of the wheelchair during the drag
test for the calculation of drag force.
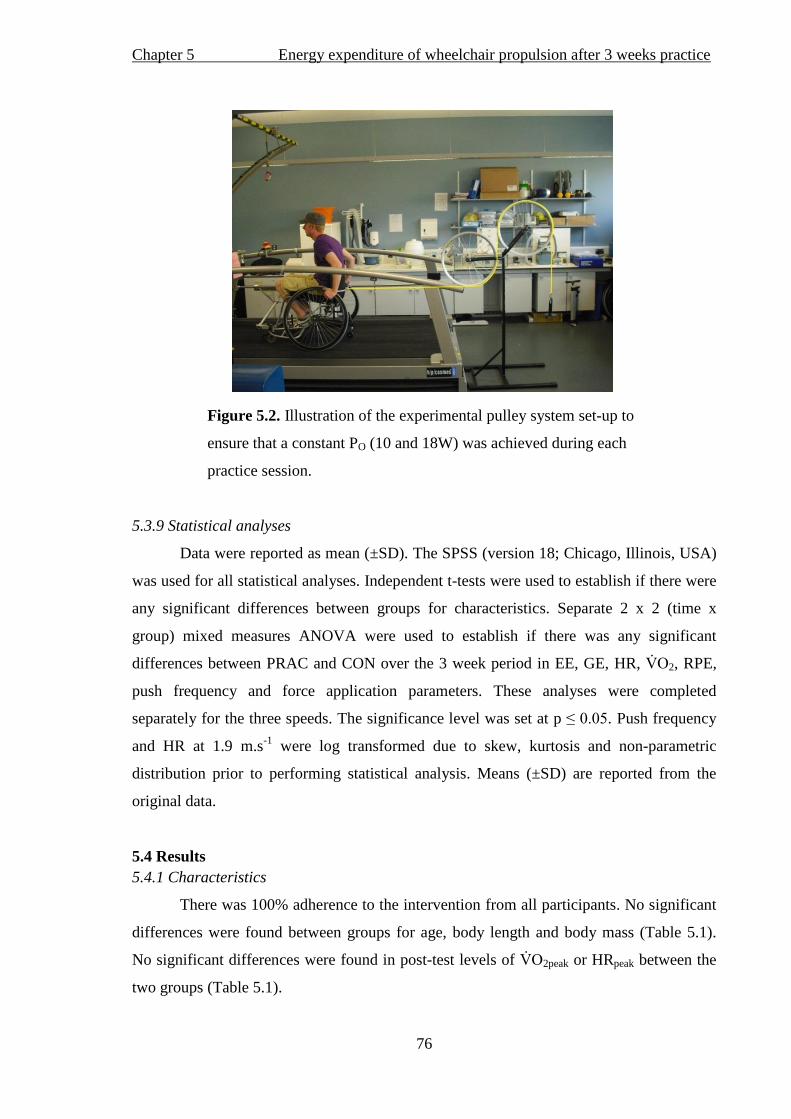
Chapter 5 Energy expenditure of wheelchair propulsion after 3 weeks practice
76
Figure 5.2. Illustration of the experimental pulley system set-up to
ensure that a constant PO (10 and 18W) was achieved during each
practice session.
5.3.9 Statistical analyses
Data were reported as mean (±SD). The SPSS (version 18; Chicago, Illinois, USA)
was used for all statistical analyses. Independent t-tests were used to establish if there were
any significant differences between groups for characteristics. Separate 2 x 2 (time x
group) mixed measures ANOVA were used to establish if there was any significant
differences between PRAC and CON over the 3 week period in EE, GE, HR, 2, RPE,
push frequency and force application parameters. These analyses were completed
separately for the three speeds. The significance level was set at p ≤ 0.05. Push frequency
and HR at 1.9 m.s-1
were log transformed due to skew, kurtosis and non-parametric
distribution prior to performing statistical analysis. Means (±SD) are reported from the
original data.
5.4 Results
5.4.1 Characteristics
There was 100% adherence to the intervention from all participants. No significant
differences were found between groups for age, body length and body mass (Table 5.1).
No significant differences were found in post-test levels of 2peak or HRpeak between the
two groups (Table 5.1).
Chapter 5 Energy expenditure of wheelchair propulsion after 3 weeks practice
77
Table 5.1. Participant characteristics for PRAC (n=11) and CON (n=11). Values are
means (±SD).
5.4.2 Energy expenditure
Energy expenditure at the three speeds for both groups is plotted in Figure 5.3. For
all speeds there was a significant main effect of time (p < 0.05) but no main effect of group
or interaction between time and group. Trends in the data suggested that EE decreased
between pre- and post-tests following practice. Relative reductions were greater in the
PRAC group (10%, 13% and 9%) when compared to the CON group (5% 8% and 6%) for
1.1, 1.5 1.9 ∙ -1
respectively. The PRAC group showed a trend in the data
towards larger reductions to that of CON despite a non-significant main effect of group
over the three speeds (p > 0.05).
5.4.3 Gross mechanical efficiency
The GE at the three speeds for both groups is shown in Table 5.2. No significant
main effect of group or significant interaction between time and group was shown at any
propulsion speed. A non-significant main effect of time was shown in GE between pre-
and post-tests ( ≤ 0.13). F ll c c , GE improved relatively by 11%, 13% and 9%
at 1.1, 1.5 and 1.9 ∙ -1
respectively. The control group also improved GE by 2% at each
speed.
Group Age
(yrs)
Body length
(m)
Body mass
(kg)
2peak
(L∙min-1
)
HRpeak
(b∙min-1
)
PRAC 20.6(2.9) 1.83(0.71) 75.4(8.9) 2.50(0.45) 173(13)
CON 21.7(3.1) 1.85(0.67) 81.8(15.1) 2.54(0.54) 172(18)

Chapter 5 Energy expenditure of wheelchair propulsion after 3 weeks practice
78
Figure 5.3. Mean (±SD) EE for pre-test and post-test in the PRAC and CON at
1.1 ∙ -1
, 1.5 ∙ -1
and 1.9 ∙ -1
. * Significant difference (p < 0.01) and # (p <
0.05) between pre-test and post-test (main effect of time).
5.4.4 Physiological variables and perceptions of effort
Heart rate across the three speeds decreased from pre- to post-test (Table 5.2);
however there was no significant main effect of group and no interaction between time and
group. The same patterns were shown for 2, with a significant main effect
c 2 between the pre- and post-tests (Table 5.2). There was a
significant main c 1.5 ∙ -1
(although the PRAC and CON groups had
different values at pre-test, the difference was not significant, p = 0.28). T c
2 followed the same pattern in both groups as evidenced by a non-significant (p > 0.31)
group by time interaction over the three speeds. There was a main effect of time (p < 0.02)
for RPE with a reduction from pre- to post-test at all three speeds. Although there was no
significant main effect for group, there was a significant interaction between time and
1.5 1.9 ∙ -1
(p = 0.01 and 0.04 respectively) and a trend towards a significant
c 1.1 ∙ -1
(p = 0.08) showing that, with practice, RPE decreases to a greater
extent than in the CON group over the three speeds.
*
#
#
b) c)
a)
b) c) b)
(m·s-1
)
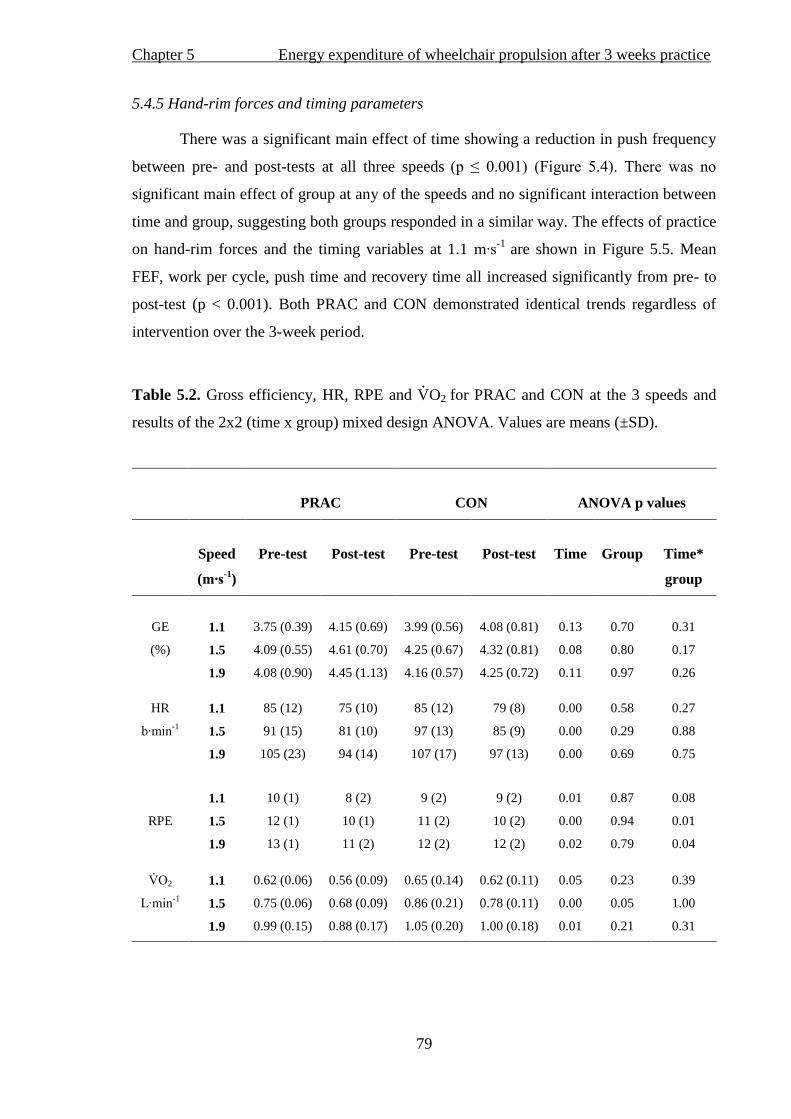
Chapter 5 Energy expenditure of wheelchair propulsion after 3 weeks practice
79
5.4.5 Hand-rim forces and timing parameters
There was a significant main effect of time showing a reduction in push frequency
between pre- and post-tests at all three speeds ( ≤ 0.001) (F 5.4). T
significant main effect of group at any of the speeds and no significant interaction between
time and group, suggesting both groups responded in a similar way. The effects of practice
on hand-rim forces and the timing variables at 1.1 ∙ -1
are shown in Figure 5.5. Mean
FEF, work per cycle, push time and recovery time all increased significantly from pre- to
post-test (p < 0.001). Both PRAC and CON demonstrated identical trends regardless of
intervention over the 3-week period.
Table 5.2. Gross efficiency, HR, RPE and ·VO2 for PRAC and CON at the 3 speeds and
results of the 2x2 (time x group) mixed design ANOVA. Values are means (±SD).
PRAC
CON
ANOVA p values
Speed
(m∙s-1
)
Pre-test
Post-test
Pre-test
Post-test
Time
Group
Time*
group
GE
(%)
1.1 3.75 (0.39) 4.15 (0.69) 3.99 (0.56) 4.08 (0.81) 0.13 0.70 0.31
1.5 4.09 (0.55) 4.61 (0.70) 4.25 (0.67) 4.32 (0.81) 0.08 0.80 0.17
1.9 4.08 (0.90) 4.45 (1.13) 4.16 (0.57) 4.25 (0.72) 0.11 0.97 0.26
HR
b∙ -1
1.1 85 (12) 75 (10) 85 (12) 79 (8) 0.00 0.58 0.27
1.5 91 (15) 81 (10) 97 (13) 85 (9) 0.00 0.29 0.88
1.9 105 (23) 94 (14) 107 (17) 97 (13) 0.00 0.69 0.75
RPE
1.1 10 (1) 8 (2) 9 (2) 9 (2) 0.01 0.87 0.08
1.5 12 (1) 10 (1) 11 (2) 10 (2) 0.00 0.94 0.01
1.9 13 (1) 11 (2) 12 (2) 12 (2) 0.02 0.79 0.04
2
L∙ -1
1.1 0.62 (0.06) 0.56 (0.09) 0.65 (0.14) 0.62 (0.11) 0.05 0.23 0.39
1.5 0.75 (0.06) 0.68 (0.09) 0.86 (0.21) 0.78 (0.11) 0.00 0.05 1.00
1.9 0.99 (0.15) 0.88 (0.17) 1.05 (0.20) 1.00 (0.18) 0.01 0.21 0.31
a)

Chapter 5 Energy expenditure of wheelchair propulsion after 3 weeks practice
80
Figure 5.4. Mean (±SD) push frequency for both PRAC and CON from pre- to
post-test at 1.1 ∙ -1, 1.5 ∙
-1 1.9 ∙
-1. * Significant difference (p <0.01)
between pre- and post-test at all speeds.
5.5 Discussion
This study investigated the c k ’ lc l c c
on the physiological, kinetic and temporal responses in novice able-bodied participants.
The main findings c , 2 and HR following a 3-week period
regardless of intervention (PRAC or CON). Improvements are also shown in temporal
parameters. This supported the hypothesis that three weeks of wheelchair propulsion
practice would lead to an improvement in both physiological and technique parameters.
However, it does not support the hypothesis that improvements would be significantly
greater in the PRAC group in comparison to the CON group.
a) * * b) *
c)
* * *
(m·s-1
)

Chapter 5 Energy expenditure of wheelchair propulsion after 3 weeks practice
81
Figure 5.5. Mean (±SD) for (a) resultant force (Fres), (b) tangential force (Ftan), (c)
fractional effective force (FEF), (d) work per cycle, (e) push time and (f) recovery time
during wheelchair propulsion at 1.1 ∙ -1
for PRAC and CON for pre-test and post-test
trials. *Significant difference from pre- to post-test (p < 0.01).
Note. This data was collected using the 0.614 m SMARTWheel
.
b)
c)

Chapter 5 Energy expenditure of wheelchair propulsion after 3 weeks practice
82
5.5.1 Energy expenditure and GE
To the author’s knowledge this study was the first to document a reduction in EE
following practice over a 3-week period. Practice is an interesting phenomenon for able-
bodied participants without any experience in wheelchair propulsion, as several
adaptations can occur during the initial phases of learning (de Groot et al., 2003;
Dallmeijer et al., 1999b; van der Woude et al., 1999). T ‘three weeks’
c c c l c c c c ’ j c , as a reduction
of 5-6% was also observed in the CON group. These participants performed only 36
minutes of wheelchair propulsion during the pre-test session yet, as shown, this short
propulsion exposure seemed to have impacted upon the post-test performance. In
comparison, the PRAC group performed 108 minutes of wheelchair propulsion, including
the pre-test, which resulted in a greater reduction in EE (9-13%) although statistically
insignificant. Research has demonstrated that wheelchair propulsion skills can be learned
following only 8 minutes of practice (de Groot et al., 2003) and so the validity of
experimental designs that include a control group is somewhat questionable. It must be
noted that the inter-individual variation in EE could have contributed, together with sample
size, to the lack of significance between groups. However, as three weeks of practice
demonstrated a greater reduction in EE than no practice, it is suggested that further
investigation should explore the duration and type of practice to greater understand optimal
reduction in EE. The aforementioned improvements for both PRAC and CON is not a
unique finding, as improvements in GE have also been noted after a short period of
practice in novice wheelchair users and between pre- and post-test results for control
groups (Dallmeijer et al., 1999b; van der Woude et al., 1999).
Absolute EE has been shown to reduce after wheelchair propulsion practice at the
same relative PO 1.39 ∙ -1
(van den Berg et al., 2010). The results of the
current study add to this data and suggest that novice individuals show a reduction in EE at
1.9 ∙ -1
. If EE reduces and other physiological measures improve at
fast daily speeds, individuals may be able to exercise regularly at higher intensities after
practice. Greater fitness gains and higher activity levels could then be achieved. However,
it is still important to be cautious in the early stages of rehabilitation as practice
programmes may adopt a lower push frequency technique to reduce the chance of overuse
injury and optimise correct wheelchair propulsion (Boninger et al., 2002).
Chapter 5 Energy expenditure of wheelchair propulsion after 3 weeks practice
83
5.5.2 Physiological variables and perceptions of effort
Heart rate and 2 showed similar trends to that of EE with a reduction between
pre- and post-tests. Once more, there were no differences shown between groups. The
results are in agreement with data showing decreases in HR and 2 after 7 weeks of
wheelchair propulsion training in novice able-bodied participants (de Groot et al., 2008;
van den Berg et al., 2010). Interestingly, both studies described their 7-week practice
intervention as low intensity ‘ ’ (working at 30% HR reserve). Yet since this is
lower than the minimal recommended exercise intensity of ≥40% HR reserve (ACSM,
2006), these studies show physiological adaptations were more likely to be achieved
through changes in propulsion technique rather than through improvements in physical
fitness. As the current study was also not designed to induce training effects, this adds to
the literature providing practitioners with an appreciation of the physiological effect which
learning wheelchair propulsion has without the influence of training.
A different response was shown in the subjective measures of effort during daily
propulsion (RPE) after practice when compared to CON. Interestingly, the interaction
effect between time and group suggested an effect of practice on RPE, with greater relative
reductions of up to 18% when compared to a maximum of a 5% reduction for the CON
group. The importance of understanding how an individual subjectively rates exercise
intensity is a key issue in the rehabilitation setting where individuals practice wheelchair
skills. This is also important for the general wheelchair user population, where adherence
to physical activity may improve as it becomes subjectively easier to do. Our findings
suggest that RPE reduces to a greater extent after 3 weeks of practice, so if RPE is used as
a tool to monitor exercise intensity then the practitioner must be aware of these patterns
over time.
The measurement of RPE in a population with a disability may be of greater value
than the HR to monitor exercise intensity, as spinal cord injury can cause a disruption to
the autonomic nervous system (Maynard et al., 1997). Subjective signs of exercise
intensity may be more sensitive to practice than physiological markers, and adherence to
physical activity may improve if it is subjectively easier to do. To obtain health benefits
from exercise, wheelchair users must remain physically active during and after
rehabilitation programs (Dallmeijer et al., 1999c) and, therefore, RPE offers a useful tool
for individuals to use in their own environment to self-regulate exercise intensity (Grange
et al., 2002; Goosey-Tolfrey et al., 2010).

Chapter 5 Energy expenditure of wheelchair propulsion after 3 weeks practice
84
5.5.3 Hand-rim force application and timing parameters
The FEF for both groups reduced from pre- to post-test which was most likely due
to the reduced ratio between Ftan and Fres, thus indicating that there was an increase in
force application but not in the forward direction. An improvement in Ftan may not,
therefore, be necessary for the significant reduction in EE. This is in disagreement with
Veeger et al. (1992a) who suggested that a decreased GE and increased EE is due to
ineffective force production. In line with their findings, Dallmeijer et al. (1999b) reported
an increase in GE and an improvement in FEF in a group following a 7-week wheelchair
training programme and in a control group, although this latter improvement was not
significant. However, t ’ c l c sults are not isolated. De
Groot et al. (2002b) found that, although FEF can improve with visual feedback practice
over a 3-week period with this improvement, no expected improvement in GE was
reported. In line with this, de Groot et al. (2002a) and Goosey-Tolfrey et al. (2011) found
an increase in GE with no change in force parameters after three weeks of practice. In
direct contrast to Dallmeijer et al. (1999b), Bregman et al. (2009) actually found greater
strain on the shoulder and less efficiency of the muscle when measuring Ftan during
wheelchair propulsion. From these findings it seems an improved direction of force on the
hand-rim is not related to a reduction in EE. Consequently, other parameters of propulsion
technique may have a greater influence on the metabolic cost of this skill.
From pre- to post-test, results show a reduction in push frequency in PRAC and
CON. Alongside this, mean work per cycle, stroke time and recovery time increased in
both groups. The findings are in agreement with Goosey-Tolfrey et al. (2011), who
reported an increase in cycle time alongside an improvement in GE after a 3-week practice
period in novice wheelchair users. In the able-bodied literature, Lay et al. (2002) reported
significant reductions in 2 and increased recovery duration during strokes after practice
in rowing. The suggestion was that decreased muscle activation could be, in part,
responsible for a lower metabolic cost. A reduced cycle frequency and longer recovery
between pushes may reduce arm acceleration and deceleration (de Groot et al., 2003). The
result of a reduced arm de/ acceleration has been linked to decreased muscular activity
which, in turn, leads to less energy consumption (Vanlandewijck et al., 1994a).

Chapter 5 Energy expenditure of wheelchair propulsion after 3 weeks practice
85
5.6 Conclusions
The first hypothesis of the current study was accepted as three weeks of practice
resulted in reductions in EE, HR, 2 and RPE. Moreover, the second hypothesis was also
accepted as there was a significant reduction in push frequency and an increase in recovery
and cycle time after the 3-week practice period. However, it was interesting to note that
improvements were not only a consequence of 3 weeks of practice, but also due to just 36
minutes of wheelchair activity. The increased recovery and cycle time, rather than
effectiveness of the force application, may be linked with a decrease in EE. The reduction
in EE after only a short period of exposure to wheelchair propulsion confirms that the
metabolic cost is influenced through learning and improved propulsion technique. To take
this a step further, an exploration of the effects of experience and practice on the EE of
wheelchair propulsion will be the main focus of the next chapter. Progression of this
research looks to offer a greater insight into the pattern of EE in the rehabilitation setting as
well as during habitual daily life in wheelchair users.

Chapter 6 Energy expenditure of wheelchair propulsion: effect of experience
86
Chapter 6
Energy expenditure of wheelchair propulsion at fixed power outputs: effect of
experience
6.1 Abstract
Purpose: To investigate the effects of experience on EE during wheelchair propulsion at
fixed PO’s. Methods: Thirty-one participants were assigned to a group in accordance to
their wheelchair propulsion experience: 1) novice able-bodied individuals (NOV; n = 11),
2) able-bodied individuals habituated to three weeks practice (PRAC; n = 11) and 3)
experienced paraplegic daily-wheelchair users (EXP; n = 9). The PRAC group took part in
three weeks of wheelchair propulsion practice, consisting of two 4-minute stages on a
motor-driven treadmill at fixed PO’s of 10 and 18 W at a speed of 1.1 m·s-1
, prior to testing.
The sub-maximal exercise testing session consisted of three 4-min stages at 10, 18 and 26
W at a 0% gradient with a 5-minute rest period between stages. During the final minute of
each stage, 2 and push frequency were recorded and HR was recorded continuously.
Energy expenditure s s 2 values. Results: Energy expenditure analysis
revealed a significant main effect of PO and group (p < 0.01) and a significant group by PO
interaction (p < 0.01). Follow-up pair-wise comparisons revealed significantly lower EE in
EXP compared to both other groups (p < 0.01), but no difference was shown between
NOV and PRAC (p = 0.15). A lower relative EE of 20, 22 and 32% was reported in the
EXP group compared to the NOV group at 10, 18 and 26 W, respectively. In comparison
to the PRAC group, the EE of the EXP group was 10, 16 and 26% lower in relative terms
at the same PO’s respectively. There was a main effect of PO for HR, RPE and 2, and a
main effect of group for RPE and 2. Follow-up pair-wise comparisons revealed that, for
RPE, the difference existed between EXP and NOV (p = 0.02) and, for 2, EXP had
lower values than both NOV (p <0.01) and PRAC (p = 0.01). Conclusion: The EXP group
had lower EE compared to both NOV and PRAC groups at fixed PO’s, suggesting
experience reduces the EE of sub-maximal wheelchair propulsion. Although practice
reduced EE, no significant reductions were shown between PRAC and NOV.

Chapter 6 Energy expenditure of wheelchair propulsion: effect of experience
87
6.2 Introduction
The O2 cost and efficiency of wheelchair propulsion is affected by the PO of the
wheelchair-user interface (van der Woude et al., 1988; Veeger et al., 1992a). Power output
is affected by speed and drag forces, which are influenced by wheelchair configuration
(contributing to the magnitude of internal friction), rear wheel size (affecting the rolling
resistance), and floor surface characteristics (van der Woude et al., 2001). When PO is
controlled, similar O2 costs have been reported between individuals during cycle ergometry
(Hansen et al., 1988; Ästrand et al., 2003). Pilot work for this study has shown that large
variations in EE exist between paraplegic individuals during daily ambulation at fixed
speeds on a motorised treadmill. It is clear that understanding the EE of wheelchair
propulsion requires the PO to be controlled (van der Woude et al., 1988). Nevertheless, EE
during wheelchair propulsion could still vary depending upon the level of experience as
reported in the able-bodied literature (Holmer, 1972; Pannier et al., 1980; Ingham et al.,
2007). For example, lower O2 cost is evident in experienced athletes when compared to
novices at the same absolute speed in swimming (Holmer, 1972) to novice runners at sub-
maximal treadmill speeds (Pannier et al., 1980), and to club athletes in rowing at the same
relative work load (Ingham et al., 2007). More recently, wheelchair propulsion practice
(Chapter 5) has been found to reduce EE at fixed speeds, thus suggesting that the level of
experience and practice between individuals may affect the EE of daily wheelchair
propulsion when pushing at a fixed PO.
Research into hand-rim wheelchair propulsion has demonstrated that experienced
wheelchair users report significantly greater GE values than novice able-bodied individuals
at the same propulsion velocity (van der Woude et al., 1986) or the same relative exercise
intensity (Lenton et al., 2008a). At a fixed PO, a consistently higher GE and lower 2 in
SCI individuals are seen when compared to novice able-bodied individuals during
wheelchair propulsion (Brown et al., 1990; Dallmeijer et al., 2004). This may suggest that
the reduced EE of the experienced group may be the result of a more efficient propulsion
technique (van der Woude et al., 1986). Consequently, measurement of the absolute EE of
both experienced and novice wheelchair users will provide further information about the
metabolic cost of wheelchair propulsion in relation to experience.
Energy expenditure decreases after 36 minutes (Chapter 5), three weeks (Chapter 5)
and seven weeks of wheelchair propulsion practice (van den Berg et al., 2010). Gross
mechanical efficiency is greater as a result of propulsion experience (van der Woude et al.,
Chapter 6 Energy expenditure of wheelchair propulsion: effect of experience
88
1986; Brown et al., 1990; Lenton et al., 2008a) and increases with practice or training (de
Groot et al., 2002a; 2005; 2007; 2008). These findings, alongside data that has
demonstrated reductions in O2 cost during motor skill practice in rowing (Sparrow et al.,
1999), would suggest that EE will be lower with increased levels of wheelchair experience
and propulsion practice. Reduced EE may also be influenced by improved temporal
parameters of wheelchair propulsion which can occur after practice (Chapter 5, Dallmeijer
et al., 1999b; de Groot et al., 2003; Goosey-Tolfrey et al., 2011).
With the O2 cost of wheelchair propulsion directly affected by PO (Woude et al.,
1988; Veeger et al., 1992a), standardisation of this parameter should reduce its influence
on EE (van der Woude et al., 2001) when comparing different groups of individuals. By
assessing the EE of wheelchair propulsion over the course of learning the skill and through
years of experience, recommendations can be provided for individuals in the early stages
of rehabilitation and also for habituated wheelchair users. Therefore, the purpose of this
study was to investigate the effects of experience on EE during wheelchair propulsion at
fixed PO’s. It was hypothesised that, despite the control of PO, the refined technique of
experienced paraplegic wheelchair users would result in lower absolute EE when
compared to NOV and PRAC groups. Although Chapter 5 reported a similar reduction of
EE after 36 minutes and three weeks of wheelchair practice, it was hypothesised that three
weeks of practice would elicit lower EE values than during wheelchair propulsion for the
first time.
6.3 Methods
6.3.1 Participants
Thirty-one male participants volunteered and gave written informed consent to
participate in this study. Approval for the study was obtained from the University Ethical
Advisory Committee. Body mass was recorded to the nearest 0.1 kg using double beam
wheelchair scales (300 series, Marsden, London, UK). Body length was recorded in the
able-bodied individuals using a Leicester height measure (SECA Ltd) and in the
paraplegics in the supine position to the nearest 0.1 cm (Luftkin tape). Body composition
was obtained using the skinfold technique, taken with Harpenden skin callipers
(FitnessAssist, Wrexham, UK) on the right hand side of the body in accordance with
Marfell-Jones et al. (2006). The four sites measured were the triceps, biceps, sub-scapular
and iliac crest.
Chapter 6 Energy expenditure of wheelchair propulsion: effect of experience
89
6.3.2 Design
Participants were assigned to one of three groups in accordance with their level of
wheelchair propulsion experience: 1) an able-bodied novice group (NOV; n = 11), 2) an
able-bodied group habituated to three weeks of practice (PRAC; n = 11), and 3) an
experienced group of paraplegic daily-wheelchair users (EXP; n = 9). Participant
characteristics are shown in Table 6.1. All able-bodied participants were tested in the same
daily activity wheelchair (Invacare Top End Crossfire Titanium, Bromakin, UK,
configured with 0.592 m diameter wheels, 4° camber, solid tyres and a total mass of 12.5
kg). The PRAC group took part in three weeks of wheelchair propulsion practice,
consisting of two 4-minute stages at fixed PO’s (10 and 18 W) at 1.1 m·s-1
(described
previously in Chapter 5, sections 5.3.4 and 5.3.8). The EXP group were tested in their own
daily wheelchair however, with the standardised 0.592 m diameter wheels and solid tyres.
The EXP group all had at least six years of experience in daily wheelchair propulsion. All
groups were tested on one occasion and attended the laboratory between 08:00 – 09:00
hours after a 12-hour fast. All testing was performed on a motor-driven treadmill (HP
Cosmos Saturn, Nussdorf-Traunstein, Germany). Gross efficiency, EE and push frequency
were determined during the sub-maximal exercise test at each fixed Po.
6.3.3 Test protocol
The sub-maximal exercise testing consisted of four 4-min stages at 10, 18, 26 and
34W (0% gradient) with a 5-minute rest period between each stage. Power outputs were
determined in accordance to previous values reported in the literature (van der Woude et
al., 1999; de Groot et al., 2002a; 2008). The data obtained during the final 34 W stage was
not used in subsequent analysis due to high RER values measured in the novice
individuals. For the PRAC and NOV group, five sub-maximal stages were completed
before this protocol took place (for separate analysis as part of Chapter 5) and these results
were not included in the current study. This resulted in the NOV group completing the
protocol for the current study after 20 minutes of wheelchair propulsion. During the final
minute of each stage, push frequency and RPE were recorded. Each participant received
detailed instructions about the use of the 15-point Borg scale (Borg, 1970) and was given
an example of how they might score their RPE. Expired gas was collected using the
Douglas bag technique as described in Chapter 5, section 5.3.3. Heart rate was recorded
continuously (PE4000 Polar Sport Tester, Kempele, Finland) via radio telemetry. On
completion of the sub-maximal stages, participants in EXP and PRAC groups received a

Chapter 6 Energy expenditure of wheelchair propulsion: effect of experience
90
20-minute recovery period. Following this, participants performed a 2peak test as
described in Chapter 5 section 5.3.3. Th 2peak test speeds ranged from 1.3 – 2.6 ∙s-1
,
and all participants satisfied the criteria for a valid 2peak. However, four PRAC
participants did not reach the HRpeak 95% of the age-predicted maximum (Goosey-
Tolfrey and Price, 2010).
6.3.4 Energy expenditure and GE
Energy expenditure and GE were calculated according to the methods described in
Chapter 5, section 5.3.5 & 5.3.6.
6.3.5 Calculation of fixed PO
Calculations of the fixed PO were obtained as previously documented in Chapter 5,
section 5.3.8.
6.3.6 Statistical analyses
Data were reported as mean (±SD). The SPSS (version 18; Chicago, Illinois, USA)
was used for all statistical analyses. A one-way ANOVA was used to examine any
significant differences between all three groups for physical characteristics. A 3x3 mixed
design ANOVA was used to establish if any statistically significant differences existed
between groups for EE, GE, HR 2, RPE and push frequency at 10, 18 and 26 W.
Bonferroni and Games-Howell post-hoc tests were used to examine further significant
effects between groups. The significance level was set at p ≤ 0.05 for all analyses. RPE
data was log transformed to satisfy normal distribution. Means (±SD) are reported from the
original data.
6.4 Results
6.4.1 Physical characteristics
Age and body length of the able-bodied NOV and PRAC groups did not differ, yet
the EXP group had a greater age and were smaller (p ≤ 0.03) (Table 6.1). Although no
significant difference was shown between groups for body mass, NOV were 13.2 kg
heavier than the EXP. Follow-up pair-wise comparisons revealed that the sum of skinfold
measurements tended to be higher for EXP compared with PRAC (p = 0.05; Table 6.1).
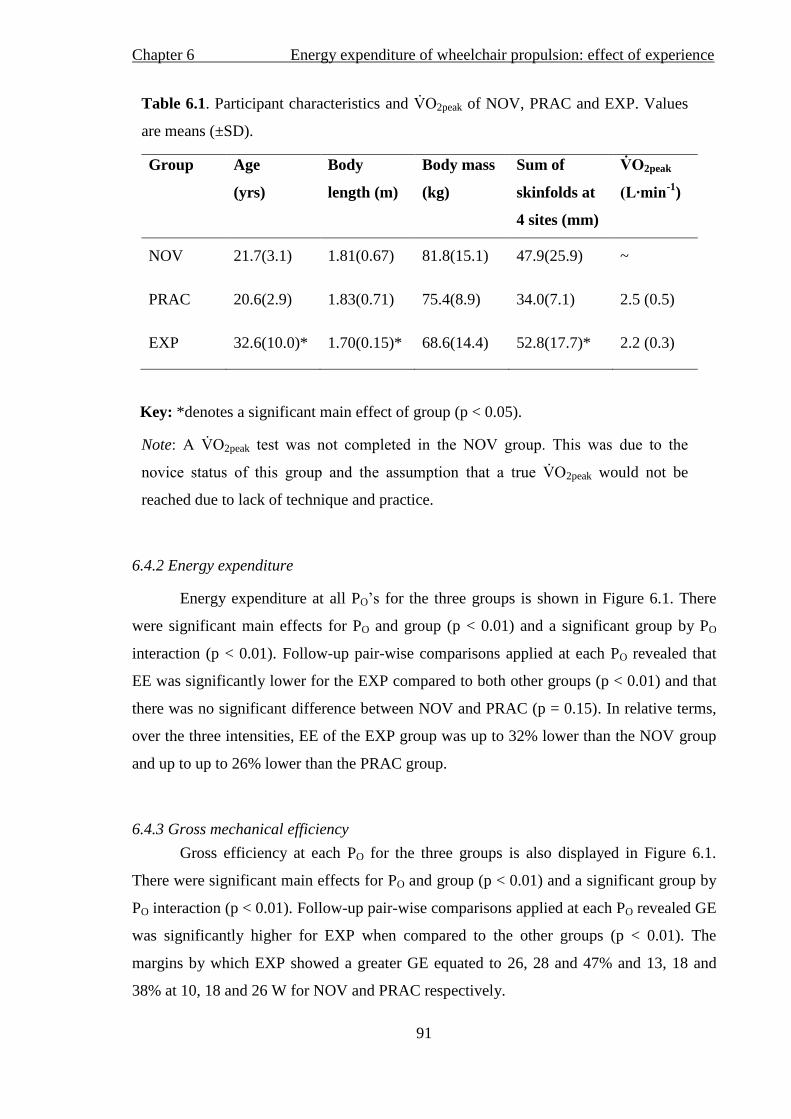
Chapter 6 Energy expenditure of wheelchair propulsion: effect of experience
91
Table 6.1. Participant characteristics and 2peak of NOV, PRAC and EXP. Values
are means (±SD).
Group Age
(yrs)
Body
length (m)
Body mass
(kg)
Sum of
skinfolds at
4 sites (mm)
2peak
(L∙min-1
)
NOV 21.7(3.1) 1.81(0.67) 81.8(15.1) 47.9(25.9) ~
PRAC 20.6(2.9) 1.83(0.71) 75.4(8.9) 34.0(7.1) 2.5 (0.5)
EXP 32.6(10.0)* 1.70(0.15)* 68.6(14.4) 52.8(17.7)* 2.2 (0.3)
Key: *denotes a significant main effect of group (p < 0.05).
Note 2peak s s . s s
s s s ss 2peak would not be
reached due to lack of technique and practice.
6.4.2 Energy expenditure
Energy expenditure at all PO’s for the three groups is shown in Figure 6.1. There
were significant main effects for PO and group (p < 0.01) and a significant group by PO
interaction (p < 0.01). Follow-up pair-wise comparisons applied at each PO revealed that
EE was significantly lower for the EXP compared to both other groups (p < 0.01) and that
there was no significant difference between NOV and PRAC (p = 0.15). In relative terms,
over the three intensities, EE of the EXP group was up to 32% lower than the NOV group
and up to up to 26% lower than the PRAC group.
6.4.3 Gross mechanical efficiency
Gross efficiency at each PO for the three groups is also displayed in Figure 6.1.
There were significant main effects for PO and group (p < 0.01) and a significant group by
PO interaction (p < 0.01). Follow-up pair-wise comparisons applied at each PO revealed GE
was significantly higher for EXP when compared to the other groups (p < 0.01). The
margins by which EXP showed a greater GE equated to 26, 28 and 47% and 13, 18 and
38% at 10, 18 and 26 W for NOV and PRAC respectively.
Baseline

Chapter 6 Energy expenditure of wheelchair propulsion: effect of experience
92
Figure 6.1. Mean (±SD) EE (kcal·h-1
) and GE (%) for NOV, PRAC and EXP
groups during wheelchair propulsion at 10, 18 and 26 (W). *denotes a significant
main effect for group (p < 0.01); a
denotes a significant main effect for PO (p <
0.01); b denotes a significant group by PO interaction (p < 0.01).
6.4.4 Physiological variables and perceptions of effort
Table 6.2 shows the HR, RPE and 2 across each PO for each group. There were
significant main effects for PO for all the aforementioned variables ( ≤ 0.01) and a main
effect of group for RPE and 2 ( ≤ 0.01). Follow-up pair-wise comparisons applied at
each PO revealed that there was a difference in RPE between EXP and NOV (p = 0.02).
[Type a quote from the document or the summary of an interesting point. You can position the text box anywhere in the document. Use the Drawing Tools tab to change the formatting of the pull quote text box.]
(W)
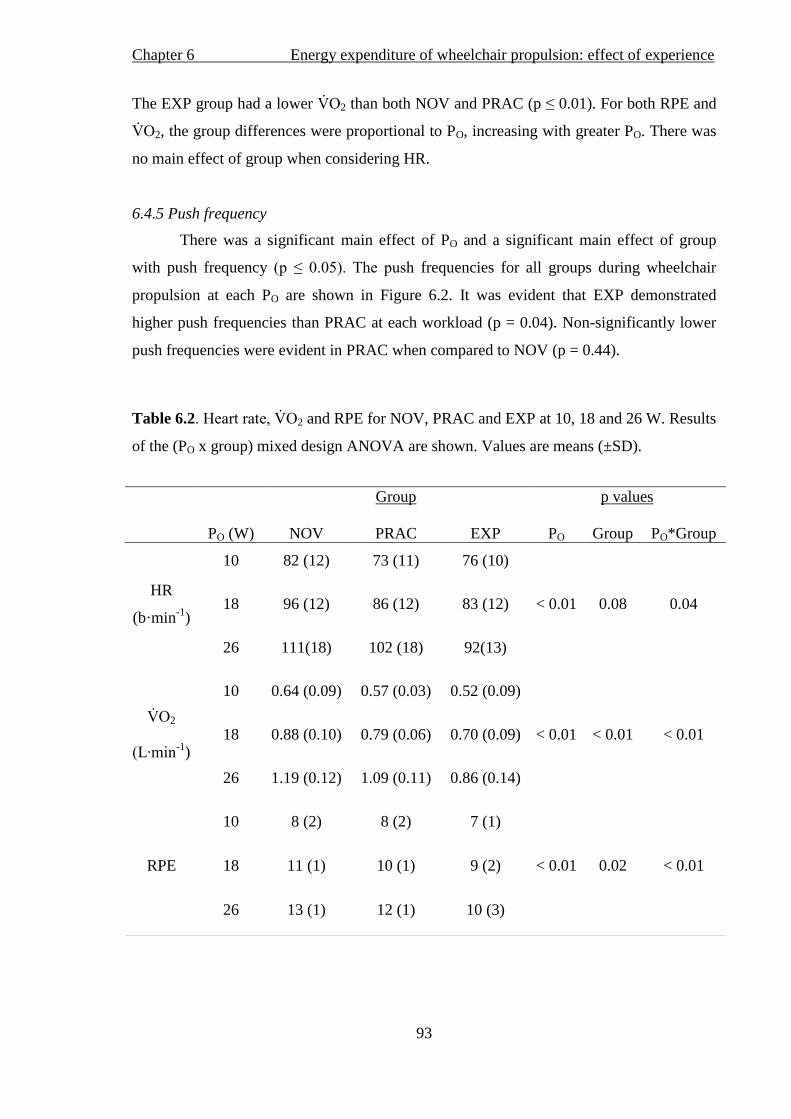
Chapter 6 Energy expenditure of wheelchair propulsion: effect of experience
93
The EXP group had a lower 2 than both NOV and PRAC (p ≤ 0.01). For both RPE and
2, the group differences were proportional to PO, increasing with greater PO. There was
no main effect of group when considering HR.
6.4.5 Push frequency
There was a significant main effect of PO and a significant main effect of group
with push frequency ( ≤ 0.05). s frequencies for all groups during wheelchair
propulsion at each PO are shown in Figure 6.2. It was evident that EXP demonstrated
higher push frequencies than PRAC at each workload (p = 0.04). Non-significantly lower
push frequencies were evident in PRAC when compared to NOV (p = 0.44).
Table 6.2. 2 and RPE for NOV, PRAC and EXP at 10, 18 and 26 W. Results
of the (PO x group) mixed design ANOVA are shown. Values are means (±SD).
Group p values
PO (W)
NOV
PRAC
EXP
PO
Group
PO*Group
HR
(b·min-1
)
10 82 (12) 73 (11) 76 (10)
18 96 (12) 86 (12) 83 (12) < 0.01 0.08 0.04
26 111(18) 102 (18) 92(13)
2
(L∙ -1
)
10 0.64 (0.09) 0.57 (0.03) 0.52 (0.09)
18 0.88 (0.10) 0.79 (0.06) 0.70 (0.09) < 0.01 < 0.01 < 0.01
26 1.19 (0.12) 1.09 (0.11) 0.86 (0.14)
RPE
10 8 (2) 8 (2) 7 (1)
18 11 (1) 10 (1) 9 (2) < 0.01 0.02 < 0.01
26 13 (1) 12 (1) 10 (3)

Chapter 6 Energy expenditure of wheelchair propulsion: effect of experience
94
Figure 6.2. Mean (±SD) push frequency during wheelchair propulsion at 10, 18 and 26 W
for NOV, PRAC and EXP groups. *denotes a significant main effect of group; a
denotes a
significant main effect of PO.
6.5 Discussion
This study investigated the effect of experience on the EE of wheelchair propulsion
at a PO of 10, 18 and 26 W on a motor-driven treadmill. Results supported the hypothesis
that EE was lower in EXP compared to NOV and PRAC. Extending the work of Chapter 5
by controlling for work load, the present findings suggested that EE did not differ
following practice when compared to the values obtained from the NOV group. Despite
Chapter 5 showing reductions in EE after practice, the second hypothesis of the current
investigation, that the reduction in EE would be greater after three weeks of practice when
compared to a novice group, was again rejected.
6.5.1 Energy expenditure and GE
As expected, lower EE was observed for the EXP group in addition to improved
GE at each PO, which is in support of and extends previous work (van der Woude et al.,
(W)
Chapter 6 Energy expenditure of wheelchair propulsion: effect of experience
95
1986; Brown et al., 1990; Dallmeijer et al., 2004; Lenton et al., 2008a). The current study
revealed that the margin between the EXP and both NOV and PRAC groups for EE clearly
increases as PO increases. Consequently it could be suggested that the EXP group can work
at a higher workload with a lower physiological cost. Similar patterns have been noted
when 2 has been compared between novice able-bodied and experienced paraplegic
wheelchair users with increasing PO during sub-maximal daily wheelchair propulsion (van
der Woude et al., 1986; Dallmeijer et al., 2004). A possible explanation for this may be due
to a more favourable propulsion technique having been developed through experience.
This will be discussed later, as pushing economy has been previously associated with
propulsion technique (Goosey et al., 2000).
The EXP group displayed a lower EE when compared to NOV by up to 32% at 26
W. This difference could make a substantial contribution to nutritional requirements if
wheelchair propulsion was conducted over extended periods of time. According to de
Groot et al. (2005), GE increases rapidly in the first few months of rehabilitation due to the
intensity of therapy within this period. This suggests the large amounts of energy needed in
the first few weeks of rehabilitation would start to reduce during continual use of a
wheelchair. In the current study, after only three weeks of practice, EE was shown to be
lower (by around 6-11%) than no practice. Although this difference is not statistically
significant, the level of this reduction should enable practitioners to appreciate the EE
patterns during the course of rehabilitation. Nevertheless, experienced wheelchair users
need correct guidance for nutritional requirements also. Thus EE values obtained during
rehabilitation would not be a suitable estimate of metabolic cost in experienced wheelchair
users.
Data has been provided to inform individuals of the EE over various propulsion
surface conditions in experienced wheelchair users (Collins et al., 2010) and at specific
exercise intensities in experienced children and young adult users (Hildebrandt et al.,
1970). However, this earlier work of Hildebrandt and colleagues (1970’s) would have
employed older model wheelchairs, much heavier than those found today (DiGiovine et al.,
2006). Consequently it is expected that the EE values would be significantly higher in
earlier studies when compared to recent work. To add to the recent work of Collins et al.
(2010), the inclusion of NOV, PRAC and EXP wheelchair users in the current study has
allowed for comparisons between individuals with different levels of wheelchair
propulsion skill.
Chapter 6 Energy expenditure of wheelchair propulsion: effect of experience
96
6.5.2 Physiological variables and perceptions of effort
Oxygen uptake displayed the same pattern to that described earlier for EE,
s 2 shown in the EXP compared to the NOV and PRAC groups. In
terms of the HR responses, there was a tendency for the EXP to elicit a higher HR than the
PRAC group at 10 W. This may indicate the additional strain of pushing at an unfamiliar
low intensity which was demonstrated by Mukherjee et al. (2002). It must be noted
however, that most of the HRs are b 100 b∙ -1
and demonstrated high inter-
individual variations within group, representing a potential lack of meaningful values from
HR alone. Nevertheless, as PO increased, 2 were lower in EXP than NOV
and PRAC providing further evidence that the physiological demand of wheelchair
propulsion is lower in experienced individuals at higher intensities of propulsion.
6.5.3 Physical capacity
As the majority of the literature has shown previously, wheelchair athletes have a
higher aerobic capacity than that of untrained able-bodied individuals during upper body
exercise (Zwiren and Bar-Or, 1975; Hooker and Wells, 1992; Huonker et al., 1998).
However, the results of the current study reported 2peak values between
PRAC and EXP, which is in agreement with Dallmeijer et al. (2004). With this in mind, it
is suggested that aerobic capacity is not an important factor when considering a reduced O2
consumption during sub-maximal wheelchair propulsion.
6.5.4 Propulsion technique
6.5.4.i Push frequency
Absolute O2 cost and GE has been shown to be affected by propulsion technique
(Veeger et al., 1992a; Dallmeijer et al., 1998; 1999b; de Groot et al., 2002a; de Groot et al.,
2008). Propulsion technique is defined by force production and timing parameters
including push frequency (van der Woude et al., 1989a). de Groot et al. (2003) also
suggested a reduced cycle frequency and longer recovery may cause the increase in GE
during wheelchair propulsion. In light of this, a reduction in push frequency has been
reported alongside reduced O2 cost after a 3-week wheelchair propulsion practice period
(de Groot et al., 2002a; Chapter 5). It is not just the effect of practice that is causing these
changes, as lower O2 cost has also been shown together with lower push frequencies in
experienced wheelchair racers (Goosey et al., 2000).

Chapter 6 Energy expenditure of wheelchair propulsion: effect of experience
97
The current study’s s however do not agree with previous literature, as the
EXP wheelchair users had a higher push frequency when compared to both NOV (not
significant) and PRAC (p = 0.04). It must be noted that the high push frequencies may be
unique s ’s cohort and wheelchair configurations. Furthermore, the nature
of the EXP group’s sporting background, such as wheelchair basketball, which involves
high intensity intermittent sprints, could help explain this finding (Lenton et al., 2008a). In
the activity of cycling, not too dissimilar to the cyclic movement of wheelchair propulsion,
Marsh et al. (1997) found that trained cyclists adapt to higher pedalling cadences.
Similarly, EXP wheelchair users may have developed an optimal push frequency and over
time show an improvement in economy. de Groot et al. (2003) suggested a reduced stroke
may minimise the O2 cost of propulsion. Therefore the NOV and PRAC groups may have
been using more energy through propulsion, with larger upper body movements, rather
than the more frequent but potentially smaller movements of the EXP group. Use of
kinematic analysis to measure the propulsion technique of experienced and novice
wheelchair users may help answer this question in the future.
As explained earlier, the reason behind the larger margin in EE between NOV and
PRAC and the EXP wheelchair users as PO increases could be due to propulsion technique.
As workload increases, EXP may adapt earlier to a change in propulsion pattern when
compared to NOV and PRAC. This concept is highlighted by the observation of a changed
stroke pattern in experienced wheelchair users as propulsion speed increased (Boninger et
al., 2002). de Groot et al. (2004) suggested segmental accelerations at the beginning and
the end of a push are needed when speed increases, which could potentially lead to a
change in stroke pattern. It is also important to note that the PRAC group practiced at the
two lower workloads of 10 and 18 W. Therefore, the higher workload may have been
unfamiliar to them and consequently produced a larger EE when compared to EXP.
6.5.4.ii Effective force production
In Chapter 5 it was established that after three weeks of wheelchair propulsion
practice, the magnitude of force application increased but not in the tangential direction
and thus not producing a greater effective force on the hand-rim. Goosey-Tolfrey et al.
(2011) also reported no change in the FEF after a 3-week wheelchair propulsion practice.
Lack of effective force production in experienced wheelchair users (Rozendaal et al., 2003)
and even decreased muscle efficiency during forward force production (Bregman et al.,
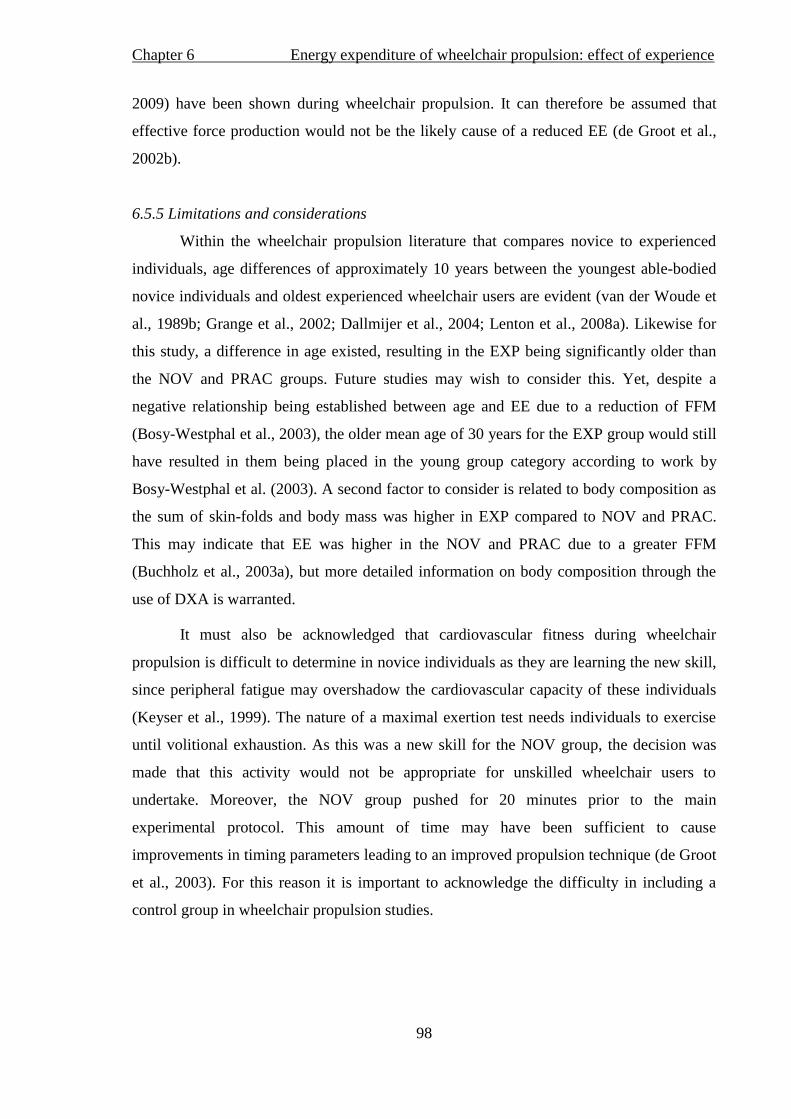
Chapter 6 Energy expenditure of wheelchair propulsion: effect of experience
98
2009) have been shown during wheelchair propulsion. It can therefore be assumed that
effective force production would not be the likely cause of a reduced EE (de Groot et al.,
2002b).
6.5.5 Limitations and considerations
Within the wheelchair propulsion literature that compares novice to experienced
individuals, age differences of approximately 10 years between the youngest able-bodied
novice individuals and oldest experienced wheelchair users are evident (van der Woude et
al., 1989b; Grange et al., 2002; Dallmijer et al., 2004; Lenton et al., 2008a). Likewise for
this study, a difference in age existed, resulting in the EXP being significantly older than
the NOV and PRAC groups. Future studies may wish to consider this. Yet, despite a
negative relationship being established between age and EE due to a reduction of FFM
(Bosy-Westphal et al., 2003), the older mean age of 30 years for the EXP group would still
have resulted in them being placed in the young group category according to work by
Bosy-Westphal et al. (2003). A second factor to consider is related to body composition as
the sum of skin-folds and body mass was higher in EXP compared to NOV and PRAC.
This may indicate that EE was higher in the NOV and PRAC due to a greater FFM
(Buchholz et al., 2003a), but more detailed information on body composition through the
use of DXA is warranted.
It must also be acknowledged that cardiovascular fitness during wheelchair
propulsion is difficult to determine in novice individuals as they are learning the new skill,
since peripheral fatigue may overshadow the cardiovascular capacity of these individuals
(Keyser et al., 1999). The nature of a maximal exertion test needs individuals to exercise
until volitional exhaustion. As this was a new skill for the NOV group, the decision was
made that this activity would not be appropriate for unskilled wheelchair users to
undertake. Moreover, the NOV group pushed for 20 minutes prior to the main
experimental protocol. This amount of time may have been sufficient to cause
improvements in timing parameters leading to an improved propulsion technique (de Groot
et al., 2003). For this reason it is important to acknowledge the difficulty in including a
control group in wheelchair propulsion studies.
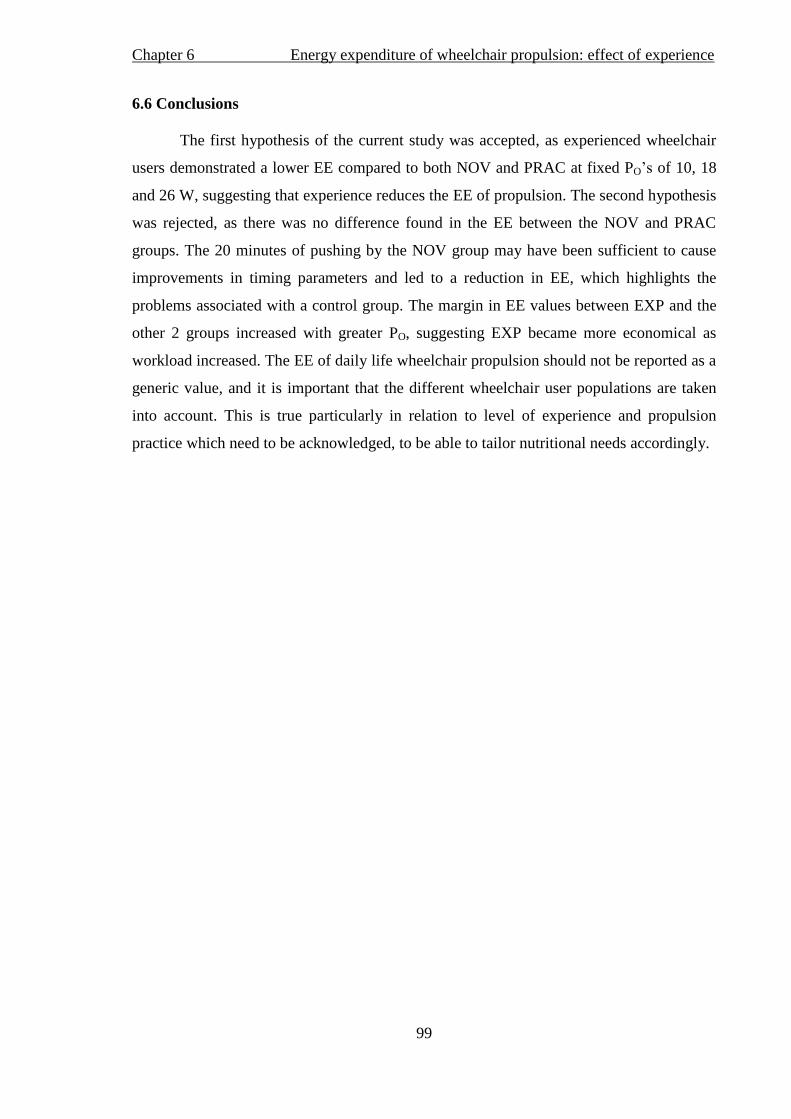
Chapter 6 Energy expenditure of wheelchair propulsion: effect of experience
99
6.6 Conclusions
The first hypothesis of the current study was accepted, as experienced wheelchair
users demonstrated a lower EE compared to both NOV and PRAC at fixed PO’s of 10, 18
and 26 W, suggesting that experience reduces the EE of propulsion. The second hypothesis
was rejected, as there was no difference found in the EE between the NOV and PRAC
groups. The 20 minutes of pushing by the NOV group may have been sufficient to cause
improvements in timing parameters and led to a reduction in EE, which highlights the
problems associated with a control group. The margin in EE values between EXP and the
other 2 groups increased with greater PO, suggesting EXP became more economical as
workload increased. The EE of daily life wheelchair propulsion should not be reported as a
generic value, and it is important that the different wheelchair user populations are taken
into account. This is true particularly in relation to level of experience and propulsion
practice which need to be acknowledged, to be able to tailor nutritional needs accordingly.

Chapter 7 Energy expenditure between classification groups in wheelchair basketball
100
Chapter 7
Energy expenditure and physiological responses between classification groups in
wheelchair basketball
7.1 Abstract
Purpose: To examine the physiological demands of elite competitive wheelchair
basketball play in relation to the International Wheelchair Basketball Federation (IWBF)
classification categories, and to estimate competitive game play EE. Methods: Fourteen
elite wheelchair basketball players were categorised into low classification (LOW (n=7):
IWBF class 1-2.5) and high classification (HIGH (n=7): IWBF class 3-4.5) groups.
Participants performed a sub-maximal and 2peak test on a specialised motorised
treadmill. Heart rate, 2 and [BLa] were measured. Heart rate and EE were measured
during whole basketball play (WBP), including timeouts and end of quarters, and during
actual play (APT), excluding timeouts and end of quarters, at an international wheelchair
basketball competition. Results: 2peak was similar between classification groups but
HRpeak was lower in the LOW group. HIGH had significantly higher propulsion speed,
2 and HR at both LT (p = 0.03, 0.03 & 0.001 respectively) and a 2 mmol∙L-1
[BLa]
reference point (p = 0.005, 0.05 & 0.005 respectively). During WBP, the LOW group spent
50 (16) minutes on court vs. 40 (17) minutes in the HIGH group, and during APT the
LOW group spent 42(13) minutes on court vs. 34 (16) minutes in the HIGH group. There
was a tendency for mean EE during WBP to be lower for the LOW group when compared
to the HIGH group (687 (189) vs. 822 (161) kcal∙h-1
; p = 0.09; effect size = 0.47). Similar
trends were also noted for mean EE during APT (709 (122) vs. 845 (170) kcal∙h-1
; p = 0.10
(LOW and HIGH respectively)) with a medium effect size of 0.44. The HR was 8 bmin-1
lower for LOW during both WBP (p = 0.07) and APT (p = 0.05). Conclusions:
Wheelchair basketball players with a higher classification tend to have higher EE during a
competitive game. The results further suggest that players with a higher functional capacity
have greater potential to work at higher exercise intensities before the onset of blood
lactate accumulation. This study supports the IWBF classification system and provides
data on the EE of national and international wheelchair basketball competition for athletes
and practitioners.

Chapter 7 Energy expenditure between classification groups in wheelchair basketball
101
7.2 Introduction
Wheelchair basketball is a physically demanding team sport that requires a high
degree of skill and technical expertise, with anaerobic and aerobic capabilities
(Vanlandewijck et al., 2001; Goosey-Tolfrey, 2005; Tweedy and Diaper, 2010).
International games last 40 minutes and are divided into four quarters for both men and
women. This internationally recognised Paralympic sport operates a classification system
which enables individuals with a range of disabilities to compete equitably against each
other. This International Wheelchair Basketball Federation (IWBF, 2009) classification
system ranges from 1.0 - 4.5 points, based on player functional ability to complete skills
including pushing, pivoting, shooting, rebounding, dribbling, passing and catching
(Tweedy and Diaper, 2010). Players with 1.0 point have the least functional ability, and
players with 4.5 points have most functional ability.
Previous wheelchair basketball research has reported high peak aerobic capacities
of between 2.3 and 3.0 L∙min-1
(Bloxham et al., 2001; Goosey-Tolfrey, 2005; Pérez et al.,
2007; Bernardi et al., 2010), average game play HR of 128 to 154 b∙min-1
(Bernardi et al.,
1988; Coutts, 1988; Bloxham et al., 2001, Pérez et al., 2007; Bernardi et al., 2010) and
average game play 2 consumption between 1.35 and 1.95 L∙min-1
(Bernardi et al., 1988;
Bernardi et al., 2010). Previous work has estimated the EE of wheelchair basketball
training in male paraplegic players at various competitive levels to range from 246 to 516
kcal∙h-1
(Burke et al., 1985; Usita et al., 2003; Abel et al., 2008) but not at elite
international competitive level.
As noted earlier, functional classification in wheelchair basketball is based on a
players’ ability to complete certain movements and skills specific to the sport. That said,
higher 2peak, PO, anaerobic and sprint performances are associated with greater
functional classification (van der Woude et al., 1998; 2002), and there is emerging
literature that supports the present IWBF classification system based upon physiological
parameters (de Lira et al., 2010). For example, significant correlations have been found
between IWBF classification and 2peak 2 at ventilatory threshold and PO
(Vanlandewijck et al., 1994b; Vanlandewijck et al., 1995; de Lira et al., 2010) suggesting
that other physiological parameters, namely EE, may be linked with classification level.
The EE and physiological responses for able-bodied athletes have been shown to be
dependent on positional requirements (Duthie et al., 2003; Stolen et al., 2005; Drinkwater
et al., 2008) and demands of the sport (McArdle et al., 2001). Whilst these are
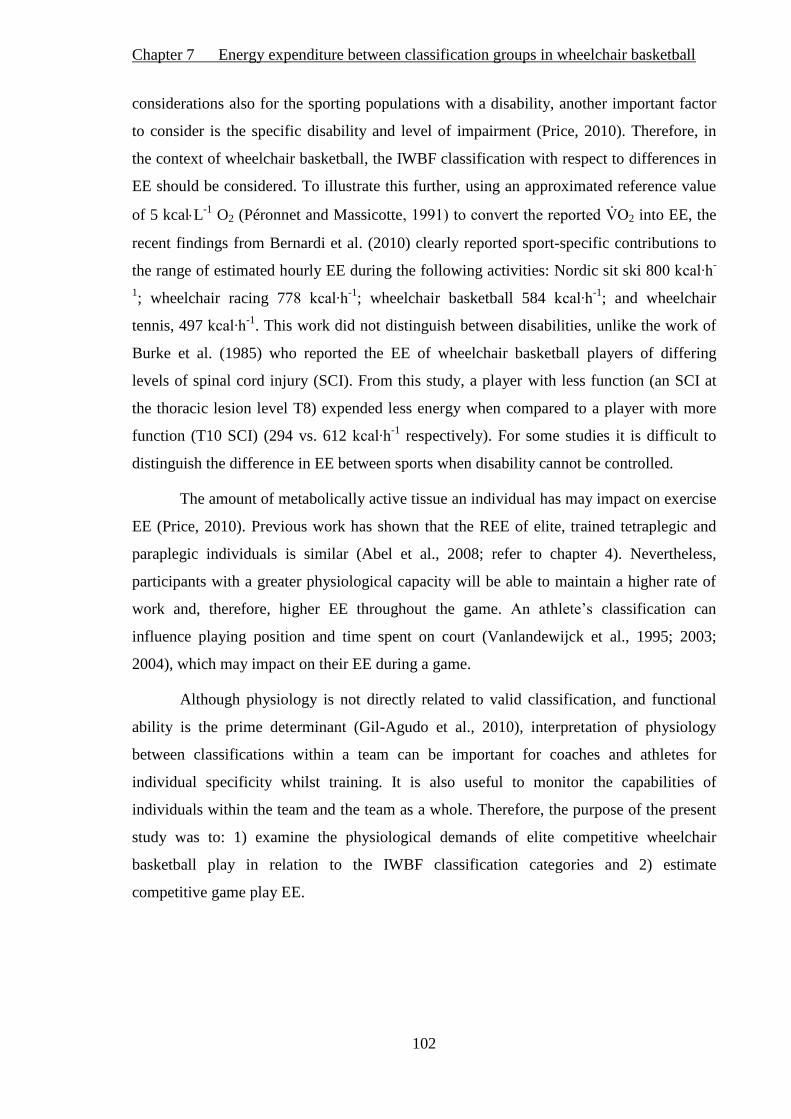
Chapter 7 Energy expenditure between classification groups in wheelchair basketball
102
considerations also for the sporting populations with a disability, another important factor
to consider is the specific disability and level of impairment (Price, 2010). Therefore, in
the context of wheelchair basketball, the IWBF classification with respect to differences in
EE should be considered. To illustrate this further, using an approximated reference value
of 5 kcalL-1
O2 (Péronnet and Massicotte to con ert the reporte 2 into EE, the
recent findings from Bernardi et al. (2010) clearly reported sport-specific contributions to
the range of estimated hourly EE during the following activities: Nordic sit ski 800 kcal∙h-
1; wheelchair racing 778 kcal∙h
-1; wheelchair basketball 584 kcal∙h
-1; and wheelchair
tennis, 497 kcal∙h-1
. This work did not distinguish between disabilities, unlike the work of
Burke et al. (1985) who reported the EE of wheelchair basketball players of differing
levels of spinal cord injury (SCI). From this study, a player with less function (an SCI at
the thoracic lesion level T8) expended less energy when compared to a player with more
function (T10 SCI) (294 vs. 612 kcal∙h-1
respectively). For some studies it is difficult to
distinguish the difference in EE between sports when disability cannot be controlled.
The amount of metabolically active tissue an individual has may impact on exercise
EE (Price, 2010). Previous work has shown that the REE of elite, trained tetraplegic and
paraplegic individuals is similar (Abel et al., 2008; refer to chapter 4). Nevertheless,
participants with a greater physiological capacity will be able to maintain a higher rate of
work and, therefore, higher EE throughout the game. An athlete’s classification can
influence playing position and time spent on court (Vanlandewijck et al., 1995; 2003;
2004), which may impact on their EE during a game.
Although physiology is not directly related to valid classification, and functional
ability is the prime determinant (Gil-Agudo et al., 2010), interpretation of physiology
between classifications within a team can be important for coaches and athletes for
individual specificity whilst training. It is also useful to monitor the capabilities of
individuals within the team and the team as a whole. Therefore, the purpose of the present
study was to: 1) examine the physiological demands of elite competitive wheelchair
basketball play in relation to the IWBF classification categories and 2) estimate
competitive game play EE.

Chapter 7 Energy expenditure between classification groups in wheelchair basketball
103
7.3 Methods
7.3.1 Participants
Fourteen male, Great Britain wheelchair basketball players participated in this
study. From this pool, two groups were created according to their IWBF disability
classification as in previous research (Goosey-Tolfrey et al., 2003). Group 1 (LOW)
consisted of participants from the 1 to 2.5 class (n=7) and group 2 (HIGH) consisted of
participants from the 3 to 4.5 class (n=7) (IWBF, 2009). The University Ethical Advisory
Committee approved the study and written consent was obtained by all participants prior to
testing. Participant characteristics are given in Table 7.1.
Table 7.1. Participant characteristics for LOW & HIGH groups. The LOW group
consists of players from the IWBF Classification (1.0 – 2.5) and the HIGH group
of players from the IWBF Classification (3.0– 4.5). Values are means (±SD).
Key: *denotes a significant difference between HIGH and LOW, p = 0.01.
7.3.2 Experimental design
There were two parts to this study: (a) a physiological laboratory assessment; and
(b) HR data collection during either an international or national wheelchair basketball
competition 2 weeks of the lab assessment. All participants were tested in their own
Variable LOW (n = 7) HIGH (n = 7)
Age (yrs) 30.3 (8.7) 25.3 (3.2)
Body mass (kg) 71.1 (13.2) 76.1 (15.1)
Sum of 4 site skin-folds (mm) 41.5 (12.4) 34.9 (5.9)
Onset of disability (yrs) 22.3 (3.9) 18.4 (6.2)
Wheelchair sport experience (yrs) 14.7 (3.6) 10.6 (4.7)
Weekly training ( h·wk-1
) 17.1 (2.1) 17.1 (2.4)
Wheel diameter (m) 0.63 (0.02)* 0.66 (0.03)
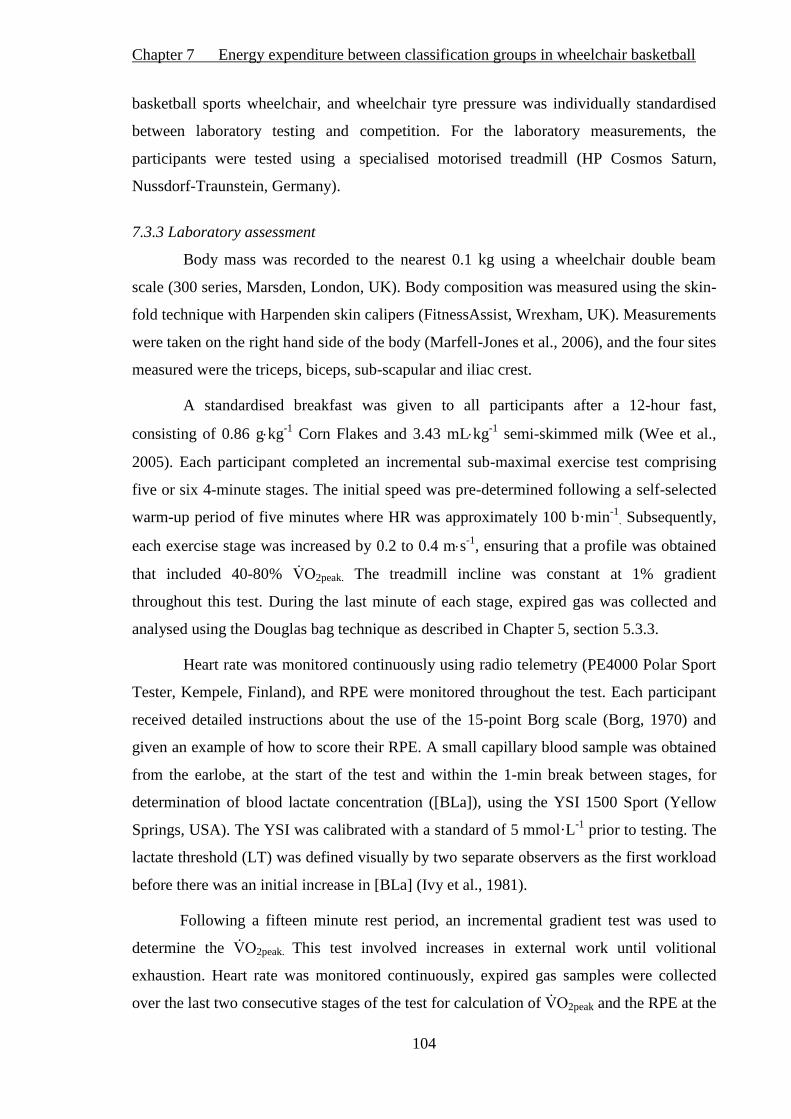
Chapter 7 Energy expenditure between classification groups in wheelchair basketball
104
basketball sports wheelchair, and wheelchair tyre pressure was individually standardised
between laboratory testing and competition. For the laboratory measurements, the
participants were tested using a specialised motorised treadmill (HP Cosmos Saturn,
Nussdorf-Traunstein, Germany).
7.3.3 Laboratory assessment
Body mass was recorded to the nearest 0.1 kg using a wheelchair double beam
scale (300 series, Marsden, London, UK). Body composition was measured using the skin-
fold technique with Harpenden skin calipers (FitnessAssist, Wrexham, UK). Measurements
were taken on the right hand side of the body (Marfell-Jones et al., 2006), and the four sites
measured were the triceps, biceps, sub-scapular and iliac crest.
A standardised breakfast was given to all participants after a 12-hour fast,
consisting of 0.86 gkg-1
Corn Flakes and 3.43 mLkg-1
semi-skimmed milk (Wee et al.,
2005). Each participant completed an incremental sub-maximal exercise test comprising
five or six 4-minute stages. The initial speed was pre-determined following a self-selected
warm-up period of five minutes where HR was approximately 100 b·min-1
. Subsequently,
each exercise stage was increased by 0.2 to 0.4 ms-1
, ensuring that a profile was obtained
that included 40-80% 2peak. The treadmill incline was constant at 1% gradient
throughout this test. During the last minute of each stage, expired gas was collected and
analysed using the Douglas bag technique as described in Chapter 5, section 5.3.3.
Heart rate was monitored continuously using radio telemetry (PE4000 Polar Sport
Tester, Kempele, Finland), and RPE were monitored throughout the test. Each participant
received detailed instructions about the use of the 15-point Borg scale (Borg, 1970) and
given an example of how to score their RPE. A small capillary blood sample was obtained
from the earlobe, at the start of the test and within the 1-min break between stages, for
determination of blood lactate concentration ([BLa]), using the YSI 1500 Sport (Yellow
Springs, USA). The YSI was calibrated with a standard of 5 mmol·L-1
prior to testing. The
lactate threshold (LT) was defined visually by two separate observers as the first workload
before there was an initial increase in [BLa] (Ivy et al., 1981).
Following a fifteen minute rest period, an incremental gradient test was used to
determine the 2peak. This test involved increases in external work until volitional
exhaustion. Heart rate was monitored continuously, expired gas samples were collected
over the last two consecutive stages of the test for calculation of 2peak and the RPE at the

Chapter 7 Energy expenditure between classification groups in wheelchair basketball
105
end of the test was recorded. On completion of the peak test, a capillary blood sample was
also taken and analysed to determine [BLa] as previously described. All participants
satisfied the criteria for a valid 2peak: a peak RER 1.10 and HRpeak 95% of the age-
pre icte maximum (200 b∙min-1
minus chronological age in years), as used previously in
this population (Diaper and Goosey-Tolfrey, 2009). The HRpeak was taken as the highest
value recorded during the test. However, if a higher HR value was obtained during match
play, then that value was used in subsequent analyses.
7.3.4 Competition data
All participants wore HR monitors (Polar team system, Kempele, Finland) during
the pre-determined competitive wheelchair basketball match. The HR monitors were set to
record at 5-second intervals, and the match start-time, substitutions and time-outs were all
manually recorded. This allowed for the calculation of whole basketball play (WBP)
including time outs, end of quarters and actual basketball playing time (APT) when an
individual was on the basketball court. Heart rate during time on the bench and during half-
time was not recorded. The average HR and HRpeak during the matches were calculated for
each participant. Where possible, more than one match was analysed per player to try and
obtain a typical match play response.
7.3.5 Calculation of EE
Energy expenditure was calculated for each sub-maximal stage (Frayn, 1983) by
estimating carbohy rate an fat oxi ation in g∙min-1
as described in Chapter 3, section
3.3.4.
7.3.6 Statistical analyses
Data were reported as mean (±SD), and standard descriptive statistics were
obtained for all variables using SPSS (version 18.0, Chicago, Illinois, USA). Independent
t-tests or the non-parametric equivalent (Mann-Whitney U test) were conducted to
determine differences between classification groups for all physiological parameters. The
2 and HR data at LT were expressed in absolute values and as a percentage of peak
values. Point by point regression was performed on the [BLa] data to determine the 2
and HR at a fixed moderate exercise intensity, representing a [BLa] of 2 mmolL-1
(Abel et
al., 2003). The 2peak data were presented as absolute (L∙min-1 relati e (mL∙kg
-1∙min
-1)

Chapter 7 Energy expenditure between classification groups in wheelchair basketball
106
an scale (mL∙kg-0.82
∙min-1
) values (Goosey-Tolfrey et al., 2003). Estimated EE data from
the sub-maximal stages in the laboratory assessment and HR data at each sub-maximal
stage were used to create individual regression equations, an the Pearson’s r correlation for
this relationship was calculated. This equation was used to estimate the EE during game play.
Using HR from the game play, average EE was calculated using the individual regression
equations. 2 was calculated at 2.6 an 3.6 m∙s-1
between classification groups by using
individual regression analysis between speed and 2. This was then used as a measure of
pushing economy. Significance was accepted at p ≤ 0.05, and ES and 95% CI were used to
complement the more traditional statistics as previously described in Chapter 3 section
3.3.5.
7.4 Results
7.4.1 Base-line characteristics and peak physiological parameters
No between-group differences were shown for baseline characteristics (age, body
mass, weekly training and body composition (p > 0.05)). However, LOW self-selected
wheelchair diameter was smaller than HIGH (p = 0.01, Table 7.1). Table 7.2 shows that
2peak was similar between the groups, regardless of how it was expressed as was peak
[BLa]; the only notable difference was the lower group average HRpeak for LOW (p =
0.03).
7.4.2 Physiological responses in the laboratory
At LT, LOW had significantly higher [BLa] than HIGH (p = 0.05). Propulsion
speed, 2 and HR, at both LT (p = 0.03, 0.03 & 0.001 respectively) and the 2 mmol∙L-1
[BLa] reference (p = 0.005, 0.05 & 0.005 respectively), were significantly lower for LOW
(Table 7.3). Relative values of HR at LT (p = 0.01) and 2 at 2 mmolL-1
[BLa] (p =
0.03) were also lower in LOW (Table 7.3). There was a trend for relative values of HR at 2
mmolL-1
[BLa] to be lower in LOW (p = 0.06). At LT, RER and RPE did not differ
between groups. Pushing economy did not differ between the groups at 2.6 ms-1
or at 3.6
m∙s-1
(Figure 7.1).
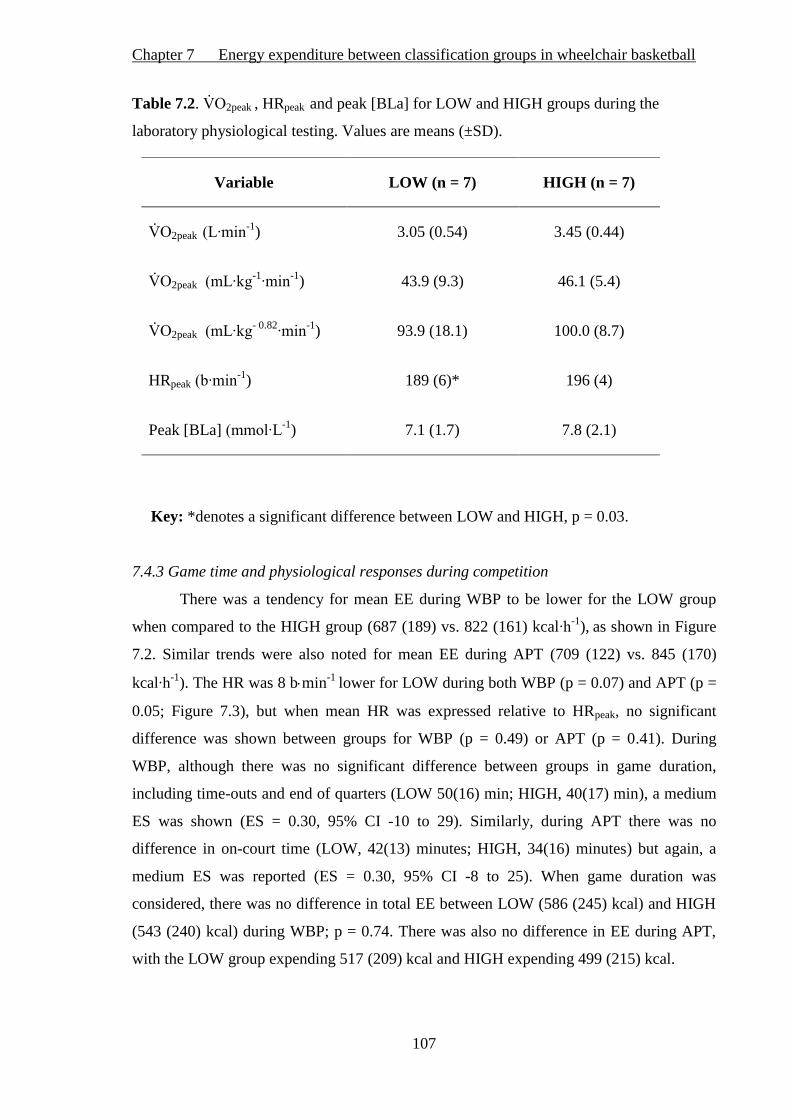
Chapter 7 Energy expenditure between classification groups in wheelchair basketball
107
Table 7.2. 2peak , HRpeak and peak [BLa] for LOW and HIGH groups during the
laboratory physiological testing. Values are means (±SD).
Key: *denotes a significant difference between LOW and HIGH, p = 0.03.
7.4.3 Game time and physiological responses during competition
There was a tendency for mean EE during WBP to be lower for the LOW group
when compared to the HIGH group (687 (189) vs. 822 (161) kcal∙h-1
), as shown in Figure
7.2. Similar trends were also noted for mean EE during APT (709 (122) vs. 845 (170)
kcal∙h-1
). The HR was 8 bmin-1
lower for LOW during both WBP (p = 0.07) and APT (p =
0.05; Figure 7.3), but when mean HR was expressed relative to HRpeak, no significant
difference was shown between groups for WBP (p = 0.49) or APT (p = 0.41). During
WBP, although there was no significant difference between groups in game duration,
including time-outs and end of quarters (LOW 50(16) min; HIGH, 40(17) min), a medium
ES was shown (ES = 0.30, 95% CI -10 to 29). Similarly, during APT there was no
difference in on-court time (LOW, 42(13) minutes; HIGH, 34(16) minutes) but again, a
medium ES was reported (ES = 0.30, 95% CI -8 to 25). When game duration was
considered, there was no difference in total EE between LOW (586 (245) kcal) and HIGH
(543 (240) kcal) during WBP; p = 0.74. There was also no difference in EE during APT,
with the LOW group expending 517 (209) kcal and HIGH expending 499 (215) kcal.
Variable LOW (n = 7) HIGH (n = 7)
2peak (L∙min-1
) 3.05 (0.54) 3.45 (0.44)
2peak (mL∙kg-1∙min
-1) 43.9 (9.3) 46.1 (5.4)
2peak (mL∙kg- 0.82
∙min-1
) 93.9 (18.1) 100.0 (8.7)
HRpeak (b∙min-1
) 189 (6)* 196 (4)
Peak [BLa] (mmol∙L-1
) 7.1 (1.7) 7.8 (2.1)
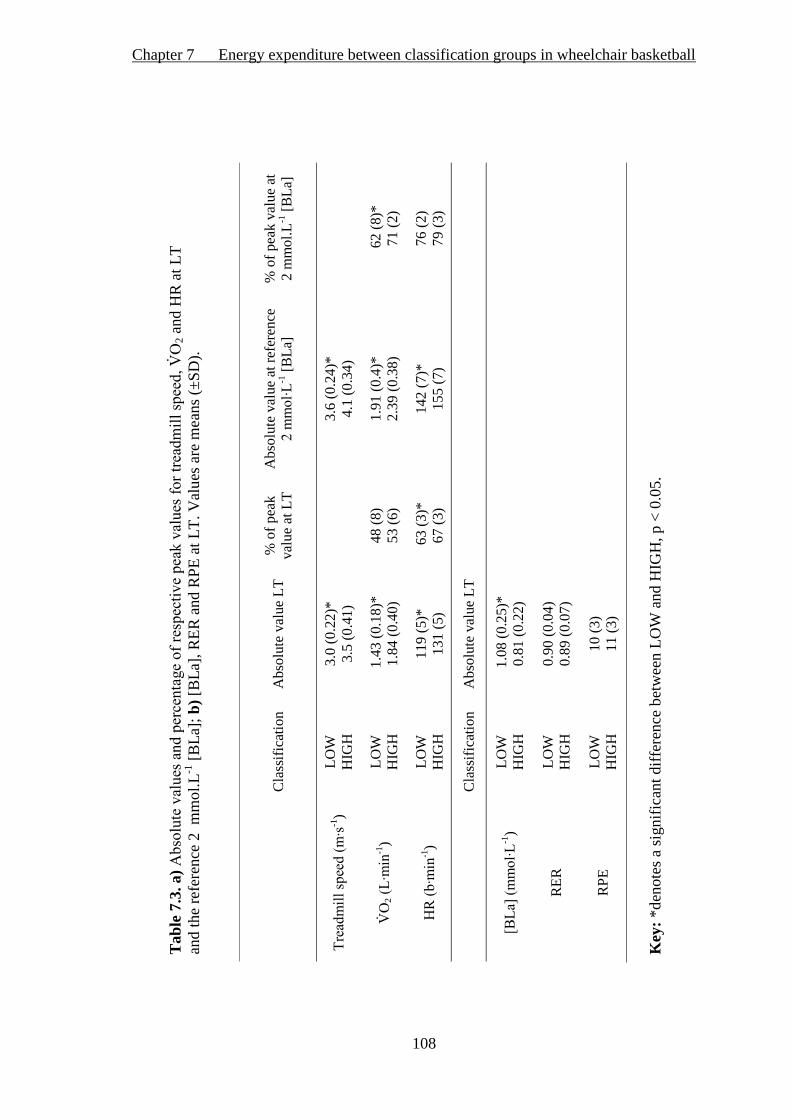
Chapter 7 Energy expenditure between classification groups in wheelchair basketball
108
Tab
le 7
.3. a) Absolute alues an percentage of respecti e peak alues for trea mill spee
2 a
nd H
R a
t L
T
and t
he
refe
rence
2 m
mo
l.L
-1 [
BL
a];
b)
[BL
a], R
ER
and R
PE
at
LT
. V
alu
es a
re m
eans
(±S
D).
C
lass
ific
atio
n
Abso
lute
val
ue
LT
%
of
pea
k
val
ue
at L
T
Abso
lute
val
ue
at r
efer
ence
2 mmol∙L
-1 [
BL
a]
% o
f p
eak v
alu
e at
2 m
mo
l.L
-1 [
BL
a]
Trea mill spee (m∙s
-1)
LO
W
HIG
H
3.0
(0.2
2)*
3.5
(0.4
1)
3
.6 (
0.2
4)*
4.1
(0
.34
)
2 (L∙min
-1)
LO
W
HIG
H
1.4
3 (
0.1
8)*
1.8
4 (
0.4
0)
48 (
8)
53 (
6)
1.9
1 (
0.4
)*
2.3
9 (
0.3
8)
62
(8)*
71
(2)
HR (b∙min
-1)
LO
W
HIG
H
119 (
5)*
131 (
5)
63 (
3)*
67 (
3)
14
2 (
7)*
15
5 (
7)
76
(2)
79
(3)
C
lass
ific
atio
n
Abso
lute
val
ue
LT
[BLa] (mmol∙L
-1)
LO
W
HIG
H
1.0
8 (
0.2
5)*
0.8
1 (
0.2
2)
RE
R
LO
W
HIG
H
0.9
0 (
0.0
4)
0.8
9 (
0.0
7)
RP
E
LO
W
HIG
H
10 (
3)
11 (
3)
Key
: *d
enote
s a
signif
ican
t dif
fere
nce
bet
wee
n L
OW
and H
IGH
, p <
0.0
5.

Chapter 7 Energy expenditure between classification groups in wheelchair basketball
109
Figure 7.1. ean ( 2 as a measure of pushing economy during
wheelchair propulsion at 2.6 m∙s-1
an 3.6 m∙s1 expresse as a L∙min
-1 and b)
relative to body mass. Note: values were interpolated from individual regression
equations between a range of speeds completed by all participants.
a) b) a) a) b)
a)
b)
1.0
1.2
1.4
1.6
1.8
2.0
2.2
2.4
2.6
Pu
shin
g e
con
om
y (
L∙m
in-1
)
LOW HIGH
15
17
19
21
23
25
27
29
31
33
35
2.6 3.6
Pu
shin
g e
con
om
y (
mL
∙kg∙m
in-1
)
Treadmill speed (m∙s-1)
a)
b)

Chapter 7 Energy expenditure between classification groups in wheelchair basketball
110
Figure 7.2. Mean (±SD) EE (kcalh-1
) during WBP and APT between LOW and
HIGH classification groups; WBP, p = 0.09, ES = 0.47, 95% CI -295 to 25; APT,
p = 0.11, ES = 0.44, 95% CI -308 to 36.
Figure 7.3.Mean (±SD) HR (b∙min-1
) during WBP and APT between LOW and
HIGH classification groups. *denotes a significant difference between LOW
and HIGH groups in APT, p = 0.05. # denotes a trend towards significance in
WBP, p = 0.07, ES = 0.50, 95% CI -16.3 to 0.61.
500
600
700
800
900
1000
1100
WBP APT
En
erg
y e
xp
en
dit
ure
(kca
l∙h
-1)
Game play
LOW
HIGH
*
150
155
160
165
170
175
180
WBP APT
Aver
age
HR
(b
∙min
-1)
Game play
LOW
HIGH
* #
* #

Chapter 7 Energy expenditure between classification groups in wheelchair basketball
111
7.5 Discussion
7.5.1 Main findings
This study investigated the physiological characteristics of wheelchair basketball
players according to the IWBF classification (LOW, 1.0 – 2.5; HIGH, 3.0 – 4.5) and
estimated the EE during competitive wheelchair basketball game play. There was a
tendency (p = 0.09) for the EE to be lower during WBP for LOW point players when
compared to HIGH point players. In line with the lower HRpeak responses of the LOW
group in the laboratory setting, match play HR was lower in LOW compared with HIGH
for APT and WBP. There were group differences in [BLa], HR and 2 at both the LT and
the 2 mmol∙L-1
[BLa] reference point, suggesting that those players with greater functional
capacity have the potential to work at higher exercise intensities before the onset of blood
lactate accumulation.
7.5.2 Playing standards and functional capacity
Physiological responses in wheelchair basketball need to be considered in relation
to sex and body mass alongside anaerobic and aerobic fitness (McArdle et al., 2001;
Vanlandewijck et al., 2004; de Lira et al., 2010). Another important variable that
influences physiological parameters during wheelchair basketball is training. A novel
feature of the present study is both classification groups’ high training status, evidenced by
their average weekly training times (Table 7.1). Since weekly training times alongside the
other characteristics were closely matched in LOW and HIGH, a primary distinguishing
factor in relation to EE and physiological responses to competition was the groups’
functional ability.
The mean 2peak of 3.25 Lmin-1
is higher than reported in previous literature
studying national squads of wheelchair basketball players (Veeger et al., 1991;
Vanlandewijck et al., 1995; Goosey-Tolfrey, 2005; Pérez et al., 2007; de Lira et al., 2010;
Bernardi et al., 2010), which may suggest a superior endurance regimen in the current
participants’ training. The 2peak test elicited significantly lower mean HRpeak values for
the LOW group, yet exceeded the HR criterion for maximal capacity testing, and all
participants also met the criterion for peak RER (Diaper and Goosey-Tolfrey, 2009). For
comparative purposes, 2peak was also expressed using a body mass exponent of 0.82
(mLkg-0.82
min-1
) according to Goosey-Tolfrey et al. (2003). This has been deemed a
Chapter 7 Energy expenditure between classification groups in wheelchair basketball
112
suitable method of comparing 2peak of different sized athletes and adds to the literature
of other trained wheelchair athletes.
Previously, a higher functional capacity has been associated with greater aerobic
fitness (Vanlandewijck et al., 1994b; 1995; van der Woude et al., 2002; Goosey-Tolfrey et
al., 2003; de Lira et al., 2010). However, Vanlandewijck et al. (1994b; 1995) only found
differences in aerobic capacity between the lowest class (1.0) vs. all other classes,
suggesting this variable may not be directly related to functional capacity in the higher
classifications. A possible reason why LOW and HIGH had similar aerobic capacities may
be inclusion of six classification classes into only two separate groups. However,
consideration must also be made of the fact that the LOW point players had four years
more wheelchair sport experience, together with the fact that seven of the LOW players
were using a daily wheelchair when compared to only three individuals in the HIGH
group.
7.5.3 Physiological responses in the laboratory
Notably, it has been suggested that [BLa], HR and 2 values at sub-maximal
thresholds are more sensitive physiological markers than aerobic capacity in wheelchair
basketball players because of the intermittent, highly anaerobic nature of the sport
(Bernardi et al., 2010; Bhambhani, 2011), confirming the importance of these
measurements. Ivy et al. (1981) showed no difference between the LT and the first initial
increase in ventilation, suggesting the two physiological markers can be used as a measure
of the same exercise intensity. However, caution must be used when comparing the results
of different studies as there are many ways of interpreting LT (Bourdon et al., 2000).
Previous studies in the area of wheelchair sport have used the ventilatory threshold (VT) as
a measure of physiological capacity in wheelchair basketball players (Bloxham et al.,
2001; De Lira et al., 2010; Bernardi et al., 2010). This physiological ‘marker’ occurs at a
workload where a greater increase in CO2 production with respect to O2 consumption is
shown (Bernardi et al., 2010). The VT has been shown to occur when a rapid rise in blood
lactate is seen, which can be observed at higher intensities than the LT (Bourdon et al.
2000). That said, 2 at LT for both groups in the present study was higher than at VT in a
mixed classification group of 17 Brazilian wheelchair basketball players (De Lira et al.,
2010). Furthermore, the HIGH group demonstrated similar 2 at LT to that of a Canadian

Chapter 7 Energy expenditure between classification groups in wheelchair basketball
113
wheelchair basketball team at VT (Bloxham et al., 2001). This suggests a greater level of
physiological capacity in the players in the current study.
At both LT an the 2 mmol∙L-1
[BLa] reference point, the L W group’s propulsi e
speed was 0.5 m·s-1 slower, suggesting the HIGH group has the potential to work at higher
exercise intensities before the onset of fatigue. Moreover, players in the LOW group
displayed lower 2 at both the LT an 2 mmol∙L-1
[BLa] reference point than players in
the HIGH group, although this was not significant at LT when 2 was expressed as a
percentage of 2peak, also confirming the lower absolute intensity of the LOW group at
the onset of [BLa] accumulation. These results are in agreement with de Lira et al. (2010),
who reported a significant positive correlation between absolute 2 values at VT and
functional capacity.
The pushing economy data highlights an interesting phenomenon. The HIGH group
were working at higher exercise intensities at LT and 2mmol∙L-1
[BLa]. Consequently, this
could suggest the HIGH group may have a greater pushing economy when working at the
same exercise intensity as the LOW group. However, this was not found as results
demonstrate a similar pushing economy between groups at the two fixe spee s (2.6 m∙s-1
an 3.6 m∙s-1
). Pushing economy is one characteristic of manual wheelchair propulsion
experience (Chapter 6), of which the LOW group have a greater number of years. This
suggests that, although the HIGH group can work at higher intensities before the onset of
[BLa] accumulation the L W group’s experience may counteract the HIGH group’s
efficiency at sub-maximal levels of wheelchair propulsion.
Heart rate was significantly lower at LT and the 2 mmol∙L-1
[BLa] reference point
in the LOW group. The LOW and HIGH groups worked at a similar % HRpeak at 2
mmol∙L-1
[BLa], suggesting that although absolute differences in HR occur during sub-
maximal exercise, in relative terms the groups are displaying similar responses to exercise.
On the other hand, at LT, % HRpeak was actually higher in HIGH. Nevertheless, the day-to-
day variability found in HR for intra- and inter-individual measurement has to be
considered and cannot be ruled out as a confounding factor (Achten and Jeukendrup, 2003;
Bagger et al., 2003). As the difference in % HRpeak in the two groups was only 4% at LT
and 3% at 2 mmol∙L [BLa], it raises the question of whether these are meaningful
differences or, more probably, that the two groups are working at a similar relative
intensity when expressed as a function of HR. It can be suggested that the small
percentages seen here are not big enough to be of practical significance and, therefore, the
Chapter 7 Energy expenditure between classification groups in wheelchair basketball
114
% HR in both the LOW and HIGH are considered similar. From the majority of the data
provided from the laboratory measures, it can be suggested that the HIGH group is able to
work at a higher exercise intensity before the onset of [BLa] accumulation; thus, attention
should be given to individualised or classification-specific training to optimise an
in i i ual’s physiological capacities, especially when monitoring HR during training.
7.5.4 Energy expenditure during competition
In the current study the participants expended more energy (range 687 to 845
kcalh-1
) than reported previously during simulated wheelchair basketball play (Burke et
al., 1985; Usita et al., 2003; Abel et al., 2008; Price, 2010), perhaps due to the greater
demands of the high standard of play evaluated from national and international competitive
match play. Estimated EE during non-elite wheelchair basketball training was only 246
kcal∙h-1
(Usita et al., 2003) compared with 375 kcal∙h-1
in elite wheelchair basketball
training (Abel et al., 2008). During simulated match play, four regional level wheelchair
basketball players demonstrated an average EE of 516 kcal∙h-1
(Burke et al., 1985).
Bernardi et al. (1988; 2010) reported the 2 values of Paralympic wheelchair basketball
players during competition and in simulated match play respectively. Using an
approximated reference value of 5 kcalL-1
O2 (Péronnet and Massicotte, 1991) to convert
the reported 2 into EE, this equates to 404 kcalh-1
and 584 kcalh-1
respectively. There
is clearly a difference in EE during actual and simulated basketball competition, and the
current stu y’s results highlight the importance of verifying actual exercise in specific
cohorts for accurate metabolic assessment.
From a classification and metabolic cost perspective, disability class did not
significantly influence estimated hourly EE during competitive wheelchair basketball game
play. However, medium effect sizes of 0.46 (WBP) and 0.44 (APT) may suggest a
meaningful difference in EE between the two groups. In WBP, the 95% CI of -298 to 25
suggests a tendency of LOW expending less energy during a game amounting to almost
300 kcal∙h-1
. In APT, the same pattern emerges with a 95% CI of -312 to 36 suggesting that
LOW could expend over 300 kcal less than HIGH per hour during a competitive match.
This is a large metabolic difference if considering nutrition, as this equals the equivalent of
over 2 standard bottles of Lucozade sport drink.

Chapter 7 Energy expenditure between classification groups in wheelchair basketball
115
This kcal difference however, no longer exists when duration of a match is
considered. There is no difference in the EE between LOW and HIGH in both WBP and
APT due to the longer time the LOW group spend on court in a typical game. So, for each
classification group, a comparable amount of energy is expended, suggesting both groups
may need a similar amount of calories when considering competition. Practitioners must
account for both the similarities shown during actual competition and for the slightly
higher EE per hour in the HIGH group, and factor this in to training days and camps where
in fact, the HIGH group may expend more energy if training hours are equal in length.
7.5.5 Heart rate during match play
The LOW group demonstrated lower average HR’s during wheelchair basketball
match play compared to the HIGH group. This finding is in agreement with Pérez et al.
(2007), who reported a lower average HR in wheelchair basketball players with no hip
control (passive pelvic stabilisation - classification 1 – 2, IWBF, 2009). However, in
relative terms, both LOW and HIGH groups in the current study had the same average
match HR in both WBP and APT when expressed as a percentage of HRpeak. So, regardless
of actual HR or the amount of absolute EE during a game, both groups were working at a
similar relative HR intensity. This data could be useful for training practices in this cohort.
Training recommendations for the able-bodied population are not directly
transferable to wheelchair athletes due to the underestimation of relative exercise intensity
(Tolfrey et al., 2001; Goosey-Tolfrey and Tolfrey 2004). For the same reason, it is worth
appreciating that, within the sport of wheelchair basketball, players vary considerably due
to their functional capacity, hence the existence of the IWBF classification system. Access
to larger pools of athletes through international collaboration which enables the complete
IWBF classification spectrum (1.0 – 4.5), and hence to more robust sample sizes, could
lead to a greater in-depth understanding of the energy requirements and key physiological
responses in each specific class.
7.5.6 Limitations
It is worth highlighting that, although no significant difference was found, body
mass was slightly higher and sum of skinfolds was slightly lower in HIGH compared to
LOW. This may suggest a greater FFM in the HIGH group potentially contributing to the
higher EE in this group. Due to methodological constraints neither the REE nor FFM of the
Chapter 7 Energy expenditure between classification groups in wheelchair basketball
116
athletes were measured in this study, and so this potential contribution to the overall EE
cannot be confirmed.
As the EE is estimated through HR measurement, an appreciation of variability in
HR during competition needs to be mentioned. However, it has been shown previously that
there is a strong relationship bet een 2 and HR during non-steady-state exercise in
wheelchair propulsion (Bot and Hollander, 2000), so this analysis was deemed appropriate
to estimate EE during competition.
Although the importance of estimating the EE of elite sports competition is
apparent, the results of this study should be interpreted with caution when applying the
findings to wheelchair basketball players who are sub-elite. The data collected from
international elite wheelchair basketball competition may not be an accurate measure of
recreational game play.
7.6 Conclusions
There was a tendency for mean EE to be higher in the HIGH group compared to the
LOW group, which was reflected by their higher HRs during APT and WBP. The absolute
HR, 2 and treadmill speed were higher at LT and 2 mmol∙L-1
[BLa] in the HIGH group.
With this in mind, wheelchair basketball players with a higher classification have greater
potential to work at higher absolute exercise intensities before the onset of [BLa]
accumulation. This study supports the IWBF classification system (2009) and provides
data on the metabolic cost of national and international wheelchair basketball competition
for athletes and practitioners.
Chapter 8 Energy expenditure of wheelchair basketball and wheelchair tennis
117
Chapter 8
A comparison of the physiological demands and energy expenditure of wheelchair
basketball and wheelchair tennis
8.1 Abstract
Purpose: To examine the physiological profiles of wheelchair basketball and tennis and
specifically to identify if there are differences in the physiological demands and
physiological fitness of wheelchair basketball and tennis players of international playing
standard, with special reference to EE. Methods: Twelve elite athletes (8 male, 4
female) from the two sports performed a sub-maximal and a OV 2peak test in their sport-
specific wheelchair. Heart rate, 2 and [BLa] were measured. Heart rate was
monitored during international competitions, and EE was calculated from this using
linear regression equations. Results: Despite no differences in the laboratory
assessment of HRpeak, the 2peak showed a trend towards being higher for the
basketball players when compared to the tennis players (2.98 ± 0.91 vs. 2.06 ± 0.71
L·min-1
; p = 0.08). Average match EE (703 ± 215 vs. 439 ± 171 kcal∙h-1
; p = 0.04) and
average match HR (166 ± 11 vs. 146 ± 16 b∙min-1
; p = 0.03) were higher during actual
playing time of basketball (A-BPT) when compared to whole tennis play (WTP)
respectively. When a whole basketball game (WBP; including time-outs) was compared
to WTP, average match EE tended to be higher for the WBP (672 ± 207 vs. 439 ± 171
kcal∙h-1
; p = 0.06). There was a trend for average match HR in WBP to be higher than in
WTP (162 ± 11 vs. 146 ± 16 b∙min-1
) (p = 0.07). Consequently, differences in the time
spent in the different training zones between the two sports existed. Conclusions: EE is
higher per hour during A-BPT and WBP when compared to WTP. It is therefore
suggested that wheelchair basketball requires predominately high-intensity training,
whereas tennis requires training across the intensity spectrum.

Chapter 8 Energy expenditure of wheelchair basketball and wheelchair tennis
118
8.2 Introduction
Wheelchair basketball and wheelchair tennis are two of the most popular and
renowned sports within the Paralympics, with International competitions being held
worldwide. Coaches and sport scientists with an interest in these sports are continually
seeking to improve and optimise sport-specific training (Roy et al., 2006; Pérez et al.,
2007; Bernardi et al., 2010). However, as with able-bodied sports, to ensure that
training reflects the demands of the sport, an understanding of the physiological
competitive demands is required (Bernardi et al., 1988; Achten and Jeukendrup, 2003;
Pérez et al., 2007). It is evident that wheelchair basketball competition involves periods
of high-intensity, intermittent activity with large physiological demand put on players
(Coutts, 1988; Bloxham et al., 2001; Pérez et al., 2007). Likewise, wheelchair tennis is
intermittent in nature and, during a game, a significant amount of stress is put on the
aerobic system (Roy et al, 2006).
Measurement of EE during wheelchair sports competition can inform training
practices, but so far there is a lack of data to provide this (Price, 2010). From the
literature available, it appears that the reported EE values for wheelchair basketball
training are between 246 - 516 kcal∙h-1
(Burke et al., 1985; Usita et al., 2003; Abel et
al., 2008). Using an approximated reference value of 5 kcalL-1
O2 (Péronnet and
a c 1 1 c 2 into EE, EE was measured in simulated competition
(584 kcal∙h-1
) (Bernardi et al., 2010) and actual competition (404 kcal∙h-1
) (Bernardi et
al., 1988). These values seem to be generally higher than the values reported for
simulated wheelchair tennis competition (312 - 497 kcal∙h-1
) (Roy et al., 2006; Bernardi
et al., 2010) or training (325 kcal∙h-1
) (Abel et al., 2008). To fully understand these
values, comparisons must control for trained status of individuals, physical impairment
with respect to disability type, and functional classification.
Work is available that extrapolates HR and 2 from laboratory assessments to
estimate EE during field evaluation of athletes with a disability (Roy et al., 2006).
However, the use of arm-crank ergometry, which involves increases in intensity every
minute (Roy et al., 2006), is unlikely to demonstrate a physiological steady state in
these short exercise stages. Moreover, arm-crank exercise would most likely not reflect
the physiological responses seen during wheelchair exercise (Sawka et al., 1980). Of the
other estimated EE data that is available in the field, most have focused on training

Chapter 8 Energy expenditure of wheelchair basketball and wheelchair tennis
119
scenarios (Burke et al., 1985; Abel et al., 2008; Bernardi et al., 2010) and not official
competition.
Most of the research to date has involved male wheelchair athletes, with only a
few recent studies examining the physiological aspects and demands of female athletes
participating in wheelchair exercise (Schmid et al., 1998b; Barfield et al., 2009; Diaper
and Goosey-Tolfrey, 2009). Including female athletes in elite competition adds to this
literature. To extend the work previously reported in this area, it is necessary to examine
the [BLa] profile so that specific HR training zones can be developed to provide athletes
with targeted and optimised training (Godfrey and Whyte, 2006). This is of interest
when comparing wheelchair sports with the objective of providing specific sports
training information, since the distances covered, rest to work ratios and length of
matches vary considerably. For example, wheelchair basketball matches involve 10-
minute quarters with time-outs and game stoppage throughout, whereas tennis matches
last from under 1 h to over 3 h (Pérez et al., 2007; Diaper and Goosey-Tolfrey, 2009).
Therefore the purpose of this study was to examine (a) if there are differences in the
physiological profiles of wheelchair basketball players and tennis players of a similar
playing standard, (b) to determine whether the competitive physiological demands and
EE of these two sports differed, and (c) to explore the relationship between the [BLa]
response to exercise and identify sport-specific trends of HR training zones that may
help develop coaches’ knowledge of training for these sports.
8.3 Methods
8.3.1 Participants
Six wheelchair basketball players (4 male, 2 female) were matched with 6
wheelchair tennis players (4 male, 2 female) from previously obtained data, all of whom
were presently competing internationally and therefore considered elite. After
consultation with medical records, all participants were matched on playing ability,
trunk mobility and classification according to the International Wheelchair Basketball
Federation (IWBF, 2004). Approval was gained from the University Ethical Advisory
Committee and written consent was obtained by all participants and their guardians (for
those under 18 yrs old) before testing. Body mass was recorded to the nearest 0.1 kg
using either a seated balance scale (Seca 710, seated scales, Hamburg, Germany) or a

Chapter 8 Energy expenditure of wheelchair basketball and wheelchair tennis
120
wheelchair double beam scale (300 series, Marsden, London, UK). Participant
characteristics are given in Table 8.1.
8.3.2 Experimental design
There were two distinct phases to this study, (a) a laboratory assessment within a
two week period either side of the selected sports competition and (b) data collection
during international wheelchair basketball and tennis competitions. All participants
were tested in their own sports-specific wheelchair. For the laboratory measurements,
the tennis players were tested 1 using a wheelchair ergometer as previously described
(Goosey-Tolfrey, 2005), whilst the basketball players were tested using a specialised
motorised treadmill (HP Cosmos Saturn, Nussdorf-Traunstein,XGermany).
8.3.3 Laboratory assessment
Each participant completed an incremental sub-maximal exercise test
comprising of five or six 4-minute stages. The initial speed was pre-determined
following a self-selected warm-up period of five minutes where HR was approximately
100 b·min-1
. Subsequently each exercise stage was increased by 0.2 to 0.4 m·s-1
,
ensuring that a profile was obtained that included intensities ranging from 40-80%
2peak. For the treadmill testing the incline was kept constant at 1% gradient
throughout this test. During the last minute of each stage, expired gas was collected and
analysed using the Douglas bag technique, described in Chapter 5, section 5.3.3.
1 Data collected from the 6 tennis players in the laboratory and during tennis
competition was completed by Mr John Lenton prior to the start of this PhD.

Chapter 8 Energy expenditure of wheelchair basketball and wheelchair tennis
121
Tab
le 8
.1:
Par
tici
pan
t ch
arac
teri
stic
s of
whee
lchai
r bas
ket
bal
l an
d w
hee
lch
air
tennis
pla
yer
s. G
rou
p v
alu
es a
re m
ean
s (±
SD
).
Par
tici
pan
t S
po
rt
Sex
A
ge
(yrs
)
Bo
dy m
ass
(kg)
Dis
abil
ity
S
CI
com
ple
teness
IWB
F S
po
rts
Cla
ssif
icat
ion
(IW
BF
, 2
009
)
Yea
rs p
layin
g
spo
rt
Tra
inin
g
(h·w
k-1
)
1
Bas
ket
bal
l M
ale
26
77
.6
SC
I T
12
Inco
mp
lete
3
.0
5
21
2
Bas
ket
bal
l M
ale
27
70
.7
Sp
ina
bif
ida
- 3
.0
14
18
3
Bas
ket
bal
l M
ale
27
93
.8
Avas
cula
r nec
rosi
s -
4.5
1
2
15
4
Bas
ket
bal
l M
ale
34
94
.2
SC
I T
12
Co
mp
lete
2
.0
16
15
5
Bas
ket
bal
l F
em
ale
29
58
.3
SC
I T
9
Co
mp
lete
1
.5
10
16
6
Bas
ket
bal
l F
em
ale
17
50
.0
Acute
mo
tor
neuro
pat
hy
-
2.5
5
1
0
Mea
n
SD
2
6.7
(5.5
)
74
.1
(18
.1)
2.8
(1.0
)
10
.3
(4.6
)
15
.8
(3.7
)
1
Ten
nis
M
ale
30
99
.0
SC
I T
12
Inco
mp
lete
2
.5
6
15
2
Ten
nis
M
ale
18
64
.1
Bri
ttle
bo
nes
-
4.0
1
2
25
3
Ten
nis
M
ale
15
67
.8
Tra
nsv
erse
Myel
itis
T1
2
Inco
mp
lete
3
.0
2
7
4
Ten
nis
M
ale
34
64
.7
SC
I T
8/9
/10
Co
mp
lete
1
.5
8
21
5
Ten
nis
F
em
ale
26
51
.9
SC
I T
4/5
C
om
ple
te
1.0
4
1
5
6
Ten
nis
F
em
ale
15
47
.5
Bri
ttle
bo
nes
4.0
1
2
5
Mea
n
SD
23
.0
(8.2
)
65
.8
(18
.1)
2.7
(1.3
)
7.3
(4.1
)
14
.7
(7.7
)
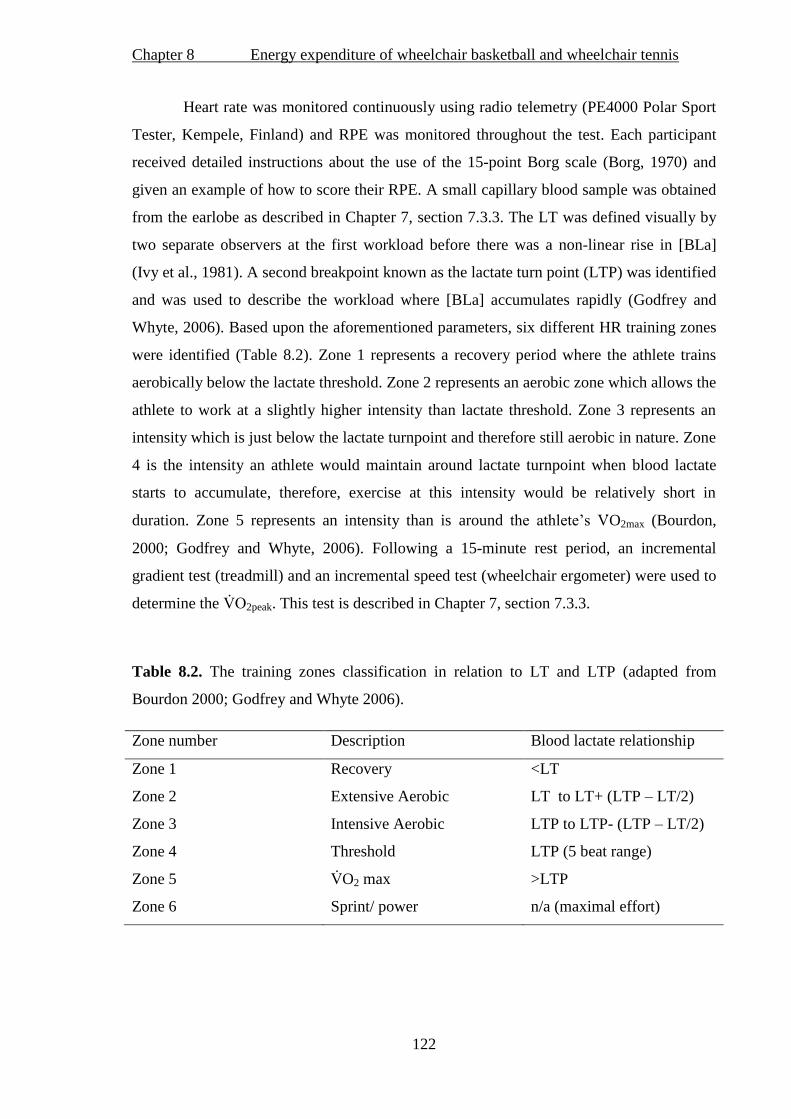
Chapter 8 Energy expenditure of wheelchair basketball and wheelchair tennis
122
Heart rate was monitored continuously using radio telemetry (PE4000 Polar Sport
Tester, Kempele, Finland) and RPE was monitored throughout the test. Each participant
received detailed instructions about the use of the 15-point Borg scale (Borg, 1970) and
given an example of how to score their RPE. A small capillary blood sample was obtained
from the earlobe as described in Chapter 7, section 7.3.3. The LT was defined visually by
two separate observers at the first workload before there was a non-linear rise in [BLa]
(Ivy et al., 1981). A second breakpoint known as the lactate turn point (LTP) was identified
and was used to describe the workload where [BLa] accumulates rapidly (Godfrey and
Whyte, 2006). Based upon the aforementioned parameters, six different HR training zones
were identified (Table 8.2). Zone 1 represents a recovery period where the athlete trains
aerobically below the lactate threshold. Zone 2 represents an aerobic zone which allows the
athlete to work at a slightly higher intensity than lactate threshold. Zone 3 represents an
intensity which is just below the lactate turnpoint and therefore still aerobic in nature. Zone
4 is the intensity an athlete would maintain around lactate turnpoint when blood lactate
starts to accumulate, therefore, exercise at this intensity would be relatively short in
duration. Zone 5 represents an intensity than is around h a hl ’ O2max (Bourdon,
2000; Godfrey and Whyte, 2006). Following a 15-minute rest period, an incremental
gradient test (treadmill) and an incremental speed test (wheelchair ergometer) were used to
determine the 2peak. This test is described in Chapter 7, section 7.3.3.
Table 8.2. The training zones classification in relation to LT and LTP (adapted from
Bourdon 2000; Godfrey and Whyte 2006).
Zone number Description Blood lactate relationship
Zone 1 Recovery <LT
Zone 2 Extensive Aerobic LT to LT+ (LTP – LT/2)
Zone 3 Intensive Aerobic LTP to LTP- (LTP – LT/2)
Zone 4 Threshold LTP (5 beat range)
Zone 5 O2 max >LTP
Zone 6 Sprint/ power n/a (maximal effort)
Chapter 8 Energy expenditure of wheelchair basketball and wheelchair tennis
123
8.3.4 Competition data
Heart rate monitors (Polar team system, Kempele, Finland) were placed on the
players at least 20 minutes prior to the start of competitive play. The players wore the HR
monitors throughout the matches, with data being recorded at 5-s intervals. Basketball HR
data were collected during the Paralympic World Cup 2009/2010 in England. The match
start time, and, during the basketball games, the substitutions and time-outs, were all
manually recorded, thus allowing calculation of whole basketball play (WBP) and
basketball actual playing time (B-APT) excluding rests. Tennis HR data were collected
from singles matches during international wheelchair tennis tournaments in Florida and
England in 2009. For each match, the start and end time were recorded, and the HR data
collection period included all the activities during this time, representing whole tennis play
(WTP). The average HR and HRpeak during the matches were calculated for each player
from both sports. Where possible, more than one match was analysed per player to try and
obtain a typical match play response.
8.3.5 Calculation of EE
Energy expenditure was calculated for each sub-maximal stage (Frayn, 1983) by
ma g ca b hyd a a d fa x da g∙m -1
as described in Chapter 3, section
3.3.4.
8.3.6 Statistical analyses
Data were reported as mean (±SD) and standard descriptive statistics were obtained for
all variables using SPSS (version 18.0, Chicago, Illinois, USA). Independent t-tests or the
non-parametric equivalent (Mann-Whitney U) were conducted to determine any
differences between groups for mean and total EE, mean and HRpeak, and duration of
games. The 2 and HR data at each sub-maximal stage were expressed as percentages of
their respective peak values. For each participant a linear regression was conducted using
the paired data points of sub-maximal 2 and [BLa] values, a d h P a ’ c la
for this relationship was calculated to determine the [BLa] at fixed exercise intensities of 40,
50, 60, 70 and 80% 2peak. The data for the whole group were not pooled together for a
single linear regression equation as this would statistically obscure the individual
relationships.
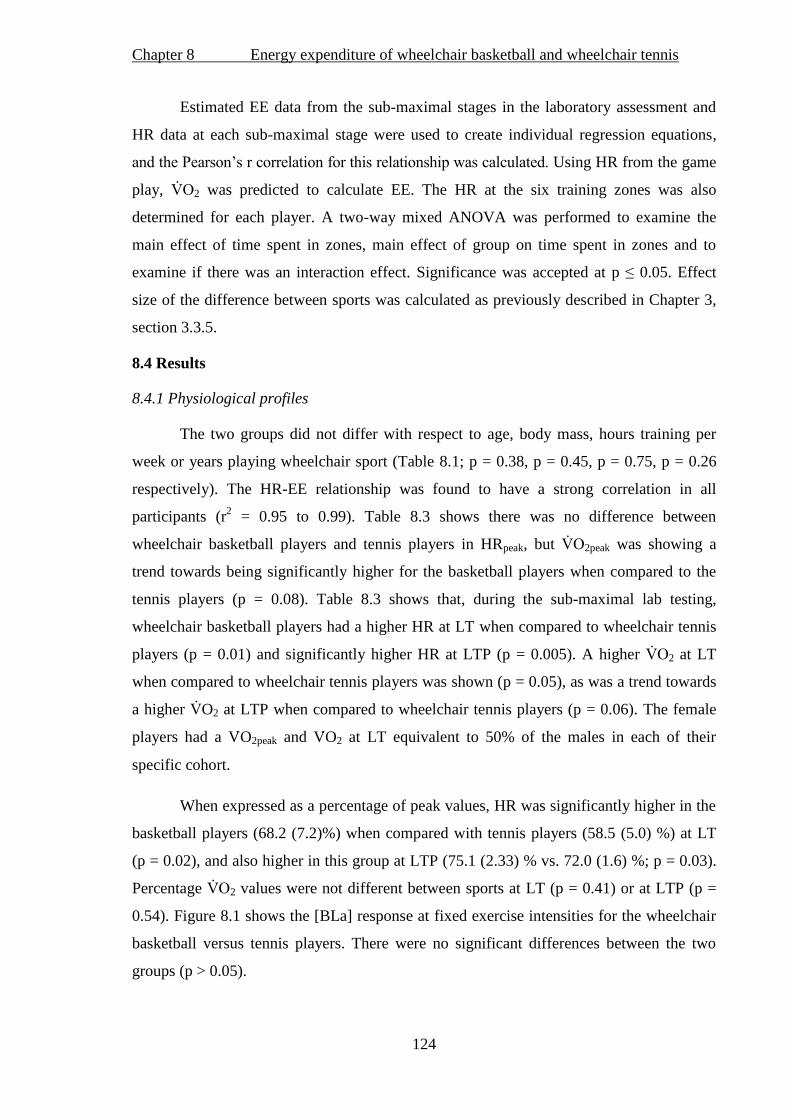
Chapter 8 Energy expenditure of wheelchair basketball and wheelchair tennis
124
Estimated EE data from the sub-maximal stages in the laboratory assessment and
HR data at each sub-maximal stage were used to create individual regression equations,
a d h P a ’ c la f h la h p wa calcula d. Using HR from the game
play, 2 was predicted to calculate EE. The HR at the six training zones was also
determined for each player. A two-way mixed ANOVA was performed to examine the
main effect of time spent in zones, main effect of group on time spent in zones and to
examine if there was an interaction effect. Significance was accepted at p ≤ 0.05. Effect
size of the difference between sports was calculated as previously described in Chapter 3,
section 3.3.5.
8.4 Results
8.4.1 Physiological profiles
The two groups did not differ with respect to age, body mass, hours training per
week or years playing wheelchair sport (Table 8.1; p = 0.38, p = 0.45, p = 0.75, p = 0.26
respectively). The HR-EE relationship was found to have a strong correlation in all
participants (r2 = 0.95 to 0.99). Table 8.3 shows there was no difference between
wheelchair basketball players and tennis players in HRpeak, but 2peak was showing a
trend towards being significantly higher for the basketball players when compared to the
tennis players (p = 0.08). Table 8.3 shows that, during the sub-maximal lab testing,
wheelchair basketball players had a higher HR at LT when compared to wheelchair tennis
players (p = 0.01) and significantly higher HR at LTP (p = 0.005). A higher 2 at LT
when compared to wheelchair tennis players was shown (p = 0.05), as was a trend towards
a higher O2 at LTP when compared to wheelchair tennis players (p = 0.06). The female
players had a V O2peak and V O2 at LT equivalent to 50% of the males in each of their
specific cohort.
When expressed as a percentage of peak values, HR was significantly higher in the
basketball players (68.2 (7.2)%) when compared with tennis players (58.5 (5.0) %) at LT
(p = 0.02), and also higher in this group at LTP (75.1 (2.33) % vs. 72.0 (1.6) %; p = 0.03).
Percentage 2 values were not different between sports at LT (p = 0.41) or at LTP (p =
0.54). Figure 8.1 shows the [BLa] response at fixed exercise intensities for the wheelchair
basketball versus tennis players. There were no significant differences between the two
groups (p > 0.05).
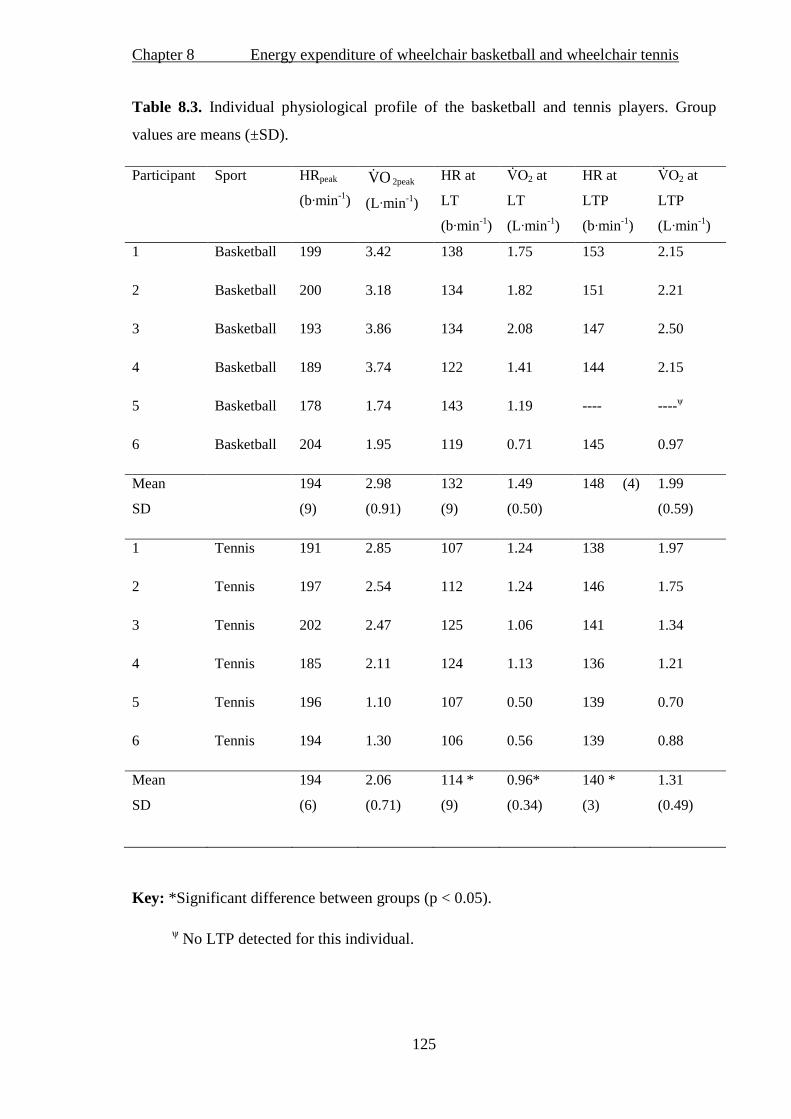
Chapter 8 Energy expenditure of wheelchair basketball and wheelchair tennis
125
Table 8.3. Individual physiological profile of the basketball and tennis players. Group
values are means (±SD).
Participant Sport HRpeak
(b∙min-1
)
VO 2peak
(L∙min-1
)
HR at
LT
(b∙min-1
)
2 at
LT
(L∙min-1
)
HR at
LTP
(b∙min-1
)
2 at
LTP
(L∙min-1
)
1 Basketball 199 3.42 138 1.75 153 2.15
2 Basketball 200 3.18 134 1.82 151 2.21
3 Basketball 193 3.86 134 2.08 147 2.50
4 Basketball 189 3.74 122 1.41 144 2.15
5 Basketball 178 1.74 143 1.19 ---- ----ψ
6 Basketball 204 1.95 119 0.71 145 0.97
Mean
SD
194
(9)
2.98
(0.91)
132
(9)
1.49
(0.50)
148 (4) 1.99
(0.59)
1 Tennis 191 2.85 107 1.24 138 1.97
2 Tennis 197 2.54 112 1.24 146 1.75
3 Tennis 202 2.47 125 1.06 141 1.34
4 Tennis 185 2.11 124 1.13 136 1.21
5 Tennis 196 1.10 107 0.50 139 0.70
6 Tennis 194 1.30 106 0.56 139 0.88
Mean
SD
194
(6)
2.06
(0.71)
114 *
(9)
0.96*
(0.34)
140 *
(3)
1.31
(0.49)
Key: *Significant difference between groups (p < 0.05).
ψ No LTP detected for this individual.

Chapter 8 Energy expenditure of wheelchair basketball and wheelchair tennis
126
Figure 8.1. Mean (±SD) [BLa] concentration of wheelchair basketball and wheelchair
tennis players at fixed exercise intensities.
8.4.2 Energy expenditure and match duration
Mean EE in B-APT (703 (215) kcal·hr-1
) was significantly higher when compared
to WTP (439 ± 171 kcal·hr-1
; p = 0.04), and there was a trend towards EE in WBP (672
(207) kcal·hr-1
) being higher than the average EE during WTP (p = 0.06) (Figure 8.2a).
This trend actually had a large ES of 0.56, showing a meaningful difference between the
average EE in wheelchair tennis and wheelchair basketball when all rests, time-outs and
half-time were included. Figure 8.2b shows the duration of WTP was significantly longer
than that of A-BPT (68.5 (14.2) to 39.0 (15.1) minutes respectively, p = 0.006). Therefore,
when this is taken into consideration, wheelchair tennis players actually expended a similar
amount of energy in WTP (522 (283) kcal) when compared to wheelchair basketball
players in A-BPT (460 (254) kcal) during a typical game for each sport (p = 0.70). When
WBP and WTP were compared, the duration of a wheelchair tennis match was
significantly longer (68.5 (14.2) minutes) than a wheelchair basketball match (46.5 (18.2)
minutes; p = 0.04). As tennis players were playing for longer than the wheelchair
basketball players, figure 8.2c shows a similar amount of energy was expended during both
WTP (522 (283) kcal) and WBP (527 (288) kcal), p = 0.98.
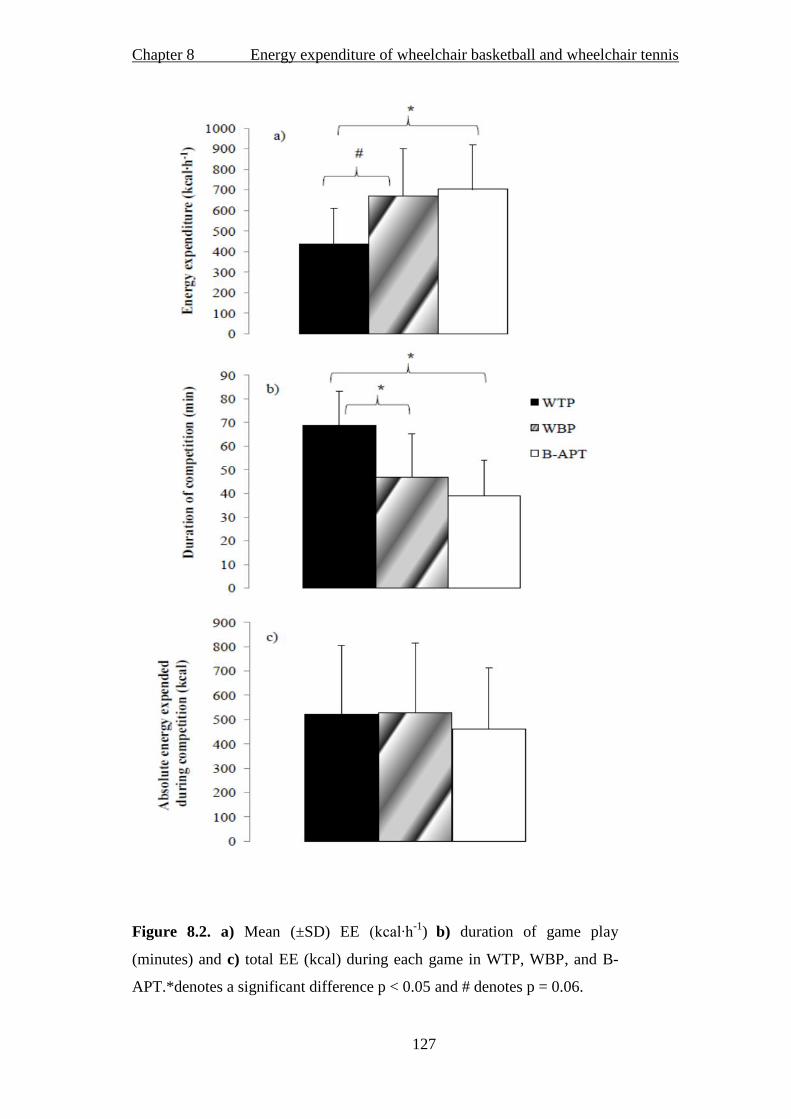
Chapter 8 Energy expenditure of wheelchair basketball and wheelchair tennis
127
Figure 8.2. a) Mean (±SD) EE (kcal∙h-1
)
b) duration of game play
(minutes) and c) total EE (kcal) during each game in WTP, WBP, and B-
APT.*denotes a significant difference p < 0.05 and # denotes p = 0.06.

Chapter 8 Energy expenditure of wheelchair basketball and wheelchair tennis
128
8.4.3 Match HR
Figure 8.3 shows the HR response during WBP and indicates the maximum and
average HR, and actual playing time (B-APT) for one participant. Between the two sports,
there was a 9 b·min-1
difference in HRpeak during game play, although these values did not
significantly differ (191 (10) in WBP/B-APT . 182 (15 b∙m -1
in WTP, p = 0.28). As
Figure 8.4a shows, the wheelchair basketball players showed a higher average match HR
during B-APT than the wheelchair tennis players (WTP) (166 (11) vs. 146 (16) b∙min-1
; p
= 0.03). During WBP and WTP, there was a trend towards a difference in average HR
between sports (162 (11) vs. 146 (16) b∙min-1
for wheelchair basketball and tennis
respectively; p = 0.07), with a large ES of 0.64. When average match HR was expressed as
%HRpeak and compared between sports during B-APT and WTP, there was a significant
difference (85.8 (2.3) vs. 75.3 (7.8) % respectively; p = 0.01). There was also a significant
difference between % HRpeak (83.6 (2.5) vs. 75.3 (7.8) % p = 0.02) during WBP and WTP
respectively (Figure 8.4b).
Figure 8.3. An example of a wheelchair ba k ball play ’ HR ac du g a ma ch
showing HRpeak (black horizontal line), average HR (grey line), and time spent on
court (dashed line).

Chapter 8 Energy expenditure of wheelchair basketball and wheelchair tennis
129
8.4.4 Heart rate zones
Figure 8.5 shows the relative percentage the wheelchair basketball and tennis
players spent in each training HR zone. This was measured during WBP, B-APT and
WTP. Analysis for the whole game in both sports (WBP and WTP) as a percentage of the
total game time showed a significant main effect for zone (p < 0.01). Pairwise analysis
revealed that more time was spent in zone 5 (79 and 69 % for wheelchair basketball and
tennis respectively) compared to other zones (< 15% in each other zone). There was no
zone * group interaction, suggesting both wheelchair basketball and tennis HR responded
in a similar pattern. Furthermore, there was no main effect of group suggesting the two
groups spent a similar relative time in each zone.
A comparison between B-APT and WTP as a percentage of a whole game showed
there was a significant main effect of zone (p < 0.01). Pairwise analysis revealed more time
was spent in zone 5 (basketball 88% and tennis 69%) compared to any other zone (<15%
in each other zone). When time spent in minutes was compared between zones, there was a
main effect of group. Observation of the results suggest that wheelchair basketball players
spent less minutes in zone 3 (1.0 vs. 9.1 minutes) and zone 5 (32.3 vs. 52.4 minutes) when
compared with the tennis players respectively. When relative time spent in each zone was
analysed, there was no main effect of group (p = 0.08).
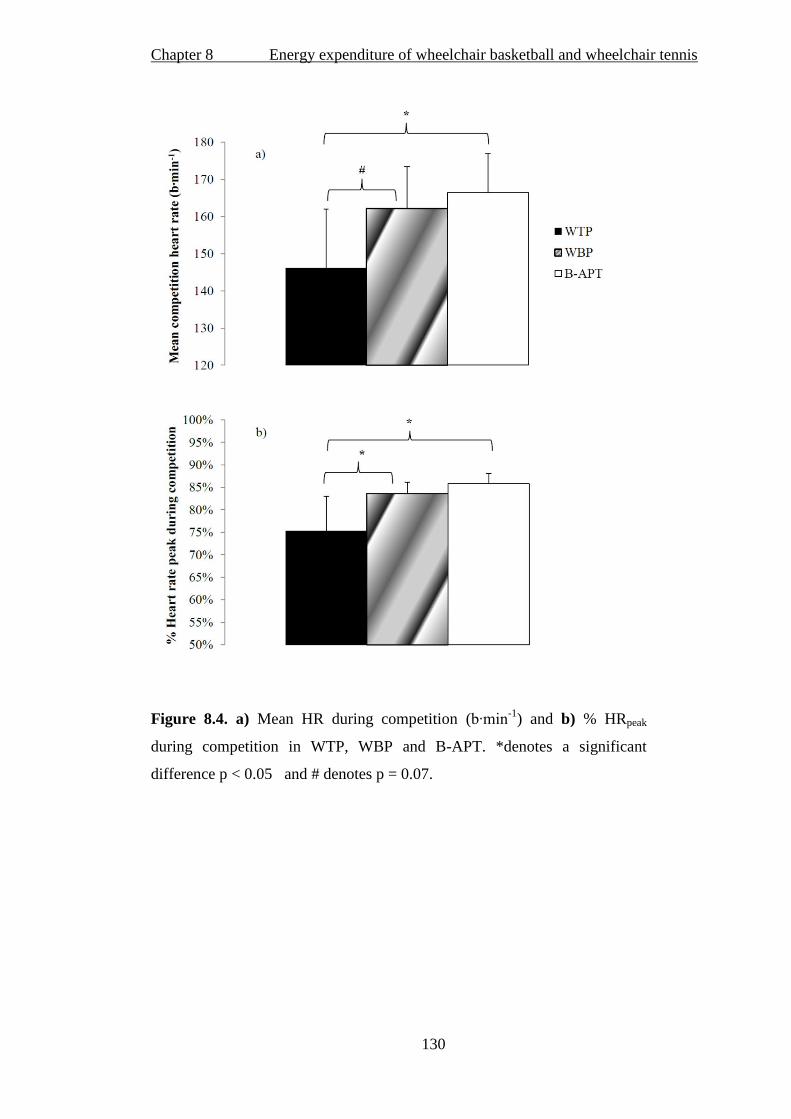
Chapter 8 Energy expenditure of wheelchair basketball and wheelchair tennis
130
Figure 8.4. a) Mean HR during competition (b∙m -1
) and b) % HRpeak
during competition in WTP, WBP and B-APT. *denotes a significant
difference p < 0.05 and # denotes p = 0.07.
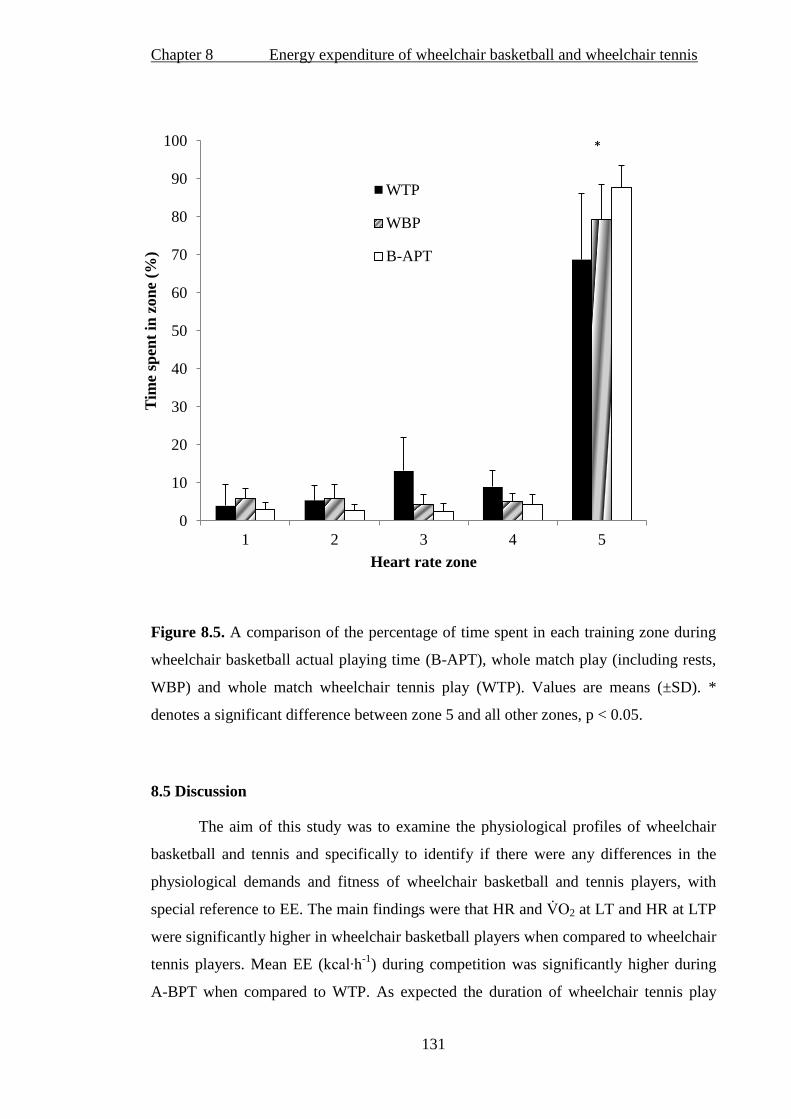
Chapter 8 Energy expenditure of wheelchair basketball and wheelchair tennis
131
Figure 8.5. A comparison of the percentage of time spent in each training zone during
wheelchair basketball actual playing time (B-APT), whole match play (including rests,
WBP) and whole match wheelchair tennis play (WTP). Values are means (±SD). *
denotes a significant difference between zone 5 and all other zones, p < 0.05.
8.5 Discussion
The aim of this study was to examine the physiological profiles of wheelchair
basketball and tennis and specifically to identify if there were any differences in the
physiological demands and fitness of wheelchair basketball and tennis players, with
special reference to EE. The main findings were that HR and 2 at LT and HR at LTP
were significantly higher in wheelchair basketball players when compared to wheelchair
tennis players. Mean EE (kcal∙h-1
) during competition was significantly higher during
A-BPT when compared to WTP. As expected the duration of wheelchair tennis play
0
10
20
30
40
50
60
70
80
90
100
1 2 3 4 5
Tim
e sp
ent
in z
on
e (%
)
Heart rate zone
WTP
WBP
B-APT
*

Chapter 8 Energy expenditure of wheelchair basketball and wheelchair tennis
132
was longer than basketball yet the total EE during competition was similar between both
sports (WTP vs. both WBP and A-BPT).
8.5.1 Physiological profile
There was a tendency for 2peak to be higher in the wheelchair basketball
players when compared to the tennis players. The 2peak of the elite wheelchair
basketball players in the present study was found to be similar to Pérez et al. (2007) or
slightly higher than that reported in the literature for wheelchair basketball players
(Burke et al., 1985; Veeger et al., 1991; Vanlandewijck et al., 1995; Goosey-Tolfrey,
2005; de Lira et al., 2010; Bernardi et al., 2010). Yet similar values were found for the
tennis players when compared to the literature (Roy et al., 2006). As evident in the
literature, female wheelchair athletes demonstrated lower 2peak values than their male
counter-parts (Bhambhani, 2002; Goosey-Tolfrey and Tolfrey, 2004). In agreement
with previous research (Abel et al., 2008), the present study found no difference
between sports in HRpeak. There were differences found between sports in HR and 2
at LT and HR at LTP, with the basketball players recording higher values. The higher
absolute 2 and HR at LT would suggest the wheelchair basketball players are
exercising at a higher intensity before the onset of [BLa] accumulation. The results
show that both groups were x c g a h am 2peak at LT and LTP and
produced a similar amount of [BLa] at the same % 2peak, suggesting that both groups
were working at the same relative intensity during the sub-maximal protocol. Of the
limited data available that focuses on the HR and 2 at LT and LTP, it is interesting to
note that the current study found similar ranges of 2 values at LT as that of Flandrois
et al. (1986). However, when expressed relative to 2peak, the current study identified
that this threshold occurred at 50 and 48% 2peak for wheelchair basketball and tennis
respectively, as compared to 63 and 54% 2peak of high and low lesion level
paraplegics found by Flandrois et al. (1986). The range of disabilities makes it hard to
compare the two studies, and the protocols differed between studies, making results
hard to interpret. In addition, these values may differ slightly depending upon the LT
definition used and the number of stages employed (Weltman, 1995; Bourdon, 2000).

Chapter 8 Energy expenditure of wheelchair basketball and wheelchair tennis
133
8.5.2 Energy expenditure
The mean EE during B-APT was significantly higher than the EE during WTP.
There was also a trend towards a difference in EE between WBP and WTP. The EE of
wheelchair tennis reported in the literature (Roy et al., 2006) is around 29% lower than
that of the wheelchair tennis players in the present study. The wheelchair basketball
players also expended a larger amount of energy, both during B-APT and during WBP,
than the EE values reported during training and competition (375 - 584 kcal∙h-1
) (Burke
et al., 1985; Bernardi et al., 1988; Abel et al., 2008; Bernardi et al., 2010). It is
important to highlight that participants within our study were highly trained and
considered elite. Moreover, the data collected was from international competition,
which would have been more physically demanding when compared to training or
simulated competition. Interestingly however, Burke et al. (1985) reported the range of
EE in four athletes during a typical 30-minute training session. The highest value, which
was obtained by two of the participants, was 612 kcal·h-1
, a value closer to that reported
in the present study.
It is clear from the results that, per hour, wheelchair basketball players expend
more energy than wheelchair tennis players. It is interesting to note that the duration of
WTP (68.9 minutes) is significantly longer than that of B-APT (39.0 minutes). So,
taking this into consideration, wheelchair tennis players expend a similar amount of
energy in WTP (522 kcal), when compared to wheelchair basketball players during A-
BPT (460 kcal), during typical game play for each sport. When WBP and WTP were
compared, the duration of a tennis match again is longer than a wheelchair basketball
game (46.8 minutes), but the total estimated EE is only 5 kcal different. This could
suggest nutritional advice for both sports may need to be similar on competition days.
However, the groups show a comparable amount of training hours per week. Therefore,
depending on the sport specificity of the exercise, wheelchair basketball players may
expend more energy during training due to the higher intensity of their sport.
8.5.3 Match HR
Average HR was higher in B-APT and trended towards being higher in WBP
when compared to WTP, which supports the work of Coutts (1988) and, more recently,
Bernardi et al. (2010). The fact that wheelchair basketball is shown to have a larger
competitive demand is a reflection of the amount of the court covered during
Chapter 8 Energy expenditure of wheelchair basketball and wheelchair tennis
134
competition and the long sprints involved in game play (Coutts, 1992; Bloxham et al.,
2001). Interpretation of this data would suggest that the highly intermittent nature of
wheelchair basketball, with a work-to-rest ratio of 1:1 (Pérez et al., 2007), may be more
physiologically demanding than the intermittent play of wheelchair tennis (with a work-
to-rest ratio estimated in the able-bodied game of 1:3 – 1:5, Kovacs, 2007).
Average HR during B-APT (166 b∙min-1
) was higher than that reported by other
literature for wheelchair basketball players (range 128 to 155 b∙min-1
) (Burke et al.,
1985; Bernardi et al., 1988; Coutts, 1988; Schmid et al., 1998b; Bloxham et al., 2001;
Pérez et al., 2007; Bernardi et al., 2010). Percentage HR in wheelchair basketball
relative to HRpeak was higher in the present study, with an average HR 86% and 75% of
HRpeak (B-APT and WBP respectively) compared to 71% (Bloxham et al., 2001). In
tennis, average HRs of 121 b∙min-1
(Roy et al., 2006; Barfield et al., 2009) to 128 b∙min-
1 (Coutts, 1988) compared to 146 b∙min
-1 in the current study have been reported.
Percentage HR in tennis relative to HRpeak was higher in the present study with HR
averaging 75% of HRpeak compared to 69% and 68% of HRpeak (Roy et al., 2006;
Barfield et al., 2009 respectively). Higher percentage and absolute values of HR in the
current study could be due to the specificity of the current study focusing on elite
athletes in international competition. From the available literature, club to national level
standard players (Bloxham et al., 2001; Roy et al., 2006; Barfield et al., 2009) and
females (Schmid et al., 1998b) have been measured, or literature has focused on training
scenarios (Coutts, 1988; Abel et al., 2008).
It is important to note that in the present study the wheelchair tennis match data
was analysed from the start of play to the end of play, including any breaks and rests
(WTP). These rests were not manually recorded and could not be excluded from the
analysis. The wheelchair basketball data however, included a whole game with rests and
time outs (WBP) as well as analysis excluding time-outs, end of quarters and
substitutions (B-APT). Basketball players may not play the whole match due to
substitutions which vary greatly between matches. Tennis players compete for the
whole match and breaks are included within the rules of the match and are consistent
from match to match. That said, tennis match length is variable, and court surface and
ball type can change between tournaments which can influence the physiological
demands of the sport (Kovacs, 2007). In wheelchair basketball, excluding time-outs,

Chapter 8 Energy expenditure of wheelchair basketball and wheelchair tennis
135
end of quarters and substitutions during competitive play is a truer reflection of the
demands of this particular sport (Pérez et al., 2007).
8.5.4 Heart rate training zones
The HR training zones obtained from the current study are informative, since
they can be used to help specialise training for the different sports. Interestingly, it was
apparent that when comparing time spent in zones between B-APT and WTP one of the
differences between sports occurred at HR zone 3, which is one of the zones just below
LTP. This finding may help explain the differences found between the characteristics of
the athletes between sports at LTP. The slightly higher absolute 2 at LTP for the
basketball players may be due to these players demonstrating a higher aerobic capacity,
as relatively, there was no difference in 2 at LTP between sports. From these data, a
wheelchair tennis match lasts on average 30 to 40 minutes longer than a wheelchair
basketball match. So in absolute terms, wheelchair tennis players are spending more
time in the zones around and above LTP. However, the wheelchair basketball players
spend a higher (although not significant) relative percentage of time in zone 5 when
compared with wheelchair tennis even when taking rests into account. If more time is
spent around or above the LTP, this may promote a more efficient lactate removal,
which would result in LTP occurring at higher exercise intensities (Weltman, 1995).
Training in the different HR zones would be achieved through varying the work-
to-rest ratios and the intensity of the activity. It has been suggested that zone 1 to 2
would incorporate lower intensities of longer duration to build an aerobic base whereas
zone 5 would have a lower work-to-rest ratio and involve higher exercise intensities
with more interval-related training (Bourdon, 2000). Training could incorporate a
combination of the HR zones, with zones 1 to 2 being used as a recovery between
training at the higher zones. Different drills could be implemented and could reflect
important aspects of the sport such as movement patterns and agility, along with more
sport-related actions such as passing in basketball (Owen, 1982; Frogley, 1999).
Bullock and Pluim (2003) highlight that it is important that training reflects competitive
play; for example wheelchair tennis training can be done holding a racket, so that the
tennis racket eventually does not become a constraint to the pushing technique (Goosey-
Tolfrey and Moss, 2005). Heart rate monitors can be used to help examine exercise
training for participants with a low to moderate spinal cord injury. It is important

Chapter 8 Energy expenditure of wheelchair basketball and wheelchair tennis
136
however, that athletes are re-tested (Diaper and Goosey-Tolfrey, 2009) as, through
training, the LT and LTP will occur at higher exercise intensities and thus it is likely
that the HR training zones will change (Godfrey and Whyte, 2006).
Basketball training literature has highlighted the need for frequent repetitions
involving different speeds and high intensity drills (Owen 1982; Frogley et al., 1999).
Similarly, drills are also available to the tennis player which replicate the movements on
the tennis courts (Bullock and Pluim, 2003). Even though some literature has suggested
more aerobic training should be undertaken for wheelchair tennis players which could
involve continuous pushing for 45 to 60 minutes or longer (Bullock and Pluim, 2003),
emphasis should also be placed on anaerobic, intermittent training (Kovacs, 2007). The
HR training zones themselves vary between researchers; however, to date, this has
involved able-bodied participants (Bourdon, 2000). Differences were also shown to
occur between participants within the same sport in the current study. Individual
variance, the problems associated with competitive play and the varying match demands
between matches discussed earlier, all contribute to these differences. However, where
possible several matches from a number of participants were used to represent the
typical match play response.
8.5.5 Limitations
As wheelchair basketball and tennis are intermittent in nature then there can be a
delay in the HR response to actual play, so excluding time-outs could obscure the true
reflection of the physiological demands of the game. Thus, using average HR to
determine the EE of intermittent games players may not be the most accurate way of
measuring metabolism (Spurr et al., 1988). Changes in HR due to excitement or stress
and the environmental changes to HR can also have an effect on the data. One of the
major difficulties facing research into elite wheelchair athletes is the small population
available, resulting in small sample sizes along with the variation in disability within
population groups. Although it is considered preferable to use a homogenous same sex
cohort for data collection to reduce the variation in the results, there is always a
practical trade-off between such homogeneity in study design and the need to ensure
sample size is as large as possible in order to analyse variation and associations. For
practical reasons, more data in this study could be analysed by including both male and
female athletes from both sports to form the largest possible cohort. This also made pair

Chapter 8 Energy expenditure of wheelchair basketball and wheelchair tennis
137
matching between sports more appropriate. Despite this study matching participants,
differences in disability between subjects could affect the findings. It also can help
explain the physiological differences compared with other studies. Both LT and LTP
were determined visually by separate investigators. However, there was sometimes an
element of uncertainty. The warmer temperatures and the humidity during tournaments
within Florida when tennis data were collected could also have resulted in higher HRs
(Price, 2006) than those played in England. Finally, when investigating competitive
intermittent sport activity, an appreciation of the different opposition, environment and
physiological demands between matches must be acknowledged (Kovacs, 2007; Pérez
et al., 2007).
8.6 Conclusions
The current study demonstrated that wheelchair basketball players have higher
aerobic capacities and can exercise at a higher intensity before the onset of blood lactate
accumulation when compared with wheelchair tennis players of similar playing
experience. Furthermore, wheelchair basketball players expend more energy during B-
APT and WBP when compared to wheelchair tennis players during WTP. Wheelchair
tennis players spend longer on court during a game, compared to wheelchair basketball
players, but absolute total EE is the same between sports regardless of time-outs and
end of quarters. Our findings suggest that it is possible that the times spent in basketball
competitive play might be associated with the improved physiological profile of the
wheelchair basketball players when compared with the tennis players. Close inspection
of the HR profile during match play would suggest that wheelchair basketball players
would benefit from high intensity training, whilst tennis players training should cover
the exercise intensity continuum (Bullock and Pluim, 2003). Future research needs to
address how athletes and coaches quantify training by taking into account both exercise
volume and intensity and monitoring weekly training for adequate assessment of EE.

Chapter 9 General Discussion
138
Chapter 9
General Discussion
The primary focus of this thesis was to investigate the EE of wheelchair athletes. It
would appear that this is a large area to study, given the complexities of data interpretation
with respect to the nature and time of onset of disability, wheelchair type and experience.
To gain a greater understanding of EE in this cohort, various aspects of physiology and
wheelchair propulsion were considered, including body composition, wheelchair
propulsion experience and classification in disability sport. As the current guidelines for
fuel provision during sport are typically based on data from able-bodied athletes, there is
limited information available to help wheelchair athletes optimise their nutritional practices
(Price, 2010). In light of this, the present thesis investigated the EE i) during rest in
wheelchair athletes; ii) during daily wheelchair propulsion in novice and experienced
wheelchair users; and iii) during sports competition in wheelchair athletes. As outlined in
section 1.2, three main objectives were formed:
1) To investigate the relationship between body composition and REE in athletes with
a disability and to compare measured values of REE to predicted equations from
the able-bodied population (Chapters 3 and 4).
2) To explore the effect of wheelchair propulsion practice and experience on the EE of
wheelchair propulsion during daily ambulatory speeds (Chapters 5 and 6).
3) To analyse the physiological variables and the EE of wheelchair sports competition,
with comparisons between sports and between disability classifications (Chapters 7
and 8).
This chapter reviews the primary findings from the experimental chapters,
addressing each of the aforementioned objectives, and provides a summary of EE in
relation to the three previously mentioned themes. This chapter also provides an overview
of how this research could be used by practitioners to understand the nutritional needs and
energy requirements of wheelchair athletes to help improve performance and optimise
training. The chapter concludes with the practical implications of the findings and
recommendations for further studies.

Chapter 9 General Discussion
139
9.1 Resting energy expenditure in relation to predictive equations and body
composition
To fully understand the REE of wheelchair athletes, the initial studies (Chapters 3
and 4) were conducted by grouping individuals according to their disability categorisation.
Inclusion of specialised techniques such as DXA increased the validity of the data
collected for this cohort. The REE of an individual accounts for the largest portion of daily
EE (Ravussin et al., 1982), so it was an important aspect of total EE to consider. From
previous literature it was evident that sedentary and/or rehabilitating individuals with an
SCI have lower REE than able-bodied individuals (Monroe et al., 1998; Buchholz et al.,
2003a; Jeon et al., 2003; Liusuwan et al., 2007). Moreover, SCI individuals also display
lower REE values than those derived from validated able-bodied prediction equations
(Mollinger et al., 1985; Sedlock and Laventure, 1990). Results in Chapters 3 and 4
revealed that the REE of tetraplegic athletes (63.4 kcal∙h-1
) was significantly lower than the
prediction equations from the able-bodied cohort, which confirmed earlier work. In
contrast to this finding, the paraplegic athletes in both Chapters 3 and 4 showed
comparable REE (70.0 and 71.8 kcal∙h-1
respectively) to that predicted for them using the
able-bodied equations (72.3 and 72.6 kcal∙h-1
respectively). There was a tendency for the
REE to be slightly higher in the paraplegics when compared to the tetraplegics in the two
experimental studies. An initial justification was that this could be explained by the greater
FFM evident in the paraplegic athletes. Nevertheless, when body composition was
measured in Chapter 4, total-body FFM was similar between the tetraplegic and paraplegic
athletes. This study extends the current literature exploring REE in relation to FFM within
the general SCI population (Buchholz et al., 2003a) to that of an elite sports context.
Chapter 4 revealed similarities in REE in both tetraplegic and paraplegic athletes,
contradicting the findings from a rehabilitation setting (Cox et al., 1985; Mollinger et al.,
1985). The similarities in FFM found in Chapter 4 are also in disagreement with Spungen
et al. (2003). From the findings, it was proposed that sports training resulted in similar
physiology, supporting the work of Abel et al. (2008) who found similar results to the
current thesis in tetraplegic and paraplegic athletes regarding REE. Chapter 3 also
highlighted the higher REE in non-SCI individuals compared to their predicted value. This
raised the question of whether able-bodied prediction equations for REE in athletic
populations are affected by the potential increase in metabolically active mass through
sports training.
Chapter 9 General Discussion
140
Chapter 4 explored the relationship between REE and FFM but these results were
not straightforward. Statistically, no difference was found between tetraplegic and
paraplegic athletes for both REE and FFM. However, further analysis revealed that the
patterns of FFM distribution showed a higher value in the upper limbs of the paraplegic
individuals, which is in agreement with values in the SCI rehabilitation context (Maynard
et al., 1997; Spungen et al., 2003; Jacobs and Nash, 2004). The finding of greater FFM in
the lower limbs of the tetraplegic individuals when compared to paraplegic individuals was
not expected, due to the majority of both cohorts having a complete SCI and therefore no
sympathetic innervation to the lower limbs. One possible explanation, supported through
regression analysis, was the difference between groups with respect to the onset of
disability (a shorter time for the tetraplegic athletes). Although there was a 6.6 and 8.4
kcal∙h-1
difference in REE between the tetraplegics and paraplegics (Chapter 3 and 4
respectively), the absence of any major difference in REE between the two cohorts was
likely to be due to the similarities in upper-body FFM alongside the somewhat unexpected
greater lower-limb FFM found in the tetraplegic individuals.
9.2 The effect of practice and experience on the EE of wheelchair propulsion during
daily ambulation.
To further understand the EE of wheelchair users, participants were grouped
according to propulsion experience (Chapters 5 and 6). Moreover, using the SMARTWheel
allowed a greater understanding of propulsion technique and consequently helped explain
patterns of EE whilst learning wheelchair propulsion (Chapter 5). There is a large amount
of literature that has measured the O2 cost and GE of wheelchair propulsion in a laboratory
setting. The variables that contribute to the O2 cost of propulsion include: pushing velocity
(Veeger et al., 1992a), properties of the wheelchair (Beekman et al., 1999; van der Woude
et al., 1989a; van der Woude et al., 2009), wheelchair propulsion experience (de Groot et
al., 2002a; 2005; 2007; 2008), and push strategy (van der Woude et al., 1989b; Goosey et
al., 2000; Lenton 2008a; 2008b; 2009). Chapters 5 and 6 were designed to extend this work
by reporting EE during daily wheelchair propulsion, so that nutritional advice could be
given according to real values of EE. The purpose of this second section of the thesis was
not just to focus on wheelchair athletes (Chapter 6) but also to account for the learning
process of manual wheelchair propulsion and cover a wide spectrum of wheelchair
Chapter 9 General Discussion
141
propulsion experience. This is of great importance, since nutritional advice may vary for
specific wheelchair user groups in accordance with their wheelchair propulsion experience.
It was evident from Chapter 5 that EE during daily wheelchair propulsion reduces
after three weeks of practice. Surprisingly, those participants who took part in no
wheelchair propulsion practice other than the 36-minutes of initial baseline measurements
were also found to have reduced EE during their post-testing session. These findings
confirm earlier work which has found that both technical adaptations and physiological
parameters are affected by the initial stages of learning wheelchair propulsion (de Groot et
al., 2003; Dallmeijer et al., 1999b; van der Woude et al., 1999). With this in mind however,
it is important to note that three weeks of practice induces greater reductions in EE than the
shorter 36-minute period of propulsion, so there seems to be a continual reduction in the
EE of wheelchair propulsion as this skill is being learnt. These findings can allow
practitioners to appreciate the pattern of EE in novice individuals learning the skill of
wheelchair propulsion.
The subjective measures of effort during daily propulsion (RPE) in Chapter 5 were
significantly lower after practice when compared to the control group. The importance of
understanding how an individual subjectively rates exercise intensity is a key issue in the
rehabilitation setting where individuals practice wheelchair skills. This is also important
for the general wheelchair user population, where adherence to physical activity may
improve as it becomes subjectively easier to do. Our findings suggest that after three weeks
of practice, RPE is lowered, so if RPE is used as a tool to monitor exercise intensity then
the practitioner must be aware of these changes over time.
Chapter 6 provided evidence that experienced wheelchair users expend less energy
at the same exercise intensity as novice individuals with only 20-minutes prior propulsion
practice and novice individuals with three weeks of practice (108 minutes). This gave
further evidence that EE obtained during wheelchair propulsion tasks must be related to the
experience of the cohort. No difference in EE was found between novice individuals and
individuals with three weeks of propulsion practice, suggesting the 20-minute practice may
be sufficient to reduce the EE of wheelchair propulsion. In addition to this, it is clear that
EE is greater in both a novice and practice group when compared to a group of habitual
wheelchair users with at least six years of experience. Chapters 5 and 6 have shown that
the EE of daily propulsion reduces with practice and reduces further with habitual

Chapter 9 General Discussion
142
wheelchair use. This highlights the necessity of providing specific databases on the EE of
wheelchair activities, depending on propulsion experience rather than generic values which
may not be appropriate for all wheelchair users.
9.3 Physiological variables and EE of wheelchair sports competition with
comparisons between sports and between classifications.
An examination of competitive wheelchair sports game play was conducted using data
from 26 wheelchair athletes (Chapters 7 and 8). This provided an awareness of the
physiological requirements and, combined with controlled laboratory testing, the EE of
competitive play. The results revealed that the physical capacity of the GB international
wheelchair basketball players was higher than the GB international tennis players. Within a
team of wheelchair basketball players, those who displayed a greater physiological
capacity belonged to the higher IWBF classification group, supporting the present
classification system of the IWBF (2009). The wheelchair basketball players participating
in the studies of Chapters 7 and 8 had a higher physical capacity compared with groups
described in previous literature as shown in figure 9.1, confirming their elite status of
training and competing at an international level.
When the EE of wheelchair basketball competition was considered, Chapter 7 revealed that
high point players (IWBF class 3 - 4.5) expended 135 kcal∙h-1
more energy than low point
players (IWBF class 1 - 2.5), although this difference did not quite reach significance.
However, as the low point players spent ~10 minutes longer on court during a game, the
EE was similar during actual playing time for both groups (517 vs. 499 kcal for LOW and
HIGH respectively). This suggests a similar amount of calories are needed by both
classification groups when considering competition. Regardless of these similarities
however, the greater EE per hour in the high point player must be considered for training
day nutritional advice and at camps where game duration may be of equal length. This
finding, alongside the information provided regarding the physiological capacities of each
group, suggests that training should be individualised in wheelchair basketball.
Understanding the physiological differences and EE between classification groups can help
provide coaches with information to make informed decisions about training.
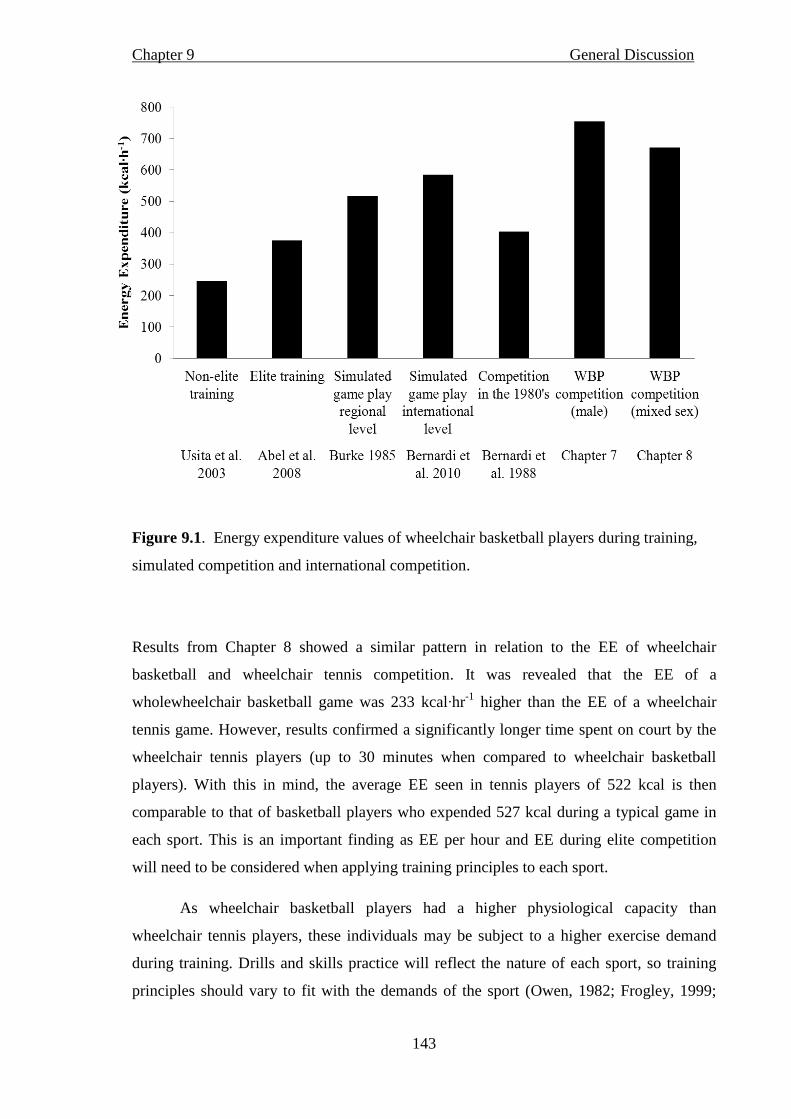
Chapter 9 General Discussion
143
Figure 9.1. Energy expenditure values of wheelchair basketball players during training,
simulated competition and international competition.
Results from Chapter 8 showed a similar pattern in relation to the EE of wheelchair
basketball and wheelchair tennis competition. It was revealed that the EE of a
wholewheelchair basketball game was 233 kcal∙hr-1
higher than the EE of a wheelchair
tennis game. However, results confirmed a significantly longer time spent on court by the
wheelchair tennis players (up to 30 minutes when compared to wheelchair basketball
players). With this in mind, the average EE seen in tennis players of 522 kcal is then
comparable to that of basketball players who expended 527 kcal during a typical game in
each sport. This is an important finding as EE per hour and EE during elite competition
will need to be considered when applying training principles to each sport.
As wheelchair basketball players had a higher physiological capacity than
wheelchair tennis players, these individuals may be subject to a higher exercise demand
during training. Drills and skills practice will reflect the nature of each sport, so training
principles should vary to fit with the demands of the sport (Owen, 1982; Frogley, 1999;

Chapter 9 General Discussion
144
Bullock and Pluim, 2003; Kovacs, 2007). As chapter 8 has highlighted similar EE during a
typical game in wheelchair basketball and tennis, advice on kcal needed during
competition ought to be similar, especially if sport-specific training reflects the typical
game duration of each sport. However, this chapter also emphasised the similar weekly
training hours between groups. As wheelchair basketball players expend more energy per
hour than wheelchair tennis players, they may need a higher energy intake on a weekly
basis.
In conclusion, the results of this thesis indicate that there are several important
physiological considerations to appreciate when investigating the EE of wheelchair athletes.
Findings suggest that disability and time of onset of disability, wheelchair propulsion
experience and sport classification are all important considerations for the accurate
assessment of EE in this particular cohort of individuals.
9.4 Practical Implications
This thesis has provided researchers, athletes, coaches and practitioners with
information regarding the EE of habitual wheelchair use through to the EE specifically in
elite wheelchair athletes. Databases that provide information regarding the EE of the able-
bodied individual, at rest and during specific activities, have taken a generalised approach,
albeit taking into account sex and/ or body mass. The transferability of this information has
been questioned and, in the context of the wheelchair user, other factors become
predominant when the energy costs of living and sports performance are to be considered.
1 Disability and body composition must be considered when estimating REE. Able-
bodied predictive equations seem to be useful for the evaluation of paraplegic athlete’s
metabolic rate although care must be taken when comparing values between the K4b2
and the Douglas bag technique. The equations should not be used to estimate the REE
of tetraplegic athletes. Individual assessment of REE related to FFM is similar in
tetraplegic and paraplegic athletes suggesting that total FFM may be comparable
through elite sports training in these groups. However, caution must be taken to assess
other factors affecting body composition and a shorter time since disability onset in
tetraplegic athletes investigated in this thesis may account for the similar FFM
between this particular group and paraplegic athletes.

Chapter 9 General Discussion
145
2 Wheelchair propulsion experience influences the EE of wheelchair propulsion at
speeds seen during daily activity. Typical values of EE seem to be 20-30% lower in
habitual wheelchair users of at least six years, in comparison to novice wheelchair
users. Nutritional advice must therefore be given in relation to experience and stage of
learning and should not be provided as a generic value for all participants undertaking
wheelchair propulsion. A reduction in EE of up to 13% is also evident after three
weeks of wheelchair propulsion practice in novice individuals. In absolute terms,
novice wheelchair users expended 180 kcal·h-1
compared to 162 kcal·h-1
in a group
who have practiced wheelchair propulsion at a speed of 1.1 m·s-1
. At 1.5 m.s novice
individuals expended 230 kcal·h-1
, 32 kcal more than their practiced counterparts. At a
faster speed of 1.9 m·s-1
, novice individuals expended 298 kcal·h-1
compared with the
practiced individual’s 259 kcal·h-1
. Although these differences are small, extrapolated
over an average day of wheelchair propulsion, this could equate to a reduction of
energy expenditure of over 100 kcal if, throughout a 24 hour period an individual was
active for at least 4 hours. Although consideration must be taken for the other
physiological variables that may predominate during rehabilitation, practitioners may
want to consider this 13% reduction in metabolic cost when assessing rehabilitation if
weight management is an important aspect of an individual’s programme. It could also
be useful for controlling the amount of activity completed if fatigue and over
expenditure may be a concern.
Following on from the practice situation, when pushing at the same power output of
10 W, novice wheelchair users expend more than experienced wheelchair users by 36
kcal·h-1
. When pushing at a harder intensity of 26 W, the novice individuals expended
110 kcal·h-1
more than the experienced wheelchair users. Values such as these can
help practitioners better understand the metabolic differences between individuals at
different stages of their rehabilitation
3 Energy expenditure during sports competition is influenced by classification and
physiological capacity. Wheelchair basketball players expend more energy per hour
than wheelchair tennis players during competition. However, due to the longer
duration of wheelchair tennis matches, the EE during a typical game in each sport is
similar. Individuals with a higher classification in wheelchair basketball have a greater
physiological capacity, alongside a non-significantly larger EE per hour when
compared to those with a low classification. From the data in figure 9.1, it is clear that
international standard wheelchair basketball players expend a higher amount of energy
Chapter 9 General Discussion
146
when compared with lower level of competition and also when compared with training
in this sport. This suggests nutrition on competition day should be increased to meet
the greater metabolic demands. However, during heavy training periods, practitioners
and coaches should consider an increased energy intake for the athlete. From the
absolute values provided in this thesis alongside the literature already published, EE
may be estimated during competition and training if classification, aerobic fitness and
hours of competition and training are considered.
9.5 Future directions
As a result of conducting the experimental research studies included in this thesis, a
number of new research questions have arisen.
9.5.1 Resting energy expenditure in relation to body composition
The collection of REE from sedentary tetraplegic and paraplegic individuals would
be extremely advantageous. This would provide a comparative study, alongside the data
collected from the elite athletes, to explore whether a relationship exists between REE and
differences in body composition that may be expected from a cohort who are not habitually
sports trained after SCI. An additional sub-group of tetraplegic and paraplegic athletes with
the same time since onset of disability would also help provide clearer conclusions about
the body composition of SCI athletes. It would help to extend knowledge of whether time
since onset of disability is a key factor driving the larger lower-limb FFM in the tetraplegic
participants.
9.5.2 Energy expenditure in daily wheelchair propulsion
Results confirmed the reduction in EE during wheelchair propulsion in novice able-
bodied individuals after a practice period. This reduction occurred after 36 minutes as well
as three weeks, so further investigation should explore the duration and type of wheelchair
propulsion practice. Future studies must also seek to confirm if this reduction in EE is seen
after three weeks in participants undergoing SCI rehabilitation, in order to make the
research more relevant to individuals who must start to use a wheelchair as part of their
daily routine. As Chapter 6 revealed lower EE in experienced wheelchair users compared
to that of novice individuals, it would also be helpful to understand the technical
adaptations in relation to wheelchair experience that may be causing the energy reduction.

Chapter 9 General Discussion
147
To facilitate this, measurement of the application of hand rim forces using the SMARTWheel
in a group of experienced wheelchair users alongside that of novice individuals is
warranted.
9.5.3 Energy expenditure in wheelchair sports competition
Chapters 7 and 8 revealed that disability classification and the nature of the sport
influences EE during elite wheelchair competition, and there still remain some Paralympic
sports that would benefit from this type of research design. There is a need for larger
sample sizes, and this, plus the need to obtain measures for each classification group within
Paralympic sports competing at an international standard, means world-wide collaboration
would be necessary. An alternative approach would be to gain physiological data from
each classification group at a national level, although this would not provide sufficient data
regarding the elite athlete. To progress this further, collection of data regarding other
wheelchair sports would give a greater picture of the demands of these activities. To
encourage individuals to be active, knowledge of the demands of certain activities is
paramount if we are to provide information regarding EE of wheelchair sports.

Chapter 10 References
148
Chapter 10
References
Abel, T., Kröner, M., Rojas Vega, S., Peters, C., Klose, C. and Platen, P. (2003). Energy
expenditure in wheelchair racing and handbiking, a basis for prevention of
cardiovascular diseases in those with disabilities. European Journal of Cardiovascular
Prevention and Rehabilitation, 10, 371–376.
Abel, T., Platen, P., Rojas Vega S., Schneider, S. and Strüder, H,K. (2008). Energy
expenditure in ball games for wheelchair users. Spinal Cord, 46, 785-790.
Achten, J. and Jeukendrup, A.E. (2003). Heart rate monitoring, applications and limitations.
Sports Medicine, 33, 517-538.
Ainsworth, B.E., Haskell, W.L., Herrmann, S.D., Meckes, N., Bassett, D.R., Tudor-Locke,
C., Greer, J.L., Vezina, J., Whitt-Glover, M.C. and Leon, A.S. (2011). 2011
compendium of physical activities: a second update of codes and MET values.
Medicine and Science in Sports and Exercise, 43, 1575-1581.
Amuna, P. and Zotor, F.B. (2008). Epidemiological and nutrition transition in developing
countries: impact on human health and development. Proceedings of the Nutrition
Society, 67, 82-90.
Andreoli, A., Monteleone, M., Van Loan, M., Promenzio, L., Tarantino, U. and de
Lorenzo, A. (2001). Effects of different sports on bone density and muscle mass in
highly trained athletes. Medicine and Science in Sports and Exercise, 33, 507-511.
Arciero, P.J., Goran, M.I. and Poehlman, E.T. (1993). Resting metabolic rate is lower in
women than in men. Journal of Applied Physiology, 75, 2514–2520.
Åstrand, P., Rodahl, K., Dahl, H.A. and Strømme, S.B. (2003). Textbook of work
physiology, physiological bases of exercise, 4th
Edition. Champaign, Illinois: Human
Kinetics.
Atwater, W.O. (1889). Food and Health. Public Health Paper Report, 15, 208–221.
Bagger, M., Petersen, P.H. and Pedersen, P.K. (2003). Biological variation in variables
associated with exercise training. International Journal of Sports Medicine, 24, 433-
440.
Barfield, J.P., Malone, L.A. and Coleman, T.A. (2009). Comparison of heart rate response
to tennis activity between persons with and without spinal cord injuries: implications
Chapter 10 References
149
for a training threshold. Research Quarterly in Exercise and Sport, 80, 71-77.
Bar-Or, O. and Zwiren, L.D. (1975). Maximal oxygen consumption test during arm
exercise - reliability and validity. Journal of Applied Physiology, 38, 424-426.
Bauman, W.A. and Spungen, A.M. (2008). Coronary heart disease in individuals with
spinal cord injury: assessment of risk factors. Spinal Cord, 46, 466-476.
Beaver, W.L., Wasserman, K. and Whipp, B.J. (1986). Bicarbonate buffering of lactic acid
generated during exercise. Journal of Applied Physiology, 60, 472-478.
Beekman, C.E., Miller-Porter, L. and Schoneberger, M. (1999). Energy cost of propulsion
in standard and ultralight wheelchairs in people with spinal cord injuries. Physical
Therapy, 79, 146-158.
Bernardi, M., Canale, I., Felici, F. and Marchettoni, P. (1988). Field evaluation of the
energy cost of different wheelchair sports. International Journal of Sports
Cardiology, 5, 58-61.
Bernardi, M., Guerra, E., Di Giacinto, B., Di Cesare, A., Castellano, V. and Bhambhani, Y.
(2010). Field evaluation of paralympic athletes in selected sports: implications for
training. Medicine and Science in Sports and Exercise, 42, 1200-1208.
Bertoli, S., Battezzati, A., Merati, G., Margonato, V., Maggioni, M., Testolin, G. and
Veicsteinas, A. (2006). Nutritional status and dietary patterns in disabled people.
Nutrition, Metabolism and Cardiovascular Diseases, 16, 100–112.
Bhambhani, Y. (2002). Physiology of wheelchair racing in athletes with spinal cord injury.
Sports Medicine, 32, 23-51.
Bhambhani, Y. (2011). Physiology. In Y.C. Vanlandewijck and W.R Thompson. Eds. The
Paralympic Athlete. Chichester, West Sussex: Wiley-Blackwell. pp. 51-73.
Bingham, S.A., Goldberg, G.R., Coward, W.A., Prentice, A.M. and Cummings, J.H.
(1989). The effect of exercise and improved physical fitness on basal metabolic rate.
British Journal of Nutrition, 61, 155-173.
Bloxham, L.A., Bell, G.J., Bhambhani, Y. and Steadward, R.D. (2001). Time motion
analysis and physiological profile of Canadian world cup wheelchair basketball
players. Sports Medicine, Training and Rehabilitation, 10, 183-198.
Chapter 10 References
150
Bonninger, M.L., Cooper, R.A., Robertson, R.N. and Shimada, S.D. (1997). Three-
dimensional pushrim forces during two speeds of wheelchair propulsion. American
Journal of Physical Medicine and Rehabilitation, 76, 420-426.
Bonninger, M.L., Souza, A.L., Cooper, R.A., Fitzgerald, S.G., Koontz, A.M. and Fay, B.T.
(2002). Propulsion patterns and pushrim biomechanics in manual wheelchair
propulsion. Archives of Physical Medicine and Rehabilitation, 83, 718-723.
Borg, G. (1970). Perceived Exertion as an indicator of somatic stress. Scandinavian
Journal of Rehabilitation Medicine, 2, 92-98.
Bosy-Westphal, A., Eichhorn, C., Kutzner, D., Illner, K., Heller, M. and Müller, M.J.
(2003). The age-related decline in resting energy expenditure in humans is due to
the loss of fat-free mass and to alterations in its metabolically active components.
The Journal of Nutrition, 133, 2356–2362.
Bot, S.D. and Hollander, A.P. (2000). The relationship between heart rate and oxygen
uptake during non-steady state exercise. Ergonomics, 43, 1578-1592.
Bourdon, P. (2000). Blood lactate transition thresholds: Concepts and controversies. In C.J.
Gore. ed. Physiological Tests for Elite Athletes. Champaign, Illinois: Human
Kinetics. pp. 50-65.
Bregman, D.J., van Drongelen, S. and Veeger, H.E. (2009). Is effective force application in
handrim wheelchair propulsion also efficient? Clinical Biomechanics, 24, 13-19.
Brown, S.P. Miller, W.C. and Eason, J.M. (2006). Exercise Physiology: Basis of Human
Movement in Health and Disease. 5th
Edition. Baltimore: Lippincott, Williams and
Wilkins.
Buchholz, A.C., McGillivray, C.F. and Pencharz, P.B. (2003a). Differences in resting
metabolic rate between paraplegic and able-bodied subjects are explained by
differences in body composition. American Journal of Clinical Nutrition, 77, 371-
378.
Buchholz, A.C., McGillivray, C.F. and Pencharz, P.B. (2003b). Physical activity levels are
low in free-living adults with chronic paraplegia. Obesity Research, 11, 563-570.

Chapter 10 References
151
Bulbulian, R., Johnson, R.E., Gruber, J.J. and Darabos, B. (1987). Body composition in
paraplegic male athletes. Medicine and Science in Sports and Exercise, 19, 195-201.
Bullock, M. and Pluim, B. (2003). Wheelchair tennis and physical conditioning. ITF
Wheelchair Tennis Coaches Review, 9, 2-10.
Burke, E.J., Auchinachie, J.A., Hayden, R. and Loftin, J.M. (1985). Energy cost of
wheelchair basketball. The Physician and Sports Medicine, 13, 99–105.
Burkett, L.N., Chisum, J., Stone, W. and Femhall, B. (1990). Exercise capacity of
untrained spinal cord injured individuals and the relationship of peak oxygen
uptake to level of injury. Paraplegia, 28, 512-521.
Broeder, C.E., Burrhus, K.A., Svanevik, L.S. and Wilmore, J.H. (1992). The effects of
either high-intensity resistance or endurance training on resting metabolic rate.
American Journal of Clinical Nutrition, 55, 802-810.
Brown, D.D., Knowlton, R.G., Hamill, J., Schneider, T.L. and Hetzler, R.K. (1990).
Physiological and biomechanical differences between wheelchair-dependent and
able-bodied subjects during wheelchair ergometry. European Journal of Applied
Physiology and Occupational Physiology, 60, 179-182.
Brubaker, P.H. and Kitzman, D.W. (2011). Chronotropic incompetence: causes,
consequences, and management. Circulation, 123, 1010-1020.
Campbell, I.G., Williams, C. and Lakomy, H.K. (1997). Physiological responses of
wheelchair athletes at percentages of top speed. British Journal of Sports Medicine,
31, 36-40.
Campbell, I.G., Williams, C. and Lakomy, H.K. (2002). Physiological responses of
endurance-trained male wheelchair athletes to a 10-kilometer treadmill time trial.
Adapted Physical Activity Quarterly, 19, 496-508.
Carling, C., Reilly, T. and Williams, A.M. (2009). Performance Assessment for Field
Sports. New York: Routledge.
Clark, H,D. and Hoffer, L.J. (1991). Reappraisal of the resting metabolic rate of normal
young men. American Journal of Clinical Nutrition, 53, 21-26.
Cohen, J. (1992). A power primer. Psychological Bulletin, 112, 155-159.
Chapter 10 References
152
Colivicchi, F., Bassi, A. and Traballesi, M. (2002). Exercise physiology, benefits of
physical activity and training prescription in paraplegic subjects. Europa
Medicophysica, 38, 109-111.
Collins, E.G., Gater, D., Kiratli, J., Butler, J., Hanson, K. and Langbein, W.E. (2010).
Energy cost of physical activities in persons with spinal cord injury. Medicine and
Science in Sports and Exercise, 42, 691-700.
Compher, C., Frankenfield, D., Keim, N. and Roth-Yousey, L. (2006). Best practice
methods to apply to measurement of resting metabolic rate in adults: a systematic
review. Journal of the American Dietetic Association, 106, 881-903.
Coutts, K.D., Rhodes, E.C. and McKenzie, D.C. (1983). Maximal exercise responses of
tetraplegics and paraplegics. Journal of Applied Physiology, 55, 479-482.
Coutts, K.D. and Stogryn, J.L. (1987). Aerobic and anaerobic power of Canadian
wheelchair track athletes. Medicine and Science in Sports and Exercise, 19, 62-65.
Coutts, K.D. (1988). Heart rates of participants in wheelchair sports. Paraplegia, 26, 43-49.
Coutts, K.D. (1992). Dynamics of wheelchair basketball. Medicine and Science in Sports
and Exercise, 24, 231-234.
Coutts, K.D. and McKenzie, D.C. (1995). Ventilatory thresholds during wheelchair
exercise in individuals with spinal cord injuries. Paraplegia, 33, 419-422.
Coutts, A., Reaburn, P. and Abt, G. (2003). Heart rate, blood lactate concentration and
estimated energy expenditure in a semi-professional rugby league team during a
match: a case study. Journal of Sports Sciences, 21, 97–103.
Cox, S.A., Weiss, S.M., Posuniak, E.A., Worthington, P., Prioleau, M. and Heffley, G.
(1985). Energy expenditure after spinal cord injury: an evaluation of stable
rehabilitating patients. The Journal of Trauma, 25, 419-423.
Cunningham, J.J. (1991). Body composition as a determinant of energy expenditure: a
synthetic review and a proposed general prediction equation. American Journal of
Clinical Nutrition, 54, 963-969.

Chapter 10 References
153
Dallmeijer, A.J., van der Woude, L.H., Veeger, H.E. and Hollander, A.P. (1998).
Effectiveness of force application in manual wheelchair propulsion in persons with
spinal cord injuries. American Journal of Physical Medicine and Rehabilitation, 77,
213-221.
Dallmeijer, A.J., van der Woude, L.H., Hollander, A.P. and van As, H.H. (1999a). Physical
performance during rehabilitation in persons with spinal cord injuries. Medicine
and Science in Sports and Exercise, 31, 1330-1335.
Dallmeijer, A.J. van der Woude, L.H. and Pathuis, C.S. (1999b). Adaptations in wheelchair
propulsion technique after training in able-bodied subjects. In: L.H.V. van der
Woude, M.T.E Hopman and C.H. van Kemenade, eds. Biomedical Aspects of
Manual Wheelchair Propulsion, The state of the art II. Amsterdam: IOS Press. pp.
224-226.
Dallmeijer, A.J., van der Woude, L.H., Hollander, P.A. and Angenot, E.L. (1999c).
Physical performance in persons with spinal cord injuries after discharge from
rehabilitation. Medicine and Science in Sports and Exercise, 31, 1111-1117.
Dallmeijer, A.J., Zentgraaff, I.D., Zijp, N.I. and van der Woude, L.H. (2004). Submaximal
physical strain and peak performance in handcycling versus handrim wheelchair
propulsion. Spinal Cord, 42, 91-98.
Davis, G.M., Kofsky, P.R., Kelsey, J.C. and Shepard, R.J. (1981). Cardiorespiratory fitness
and muscular strength of wheelchair users. Canadian Medical Association Journal,
125, 1317-1323.
Dearwater, S.R., LaPorte, R.E., Cauley, J.A. and Brenes, G. (1985). Assessment of
physical activity in inactive populations, Medicine and Science in Sports and
Exercise, 17, 651-655.
de Groot, S., Veeger, D.H., Hollander, A.P. and van der Woude, L.H. (2002a). Wheelchair
propulsion technique and mechanical efficiency after 3 wk of practice. Medicine
and Science in Sports and Exercise, 34, 756-766.

Chapter 10 References
154
de Groot, S., Veeger, H.E., Hollander, A.P. and van der Woude, L.H. (2002b).
Consequence of feedback-based learning of an effective hand rim wheelchair force
production on mechanical efficiency. Clinical Biomechanics, 17, 219-226.
de Groot, S., Veeger, H.E., Hollander, A.P. and van der Woude, L.H. (2003). Adaptations
in physiology and propulsion technique during the initial phase of learning manual
wheelchair propulsion. American Journal of Physiology. Medicine and
Rehabilitation, 82, 504-510.
de Groot, S., Veeger, H.E., Hollander, A.P. and van der Woude, L.H. (2004). Effect of
wheelchair stroke pattern on mechanical efficiency. American Journal of Physical
medicine and Rehabilitation, 83, 640-649.
de Groot, S., Dallmeijer, A.J., Kilkens, O.J., van Asbeck, F.W., Nene, A.V., Angenot, E.L.,
Post, M.W. and van der Woude, L.H. (2005). Course of gross mechanical
efficiency in handrim wheelchair propulsion during rehabilitation of people with
spinal cord injury: a prospective cohort study. Archives of Physical Medicine and
Rehabilitation, 86, 1452-1460.
de Groot, S., Dallmeijer, A.J., van Asbeck, F.W., Post, M.W., Bussman, J.B. and van der
Woude, L.H. (2007). Mechanical efficiency and wheelchair performance during
and after spinal cord injury rehabilitation. International Journal of Sports Medicine,
28, 880-886.
de Groot, S., de Bruin, M., Noomen, S.P. and van der Woude, L.H. (2008). Mechanical
efficiency and propulsion technique after 7 weeks of low-intensity wheelchair
training. Clinical Biomechanics, 23, 434-441.
de Lira, C.A., Vancini, R.L., Minozzo, F.C., Sousa, B.S., Dubas, J.P., Andrade, M.S.,
Steinberg, L.L. and da Silva, A.C. (2010). Relationship between aerobic and
anaerobic parameters and functional classification in wheelchair basketball players.
Scandinavian Journal of Medicine and Science in Sports, 20, 638-643.
Department of Health. (1991). Dietary reference values for food energy and nutrients for
the United Kingdom. Report of the panel on dietary reference values of the
committee on medical aspects of food policy. Reports on health and social subjects
(London), 41, 1-210.
Chapter 10 References
155
Diaper, N.J. and Goosey-Tolfrey, V.L. (2009). A physiological case study of a paralympic
wheelchair tennis player: reflective practise. Journal of Sports Science and
Medicine, 8, 300-307.
DiGiovine, C.P., Koontz, A.M., Boninger, M.L. (2006). Advances in manual wheelchair
technology. Topics in Spinal Cord Injury Rehabilitation, 11, 1-14.
Dionyssiotis, Y., Petropoulou, K., Rapidi, C.A., Papagelopoulos, P., Papaioannou, N.,
Galanos, A., Papadaki, P. and Lyritis, G.P. (2008). Body composition in paraplegic
men. Journal of Clinical Densitometry, 11, 437-443.
Dou, P., Jia, X., Suo, S., Wang, R. and Zhang, M. (2006). Pressure distribution at the
stump/socket interface in transtibial amputees during walking on stairs, slope and
non-flat road. Clinical Biomechanics, 21, 1067-1073.
Dreisinger, T.E., Dalton, R.B. and Whiting, R.B. (1984). Maximal wheelchair exercise:
Comparison of able-bodied and wheelchair bound. Medicine and Science in Sports
and Exercise, 16, 147.
Drinkwater, E.J., Pyne, D.B. and McKenna, M.J. (2008). Design and interpretation of
anthropometric and fitness testing of basketball players. Sports Medicine, 38, 565-
578.
Duthie, G., Pyne, D. and Hooper, S. (2003). Applied physiology and game analysis of
rugby union. Sports Medicine, 33, 973-991.
Economos, C.D., Bortz, S.S. and Nelson, M.E. (1993). Nutritional practices of elite
athletes. Practical recommendations. Sports Medicine, 16, 381-399.
Esler, M., Jennings, G., Lambert, G., Meredith, I., Horne, M. and Eisenhofer, G. (1990).
Overflow of catecholamine neurotransmitters to the circulation: source, fate and
functions. Physiological Reviews, 70, 963-985.
Fernandez-Fernandez, J., Sanz-Rivas, D., Sanchez-Muñoz, C., Pluim, B,M., Tiemessen, I.
and Mendez-Villanueva, A. (2009). A comparison of the activity profile and
physiological demands between advanced and recreational veteran tennis players.
Journal of Strength and Conditioning Research, 23, 604-610.

Chapter 10 References
156
Ferrannini, E. (1988). The theoretical bases of indirect calorimetry: A review. Metabolism,
37, 287-301.
Figueroa-Colon, R., Franklin, F.A., Goran, M.I., Lee, J.Y. and Weinsier, R.L. (1996).
Reproducibility of measurement of resting energy expenditure in prepubertal girls.
American Journal of Clinical Nutrition, 64, 533-536.
Flandrois, R., Grandmontagne, M., Gerin, H., Mayet, M.H., Jehl, J.L. and Eyssetta, M.
(1986). Aerobic performance capacity in paraplegic subjects. European Journal of
Applied Physiology and occupational physiology, 55, 604-609.
Foster, M.R. (2009). Spina Bifida [online]. Available at:<http://emedicine.medscape.com
/article/ 311113-overview> [Accessed August 2009].
Frayn, K.N. (1983). Calculation of substrate oxidation rates in vivo from gaseous exchange.
Journal of Applied Physiology, 55, 628-634.
Frogley, M. (1999). Wheelchair skills workout. Sport ‘n Spokes, 25, 46-47.
Gall, A., Horne, D., Kennedy, P., Turner-Stokes, L. and Tussler, D eds. (2008). Chronic
spinal cord injury: management of patients in acute hospital settings. National
guidelines (concise guidance to good practice). London: Royal College of
Physicians.
Gallagher, D., Belmonte, D., Deurenberg, P., Wang, Z., Krasnow, N., Pi-Sunyer, F.X. and
Heymsfield, S.B. (1998). Organ-tissue mass measurement allows modeling of REE
and metabolically active tissue mass. American Journal of Physiology
Endocrinology and Metabolism, 275, E249-E258.
Gil-Agudo, A., Del Ama-Espinosa, A. and Crespo-Ruiz, B. (2010). Wheelchair basketball
quantification. Physical Medicine and Rehabilitation Clinics of North America, 21,
141-156.
Ginis, K.A., Latimer, A.E., Hicks, A.L. and Craven, B.C. (2005). Development and
evaluation of an activity measure for people with spinal cord injury. Medicine and
Science in Sports and Exercise, 37, 1099-1111.

Chapter 10 References
157
Ginis, K. A., Latimer, A.E., Buchholz, A.C., Bray, S.R., Craven, B.C., Hayes, K.C., Hicks,
A.L., McColl, M.A., Potter, P.J., Smith, K. and Wolfe, D.L. (2008). Establishing
evidence-based physical activity guidelines: methods for the Study of Health and
Activity in People with Spinal Cord Injury (SHAPE SCI). Spinal Cord, 46, 216-
221.
Glaser, R.M., Sawaka, M.N., Laubach, L.L. and Suryaprasad, A.G. (1979). Metabolic and
cardiopulmonary responses to wheelchair and bicycle ergometry. Journal of
Applied Physiology, 46, 1066-1070.
Godfrey, R. and Whyte, G. (2006). Training Specificity. In: G. Whyte, ed. N. Spurway and
D. MacLaren, series eds. The Physiology of Training. London: Churchill,
Livingstone, Elsevier, pp 23–44.
Goosey, V.L., Campbell, I.G. and Fowler, N.E. (2000). Effect of push frequency on the
economy of wheelchair racers. Medicine and Science in Sports and Exercise, 32,
174-181.
Goosey-Tolfrey, V.L., Batterham, A.M. and Tolfrey, K. (2003)
O2peak in trained wheelchair athletes. Medicine and Science in Sports and Exercise,
35, 2106-2111.
Goosey-Tolfrey, V.L. and Tofrey, K. (2004). The oxygen uptake-heart rate relationship in
trained female wheelchair athletes. Journal of Rehabilitation Research and
Development, 41, 415-420.
Goosey-Tolfrey, V.L. (2005). Physiological profiles of elite wheelchair basketball players
in preparation for the 2000 Paralympic Games. Adapted Physical Activity Quarterly,
22, 57-66.
Goosey-Tolfrey, V.L. and Moss, A.D. (2005). Wheelchair velocity of tennis players during
propulsion with and without the use of racquets. Adapted Physical Activity
Quarterly, 22, 291-301.
Goosey-Tolfrey, V., Castle, P., Webborn, N. and Abel, T. (2006). Aerobic capacity and
peak power output of elite quadriplegic games players. British Journal of Sports
Medicine, 40, 684-687.
Chapter 10 References
158
Goosey-Tolfrey, V.L. and Price, M. (2010). Physiology of wheelchair sport. In: V.L.
Tolfrey, ed. Wheelchair Sport, a complete guide for athletes, coaches and teachers.
Champaign, Illinios: Human Kinetics. pp. 47-62.
Goosey-Tolfrey, V.L., West, M., Lenton, J.P. and Tolfrey, K. (2011). Influence of varied
tempo music on wheelchair mechanical efficiency following 3-week practice.
International Journal of Sports Medicine, 32, 126-131.
Goran, M.I. and Poehlman, E.T. (1992). Endurance training does not enhance total energy
expenditure in healthy elderly persons. American Journal of Physiology, 263,
E950-E957.
Grange, C.C., Bougenot, M.P., Groslambert, A., Tordi, N. and Rouillon, J.D. (2002).
Perceived exertion and rehabilitation with wheelchair ergometer: comparison
between patients with spinal cord injury and healthy subjects. Spinal Cord, 40, 513-
518.
Haisma, J.A., van der Woude, L.H., Stam, H.J., Bergen, M.P., Sluis, T.A. and Bussmann,
J.B. (2006). Physical capacity in wheelchair-dependent persons with a spinal cord
injury: a critical review of the literature. Spinal Cord, 44, 642–652.
Hansen, J.E., Casaburi, R., Cooper, D.M. and Wasserman, K. (1988). Oxygen uptake as
related to work rate increment during cycle ergometer exercise. European Journal
of Applied Physiology and Occupational Physiology, 57, 140-145.
Harker, J. (2006). Wound healing complications associated with lower limb amputation
[online]. Available at:<http://www.worldwidewounds.com/2006/september
/Harker/Wound-Healing-Complications-Limb-Amputation.html>[Accessed August
2009].
Hawes, M.R. and Martin, A.D. (2004). Human body composition. In R. Eston and T.
Reilly, eds. Kinanthropometry and Exercise Physiology Laboratory Manual: Tests,
Procedures and Data. Volume 1. Anthropometry. 2nd
Edition. London: E and FN
Spon. pp 7-43.

Chapter 10 References
159
Hayes, A.M., Myers, J.N., Ho, M., Lee, M.Y., Perkash, I. and Kiratli, B.J. (2005). Heart
rate as a predictor of energy expenditure in people with spinal cord injury. Journal
of Rehabilitation Research and Development, 42, 617-624.
Henry, C.J. (2005). Basal metabolic rate studies in humans: measurement and development
of new equations. Public Health Nutrition, 8, 1133-1152.
Heshka, S., Yang, M.U., Wang, J., Burt, P. and Pi-Sunyer, F.X. (1990). Weight loss and
change in resting metabolic rate. American Journal of Clinical Nutrition, 52, 981-
986.
Heymsfield, S.B., Gallagher, D., Kotler, D.P., Wang, Z., Allison, B. and Heshka, S. (2002).
Body size dependence of resting energy expenditure can be attributed to
nonenergetic homogeneity of fat-free mass. American Journal of Physiology.
Endocrinology and Metabolism, 282, E132–E138.
Hildebrandt., G., Voigt, E.D., Bahn, D., Berendes, B. and Kröger, J. (1970). Energy costs
of propelling wheelchair at various speeds: cardiac response and effect on steering
accuracy. Archives of Physical Medicine and Rehabilitation, 51, 131-136.
Hiremath, S.V. and Ding, D. (2009). Evaluation of activity monitors to estimate energy
expenditure in manual wheelchair users. Annual International Conference of the
IEEE Engineering in Medicine and Biology Society, Minnesota, 2-6 September,
835-838.
Holmér, I. (1972). Oxygen uptake during swimming in man. Journal of Applied
Physiology, 33, 502-509.
Hooker, S.P. and Wells, C.L. (1992). Aerobic power of competitive paraplegic road racers.
Paraplegia, 30, 428-436.
Hooker, S.P., Greenwood, J.D., Hatae, D.T., Husson, R.P., Matthiesen, T.L. and Waters,
A.R. (1993). Oxygen uptake and heart rate relationship in persons with spinal cord
injury. Medicine and Science in Sports and Exercise, 25, 1115-1119.

Chapter 10 References
160
Hopman, M.T. (1994). Circulatory responses during arm exercise in individuals with
paraplegia. International Journal of Sports Medicine, 15, 126-131.
Hopman, M.T., Houtman, S., Groothuis, J.T. and Folgering, H.T. (2004). The effect of
varied fractional inspired oxygen on arm exercise performance in spinal cord injury
and able-bodied persons. Archives of Physical Medicine and Rehabilitation, 85,
319-323.
Huonker, M., Schmid, A., Sorichter, S., Schmidt-Trucksäb, A., Mrosek, P. and Keul, J.
(1998). Cardiovascular differences between sedentary and wheelchair-trained
subjects with paraplegia. Medicine and Science in Sports and Exercise, 30, 609-613.
Illner, K., Brinkmann, G., Heller, M., Bosy-Westphal, A. and Müller, M.J. (2000).
Metabolically active components of fat free mass and resting energy expenditure in
nonobese adults. American Journal of Physiology, Endocrinology and Metabolism,
278, E308-E315.
Ingham, S.A., Carter, H., Whyte, G.P. and Doust, J.H. (2007). Comparison of the oxygen
uptake kinetics of club and Olympic champion rowers. Medicine and Science in
Sports and Exercise, 39, 865–871.
International Wheelchair Basketball Federation (IBWF). (2009) Classification
Commissions Function. Available at:<http://www.iwbf.org/index.php
/commissions /classification/ functions> [Accessed March 2011].
International Wheelchair Tennis Federation (ITF) (2011a). Quad Tennis Classification
Manual. Available at: <http://www.itftennis.com/shared/medialibrary/pdf/original/
IO_54618_ original.PDF> [Accessed September 2011].
International Wheelchair Tennis Federation (ITF) (2011b). Eligibility rules. Available at:
<http://www.itftennis.com/wheelchair/rules/eligibilityrules.asp> [Accessed
September 2011].
International Wheelchair Rugby Federation (IWRF) (2009). About wheelchair rugby.
Available at: <http://www.iwrf.com/history.htm> [Accessed August 2009].

Chapter 10 References
161
Inukai, Y., Takahashi, K., Wang, D.H. and Kira, S. (2006). Assessment of total and
segmental body composition in spinal cord-injured athletes in Okayama prefecture
of Japan. Acta Medica Okayama, 60, 99-106.
Ivy, J.L., Costill, D.L., Van Handel, P.J., Essig, D.A. and Lower, R.W. (1981). Alteration
in the lactate threshold with changes in substrate availability. International Journal
of Sports Medicine, 2, 139-142.
Jackson, A.S., Stanforth, P.R., Gagnon, J., Rankinen, T., Leon, A.S., Rao, D.C., Skinner, J.
S., Bouchard, C. and Wilmore, J.H. (2002). The effect of sex, age and race on
estimating percentage body fat from body mass index: The Heritage Family Study.
International Journal of Obesity and Related Metabolic Disorders 26, 789–796.
Jacobs, P.L. and Nash, M.S. (2004). Exercise recommendations for individuals with spinal
cord injury. Sports Medicine, 34, 727-751.
Janssen, T.W., van Oers, C.A., van der Woude, L.H. and Hollander, A.P. (1994). Physical
strain in daily life of wheelchair users with spinal cord injuries. Medicine and
Science in Sports and Exercise, 26, 661-670.
Janssen, T.W., Dallmeijer, A.J., Veeger, D.H. and van der Woude, L.H. (2002). Normative
values and determinants of physical capacity in individuals with spinal cord injury.
Journal of Rehabilitation, Research and Development, 39, 29-39.
Jéquier, E., Acheson, K. and Schutz, Y. (1987). Assessment of energy expenditure and fuel
utilisation in man. Annual Reviews in Nutrition, 7, 187-208.
Jeon, J.Y., Steadward, R.D., Wheeler, G.D., Bell, G., McCargar, L. and Harber, V. (2003).
Intact sympathetic nervous system is required for leptin effects on resting metabolic
rate in people with spinal cord injury. Journal of Clinical Endocrinology and
Metabolism, 88, 402-407.
Jeukendrup, A.E. and Wallis, G.A. (2005). Measurement of substrate oxidation during
exercise by means of gas exchange measurements. International Journal of Sports
Medicine, 26, S28-S37.
Chapter 10 References
162
Johnstone, A.M., Murison, S.D., Duncan, J.S., Rance, K.A. and Speakman, J.R. (2005).
Factors influencing variation in basal metabolic rate include fat-free mass, fat mass,
age, and circulating thyroxine but not sex, circulating leptin, or triiodothyronine.
American Journal of Clinical Nutrition, 82, 941–948.
Jones L,M., Legge, M. and Goulding, A. (2003). Healthy body mass index values often
underestimate body fat in men with spinal cord injury. Archives of Physical
Medicine and Rehabilitation, 84, 1068-1071.
Keyser, R.E., Rodgers, M.M., Gardner, E.R. and Russell, P,J. (1999). Oxygen uptake
during peak graded exercise and single-stage fatigue tests of wheelchair propulsion
in manual wheelchair users and the able-bodied. Archives of Physical Medicine and
Rehabilitation, 80, 1288-1292.
König, D., Huonker, M., Schmid, A., Halle, M., Berg, A. and Keul, J. (2001).
Cardiovascular, metabolic, and hormonal parameters in professional tennis players.
Medicine and Science in Sports and Exercise, 33, 654-658.
Kovacs, M.S. (2007). Tennis physiology: Training the competitive athlete. Sports
Medicine, 37, 189-198.
Laffont, I., Julia, M., Tiffreau, V., Yelnik, A., Herisson, C. and Pelissier, J. (2010). Aging
and sequelae of poliomyelitis. Annals of Physical and Rehabilitation Medicine, 53,
24–33.
Lakomy, H.K., Campbell, I. and Williams, C. (1987). Treadmill performance and selected
physiological characteristics of wheelchair athletes. British Journal of Sports
Medicine, 21, 130-133.
Lay, B.S., Sparrow, W.A., Hughes, K.M. d O’Dwy , N J. (2002). Practice effects on
coordination and control, metabolic energy expenditure and muscle activation.
Human Movement Science, 21, 807–830.
Leicht, C.A., Bishop, N.C. and Goosey-Tolfrey, V.L. (2011). Mucosal immune responses
to treadmill exercise in elite wheelchair athletes. Medicine and Science in Sports
and Exercise, 43, 1414-1421.

Chapter 10 References
163
Lemmer, J.T., Ivey, F.M., Ryan, A.S., Martel, G.F., Hurlbut, D.E., Metter, J.E., Fozard,
J.L., Fleg, J.L. and Hurley, B.F. (2001). Effect of strength training on resting
metabolic rate and physical activity: age and gender comparisons. Medicine and
Science in Sports and Exercise, 33, 532-541.
Lenton, J.P., Fowler, N.E., van der Woude, L.H. and Goosey-Tolfrey, V.L. (2008a).
Wheelchair propulsion: effects of experience and push strategy on efficiency and
perceived exertion. Applied Physiology, Nutrition and Metabolism-Physiologie
Appliquee Nutrition Et Metabolisme, 33, 870-879.
Lenton, J.P., Fowler, N.E., van der Woude, L.H. and Goosey-Tolfrey, V.L. (2008b).
Efficiency of wheelchair propulsion and effects of strategy. International Journal
of Sports Medicine, 29, 384-389.
Lenton, J.P., van der Woude, L.H., Fowler, N.E. and Goosey-Tolfrey, V.L. (2009). Effects
of arm frequency during synchronous and asynchronous wheelchair propulsion on
efficiency. International Journal of Sports Medicine, 30, 233-239.
Liusuwan, R.A., Widman, L.M., Abresch, R.T., Styne, D.M. and McDonald, C.M. (2007).
Body composition and resting energy expenditure in patients aged 11 to 21 years
with spinal cord dysfunction compared to controls: comparisons and relationships
among the groups. Journal of Spinal Cord Medicine, 30, S105-S111.
Lohman, T.G. (1996). Dual x-ray absorptiometry. In: A.F. Roche, S.B. Heymsfield and
T.G. Lohman. eds. Human Body Composition. Champaign, Illinois: Human
Kinetics. pp. 63-78.
Maggioni, M., Bertoli, S., Margonato, V., Merati, G., Veicsteinas, A. and Testolin, G.
(2003). Body composition assessment in spinal cord injury subjects. Acta
Diabetologica, 40, S183-S186.
Marfell-Jones, M., Olds, T., Stewart, A. and Carter, J.E.L. (2006). International standards
for anthropometric assessment. Potchefstroom, South Africa: The International
Society for the Advancement of Kinanthropometry.
Chapter 10 References
164
Marsh, A.P. and Martin, P.E. (1997). Effect of cycling experience, aerobic power and
power output on preferred and most economical cycling cadences. Medicine and
Science in Sports and Exercise, 29, 1225-1232.
Maynard, F.M., Bracken, M.B., Creasey, G., Ditunno, J.F., Donovan, W.H., Ducker, T.B.,
Garber, S.L., Marino, R.J., Stover, S.L., Tator, C.H., Waters, R.L., Wilberger, J.E.
and Young, W. (1997). International standards for neurological and functional
classification of spinal cord injury. Spinal Cord, 35, 266-274.
McArdle, W.D., Katch, F.I. and Katch, V.L. (2001). Exercise Physiology. Energy,
Nutrition and Human Performance. Philadelphia, USA: Lippincott Williams and
Wilkins.
McLaren, D. (1990). Court games: volleyball and basketball. In T. Reilly, N. Secher, P.
Snell and C. Williams, eds. Physiology of Sports. London: E & FN Spon. pp.427-
464.
Mifflin, M.D., St Jeor, S,T., Hill, L.A., Scott, B.J., Daugherty, S.A. and Koh, Y.O. (1990).
A new predictive equation for resting energy expenditure in healthy individuals.
American Journal of Clinical Nutrition, 51, 241-247.
Miyahara, K, Wang, D.H., Mori, K., Takahashi, K., Miyatake, N., Wang, B.L., Takigawa,
T., Takaki, J. and Ogino, K. (2008). Effect of sports activity on bone mineral
density in wheelchair athletes. Journal of Bone and Mineral Metabolism, 26, 101-
106.
Mojtahedi, M.C., Valentine, R.J., Arngrímsson, S.A., Wilund, K.R. and Evans, E.M.
(2008). The association between regional body composition and metabolic
outcomes in athletes with spinal cord injury. Spinal Cord, 46, 192–197.
Mollinger, L.A., Spurr, G.B., el Ghatit, A.Z., Barboriak, J.J., Rooney, C.B., Davidoff, D.D.
and Bongard, R.D. (1985). Daily energy expenditure and basal metabolic rates in
patients with spinal cord injury. Archives of Physical Medicine and Rehabilitation,
66, 420-426.
Monroe, M.B., Tataranni, P.A., Pratley, R., Manore, M.M., Skinner, J.S. and Ravussin, E.
(1998). Lower daily energy expenditure as measured by a respiratory chamber in

Chapter 10 References
165
subjects with spinal cord injury compared with control subjects. American Journal
of Clinical Nutrition, 68, 1223–1227.
Morgulec-Adamowicz, N., Kosmol, A., Molik, B., Yilla, A.B. and Laskin, J.J. (2011).
Aerobic, anaerobic and skill performance with regards to classification in
wheelchair rugby athletes. Research Quarterly for Exercise and Sport, 82, 61-69.
Mukherjee, G., Bhowik, P. and Samanta, A. (2002). Energy cost of manual wheelchair
propulsion at different speeds. International Journal of Rehabilitation Research,
25, 71-75.
Müller, M.J., Bosy-Westphal, A., Klaus, S., Kreymann, G., Lührmann, P.M., Neuhäuser-
Berthold, M., Noack, R., Pirke, K.M., Platte, P., Selberg, O. and Steiniger, J.
(2004). World Health Organization equations have shortcomings for predicting
resting energy expenditure in persons from a modern, affluent population:
generation of a new reference standard from a retrospective analysis of a German
database of resting energy expenditure. American Journal of Clinical Nutrition, 80,
1379–1390.
Neumann, D.A. (2004). Polio: Its impact on the people of the United States and the
emerging profession of physical therapy. Journal of Orthopaedic and Sports
Physical Therapy, 34, 479-492.
Olle, M.M., Pivarnik, J.M., Klish, W.J. and Morrow, J.R. (1993). Body composition of
sedentary and physically active spinal cord injured individuals estimated from total
body electrical conductivity. Archives of Physical Medicine and Rehabilitation, 74,
706-710.
Owen, E. (1982). Playing and coaching wheelchair basketball. Champaign, Illinios:
University of Illinios Press.
Owen, O.E., Holup, J.L., D’Alessio, D.A., Craig, E.S., Polansky, M., Smalley, K.J., Kavle,
E.C., Bushman, M.C., Owen, L.R., Mozzoli, M.A., Kendrick, Z.V. and Boden, G.H.
(1987). A reappraisal of the caloric requirements of men. American Journal of
Clinical Nutrition, 46, 875-885.

Chapter 10 References
166
Paffenbarger, R.S., Hyde, R.T., Wing, A.L. and Hsieh, C.C. (1986). Physical activity, all-
cause mortality and longevity of college alumni. New England Journal of Medicine,
314, 605-613.
Pannier, J.L., Vrijens, J. and van Cauter, C. (1980). Cardiorespiratory response to treadmill
and bicycle exercise in runners. European Journal of Applied Physiology and
Occupational Physiology, 43, 243-251.
Passmore, R. and Durnin, J. (1955). Human energy expenditure. Physiological Reviews,
35, 801-840.
Pérez, J., Rabadán, M., Pacheco, J.L. and Sampedro, J. (2007). Heart rate assessment
during wheelchair basketball competition: Its relationship with functional
classification and specific training design. In C Higgs and Y Vanlandewijck, eds.
Sport for Persons with a Disability.Perspectives. Vol.7. Berlin: International
Council of Sport Science and Physical Education. pp. 151–174.
Péronnet, F. and Massicotte, D. (1991). Table of nonprotein respiratory quotient: an update.
Canadian Journal of Sport Sciences, 16, 23-29.
Poehlman, E.T., Melby, C.L. and Badylak, S.F. (1988). Resting metabolic rate and
postprandial thermogenesis in highly trained and untrained males. American
Journal of Clinical Nutrition, 47, 793-798.
Price, M.J. and Campbell, I.G. (1999). Thermoregulatory and physical responses of
wheelchair athletes to prolonged arm crank and wheelchair exercise. International
Journal of Sports Medicine, 20, 457-463.
Price, M.J. (2006). Thermoregulation during exercise in individuals with spinal cord
injuries. Sports Medicine, 36, 863-879.
Price, M.J. (2010). Energy expenditure and metabolism during exercise in persons with a
spinal cord injury. Sports Medicine, 40, 681-696.
Price, M,J., Bottoms, L., Smith, P.M. and Nicholettos, A. (2011). The effects of an
increasing versus constant crank rate on peak physiological responses during
incremental arm crank ergometry. Journal of Sports Sciences, 29, 263-269.
Chapter 10 References
167
Ramirez-Zea, M. (2005). Validation of three predictive equations for basal metabolic rate
in adults. Public Health Nutrition, 8, 1213-1228.
Ravussin, E. Burnand, B., Schutz, Y. and Jéquier, E. (1982). Twenty-four-hour energy
expenditure and resting metabolic rate in obese, moderately obese and control
subjects. American Journal of Clinical Nutrition, 35, 566-573.
Ravussin, E. and Bogardus, C. (1989). Relationship of genetics, age, and physical fitness to
daily energy expenditure and fuel utilization, American Journal of Clinical
Nutrition, 49, 968-975.
Reilly, T. (1990a). The racquet sports. In T. Reilly, N. Secher, P. Snell and C. Williams,
eds. Physiology of Sports. London: E & FN Spon. pp.337-370.
Reilly, T. (1990b). Football. In T. Reilly, N. Secher, P. Snell and C. Williams, eds.
Physiology of Sports. London: E & FN Spon. pp. 371-426.
Reilly, T. and Crosland, J. (2010). Nutrition and body composition. In V. Goosey-Tolfrey,
ed. Wheelchair Sport. A complete guide for athletes, coaches and teachers.
Champaign, Illinios: Human Kinetics. pp. 75-86.
Rice, I., Gagnon, D., Gallagher, J. and Boninger, M. (2010). Hand rim wheelchair
propulsion training using biomechanical real-time visual feedback based on motor
learning theory principles. Journal of Spinal Cord Medicine, 33, 33-42.
Roy, J.L., Menear, K.S., Schmid, M.M., Hunter, G.R. and Malone, L.A. (2006).
Physiological responses of skilled players during a competitive wheelchair tennis
match. Journal of Strength and Conditioning Research, 20, 665–671.
Roza, A.M. and Shizgal, H.M. (1984). The Harris Benedict equation re-evaluated: resting
energy requirements and the body cell mass. American Journal of Clinical
Nutrition, 40, 168-182.
Rozendaal, L.A., Veeger, H.E. and van der Woude, L.H. (2003). The push force pattern in
manual wheelchair propulsion as a balance between cost and effect. Journal of
Biomechanics, 36, 239-247.

Chapter 10 References
168
Sarro, K.L., Misuta, M.S., Burkett, B., Malone, L.A. and Barros, R.M. (2010). Tracking of
wheelchair rugby players in the 2008 Demolition Derby final. Journal of Sport
Sciences, 28, 193-200.
Sawka, M.N., Glaser, R.M., Wilde, S.W. and von Luhrte, T.C. (1980). Metabolic and
circulatory responses to wheelchair and arm crank exercise. Journal of Applied
Physiology, 49, 784-788.
Sedlock, D.A. and Laventure, S.J. (1990). Body composition and resting energy
expenditure in long term spinal cord injury. Paraplegia, 28, 448-454.
Seliger, V. (1968). Energy metabolism in selected physical exercises. Internationale
Zeitschrift fur angewandte Physiologie, einschliesslich Arbeitsphysiologie, 25, 104-
120.
Schmid, A., Huonker, M., Barturen, J.M., Stahl, F., Schmidt-Trucksäss, A., König D.,
Grathwohl, D., Lehmann, M. and Keul, J. (1998a). Catecholamines, heart rate, and
oxygen uptake during exercise in persons with spinal cord injury. Journal of
Applied Physiology, 85, 635-641.
Schmid, A., Huonker, M., Stober, P., Barturen, J.M., Schmidt-Trucksäss, A., Dürr, H.,
Völpel, H.J. and Keul, J. (1998b). Physical performance and cardiovascular and
metabolic adaptation of elite female wheelchair basketball players in wheelchair
ergometry and in competition. American Journal of Physical Medicine and
Rehabilitation, 77, 527-533.
Schneider, D.A., Sedlock, D.A., , d , O2peak and the gas-
exchange anaerobic threshold during incremental arm cranking in able-bodied and
paraplegic men. European Journal of Applied Physiology and Occupational
Physiology, 80, 292-297.
Schofield, W.N. (1985). Predicting basal metabolic rate, new standards and review of
previous work. Human Nutrition: Clinical Nutrition, 39, 5-41.
Skrinar, G.S., Evans, W.J., Ornstein, L.J. and Brown, D.A. (1982). Glycogen utilisation in
wheelchair-dependent athletes. International Journal of Sports Medicine, 3, 215-
219.

Chapter 10 References
169
Sparrow, W.A., Hughes, K.M., Russell, A.P. and Le Rossignol, P.F. (1999). Effects of
practice and preferred rate on perceived exertion, metabolic variables and
movement control. Human Movement Science, 18, 137-153.
Sporner, M.L., Grindle, G.G., Kelleher, A., Teodorski, E.E., Cooper, R. and Cooper, R.A.
(2009). Quantification of activity during wheelchair basketball and rugby at the
national veterans wheelchair games: A pilot study. Prosthetics and Orthotics
International, 33, 210-217.
Šp y á, Š d P řizková, J. (1971). Functional capacity and body composition in top
weight-lifters, swimmers, runners and skiers. Internationale Zeitschrift für
Angewandte Physiologie, Einschliesslich Arbeitsphysiologie, 29, 184-194.
Spungen, A.M., Wang, J., Pierson, R.N. and Bauman, W.A. (2000). Soft tissue body
composition differences in monozygotic twins discordant for spinal cord injury.
Journal of Applied Physiology, 88, 1310-1315.
Spungen, A.M., Adkins, R.H., Stewart, C.A., Wang, J., Pierson, R.N., Waters, R.L. and
Bauman, W.A. (2003). Factors influencing body composition in persons with spinal
cord injury: a cross-sectional study. Journal of Applied Physiology, 95, 2398-2407.
Spurr, G.B., Prentice, A.M., Murgatroyd, P.R., Goldberg, G.R., Reina, J.C. and Christman,
N.T. (1988). Energy expenditure from minute-by-minute heart-rate recording:
comparison with indirect calorimetry. American Journal of Clinical Nutrition, 48,
552-559.
Stainsby, W.N., Gladden, L.B., Barclay, J.K and Wilson, B.A. (1980). Exercise efficiency:
validity of base-line subtractions. Journal of Applied Physiology, 48, 518-522.
Stallknecht, B., Lorentsen, J., Envoldsen, L.H., Bülow, J., Biering-Sørensen, F., Galbo, H.
and Kjær, M. (2001). Role of the sympathoadrenergic system in adipose tissue
metabolism during exercise in humans. Journal of Physiology, 536, 283-294.
Steinberg, L.L., Lauro, F.A., Sposito, M.M., Tufik, S., Mello, M.T., Naffah-Mazzacoratti,
M.G., Cavalheiro, E.A. and Silva, A.C. (2000). Catecholamine response to exercise
in individuals with different levels of paraplegia. Brazilian Journal of Medical and
Biological Research, 33, 913-918.
Chapter 10 References
170
Stewart, A.D. and Hannan, W.J. (2000). Prediction of fat and fat-free mass in male athletes
using dual X-ray absorptiometry as the reference method. Journal of Sports
Sciences, 18, 263-274.
Stølen, T., Chamari, K., Castagna, C. and Wilsløff, U. (2005). Physiology of soccer: an
update. Sports Medicine, 35, 501-536.
Sugarman, B. (1985). Medical complications of spinal cord injury. The Quarterly Journal
of Medicine, 54, 3-18.
Suriano, R. and Bishop, D. (2010). Physiological attributes of triathletes. Journal of
Science and Medicine in Sport, 13, 340-347.
Sutton, L., Wallace, J., Goosey-Tolfrey, V., Scott, M. and Reilly, T. (2009). Body
composition of female wheelchair athletes. International Journal of Sports
Medicine, 30, 259-265.
Teasell, R.W., Arnold, J.M., Krassioukov, A. and Delaney, G.A. (2000). Cardiovascular
consequences of loss of supraspinal control of the sympathetic nervous system after
spinal cord injury. Archives of Physical Medicine and Rehabilitation, 81, 506-516.
Thompson, J.L., Arons, D., Morjig, K. and Baldini, F.D. (1995). Resting metabolic rate
and energy intake of elite wheelchair athletes. Journal of the American College of
Sports Medicine, 27, S145.
Tolerico, M.L., Ding, D., Cooper, R.A., Spaeth, D.M., Fitzgerald, S.G., Cooper, R.,
Kelleher, A. and Boninger, M.L. (2007). Assessing mobility characteristics and
activity levels of manual wheelchair users. Journal of Rehabilitation Research and
Development, 44, 561-571.
Tolfrey, K., Goosey-Tolfrey, V.L. and Campbell, I.G. (2001). Oxygen uptake-heart rate
relationship in elite wheelchair racers. European Journal of Applied Physiology, 86,
174-178.
Totora, G.J. and Grabowski, S.R. (2003). Principles of Anatomy and Physiology. Tenth
Edition. Danvers, MA: John Wiley & Sons.

Chapter 10 References
171
Tweedy, S. and Diaper, N. (2010). Introduction to wheelchair sport. In V. Goosey-Tolfrey,
ed. Wheelchair Sport, a complete guide for athletes, coaches and teachers. Human
Kinetics: Champaign, Illinois. pp 3-28.
Usita, C.K., Ord, R.M., Perez, A.T. and McCann, D.J. (2003). The metabolic cost of
recreational full court wheelchair basketball. Medicine and Science in Sports and
Exercise, 35, S347.
van den Berg, R., de Groot, S., Swart, K.M. and van der Woude, L.H. (2010).
Physical capacity after 7 weeks of low-intensity wheelchair training. Disability and
Rehabilitation, 32, 2244–2252.
van der Woude, L.H., de Groot, G., Hollander, A.P., van Ingen Schenau, G.J. and
Rozendal, R.H. (1986). Wheelchair ergonomics and physiological testing of
prototypes. Ergonomics, 29, 1561-1573.
van der Woude, L.H., Hendrich, K.M., Veeger, H.E., van Ingen Schenau, G.J., Rozendal,
R.H., de Groot, G. and Hollander, A.P. (1988). Manual wheelchair propulsion:
effects of power output on physiology and technique. Medicine and Science in
Sports and Exercise, 20, 70-78.
van der Woude, L.H., Veeger, H.E. and Rozendal, R.H. (1989a). Ergonomics of
wheelchair design: A prerequisite for optimum wheeling conditions. Adapted
Physical Activity Quarterly, 6, 109-132.
van der Woude, L.H., Veeger, H.E., Rozendal, R.H. and Sargeant, A.J. (1989b). Optimum
cycle frequencies in hand-rim wheelchair propulsion. Wheelchair propulsion
technique. European Journal of Applied Physiology and Occupational Physiology,
58, 625-632.
van der Woude, L., Bakker, W., Elkhuizen, J., Veeger, H. and Gwinn, T. (1998).
Propulsion technique and anaerobic work capacity in elite wheelchair athletes:
cross-sectional analysis. American Journal of Physical Medicine and Rehabilitation,
77, 222-234.
Chapter 10 References
172
van der Woude, L.H., van Croonenborg, J.J., Wolff, I., Dallmeijer, A.J. and Hollander, A.P.
(1999). Physical work capacity after 7 wk of wheelchair training: effect of intensity
in able-bodied subjects. Medicine and Science in Sports and Exercise, 31, 331-341.
van der Woude, L.H., Veeger, H.E., Dallmeijer, A.J., Janssen, T.W. and Rozendaal, L.A.
(2001). Biomechanics and physiology in active manual wheelchair propulsion.
Medical Engineering and Physics, 23, 713–733.
van der Woude, L.H., Bouten, C., Veeger, H.E. and Gwinn, T. (2002). Aerobic work
capacity in elite wheelchair athletes: a cross-sectional analysis. American Journal
of Physical Medicine and Rehabilitation, 81, 261-71.
van der Woude, L.H., Bouw, A., van Wegen, J., van As, H., Veeger, D. and de Groot, S.
(2009). Seat height: Effects on submaximal hand rim wheelchair performance
during spinal cord injury rehabilitation. Journal of Rehabilitation Medicine, 41,
143-149.
Vanlandewijck, Y.C., Spaepen, A.J. and Lysens, R.J. (1994a). Wheelchair propulsion
efficiency: movement pattern adaptations to speed changes. Medicine and Science
in Sports and Exercise, 26, 1373-1381.
Vanlandewijck, Y.C., Spaepen, A.J. and Lysens, R.J. (1994b). Wheelchair propulsion:
functional ability dependent factors in wheelchair basketball players. Scandinavian
Journal of Rehabilitation Medicine, 26, 37-48.
Vanlandewijck, Y.C., Spaepen, A.J. and Lysens, R.J. (1995). Relationship between the
level of physical impairment and sports performance in elite wheelchair basketball
athletes. Adapted Physical Activity Quarterly, 12, 139-150.
Vanlandewijck, Y., Theisen, D. and Daly, D. (2001). Wheelchair propulsion biomechanics:
implications for wheelchair sports. Sports Medicine, 31, 339-367.
Vanlandewijck., Y.C., Evaggelinou, C., Daly, D.D., Van Houtte, S., Verellen, J.,
Aspeslagh, V., Hendrickx, R., Piessens, T. and Zwakhoven, B. (2003).
Proportionality in wheelchair basketball classification. Adapted Physical Activity
Quarterly, 20, 369-380.
Vanlandewijck, Y.C., Evaggelinou, C., Daly, D.J., Verellen, J., Van Houtte, S., Aspeslagh,
V., Hendrickx, R., Piessens, T. and Zwakhoven, B. (2004). The relationship
between functional potential and field performance in elite female wheelchair
basketball players. Journal of Sports Sciences, 22, 668-675.
Chapter 10 References
173
Veeger, H.E., Hadj, Y.M., van der Woude, L.H.. and Charpentier, P. (1991). Peak oxygen
uptake and maximal power output of Olympic wheelchair-dependent athletes.
Medicine and Science in Sports and Exercise, 23, 1201-1209.
Veeger, H.E., van der Woude, L.H. and Rozendal, R.H. (1992a). Effect of handrim
velocity on mechanical efficiency in wheelchair propulsion. Medicine and Science
in Sports and Exercise, 24, 100-107.
Veeger, H.E., Lute, E.M., Roeleveld, K. and van der Woude, L.H. (1992b). Differences in
performance between trained and untrained subjects during a 30-s sprint test in a
wheelchair ergometer. European Journal of Applied Physiology and Occupational
Physiology, 64, 158-164.
Veeger, H.E., van der Woude., L.H. and Rozendal, R.H. (1992c). A computerized
wheelchair ergometer. Results of a comparison study. Scandinavian Journal of
Rehabilitation Medicine, 24, 17-23.
Vinet, A., Le Gallais, D., Bernard, P.L., Poulain, M., Varray, A., Mercier, J. and Micallef,
J.P. (1997). Aerobic metabolism and cardioventilatory responses in paraplegic
athletes during an incremental wheelchair exercise. European Journal of Applied
Physiology and Occupational Physiology, 76, 455-461.
Wang, Z.M., Heshka, S., Gallagher, D., Boozer, C.N., Kotler, D.P. and Heymsfield, S.B.
(2000). Resting energy expenditure-fat-free mass relationship: new insights
provided by body composition modelling. American Journal of Physiology,
Endocrinology and Metabolism, 279, E539-E545.
Washburn, R.A. and Copay, A.G. (1999). Assessing physical activity during wheelchair
pushing: Validity of a portable accelerometer. Adapted Physical Activity Quarterly,
16, 290-299.
Waters, R.L. and Mulroy, S. (1999). The energy expenditure of normal and pathological
gait. Gait and Posture, 9, 207-231.

Chapter 10 References
174
Wee, S.L., Williams, C., Tsintzas, K. and Boobis, L. (2005). Ingestion of a high-glycemic
index meal increases muscle glycogen storage at rest but augments its utilization
during subsequent exercise. Journal of Applied Physiology, 99, 707-714.
Weinsier, R.L, Schutz, Y. and Bracco D. (1992). Re-examination of the relationship of
resting metabolic rate to fat free mass and to the metabolically active components
of fat free mass in humans. American Journal of Clinical Nutrition, 55, 790-794.
Wells, C.L. and Hooker, S.P. (1990). The spinal injured athlete. Adapted Physical Activity
Quarterly, 7, 265–285.
Weltman, A. (1995). The blood lactate response to exercise. Champaign, Illinois: Human
Kinetics.
Westerterp, K.R. and Goran, M.I. (1997). Relationship between physical activity related
energy expenditure and body composition: a gender difference. International
Journal of Obesity and related metabolic disorders, 21, 184 – 188.
Westerterp, K.R. (1998). Alterations in energy balance with exercise. American Journal of
Clinical Nutrition, 68, S970-S974.
Westerterp, K.R. (2004). Diet induced thermogenesis. Nutrition and Metabolism, 1, 5.
Westerterp, K.R. (2007). Assessment of energy expenditure. In D. MacLaren and N.
Spurway eds. Nutrition and Sport: Advances in Sport and Exercise Science.
Philadelphia: Elsevier. pp.1-20.
Whalley, G.A., Doughty, R.N., Gamble, G.D., Oxenham, H.C., Walsh, H.J., Reid, I.R. and
Baldi, J.C. (2004). Association of fat-free mass and training status with left
ventricular size and mass in endurance-trained athletes. Journal of the American
College of Cardiology, 44, 892-896.
Wilmet, E., Ismail, A.A., Heilporn, A., Welraeds, D. and Bergmann, P. (1995).
Longitudinal study of the bone mineral content and of soft tissue composition after
spinal cord section. Paraplegia, 33, 674-677.
Wilmore, J.H. and Costill, D.L. (1999). Physiology of Sport and Exercise. Champaign,
Illinois: Human Kinetics.
Chapter 10 References
175
World Health Organisation (1985). Energy and protein requirements, Report of a joint
FAO/WHO/UNU Expert Consultation. Geneva.
World Health Organisation (2001). Human energy requirements, Report of a Joint
FAO/WHO/UNU Expert Consultation. Rome, 17th
– 24th
October.
Yamasaki, M., Irizawa, M., Komura, T., Kikuchi, K., Sasaki, H., Kai, K. and Ohdoko, K.
(1992). Daily energy expenditure in active and inactive persons with spinal cord
injury. Journal of Human Ergology, 21, 125-133.
Zurlo, F., Larson, K., Bogardus, C. and Ravussin, E. (1990). Skeletal muscle metabolism is
a major determinant of resting energy expenditure. The Journal of Clinical
Investigation, 86, 1423-1427.
Zwiren, L.D. and Bar-Or, O. (1975). Responses to exercise of Paraplegics who differ in
conditioning level, Medicine and Science in Sports, 7, 94-98.

176
Appendix 1
Croft, L., Dybrus, S., Lenton, J. and Goosey-Tolfrey, V. (2010). A comparison of the
physiological demands of wheelchair basketball and wheelchair tennis. International
Journal of Sports Physiology and Performance, 5, 301-315.

301
International Journal of Sports Physiology and Performance, 2010, 5, 301-315© Human Kinetics, Inc.
The authors are with the Peter Harrison Centre for Disability Sport, School of Sport Exercise and Health Sciences, Loughborough University, Loughborough, England, UK.
A Comparison of the Physiological Demands of Wheelchair Basketball
and Wheelchair Tennis
Louise Croft, Suzanne Dybrus, John Lenton, and Victoria Goosey-Tolfrey
Purpose: To examine the physiological profiles of wheelchair basketball and tennis and specifically to: (a) identify if there are differences in the physiological profiles of wheelchair basketball and tennis players of a similar playing standard, (b) to determine whether the competitive physiological demands of these sports differed (c) and to explore the relationship between the blood lactate [Bla–] response to exercise and to identify the sport specific heart rate (HR) training zones. Methods: Six elite athletes (4 male, 2 female) from each sport performed a submaximal and VO
2peak test in their sport specific wheelchair. Heart rate, VO
2, and [Bla–] were
measured. Heart rate was monitored during international competitions and VO2
was calculated from this using linear regression equations. Individual HR training zones were identified from the [Bla–] profile and time spent within these zones was calculated for each match. Results: Despite no differences in the laboratory assess-ment of HRpeak, the VO
2peak was higher for the basketball players when compared
with the tennis players (2.98 ± 0.91 vs 2.06 ± 0.71; P = .08). Average match HR (163 ± 11 vs 146 ± 16 beats⋅min–1; P = .06) and average VO
2 (2.26 ± 0.06 vs 1.36 ±
0.42 L⋅min−1; P = .02) were higher during actual playing time of basketball when compared with whole tennis play. Consequently, differences in the time spent in the different training zones within and between the two sports existed (P < .05). Conclusions: Wheelchair basketball requires predominately high-intensity training, whereas tennis training requires training across the exercise intensity spectrum.
Keywords: Paralympic sport, training, wheelchair propulsion, heart rate, lactate threshold
Wheelchair basketball and tennis are two of the most popular and renowned sports within the Paralympics, with International competitions being held world-wide. Coaches and sport scientists with an interest in these sports are continually seeking to improve current training methods and optimize sport-specific training.1,2 With that in mind, it is evident that these wheelchair sports involve the aerobic system along with short periods of high-intensity intermittent activity.3,4 However, as with able-bodied sports, to ensure that training reflects the demands of the sport, an understanding of the physiological competitive sporting demands is required.2,5
Appendix I
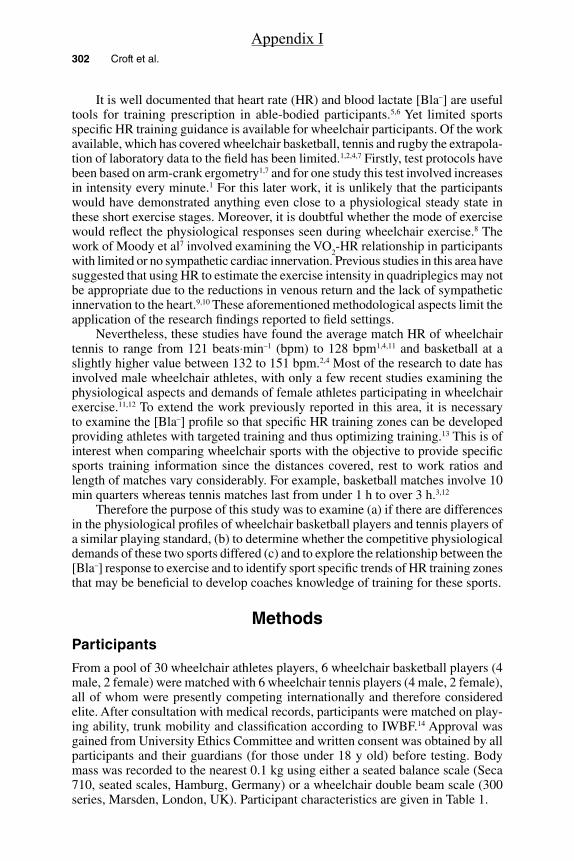
302 Croft et al.
It is well documented that heart rate (HR) and blood lactate [Bla–] are useful tools for training prescription in able-bodied participants.5,6 Yet limited sports specific HR training guidance is available for wheelchair participants. Of the work available, which has covered wheelchair basketball, tennis and rugby the extrapola-tion of laboratory data to the field has been limited.1,2,4,7 Firstly, test protocols have been based on arm-crank ergometry1,7 and for one study this test involved increases in intensity every minute.1 For this later work, it is unlikely that the participants would have demonstrated anything even close to a physiological steady state in these short exercise stages. Moreover, it is doubtful whether the mode of exercise would reflect the physiological responses seen during wheelchair exercise.8 The work of Moody et al7 involved examining the VO
2-HR relationship in participants
with limited or no sympathetic cardiac innervation. Previous studies in this area have suggested that using HR to estimate the exercise intensity in quadriplegics may not be appropriate due to the reductions in venous return and the lack of sympathetic innervation to the heart.9,10 These aforementioned methodological aspects limit the application of the research findings reported to field settings.
Nevertheless, these studies have found the average match HR of wheelchair tennis to range from 121 beats⋅min–1 (bpm) to 128 bpm1,4,11 and basketball at a slightly higher value between 132 to 151 bpm.2,4 Most of the research to date has involved male wheelchair athletes, with only a few recent studies examining the physiological aspects and demands of female athletes participating in wheelchair exercise.11,12 To extend the work previously reported in this area, it is necessary to examine the [Bla–] profile so that specific HR training zones can be developed providing athletes with targeted training and thus optimizing training.13 This is of interest when comparing wheelchair sports with the objective to provide specific sports training information since the distances covered, rest to work ratios and length of matches vary considerably. For example, basketball matches involve 10 min quarters whereas tennis matches last from under 1 h to over 3 h.3,12
Therefore the purpose of this study was to examine (a) if there are differences in the physiological profiles of wheelchair basketball players and tennis players of a similar playing standard, (b) to determine whether the competitive physiological demands of these two sports differed (c) and to explore the relationship between the [Bla–] response to exercise and to identify sport specific trends of HR training zones that may be beneficial to develop coaches knowledge of training for these sports.
MethodsParticipants
From a pool of 30 wheelchair athletes players, 6 wheelchair basketball players (4 male, 2 female) were matched with 6 wheelchair tennis players (4 male, 2 female), all of whom were presently competing internationally and therefore considered elite. After consultation with medical records, participants were matched on play-ing ability, trunk mobility and classification according to IWBF.14 Approval was gained from University Ethics Committee and written consent was obtained by all participants and their guardians (for those under 18 y old) before testing. Body mass was recorded to the nearest 0.1 kg using either a seated balance scale (Seca 710, seated scales, Hamburg, Germany) or a wheelchair double beam scale (300 series, Marsden, London, UK). Participant characteristics are given in Table 1.
Appendix I

303
Tab
le 1
S
po
rt, s
ex, a
ge,
dis
abili
ty a
nd
tra
inin
g c
har
acte
rist
ics
of
the
wh
eelc
hai
r te
nn
is a
nd
bas
ketb
all p
laye
rs
Part
icip
ant
Spo
rtS
exA
ge (y)
Bod
y M
ass
(kg)
Dis
abili
tyS
CI
Com
plet
enes
s
Year
sP
layi
ngS
port
Trai
ning
Hou
rsPe
r Wee
k
IWB
FS
port
sC
lass
ifica
tion14
1B
aske
tbal
lM
ale
2677
.6SC
I T
12In
com
plet
e5
213.
0
2B
aske
tbal
lM
ale
2770
.7Sp
ina
bifid
a—
1418
3.0
3B
aske
tbal
lM
ale
2793
.8A
vasc
ular
nec
rosi
s—
1215
4.5
4B
aske
tbal
lM
ale
3494
.2SC
I T
12C
ompl
ete
1615
2.0
5B
aske
tbal
lFe
mal
e29
58.3
SCI
T9
Com
plet
e10
161.
5
6B
aske
tbal
lFe
mal
e17
50.0
Acu
te m
otor
neu
ropa
thy
—5
102.
5
Mea
n26
.774
.110
.315
.82.
8
SD5.
518
.14.
63.
71.
0
1Te
nnis
Mal
e30
99.0
SCI
T12
Inco
mpl
ete
615
2.5
2Te
nnis
Mal
e18
64.1
Bri
ttle
bone
s—
1225
4.0
3Te
nnis
Mal
e15
67.8
Tra
nsve
rse
Mye
litis
T12
Inco
mpl
ete
27
3.0
4Te
nnis
Mal
e34
64.7
SCI
T 8
/9/1
0C
ompl
ete
821
1.5
5Te
nnis
Fem
ale
2651
.9SC
I T
4/5
Com
plet
e4
151.
0
6Te
nnis
Fem
ale
1547
.5B
rittl
e bo
nes
125
4.0
Mea
n23
.065
.87.
314
.72.
7
SD8.
218
.14.
17.
71.
3
Appendix I

304 Croft et al.
Experimental Design
There were two distinct phases to this study: a laboratory assessment within a 2-wk period either side of the selected sports competition and data collection during international wheelchair basketball and tennis competitions. All participants were tested in their own sports specific wheelchair. For the laboratory measurements, the tennis players were tested using a wheelchair ergometer as previously described,12 while the basketball players were tested using a specialized motorized treadmill (H/P/Cosmos, Germany).
Laboratory Assessment
Each participant completed an incremental submaximal exercise test that comprised five or six 4-min stages. The initial speed was predetermined following a self-selected warm-up period of 5 min where heart rate (HR) was approximately 100 bpm. Subse-quently each exercise stage was increased by 0.2 to 0.4 m⋅s−1, and this ensured that we obtained a profile that included 40% to 80% VO
2 peak
. For the treadmill testing
the incline was kept constant at 1% gradient throughout this test. During the last minute of each stage, expired air was collected and analyzed using the Douglas bag technique. The concentration of oxygen and carbon dioxide in the expired air samples was determined using a paramagnetic oxygen analyzer (Series 1400, Servomex Ltd., Sussex, UK) and an infrared carbon dioxide analyzer (Series 1400, Servomex Ltd., Sussex, UK). Expired air volumes were measured using a dry gas meter (Harvard Apparatus, Kent, UK) and corrected to standard temperature and pressure (dry). Oxygen uptake (VO
2), carbon dioxide output, expired minute ventilation, and
respiratory exchange ratio were calculated. Heart rate was monitored continuously using radio telemetry (PE4000 Polar Sport Tester, Kempele, Finland) and the rating of perceived exertion (RPE) was monitored throughout the test. A small capillary blood sample was obtained from the earlobe at the start of the test and as quickly as possible during a 1-min break between stages for determination of whole blood lactate concentration [Bla–] using a YSI 1500 Sport (Yellow Springs, USA), which had been calibrated with a lactate standard of 5 mmol·L–1 before testing. The lactate threshold (LT) was defined visually by two separate observers at the first workload before there was “an onset of blood lactate accumulation.”15 A second breakpoint known as the lactate turn point (LTP) was identified and is used to describe a second workload where [Bla–] begins to accumulate quickly.13 Based upon the aforementioned parameters six different HR training zones were identified (Table 2).13,16
Following a 15-min rest period, an incremental gradient test (treadmill) and an incremental speed test (wheelchair ergometer) was used to determine the peak oxygen uptake (VO
2peak). This test involved increases in external work until
volitional exhaustion. Heart rate was monitored continuously, expired air samples were collected over the last two consecutive stages of the test and the final RPE was recorded. On completion of the peak test a capillary blood sample was also taken and analyzed to determine [Bla–] as previously described. The criteria for a valid VO
2peak were a peak RER ≥ 1.10 and peak HR ≥ 95% of the age-predicted
maximum (200 bpm minus chronological age in years) as previously used in this population group.12 All of the participants satisfied both criteria. Peak HR was taken as the highest value recorded during the test; however, if a higher HR value was obtained during match play then that value was used.
Appendix I
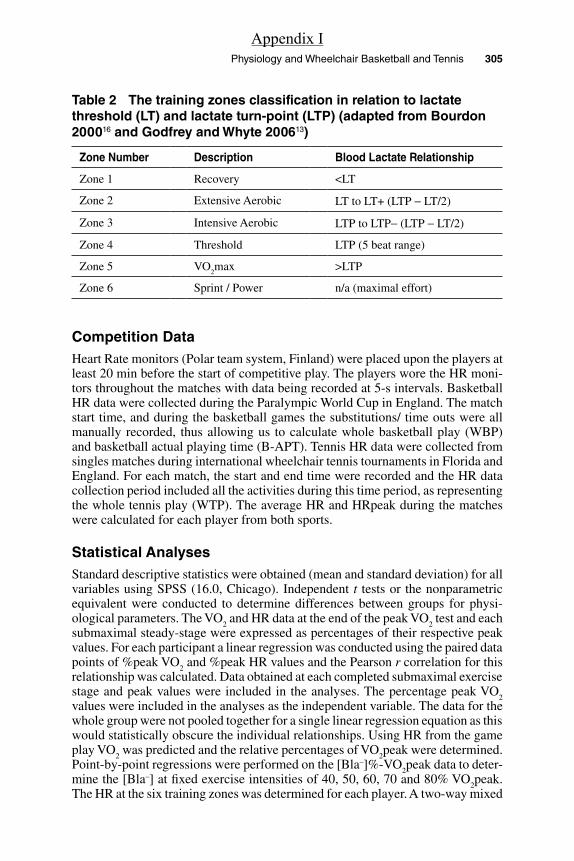
Physiology and Wheelchair Basketball and Tennis 305
Competition DataHeart Rate monitors (Polar team system, Finland) were placed upon the players at least 20 min before the start of competitive play. The players wore the HR moni-tors throughout the matches with data being recorded at 5-s intervals. Basketball HR data were collected during the Paralympic World Cup in England. The match start time, and during the basketball games the substitutions/ time outs were all manually recorded, thus allowing us to calculate whole basketball play (WBP) and basketball actual playing time (B-APT). Tennis HR data were collected from singles matches during international wheelchair tennis tournaments in Florida and England. For each match, the start and end time were recorded and the HR data collection period included all the activities during this time period, as representing the whole tennis play (WTP). The average HR and HRpeak during the matches were calculated for each player from both sports.
Statistical AnalysesStandard descriptive statistics were obtained (mean and standard deviation) for all variables using SPSS (16.0, Chicago). Independent t tests or the nonparametric equivalent were conducted to determine differences between groups for physi-ological parameters. The VO
2 and HR data at the end of the peak VO
2 test and each
submaximal steady-stage were expressed as percentages of their respective peak values. For each participant a linear regression was conducted using the paired data points of %peak VO
2 and %peak HR values and the Pearson r correlation for this
relationship was calculated. Data obtained at each completed submaximal exercise stage and peak values were included in the analyses. The percentage peak VO
2
values were included in the analyses as the independent variable. The data for the whole group were not pooled together for a single linear regression equation as this would statistically obscure the individual relationships. Using HR from the game play VO
2 was predicted and the relative percentages of VO
2peak were determined.
Point-by-point regressions were performed on the [Bla–]%-VO2peak data to deter-
mine the [Bla–] at fixed exercise intensities of 40, 50, 60, 70 and 80% VO2peak.
The HR at the six training zones was determined for each player. A two-way mixed
Table 2 The training zones classification in relation to lactate threshold (LT) and lactate turn-point (LTP) (adapted from Bourdon 200016 and Godfrey and Whyte 200613)
Zone Number Description Blood Lactate Relationship
Zone 1 Recovery <LT
Zone 2 Extensive Aerobic LT to LT+ (LTP − LT/2)
Zone 3 Intensive Aerobic LTP to LTP− (LTP − LT/2)
Zone 4 Threshold LTP (5 beat range)
Zone 5 VO2max >LTP
Zone 6 Sprint / Power n/a (maximal effort)
Appendix I
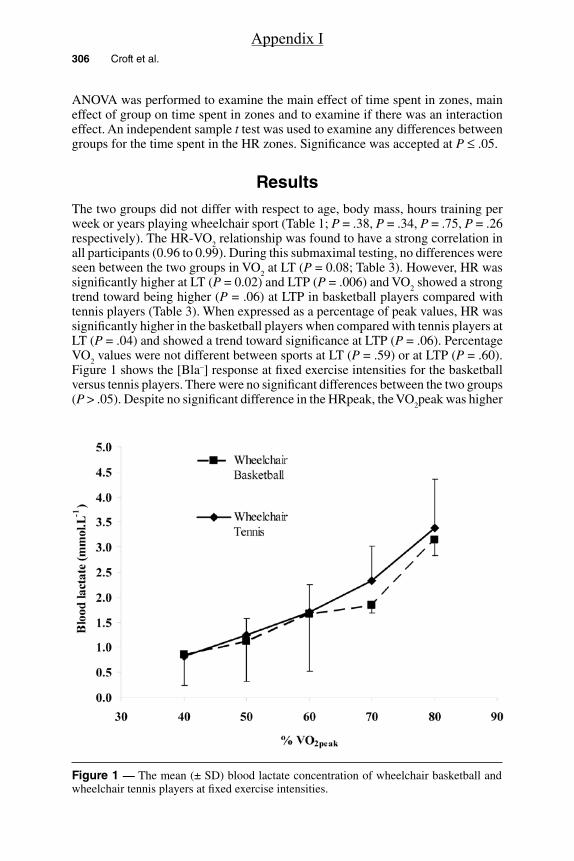
306 Croft et al.
ANOVA was performed to examine the main effect of time spent in zones, main effect of group on time spent in zones and to examine if there was an interaction effect. An independent sample t test was used to examine any differences between groups for the time spent in the HR zones. Significance was accepted at P ≤ .05.
ResultsThe two groups did not differ with respect to age, body mass, hours training per week or years playing wheelchair sport (Table 1; P = .38, P = .34, P = .75, P = .26 respectively). The HR-VO
2 relationship was found to have a strong correlation in
all participants (0.96 to 0.99). During this submaximal testing, no differences were seen between the two groups in VO
2 at LT (P = 0.08; Table 3). However, HR was
significantly higher at LT (P = 0.02) and LTP (P = .006) and VO2 showed a strong
trend toward being higher (P = .06) at LTP in basketball players compared with tennis players (Table 3). When expressed as a percentage of peak values, HR was significantly higher in the basketball players when compared with tennis players at LT (P = .04) and showed a trend toward significance at LTP (P = .06). Percentage VO
2 values were not different between sports at LT (P = .59) or at LTP (P = .60).
Figure 1 shows the [Bla–] response at fixed exercise intensities for the basketball versus tennis players. There were no significant differences between the two groups (P > .05). Despite no significant difference in the HRpeak, the VO
2peak was higher
Figure 1 — The mean (± SD) blood lactate concentration of wheelchair basketball and wheelchair tennis players at fixed exercise intensities.
Appendix I

Physiology and Wheelchair Basketball and Tennis 307
Figure 2 — An example of a basketball player’s heart rate trace during a match showing peak heart rate, average heart rate and playing time. Peak heart rate (black horizontal line), average heart rate (gray line) and time spent on court (dashed line).
for the basketball players when compared with the tennis players (2.98 ± 0.91 vs 2.06 ± 0.71; P = .08).
Figure 2 shows the HR response during whole basketball play (WBP) and indicates the maximum and average HR, and actual playing time (B-APT) for one participant. Peak VO
2 was significantly higher during WBP when compared with
WTP (2.90 ± 0.93 vs 1.80 ± 0.58 L∙min–1; P = .03) and there was a 10 beat dif-ference in peak HR although these values did not significantly differ (190 ± 12 vs 180 ± 18 bpm respectively). The basketball group showed a trend toward a higher average match HR during B-APT (163 ± 11 vs 146 ± 16 bpm; P = .06, Figure 3) and a higher estimated average VO
2 (2.26 ± 0.06 vs 1.36 ± 0.42 L⋅min−1; P = .02)
than the tennis players (WTP). During WBP and WTP, there were no differences in average HR between sports (154 ± 15 vs 146 ± 16 bpm; P = .40). Yet, the basketball players still showed a higher estimated average VO
2 (2.03 ± 0.57 vs 1.36 ± 0.42
L⋅min−1; P = .04). When average match HR was compared as %HRpeak between sports during B-APT and WTP, there was a significant difference (83.9 ± 1.9% vs 75.3 ± 7.8% respectively; P = .03). The corresponding average %VO
2peak for
B-APT and WTP was found to be 75.9 ± 5.5% vs 68.3 ± 11.8% respectively (P = .18). There was no significant difference between %HR (79.2 ± 4.4 vs 75.3 ± 7.8% P = .3) and %VO
2peak (68.9 ± 7.7 vs 68.2 ± 11.8% P = .90) between sports
whole play.Table 4 shows the relative percentage and actual time the basketball and tennis
players spent in each training HR zone. This was measured during WBP, B-APT and WTP. Analysis for the whole game in both sports in actual minutes and as a percentage of the total game time showed a significant main effect for zone (P < .01). Pairwise analysis revealed that more time was spent in HR zone 5 (36.1 ± 17.6 and 44.2 ± 23.9 minutes for basketball and tennis respectively) compared with
Appendix I

308
Figure 3 —Top panel: Peak (± SD) heart rate during a wheelchair basketball and wheelchair tennis match, average (± SD) match heart rate during WBP and WTP and average (± SD) match heart rate during B-APT. Bottom panel: Peak (± SD) VO
2 during a wheelchair basketball and wheelchair tennis
match, average (± SD) match VO2 during WBP and WTP and average (± SD) match VO
2 during
B-APT (b). Note. *Significant difference between sports; WBP = whole basketball play, WTP = whole tennis play and B-APT = basketball actual playing time.
*
Appendix I

309
Tab
le 3
T
he
phy
sio
log
ical
pro
file
of
the
bas
ketb
all a
nd
ten
nis
pla
yers
Part
icip
ant
Spo
rtH
Rpe
ak(b
pm)
VO2p
eak
(L·m
in−1
)H
R a
t LT
(bpm
)VO
2 at L
T(L
·min
−1)
HR
at L
TP(b
pm)
VO2 a
t LTP
(L·m
in−1
)
1B
aske
tbal
l19
93.
4213
81.
7715
32.
15
2B
aske
tbal
l20
03.
1813
41.
8115
12.
21
3B
aske
tbal
l19
33.
8613
42.
0814
72.
50
4B
aske
tbal
l18
93.
7411
31.
1314
42.
15
5B
aske
tbal
l17
81.
7414
31.
19—
—
6B
aske
tbal
l20
41.
9511
90.
7114
50.
97
Mea
n19
42.
9813
01.
4514
81.
99
SD9
0.91
120.
524
0.59
1Te
nnis
191
2.85
107
1.24
138
1.97
2Te
nnis
197
2.54
112
1.24
146
1.75
3Te
nnis
202
2.47
125
1.06
141
1.34
4Te
nnis
185
2.11
124
1.13
136
1.21
5Te
nnis
196
1.10
107
0.50
139
0.70
6Te
nnis
194
1.30
106
0.56
139
0.88
Mea
n19
42.
0611
4 *
0.96
140
*1.
31
SD6
0.71
90.
343
0.49
* Si
gnifi
cant
dif
fere
nce
whe
n co
mpa
red
with
bas
ketb
all (
P <
.05)
.
Appendix I

310 Croft et al.
Tab
le 4
A
co
mp
aris
on
of
the
per
cen
tag
e o
f ti
me
spen
t in
eac
h t
rain
ing
zo
ne
du
rin
g a
ctu
al p
layi
ng
tim
e (A
PT
) an
d w
ho
le m
atch
pla
y (i
ncl
ud
ing
res
ts)
in w
hee
lch
air
bas
ketb
all w
ith
wh
ole
mat
ch w
hee
lch
air
ten
nis
pla
y
Zone
:1
23
45
Tota
l gam
etim
e
Spo
rt
Rel
ativ
eA
bsol
ute
Rel
ativ
eA
bsol
ute
Rel
ativ
eA
bsol
ute
Rel
ativ
eA
bsol
ute
Rel
ativ
eA
bsol
ute
Abs
olut
e
%M
in%
Min
%M
in%
Min
%M
inM
in
Whe
elch
air
Bas
ketb
all
(APT
)
7.4
2.7
3.7
1.8
2.7
1.3
*4
1.6
*82
.0 a
33.1
a40
.5
Whe
elch
air
Bas
ketb
all
(WB
P)
18.2
9.6
5.6
3.7
4.3
2.8
4.3
2.5
67.6
b36
.1 a
54.7
Whe
elch
air
Tenn
is
(WT
P)
7.6
4.2
11.9
7.0
14.7
9.7
7.9
5.8
57.9
44.2
70.9
* D
enot
es a
sig
nific
ant d
iffe
renc
e (P
< .0
5) w
ith w
heel
chai
r te
nnis
. a D
enot
es a
sig
nific
ant d
iffe
renc
e (P
< .0
5) b
etw
een
time
spen
t in
zone
5 to
all
othe
r zo
nes
whe
n an
alyz
ed w
ith te
nnis
.b D
enot
es a
sig
nific
ant d
iffe
renc
e (P
< .0
5) b
etw
een
time
spen
t in
zone
s 2–
4 an
d 5
whe
n an
alyz
ed w
ith te
nnis
.
Appendix I
Physiology and Wheelchair Basketball and Tennis 311
any of the other HR zones in minutes (both groups spent <10 min in each zone). As a percentage, more time was spent in zone 5 (67.6 ± 16.5 and 57.9 ± 30.7% for basketball and tennis respectively) than zone 2, 3 and 4 (both groups < 10% in each zone). There was no main effect of sport (P = .24; P = .99 respectively) and no interaction effect (P = .50, 0.10 respectively). A comparison between B-APT and WTP in minutes and as a percentage of a whole game, results showed that there was a significant main effect of zone (P < .001). Pairwise analysis revealed more time was spent in zone 5 (basketball 33.1 ± 15.8 min (82 ± 7.4%); tennis 44.2 ± 23.9 min (57.9 ± 30.7%) when compared with all the other zones (all other zones < 10 min [<15%]). When time spent in minutes was compared between zones, there was a main effect of sport. Analysis revealed that basketball players spent less minutes in zone 3 (1.3 ± 1.1 vs 9.6 ± 5.3 min) and zone 4 (1.6 ± 1.0 vs 5.8 ± 3.9 min) when compared with tennis players. When relative time spent in each zone was analyzed there was no main effect of sport (P = .39).
DiscussionThe VO
2peak of the elite basketball players in the current study were found to be
slightly higher than that reported in previous literature,4,17 yet similar values were found for the tennis players.1 As evident in the literature the females demonstrated lower VO
2peak values to their male counterparts.18 There was a tendency for
VO2peak to be higher for the basketball players when compared with the tennis
players (2.98 ± 0.91 vs 2.06 ± 0.71; P = .08). Moreover, in contrast to previous research, the current study found a difference between sports in the HRs (148 ± 4 vs 140 ± 3 bpm) at LTP, with again the basketball players recording higher values.19 To the authors knowledge limited data exists that focuses around the LT and corresponding work rates. Of that available, it is of interest to note that the current study found similar VO
2 values at LT to the work of Flandrois et al.20 But
when expressed relative to VO2peak the current study identified that this threshold
occurred at only 49.6 and 48% VO2peak for basketball and tennis respectively
when compared with the 63% and 54% of high and low paraplegics in Flandrois et al.20 The range of disabilities makes it hard to compare the two studies and the protocols differed between studies making results hard to interpret. In addition, these values may differ slightly depending upon the LT definition used, which, although was similar in both studies, in the present work, was perhaps limited due to the number of exercise stages employed,6,16 we will revisit this methodological consideration later.
Average match HRs in the current study were found to be higher in both sports when compared with other previously reported research.1,2,4,11,21,22 Basketball aver-age actual play, match HRs (163 bpm) were higher than that reported by other literature (range 128 to 151 bpm).2,4,21,22 In tennis, average HRs of 121 to 127 bpm compared with 146 bpm in this study have been reported.1,4,11 Average tennis values relative to %HRpeak were higher in this study with 75% compared with 69%.1 A similar case in tennis reported average VO
2 as %VO
2peak at a higher 68% in this
study when compared with Roy and coworkers1 finding of 49.9%. In fact this value is more similar to that of able-bodied tennis players which is reported at 60% to 70% VO
2peak.23
Appendix I

312 Croft et al.
Average HR, VO2peak and average VO
2 were all higher during actual play in
a basketball match (B-APT) when compared with tennis (WTP) which supports the work of Coutts.4 The novelty of this study is that it extends the work of Coutts4 to now include estimates of VO
2 through the HR-VO
2 relationship. The fact that
basketball is shown to have a larger competitive demand will be a reflection of skills involved, court covered and activities performed such as longer sprints.22 Basketball also has a higher work to rest ratio with actual playing time accounting for 50% of total match time (excluding substitution time) compared with tennis actual playing time only accounting for 15 to 20%.1,2 Comparison of the two sports including all rest and time out periods in basketball showed no difference in average HR but results still showed a significantly higher average VO
2 during a basketball
game when compared with tennis. Further work is warranted in this area to include time-motion match analysis which would enable a greater understanding of the relative importance of these factors.
It is important to note that in the current study the tennis match data were analyzed from the start of play to the end of play, including any breaks or rests whereas basketball data includes a whole game with rests and time outs and also analysis excluding time outs, end of quarters and substitutions. Basketball players may not play the whole match due to substitutions, and substitutions and time outs vary greatly between matches. Tennis players compete for the whole match and breaks are included within the rules of the match and are consistent from match to match. This may have been influential upon the difference between the sports and excluding time outs, end of quarters and substitutions during basketball play may be a truer reflection of the demands of this particular sport. Roy et al1 included only actual playing time of tennis matches and despite only accounting for 15% of total time, average HR values were similar to that of other literature. The slightly higher VO
2 and HR values reported here highlights a major issue when investigating
competitive intermittent sport activity as the opposition, environment and match demands can vary greatly between matches.2,23 Additionally in tennis, match length is variable, thus longer matches can result in higher physiological demands and court surface and ball type can change between tournaments; these will all play a role in the physiological demands of the sport.23
The HR training zones obtained from the current study are informative, since they can be used to help specialize training for the different sports. Interestingly, it was apparent that when comparing B-ATP with WTP the main differences between sports occurred at HR zones 3 to 4, which are the zones just below and at LTP. This finding may help explain the differences found between the characteristics of the sportsmen and women between sports where the VO
2 and HR at LTP differed.
The higher absolute VO2 and HR at LTP for the basketball players may be due to
these players demonstrating a higher aerobic capacity, as relatively, there was no difference in VO
2 at LTP between sports. From these data, a tennis match lasts on
average 40 to 50 min longer than a basketball match and so in absolute terms, tennis players are spending more time in zones above LTP. However, relatively speaking, the basketball players spend a higher (although not significant) percentage of time in zone 5 when compared with tennis even when taking rests into account (67.6 ± 16.5 vs 57.9 ± 30.7% respectively). If more time is spent above the LTP, this may promote more muscular adaptations enhancing the removal of lactate which would thus result in LTP occurring at a higher exercise intensity.6
Appendix I

Physiology and Wheelchair Basketball and Tennis 313
Training in the different HR zones would be achieved through varying the work to rest ratios and the intensity of the activity. It has been suggested that zone 1 to 2 would incorporate lower intensities of longer duration to build the aerobic base whereas zone 5 would have a lower work to rest ratio but involve higher exercise intensities with more interval related training.24 Training could incorporate a combination of the HR zones, with HR zones 1 to 2 being used as a recovery between training at the higher HR zones. Different drills could be implemented and could reflect important aspects of the sport such as movement patterns and agility along with more sport-related actions such as passing in basketball.25,26 Bullock and Pluim27 highlight that it is important that training reflects competitive play; for example tennis training can be done holding a racket, so that the tennis racket eventually does not become a constraint to the pushing technique.28 Heart rate monitors can be used to help monitor exercise training for participants with a low to moderate spinal cord injury, as it still remains unclear whether RPE can be used successfully by all athletes with the prescription of exercise. It is important however, that athletes are retested as through training the LT and LTP will occur at higher HR and thus it is likely that the HR training zones will change.6,12
Basketball training has highlighted the need for frequent repetitions involv-ing different speeds and more high intensity drills such as fast break basketball.25 In fact, a number of high-intensity interval-training drills for basketball many of which reflect the basketball movements such as U-turns and clovers are available in the coaching literature.26 Similarly, adapted versions of these drills are also available to the tennis player replicating the movements on the tennis courts.27 However, more aerobic training would be undertaken at a lower intensity within tennis which could involve continuous pushing for 45 to 60 min or longer dura-tion less intensive interval programs.27 Weight and resistance training have been recommended for both sports to develop endurance, while also helping to develop upper body and trunk strength.27
The HR training zones themselves vary between researchers; however to date, all the research has been involved able-bodied participants.16 Differences were also shown to occur between participants within the same sport. Individual variance, the problems associated with competitive play and the varying match demands between matches discussed earlier contribute to these differences. However, where possible we used several matches from a number of participants to represent the typical match play response.
One of the major difficulties facing research into elite wheelchair athletes is the small population available resulting in small sample sizes along with the variation of injuries within population groups.29 Despite this study trying to match participants, differences in injuries between subjects could affect findings and help explain the physiological characteristically differences with other studies. To determine the precise LTP more stages around the LTP should be conducted.16 Both LT and LTP were determined visually by separate investigators, however due to the large jumps in values there was sometimes an element of uncertainty. One basketball player was also excluded due to their LTP not being identified, however this subjects’ HR at LT was higher than most of the tennis players’ HR at LTP and thus their results would probably tie in with the findings above. Data from this study was conducted within international competition, whereas some of other studies1,11 organized matches solely for the study. The warmer temperatures
Appendix I
314 Croft et al.
and humidity during tournaments within Florida when tennis data were collected could also have resulted in higher HR.30 This may have bias the HR recordings toward a higher percentage time in zones 3 to 5 between sports which is opposite from the findings from this study.
In conclusion this study demonstrated that wheelchair basketball players have higher aerobic capacities when compared with tennis players of a similar playing experience. Despite the simplicity of HR data collection, the demands of wheelchair basketball actual play were shown to be more physiologically demanding than tennis. Our findings suggest that it is possible that the times spent in basketball competitive play might be associated with the improved physiological profile of the basketball players when compared with the tennis players. Close inspection of the HR profile during match play would suggest that wheelchair basketball players would benefit from high intensity training, while tennis players training should cover the exercise intensity continuum. Future research needs to address how athletes and coaches quantify training by taking into account both exercise volume and intensity and how stable or reliable the use of ratings of perceived exertion (RPE) may be in this process.
References 1. Roy JLP, Menear KS, Schmid MMA, Hunter GR, Malone LA. Physiological Responses
of Skilled Players During a Competitive Wheelchair Tennis Match. J Strength Cond Res. 2006;20:665–671.
2. Perez J, Rabadan M, Pacheco JL, Sampedro J. Heart rate assessment during wheel-chair basketball competition: Its relationship with functional classification and specific training design. In Higgs C & Vanlandewijck Y eds. Sport for persons with a disability. Perspectives. Vol. 7. Berlin: International Council of Sport Science and Physical Educa-tion; 2007;151–174.
3. Royer D. The Applications of Aerobic and Anaerobic Training to Wheelchair Athletes. In Steadward RD (ed) Proceedings; First International Conference on Sport and Train-ing of the Physically Disable Athlete. Edmonton. 1979.
4. Coutts KD. Heart rates of participants in wheelchair sports. Paraplegia. 1988;26:43–49. 5. Achten J, Jeukendrup AE. Heart rate monitoring: applications and limitations. Sports
Med. 2003;33:517–538. 6. Weltman A. The Blood Lactate Response to Exercise. Champaign, IL: Human Kinetics;
1995. 7. Moody JA, Tong RJ. Jackson CB Quadriplegic Rugby – The Welsh Rugby Tradition
Pushes Forward. 3rd Paralympic Conference. 1996. Atlanta, Georgia, August 12–16. 8. Sawka MN, Glaser RM, Wilde SW, von Luhrte TC. Metabolic and circulatory responses
to wheelchair and arm crank exercise. J Appl Physiol. 1980;49:784–788. 9. Glaser RM. Arm exercise training for wheelchair users. Med Sci Sports Exerc.
1989;21:S149–S157. 10. Janssen TWJ, Hopman MTE. Spinal Cord Injury. In: Skinner JS, ed. Exercise Testing
and Exercise Prescription for Special Cases. United States of America: Lippincott, Williams & Wilkins; 2005:203–219.
11. Barfield JP, Malone LA, Coleman TA. Comparison of Heart Rate Response to Tennis Activity Between Persons With and Without Spinal Cord Injuries: Implications for a Training Threshold. Res Q Exerc Sport. 2009;80:71–77.
12. Diaper NJ, Goosey-Tolfrey VL. A Physiological Case Study of a Paralympic Wheelchair Tennis Player: Reflective Practise. J Sports Sci & Med. 2009;8:300–307.
Appendix I

Physiology and Wheelchair Basketball and Tennis 315
13. Godfrey R, Whyte G. Training Specificity. In: Whyte G, ed. The Physiology of Training. London: Churchill, Livingstone, Elsevier; 2006:23–44.
14. International Wheelchair Basketball Federation. (2009) Classification Commissions Function. Available via http://www.iwbf.org/index.html. Accessed 10 August 2009.
15. Ivy JL, Withers RT, Van Handel PJ, Essig DA, Lower RW. Alteration in the lactate threshold with changes in substrate availability. Int J Sports Med. 1981;2:139–142.
16. Bourdon P. Blood Lactate Transition Thresholds: Concepts and Controversies. In: Gore CJ, ed. Physiological Tests for Elite Athletes. Champaign, IL: Human Kinetics; 2000:50–65.
17. Goosey-Tolfrey VL. Physiological Profiles of Elite Wheelchair Basketball Players in Preparation for the 2000 Paralympic Games. Adapt Phys Activ Q. 2005;22:57–66.
18. Bhambhani Y. Physiology of wheelchair racing in athletes with spinal cord injury. Sports Med. 2002;32:23–51.
19. Gass GC, Camp EM. Physiological characteristics of trained Australian paraplegic and tetraplegic subjects. Med Sci Sports Exerc. 1979;11:256–259.
20. Flandrois R, Grandmontagne M, Gerin H, Mayet MH, Jehl JL, Eyssette M. Aerobic performance capacity in paraplegic subjects. Eur J Appl Physiol. 1986;55:604–609.
21. Schmid A, Huonker M, Stober P, Barturen JM. Schimdt – Trucksäss A, Dürr H, Völpel H-J, Keul J. Physical performance and cardiovascular and metabolic adaptation of elite female wheelchair basketball players in wheelchair ergometry and in competition. Am J Phys Med Rehabil. 1998;77:527–533.
22. Bloxham LA, Bell GJ, Bhambani Y, Steadward RD. Time motion analysis and physi-ological profile of Canadian world cup wheelchair basketball players. Sports Med Train Rehabil. 2001;10:183–198.
23. Kovacs MS. Tennis physiology: Training the competitive athlete. Sports Med. 2007;37:189–198.
24. Jacobs PL, Nash MS. Exercise recommendations for individuals with spinal cord injury. Sports Med. 2004;34:727–751.
25. Owen E. Playing and Coaching Wheelchair Basketball. Champaign, Ill: University of Illinois Press, 1982.
26. Frogley M. Wheelchair Skills Workout. Sport ‘n Spokes. 1999; 25:46–47. 27. Bullock M, Pluim B. Wheelchair tennis and physical conditioning. ITF Wheelchair
Tennis Coaches Review. 2003;9:2–10. 28. Goosey-Tolfrey VL, Moss AD. The velocity characteristics of wheelchair tennis players
with and without the use of racquets. Adapt Phys Activ Q. 2005;22:291–301. 29. Hutzler Y. Anaerobic fitness testing of wheelchair users. Sports Med. 1998;25:101–113. 30. Price MJ. Thermoregulation during exercise in individuals with spinal cord injuries.
Sports Med. 2006;36:863–879.
Appendix I