investigating project profitability in case of …
TRANSCRIPT

124
Finiz 2017 CHALLENGES IN MODERN CORPORATE GOVERNANCE
INVESTIGATING PROJECT PROFITABILITY IN CASE OF UNCERTAIN RETURNS: A SIMULATION APPROACH
Abstract:The selection of an appropriate investment option is one of the key components of corporate suc-cess. Project selection includes the evaluation of proposed projects in order to accept those that will contribute to achieving an organization’s objectives. The goal of this paper is to demonstrate the potential benefits of using the Monte Carlo simulation during the project evaluation process. The literature review provides insights into the benefits and drawbacks of various numerical and non-numerical models for project evaluation, as well as the key features of Monte Carlo simula-tions that can make this process easier. A practical application of the Monte Carlo simulation in the project evaluation process is presented using the Net Present Value (NPV) method, one of the most commonly used numeric selection models, in a well-known software environment. The proposed simulation approach proved to be useful, applicable and adaptable in the project evaluation process, especially when it comes to projects with high risk and uncertain returns.
Keywords: Project Evaluation, Monte Carlo simulation, Net Present Value, Profitability.
INTRODUCTION
One of the hardest decisions that corporate managers face is choosing between different investment options. Some of the factors that contribute to the importance of such decisions are: increased competitiveness between businesses, well informed and demanding customers, increasing demand for customized products/services and the requirements of worldwide markets. Therefore, managers, academicians and research-ers place a greater focus on the project selection process, as well as on the profitability of realized projects. An efficient project selection process is of the utmost importance, especially considering uncertainties, risks, constraints, project size and the complexity and uniqueness of contemporary projects. To be efficient, business entities and or-ganizations must improve the project selection process by using multiple criteria and objectives and considering constraining factors such time, budget, number of employ-ees, etc. In addition, the selected project has to be able to create economic value and a competitive advantage for the business entity in question.
As there are no sufficient resources to fund all proposed projects, it is vital to select the project that will be the most profitable. In order to secure maximum profits for se-lected projects, the selection process should use consistent criteria that will be in line with the organization’s business strategies and goals.1 Different methods and tools could be used to establish an appropriate project selection process. First, this paper will address different methods of project selection and the potential role of Monte Carlo simulations in this process. Next, an economic–probabilistic model for project evaluation will be presented, which assesses the financial return and the impact of uncertainties involved in the execution of a project. Before the closing remarks, some information with regard to the benefits and drawbacks that such a simulation model can provide will be provided.
1 Archer, N. & Ghasemzadeh, F. (2007). Project portfolio selection and management. Morris, P. Pinto, JK (2007), The Wiley Guide to Project, Program & Portfolio Management, 94-112.
Goran Avlijaš,Vule Mizdraković
Singidunum University, Belgrade, Serbia
Correspondence: Goran Avlijaš
e-mail: [email protected]
Finiz 2017 DOI: 10.15308/finiz-2017-124-130
EVALUATION AND RISKScientific - original paper
Singidunum University International Scienti�c Conference

125
Finiz 2017 Challenges in Modern Corporate Governance
Evaluation and risk
THEORETICAL BACKGROUND
As noted before, the process of selection and prioritiza-tion of projects is a strategic decision-making problem. It is very complex and usually characterized by multiple ob-jectives which could be conflicting and difficult to measure. On the other hand, the information available to decision makers is usually incomplete and sometimes subjective in nature. Gorrod (2003) and Hubbard (2014) argue that the uncertainty associated with a course of action generates op-portunities for loss, gain, or variation concerning desired or planned results.234 Therefore, it is very important to clearly define the criteria and methods to be used by organisations in order to provide support for the decision-making process.
There are number of studies in existing literature that deal with project selection and prioritization.5678 However, there is a wide range of criteria implanted and no consensus on which of them should be used. Naturally, each business entity should select a set of criteria that suits the type of or-ganisation and its chosen goals and objectives the most. It is important to note that inappropriate selection of criteria can cause a failure to achieve a business organisation’s goals and shareholders’ objectives.9 The following part of this pa-per presents some of the most common project evaluation models and the benefits of using the Monte Carlo simulation in the project management and evaluation process.
Project selection models
In order to address the previously stated issues, organi-sations can use different models. Namely, by using models, organisations can analyse and distinguish the problem from the mass of details in which the problem is embedded; there-fore, they can model the problem. This will lead to increased profits, efficient use of scarce resources, and an improve-ment in the market position. Organizations usually choose between numeric and non-numeric project selection models, or they can use combinations of the two.10 Although both criteria can be useful, numeric models are more focused on profitability. On the other hand, non-numeric models were used first and are much simpler than numeric models.
These models usually use subjective approaches, such as the “sacred cow” model, where the project is suggested by a senior or powerful official in the organization. The project
2 Gorrod, M. (2003). Risk management systems: process, technology and trends. Springer.
3 Hubbard, D. W. (2014). How to measure anything: Finding the va-lue of intangibles in business. John Wiley & Sons.
4 Meade, L. M. & Presley, A. (2002). R&D project selection using the analytic network process. IEEE transactions on engineering manage-ment, 49(1), 59-66.
5 Cooper, R., Edgett, S., & Kleinschmidt, E. (2001). Portfolio man-agement for new product development: results of an industry prac-tices study. R&D Management, 31(4), 361-380.
6 Henriksen, A. D. & Traynor, A. J. (1999). A practical R&D project-selection scoring tool. IEEE Transactions on Engineering Manage-ment, 46(2), 158-170.
is “sacred” in the sense that it will be maintained until suc-cessfully completed, or until the boss personally, recognizes the idea as a failure and terminates it. Other non-numeric approaches can be driven by necessity, when the project is required in order to keep a system operating, or the decision to undertake the project was based on a desire to maintain the company’s competitive position in the market.
Regarding models that use profitability as the only pa-rameter for selection, there are several methods available. The first is the Payback Period method, which shows how much time is needed to recover the initial fixed investment in the project using estimated annual net cash inflows from the project. The drawback of this method is that it ignores any cash inflows in the period after the payback period. Also, this method does not account for the time value of money. The Discounted Cash Flow or Net Present Value method over-comes this issue through the calculation of the Net Present Value (NPV) of all future cash flows and discounting them by a selected rate of return:
( )( )0
1
1
nt
tt
NNPV project Ir=
= ++
∑whereNt = the net cash flow in period tr = the required rate of return, andI0 = the initial cash investment (negative, since it is an outflow)
In order to include the impact of inflation or deflation, pt is introduced as the predicted rate of inflation during pe-riod t:
( )( )0
1
1
nt
tt t
NNPV project Ir p=
= ++ +
∑
Another method, similar to NPV, is the Internal Rate of Return (IRV) method, which is a discount rate that compares the present values of total cash inflows and outflows. Basi-cally, it is a discount rate at which Net Present Value (NPV) equals zero. Furthermore, if all the projected cash flows are divided and that sum is divided by the initial cash invest-ment, the Profitability Index could be calculated. Naturally, all projects with a ratio higher than one using this metric should be accepted. Besides the aforementioned models, there are many other models that focus on different aspects 7 Padovani, M., Carvalho, M. D., & Muscat, A. R. N. (2010). Seleção
e alocação de recursos em portfólio de projetos: estudo de caso no setor químico. Gestão & Produção, 17(1), 157-180.
8 Poh, K. L., Ang, B. W., & Bai, F. (2001). A comparative analysis of R&D project evaluation methods. R&D Management, 31(1), 63-75.
9 Padovani, M., Muscat, A. R. N., Camanho, R. & Carvalho, M. D. (2008). Looking for the right criteria to define projects portfolio: multiple case study analysis. Product: Management & Develop-ment, 6(2), 127-134.
10 Meredith, J. R., & Mantel Jr, S. J. (2011). Project management: a managerial approach. John Wiley & Sons.
(2)
(1)

126
Finiz 2017 Challenges in Modern Corporate Governance
Evaluation and risk
of project selection, like risk and uncertainty, the structure of cash flows and the connection between analyzed projects.
In order to overcome some of the drawbacks of profita-bility models, especially their focus on a single decision crite-rion, a number of selection models that use multiple criteria to evaluate a project have been developed. Such models are known as scoring models and may vary widely in their com-plexity and information requirements. Therefore, different forms of scoring models can be used for different purposes, such as the Unweighted Factor Model (0-1), the Unweighted Factor Scoring Model, the Weighted Factor Scoring Model and others.
The methods explained here are the most commonly used methods in practice. Ross et al. (2008) provides a more de-tailed overview of almost all of the profitability methods.11 Also, Cooper et al. (2001) studied and presented methods which are most frequently used in practical settings, as well as ones which prevail in the decision-making process.12 The results of the aforementioned studies show that financial methods perform better, especially when used together with other methods. Therefore, it can be concluded that the best models are in fact hybrid models, since they exploit benefits from both the numerical and non-numerical models.
The use of the Monte Carlo simulation in project management
Monte Carlo simulations have been used for decades and have been successfully applied in the areas of biology, engi-neering, computer science, meteorology, geophysics, public studies, and finance. In project management they are mostly used for cost and time management in order to measure the level of risk that a project involves.13 This can be conducive to determining total costs, project duration and completion date.14 Therefore, the Monte Carlo simulation can also be used in the project selection process in order to provide es-timates of total costs and project completion time. Informa-tion about both factors impact the quality of project selection decision-making.
In time management, project managers define the prob-ability distribution function of the duration of each project activity in order to provide better estimations.15 Since it is impossible to determine the exact time necessary for an 11 Ross, S. A., Westerfield, R., & Jordan, B. D. (2008). Fundamentals
of corporate finance. Tata McGraw-Hill Education.12 Cooper, R., Edgett, S., & Kleinschmidt, E. (2001). Portfolio ma-
nagement for new product development: results of an industry practices study. R&D Management, 31(4), 361-380.
13 Kerzner, H. (2017). Project Management: A Systems Approach to Planning, Scheduling, and Controlling. Hoboken, NJ: Wiley.
14 Williams, T. (2003). The contribution of mathematical modelling to the practice of project management. IMA Journal of Manage-ment Mathematics, 14(1), 3-30.
15 Agarwal, R., & Virine, L. (2017). Monte Carlo Project Risk Analy-sis. In Y. Raydugin (Ed.), Handbook of Research on Leveraging Risk and Uncertainties for Effective Project Management (109-129). Hershey, PA: IGI Global.
activity to be completed, project managers usually use a three-point estimate, with most-likely, best and worst case scenarios. Afterwards, these estimates are fitted to a duration probability distribution, such as a normal, Beta, or triangular distribution. Probability distributions should be made using historical data regarding certain characteristics of completed activities in the past. As a result, the Monte Carlo simulation provides project managers with information regarding the probability of completing a project on a certain date. Differ-ent types of project management software could be used for this type of simulation.
A similar approach to time management can be applied to project cost management. The difference would be assign-ing a probability distribution to the project costs, instead of the duration of activities. Once again, these data should be provided by accounting or cost experts.16 Instead of total project duration, the Monte Carlo simulation applied to cost management would result in an estimation of the total cost of a final project. The amount calculated will be used for es-timation of additional reserves or used in case of risk events and unplanned circumstances.
This paper will focus on the use of Monte Carlo simu-lations in the project selection process, combining it with one of the most common numeric selection models – Net Present Value. Smith (1994) suggested replacing estimates of net cash flow for each period with probability distributions for each factor that affects the amount of net cash flow.17 As a result, project managers can acquire the distribution of possible NPV instead of a single value. With the increase in computing power and development of easy-to-use environ-ments, this idea is becoming increasingly important, and it seems that it deserves more attention. Therefore, the follow-ing section considers some of the key benefits and drawbacks of such an approach using a fictive case study.
APPLICATION OF THE MONTE CARLO SIMULATION TO PROJECT SELECTION
It is impossible to completely remove uncertainty from the process of project selection. However, project managers can use the Monte Carlo simulation to describe ambiguity or uncertainties and provide themselves with additional per-spectives. According to Meredith and Mantel (2011) simula-tion is an easy to use technique, which helps evaluate risk in certain situations involving input variables or parameters.18 A project manager can use different simulation software,
16 Hulett, D. T. (2017). Monte Carlo Simulation for Integrated Cost-Schedule Risk Analysis: Concepts, Methods, and Tools for Risk Analysis and Mitigation. In Y. Raydugin (Ed.), Handbook of Re-search on Leveraging Risk and Uncertainties for Effective Project Management (pp. 29-60). Hershey, PA: IGI Global.
17 Smith, D. (1994). Incorporating Risk into Capital Budgeting Deci-sions Using Simulation. Management Decision, 32 (9), p. 20.
18 Meredith, J. R., & Mantel Jr, S. J. (2011). Project management: a managerial approach. John Wiley & Sons.
127
Finiz 2017 Challenges in Modern Corporate Governance
Evaluation and risk
which allows decisions to be presented by a mathematical model. For the purpose of illustration, authors decided to
use Oracle Crystal Ball, an add-on for the well-known and widely used program Microsoft Excel.
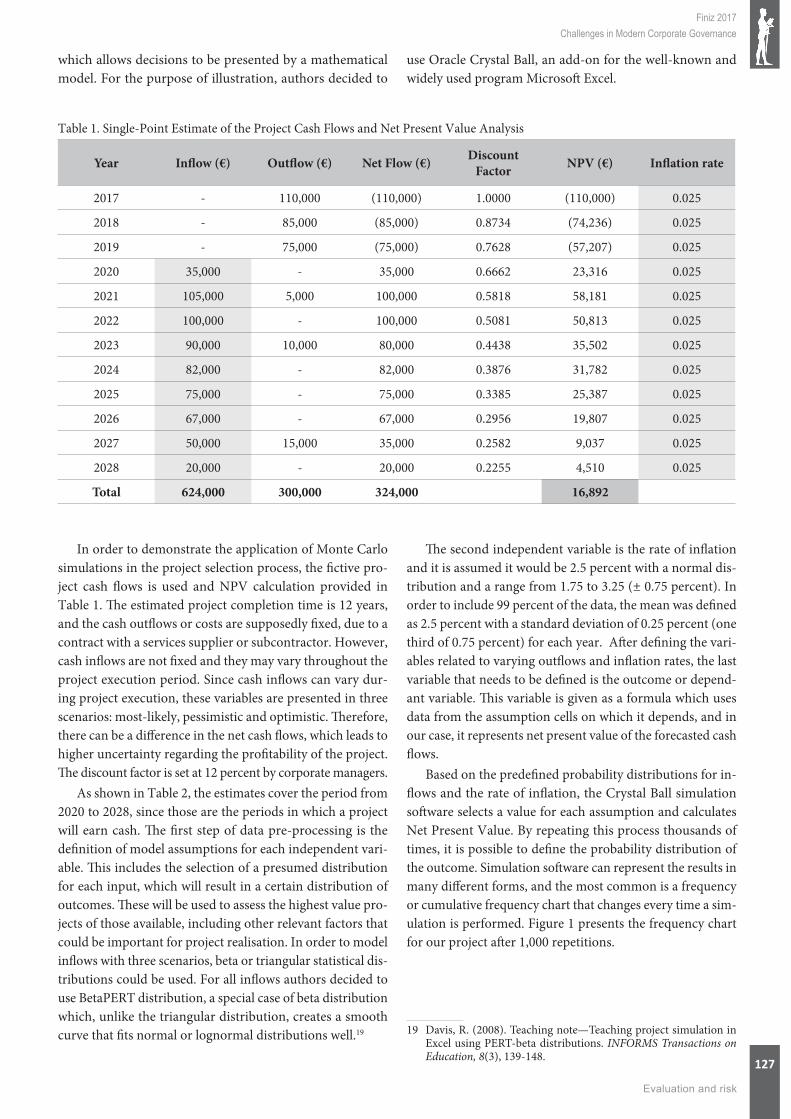
In order to demonstrate the application of Monte Carlo simulations in the project selection process, the fictive pro-ject cash flows is used and NPV calculation provided in Table 1. The estimated project completion time is 12 years, and the cash outflows or costs are supposedly fixed, due to a contract with a services supplier or subcontractor. However, cash inflows are not fixed and they may vary throughout the project execution period. Since cash inflows can vary dur-ing project execution, these variables are presented in three scenarios: most-likely, pessimistic and optimistic. Therefore, there can be a difference in the net cash flows, which leads to higher uncertainty regarding the profitability of the project. The discount factor is set at 12 percent by corporate managers.
As shown in Table 2, the estimates cover the period from 2020 to 2028, since those are the periods in which a project will earn cash. The first step of data pre-processing is the definition of model assumptions for each independent vari-able. This includes the selection of a presumed distribution for each input, which will result in a certain distribution of outcomes. These will be used to assess the highest value pro-jects of those available, including other relevant factors that could be important for project realisation. In order to model inflows with three scenarios, beta or triangular statistical dis-tributions could be used. For all inflows authors decided to use BetaPERT distribution, a special case of beta distribution which, unlike the triangular distribution, creates a smooth curve that fits normal or lognormal distributions well.19
The second independent variable is the rate of inflation and it is assumed it would be 2.5 percent with a normal dis-tribution and a range from 1.75 to 3.25 (± 0.75 percent). In order to include 99 percent of the data, the mean was defined as 2.5 percent with a standard deviation of 0.25 percent (one third of 0.75 percent) for each year. After defining the vari-ables related to varying outflows and inflation rates, the last variable that needs to be defined is the outcome or depend-ant variable. This variable is given as a formula which uses data from the assumption cells on which it depends, and in our case, it represents net present value of the forecasted cash flows.
Based on the predefined probability distributions for in-flows and the rate of inflation, the Crystal Ball simulation software selects a value for each assumption and calculates Net Present Value. By repeating this process thousands of times, it is possible to define the probability distribution of the outcome. Simulation software can represent the results in many different forms, and the most common is a frequency or cumulative frequency chart that changes every time a sim-ulation is performed. Figure 1 presents the frequency chart for our project after 1,000 repetitions.
19 Davis, R. (2008). Teaching note—Teaching project simulation in Excel using PERT-beta distributions. INFORMS Transactions on Education, 8(3), 139-148.
Table 1. Single-Point Estimate of the Project Cash Flows and Net Present Value Analysis
Year Inflow (€) Outflow (€) Net Flow (€) Discount Factor NPV (€) Inflation rate
2017 - 110,000 (110,000) 1.0000 (110,000) 0.025
2018 - 85,000 (85,000) 0.8734 (74,236) 0.025
2019 - 75,000 (75,000) 0.7628 (57,207) 0.025
2020 35,000 - 35,000 0.6662 23,316 0.025
2021 105,000 5,000 100,000 0.5818 58,181 0.025
2022 100,000 - 100,000 0.5081 50,813 0.025
2023 90,000 10,000 80,000 0.4438 35,502 0.025
2024 82,000 - 82,000 0.3876 31,782 0.025
2025 75,000 - 75,000 0.3385 25,387 0.025
2026 67,000 - 67,000 0.2956 19,807 0.025
2027 50,000 15,000 35,000 0.2582 9,037 0.025
2028 20,000 - 20,000 0.2255 4,510 0.025
Total 624,000 300,000 324,000 16,892

128
Finiz 2017 Challenges in Modern Corporate Governance
Evaluation and risk
Table 2. Pessimistic, Most Likely, and Optimistic Estimates of the Project Cash Flow
Year Minimum Inflow Most Likely Inflow Maximum Inflow
2020 20,000 35,000 45,000
2021 80,000 105,000 121,000
2022 85,000 100,000 110,000
2023 73,000 90,000 101,000
2024 65,000 82,000 93,000
2025 60,000 75,000 85,000
2026 52,000 67,000 76,000
2027 36,000 50,000 58,000
2028 15,000 20,000 23,000
Total 486,000 624,000 712,000
Figure 1. Frequency chart of the simulation output for net present value of project
Table 1 shows that the single point estimate of NPV, cal-culated with the most-likely inflows, was positive (16,892). Based on this information the project seems to be profitable. On the other hand, the frequency chart showed several nega-tive outcomes at or below the discount rate, which came as a result of pessimistic scenarios. One of the benefits of the Monte Carlo simulation is its ability to show the probability of achieving certain outcomes. As can be seen from the il-lustration, in this case the probability of obtaining NPV≥0 is 96.21 percent. In other words, with given estimates and assumptions of inflows and inflation rate, there is a 0.95+ probability that project will perform at or above 12 percent discount rate.
Table 3. Summary statistics of the simulation output for net present value of project
Statistic Forecast values
Trials 1.000
Base Case € 16.892
Mean € 13.518
Median € 13.815
Mode ---
Standard Deviation € 7.276
Variance € 52.940.854
Skewness -0,1229
Kurtosis 2,80
Coeff. of Variation 0,5382
Minimum (€ 10.449)
Maximum € 35.284
Mean Std. Error € 230

129
Finiz 2017 Challenges in Modern Corporate Governance
Evaluation and risk
The summary statistics in table 2 provide useful addition-al information for decision makers. The mean and median of the outcome are positive and significantly above the discount rate. Since decision makers are usually uncertain about some assumptions it is possible to observe how different levels of uncertainty impact the forecasted value of the outcome. Therefore, it is very simple to alter the level of uncertainty of independent variables. This can be done by changing the inflation rate, contracting or expanding the range between optimistic and pessimistic values or the distance between these values and the most likely estimate. Running simula-tions with different scenarios can illustrate how sensitive and significant input data is.
It is obvious that an accurate estimation of cash flows is the key precondition for obtaining useful results, and this estimation is usually very difficult. If the investment includes new technology or the introduction of new processes, it is es-sential to perform detailed cost, time, and risk analyses which should result in most-likely, best case and worst scenarios. In this way, decision makers can have the main factors that cause uncertainty in cash flow distributions at their disposal.
Decision makers should use Monte Carlo simulations with caution, because in certain situations they can be misleading and lead to false conclusions. This is most of-ten related to insufficient historical data to define adequate assumptions about variables and probability distributions. Even in cases where there is enough historical information to define three scenarios and necessary distributions of cost and time, it does not mean these will correspond to real time execution. Therefore, project managers and other decision makers should monitor the situation in order to react to any unsuspected events.
CONCLUSION
This article presented a numeric approach for selecting and prioritizing projects using the NPV method supported by Monte Carlo simulations. Besides the theoretical foun-dation of modelling and simulating the project selection process, a simple case study approach illustrated the prin-ciples involved in the simulation of NPV. The Simulation using the Oracle add-on for Excel demonstrated the use of a practical tool within a commercial spreadsheet that deci-sion makers can use in the process of project evaluation and risk analysis. Besides the benefits of a familiar environment for most decision makers, the application demonstrated that analysis is performed quickly and in a format, that enables decision making, even with a modest knowledge of statis-tics. The application confirmed that a simulation approach can successfully deal with uncertain cash flows in the project evaluation process. However, the simplicity of the suggested approach has its certain number of drawbacks that corporate managers should also take into account. Most of cash flows are based on a number of uncertain and dynamic factors,
such as market share, market growth, sales, unit cost and product price. Therefore, the decision maker has to use as much available data as possible and treat the results of simu-lations with caution. The proposed approach enables dif-ferent scenario analyses, so it is possible to produce reliable results by using a different number of complex models that better reflect reality. Most of the earlier studies confirmed that managers are familiar with the Monte Carlo simulation as a form of project risk analysis, although just small number of them are willing to use it. The main reason for this is a lack of required statistical knowledge and the use of specialized computer applications. As this study showed, introduction to user-friendly environments and increased computer pow-er means that the Monte Carlo simulation can be combined with other approaches easily, and used widely and expedi-ently by most decision makers.
LITERATURE
Agarwal, R., & Virine, L. (2017). Monte Carlo Project Risk Analy-sis. In Y. Raydugin (Ed.), Handbook of Research on Lever-aging Risk and Uncertainties for Effective Project Manage-ment (pp. 109-129). Hershey, PA: IGI Global.
Archer, N. & Ghasemzadeh, F. (2007). Project portfolio selection and management. Morris, P. Pinto, JK (2007), The Wiley Guide to Project, Program & Portfolio Management, 94-112.
Cooper, R., Edgett, S., & Kleinschmidt, E. (2001). Portfolio man-agement for new product development: results of an in-dustry practices study. R&D Management, 31(4), 361-380.
Davis, R. (2008). Teaching note—Teaching project simulation in Excel using PERT-beta distributions. INFORMS Transac-tions on Education, 8(3), 139-148.
Gorrod, M. (2003). Risk management systems: process, technology and trends. Springer.
Henriksen, A. D. & Traynor, A. J. (1999). A practical R&D pro-ject-selection scoring tool. IEEE Transactions on Engineer-ing Management, 46(2), 158-170.
Hubbard, D. W. (2014). How to measure anything: Finding the value of intangibles in business. John Wiley & Sons.
Hulett, D. T. (2017). Monte Carlo Simulation for Integrated Cost-Schedule Risk Analysis: Concepts, Methods, and Tools for Risk Analysis and Mitigation. In Y. Raydugin (Ed.), Hand-book of Research on Leveraging Risk and Uncertainties for Effective Project Management (pp. 29-60). Hershey, PA: IGI Global.
Kerzner, H. (2017). Project Management: A Systems Approach to Planning, Scheduling, and Controlling. Hoboken, NJ: Wiley.
Meade, L. M. & Presley, A. (2002). R&D project selection using the analytic network process. IEEE transactions on engi-neering management, 49(1), 59-66.
Meredith, J. R., & Mantel Jr, S. J. (2011). Project management: a managerial approach. John Wiley & Sons.
Padovani, M., Muscat, A. R. N., Camanho, R. & Carvalho, M. D. (2008). Looking for the right criteria to define projects port-folio: multiple case study analysis. Product: Management & Development, 6(2), 127-134.

130
Finiz 2017 Challenges in Modern Corporate Governance
Evaluation and risk
Padovani, M., Carvalho, M. D., & Muscat, A. R. N. (2010). Seleção e alocação de recursos em portfólio de projetos: estudo de caso no setor químico. Gestão & Produção, 17(1), 157-180.
Poh, K. L., Ang, B. W., & Bai, F. (2001). A comparative analysis of R&D project evaluation methods. R&D Management, 31(1), 63-75.
Ross, S. A., Westerfield, R., & Jordan, B. D. (2008). Fundamentals of corporate finance. Tata McGraw-Hill Education.
Smith, D. (1994). Incorporating Risk into Capital Budgeting De-cisions Using Simulation. Management Decision, 32(9), p. 20.
Williams, T. (2003). The contribution of mathematical model-ling to the practice of project management. IMA Journal of Management Mathematics, 14(1), 3-30.