investigating the determinants of renewable energy ... · investigating the determinants of...
TRANSCRIPT

International Journal of Business and Society, Vol. 19 No. 3, 2018, 886-903
INVESTIGATING THE DETERMINANTS OF RENEWABLE
ENERGY CONSUMPTION IN MALAYSIA: AN ARDL APPROACH
Lin-Sea Lau Universiti Tunku Abdul Rahman
Kwang-Jing Yii
Universiti Tunku Abdul Rahman
Chin-Yu Lee
Universiti Tunku Abdul Rahman
Yee-Lee Chong
Universiti Tunku Abdul Rahman
Eng-Heng Lee
Universiti Tunku Abdul Rahman
ABSTRACT
It is vital for Malaysia to increase the consumption of renewable energy to reduce its dependence on dirty
fossil fuels for electricity generation. This paper attempts to investigate the factors affecting renewable
electricity consumption in Malaysia. Specifically, our study aims to explore the long-run relationship among
renewable electricity consumption, economic growth, CO2 emissions, foreign direct investment and trade
openness over the period 1980 to 2015. By employing autoregressive distributed lag (ARDL) bounds testing
cointegration approach, we find that economic growth and foreign direct investment (FDI) are the major
drivers for renewable electricity consumption. Trade openness, however, is found to have a negative impact
on renewable electricity consumption in the long-run. Interestingly, the effect of CO2 emissions on renewable
electricity consumption is not significant. Moreover, the vector error correction model (VECM) Granger
causality test discovers the existence of a unidirectional causality relationship running from GDP to renewable
electricity consumption, confirming the validity of conservation hypothesis in Malaysia. Some important
policy implications are also discussed.
Keywords: Renewable electricity consumption; GDP; ARDL bounds testing; VECM Granger causality test
1. INTRODUCTION
In recent decades, the issue of global warming has become a worldwide concern. According to
scientists, the burning of fossil fuels particularly coal to generate electricity is the main human
Corresponding author: Faculty of Business and Finance, Universiti Tunku Abdul Rahman, Jalan Universiti, Bandar Barat, 31900
Kampar, Perak Darul Ridzuan, Malaysia. Tel: +605 468 8888 Ext: 4367 Fax: +605 4667407 Email address: [email protected]

Investigating the Determinants of Renewable Energy Consumption in Malaysia: An ARDL Approach 887
activity that has caused climate change. However, the good news is, the problem of global warming
can be mitigated by switching to renewable energy sources, such as wind and solar power. As a
way to reduce CO2 emissions that have led to climate change, many countries have started to look
for alternative energy sources rather than depending solely on fossil fuels for electricity production.
For Malaysia, the gradual adoption of renewable energy to replace the use of non-renewable
sources particularly in power sector is crucial due to two very important reasons. First, Malaysia
has been relying on fossil-based energy sources, such as coal and oil for electricity production,
particularly in the power sector that contribute to the emissions of greenhouse gases. According to
Klugman (2011), Malaysia has recorded the third highest annual growth rate of 4.7% for CO2
emissions in the world from 1970 to 2008. In terms of CO2 emissions from electricity production,
it is predicted that the pollution intensity of CO2 will increase from 298,339kt in 1999 to 800,519kt
by 2020 (Basri, Ramli, & Aliyu, 2015). Second, although Malaysia is a country that is blessed with
an abundance of natural resources including oil and natural gas, there is an increased concern over
the reserves of these resources as the demand for non-renewable energy sources keeps rising over
the years. For example, Malaysia’s average annual growth rate for total energy demand was
recorded as 6.6% over the period from 1980 to 2010 (Kardooni, Yusof, & Kari, 2016). To
overcome the issue of rising demand on energy, it is expected that power sector in Malaysia will
need to be more dependent on imported coal. The problems concerning the use of foreign coal is
that it exposes Malaysia to the risks of supply interruption and price fluctuations.
As non-renewable energy sources have adverse effects on both the environment and national power
security as mentioned above, efforts are required to encourage the development and consumption
of renewable energy sources in Malaysia. In particular, Malaysia needs to tap into green energy
potentials to reduce the reliance of its power plants on fossil fuels, particularly coal. Indeed, various
policy measures, such as the Five Fuel Diversification in 1999 and Renewable Energy Act in 2011
have been developed to promote the use of renewable energy in Malaysia. The most recent
initiative in promoting green technology can be seen in the 11th Malaysia Plan (2016-2020) where
‘pursuing green growth for sustainability and resilience’ has been included as one of the strategic
thrusts of the Plan. However, the contribution of renewables for electricity generation over the
years remains low in Malaysia. Renewable energy sources (excludes hydro that takes up 7%) such
as biomass/biogas, solar PV, mini hydro, and municipal solid waste, accounted for merely 0.2% of
the total electricity generated in 2012 (Basri et al., 2015). This situation leads to a question
regarding what motivates and hinders renewable electricity consumption in Malaysia. Although
there is a vast literature on the factors affecting renewable energy consumption (for example, Omri
& Nguyen, 2014; Saidi & Ben Mbarek, 2016; Vachon & Menz, 2006), the literature on the
determinants for renewable electricity consumption remains scarce. So far, Lin, Omoju, and
Okonkwo (2016) have studied the factors leading to renewable electricity consumption in China.
Other studies on the drivers of renewable electricity consumption are still absent from the literature.
Despite the fact that an investigation on the determinants for renewable electricity consumption is
vital in Malaysia, the current literature on the issue tends to focus merely on reviewing and
describing the current scenario of renewable energy consumption in the country. Many of the
existing studies (such as, Basri et al., 2015; Bujang, Bern, & Brumm, 2016; Mekhilef et al., 2014;
Petinrin & Shaaban, 2015) have been discussing on the current energy policies and the potential
renewable resources in Malaysia. As far as we are aware, the literature has yet to investigate the
determinants for the consumption of renewable electricity in Malaysia.
Our study contributes to the literature in several important ways. First, we consider renewable
electricity consumption as the dependent variable, instead of renewable energy consumption as
888 Lin-Sea Lau, Kwang-Jing Yii, Chin-Yu Lee, Yee-Lee Chong, Eng-Heng Lee
adopted in most of the existing studies. It is because the burning of fossil fuels particularly coal to
generate electricity has been identified as the main human activity that has led to climate change
according to the scientists. In Malaysia, the power plants have been depending on fossil-based
energy sources, such as coal and oil for electricity production. In terms of CO2 emissions from
electricity production, it is predicted that the pollution intensity of CO2 will increase by almost
threefold from 1999 to 2020 (Basri et al., 2015). Second, most of current literature about renewable
energy development emphasize on developed countries, such as Sovacool (2009) for United States
and Popp, Hascic, and Medhi (2011) for OECD countries. On the contrary, our study focuses on
the factors affecting renewable electricity consumption in an emerging economy. Third, compared
to past studies on renewable energy consumption in Malaysia that provide mostly current situation
of renewables development, this study attempts to extend the literature by examining the
determinants for renewable electricity consumption in the country which is of great importance to
the policy makers. Thus, our study generally aims to investigate the determinants of renewable
electricity consumption in Malaysia using Autoregressive Distributed Lag (ARDL) and Granger
causality test for the period from 1980 to 2015. There are two specific objectives of the study. First,
it is to examine the long-run relationship among renewable electricity consumption, economic
growth, CO2 emissions, foreign direct investment and trade openness in Malaysia. Second, the
results of the study would serve as a reference for policy makers to design energy, environmental
and economic policies that can eventually contribute to higher consumption of renewable
electricity in Malaysia.
The rest of the paper is organized as follows. Section 2 presents the literature review. Section 3
describes the methodology used. Section 4 provides a discussion on the empirical results obtained
while Section 5 concludes the paper with the inclusion of policy implications.
2. LITERATURE REVIEW
Numerous researches have analyzed the energy-growth nexus for different countries or regions
using different econometric methods to show whether energy consumption has an impact on
economic growth, and vice versa (Al-Iriani, 2006; Belloumi, 2009; Borozan, 2013; Dagher &
Yacoubian, 2012; Ghali & El-Sakka, 2004; Hossien, Yazdan, & Ehsan, 2012; Lee, Chang, & Chen,
2008). There are four well-established hypotheses related to energy-growth nexus. The first
hypothesis is growth hypothesis which suggests that economic growth is energy dependent.
Conversely, the second hypothesis is conservation hypothesis which claims that economic growth
is not energy dependent. Next, the neutrality hypothesis argues that economic growth and energy
are independent. Lastly, the feedback hypothesis suggests an interdependent connection between
economic growth and energy. The more recent studies on the link between energy consumption
and economic growth have noticed the decomposition of energy variable into renewable and
nonrenewable energy sources (Al-mulali, 2011; Apergis & Payne, 2010; Kum, Ocal, & Aslan,
2012; Payne & Taylor, 2008; Yang, 2000). Among these studies, some have been focusing on
factors affecting renewable energy consumption or production. Studies on investigating the
determinants for renewable energy can be further grouped into a single country or a panel of
countries, various econometric techniques, developed or developing countries, and different types
of renewable energy.

Investigating the Determinants of Renewable Energy Consumption in Malaysia: An ARDL Approach 889
By utilizing a dynamic system-GMM panel model, Omri and Nguyen (2014) discover that CO2
emissions and trade openness do play an important role in contributing to higher renewable energy
consumption in 64 countries for the period 1990 to 2011. However, a rise in oil price is found to
have a negative impact on renewable energy consumption in the middle-income countries as well
as the global panel. In addition, Sebri and Ben-Salha (2014) reveal a bidirectional causality
between renewable energy consumption and economic growth in BRICS countries. A
unidirectional causality is found to run from output to renewable energy in the case of OECD
countries in the study by Ben Jebli, Youssef, and Ozturk (2015). Similarly, Apergis and Payne
(2010) examine the energy-growth nexus in OECD countries over the period of 1985-2005 using
heterogeneous techniques. The results suggest that there is a bi-directional causality between
economic growth and renewable energy consumption. Another study on OECD countries by Kula
(2014) concludes that economic development has a significant effect on renewable energy
consumption. Focusing on Baltic region, Furuoka (2017) discovers that there is a unidirectional
causality from economic growth to renewable electricity consumption. Furthermore, the outcomes
of a study by Sadorsky (2009) show that income and pollution have a long-run positive effect on
per capita renewable energy consumption in G7 countries using panel cointegration techniques.
However, an increase in oil price is found to have impacted renewable energy consumption
negatively. Marques and Fuinhas (2011) discover that public awareness about climate change
mitigation and CO2 reduction targets fail to be the motivators for renewable energy consumption
in European countries using data from 1999 to 2006. It is also found that GDP and prices of fossil
fuels do not influence the development of renewables, concluding that the market does not play an
important role in promoting renewable energy in the 24 countries concerned. Furthermore, by using
data of 112 developing and developed countries from 1998 to 2009, Stadelmann and Castro (2014)
suggest that domestic factors like population and wealth do have a positive impact on the adoption
of renewable energy policies.
A study by Ben Jebli and Ben Youssef (2015) reveals that there is a unidirectional causality
relationship running from GDP, carbon emissions, nonrenewable energy and trade openness to
renewable energy in Tunisia. Sovacool (2009) reveals that the share of fossil fuels plays an
important role in explaining the consumption of renewable energy in the United States. Most
recently, Lin et al. (2016) employ the Johansen cointegration technique and vector error correction
model to identify the determinants of the share of renewable electricity in total electricity
consumption in China for the years 1980-2011. The results indicate that economic growth and
financial development tend to encourage renewable electricity consumption. However, foreign
direct investment, traditional energy sources and trade openness reduce the consumption on
renewable energy. A unidirectional causality is also found running from financial development to
renewable electricity consumption. The results imply that the government policies should gear
towards the use of renewable energy sources to ensure reduced CO2 emissions and sustainable
economic growth in China.
In the context of Malaysia, none of the existing literature has studied the factors affecting
renewable energy consumption in the country. Much of the literature about Malaysia has been
focusing on presenting the descriptive analysis and surveys, which show a review on the current
situation of renewable energy consumption. For example, Petinrin and Shaaban (2015) attempt to
figure out what are the most prospective renewable energy sources in Malaysia. They conclude
that biomass and solar energy are the most potential types of renewable energy in the country. The
study also looks into the effectiveness of the existing renewable strategies implemented in

890 Lin-Sea Lau, Kwang-Jing Yii, Chin-Yu Lee, Yee-Lee Chong, Eng-Heng Lee
Malaysia. Similarly, Mekhilef et al. (2014) give a detailed description on Malaysian energy policies
and renewable energy programs in their study. The study further concludes that enhanced
collaboration between the public and private sectors is needed to fully utilize the renewable energy
sources. In addition, Bujang et al. (2016) also provide a discussion on the renewable energy
initiatives in Malaysia. The study further suggests that more efforts need to be taken in developing
the potential of renewable resources to reduce the consumption of fossil fuel in the country. In an
earlier study by Ahmad, Kadir, and Shafie (2011), the primary sources of renewable energy in
Malaysia, such as solar, mini-hydro, and biomass as well as their potentials are discussed. It is also
highlighted in the study that meeting future energy demand and cutting carbon emissions are the
two main reasons for the country to switch from non-renewable to renewable energy sources.
Likewise, Ahmad and Tahar (2014) study the potential of four different types of renewable
resources (hydropower, solar, wind and biomass) in Malaysia for electricity generation using
analytical hierarchy process (AHP) methodology. The results indicate that solar is the most
potential renewable resource followed by biomass, hydro, and wind respectively. Basri et al. (2015)
go a step further by discussing both energy policies and potential renewable energy sources in their
study. The study also stresses the importance of strategies, such as inclusion of renewable energy
into energy mix, adoption of more effective energy policies and power expansion plan to achieve
sustainability in Malaysia. Most recently, Kardooni et al. (2016) study factors that determine
renewable energy technology acceptance in Peninsular Malaysia. It is revealed that cost of
renewable energy does have an indirect effect on public’s attitude towards the use of renewables
via the associated impact on the perceived ease of use and perceived usefulness.
3. METHODOLOGY
The study uses annual time series data for the period from 1980 to 2015 in Malaysia. The data is
derived from International Energy Statistics, World Development Indicators (WDI) and Emissions
Database for Global Atmospheric Research (EDGAR). The dependent variable in the model refers
to renewable electricity consumption which is measured using renewable electricity net
consumption in billion kWh. Meanwhile, the explanatory variables included are economic growth,
carbon dioxide (CO2) emissions, trade openness, FDI which are denoted by GDP per capita (US$),
CO2 emissions in metric tons per capita, share of import and export in GDP, ratio of foreign
investment to GDP respectively. To reduce the variation and induce stationarity in the variance-
covariance matrix, the natural logarithmic form (ln) is applied to all the variables.
The analysis is started by determining the order of integration of the variables using unit root test.
Augmented Dickey Fuller (ADF) is one of the best known unit root tests based on the model of the
first-order autoregressive process (Box & Jenkins, 1970). In addition, Phillips and Perron (PP) test
allows for milder assumptions on the error distribution and controls for higher order serial
correlation in the series as well as heteroscedasticity. After deciding the order of integration, the
existence of long-run relationship between the variables is tested. The autoregressive distributed
lag (ARDL) method (Pesaran et al., 2001) is proposed due to its effective applications for small
sample sizes compared to Johansen (1988) and Engle and Granger (1987) tests. ARDL is also
applicable irrespective of the variables are integrated of order zero or one or mutually cointegrated
as long as not order two. Moreover, Banerjee et al. (1998) claimed that ARDL does not convert
the short run coefficients into residuals. In essence, ARDL procedure involves the estimation of
Investigating the Determinants of Renewable Energy Consumption in Malaysia: An ARDL Approach 891
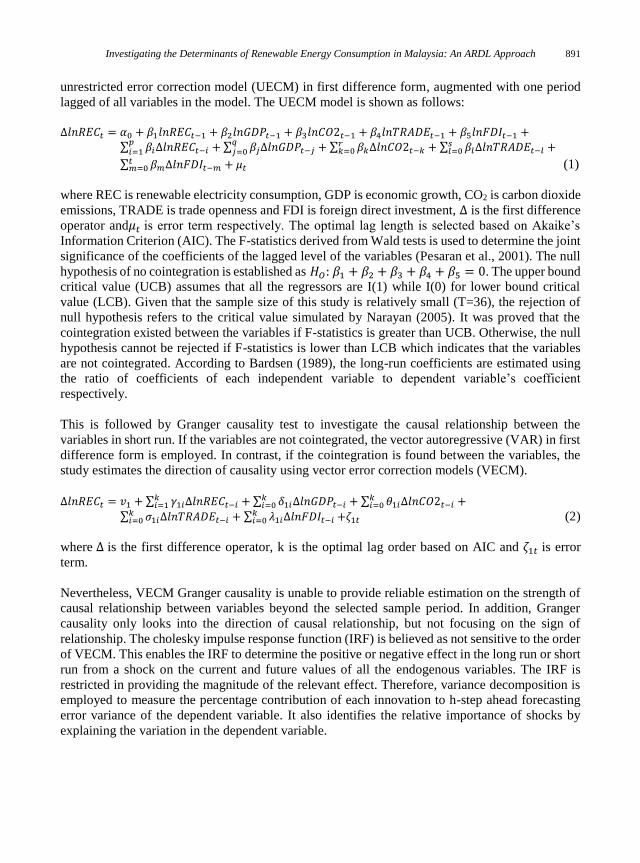
unrestricted error correction model (UECM) in first difference form, augmented with one period
lagged of all variables in the model. The UECM model is shown as follows: ∆𝑙𝑛𝑅𝐸𝐶𝑡 = 𝛼0 + 𝛽1𝑙𝑛𝑅𝐸𝐶𝑡−1 + 𝛽2𝑙𝑛𝐺𝐷𝑃𝑡−1 + 𝛽3𝑙𝑛𝐶𝑂2𝑡−1 + 𝛽4𝑙𝑛𝑇𝑅𝐴𝐷𝐸𝑡−1 + 𝛽5𝑙𝑛𝐹𝐷𝐼𝑡−1 +
∑ 𝛽𝑖∆𝑙𝑛𝑅𝐸𝐶𝑡−𝑖𝑝𝑖=1 + ∑ 𝛽𝑗∆𝑙𝑛𝐺𝐷𝑃𝑡−𝑗
𝑞𝑗=0 + ∑ 𝛽𝑘∆𝑙𝑛𝐶𝑂2𝑡−𝑘
𝑟𝑘=0 + ∑ 𝛽𝑙∆𝑙𝑛𝑇𝑅𝐴𝐷𝐸𝑡−𝑙
𝑠𝑙=0 +
∑ 𝛽𝑚∆𝑙𝑛𝐹𝐷𝐼𝑡−𝑚𝑡𝑚=0 + 𝜇𝑡 (1)
where REC is renewable electricity consumption, GDP is economic growth, CO2 is carbon dioxide
emissions, TRADE is trade openness and FDI is foreign direct investment, ∆ is the first difference
operator and𝜇𝑡 is error term respectively. The optimal lag length is selected based on Akaike’s
Information Criterion (AIC). The F-statistics derived from Wald tests is used to determine the joint
significance of the coefficients of the lagged level of the variables (Pesaran et al., 2001). The null
hypothesis of no cointegration is established as 𝐻𝑂: 𝛽1 + 𝛽2 + 𝛽3 + 𝛽4 + 𝛽5 = 0. The upper bound
critical value (UCB) assumes that all the regressors are I(1) while I(0) for lower bound critical
value (LCB). Given that the sample size of this study is relatively small (T=36), the rejection of
null hypothesis refers to the critical value simulated by Narayan (2005). It was proved that the
cointegration existed between the variables if F-statistics is greater than UCB. Otherwise, the null
hypothesis cannot be rejected if F-statistics is lower than LCB which indicates that the variables
are not cointegrated. According to Bardsen (1989), the long-run coefficients are estimated using
the ratio of coefficients of each independent variable to dependent variable’s coefficient
respectively.
This is followed by Granger causality test to investigate the causal relationship between the
variables in short run. If the variables are not cointegrated, the vector autoregressive (VAR) in first
difference form is employed. In contrast, if the cointegration is found between the variables, the
study estimates the direction of causality using vector error correction models (VECM).
∆𝑙𝑛𝑅𝐸𝐶𝑡 = 𝑣1 + ∑ 𝛾1𝑖∆𝑙𝑛𝑅𝐸𝐶𝑡−𝑖𝑘𝑖=1 + ∑ 𝛿1𝑖∆𝑙𝑛𝐺𝐷𝑃𝑡−𝑖
𝑘𝑖=0 + ∑ 𝜃1𝑖∆𝑙𝑛𝐶𝑂2𝑡−𝑖
𝑘𝑖=0 +
∑ 𝜎1𝑖∆𝑙𝑛𝑇𝑅𝐴𝐷𝐸𝑡−𝑖𝑘𝑖=0 + ∑ 𝜆1𝑖∆𝑙𝑛𝐹𝐷𝐼𝑡−𝑖
𝑘𝑖=0 +𝜁1𝑡 (2)
where ∆ is the first difference operator, k is the optimal lag order based on AIC and 𝜁1𝑡 is error
term.
Nevertheless, VECM Granger causality is unable to provide reliable estimation on the strength of
causal relationship between variables beyond the selected sample period. In addition, Granger
causality only looks into the direction of causal relationship, but not focusing on the sign of
relationship. The cholesky impulse response function (IRF) is believed as not sensitive to the order
of VECM. This enables the IRF to determine the positive or negative effect in the long run or short
run from a shock on the current and future values of all the endogenous variables. The IRF is
restricted in providing the magnitude of the relevant effect. Therefore, variance decomposition is
employed to measure the percentage contribution of each innovation to h-step ahead forecasting
error variance of the dependent variable. It also identifies the relative importance of shocks by
explaining the variation in the dependent variable.
892 Lin-Sea Lau, Kwang-Jing Yii, Chin-Yu Lee, Yee-Lee Chong, Eng-Heng Lee
4. RESULTS
4.1. Descriptive Analysis
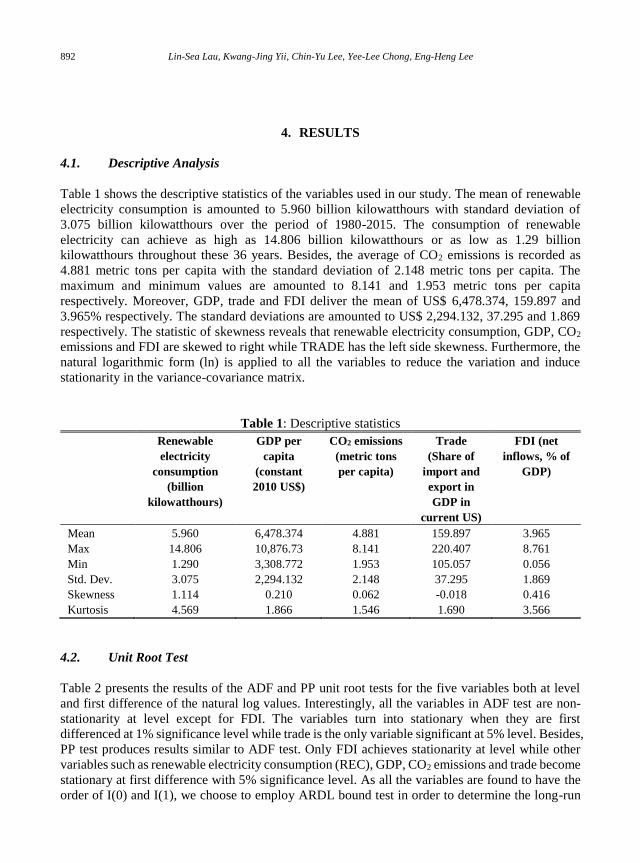
Table 1 shows the descriptive statistics of the variables used in our study. The mean of renewable
electricity consumption is amounted to 5.960 billion kilowatthours with standard deviation of
3.075 billion kilowatthours over the period of 1980-2015. The consumption of renewable
electricity can achieve as high as 14.806 billion kilowatthours or as low as 1.29 billion
kilowatthours throughout these 36 years. Besides, the average of CO2 emissions is recorded as
4.881 metric tons per capita with the standard deviation of 2.148 metric tons per capita. The
maximum and minimum values are amounted to 8.141 and 1.953 metric tons per capita
respectively. Moreover, GDP, trade and FDI deliver the mean of US$ 6,478.374, 159.897 and
3.965% respectively. The standard deviations are amounted to US$ 2,294.132, 37.295 and 1.869
respectively. The statistic of skewness reveals that renewable electricity consumption, GDP, CO2
emissions and FDI are skewed to right while TRADE has the left side skewness. Furthermore, the
natural logarithmic form (ln) is applied to all the variables to reduce the variation and induce
stationarity in the variance-covariance matrix.
Table 1: Descriptive statistics
Renewable
electricity
consumption
(billion
kilowatthours)
GDP per
capita
(constant
2010 US$)
CO2 emissions
(metric tons
per capita)
Trade
(Share of
import and
export in
GDP in
current US)
FDI (net
inflows, % of
GDP)
Mean 5.960 6,478.374 4.881 159.897 3.965
Max 14.806 10,876.73 8.141 220.407 8.761
Min 1.290 3,308.772 1.953 105.057 0.056
Std. Dev. 3.075 2,294.132 2.148 37.295 1.869
Skewness 1.114 0.210 0.062 -0.018 0.416
Kurtosis 4.569 1.866 1.546 1.690 3.566
4.2. Unit Root Test
Table 2 presents the results of the ADF and PP unit root tests for the five variables both at level
and first difference of the natural log values. Interestingly, all the variables in ADF test are non-
stationarity at level except for FDI. The variables turn into stationary when they are first
differenced at 1% significance level while trade is the only variable significant at 5% level. Besides,
PP test produces results similar to ADF test. Only FDI achieves stationarity at level while other
variables such as renewable electricity consumption (REC), GDP, CO2 emissions and trade become
stationary at first difference with 5% significance level. As all the variables are found to have the
order of I(0) and I(1), we choose to employ ARDL bound test in order to determine the long-run

Investigating the Determinants of Renewable Energy Consumption in Malaysia: An ARDL Approach 893
cointegration between GDP, CO2 emissions, trade and FDI with REC in Malaysia. Furthermore, it
is also applicable in VECM Granger causality with the integration of I(0) and I(1) (Sinha & Sinha,
1998).
Table 2: Unit root test
ADF PP
Level Difference Level Difference
REC -3.1020(1) -5.3638(1)*** -2.2602 -4.7036***
GDP -1.7677(0) -4.8434(0)*** -1.9633 -4.8434***
CO2 -0.8178(0) -4.5520(8)*** -1.0483 -4.8662***
TRADE -0.4222(1) -4.0373(0)** 0.0900 -3.8114**
FDI -5.0415(0)*** -6.4872(1)*** -5.0448*** -23.6103***
Notes: Both intercept and deterministic trendare included in the test equation for the variable in level and first difference.
The ADF and PP are estimated with t-Statistic. The optimal lag length in ADF equation is reported in ( ) and based on AIC.
***, ** and * denote significance at 1%, 5% and 10%, respectively.
4.3. ARDL Bound Test
Table 3 presents the results of the bounds test based on REC and its determinants. The ARDL (1,
4, 0, 2, 3) model is selected to fit the data of value added per capita in service sector. The optimal
lag selected is one based on AIC tests. The computed F-statistic of 13.591 in ARDL bound test is
greater than the upper critical bound value of 6.250 at 1% significance level based on Narayan
(2005). The rejection of null hypothesis of no cointegration suggests that the existence of steady-
state long-run relationship among GDP, CO2 emissions, trade, FDI and renewable electricity
consumption in Malaysia. This is in line with the studies conducted by Sardorsky (2009) and Sebri
and Ben-Salha (2014) who reveal a long-run relationship among the variables.
Table 3: ARDL bound test
Model F-statistic Conclusion
REC = f (GDP, CO2, TRADE, FDI) 13.591*** Cointegrated
Optimal lag [1,4, 0, 2, 3]
Critical value I(0) I(1)
1% significance level 4.428 6.250
5% significance level 3.202 4.544
10% significance level 2.660 3.838
Diagnostic test
Breusch-Godfrey LM test 0.4654 (0.6366)
Heteroskedasticity test 0.0300 (0.8636)
Ramsey RESET 0.0493 (0.9613)
Notes: Critical values: case III: unrestricted intercept and no trend (k=4, T=40). ( ) refers to p-values.
The robustness of the model is confirmed by the diagnostic tests, such as Breusch-Godfrey serial
correlation Lagrange multiplier (LM), autoregressive conditional heteroskedasticity (ARCH) and
Ramsey RESET. The Breusch-Godfrey serial correlation LM test indicates that the model is free
from serial correlation problem. There is no heteroskedasticity problem found from ARCH test..

894 Lin-Sea Lau, Kwang-Jing Yii, Chin-Yu Lee, Yee-Lee Chong, Eng-Heng Lee
In addition, Ramsey RESET test indicates that there is no functional form misspecification.
Furthermore, plots of cumulative sum (CUSUM) and CUSUM of squares tests in Figure 1 point
out that no misspecification and structural instability of long-run and short-run estimated
parameters appeared in the sample period. This implies that the estimated parameters of the model
produce a reliable estimation.
Figure 1: Plot of cumulative sum (CUSUM) and CUSUM of squares tests for the equation of
renewable electricity consumption
Table 4 indicates the results of long-run elasticities of explanatory variables on renewable
electricity consumption. Interestingly, all the explanatory variables are found to be significant in
explaining the renewable electricity consumption in the long run for Malaysia except CO2
emissions. It is evident that GDP possesses a positive and significant coefficient throughout the
long run at 10% significance level, indicating that 1% increase of GDP would increase the
renewable electricity consumption by 1.189%. The estimated income elasticity of renewable
electricity consumption or demand is positively greater than 1, indicating that it can be considered
as a superior good in Malaysia. The result is within our expectation as higher economic growth
would allow the economy to have more resources to promote the use of greener energy sources
that include renewable electricity. In the meantime, better economic performance enables people
in the country to have more income to be spent on environmental protection and to demand more
of renewable energy. The positive impact of GDP on renewable electricity consumption is verified
by previous studies, such as Marques and Fuinhas (2011). In addition, the finding further implies
the importance of economic growth in boosting renewable electricity consumption by increasing
its ability to develop technologies related to renewable electricity in Malaysia.
This positive coefficient also implies that Malaysian government has been concentrating on the
sustainable energy in line with the strategic thrust 4 of the eleventh Malaysia Plan. One of the focus
areas in the strategic thrust is to adopt the sustainable consumption and production concept that
aims to provide at least 2,080 MW in renewable energy installed capacity. Meanwhile, the
government also allocates RM5 billion to implement the Green Technology Financing Scheme in
Malaysian Budget 2018 to ensure a sustainable green development.
-12
-8
-4
0
4
8
12
2000 2002 2004 2006 2008 2010 2012 2014
CUSUM 5% Significance
-0.4
0.0
0.4
0.8
1.2
1.6
2000 2002 2004 2006 2008 2010 2012 2014
CUSUM of Squares 5% Significance

Investigating the Determinants of Renewable Energy Consumption in Malaysia: An ARDL Approach 895
Besides, an additional percentage increase in FDI also significantly raises renewable electricity
consumption by 0.299%. This suggests that technological transfer through FDI has successfully
enhanced the consumption of renewable electricity. Our finding agrees with the popular belief that
FDI is essential in improving renewable electricity consumption. Nonetheless, the result does not
support the findings of previous studies, such as Peterson (2007) who finds no evidence of a
positive relationship between FDI and renewable energy consumption. This is due to the change
in the global perception of renewable energy particularly in the electricity sector compared to a
decade ago. Nowadays, renewable energy technologies are not only used for the enhancement of
energy security and mitigation of climate change, but also an important factor contributing to the
nation’s economic development either directly or indirectly.
Trade openness is found to be negatively related to renewable electricity consumption in the long
run. The renewable electricity consumption is diminished by 1.352% with one percent increase in
trade openness. The result indicates that foreign trade is not able to encourage the exchange of
renewable technologies in electricity generation via technological transfer. In other words, it does
not promote the consumption of renewable electricity in Malaysia. This finding is in line with the
result reported by Lin et al. (2016). However, it contradicts with conclusions documented in
literature such as Ben Jebli and Ben Youssef (2015) and Omri and Nguyen (2014) who claim that
trade openness leads to an increase in the use of renewable energy.
On the other hand, our results show that CO2 emissions do not have a significant impact on
renewable electricity consumption. The value of the coefficient is positive though not significant.
This indicates that our finding is not in line with previous studies such as Marques, Fuinhas, and
Manso (2010) who suggest that the deterioration of environmental quality tends to reduce
renewable electricity consumption. The positive relationship between CO2 emissions and
renewable electricity consumption, however, is consistent with Omri and Nguyen (2014) and
Sadorsky (2009) who claim that a rise in CO2 emissions is the major driver for renewable electricity
consumption. In the case of Malaysia, a positive but yet insignificant relationship between the two
variables can be explained by the fact that public awareness on the importance of utilizing
renewable electricity is still weak among Malaysians.
Table 4: Long-run coefficient of renewable electricity consumption
Variable Coefficient Standard Error t-Statistic
C -2.482 5.914 -0.419
GDP 1.189* 0.666 1.783
CO2 0.429 0.596 0.719
TRADE -1.352*** 0.275 -4.908
FDI 0.299*** 0.097 3.056
Notes: ***, ** and * denote significance at 1%, 5% and 10%, respectively
4.4. VECM Granger Causality test
The results of Granger causality as shown in Table 5 indicates that GDP does Granger-cause
renewable electricity consumption in a unidirectional way at 10% significance level. This result
confirms the importance of economic development of Malaysia in promoting renewable electricity
consumption. Similar to findings obtained by Furuoka (2017) and Kula (2014), a unidirectional

896 Lin-Sea Lau, Kwang-Jing Yii, Chin-Yu Lee, Yee-Lee Chong, Eng-Heng Lee
causality is also found from GDP to renewable electricity consumption. However, our finding
differs from studies by Farhani and Shahbaz (2014) and Al-mulali, Fereidouni, and Lee (2014)
who found no causality and a bidirectional relationship between economic growth and renewable
electricity consumption respectively.
In addition, a unidirectional causal relationship is found from trade openness to CO2 emissions at
1% significance level indicating that trade liberalisation does contribute to the deterioration of
environmental quality in Malaysia. It is consistent with the findings of Kasman and Duman (2015)
who also discover a unidirectional causality from trade openness to CO2 emissions in the case of
new EU member countries. Our result, however, is contradictory with the finding by Ohlan (2015)
who suggests that there is no causality between the two variables.
Last but not least, with the expected negative sign, the speed of adjustment on the lagged ECT for
renewable electricity consumption represents a significant long-run causal effect which is
consistent with the results of ARDL. The ECT indicates that renewable electricity consumption
will converge its equilibrium within 22.08 years after the shocks with the adjustment of 4.53% per
annum.
Table 5: VECM granger causality
Dependent
variables
D(REC) D(GDP) D(CO2) D(TRADE) D(FDI) ECT(-1)
D(REC) - 3.5041* 1.7657 0.0285 0.1219 -0.0453***
D(GDP) 0.0299 - 0.0441 1.2022 0.0007 0.0016
D(CO2) 1.1187 1.2484 - 7.1720*** 0.0042 0.0058
D(TRADE) 1.2587 0.4189 0.8548 - 0.0029 0.0011
D(FDI) 0.6351 0.0371 0.1555 0.2362 - 0.2469***
Notes: ***, ** and * denote significance at 1%, 5% and 10%, respectively
4.5. Impulse Response Function
Figure 2 indicates the results of impulse response function that visualize the destabilization
experienced by the endogenous variables (REC, GDP, CO2 emissions, TRADE and FDI) in
response to one external standard deviation (SD) shock within other variables. Renewable
electricity consumption is found to be significantly responsive to its own shock in the second period
with the continuing negative effect. Besides, the response of REC to one SD shock of GDP reveals
the positive trend from the second year to tenth year. This supports the long-run positive
relationship between GDP and renewable electricity consumption in Malaysia. Moreover, the REC
would be increased in the first year, then slightly decreasing to fourth year when there is one SD
shock given to CO2 emissions. Subsequently, the impact on REC from the shock of CO2 emissions
continues to increase until tenth year.
In addition, the response of REC is found to be negative after the first year when there is an
occurrence of a shock in trade. This is in line with the findings of negative coefficient in TRADE
towards renewable electricity consumption. Similarly, the response of REC from the shock of FDI
indicates a drop for REC after the first year. Furthermore, the shocks of all the variables (GDP,
CO2, TRADE and FDI) on the response of REC are found to make a turning change at the first
year before following the trend throughout the remaining periods. This indicates the actual

Investigating the Determinants of Renewable Energy Consumption in Malaysia: An ARDL Approach 897
responses are only found after the first year in order to determine the adjustment towards the shock
of REC.
On the other hand, the response of GDP to its own shocks is significant and negative in the fifth
period. TRADE possesses the significant response to its own shocks in the sixth period with
marginal movement. For the response of CO2 emissions, it is significant and negative to its own
shock in the second period while the third period from the shock of GDP. Last but not least, the
significant and negative responses to FDI are found from the shocks of GDP and FDI in the first
period.
Figure 2: Impulse response functions
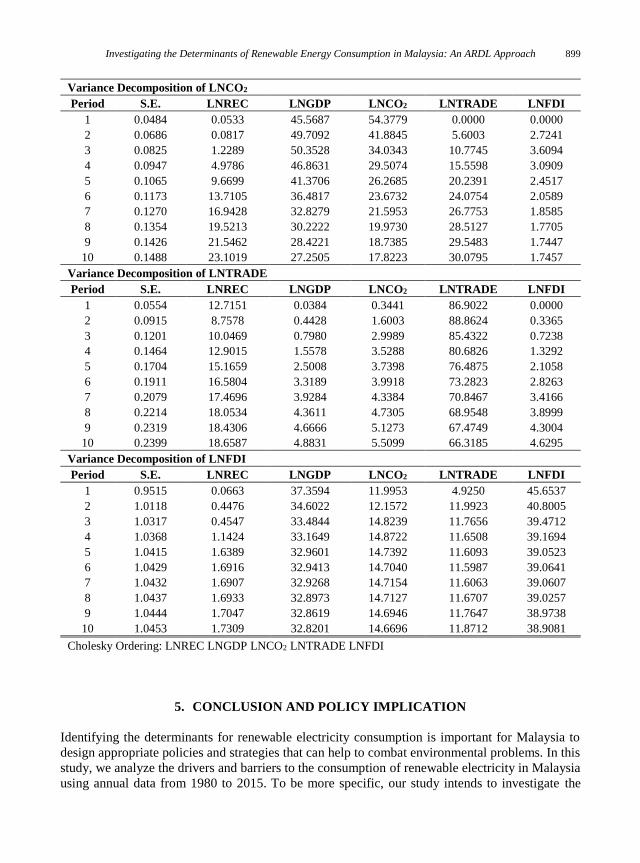
4.6. Variance decomposition analysis
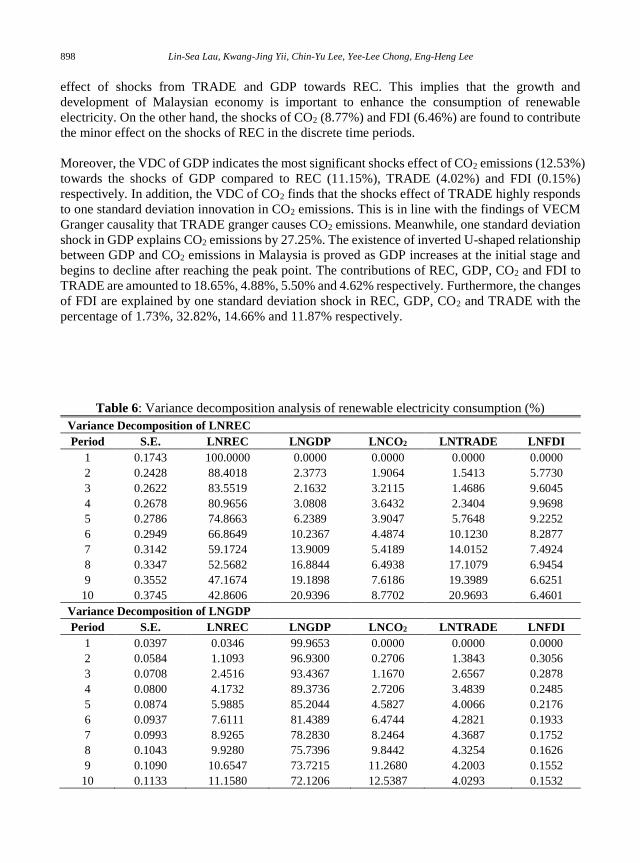
Table 6 shows the results of variance decomposition analysis (VDC) that separate the variation for
each endogenous variable into the component shocks to the VECM. The VDC of renewable
electricity consumption (REC) clearly indicates that TRADE and GDP are vitally explaining the
innovation to renewable electricity consumption. The shocks to REC in response to a one standard
deviation innovation in TRADE and GDP highly range from 0% to 20.96% and 20.93%
respectively. Similar to the findings of ARDL and IRF, these VDC findings confirm the dynamic
- .1
.0
.1
.2
2 4 6 8 10
Response of LNREC to LNREC
- .1
.0
.1
.2
2 4 6 8 10
Response of LNREC to LNGDP
- .1
.0
.1
.2
2 4 6 8 10
Response of LNREC to LNCO2
- .1
.0
.1
.2
2 4 6 8 10
Response of LNREC to LNTRADE
- .1
.0
.1
.2
2 4 6 8 10
Response of LNREC to LNFDI
- .02
.00
.02
.04
.06
2 4 6 8 10
Response of LNGDP to LNREC
- .02
.00
.02
.04
.06
2 4 6 8 10
Response of LNGDP to LNGDP
- .02
.00
.02
.04
.06
2 4 6 8 10
Response of LNGDP to LNCO2
- .02
.00
.02
.04
.06
2 4 6 8 10
Response of LNGDP to LNTRADE
- .02
.00
.02
.04
.06
2 4 6 8 10
Response of LNGDP to LNFDI
.00
.04
2 4 6 8 10
Response of LNCO2 to LNREC
.00
.04
2 4 6 8 10
Response of LNCO2 to LNGDP
.00
.04
2 4 6 8 10
Response of LNCO2 to LNCO2
.00
.04
2 4 6 8 10
Response of LNCO2 to LNTRADE
.00
.04
2 4 6 8 10
Response of LNCO2 to LNFDI
- .05
.00
.05
.10
2 4 6 8 10
Response of LNTRADE to LNREC
- .05
.00
.05
.10
2 4 6 8 10
Response of LNTRADE to LNGDP
- .05
.00
.05
.10
2 4 6 8 10
Response of LNTRADE to LNCO2
- .05
.00
.05
.10
2 4 6 8 10
Response of LNTRADE to LNTRADE
- .05
.00
.05
.10
2 4 6 8 10
Response of LNTRADE to LNFDI
- .4
.0
.4
.8
2 4 6 8 10
Response of LNFDI to LNREC
- .4
.0
.4
.8
2 4 6 8 10
Response of LNFDI to LNGDP
- .4
.0
.4
.8
2 4 6 8 10
Response of LNFDI to LNCO2
- .4
.0
.4
.8
2 4 6 8 10
Response of LNFDI to LNTRADE
- .4
.0
.4
.8
2 4 6 8 10
Response of LNFDI to LNFDI
898 Lin-Sea Lau, Kwang-Jing Yii, Chin-Yu Lee, Yee-Lee Chong, Eng-Heng Lee
effect of shocks from TRADE and GDP towards REC. This implies that the growth and
development of Malaysian economy is important to enhance the consumption of renewable
electricity. On the other hand, the shocks of CO2 (8.77%) and FDI (6.46%) are found to contribute
the minor effect on the shocks of REC in the discrete time periods.
Moreover, the VDC of GDP indicates the most significant shocks effect of CO2 emissions (12.53%)
towards the shocks of GDP compared to REC (11.15%), TRADE (4.02%) and FDI (0.15%)
respectively. In addition, the VDC of CO2 finds that the shocks effect of TRADE highly responds
to one standard deviation innovation in CO2 emissions. This is in line with the findings of VECM
Granger causality that TRADE granger causes CO2 emissions. Meanwhile, one standard deviation
shock in GDP explains CO2 emissions by 27.25%. The existence of inverted U-shaped relationship
between GDP and CO2 emissions in Malaysia is proved as GDP increases at the initial stage and
begins to decline after reaching the peak point. The contributions of REC, GDP, CO2 and FDI to
TRADE are amounted to 18.65%, 4.88%, 5.50% and 4.62% respectively. Furthermore, the changes
of FDI are explained by one standard deviation shock in REC, GDP, CO2 and TRADE with the
percentage of 1.73%, 32.82%, 14.66% and 11.87% respectively.
Table 6: Variance decomposition analysis of renewable electricity consumption (%)
Variance Decomposition of LNREC
Period S.E. LNREC LNGDP LNCO2 LNTRADE LNFDI
1 0.1743 100.0000 0.0000 0.0000 0.0000 0.0000
2 0.2428 88.4018 2.3773 1.9064 1.5413 5.7730
3 0.2622 83.5519 2.1632 3.2115 1.4686 9.6045
4 0.2678 80.9656 3.0808 3.6432 2.3404 9.9698
5 0.2786 74.8663 6.2389 3.9047 5.7648 9.2252
6 0.2949 66.8649 10.2367 4.4874 10.1230 8.2877
7 0.3142 59.1724 13.9009 5.4189 14.0152 7.4924
8 0.3347 52.5682 16.8844 6.4938 17.1079 6.9454
9 0.3552 47.1674 19.1898 7.6186 19.3989 6.6251
10 0.3745 42.8606 20.9396 8.7702 20.9693 6.4601
Variance Decomposition of LNGDP
Period S.E. LNREC LNGDP LNCO2 LNTRADE LNFDI
1 0.0397 0.0346 99.9653 0.0000 0.0000 0.0000
2 0.0584 1.1093 96.9300 0.2706 1.3843 0.3056
3 0.0708 2.4516 93.4367 1.1670 2.6567 0.2878
4 0.0800 4.1732 89.3736 2.7206 3.4839 0.2485
5 0.0874 5.9885 85.2044 4.5827 4.0066 0.2176
6 0.0937 7.6111 81.4389 6.4744 4.2821 0.1933
7 0.0993 8.9265 78.2830 8.2464 4.3687 0.1752
8 0.1043 9.9280 75.7396 9.8442 4.3254 0.1626
9 0.1090 10.6547 73.7215 11.2680 4.2003 0.1552
10 0.1133 11.1580 72.1206 12.5387 4.0293 0.1532
Investigating the Determinants of Renewable Energy Consumption in Malaysia: An ARDL Approach 899
Variance Decomposition of LNCO2
Period S.E. LNREC LNGDP LNCO2 LNTRADE LNFDI
1 0.0484 0.0533 45.5687 54.3779 0.0000 0.0000
2 0.0686 0.0817 49.7092 41.8845 5.6003 2.7241
3 0.0825 1.2289 50.3528 34.0343 10.7745 3.6094
4 0.0947 4.9786 46.8631 29.5074 15.5598 3.0909
5 0.1065 9.6699 41.3706 26.2685 20.2391 2.4517
6 0.1173 13.7105 36.4817 23.6732 24.0754 2.0589
7 0.1270 16.9428 32.8279 21.5953 26.7753 1.8585
8 0.1354 19.5213 30.2222 19.9730 28.5127 1.7705
9 0.1426 21.5462 28.4221 18.7385 29.5483 1.7447
10 0.1488 23.1019 27.2505 17.8223 30.0795 1.7457
Variance Decomposition of LNTRADE
Period S.E. LNREC LNGDP LNCO2 LNTRADE LNFDI
1 0.0554 12.7151 0.0384 0.3441 86.9022 0.0000
2 0.0915 8.7578 0.4428 1.6003 88.8624 0.3365
3 0.1201 10.0469 0.7980 2.9989 85.4322 0.7238
4 0.1464 12.9015 1.5578 3.5288 80.6826 1.3292
5 0.1704 15.1659 2.5008 3.7398 76.4875 2.1058
6 0.1911 16.5804 3.3189 3.9918 73.2823 2.8263
7 0.2079 17.4696 3.9284 4.3384 70.8467 3.4166
8 0.2214 18.0534 4.3611 4.7305 68.9548 3.8999
9 0.2319 18.4306 4.6666 5.1273 67.4749 4.3004
10 0.2399 18.6587 4.8831 5.5099 66.3185 4.6295
Variance Decomposition of LNFDI
Period S.E. LNREC LNGDP LNCO2 LNTRADE LNFDI
1 0.9515 0.0663 37.3594 11.9953 4.9250 45.6537
2 1.0118 0.4476 34.6022 12.1572 11.9923 40.8005
3 1.0317 0.4547 33.4844 14.8239 11.7656 39.4712
4 1.0368 1.1424 33.1649 14.8722 11.6508 39.1694
5 1.0415 1.6389 32.9601 14.7392 11.6093 39.0523
6 1.0429 1.6916 32.9413 14.7040 11.5987 39.0641
7 1.0432 1.6907 32.9268 14.7154 11.6063 39.0607
8 1.0437 1.6933 32.8973 14.7127 11.6707 39.0257
9 1.0444 1.7047 32.8619 14.6946 11.7647 38.9738
10 1.0453 1.7309 32.8201 14.6696 11.8712 38.9081
Cholesky Ordering: LNREC LNGDP LNCO2 LNTRADE LNFDI
5. CONCLUSION AND POLICY IMPLICATION
Identifying the determinants for renewable electricity consumption is important for Malaysia to
design appropriate policies and strategies that can help to combat environmental problems. In this
study, we analyze the drivers and barriers to the consumption of renewable electricity in Malaysia
using annual data from 1980 to 2015. To be more specific, our study intends to investigate the

900 Lin-Sea Lau, Kwang-Jing Yii, Chin-Yu Lee, Yee-Lee Chong, Eng-Heng Lee
long-run and causal relationship among renewable electricity consumption, economic growth, CO2
emissions, foreign direct investment and trade openness using autoregressive distributed lag
(ARDL) bounds testing cointegration approach and VECM Granger causality test respectively.
Results obtained from autoregressive distributed lag (ARDL) bounds testing cointegration
approach reveal that economic growth and FDI are the main drivers for renewable electricity
consumption in Malaysia. This implies that renewable electricity consumption could be further
enhanced via an increase in GDP and FDI. On the other hand, trade openness is discovered to have
a negative effect on renewable electricity consumption in the long run, indicating that exchanges
of goods and services among countries tend to hinder the consumption of renewable electricity. It
is found that CO2 emissions insignificantly affect renewable electricity consumption. Furthermore,
a unidirectional causality relationship is found running from GDP to renewable electricity
consumption, suggesting that conservation hypothesis is valid for Malaysia. It is also confirmed
that a unidirectional Granger causality is running from trade openness to CO2 emissions, but not
vice versa.
Several important policy implications can be drawn based on the results obtained. In relation to
this, the policy makers should continue to implement sound fiscal and monetary policies that can
ensure robust growth while encouraging the development of renewable energy in the country. We
also find that FDI has a positive impact on renewable electricity consumption. This result is
indicative of the fact that FDI can be utilized as a tool to promote the use of renewables. While
attracting more FDI, the Malaysian government needs to ensure that only those foreign investors
who develop and adopt renewable energy are welcome to the country.
In recent years, awareness on environmental issues has increased among Malaysians. However, a
lot more efforts need to be done to increase awareness.1 Thus, Malaysia must relook into the
effectiveness of current measures aimed at creating greater public awareness on the importance of
adopting renewable electricity in combating environmental problems. Adding to the existing
policies that geared towards improving environmental quality, the government should consider
adopting more effective ways of developing environmental awareness among Malaysians. For
example, government agencies can make use of media (print, broadcast or Internet) to enhance
education and awareness of people on environmental protection. Besides, incorporating
environmental education into the current science classes in schools can be another effective way
to create a sense of responsibility to the environment among children and young adults. By
enhancing public awareness, it is hoped that renewable electricity consumption can be enhanced
in Malaysia.
As trade openness hinders the consumption of renewable electricity, it is suggested that the policy
makers have to ensure that trade between Malaysia and trading partners involves the transfer or
use of technologies related to renewables. In this context, for example, the government can
encourage the use of renewables among local exporters by providing them incentives, such as tax
exemption.
Our finding of a unidirectional causality running from GDP to renewable electricity but not vice
versa is in line with the ‘conservation hypothesis’. The ‘conservation hypothesis’ implies that
1Despite various strategies and efforts taken to curb pollution, Malaysia remains as one of the top 30 CO2 emitters in the world.
Investigating the Determinants of Renewable Energy Consumption in Malaysia: An ARDL Approach 901
Malaysia may implement energy conservation policies without affecting its economic performance.
In other words, a reduction in renewable electricity consumption would not retard the GDP growth.
On the other hand, as economic growth helps to stimulate the use of renewable electricity as our
finding suggested, it is vital therefore for Malaysia to come up with economic policies that would
lead to robust growth.
ACKNOWLEDGEMENT
This research is funded by research grant scheme (IPSR/RMC/UTARRF/2016-C2/C05), Universiti
Tunku Abdul Rahman (UTAR), Malaysia.
REFERENCES
Ahmad, S., Kadir, M. Z. A. A., & Shafie, S. (2011). Current perspective of the renewable energy
development in Malaysia. Renewable and Sustainable Energy Reviews, 15, 897-904.
Ahmad, S., & Tahar, R. M. (2014). Selection of renewable energy sources for sustainable
development of electricity generation system using analytic hierarchy process: A case of
Malaysia. Renewable Energy, 63, 458-466.
Al-Iriani, M. A. (2006). Energy-GDP relationship revisited: an example from GCC countries using
panel causality. Energy Policy, 34, 3342-3350.
Al-mulali, O. (2011). Oil consumption, CO2 emission and economic growth in MENA countries.
Energy, 36, 6165-6171.
Al-mulali, U., Fereidouni, H. G., & Lee, J. Y. (2014). Electricity consumption from renewable and
non-renewable sources and economic growth: Evidence from Latin American countries.
Renewable and Sustainable Energy Reviews, 30, 290-298.
Apergis, N., & Payne, J. E. (2010). Renewable energy consumption and economic growth:
evidence from a panel of OECD countries. Energy Policy, 38, 656-660.
Banerjee, A., Dolado, J., & Mestre, R. (1998). Error‐correction mechanism tests for cointegration
in a single‐equation framework. Journal of time series analysis, 19, 267-283.
Bardsen, G. (1989). Estimation of long run coefficients in error correction models. Oxford Bulletin
of Economics and Statistics, 51, 345-350.
Basri, N. A., Ramli, A. T., & Aliyu, A. S. (2015). Malaysia energy strategy towards sustainability:
A panoramic overview of the benefits and challenges. Renewable and Sustainable Energy
Reviews, 42, 1094-1105.
Belloumi, M. (2009). Energy consumption and GDP in Tunisia: cointegration and causality
analysis. Energy Policy, 37, 2745-2753.
Ben Jebli, M., & Ben Youssef, S. (2015). The environmental Kuznets curve, economic growth,
renewable and non-renewable energy, and trade in Tunisia. Renewable and Sustainable
Energy Reviews, 47, 173-185.
Ben Jebli, M., Ben Youssef, S., & Ozturk, I. (2015). Testing environmental Kuznets curve
hypothesis: The role of renewable and non-renewable energy consumption and trade in
OECD countries. Ecological Indicators, 60, 824-831.
Box, G. E., & Jenkins, G. M. (1970). Time Series Analysis, Forecasting and Control. San Francisco:
Holden-Day.
902 Lin-Sea Lau, Kwang-Jing Yii, Chin-Yu Lee, Yee-Lee Chong, Eng-Heng Lee
Borozan, D. (2013). Exploring the relationship between energy consumption and GDP: evidence
from Croatia. Energy Policy, 59, 373-381.
Bujang, A. S., Bern, C. J., & Brumm, T. J. (2016). Summary of energy demand and renewable
energy policies in Malaysia. Renewable and Sustainable Energy Reviews, 53, 1459-1467.
Dagher, I., & Yacoubian, T. (2012). The causal relationship between energy consumption and
economic growth in Lebanon. Energy Policy, 50, 795-801.
Engle, R. F., & Granger, C. W. (1987). Cointegration and error correction: Representation,
estimation, and testing. Econometrica, 55, 251-276.
Farhani, S., & Shahbaz, M. (2014). What role of renewable and non-renewable electricity
consumption and output is needed to initially mitigate CO2 emissions in MENA region?
Renewable and Sustainable Energy Reviews, 40, 80-90.
Furuoka, F. (2017). Renewable electricity consumption and economic development: New findings
from the Baltic countries. Renewable and Sustainable Energy Reviews, 71, 450-463.
Ghali, K. H., & El-Sakka, M. I. T. (2004). Energy use and output growth in Canada: a multivariate
cointegration analysis. Energy Economics, 26, 225-238.
Hossein, A., Yazdan, G. F., & Ehsan, A. G. (2012). The relationship between energy consumption,
energy prices and economic growth: case study (OPEC countries). OPEC Energy Reviews,
36, 272-286.
Johansen, S. (1988). Statistical analysis of cointegration vectors. Journal of economic dynamics
and control, 12, 231-254.
Kardooni, R., Yusof, S., & Kari, F. (2016). Renewable energy technology acceptance in Peninsular
Malaysia. Energy Policy, 88, 1-10.
Kasman, A., & Duman, Y. S. (2015). CO2 emissions, economic growth, energy consumption, trade
and urbanization in new EU member and candidate countries: a panel data analysis.
Economic Modelling, 44, 97-103.
Klugman, J. (2011). Sustainability and equity: A better future for all (Human Development
Report). New York. USA: UNDP.
Kula, F. (2014). The long-run relationship between renewable electricity consumption and GDP:
evidence from panel data. Energy Sources, Part B: Economics, Planning, and Policy, 9,
156-160.
Kum, H., Ocal, O., & Aslan, A. (2012). The relationship among natural gas energy consumption,
capital and economic growth: bootstrap-corrected causality tests from G-7 countries.
Renewable and Sustainable Energy Reviews, 16, 2361-2365.
Lee, C. C., Chang, C. P., & Chen, P. F. (2008). Energy-income causality in OECD countries
revisited: The key role of capital stock. Energy Economics, 30, 2359-2373.
Lin, B., Omoju, O. E., & Okonkwo, J. U. (2016). Factors influencing renewable electricity
consumption in China. Renewable and Sustainable Energy Reviews, 55, 687-696.
Marques, A. C., & Fuinhas, J. A. (2011). Drivers promoting renewable energy: A dynamic panel
approach. Renewable and Sustainable Energy Reviews, 15, 1601-1608.
Marques, A. C., Fuinhas, J. A., & Manso, J. P. (2010). Motivations driving renewable energy in
European countries: A panel data approach. Energy policy, 38, 6877-6885.
Mekhilef, S., Barimani, M., Safari, A., & Salam, Z. (2014). Malaysia’s renewable energy policies
and program with green aspects. Renewable and Sustainable Energy Reviews, 40, 497-
504.
Narayan, P. K. (2005). The saving and investment nexus for China: evidence from cointegration
tests. Applied Economics, 37, 1979-1990.
Investigating the Determinants of Renewable Energy Consumption in Malaysia: An ARDL Approach 903
Ohlan, R. (2015). The impact of population density, energy consumption, economic growth and
trade openness on CO2 emissions in India. Natural Hazards, 79, 1409-1428.
Omri, A., & Nguyen, D. K. (2014). On the determinants of renewable energy consumption:
International evidence. Energy, 72, 554-560.
Payne, J. E., & Taylor, J. P. (2008). Nuclear energy consumption and economic growth in the U.S:
an empirical note. Energy Sources, 5, 301-307.
Pesaran, M. H., Shin, Y., & Smith, R. J. (2001). Bounds testing approaches to the analysis of level
relationships. Journal of Applied Econometrics, 16, 289-326.
Peterson, S. (2007). Greenhouse gas mitigation in developing countries through technology
transfer?: a survey of empirical evidence. Mitigation and Adaptation Strategies for Global
Change, 13, 283-305.
Petinrin, J. O., & Shaaban, M. (2015). Renewable energy for continuous energy sustainability in
Malaysia. Renewable and Sustainable Energy Reviews, 50, 967-981.
Sadorsky, P. (2009). Renewable energy consumption, CO2 emissions and oil prices in the G7
countries. Energy Economics, 31, 456-462.
Saidi, K., & Mbarek, M. B. (2016). Nuclear energy, renewable energy, CO2 emissions, and
economic growth for nine developed countries: Evidence from panel Granger causality
tests. Progress in Nuclear Energy, 88, 364-374.
Sebri, M., & Ben-Salha, O. (2014). On the causal dynamics between economic growth, renewable
energy consumption, CO2 emissions and trade openness: fresh evidence from BRICS
countries. Renewable and Sustainable Energy Reviews, 39, 14-23.
Sinha, D., & Sinha, T. (1998). Cart before the horse? The saving-growth nexus in Mexico.
Economics Letters, 61, 43-47.
Sovacool, B. (2009). Rejecting renewables: the socio-technical impediments to renewable
electricity in the United States. Energy Policy, 37, 4500-4513.
Stadelmann, M., & Castro, P. (2014). Climate policy innovation in the South-domestic and
international determinants of renewable energy policies in developing and emerging
countries. Global Environmental Change, 29, 413-423.
Vachon, S., & Menz, F. (2006). The role of social, political, and economic interests in promoting
state green electricity policies. Environmental Science & Policy, 9, 652-662.
Yang, H. Y. (2000). Coal consumption and economic growth in Taiwan. Energy Sources, 22, 9-
15.