investigating the underlying item characteristics in nifu
TRANSCRIPT
Investigating the underlying item
characteristics in NIFU’s 1+1 tests for
elementary mathematics
Ymkje Elisabeth Haverkamp
Assessment, Measurement and Evaluation
30 credits Master’s Thesis
Centre for Educational Measurement (CEMO)
Faculty of Educational Sciences
May, 2020
1
Popular abstract
Large amounts of text might make mathematical word problems more complex for lower
elementary students. This, and other factors, such as comparative words and mathematical
content, that can relate to a math problems difficulty, were studied by analyzing the responses
to two mathematics tests, one for grade two and one for grade three. The main finding is that
number of words and the use of comparative words such as ‘more’, or ‘less’ in a math word
problem can contribute to the overall difficulty of the problem. It is therefore recommended
that number of words and comparative terms in math problems are taken into consideration in
math education and research, and that future research includes and further investigates the
relationship between language factors and mathematical problem difficulty.

2
Acknowledgements
Over the past year, while preparing for, and writing my thesis, I have had the fortune
to be guided along the way by two exceedingly dedicated supervisors. Johan and Stephan,
thank you both for helping me find the flexibility and endurance needed while working with
real life data, and for the fast replies over all possible online platforms. Johan, you helped me
find structure in my text, and always encouraged me to see the worth in my work. Stephan,
you made me feel welcome at NIFU, you and Vibeke Opheim were always available for
advice, not just with regards to the thesis, but also on a future career in research.
I would also like to thank the members of the CEMO staff, it has been a pleasure to
learn from all of you. Some special mentions: Siri Heslien, for your aid with all the chaotic
paperwork and all other possible issues. Björn Andersson, for the most coherent lecture slides
on IRT ever, they have been my guide throughout this thesis. Ronny Scherer, for your
uplifting teaching and great notes on lme4. Alexandra Niculescu and Stefan Schauber, thank
you both for introducing me to my new writing bible, and for the waffles...
In addition, a big thank you to my classmates for being an amazing group of
colleagues and friends. I value all the class discussions, the interesting insights, and I can’t
wait to see what you all end up doing!
Last but not least, I want to thank my emotional cheerleaders, min samboer, Kristian,
who selflessly offered up the dinner table to make me a home-office during quarantine and
put up with my thesis moods. My family, my friends ‘from back home’, and my friends ‘from
home here’. Special thanks to my dear friend Judith for texting me every morning to check if
I was up and writing.
These pages would be empty if it wasn’t for all of you.
Ymkje Haverkamp
3
Investigating the underlying item characteristics in NIFU’s 1+1 tests for elementary
mathematics
Ymkje Haverkamp1, Stephan Daus2, and Johan Braeken3
1Centre for Educational Measurement (CEMO), Faculty of Educational Sciences,
University of Oslo, Norway; [email protected]
2Nordic Institute for Studies in Innovation, Research and Education (NIFU), Oslo,
Norway; [email protected]
3Centre for Educational Measurement (CEMO), Faculty of Educational Sciences,
University of Oslo, Norway; [email protected]
May 2020

4
Abstract
There are multiple item characteristics, some unrelated to mathematics, that can have an
impact on item difficulty. Research into the effect of item characteristics such as number of
words and comparative language has already been performed in larger state assessments in an
American context but has not yet been implemented in a Norwegian setting. In this paper, the
relationship between mathematical and linguistic item characteristics to variation in item
difficulty is investigated in two tests of elementary mathematics via an explanatory item
response modelling approach. The results show that number of words are the biggest driver
of item difficulty in the second-grade test, and that comparative terms and number of words
combined are the biggest drivers of item difficulty in the third-grade test, explaining 38% and
45% of the variance respectively. A higher number of words was related to a higher expected
difficulty in both tests, and the presence of a comparative term in an item was related to a
higher expected difficulty in the third-grade test. This finding indicates that the number of
words should be considered while creating new test items both in research and in practice, as
this might have an unexpected impact on item difficulty. The next stage would be to further
investigate the item characteristics in a mathematical and linguistic framework-based test and
extend the mathematical framework to distinguish better between different mathematical
content.
Keywords: Elementary school mathematics, item analysis, word problems (mathematics),
language of mathematics, item difficulty
5
Investigating the underlying item characteristics in NIFU’s 1+1 tests for elementary
mathematics
Better knowledge on what a test measures gives a better view on the general construct
validity of the test (Whitely, 1983), which ultimately leads to a better understanding of the
outcome of an intervention, research study or class instruction. Ensuring a test is valid and
contains items of appropriate difficulty however, is not always an easy task, as there can be
multiple facets to the construct that is measured, and multiple item characteristics driving
item difficulty such as mathematical content, text length and complexity (Ferrara et al., 2011;
Schneider et al., 2013; Shaftel et al., 2006). Story problems in mathematics provide an
interesting example. These can be used to showcase realistic examples of everyday
mathematics, incorporate new mathematical content to the students by extending on known
problems, and have the potential to engage students more than a simple calculation might
(Haylock, 2010; McNeil et al., 2009; Verschaffel, 2000). However, the extra text in an item
could also introduce extra demands on the students, increasing the item’s difficulty
(Walkington et al., 2018).
Previous content analyses and research into the relationship between different item
characteristics and item difficulty has mainly been done in the USA, where the alignment
demands between a states educational core standards and educational assessments are strict
(Porter et al., 2008). In Norway, curriculum standards are less defined, and the responsibility
for educational assessment in lower elementary education lies mainly with the teachers
(Tveit, 2014). In the Norwegian context, the 1+1 tests, created by The Nordic Institute for
Studies in Innovation, Research and Education (NIFU) in order to monitor an intervention in
their 1+1 project, are a good example of teacher-made and curriculum-inspired tests(Nordisk
institutt for studier av innovasjon, forskning og utdanning (NIFU), n.d.). The items were
created in cooperation with teachers experienced in item writing, and modeled to resemble
6
Norway’s national test in elementary mathematics (Utdanningsdirektoratet, 2019). In this
study, two of NIFU’s 1+1 tests will be investigated in order to assess the relationship between
linguistic and mathematical characteristics on item difficulty.
Linguistics in elementary mathematics
Various research has shown that a relationship exists between reading skills and
mathematical skills. Reading skills are positively related to math achievement, especially on
the subject of word problems (Grimm, 2008; Vilenius‐Tuohimaa et al., 2008). But this
correlation is a complicated and interesting one, as there are many components in reading and
mathematics that could relate to each other in different ways, such as fluent retrieval from
memory, underlying reasoning skills necessary in both reading and problem solving, and a
person’s phonological processing abilities, needed in both reading and computational skills
(Hecht et al., 2001; Koponen et al., 2007; Vilenius‐Tuohimaa et al., 2008).
In practice we see that word problems are often included in mathematics teaching and
testing, and when done well, word problems are considered easier to grasp and are more
interesting for students to participate in (McNeil et al., 2009). Word problems also have an
important role to help young children extend the concept of addition and multiplication
(Verschaffel, 2000). The use of word problems should therefore not be immediately shelved,
but we should stay mindful of the extra demands the linguistic component of word problems
can put on children.
Word problems do require a student to make the assumption that there is in fact
always a solvable mathematical problem hidden in the story, and that some story elements
incongruous with daily life can be ignored (Verschaffel, 2000). These assumptions make a
large variety of word problems possible in the context of the classroom, but this habituation
can in some cases lead to children trying to solve impossible word problems, such as the
famous (and impossible) ‘age of the captain’ problem (Verschaffel, 2000).
7
Sometimes students struggle with grasping the full information from the text that is
needed to solve the problem (Cummins et al., 1988; Verschaffel, 2000). Children with
mathematical difficulties that are good readers have an advantage over children with both
mathematical and reading difficulties on mathematical areas related to language, and they
also show a faster progression in mathematics achievement over time than children with both
mathematical and reading difficulties (Hanich et al., 2001; Jordan et al., 2002). Children with
only mathematical difficulties perform equally on word problems compared to students with
only reading difficulties; Jordan and colleagues (2003) hypothesise that these children can
draw from their respective strengths to compensate for the weaker skills in either
mathematics or reading.
Mathematics content or linguistic features are prime examples of demands that can
impact the difficulty of an item in a mathematics test (Schneider et al., 2013; Shaftel et al.,
2006; Warren, 2006). Higher reading load, meaning longer and more complex text, in
mathematics items was found to be related to item difficulty (Ferrara et al., 2011; Walkington
et al., 2018). Children also struggle more with comparative items (e.g., ‘Anna has 4 pencils.
She has 2 pencils more than Jane does. How many pencils does Jane have?’), due to a
potential lack of understanding of the meaning of comparative words (Schumacher & Fuchs,
2012; Warren, 2006). Shaftel and colleagues (2006) found that higher linguistic demands in
mathematics items, specifically containing difficult mathematics vocabulary, are related to
higher item difficulty. As certain words and vocabulary might be related to specific
mathematical content, and for example in the case of comparative terms possibly indicate a
specific operation (Hanich et al., 2001; Haylock, 2010), it is important to consider the
relationship between both linguistic demands and mathematical content demands and item
difficulty (Haghverdi et al., 2012; Shaftel et al., 2006). In this research, the focus will mainly
8
lie on mathematical demands in terms of mathematical content and complexity, and on
linguistic demands in terms of word count, and comparative terms.
Mathematical demands
Haghverdi and colleagues (2012) reported that students made more errors in the
algebra and geometry categories than in the arithmetic category in their research. Schneider
and colleagues (2006) included a similar distinction as predictor of item difficulty in their
research into item difficulty in the US National Assessment of Educational Progress. This
mathematical content variable, Applying Math Knowledge (Schneider et al., 2013), was
divided into two hierarchical categories: the first category referring to numeration items, and
the second category referring to items with other content areas found in mathematics
curricula (e.g., measurement, probability, algebra and data analysis).
Multi-digit skills were labeled the most important skill needed for mathematical
achievement in third-grade students by Cowan and Powell (2014), where students with
mathematical difficulties especially struggled with. Multi-digit numbers are also processed at
a different speed and in a different way than single-digit numbers (Brysbaert, 1995; Nuerk et
al., 2011). To account for increasing difficulty due to the use of single- versus multi-digit
numbers in the item, numerical complexity should be considered (Daroczy et al., 2015; Nuerk
et al., 2011).
Linguistic demands
Reading demands in mathematics and science items has been the topic of interest in
multiple research projects (e.g. Ferrara et al., 2011; Haghverdi et al., 2012; Shaftel et al.,
2006; Stiller et al., 2016, 2016; Walkington et al., 2018). Ferrara and colleagues (2011) found
that a higher reading load, in their paper defined as a combination of amount of complicated
text and the presence of visual displays, is positively related to item difficulty. Moreover,
Martiniello (2009) and Walkington and colleagues (2018), pointed out that the relationship
9
between linguistic item characteristics and item difficulty is stronger for second language
learners, students speaking a different language at home, and low-achieving students. Shaftel
and colleagues (2006) studied the effect of language characteristics such as number of words,
number of sentences, comparative terms and vocabulary in grade four, seven and ten, and
reported that language characteristics had the most impact in grade four. If it is indeed the
case that language characteristics are of more impact in the lower grades, it makes research
like this only the more relevant.
It is not only the amount of words that can impact item difficulty, the type of words
matters as well. Comparative words such as ‘more’ ‘less’ and ‘equal’ are difficult for young
children to understand (Schumacher & Fuchs, 2012; Warren, 2006). Young children often
lack a full conception of the meaning of the words, and might forget the comparative term
easily, which makes it harder for them to grasp what is asked of them (Schumacher & Fuchs,
2012; Warren, 2006).
Hanich and colleagues (2001) categorized four types of word problems in their
research into mathematical cognition in children with learning difficulties − Change,
Equalize, Combine, and Compare − where equalize and compare word problems were
considered as having the most complicated semantics. Shaftel and colleagues (2006) found
that comparative terms added to an item’s difficulty for their seventh-grade sample, but noted
that this finding is difficult to attribute to the linguistics alone considering comparative terms
can be an indicator for specific mathematical content. It should be interpreted as being both a
mathematical and linguistic demand (Shaftel et al., 2006). A step further within comparative
items there are comparison-to-ratio items (Haylock, 2010). In early grades word problems
work well to expand from addition to multiplication, and comparative items transfer through
‘double or tripple the amount of’ items into multiplication items (Haylock, 2010; Verschaffel,
2000).
10
Visual images could have an effect on item difficulty as well. Ferrara and colleagues
(2011) included visual images as additional complexity in the coding for reading load, and
Stiller and colleagues (2016) found in their research into item features affecting science item
difficulty that visual images increased an item’s difficulty.
Aims and expectations
The first aim of the study is to present the content of NIFU’s 1+1 tests in terms of the
theoretical framework. In order to do this, items and predictors in two versions of the 1+1 test
will be mapped, and a reverse-engineered blueprint of the test will be provided. Given the
nature of the test we expect to mainly find numeration items.
The second aim of the study is to investigate the relationship between the different item
characteristics and item difficulty. This will be done by analyzing the item responses of
second and third-grade students to their corresponding grade-level 1+1 test, using an
explanatory item response approach. Based on the aforementioned theory, word count is
expected to be a strong predictor of item difficulty, as well as comparative terms. In
mathematical content we expect the non-numeration items to be more difficult.
Method
The data for this study came from NIFU’s 1 plus 1 project (Nordisk institutt for studier av
innovasjon, forskning og utdanning (NIFU), n.d.). The 1 plus 1 project was set up to assess
the effect of additional small group mathematics instruction on lower elementary students’
mathematical skills. This randomized controlled trial intervention study includes 163 schools
from 10 of Norway’s larger municipalities and runs over multiple grades and year cohorts.
Randomization took place at the school level. In order to monitor the students’ progress, the
1+1 tests were created to measure mathematical ability at grade one, two, and three in
elementary school.
11
Sample
The sample for this study consisted of lower elementary school students from the
elementary school cohort born in 2009 included in NIFU’s 1+1 project. Only control group
students were included to avoid that the original project’s intervention introduced a
confounding effect. The students were tested once in grade 2 (N = 3985, N schools = 82), and
once in grade 3 (N = 3617, N schools = 78). The use of the data for the current study was
approved under the General Data Protection Regulation (GDPR) by the Norwegian Centre for
Research Data, see Appendix I for the information letter and application (reference number
885257).
1+1 tests
The 1+1 tests are built to fall in line with Norway’s national test in elementary
mathematics, and is, like many educational measures in Norwegian context, designed in
cooperation with teachers with experience in test item generation. The measures used in this
study were the second-grade version and third-grade version of NIFU’s 1+1 test. Both tests
contained 19 items, after recoding two items into one in the third-grade test due to local item
dependence issues (for examples of test items see Appendix III part A). Three items in the
second-grade test and four items in the third-grade test that were originally scored with partial
credit were recoded dichotomously (i.e., over 50% partial credit scored 1, otherwise 0).
Framework
To code the items within the 1+1 tests, two item demands frameworks were
assembled from multiple research studies in the field of mathematics education and item
writing (Daroczy et al., 2015; Ferrara et al., 2011; Haylock, 2010; Schneider et al., 2013;
Shaftel et al., 2006; Warren, 2006). One framework with a focus on mathematical item
characteristics, and one framework with a focus on linguistic item characteristics. The tests
12
are not expected to follow a strict structure in terms of how often certain types of items are
represented. Both frameworks are described below in more detail.
Mathematical demands
For the Mathematical demands framework (see Table 1) in this study, elements of
frameworks from Daroczy and colleagues (2015) and Schneider and colleagues (2013) were
used. The item descriptions were adapted to suit the sample and data, and not all categories
used in the original research studies were included. Applying Mathematical Knowledge
relates to the mathematics content within the item. It has a hierarchical nature, with Applying
Mathematical Knowledge 1 (dummy coded as 0) considered easier, and Applying
Mathematical Knowledge 2 (dummy coded as 1) considered more difficult (Haghverdi et al.,
2012; Schneider et al., 2013).
Daroczy and colleagues (2015) pointed out the importance of including the property
of numbers, such as the range, or single versus multi-digit numbers, as one of the factors that
contributes to item difficulty through numerical complexity. In the current study numerical
complexity is represented by coding for multi-digit numbers. Multi-digit is a dummy coded
variable that relates to the distinction in numerical complexity between single- and multi-digit
numbers (Daroczy et al., 2015; Haghverdi et al., 2012; Nuerk et al., 2011), with 1 indicating
multi-digit numbers, 0 indicating otherwise.
Linguistic demands
The linguistic demands framework (see Table 2) contains adapted elements from a
wide range of prior studies and frameworks (Ferrara et al., 2011; Haylock, 2010; Shaftel et
al., 2006; Stiller et al., 2016). The coding for Number of words was a centered variable,
showing the number of words in the problem statement, as done in research by Shaftel and
colleagues (2006). Visual images is a dummy-coded variable, with 1 indicating a photograph
or drawing is included in the item, as done in research by Stiller and colleagues (2016). The

13
Comparative variable is another dummy-coded variable, where 1 indicates the presence of a
comparative term, such as ‘how many more’ in the item. Multiplicative comparatives were
included as a separate variable with the theory in mind that during the first years of
mathematics education multiplication is introduced, with comparative terms being one of the
tools for transitioning from adding and subtracting to multiplication and division (Haylock,
2010). Ratio-comparatives is dummy-coded, with 1 indicating the occurrence of a
multiplicative comparative term, such as ‘three times as many as’.
Table 1
Mathematical demands framework
Code Description
Applying Mathematical
Knowledge (AMK)
AMK is scored 0 if items require students to apply mathematics
content and processes that are usually learned in their respective
grade or before in number and number relations, computation and
numerical estimation, and operation concepts (numeration).
AMK is scored 1 if items require students to apply mathematics
content and processes that are usually learned in their respective
grade in measurement; geometry and spatial sense; data analysis,
statistics and probability; and patterns, functions and algebra. It
also includes some more advanced or complex applications of
knowledge learned in their respective grade and before. This
covers algorithms, procedures, translation between verbal
expressions and equations, graphing, definitions, and terminology.
Multi-digit Multi-digit response required.
Note. adapted from (Daroczy et al., 2015; Schneider et al., 2013)
14
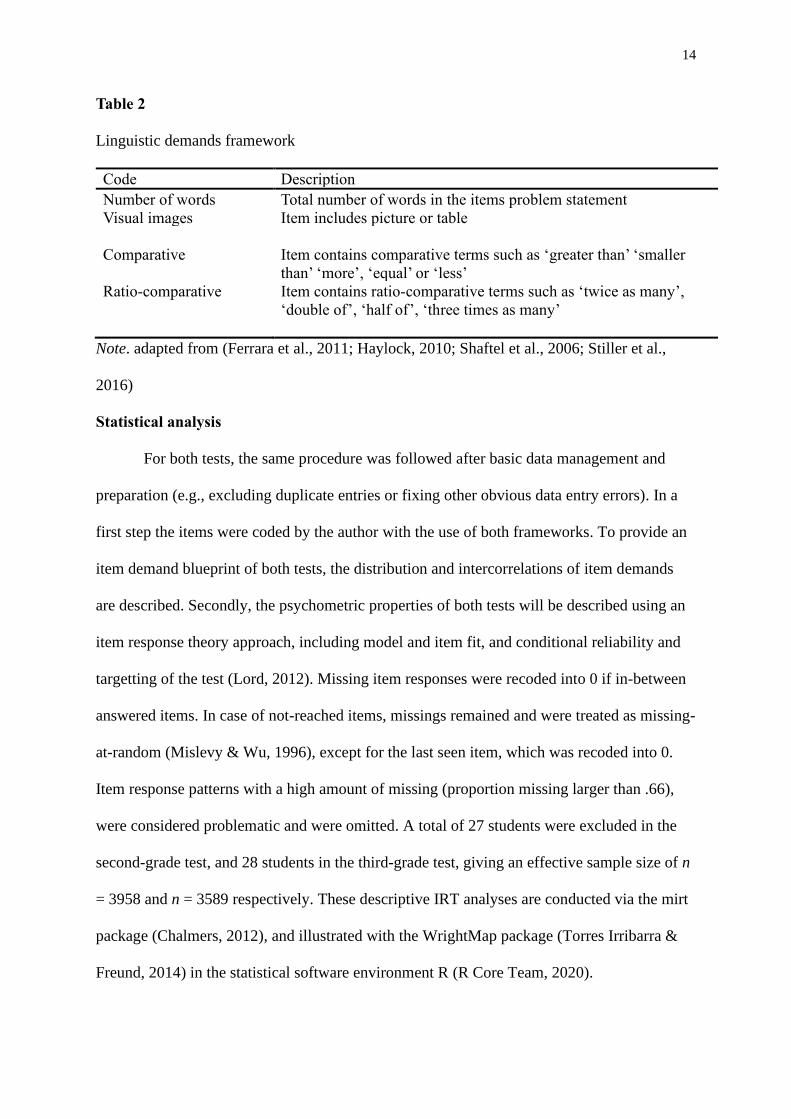
Table 2
Linguistic demands framework
Code Description
Number of words Total number of words in the items problem statement
Visual images Item includes picture or table
Comparative Item contains comparative terms such as ‘greater than’ ‘smaller
than’ ‘more’, ‘equal’ or ‘less’
Ratio-comparative Item contains ratio-comparative terms such as ‘twice as many’,
‘double of’, ‘half of’, ‘three times as many’
Note. adapted from (Ferrara et al., 2011; Haylock, 2010; Shaftel et al., 2006; Stiller et al.,
2016)
Statistical analysis
For both tests, the same procedure was followed after basic data management and
preparation (e.g., excluding duplicate entries or fixing other obvious data entry errors). In a
first step the items were coded by the author with the use of both frameworks. To provide an
item demand blueprint of both tests, the distribution and intercorrelations of item demands
are described. Secondly, the psychometric properties of both tests will be described using an
item response theory approach, including model and item fit, and conditional reliability and
targetting of the test (Lord, 2012). Missing item responses were recoded into 0 if in-between
answered items. In case of not-reached items, missings remained and were treated as missing-
at-random (Mislevy & Wu, 1996), except for the last seen item, which was recoded into 0.
Item response patterns with a high amount of missing (proportion missing larger than .66),
were considered problematic and were omitted. A total of 27 students were excluded in the
second-grade test, and 28 students in the third-grade test, giving an effective sample size of n
= 3958 and n = 3589 respectively. These descriptive IRT analyses are conducted via the mirt
package (Chalmers, 2012), and illustrated with the WrightMap package (Torres Irribarra &
Freund, 2014) in the statistical software environment R (R Core Team, 2020).
15
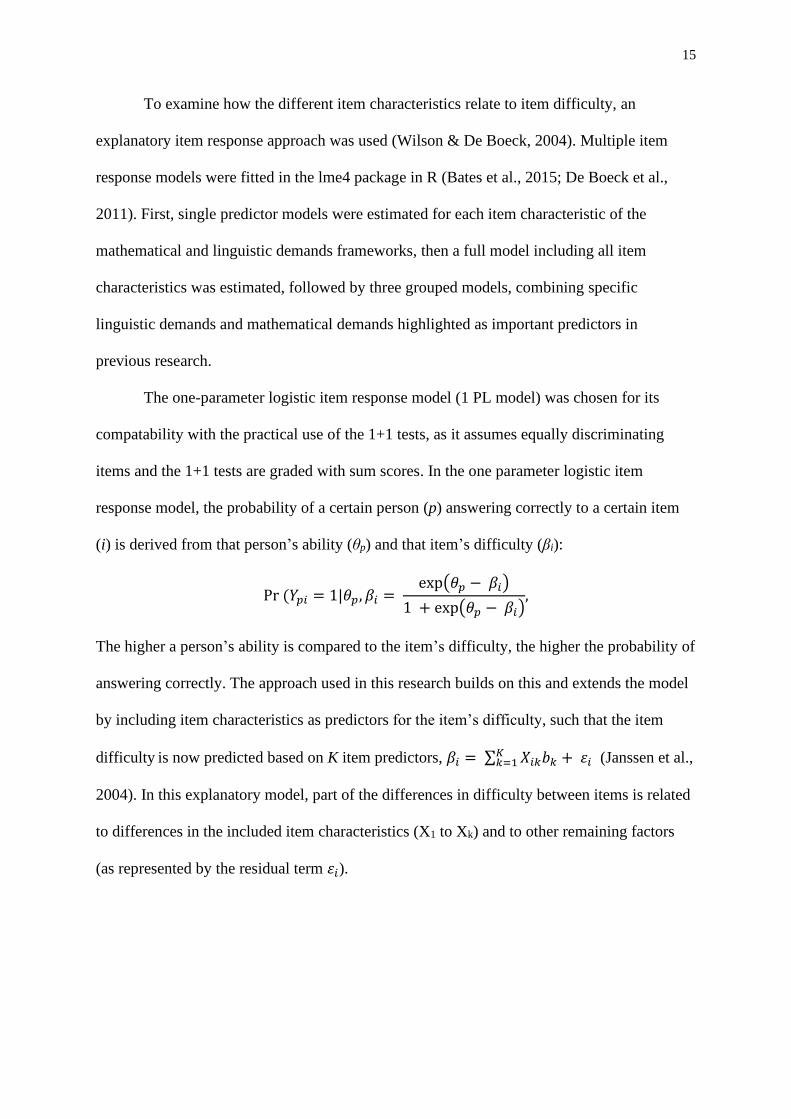
To examine how the different item characteristics relate to item difficulty, an
explanatory item response approach was used (Wilson & De Boeck, 2004). Multiple item
response models were fitted in the lme4 package in R (Bates et al., 2015; De Boeck et al.,
2011). First, single predictor models were estimated for each item characteristic of the
mathematical and linguistic demands frameworks, then a full model including all item
characteristics was estimated, followed by three grouped models, combining specific
linguistic demands and mathematical demands highlighted as important predictors in
previous research.
The one-parameter logistic item response model (1 PL model) was chosen for its
compatability with the practical use of the 1+1 tests, as it assumes equally discriminating
items and the 1+1 tests are graded with sum scores. In the one parameter logistic item
response model, the probability of a certain person (p) answering correctly to a certain item
(i) is derived from that person’s ability (θp) and that item’s difficulty (βi):
Pr(𝑌𝑝𝑖 = 1|𝜃𝑝, 𝛽𝑖 =exp(𝜃𝑝 −𝛽𝑖)
1 + exp(𝜃𝑝 −𝛽𝑖),
The higher a person’s ability is compared to the item’s difficulty, the higher the probability of
answering correctly. The approach used in this research builds on this and extends the model
by including item characteristics as predictors for the item’s difficulty, such that the item
difficulty is now predicted based on K item predictors, 𝛽𝑖 =∑ 𝑋𝑖𝑘𝑏𝑘 +𝜀𝑖𝐾𝑘=1 (Janssen et al.,
2004). In this explanatory model, part of the differences in difficulty between items is related
to differences in the included item characteristics (X1 to Xk) and to other remaining factors
(as represented by the residual term 𝜀𝑖).

16
Results
Test Blueprint
The two 1+1 tests include items both on basic numeration and on mathematical
content such as measurement, data analysis, statistics and probability (i.e., AMK, see Table 3
and Table 4). Ratio-comparative items occurred least, with three items in the second-grade
test, and four items in the third-grade test. Approximately half of the items in both tests
included a visual representation and over half of the items required the student to work with
multi-digit numbers. The number of items with multi-digit numbers was higher in the third-
grade test, 16 out of 19 items, compared to the second-grade test, 12 out of 19 items.
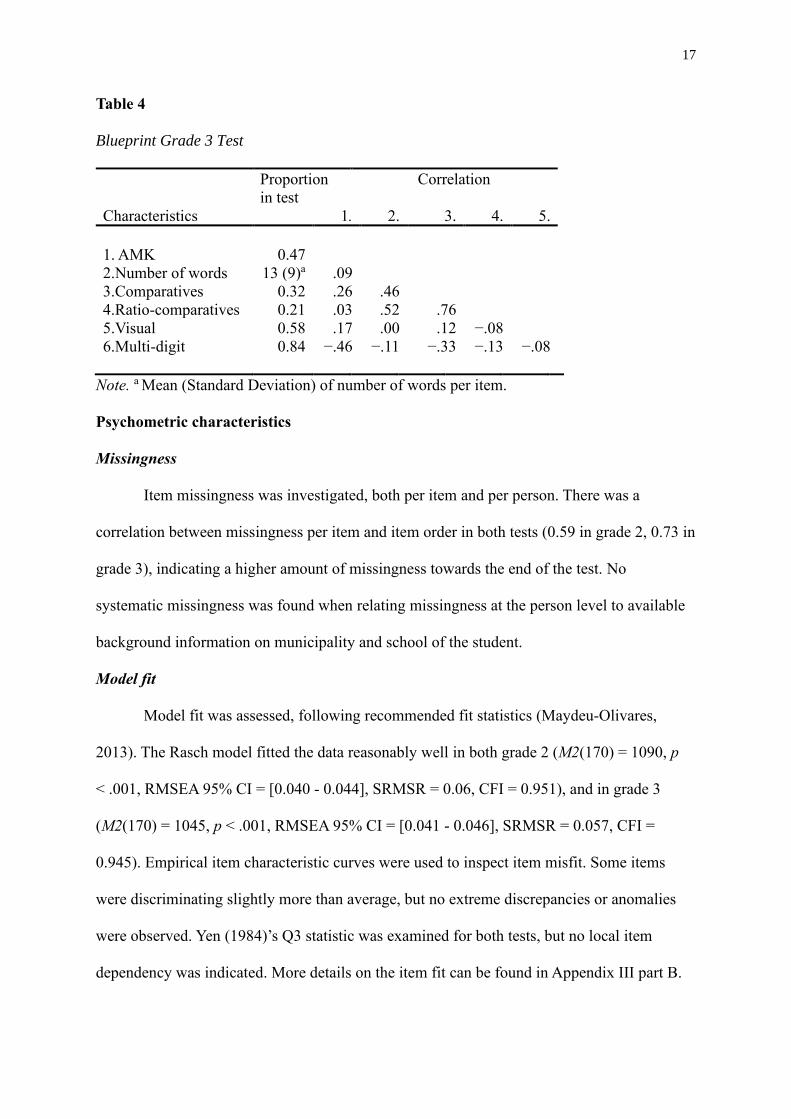
The correlations between number of words and comparative terms and between
mathematical knowledge and comparative terms were relatively strong (see Table 3 and Table
4). This is in line with the theory, as previous research found that comparative items both
relate to the linguistic item features and to the mathematical content of the item (Shaftel et al.,
2006).
Table 3
Blueprint Grade 2 Test
Proportion
in test
Correlation
Characteristics 1. 2. 3. 4. 5.
1. AMK 0.37
2. Number of words 15 (11)a .03
3. Comparatives 0.32 −.52 .5
4. Ratio comparatives 0.16 −.33 .25 .64
5. Visual 0.53 .29 .03 −.49 −.46
6. Multi-digit 0.63 −.77 −.36 .28 .33 −.29
Note. a Mean (Standard Deviation) of number of words per item.
17
Table 4
Blueprint Grade 3 Test
Proportion
in test
Correlation
Characteristics 1. 2. 3. 4. 5.
1. AMK 0.47
2.Number of words 13 (9)a .09
3.Comparatives 0.32 .26 .46
4.Ratio-comparatives 0.21 .03 .52 .76
5.Visual 0.58 .17 .00 .12 −.08
6.Multi-digit 0.84 −.46 −.11 −.33 −.13 −.08
Note. a Mean (Standard Deviation) of number of words per item.
Psychometric characteristics
Missingness
Item missingness was investigated, both per item and per person. There was a
correlation between missingness per item and item order in both tests (0.59 in grade 2, 0.73 in
grade 3), indicating a higher amount of missingness towards the end of the test. No
systematic missingness was found when relating missingness at the person level to available
background information on municipality and school of the student.
Model fit
Model fit was assessed, following recommended fit statistics (Maydeu-Olivares,
2013). The Rasch model fitted the data reasonably well in both grade 2 (M2(170) = 1090, p
< .001, RMSEA 95% CI = [0.040 - 0.044], SRMSR = 0.06, CFI = 0.951), and in grade 3
(M2(170) = 1045, p < .001, RMSEA 95% CI = [0.041 - 0.046], SRMSR = 0.057, CFI =
0.945). Empirical item characteristic curves were used to inspect item misfit. Some items
were discriminating slightly more than average, but no extreme discrepancies or anomalies
were observed. Yen (1984)’s Q3 statistic was examined for both tests, but no local item
dependency was indicated. More details on the item fit can be found in Appendix III part B.

18
Test information and reliability
Both 1+1 tests adequately cover the lower-to-average ability level (see Wright maps
Figure 1). The second-grade test is lacking some more difficult items, with the exception of
item 17. Grade three has some more items at the upper end of the scale, with yet again one
exceptionaly difficult item, item 16. Note that these two items did not show extreme
problems with item fit, and hence, both items were kept throughout the analysis.
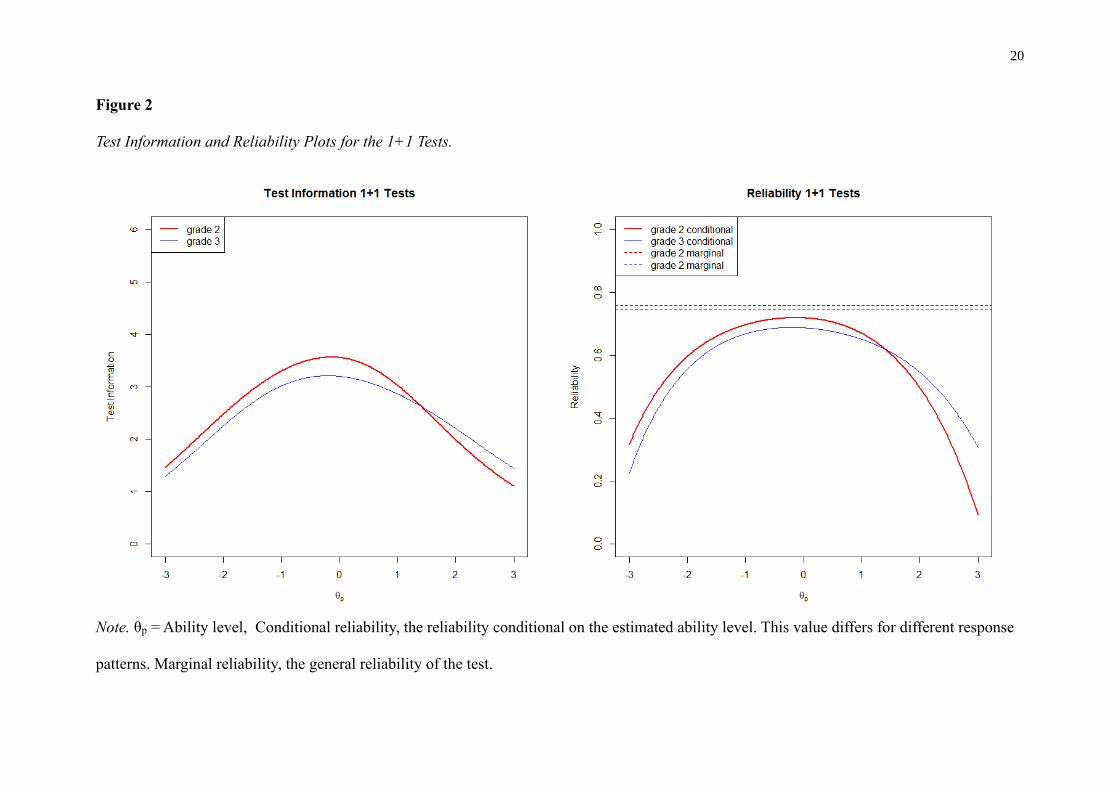
The test information plot in Figure 2 (left), shows that both tests give the most
information around the average ability level, where most items were located. The tests are
most informative on the lower-to-average ability level, indicating that it targets lower and
average-achieving students slightly better than high-achieving students. The reliability of the
test for students around the average on the latent ability scale lies between .70 and .80 (Figure
2, right). Measurement of lower and higher-achieving students is less precise with reliabilities
dropping to .60 or lower for students close to two standard deviations away from the mean.

19
Figure 1
Wright Map of Grade 2 and Grade 3 Tests
Note. In the Wrigh map, each item’s difficulty and the respondents’ ability is mapped on the same (ability) scale (Callingham & Bond, 2006).
20
Figure 2
Test Information and Reliability Plots for the 1+1 Tests.
Note. θp = Ability level, Conditional reliability, the reliability conditional on the estimated ability level. This value differs for different response
patterns. Marginal reliability, the general reliability of the test.

21
Relationship between item characteristics and item difficulty
Null model
In order to assess the relationship between item characteristics and item difficulty in
the 1+1 tests, first a null model was created. It showed that the average second-grader has
54% chance of giving a correct response to an average item in the second-grade 1+1 test, for
the average third-grader the chance of correctly answering an average third-grade-1+1 test
item was 45%. Of the response variation in the second-grade test, 22% could be attributed to
person differences, and 26% to item differences. Of the response variation in the third-grade
test, 20% could be attributed to person differences, and 36% to item differences. The
difference between the response variation attributed to item differences does indicate a certain
disparity in the character of the two tests.
Single predictor models
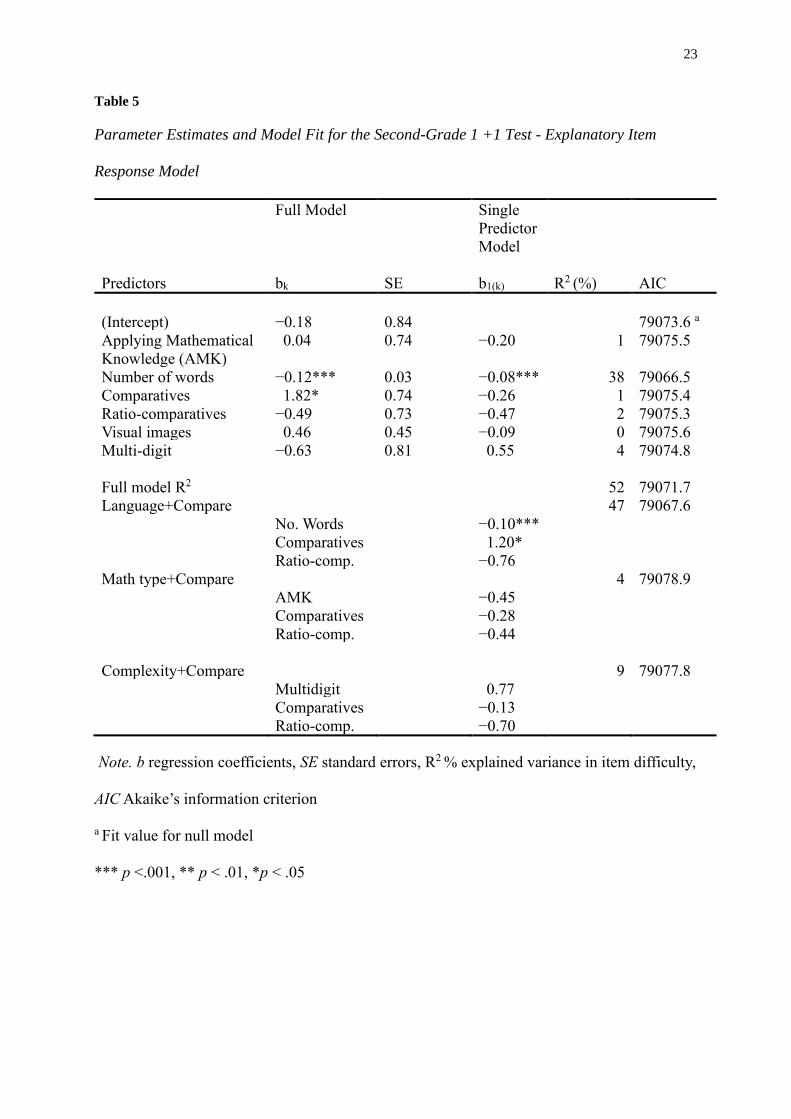
The top right section of Table 5 shows the parameter estimates and model fit of the
single predictor explanatory item response models for the second-grade 1+1 test. In each
model, only one item characteristic was included as a predictor of item difficulty to examine
to what extent this characteristic could explain item difficulty. Of all single predictors in the
second-grade test, only Number of words showed a better fit than the null model when
compared on AIC. The differences in number of words between different items explained
38% of the variance in item difficulty (χ²(1) = 9.06, p = 0.003) and had a negative
relationship with item easiness (b 1(k) = −.08, Z = −3.41, p <.001). In this test, the expected
difference in item difficulty between an item that has 10 words extra compared to another
item, is .8 ability points (for the ability scale, see Figure 1). In general for the second-grade
test this means that the more words an item contains, the more difficult the item can be
expected to be.

22
In contrast, for the third-grade test, none of the single predictors showed a better
model fit than the null model when compared on AIC (see Table 6, top right). Number of
words explained the most variance in item difficulty, at 10% , closely followed by
Comparatives, with nine percent; however, none of the predictors were significant.
Full model
For the full model an explanatory item response model including all predictors was
fitted for each of the second and the third-grade tests. The full model for grade two explained
52% of the variance in item difficulty (χ²(6) = 13.87, p = 0.032), and AIC, indicated a better
fit than the null model and almost all single predictor models (see Table 5, top left). The
single predictor model with Number of words as a predictor remains the stronger model as the
full model did not show a better model fit (χ²(6) = 4.81, p = 0.440).
The full model results for the third-grade test can be seen in the top left section of
Table 6. The full model explained 48% of the variance in item difficulty, and had a better fit
than both the null model and all single predictor models compared on the AIC, but a
likelihood ratio test showed it was not a significantly better model than the null model (χ²(6) =
12.34, p = .055).
23
Table 5
Parameter Estimates and Model Fit for the Second-Grade 1 +1 Test - Explanatory Item
Response Model
Full Model Single
Predictor
Model
Predictors bk SE b1(k) R2 (%) AIC
(Intercept) −0.18 0.84 79073.6 a
Applying Mathematical
Knowledge (AMK)
0.04 0.74 −0.20 1 79075.5
Number of words −0.12*** 0.03 −0.08*** 38 79066.5
Comparatives 1.82* 0.74 −0.26 1 79075.4
Ratio-comparatives −0.49 0.73 −0.47 2 79075.3
Visual images 0.46 0.45 −0.09 0 79075.6
Multi-digit −0.63 0.81 0.55 4 79074.8
Full model R2 52 79071.7
Language+Compare 47 79067.6
No. Words −0.10***
Comparatives 1.20*
Ratio-comp. −0.76
Math type+Compare 4 79078.9
AMK −0.45
Comparatives −0.28
Ratio-comp. −0.44
Complexity+Compare 9 79077.8
Multidigit 0.77
Comparatives −0.13
Ratio-comp. −0.70
Note. b regression coefficients, SE standard errors, R2 % explained variance in item difficulty,
AIC Akaike’s information criterion
a Fit value for null model
*** p <.001, ** p < .01, *p < .05

24
Table 6
Parameter Estimates and Model Fit for the Third-Grade 1 +1 Test - Explanatory Item
Response Model
Full Model Single
Predictor
Model
Predictors bk SE b1(k) R2 (%) AIC
(Intercept) −0.06 0.89 66797.0 a
Applying Mathematical
Knowledge
−0.38 0.54 −0.72 5 66798.0
Number of words −0.08* 0.04 −0.06 10 66797.1
Comparatives −2.87** 1.08 −1.03 9 66797.2
Ratio-comparatives 3.84*** 1.32 0.37 1 66798.8
Visual images 0.48 0.63 −0.16 0 66798.9
Multi-digit −0.18 0.77 0.87 4 66798.2
Full model R2 48 66796.6
Language+Compare 45
No. Words −0.08* 66791.5
Comparatives −2.82***
Ratio-comp. 3.70***
Math type+Compare 32 66795.5
AMK −0.05
Comparatives −3.00**
Ratio-comp. 2.97*
Complexity+Compare 32 66795.6
Multidigit 0.05
Comparatives −3.01**
Ratio-comp. 2.98**
Note. b regression coefficients, SE standard errors, R2 % explained variance in item difficulty,
AIC Akaike’s information criterion
a Fit value for null model
*** p <.001, ** p < .01, *p < .05
25
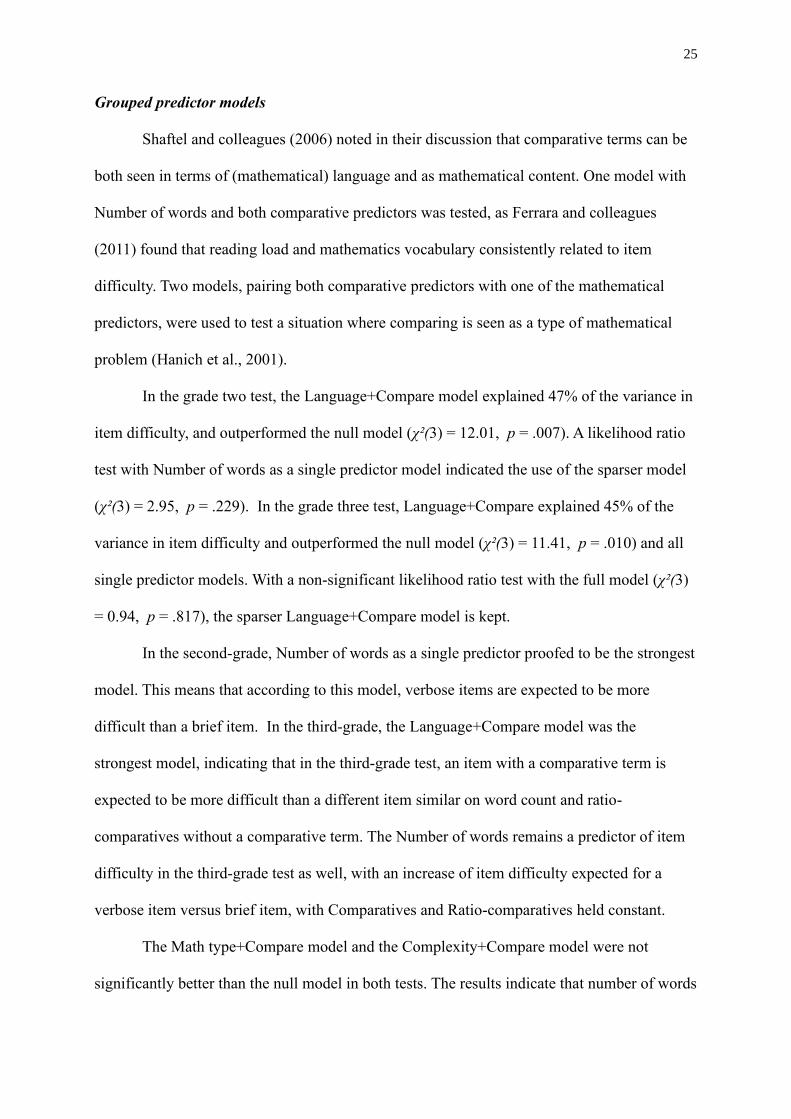
Grouped predictor models
Shaftel and colleagues (2006) noted in their discussion that comparative terms can be
both seen in terms of (mathematical) language and as mathematical content. One model with
Number of words and both comparative predictors was tested, as Ferrara and colleagues
(2011) found that reading load and mathematics vocabulary consistently related to item
difficulty. Two models, pairing both comparative predictors with one of the mathematical
predictors, were used to test a situation where comparing is seen as a type of mathematical
problem (Hanich et al., 2001).
In the grade two test, the Language+Compare model explained 47% of the variance in
item difficulty, and outperformed the null model (χ²(3) = 12.01, p = .007). A likelihood ratio
test with Number of words as a single predictor model indicated the use of the sparser model
(χ²(3) = 2.95, p = .229). In the grade three test, Language+Compare explained 45% of the
variance in item difficulty and outperformed the null model (χ²(3) = 11.41, p = .010) and all
single predictor models. With a non-significant likelihood ratio test with the full model (χ²(3)
= 0.94, p = .817), the sparser Language+Compare model is kept.
In the second-grade, Number of words as a single predictor proofed to be the strongest
model. This means that according to this model, verbose items are expected to be more
difficult than a brief item. In the third-grade, the Language+Compare model was the
strongest model, indicating that in the third-grade test, an item with a comparative term is
expected to be more difficult than a different item similar on word count and ratio-
comparatives without a comparative term. The Number of words remains a predictor of item
difficulty in the third-grade test as well, with an increase of item difficulty expected for a
verbose item versus brief item, with Comparatives and Ratio-comparatives held constant.
The Math type+Compare model and the Complexity+Compare model were not
significantly better than the null model in both tests. The results indicate that number of words
26
is the driving force of item difficulty in the second-grade 1+1 test, and that Number of words,
Comparative and Ratio-comparative terms are the driving force of item difficulty in the third-
grade 1+1 tests.
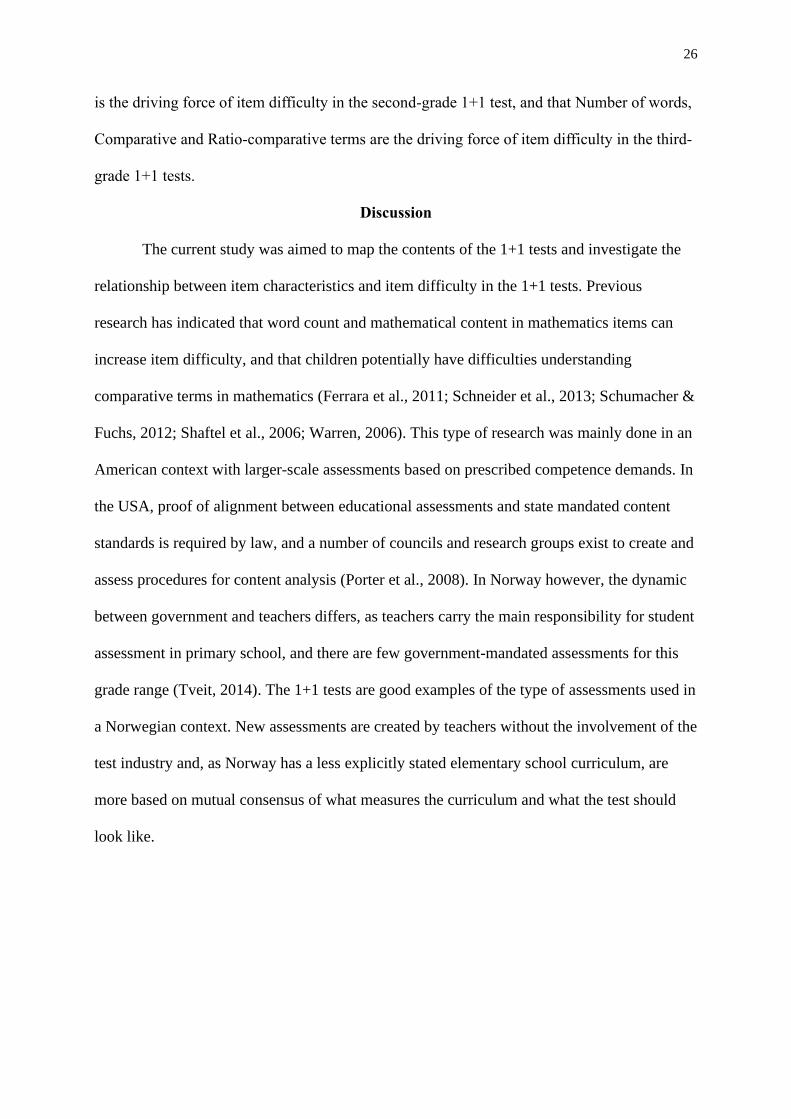
Discussion
The current study was aimed to map the contents of the 1+1 tests and investigate the
relationship between item characteristics and item difficulty in the 1+1 tests. Previous
research has indicated that word count and mathematical content in mathematics items can
increase item difficulty, and that children potentially have difficulties understanding
comparative terms in mathematics (Ferrara et al., 2011; Schneider et al., 2013; Schumacher &
Fuchs, 2012; Shaftel et al., 2006; Warren, 2006). This type of research was mainly done in an
American context with larger-scale assessments based on prescribed competence demands. In
the USA, proof of alignment between educational assessments and state mandated content
standards is required by law, and a number of councils and research groups exist to create and
assess procedures for content analysis (Porter et al., 2008). In Norway however, the dynamic
between government and teachers differs, as teachers carry the main responsibility for student
assessment in primary school, and there are few government-mandated assessments for this
grade range (Tveit, 2014). The 1+1 tests are good examples of the type of assessments used in
a Norwegian context. New assessments are created by teachers without the involvement of the
test industry and, as Norway has a less explicitly stated elementary school curriculum, are
more based on mutual consensus of what measures the curriculum and what the test should
look like.
27
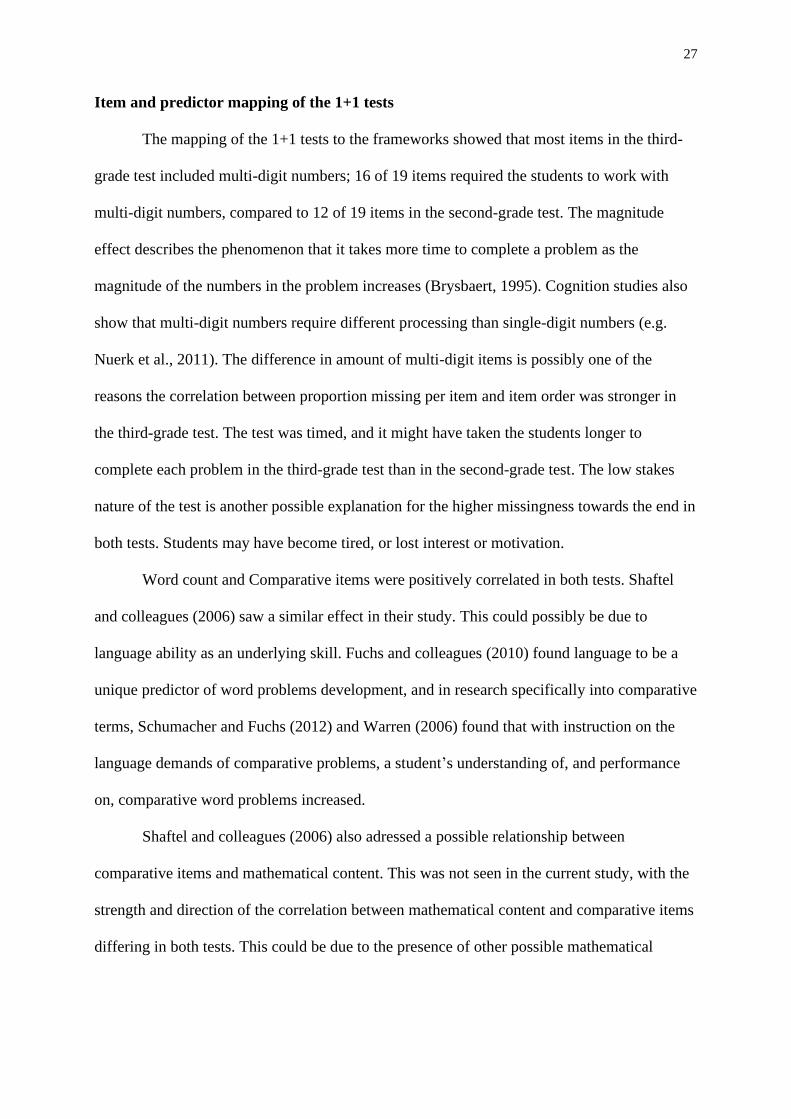
Item and predictor mapping of the 1+1 tests
The mapping of the 1+1 tests to the frameworks showed that most items in the third-
grade test included multi-digit numbers; 16 of 19 items required the students to work with
multi-digit numbers, compared to 12 of 19 items in the second-grade test. The magnitude
effect describes the phenomenon that it takes more time to complete a problem as the
magnitude of the numbers in the problem increases (Brysbaert, 1995). Cognition studies also
show that multi-digit numbers require different processing than single-digit numbers (e.g.
Nuerk et al., 2011). The difference in amount of multi-digit items is possibly one of the
reasons the correlation between proportion missing per item and item order was stronger in
the third-grade test. The test was timed, and it might have taken the students longer to
complete each problem in the third-grade test than in the second-grade test. The low stakes
nature of the test is another possible explanation for the higher missingness towards the end in
both tests. Students may have become tired, or lost interest or motivation.
Word count and Comparative items were positively correlated in both tests. Shaftel
and colleagues (2006) saw a similar effect in their study. This could possibly be due to
language ability as an underlying skill. Fuchs and colleagues (2010) found language to be a
unique predictor of word problems development, and in research specifically into comparative
terms, Schumacher and Fuchs (2012) and Warren (2006) found that with instruction on the
language demands of comparative problems, a student’s understanding of, and performance
on, comparative word problems increased.
Shaftel and colleagues (2006) also adressed a possible relationship between
comparative items and mathematical content. This was not seen in the current study, with the
strength and direction of the correlation between mathematical content and comparative items
differing in both tests. This could be due to the presence of other possible mathematical

28
factors, such as number properties as magnitude, role of the number and the required
operation (Brysbaert, 1995; Daroczy et al., 2015; Nuerk et al., 2011) (all not coded for in the
current study due to limitations in the design of the test).
In the mapping of the items to the students’ ability level, two items proved remarkably
difficult compared to the other items. Item 17 in the second-grade test, was an item very
similar to item 9, an item earlier in the test, but with one difference. Instead of having to look
at the increase, as was asked in the earlier item, this time the student was asked to look at the
decrease. A possible explanation that may have added to the item’s difficulty is that students
overlooked the change in direction and assumed a similar task as seen earlier, as item 9 itself
was of average difficulty in the test. Item 16 in the third-grade test had quite ambiguous
wording with multiple possible interpretations, where only one of these led to the correct
answer. This ambiguity might explain the notable difficulty of the item.
Overall, both tests mapped better, and provided most information, for students located
at the lower to average ability level. Considering that the conditional reliability reduced
substantially at two standard deviations from the mean, and that the targetting missed out on
high achievers, the 1+1 tests are less suited for individual assessment. They do however serve
their intended purpose of monitoring the general mathematical skill during the intervention at
the macro level.
Relationship between item characteristics and item difficulty
Word count explained a substantial part of the variation in item difficulty as a single
predictor in the second-grade test, and remained the strongest model throughout. This finding
was not replicated in the third-grade test, where none of the single predictor models
outperformed the null model. The findings in the second-grade test align with the findings by
Ferrara and colleagues (2011) that reading load was a significant predictor of item difficulty.
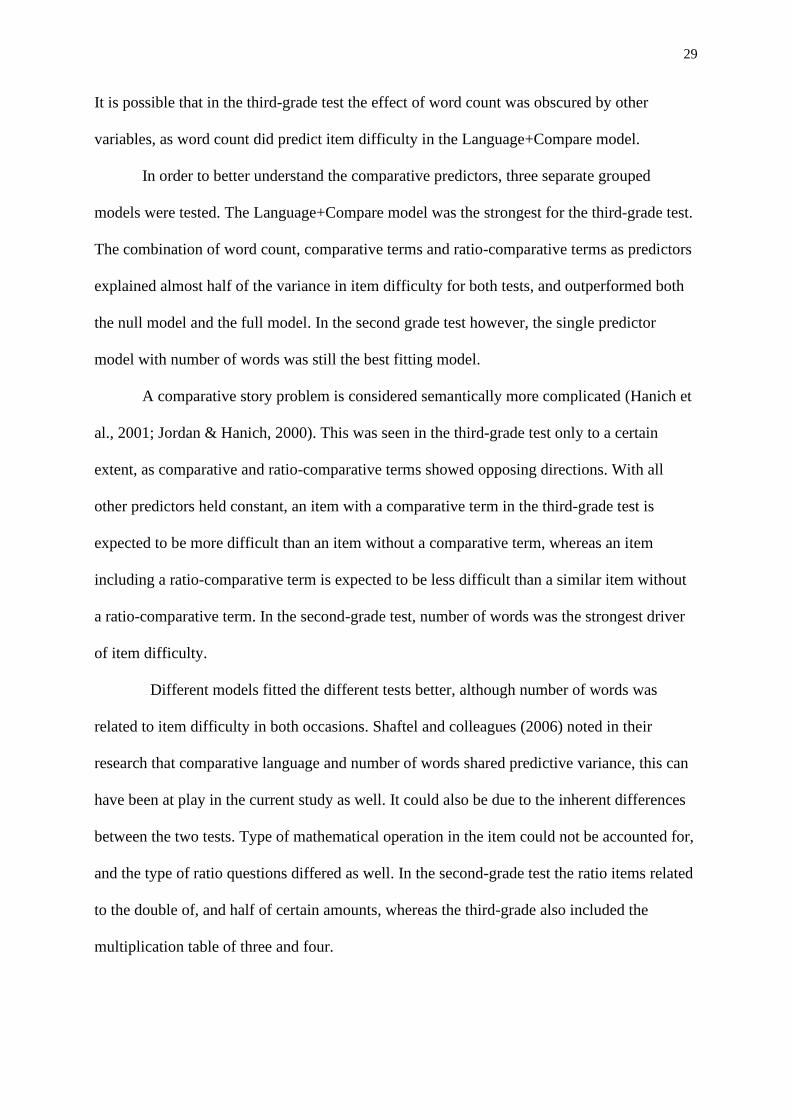
29
It is possible that in the third-grade test the effect of word count was obscured by other
variables, as word count did predict item difficulty in the Language+Compare model.
In order to better understand the comparative predictors, three separate grouped
models were tested. The Language+Compare model was the strongest for the third-grade test.
The combination of word count, comparative terms and ratio-comparative terms as predictors
explained almost half of the variance in item difficulty for both tests, and outperformed both
the null model and the full model. In the second grade test however, the single predictor
model with number of words was still the best fitting model.
A comparative story problem is considered semantically more complicated (Hanich et
al., 2001; Jordan & Hanich, 2000). This was seen in the third-grade test only to a certain
extent, as comparative and ratio-comparative terms showed opposing directions. With all
other predictors held constant, an item with a comparative term in the third-grade test is
expected to be more difficult than an item without a comparative term, whereas an item
including a ratio-comparative term is expected to be less difficult than a similar item without
a ratio-comparative term. In the second-grade test, number of words was the strongest driver
of item difficulty.
Different models fitted the different tests better, although number of words was
related to item difficulty in both occasions. Shaftel and colleagues (2006) noted in their
research that comparative language and number of words shared predictive variance, this can
have been at play in the current study as well. It could also be due to the inherent differences
between the two tests. Type of mathematical operation in the item could not be accounted for,
and the type of ratio questions differed as well. In the second-grade test the ratio items related
to the double of, and half of certain amounts, whereas the third-grade also included the
multiplication table of three and four.
30
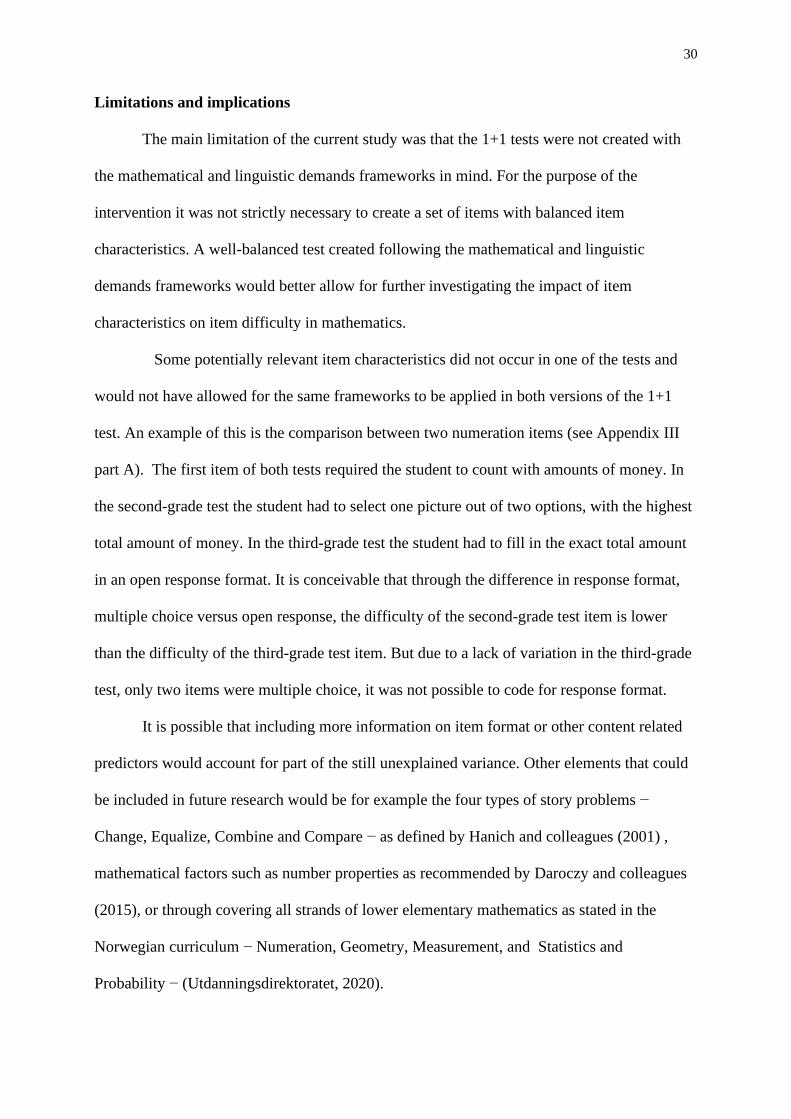
Limitations and implications
The main limitation of the current study was that the 1+1 tests were not created with
the mathematical and linguistic demands frameworks in mind. For the purpose of the
intervention it was not strictly necessary to create a set of items with balanced item
characteristics. A well-balanced test created following the mathematical and linguistic
demands frameworks would better allow for further investigating the impact of item
characteristics on item difficulty in mathematics.
Some potentially relevant item characteristics did not occur in one of the tests and
would not have allowed for the same frameworks to be applied in both versions of the 1+1
test. An example of this is the comparison between two numeration items (see Appendix III
part A). The first item of both tests required the student to count with amounts of money. In
the second-grade test the student had to select one picture out of two options, with the highest
total amount of money. In the third-grade test the student had to fill in the exact total amount
in an open response format. It is conceivable that through the difference in response format,
multiple choice versus open response, the difficulty of the second-grade test item is lower
than the difficulty of the third-grade test item. But due to a lack of variation in the third-grade
test, only two items were multiple choice, it was not possible to code for response format.
It is possible that including more information on item format or other content related
predictors would account for part of the still unexplained variance. Other elements that could
be included in future research would be for example the four types of story problems −
Change, Equalize, Combine and Compare − as defined by Hanich and colleagues (2001) ,
mathematical factors such as number properties as recommended by Daroczy and colleagues
(2015), or through covering all strands of lower elementary mathematics as stated in the
Norwegian curriculum − Numeration, Geometry, Measurement, and Statistics and
Probability − (Utdanningsdirektoratet, 2020).
31
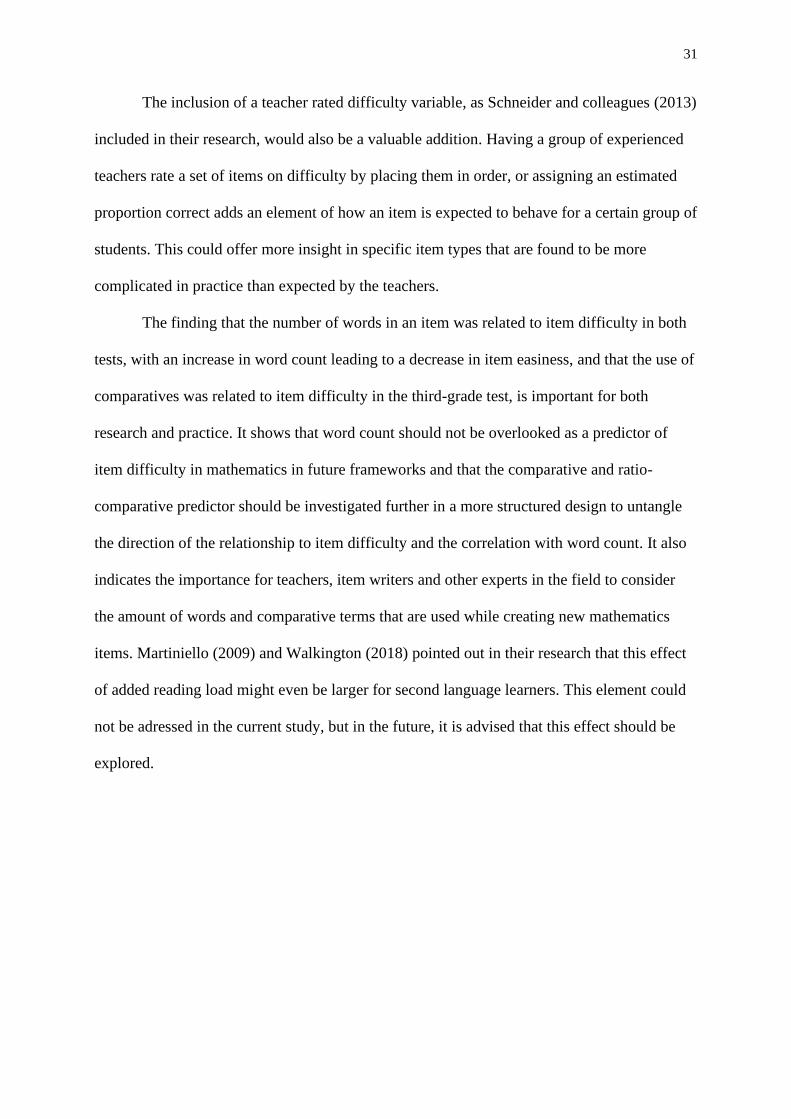
The inclusion of a teacher rated difficulty variable, as Schneider and colleagues (2013)
included in their research, would also be a valuable addition. Having a group of experienced
teachers rate a set of items on difficulty by placing them in order, or assigning an estimated
proportion correct adds an element of how an item is expected to behave for a certain group of
students. This could offer more insight in specific item types that are found to be more
complicated in practice than expected by the teachers.
The finding that the number of words in an item was related to item difficulty in both
tests, with an increase in word count leading to a decrease in item easiness, and that the use of
comparatives was related to item difficulty in the third-grade test, is important for both
research and practice. It shows that word count should not be overlooked as a predictor of
item difficulty in mathematics in future frameworks and that the comparative and ratio-
comparative predictor should be investigated further in a more structured design to untangle
the direction of the relationship to item difficulty and the correlation with word count. It also
indicates the importance for teachers, item writers and other experts in the field to consider
the amount of words and comparative terms that are used while creating new mathematics
items. Martiniello (2009) and Walkington (2018) pointed out in their research that this effect
of added reading load might even be larger for second language learners. This element could
not be adressed in the current study, but in the future, it is advised that this effect should be
explored.

32
References
Bates, D., Maechler, M., Bolker, B., & Walker, S. (2015). Fitting Linear Mixed-Effects
Models Using lme4. Journal of Statistical Software, 67(1), 1–48.
Brysbaert, M. (1995). Arabic number reading: On the nature of the numerical scale and the
origin of phonological recoding. Journal of Experimental Psychology: General,
124(4), 434. https://doi.org/10.1037/0096-3445.124.4.434
Callingham, R., & Bond, T. (2006). Research in mathematics education and rasch
measurement. Mathematics Education Research Journal, 18(2), 1–10.
https://doi.org/10.1007/BF03217432
Chalmers, R. P. (2012). mirt: A Multidimensional Item Response Theory Package for the R
Environment. Journal of Statistical Software, 48(6).
https://doi.org/10.18637/jss.v048.i06
Cowan, R., & Powell, D. (2014). The contributions of domain-general and numerical factors
to third-grade arithmetic skills and mathematical learning disability. Journal of
Educational Psychology, 106(1). https://doi.org/10.1037/a0034097
Cummins, D. D., Kintsch, W., Reusser, K., & Weimer, R. (1988). The role of understanding in
solving word problems. Cognitive Psychology, 20(4), 405–438.
https://doi.org/10.1016/0010-0285(88)90011-4
Daroczy, G., Wolska, M., Meurers, W. D., & Nuerk, H.-C. (2015). Word problems: A review
of linguistic and numerical factors contributing to their difficulty. Frontiers in
Psychology, 6. https://doi.org/10.3389/fpsyg.2015.00348
De Boeck, P., Bakker, M., Zwitser, R., Nivard, M., Hofman, A., Tuerlinckx, F., & Partchev, I.
(2011). The Estimation of Item Response Models with the lmer Function from the
lme4 Package in R. Journal of Statistical Software, 39(1), 1–28.
https://doi.org/10.18637/jss.v039.i12

33
Ferrara, S., Svetina, D., Skucha, S., & Davidson, A. H. (2011). Test Development with
Performance Standards and Achievement Growth in Mind. Educational Measurement:
Issues and Practice, 30(4), 3–15. https://doi.org/10.1111/j.1745-3992.2011.00218.x
Fuchs, L. S., Geary, D. C., Compton, D. L., Fuchs, D., Hamlett, C. L., Seethaler, P. M.,
Bryant, J. D., & Schatschneider, C. (2010). Do different types of school mathematics
development depend on different constellations of numerical versus general cognitive
abilities? Developmental Psychology, 46(6), 1731. https://doi.org/10.1037/a0020662
Grimm, K. J. (2008). Longitudinal Associations Between Reading and Mathematics
Achievement. Developmental Neuropsychology, 33(3), 410–426.
https://doi.org/10.1080/87565640801982486
Haghverdi, M., Semnani, A. S., & Seifi, M. (2012). The relationship between different kinds
of students’ errors and the knowledge required to solve mathematics word problems.
Bolema: Boletim de Educação Matemática, 26(42B), 649–666.
https://doi.org/10.1590/S0103-636X2012000200012
Hanich, L. B., Jordan, N. C., Kaplan, D., & Dick, J. (2001). Performance across different
areas of mathematical cognition in children with learning difficulties. Journal of
Educational Psychology, 93(3), 615. https://doi.org/10.1037/0022-0663.93.3.615
Haylock, D. (2010). Mathematics explained for primary teachers (4th ed., s. XII, 417). Sage.
Hecht, S. A., Torgesen, J. K., Wagner, R. K., & Rashotte, C. A. (2001). The Relations between
Phonological Processing Abilities and Emerging Individual Differences in
Mathematical Computation Skills: A Longitudinal Study from Second to Fifth Grades.
Journal of Experimental Child Psychology, 79(2), 192–227.
https://doi.org/10.1006/jecp.2000.2586
Janssen, R., Schepers, J., & Peres, D. (2004). Models with item and item group predictors. In.
De Boeck & M. Wilson (Red.), Explanatory Item Response Models: A Generalized
34
Linear and Nonlinear Approach (s. 189–212). Springer. https://doi.org/10.1007/978-1-
4757-3990-9_6
Jordan, N. C., & Hanich, L. B. (2000). Mathematical Thinking in Second-Grade Children
with Different Forms of LD Journal of Learning Disabilities.
https://doi.org/10.1177/002221940003300605
Jordan, N. C., Hanich, L. B., & Kaplan, D. (2003). A Longitudinal Study of Mathematical
Competencies in Children With Specific Mathematics Difficulties Versus Children
With Comorbid Mathematics and Reading Difficulties. Child Development, 74(3),
834–850. https://doi.org/10.1111/1467-8624.00571
Jordan, N. C., Kaplan, D., & Hanich, L. B. (2002). Achievement growth in children with
learning difficulties in mathematics: Findings of a two-year longitudinal study.
Journal of Educational Psychology, 94(3), 586. https://doi.org/10.1037/0022-
0663.94.3.586
Koponen, T., Aunola, K., Ahonen, T., & Nurmi, J.-E. (2007). Cognitive predictors of single-
digit and procedural calculation skills and their covariation with reading skill. Journal
of Experimental Child Psychology, 97(3), 220–241.
https://doi.org/10.1016/j.jecp.2007.03.001
Lord, F. M. (2012). Applications of Item Response Theory To Practical Testing Problems.
Routledge. https://doi.org/10.4324/9780203056615
Martiniello, M. (2009). Linguistic Complexity, Schematic Representations, and Differential
Item Functioning for English Language Learners in Math Tests. Educational
Assessment, 14(3–4), 160–179. https://doi.org/10.1080/10627190903422906
Maydeu-Olivares, A. (2013). Goodness-of-Fit Assessment of Item Response Theory Models.
Measurement: Interdisciplinary Research and Perspectives, 11(3), 71–101.
https://doi.org/10.1080/15366367.2013.831680
35
McNeil, N. M., Uttal, D. H., Jarvin, L., & Sternberg, R. J. (2009). Should you show me the
money? Concrete objects both hurt and help performance on mathematics problems.
Learning and Instruction, 19(2), 171–184.
https://doi.org/10.1016/j.learninstruc.2008.03.005
Mislevy, R. J., & Wu, P.-K. (1996). Missing Responses and IRT Ability Estimation: Omits,
Choice, Time Limits, and Adaptive Testing. ETS Research Report Series, 1996(2), i–
36. https://doi.org/10.1002/j.2333-8504.1996.tb01708.x
Nordisk institutt for studier av innovasjon, forskning og utdanning (NIFU). (n.d.). 1+1
Prosjektet—1+1 Prosjektet. Retrieved 23 mars 2020, from
https://1pluss1prosjektet.no/
Nuerk, H.-C., Moeller, K., Klein, E., Willmes, K., & Fischer, M. H. (2011). Extending the
mental number line: A review of multi-digit number processing. Zeitschrift für
Psychologie/Journal of Psychology, 219(1), 3–22. https://doi.org/10.1027/2151-
2604/a000041
Porter, A. C., Polikoff, M. S., Zeidner, T., & Smithson, J. (2008). The Quality of Content
Analyses of State Student Achievement Tests and Content Standards. Educational
Measurement: Issues and Practice, 27(4), 2–14. https://doi.org/10.1111/j.1745-
3992.2008.00134.x
R Core Team. (2020). R: A Language and Environment for Statistical Computing. R
Foundation for Statistical Computing. https://www.R-project.org/
Schneider, M. C., Huff, K. L., Egan, K. L., Gaines, M. L., & Ferrara, S. (2013). Relationships
Among Item Cognitive Complexity, Contextual Demands, and Item Difficulty:
Implications for Achievement-Level Descriptors. Educational Assessment, 18(2), 99–
121. https://doi.org/10.1080/10627197.2013.789296

36
Schumacher, R. F., & Fuchs, L. S. (2012). Does understanding relational terminology mediate
effects of intervention on compare word problems? Journal of Experimental Child
Psychology, 111(4), 607–628. https://doi.org/10.1016/j.jecp.2011.12.001
Shaftel, J., Belton-Kocher, E., Glasnapp, D., & Poggio, J. (2006). The Impact of Language
Characteristics in Mathematics Test Items on the Performance of English Language
Learners and Students with Disabilities. Educational Assessment, 11(2), 105–126.
https://doi.org/10.1207/s15326977ea1102_2
Stiller, J., Hartmann, S., Mathesius, S., Straube, P., Tiemann, R., Nordmeier, V., Krüger, D., &
Upmeier zu Belzen, A. (2016). Assessing scientific reasoning: A comprehensive
evaluation of item features that affect item difficulty. Assessment & Evaluation in
Higher Education, 41(5), 721–732. https://doi.org/10.1080/02602938.2016.1164830
Torres Irribarra, D., & Freund, R. (2014). Wright Map: IRT item-person map with ConQuest
integration. http://github.com/david-ti/wrightmap
Tveit, S. (2014). Educational assessment in Norway. Assessment in Education: Principles,
Policy & Practice, 21(2), 221–237. https://doi.org/10.1080/0969594X.2013.830079
Utdanningsdirektoratet. (2019, november 20). Kva er nasjonale prøver? Retrieved 3 April,
2020, from https://www.udir.no/eksamen-og-prover/prover/nasjonale-prover/om-
nasjonale-prover/
Utdanningsdirektoratet. (2020). Læreplan i matematikk fellesfag (MAT1-04). Retrieved 3
April, 2020, from https://www.udir.no/laring-og-trivsel/lareplanverket/finn-
lareplan/lareplan/?kode=MAT1-04
Verschaffel, L. (2000). Making sense of word problems. Swets & Zeitlinger.
Vilenius‐Tuohimaa, P. M., Aunola, K., & Nurmi, J.-E. (2008). The association between
mathematical word problems and reading comprehension. Educational Psychology,
28(4), 409–426. https://doi.org/10.1080/01443410701708228
37
Walkington, C., Clinton, V., & Shivraj, P. (2018). How Readability Factors Are Differentially
Associated With Performance for Students of Different Backgrounds When Solving
Mathematics Word Problems. American Educational Research Journal, 55(2), 362–
414. https://doi.org/10.3102/0002831217737028
Warren, E. (2006). Comparative Mathematical Language in the Elementary School: A
Longitudinal Study. Educational Studies in Mathematics, 62(2), 169–189.
https://doi.org/10.1007/s10649-006-4627-5
Whitely, S. E. (1983). Construct validity: Construct representation versus nomothetic span.
Psychological Bulletin, 93(1), 179–197.
Wilson, M., & De Boeck, P. (2004). Descriptive and explanatory item response models. In. De
Boeck & M. Wilson (Red.), Explanatory Item Response Models: A Generalized Linear
and Nonlinear Approach (s. 43–74). Springer. https://doi.org/10.1007/978-1-4757-
3990-9_2
Yen, W. M. (1984). Effects of Local Item Dependence on the Fit and Equating Performance of
the Three-Parameter Logistic Model. Applied Psychological Measurement, 8(2), 125–
145. https://doi.org/10.1177/014662168400800201
38
Appendix I – A. GDPR Documents and Ethical Approval
Notification Form 885257
Last updated
24.03.2020
Which personal data will be processed?
Type of data
Will you be processing special categories of personal data or personal data relating to
criminal convictions and offences?
No
Project information
Project title
Masters thesis - Mathematics ability in primary school children in Norway.
If the collected personal data will be used for other purposes, please describe
Secondary data only, and will only be used in this project. The original data collection over a
broader scope is done by NIFU and is part of a larger multiple year project (which has received approval
from NSD).
Explain why the processing of personal data is necessary
The students’ Norwegian personal ID is collected, which is used to link test ID occurrences and
changes across time points in the original project. They exist in a securely stored register on an NSD-
approved storage medium. After using this to link test data across time points, the working data files with
test responses will be safely anonymized.
External funding
Type of project
National ID number or other personal identification number
39
Student project, Master’s thesis
Contact information, student
Ymkje Elisabeth Haverkamp, [email protected], tlf: 004794182742
Data controller
Data controller (institution responsible for the project)
NIFU – Nordisk institutt for studier av innovasjon, forskning og utdanning
Project leader (academic employee/supervisor or PhD candidate)
Stephan Daus, [email protected], tlf: 90508325
Will the responsibility of the data controller be shared with other institutions (joint data
controllers)?
No
Sample 1
Describe the sample
Lower primary grade students (grade 3 data for this project specifically)
Recruitment or selection of the sample
Secondary data is the only data in this project. Sample originally selected by NIFU under the 1
plus 1 prosjektet.
Age
7 - 9
Will you include adults (18 years and over) who do not have the capacity to consent?
No
Personal data relating to sample 1
National ID number or other personal identification number
How will you collect data relating to sample 1?
Data from another research project
Legal basis for processing general categories of
personal data Consent (art. 6 nr. 1 a)
Who will give consent for children under 16 years?
Parents/guardians
Information for sample 1

40
Will you inform the sample about the processing of their personal data?
No
Explain why you will not inform the sample about the processing of their personal data.
Only secondary data is used in this project, Communications with sample run via the original
datacontroller NIFU.
Third Persons
Will you be processing data relating to third persons?
No
Documentation
How will consent be documented?
Electronically (email, e-form, digital
signature) Manually (on paper)
How can consent be withdrawn?
contact as specified by original datacontroller NIFU
How can data subjects get access to their personal data or have their personal data corrected
or deleted?
contact as specified by original datacontroller NIFU
Total number of data subjects in the project
5000-9999
Approvals
Will you obtain any of the following approvals or permits for the project?
Processing
Where will the personal data be processed?
Computer belonging to the data controller
Mobile device belonging to the data controller

41
Who will be processing/have access to the collected personal data?
Project leader
Student (student project)
External co-workers/collaborators inside the EU/EEA
Internal co-workers
Will the collected personal data be transferred/made available to a third country or
international organisation outside the EU/EEA?
No
Information Security
Will directly identifiable data be stored separately from the rest of the collected data (e.g. in
a scrambling key)?
Yes
Which technical and practical measures will be used to secure the personal data?
Personal data will be anonymised as soon as no longer
needed Restricted access
Duration of processing
Project period
01.09.2019 - 31.12.2020
Will personal data be stored after the end of the project?
No, the collected data will be stored in anonymous form
Which anonymization measures will be taken?
Other
Secondary data, Storage and anonymization measures are done by data controller NIFU
Will the data subjects be identifiable (directly or indirectly) in the thesis/publications from
the project?
No
Additional information
Due to using secondary, already existing data, not all points relate well to the project. While the
project by NIFU uses a wider range of data for a longer time period, this project only contains results from
42
mathematics tests and a code to track students. NIFU uses a securely stored register on an NSD-approved
storage medium with the students’ Norwegian personal ID, which is used to link test ID occurrences and
changes across time points.
The dataset for this project contains the following variables:
AssessmentRoundID
Title - test title
UserID - generated ID
CandidateExternalID - a generated ID for the duration of the project (løpenr)
Questionnumber
Questiontitle
QuestionID
Score
Duration
Starttime
Endtime
Municipality
School
Class - a number indicating the cohort the students are in (09 meaning the 2009 cohort
etc) StrataID
Tschool - dichotomous variable indicating wether the participant is in a test school or not.
NIFU considers this work falling under the 1+1 project, reference number 47196

43
17.4.2020 Meldeskjema for behandling av personopplysninger
NSD's assessment
Project title
Masters thesis - Mathematics ability in primary school children in Norway.
Reference number
885257
Registered
16.01.2020 av Ymkje Elisabeth Haverkamp - [email protected]
Data controller (institution responsible for the project)
NIFU – Nordisk institutt for studier av innovasjon, forskning og utdanning
Project leader (academic employee/supervisor or PhD candidate)
Stephan Daus, [email protected], tlf: 90508325
Type of project
Student project, Master’s thesis
Contact information, student
Ymkje Elisabeth Haverkamp, [email protected], tlf: 004794182742
Project period
01.09.2019 - 31.12.2020
Status
26.03.2020 - Assessed
Assessment (1)
26.03.2020 - Assessed
Our assessment is that the processing of personal data in this project will comply with data
protection legislation, so long as it is carried out in accordance with what is documented in the
Notification Form and attachments, dated 26.03.2020, as well as in correspondence with NSD.
Everything is in place for the processing to begin.
NOTIFY CHANGES
If you intend to make changes to the processing of personal data in this project it may be
necessary to notify NSD. This is done by updating the information registered in the Notification Form.
On our website we explain which changes must be notified. Wait until you receive an answer from us
before you carry out the
https://meldeskjema.nsd.no/vurdering/5e204db5-fe84-4d47-9a56-b369003cb811 1/2
17.4.2020 Meldeskjema for behandling av personopplysninger changes.
TYPE OF DATA AND DURATION
The project will be processing general categories of personal data until 31.12.2020.

44
LEGAL BASIS
The project will gain consent from data subjects to process their personal data. We find that
consent will meet the necessary requirements under art. 4 (11) and 7, in that it will be a freely given,
specific, informed and unambiguous statement or action, which will be documented and can be
withdrawn. The legal basis for processing personal data is therefore consent given by the data subject, cf.
the General Data Protection Regulation art. 6.1 a).
PRINCIPLES RELATING TO PROCESSING PERSONAL DATA
NSD finds that the planned processing of personal data will be in accordance with the principles
under the General Data Protection Regulation regarding:
- lawfulness, fairness and transparency (art. 5.1 a), in that data subjects will receive sufficient
informationabout the processing and will give their consent
- purpose limitation (art. 5.1 b), in that personal data will be collected for specified, explicit and
legitimatepurposes, and will not be processed for new, incompatible purposes
- data minimisation (art. 5.1 c), in that only personal data which are adequate, relevant and
necessary for thepurpose of the project will be processed
- storage limitation (art. 5.1 e), in that personal data will not be stored for longer than is necessary
to fulfilthe project’s purpose
THE RIGHTS OF DATA SUBJECTS
Data subjects will have the following rights in this project: transparency (art. 12), information
(art. 13), access (art. 15), rectification (art. 16), erasure (art. 17), restriction of processing (art. 18),
notification (art.
19), data portability (art. 20).
These rights apply so long as the data subject can be identified in the collected data.
NSD finds that the information that will be given to data subjects about the processing of their
personal data will meet the legal requirements for form and content, cf. art. 12.1 and art. 13.
We remind you that if a data subject contacts you about their rights, the data controller has a
duty to reply within a month.
FOLLOW YOUR INSTITUTION’S GUIDELINES
NSD presupposes that the project will meet the requirements of accuracy (art. 5.1 d), integrity
and confidentiality (art. 5.1 f) and security (art. 32) when processing personal data.
To ensure that these requirements are met you must follow your institution’s internal guidelines
and/or consult with your institution (i.e. the institution responsible for the project).
FOLLOW-UP OF THE PROJECT
NSD will follow up the progress of the project at the planned end date in order to determine
whether the processing of personal data has been concluded.
Good luck with the project!
Contact person at NSD: Gry Henriksen
Data Protection Services for Research: +47 55 58 21 17 (press 1)
https://meldeskjema.nsd.no/vurdering/5e204db5-fe84-4d47-9a56-b369003cb811 2/2

45
Appendix I – B. Information to parents and teachers.
Informasjon til foresatte om skolens deltakelse i 1+1 prosjektet
Din kommune deltar i forskningsprosjektet 1+1 prosjektet: Smågruppeundervisning i matematikk
på småskoletrinnet. Til sammen deltar 160 skoler fordelt over 10 kommuner i Norge. Hensikten med
prosjektet er å undersøke om elevene oppnår bedre ferdigheter i matematikk når skolene tildeles mer
lærerressurser slik at matematikkundervisningen kan gis i små grupper på 4-6 elever i deler av skoleåret.
Prosjektet er finansiert av Norges forskningsråd og utføres i et samarbeid mellom tre forskningsmiljøer:
NIFU Nordisk institutt for studier av innovasjon, forskning og utdanning, Senter for økonomisk forskning
(SØF) og Institutt for samfunnsforskning (ISF).
Som del av prosjektet vil alle skolene gjennomføre korte prøver i matematikk i
begynnelsen og mot slutten av hvert skoleår. Dette gjøres for å undersøke hvordan elevenes
ferdigheter i matematikk har utviklet seg i løpet av skoleåret. Elevene vil også få spørsmål om
læringsmiljøet sitt. Prøvene vil utgjøre et pedagogisk verktøy for matematikklærerne i utformingen av
tilpasset opplæring for hver elev. Prosjektet vil videre innhente resultater fra nasjonale prøver på 5. og 8.
trinn, samt karakterer på 10. trinn. Enkelte av skolene vil få besøk av forskere i løpet av prosjektperioden,
disse vil snakke med matematikklærere og observere undervisningen.
I prosjektet vil det være viktig å kunne koble resultater på tvers av prøvene, ved hjelp av et
identifikasjonsnummer for eleven. Prosjektet vil koble på informasjon om foreldres utdanningsnivå, kjønn
og innvandringsstatus (fødeland) for elever og foreldre. Dette hentes fra Statistisk Sentralbyrås
befolkningsregister.
Sammenkoblingen av resultater fra ulike tester og kobling med data fra befolkningsregistret krever
aktivt samtykke fra foreldre/foresatte. Prosjektet vil gi verdifull informasjon om hvordan kvaliteten i norsk
skole kan forbedres. Vi håper derfor at du/dere er villige til å delta.

46
Hva skjer med informasjonen om elevene?
Alle personopplysninger vil bli behandlet konfidensielt. Kun forskere i prosjektgruppen vil ha
tilgang til personopplysningene. Dataene lagres på et sikret område, hvor kun prosjektdeltakere har tilgang,
via passord. Elever og skoler anonymiseres i analysene. Det betyr at ingen elever eller skoler vil kunne
gjenkjennes i noen publikasjoner fra prosjektet.
Prosjektet skal avsluttes 31.07.2021. Data vil opprettholdes i sin opprinnelige form fram til
31.12.2025. Etter det vil dataene bli anonymisert. Datainnsamlingen er godkjent av Personvernombudet
for forskning ved Norsk samfunnsvitenskapelig datatjeneste (NSD).
Frivillig deltakelse
Det er frivillig å delta i studien, og du kan når som helst trekke ditt samtykke uten å oppgi noen
grunn. Dersom du trekker samtykket, vil alle personopplysninger om barnet ditt slettes. Beslutningen om å
delta eller ikke vil ikke ha noen innvirkning på ditt barns undervisning.
For mer informasjon om 1+1 prosjektet, se vår hjemmeside: http://1pluss1prosjektet.no På forhånd
takk for ditt bidrag til dette prosjektet!
Vennlig hilsen
Vibeke Opheim
Prosjektleder
47
Samtykke
Jeg har mottatt informasjon om prosjektet, og gir tillatelse til at mitt barn deltar.
Det er til stor hjelp for oss dersom du kan fylle ut barnets og skolens navn med
BLOKKBOKSTAVER.
Barnets navn: ______________________________________________________
Klassenavn: _______________________________________________________
Skolens navn: ______________________________________________________
Foresattes signatur: _____________________________________________
(Skjemaet leveres til skolen).

48
Appendix II – Data Management and Analysis Code
##################################
##SETUP & DATA IMPORT
##################################
#install.packages('WrightMap')
pkg = c("mirt","tidyverse", 'dplyr', 'tidyr', 'car', 'corrplot',
'WrightMap', 'lme4', 'psych') #vector with packages you use
sapply(pkg,library,character.only=TRUE) #load in relevant packages at start
missingRecoder <- function(df) { # df must be a dataframe, not a matrix, in
this function
for(row in 1:nrow(df)) { ## Recoding omitted as incorrect, leaving not-
reached as missing and the rest as is
for(col in (ncol(df)-1):3) { # Going backwards
if(is.na(df[row, col])) { # If this cell is empty
if(!all(is.na(df[row, col:ncol(df)]))) { # and all cells from this
cells to the last column are not all empty
df[row, col] <- 0L
} else if(!is.na(df[row, col-1])) { # and the cell after this is
not empty
df[row, col] <- 0L
}
}
}
}
df
}
#1. A clean item response dataset: Persons - by - Items with first column
the person ID
#ID variable for persons: "Person"
#All binary coded items
#clean implies unique codes, no duplicates or missing ID
#2. A clean item covariates dataset: Items - by - Features with first
column the item ID
#ID variable for items: "Item"
#AMK dummy: 0 = basic, 1 =rest, word count, recoded, item order, ...
#3. A clean person covariates dataset: Persons - by - Characteristics
dataIR17 = read.csv("dataIRwide17.csv")
dataIR17 = cbind(dataIR17$Person,missingRecoder(dataIR17[,-c(1,2)]))
names(dataIR17)[1]="Person"
dataIR18 = read.csv("dataIRwide18.csv")
dataIR18 = cbind(dataIR18$Person,missingRecoder(dataIR18[,-c(1)]))
names(dataIR18)[1]="Person"
dataP17=read.csv('rowpersons (1).csv')
dataP18= read.csv('rowpersons18 (1).csv')
dataI17=read.csv('newframework17.csv')
dataI18=read.csv('newframework18.csv')
##################################
##ITEM RESPONSE DATA SUMMARY
##################################
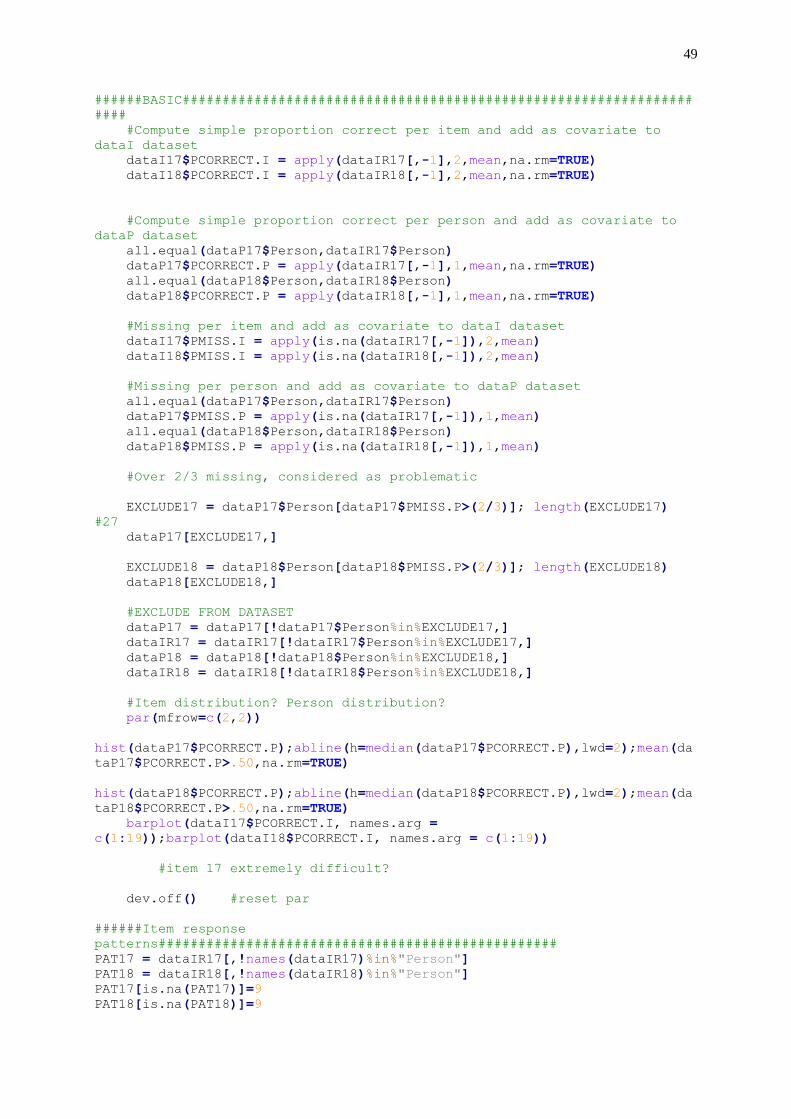
49
######BASIC################################################################
####
#Compute simple proportion correct per item and add as covariate to
dataI dataset
dataI17$PCORRECT.I = apply(dataIR17[,-1],2,mean,na.rm=TRUE)
dataI18$PCORRECT.I = apply(dataIR18[,-1],2,mean,na.rm=TRUE)
#Compute simple proportion correct per person and add as covariate to
dataP dataset
all.equal(dataP17$Person,dataIR17$Person)
dataP17$PCORRECT.P = apply(dataIR17[,-1],1,mean,na.rm=TRUE)
all.equal(dataP18$Person,dataIR18$Person)
dataP18$PCORRECT.P = apply(dataIR18[,-1],1,mean,na.rm=TRUE)
#Missing per item and add as covariate to dataI dataset
dataI17$PMISS.I = apply(is.na(dataIR17[,-1]),2,mean)
dataI18$PMISS.I = apply(is.na(dataIR18[,-1]),2,mean)
#Missing per person and add as covariate to dataP dataset
all.equal(dataP17$Person,dataIR17$Person)
dataP17$PMISS.P = apply(is.na(dataIR17[,-1]),1,mean)
all.equal(dataP18$Person,dataIR18$Person)
dataP18$PMISS.P = apply(is.na(dataIR18[,-1]),1,mean)
#Over 2/3 missing, considered as problematic
EXCLUDE17 = dataP17$Person[dataP17$PMISS.P>(2/3)]; length(EXCLUDE17)
#27
dataP17[EXCLUDE17,]
EXCLUDE18 = dataP18$Person[dataP18$PMISS.P>(2/3)]; length(EXCLUDE18)
dataP18[EXCLUDE18,]
#EXCLUDE FROM DATASET
dataP17 = dataP17[!dataP17$Person%in%EXCLUDE17,]
dataIR17 = dataIR17[!dataIR17$Person%in%EXCLUDE17,]
dataP18 = dataP18[!dataP18$Person%in%EXCLUDE18,]
dataIR18 = dataIR18[!dataIR18$Person%in%EXCLUDE18,]
#Item distribution? Person distribution?
par(mfrow=c(2,2))
hist(dataP17$PCORRECT.P);abline(h=median(dataP17$PCORRECT.P),lwd=2);mean(da
taP17$PCORRECT.P>.50,na.rm=TRUE)
hist(dataP18$PCORRECT.P);abline(h=median(dataP18$PCORRECT.P),lwd=2);mean(da
taP18$PCORRECT.P>.50,na.rm=TRUE)
barplot(dataI17$PCORRECT.I, names.arg =
c(1:19));barplot(dataI18$PCORRECT.I, names.arg = c(1:19))
#item 17 extremely difficult?
dev.off() #reset par
######Item response
patterns##################################################
PAT17 = dataIR17[,!names(dataIR17)%in%"Person"]
PAT18 = dataIR18[,!names(dataIR18)%in%"Person"]
PAT17[is.na(PAT17)]=9
PAT18[is.na(PAT18)]=9
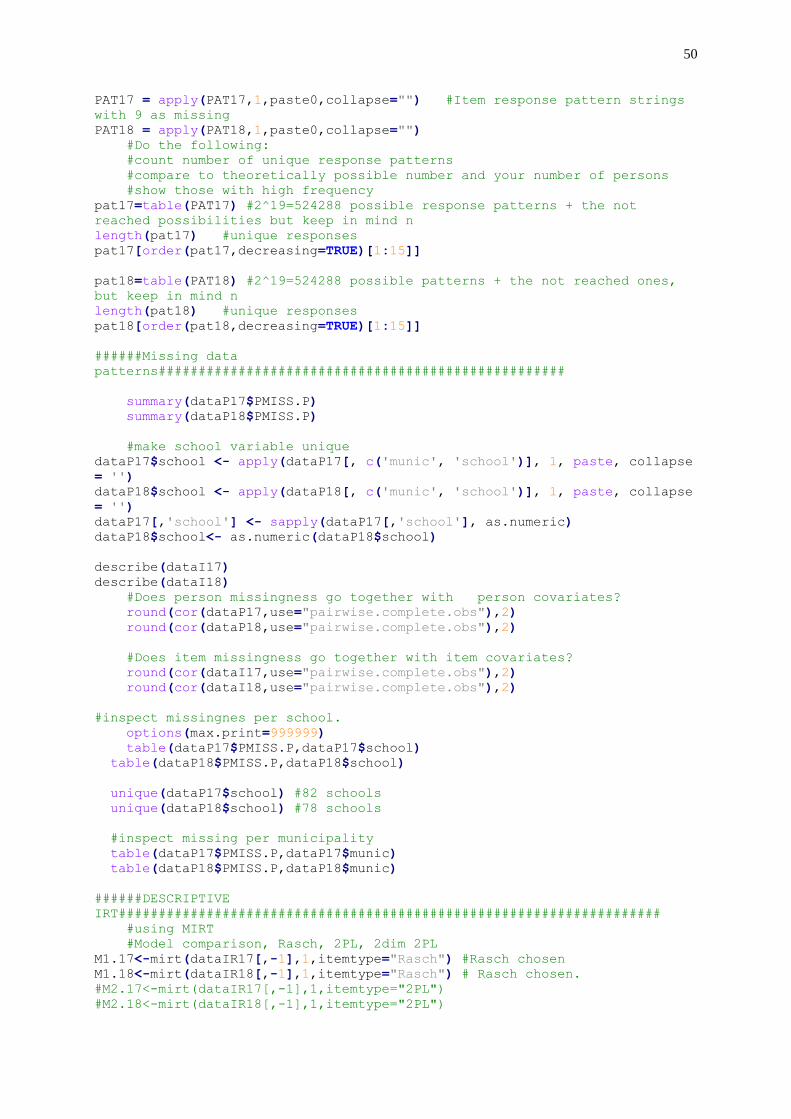
50
PAT17 = apply(PAT17,1,paste0,collapse="") #Item response pattern strings
with 9 as missing
PAT18 = apply(PAT18,1,paste0,collapse="")
#Do the following:
#count number of unique response patterns
#compare to theoretically possible number and your number of persons
#show those with high frequency
pat17=table(PAT17) #2^19=524288 possible response patterns + the not
reached possibilities but keep in mind n
length(pat17) #unique responses
pat17[order(pat17,decreasing=TRUE)[1:15]]
pat18=table(PAT18) #2^19=524288 possible patterns + the not reached ones,
but keep in mind n
length(pat18) #unique responses
pat18[order(pat18,decreasing=TRUE)[1:15]]
######Missing data
patterns###################################################
summary(dataP17$PMISS.P)
summary(dataP18$PMISS.P)
#make school variable unique
dataP17$school <- apply(dataP17[, c('munic', 'school')], 1, paste, collapse
= '')
dataP18$school <- apply(dataP18[, c('munic', 'school')], 1, paste, collapse
= '')
dataP17[,'school'] <- sapply(dataP17[,'school'], as.numeric)
dataP18$school<- as.numeric(dataP18$school)
describe(dataI17)
describe(dataI18)
#Does person missingness go together with person covariates?
round(cor(dataP17,use="pairwise.complete.obs"),2)
round(cor(dataP18,use="pairwise.complete.obs"),2)
#Does item missingness go together with item covariates?
round(cor(dataI17,use="pairwise.complete.obs"),2)
round(cor(dataI18,use="pairwise.complete.obs"),2)
#inspect missingnes per school.
options(max.print=999999)
table(dataP17$PMISS.P,dataP17$school)
table(dataP18$PMISS.P,dataP18$school)
unique(dataP17$school) #82 schools
unique(dataP18$school) #78 schools
#inspect missing per municipality
table(dataP17$PMISS.P,dataP17$munic)
table(dataP18$PMISS.P,dataP18$munic)
######DESCRIPTIVE
IRT####################################################################
#using MIRT
#Model comparison, Rasch, 2PL, 2dim 2PL
M1.17<-mirt(dataIR17[,-1],1,itemtype="Rasch") #Rasch chosen
M1.18<-mirt(dataIR18[,-1],1,itemtype="Rasch") # Rasch chosen.
#M2.17<-mirt(dataIR17[,-1],1,itemtype="2PL")
#M2.18<-mirt(dataIR18[,-1],1,itemtype="2PL")

51
#M3.17<-mirt(dataIR17[,-1],2,itemtype="2PL")
#M3.18<-mirt(dataIR18[,-1],2,itemtype="2PL")
sapply(lapply(c(M1.17,M1.18),M2,na.rm=TRUE),round,3)
M2(M1.17, na.rm = TRUE)
#Summarize:
coef(M2.17,IRT=TRUE,simplify=TRUE)
coef(M2.18,IRT=TRUE,simplify=TRUE)
itemestimates17 <- as.data.frame(coef(M1.17,IRT=TRUE,simplify=TRUE))
itemestimates18 <- as.data.frame(coef(M1.18,IRT=TRUE,simplify=TRUE))
ITEMFIT = lapply(c(M1.17,M1.18),mirt:::itemfit,na.rm=TRUE)
ITEMFIT
fun<-function(x){
alpha = .05 / nrow(x)
return( which(x$p.S_X2<=alpha) )
}
MISFIT = lapply(ITEMFIT,fun)
MISFIT
#inspect empirical plots for possible misfit items
mirt:::itemfit(M1.17, empirical.plot = 1)
mirt:::itemfit(M1.17, empirical.plot = 2)
mirt:::itemfit(M1.17, empirical.plot = 3)
mirt:::itemfit(M1.17, empirical.plot = 5)
mirt:::itemfit(M1.17, empirical.plot = 7)
mirt:::itemfit(M1.17, empirical.plot = 9)
mirt:::itemfit(M1.17, empirical.plot = 14)
mirt:::itemfit(M1.17, empirical.plot = 15)
mirt:::itemfit(M1.17, empirical.plot = 18)
mirt:::itemfit(M1.18, empirical.plot = 5)
mirt:::itemfit(M1.18, empirical.plot = 7)
mirt:::itemfit(M1.18, empirical.plot = 12)
mirt:::itemfit(M1.18, empirical.plot = 13)
mirt:::itemfit(M1.18, empirical.plot = 14)
mirt:::itemfit(M1.18, empirical.plot = 16)
mirt:::itemfit(M1.18, empirical.plot = 18)
Q3.M1.17<-mirt:::residuals(M1.17, type = "Q3")
corrplot(Q3.M1.17, title = 'Q3 plot grade 2', mar=c(0,0,2,0))
#Clean :)
#check for 2dimensional structure
summary(M3.17, rotate= 'promax')
Q3.M1.18<-mirt:::residuals(M1.18, type = "Q3")
corrplot(Q3.M1.18, title = 'Q3 plot grade 3', mar=c(0,0,2,0)) #clean
now 1&2 is 1 item
#check for 2 dimensional structure
summary(M3.18, rotate= 'promax')
#marginal reliability & test information / conditional reliability
function
#test information
plot(seq(-3, 3, by = 0.01), testinfo(M1.17, seq(-3, 3, by = 0.01)),
type = "l", xlab = expression(theta[p]), ylab = "Test Information", ylim =
c(0, 6), lwd = 2.5, col = "red", main = "Test Information 1+1 Tests")
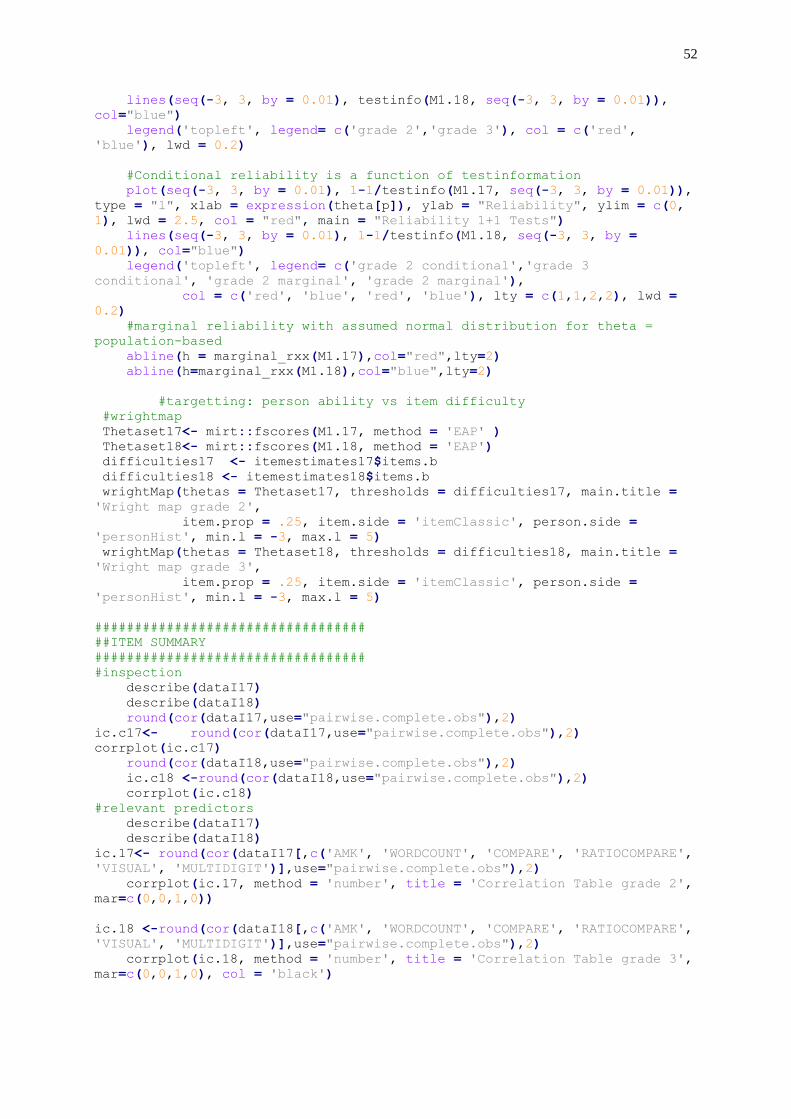
52
lines(seq(-3, 3, by = 0.01), testinfo(M1.18, seq(-3, 3, by = 0.01)),
col="blue")
legend('topleft', legend= c('grade 2','grade 3'), col = c('red',
'blue'), lwd = 0.2)
#Conditional reliability is a function of testinformation
plot(seq(-3, 3, by = 0.01), 1-1/testinfo(M1.17, seq(-3, 3, by = 0.01)),
type = "l", xlab = expression(theta[p]), ylab = "Reliability", ylim = c(0,
1), lwd = 2.5, col = "red", main = "Reliability 1+1 Tests")
lines(seq(-3, 3, by = 0.01), 1-1/testinfo(M1.18, seq(-3, 3, by =
0.01)), col="blue")
legend('topleft', legend= c('grade 2 conditional','grade 3
conditional', 'grade 2 marginal', 'grade 2 marginal'),
col = c('red', 'blue', 'red', 'blue'), lty = c(1,1,2,2), lwd =
0.2)
#marginal reliability with assumed normal distribution for theta =
population-based
abline(h = marginal_rxx(M1.17),col="red",lty=2)
abline(h=marginal_rxx(M1.18),col="blue",lty=2)
#targetting: person ability vs item difficulty
#wrightmap
Thetaset17<- mirt::fscores(M1.17, method = 'EAP' )
Thetaset18<- mirt::fscores(M1.18, method = 'EAP')
difficulties17 <- itemestimates17$items.b
difficulties18 <- itemestimates18$items.b
wrightMap(thetas = Thetaset17, thresholds = difficulties17, main.title =
'Wright map grade 2',
item.prop = .25, item.side = 'itemClassic', person.side =
'personHist', min.l = -3, max.l = 5)
wrightMap(thetas = Thetaset18, thresholds = difficulties18, main.title =
'Wright map grade 3',
item.prop = .25, item.side = 'itemClassic', person.side =
'personHist', min.l = -3, max.l = 5)
##################################
##ITEM SUMMARY
##################################
#inspection
describe(dataI17)
describe(dataI18)
round(cor(dataI17,use="pairwise.complete.obs"),2)
ic.c17<- round(cor(dataI17,use="pairwise.complete.obs"),2)
corrplot(ic.c17)
round(cor(dataI18,use="pairwise.complete.obs"),2)
ic.c18 <-round(cor(dataI18,use="pairwise.complete.obs"),2)
corrplot(ic.c18)
#relevant predictors
describe(dataI17)
describe(dataI18)
ic.17<- round(cor(dataI17[,c('AMK', 'WORDCOUNT', 'COMPARE', 'RATIOCOMPARE',
'VISUAL', 'MULTIDIGIT')],use="pairwise.complete.obs"),2)
corrplot(ic.17, method = 'number', title = 'Correlation Table grade 2',
mar=c(0,0,1,0))
ic.18 <-round(cor(dataI18[,c('AMK', 'WORDCOUNT', 'COMPARE', 'RATIOCOMPARE',
'VISUAL', 'MULTIDIGIT')],use="pairwise.complete.obs"),2)
corrplot(ic.18, method = 'number', title = 'Correlation Table grade 3',
mar=c(0,0,1,0), col = 'black')
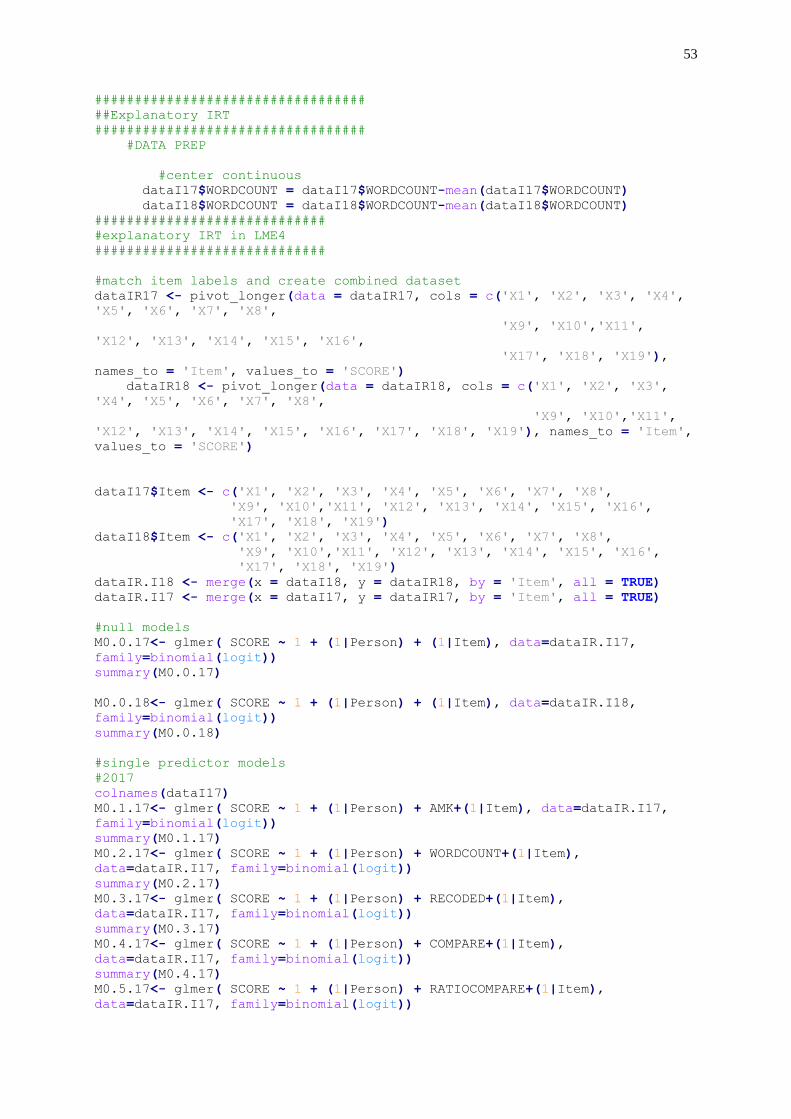
53
##################################
##Explanatory IRT
##################################
#DATA PREP
#center continuous
dataI17$WORDCOUNT = dataI17$WORDCOUNT-mean(dataI17$WORDCOUNT)
dataI18$WORDCOUNT = dataI18$WORDCOUNT-mean(dataI18$WORDCOUNT)
#############################
#explanatory IRT in LME4
#############################
#match item labels and create combined dataset
dataIR17 <- pivot_longer(data = dataIR17, cols = c('X1', 'X2', 'X3', 'X4',
'X5', 'X6', 'X7', 'X8',
'X9', 'X10','X11',
'X12', 'X13', 'X14', 'X15', 'X16',
'X17', 'X18', 'X19'),
names_to = 'Item', values_to = 'SCORE')
dataIR18 <- pivot_longer(data = dataIR18, cols = c('X1', 'X2', 'X3',
'X4', 'X5', 'X6', 'X7', 'X8',
'X9', 'X10','X11',
'X12', 'X13', 'X14', 'X15', 'X16', 'X17', 'X18', 'X19'), names_to = 'Item',
values_to = 'SCORE')
dataI17$Item <- c('X1', 'X2', 'X3', 'X4', 'X5', 'X6', 'X7', 'X8',
'X9', 'X10','X11', 'X12', 'X13', 'X14', 'X15', 'X16',
'X17', 'X18', 'X19')
dataI18$Item <- c('X1', 'X2', 'X3', 'X4', 'X5', 'X6', 'X7', 'X8',
'X9', 'X10','X11', 'X12', 'X13', 'X14', 'X15', 'X16',
'X17', 'X18', 'X19')
dataIR.I18 <- merge(x = dataI18, y = dataIR18, by = 'Item', all = TRUE)
dataIR.I17 <- merge(x = dataI17, y = dataIR17, by = 'Item', all = TRUE)
#null models
M0.0.17<- glmer( SCORE ~ 1 + (1|Person) + (1|Item), data=dataIR.I17,
family=binomial(logit))
summary(M0.0.17)
M0.0.18<- glmer( SCORE ~ 1 + (1|Person) + (1|Item), data=dataIR.I18,
family=binomial(logit))
summary(M0.0.18)
#single predictor models
#2017
colnames(dataI17)
M0.1.17<- glmer( SCORE ~ 1 + (1|Person) + AMK+(1|Item), data=dataIR.I17,
family=binomial(logit))
summary(M0.1.17)
M0.2.17<- glmer( SCORE ~ 1 + (1|Person) + WORDCOUNT+(1|Item),
data=dataIR.I17, family=binomial(logit))
summary(M0.2.17)
M0.3.17<- glmer( SCORE ~ 1 + (1|Person) + RECODED+(1|Item),
data=dataIR.I17, family=binomial(logit))
summary(M0.3.17)
M0.4.17<- glmer( SCORE ~ 1 + (1|Person) + COMPARE+(1|Item),
data=dataIR.I17, family=binomial(logit))
summary(M0.4.17)
M0.5.17<- glmer( SCORE ~ 1 + (1|Person) + RATIOCOMPARE+(1|Item),
data=dataIR.I17, family=binomial(logit))
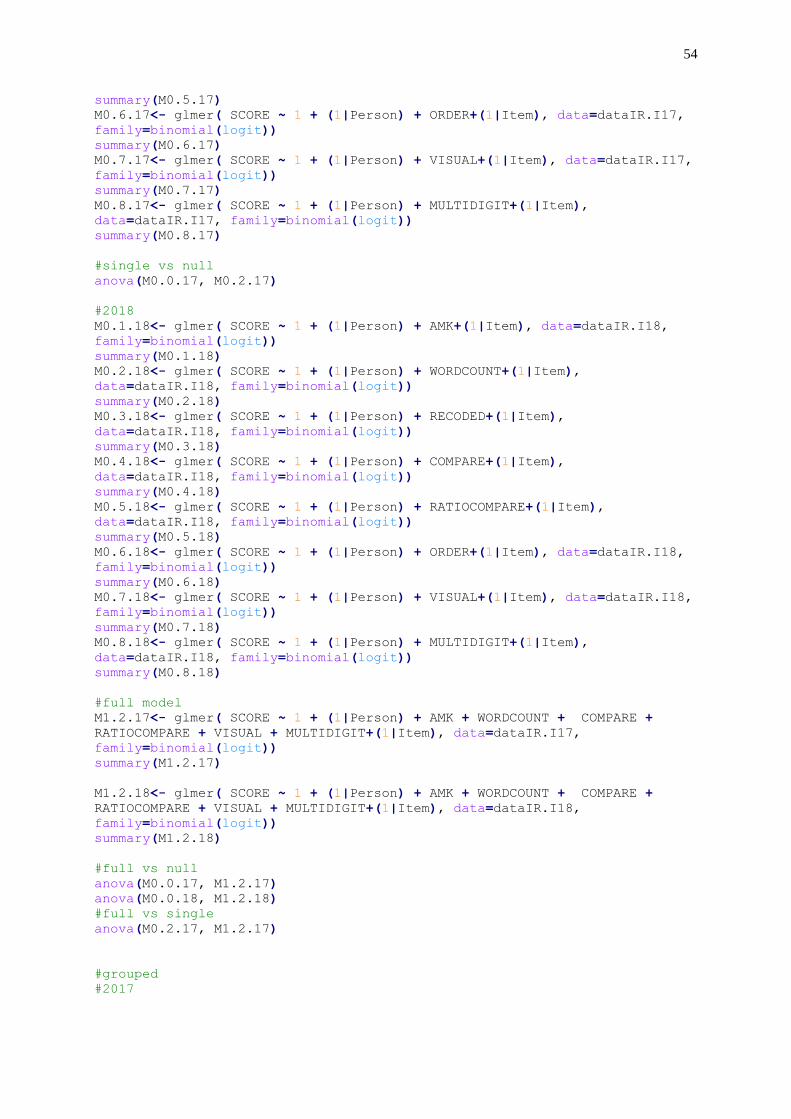
54
summary(M0.5.17)
M0.6.17<- glmer( SCORE ~ 1 + (1|Person) + ORDER+(1|Item), data=dataIR.I17,
family=binomial(logit))
summary(M0.6.17)
M0.7.17<- glmer( SCORE ~ 1 + (1|Person) + VISUAL+(1|Item), data=dataIR.I17,
family=binomial(logit))
summary(M0.7.17)
M0.8.17<- glmer( SCORE ~ 1 + (1|Person) + MULTIDIGIT+(1|Item),
data=dataIR.I17, family=binomial(logit))
summary(M0.8.17)
#single vs null
anova(M0.0.17, M0.2.17)
#2018
M0.1.18<- glmer( SCORE ~ 1 + (1|Person) + AMK+(1|Item), data=dataIR.I18,
family=binomial(logit))
summary(M0.1.18)
M0.2.18<- glmer( SCORE ~ 1 + (1|Person) + WORDCOUNT+(1|Item),
data=dataIR.I18, family=binomial(logit))
summary(M0.2.18)
M0.3.18<- glmer( SCORE ~ 1 + (1|Person) + RECODED+(1|Item),
data=dataIR.I18, family=binomial(logit))
summary(M0.3.18)
M0.4.18<- glmer( SCORE ~ 1 + (1|Person) + COMPARE+(1|Item),
data=dataIR.I18, family=binomial(logit))
summary(M0.4.18)
M0.5.18<- glmer( SCORE ~ 1 + (1|Person) + RATIOCOMPARE+(1|Item),
data=dataIR.I18, family=binomial(logit))
summary(M0.5.18)
M0.6.18<- glmer( SCORE ~ 1 + (1|Person) + ORDER+(1|Item), data=dataIR.I18,
family=binomial(logit))
summary(M0.6.18)
M0.7.18<- glmer( SCORE ~ 1 + (1|Person) + VISUAL+(1|Item), data=dataIR.I18,
family=binomial(logit))
summary(M0.7.18)
M0.8.18<- glmer( SCORE ~ 1 + (1|Person) + MULTIDIGIT+(1|Item),
data=dataIR.I18, family=binomial(logit))
summary(M0.8.18)
#full model
M1.2.17<- glmer( SCORE ~ 1 + (1|Person) + AMK + WORDCOUNT + COMPARE +
RATIOCOMPARE + VISUAL + MULTIDIGIT+(1|Item), data=dataIR.I17,
family=binomial(logit))
summary(M1.2.17)
M1.2.18<- glmer( SCORE ~ 1 + (1|Person) + AMK + WORDCOUNT + COMPARE +
RATIOCOMPARE + VISUAL + MULTIDIGIT+(1|Item), data=dataIR.I18,
family=binomial(logit))
summary(M1.2.18)
#full vs null
anova(M0.0.17, M1.2.17)
anova(M0.0.18, M1.2.18)
#full vs single
anova(M0.2.17, M1.2.17)
#grouped
#2017

55
m3.4.17 <- glmer(SCORE ~ 1 + (1|Person) + WORDCOUNT + COMPARE +
RATIOCOMPARE +(1|Item), data = dataIR.I17, family=binomial(logit))
summary(m3.4.17)
m3.5.17 <- glmer(SCORE ~ 1 + (1|Person) + AMK + COMPARE + RATIOCOMPARE
+(1|Item), data = dataIR.I17, family=binomial(logit))
summary(m3.5.17)
m3.6.17 <- glmer(SCORE ~ 1 + (1|Person) + MULTIDIGIT + COMPARE +
RATIOCOMPARE +(1|Item), data = dataIR.I17, family=binomial(logit))
summary(m3.6.17)
#group vs null
anova(M0.0.17, m3.4.17)
anova(M0.0.17, m3.5.17)
anova(M0.0.17, m3.6.17)
#Language+compare group vs language single
anova(M0.2.17, m3.4.17)
#group vs full
#anova(M1.2.17, m3.4.17)
#2018
m3.4.18 <- glmer( SCORE ~ 1 + (1|Person) + WORDCOUNT + COMPARE +
RATIOCOMPARE +(1|Item), data=dataIR.I18, family=binomial(logit))
summary(m3.4.18)
m3.5.18 <- glmer( SCORE ~ 1 + (1|Person) + AMK + COMPARE + RATIOCOMPARE
+(1|Item), data=dataIR.I18, family=binomial(logit))
summary(m3.5.18)
m3.6.18 <- glmer( SCORE ~ 1 + (1|Person) + MULTIDIGIT+ COMPARE +
RATIOCOMPARE +(1|Item), data=dataIR.I18, family=binomial(logit))
summary(m3.6.18)
#group vs null
anova(M0.0.18, m3.4.18)
anova(M0.0.18, m3.5.18)
anova(M0.0.18, m3.6.18)
#Language+compare group vs full
anova(M1.2.18, m3.4.18)
invlogit<-function(x){
Pr = 1/(1+exp(-x))
return(Pr)
}
ICC.irt<-function(m,reqVC=FALSE){
VC = c(unlist(lapply(VarCorr(m), diag)),(pi^2)/3)
if(reqVC){return(VC);}
ICC = VC/sum(VC)
return(ICC)
}
R2item<-function(m1,m0){
vc1=unlist(lapply(VarCorr(m1), diag))[2]
vc0=unlist(lapply(VarCorr(m0), diag))[2]
R2=1-vc1/vc0
return(R2)
}
summary(M0.0.17)
invlogit(fixef(M0.0.17)[1])
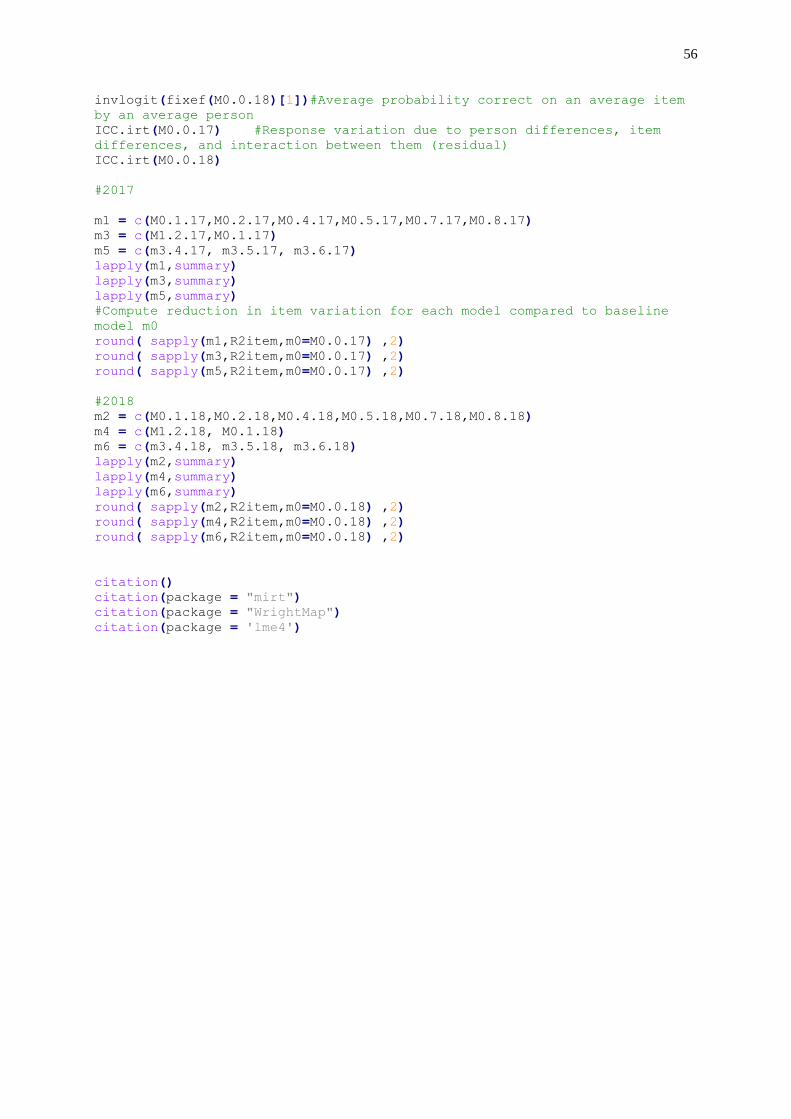
56
invlogit(fixef(M0.0.18)[1])#Average probability correct on an average item
by an average person
ICC.irt(M0.0.17) #Response variation due to person differences, item
differences, and interaction between them (residual)
ICC.irt(M0.0.18)
#2017
m1 = c(M0.1.17,M0.2.17,M0.4.17,M0.5.17,M0.7.17,M0.8.17)
m3 = c(M1.2.17,M0.1.17)
m5 = c(m3.4.17, m3.5.17, m3.6.17)
lapply(m1,summary)
lapply(m3,summary)
lapply(m5,summary)
#Compute reduction in item variation for each model compared to baseline
model m0
round( sapply(m1,R2item,m0=M0.0.17) ,2)
round( sapply(m3,R2item,m0=M0.0.17) ,2)
round( sapply(m5,R2item,m0=M0.0.17) ,2)
#2018
m2 = c(M0.1.18,M0.2.18,M0.4.18,M0.5.18,M0.7.18,M0.8.18)
m4 = c(M1.2.18, M0.1.18)
m6 = c(m3.4.18, m3.5.18, m3.6.18)
lapply(m2,summary)
lapply(m4,summary)
lapply(m6,summary)
round( sapply(m2,R2item,m0=M0.0.18) ,2)
round( sapply(m4,R2item,m0=M0.0.18) ,2)
round( sapply(m6,R2item,m0=M0.0.18) ,2)
citation()
citation(package = "mirt")
citation(package = "WrightMap")
citation(package = 'lme4')
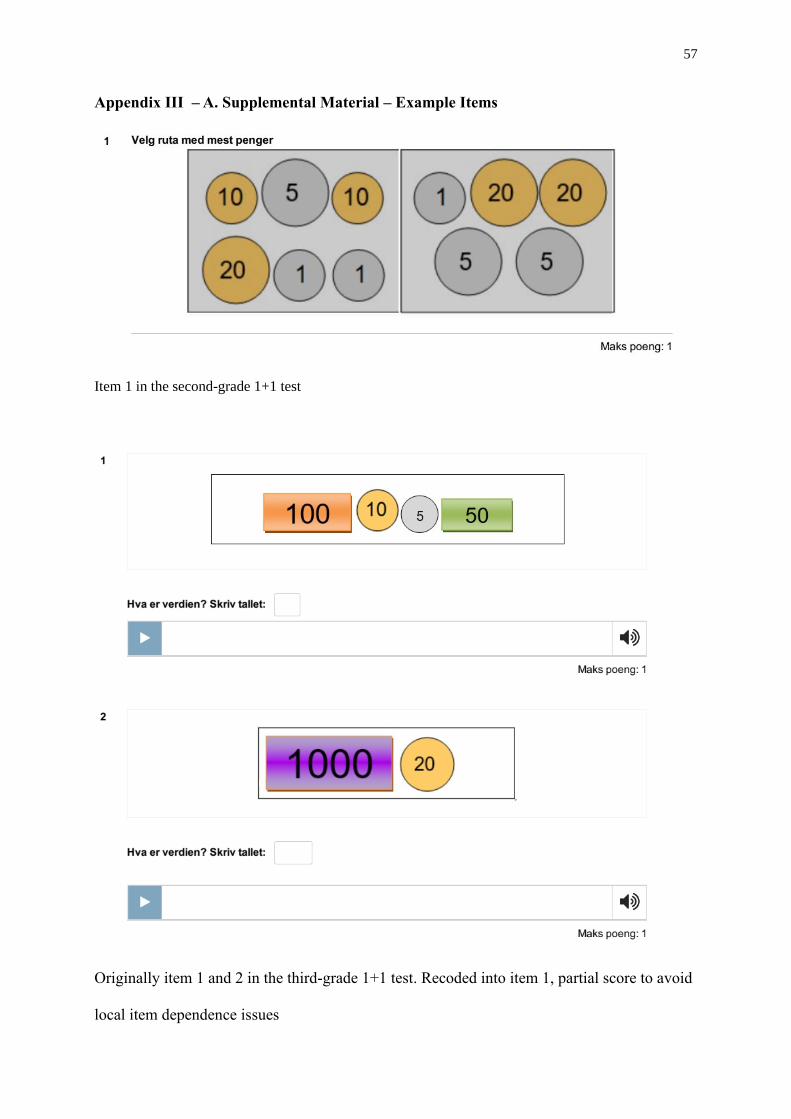
57
Appendix III – A. Supplemental Material – Example Items
Item 1 in the second-grade 1+1 test
Originally item 1 and 2 in the third-grade 1+1 test. Recoded into item 1, partial score to avoid
local item dependence issues
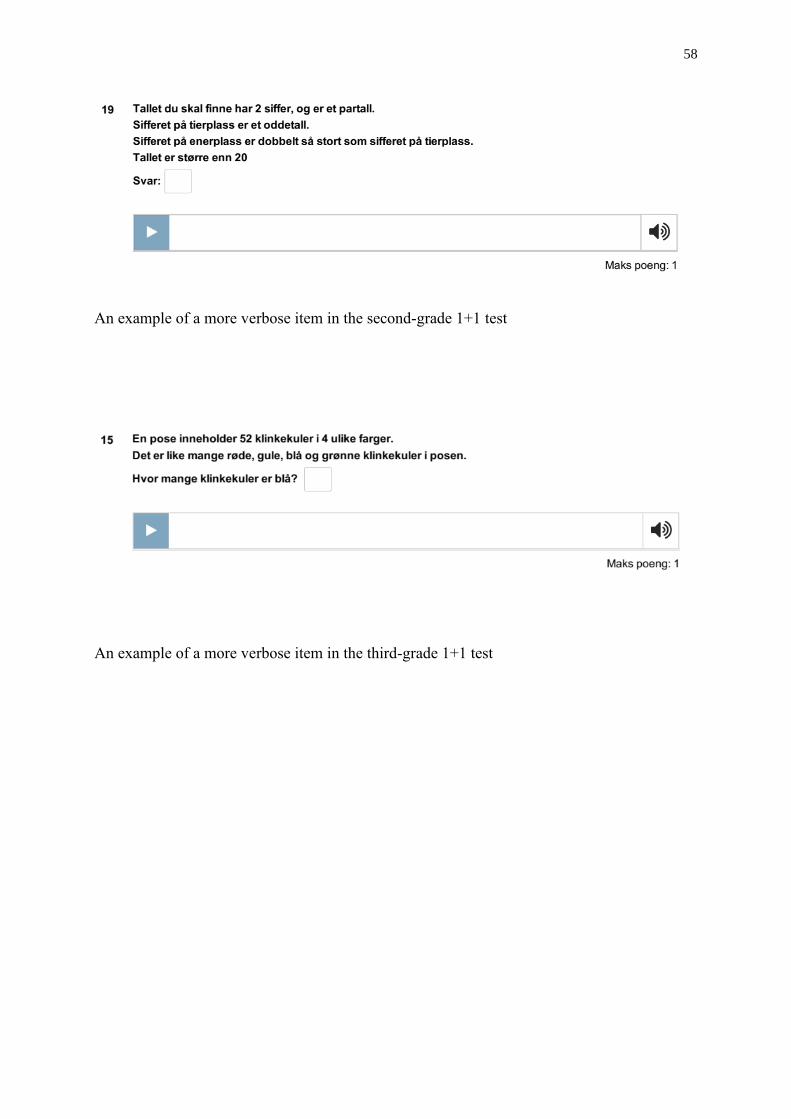
58
An example of a more verbose item in the second-grade 1+1 test
An example of a more verbose item in the third-grade 1+1 test
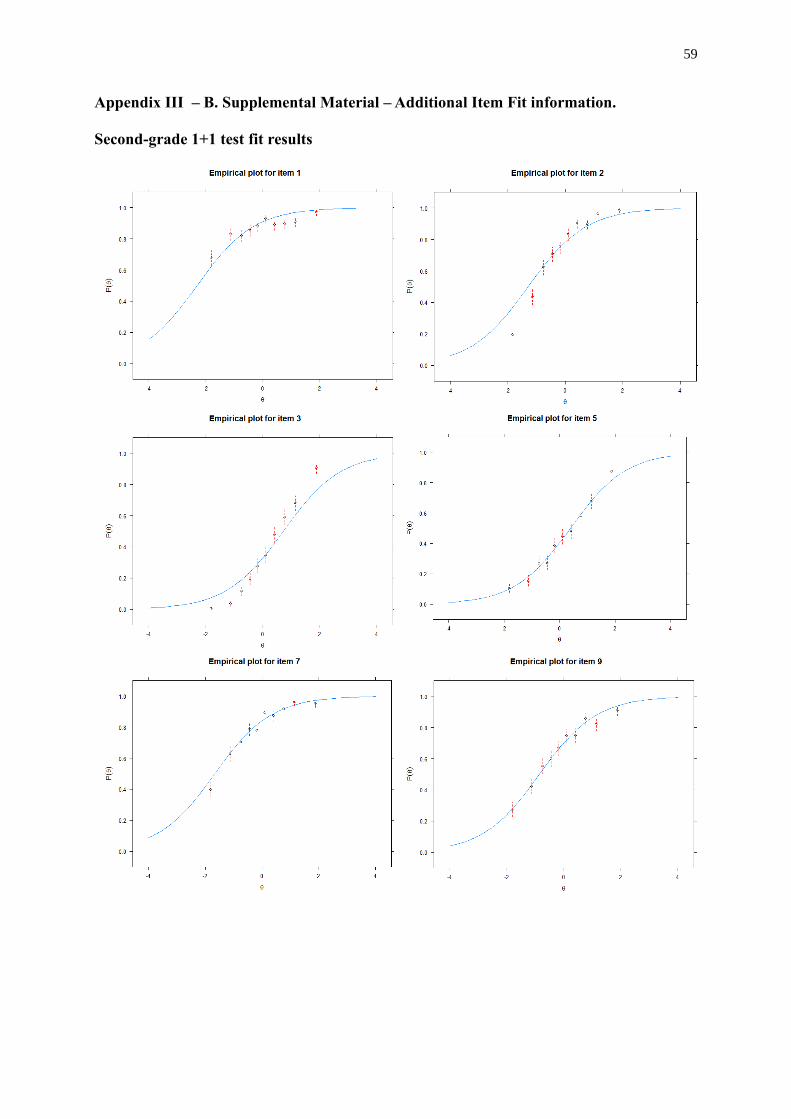
59
Appendix III – B. Supplemental Material – Additional Item Fit information.
Second-grade 1+1 test fit results
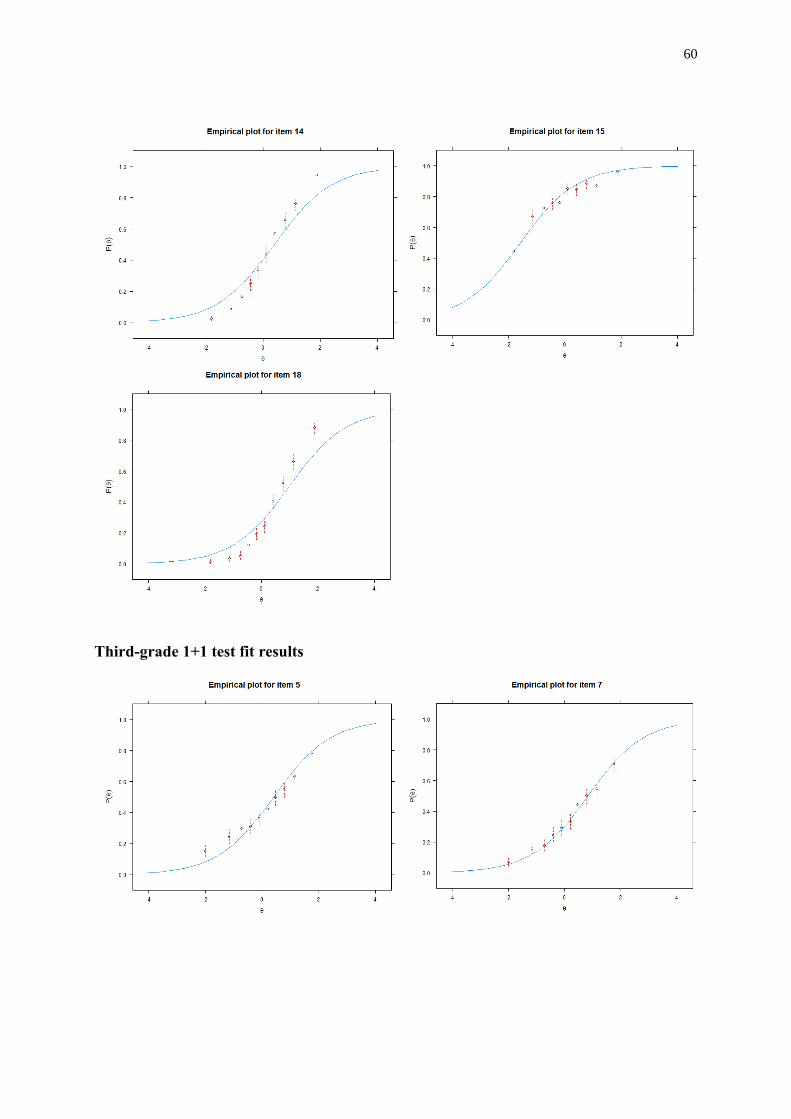
60
Third-grade 1+1 test fit results
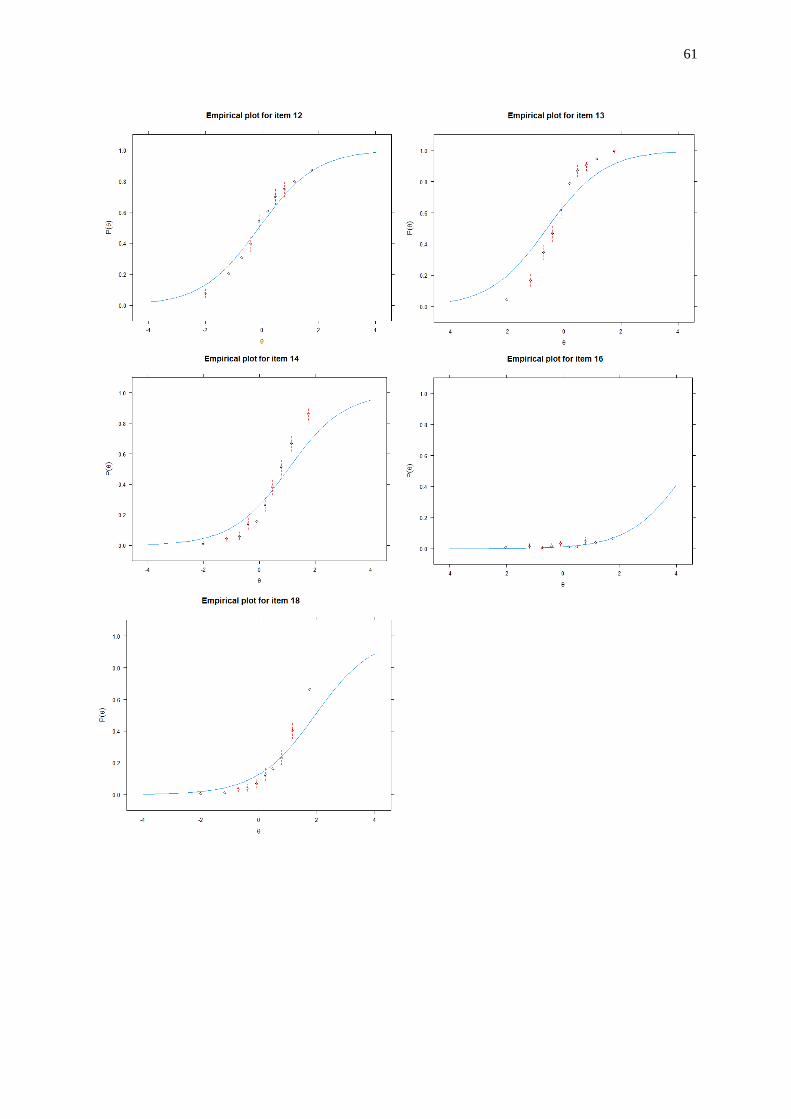
61
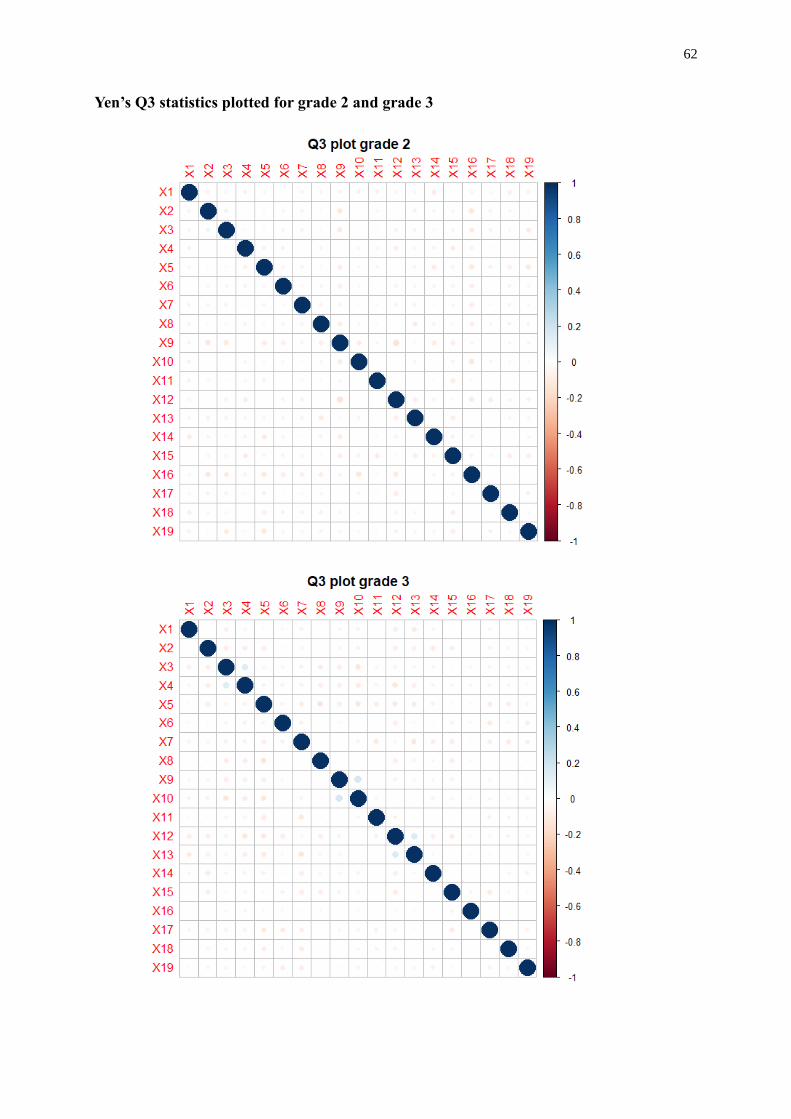
62
Yen’s Q3 statistics plotted for grade 2 and grade 3