investigation of aldehyde oxidase and xanthine...
TRANSCRIPT

Investigation of aldehyde oxidase and
xanthine oxidoreductase in rainbow trout
(Oncorhynchus mykiss)
Omaro Aburas B.Sc., M.Sc.
Department of Chemical and Biological Science
University of Huddersfield
United Kingdom
Thesis submitted in partial fulfilment of the
requirements for the Degree of Doctor of
Philosophy
July 2014

I
Abstract
Molybdo-flavoenzymes (MFEs), aldehyde oxidase (AOX) and xanthine
oxidoreductase (XOR) are involved in the oxidation of N-heterocyclic compounds
and aldehydes, many of which are environmental pollutants, drugs and vitamins.
This biotransformation generally generates more polar compounds that are more
easily excreted, thus MFEs have been classed as detoxication enzymes.
To date there has been scant study of the properties, substrate and inhibitor
specificities of MFEs in non-mammalian vertebrate organisms. This investigation
focuses on MFEs in rainbow trout (Oncorhynchus mykiss) as it belongs to a class of
fish that host a single AOX (AOXβ) and one XOR.
In this study the substrate specificity of rainbow trout liver AOX and XOR was
investigated using HPLC and spectrophotometric assays. AOX in hepatic cytosol
was found to be able to catalyse the oxidation of azanaphthalenes belonging to a
group of compounds that are environmental pollutants such as phenanthridine,
phthalazine and cinchonine. In addition, xenobiotic aromatic aldehydes (vanillin
and dimethylaminocinnamaldehyde) and drugs such as allopurinol and
pyrazinamide were substrates. Several endogenous vitamins including pyridoxal
(vitamin B6), all-trans retinal (vitamin A) and N1-methylnicotinamide were also
biotransformed by the rainbow trout AOX. In contrast to liver no AOX activity was
detectable in kidney and gill tissue. XOR activity in rainbow trout liver was
measurable with the endogenous purine xanthine, purine drug metabolites (1-
methylxanthine and 6-thioxanthine) and N-heterocyclic drugs (allopurinol and
pyrazinamide). Unlike mammalian XOR that can utilise both NAD+ and O2 as

II
electron acceptors, trout XOR was exclusively NAD+-dependent with no activity
being detected with O2.
Eadie-Hofstee plots were using to determine the Km and Vmax of rainbow trout
AOX and XOR with different substrates and it was found the Vmax of the rainbow
trout enzymes were generally lower and Km generally higher than mammalian
AOX and XOR.
Inhibitors of mammalian AOX were tested to determine if they could interact with
the piscine AOX. Environmental pollutants (17α-ethinyl estradiol and
phenanthridine), an endogenous steroid (estradiol) and drugs (chlorpromazine and
menadione) were found to be effective inhibitors and were classed as competitive,
non-competitive and uncompetitive respectively using Lineweaver-Burk plots. The
drug metabolite, oxipurinol, was a non-competitive inhibitor of rainbow trout XOR.
In order to further characterise trout AOX protein purification was carried out. In
contrast to mammalian AOX, the piscine enzyme was not thermotolerant at 55°C
nor was it inhibited by benzamidine, thus heat treatment and affinity
chromatography could not be used as a purification steps. Trout AOX was purified
210-fold using ammonium sulphate fractionation, together with ion exchange and
gel filtration chromatography. The native molecular mass of the piscine AOX was
295 kDa, which is similar to mammalian AOXs.
In conclusion this study yields new insight into groups of anthropogenic
environmental pollutants, drugs and vitamins that are substrates and inhibitors of an
ancestral vertebrate AOX. The toxicological relevance of these findings is
discussed.

III
ACKNOWLEDGEMENTS
No project such as can be carried out by only one individual. I would like to
express my thanks to God who is the source and origin of all knowledge.
I fell highly privileged to express my heartiest gratitude to the worthy and kind
supervisor, Dr Dougie Clarke for his dynamic supervision, constructive criticism
and affectionate behaviour throughout this study. His wide knowledge and logical
way of thinking has been of great value for me. And his intensive and creative
comments have helped me step by step throughout this project.
My sincere deepest gratitude to all my family for their support and encouragement
through this work, I would like to thank my colleagues at the school of Applied
Sciences who shared great research ideas during my time in Huddersfield
University.

IV
Table of Contents List of Tables: ...................................................................................................... VIII
List of Figures: ....................................................................................................... XI
List of Abbreviations: ................................................................................. XVII
1. Introduction. ........................................................................................................ 1
1.1. Molybdo-flavoenzyme structure ................................................................. 1
1.2. Molybdenum cofactor and the catalytic mechanism of molybdo-flavoenzymes 4
1.3. Substrate specificity of aldehyde oxidase and xanthine oxidoreductase ...........10
1.4. Molybdo-flavoenzymes inhibitors. .............................................................22
1.4.1. Aldehyde oxidase inhibitors ...................................................................22
1.4.2. Oxipurinol as a specific xanthine oxidoreductase inhibitor .........................26
1.5. Species variation in molybdo-flavoenzyme activity. .....................................29
1.5.1. Vertebrate molybdo-flavoenzymes ..........................................................30
1.5.2. Molybdo-flavoenzymes in fish ................................................................35
1.5.2.1. Aldehyde oxidase activity in fish liver ..................................................35
1.5.2.2. Extrahepatic aldehyde oxidase activity in fish ........................................39
1.5.2.3. Aldehyde oxidase as reductase activity in fish ........................................40
1.5.2.4. Xanthine oxidoreductase activity in fish ................................................41
1.5.2.5. Extrahepatic xanthine oxidoreductase activity in fish ..............................46
1.5.3. Molybdo-flavoenzymes as pollution monitoring in fish ..............................48
1.5.4. Genetic and structural properties of molybdo-flavoenzymes in fish. ............53
1.6. Purification of aldehyde oxidase and xanthine oxidoreductase enzymes. .........59
1.7. Aims of the project. .................................................................................65
2.0. Materials and methods. ......................................................................................67
2.1. In vitro analysis of molybdo-flavoenzyme activity. ......................................67
2.1.1. Preparation of cytosol. ...........................................................................67
2.1.2. Gel filtration of cytosol. .........................................................................68
2.2. Protein determination. ..............................................................................68
2.2.1. Bicinchoninic acid reagents. ...................................................................68
2.2.2. Bicinchoninic acid methodology. ............................................................69
2.3. Preparation of substrate stocks. ..................................................................69
2.4. Spectrophotometric determination of aldehyde oxidase activity. ....................70
2.5. Spectrophotometric determination of xanthine oxidoreductase activity. ..........71
2.6. Determination of specific activity from spectrophotometric data. ...................73
2.7. Determination of optimum conditions of molybdo-flavoenzymes. .................73

V
2.7.1. Determination of optimum pH of buffer. ..................................................73
2.7.2. Temperature dependence of AOX and XOR activities. ..............................73
2.7.3. Heat stability study. ...............................................................................74
2.8.Assay of molybdo-flavoenzyme activity using high pressure liquid
chromatography. ............................................................................................74
2.8.1. HPLC analysis of the in vitro metabolism of molybdo-flavoenzyme substrates.
....................................................................................................................80
2.9. Determination of Km and Vmax for molybdo-flavoenzymes. ...........................81
2.10. Determination of the mode of inhibition and inhibitor constant (Ki) .............82
2.11. Purification of aldehyde oxidase ..............................................................85
2.11.1. Chromatography instruments media and concentrators used .....................85
2.11.2. Buffers used in purification protocols. ...................................................85
2.11.3. Purification of AOX ............................................................................86
2.11.3.1. Preparation of cytosol. .......................................................................86
2.11.3.2. Heat treatment step. ..........................................................................86
2.11.3.3. Ammonium sulphate fractionation step. ...............................................86
2.11.3.4. Q-Sepharose anion exchange fast flow chromatography. .......................88
2.11.3.5. Affinity chromatography on benzamidine Sepharose 6B. .......................88
2.11.3.6. Chromatofocusing on Mono P HR 5/20. ..............................................89
2.11.3.7. Gel filtration chromatography. ...........................................................89
2.11.3.8. MonoQ chromatography. ...................................................................90
2.11.4. Sodium dodecyl sulphate polyacrylamide gel electrophoresis ...................90
2.11.4.1. Staining of SDS polyacrylamide gels ..................................................91
2.11.4.2. Determination of native molecular mass using Superose 6 chromatography.
....................................................................................................................92
2.12. Statistical analysis. .................................................................................93
2.12.1. Two tailed t-test ..................................................................................93
3. Results. ..............................................................................................................94
3.1. Quantification of molybdo-flavoenzyme activity .........................................94
3.1.1. Effect of pH on trout, rat and human molybdo-flavoenzymes activity. .........95
3.1.2. Effect of temperature on trout, rat and human molybdo-flavoenzymes activity.
....................................................................................................................97
3.1.3. Validation of the accuracy and precision of HPLC assays ........................ 100
3.2. Screening of molybdo-flavoenzyme activities. .......................................... 101
3.2.1. AOX activity with exogenous aldehydes in trout tissue and mammalian liver
cytosol. ....................................................................................................... 101

VI
3.2.2. HPLC analysis of AOX activity with endogenous vitamins and vitamin
metabolites. ................................................................................................. 105
3.2.3. Spectrophotometric and HPLC analysis of AOX activity with exogenous N-
heterocyclic compounds. ............................................................................... 108
3.2.3.1. Phenanthridine. ................................................................................ 108
3.2.3.2. Phthalazine. ..................................................................................... 111
3.2.3.3. Cinchonine. ..................................................................................... 112
3.2.3.4. Pyrazinamide. .................................................................................. 113
3.3. Spectrophotometric and HPLC analysis of molybdo-flavoenzyme activity with
endogenous purine and purine analogue substrates. .......................................... 118
3.3.1. Xanthine and 1-methylxanthine. ........................................................... 119
3.3.3. 6-mercaptopurine. ............................................................................... 136
3.3.4. Allopurinol. ........................................................................................ 145
3.4. Determination of the kinetic parameters for aldehyde oxidase and xanthine
oxidoreductase in trout, rat and human ........................................................... 148
3.4.1. Exogenous aldehydes as substrates for AOX .......................................... 148
3.4.2. Endogenous vitamin aldehydes as substrates for AOX ............................. 150
3.4.2.1. Vitamin B6 (pyridoxal) ..................................................................... 150
3.4.2.2. Vitamin A (all-trans retinal) ............................................................... 150
3.4.2.3. N1-methylnicotinamide ..................................................................... 151
3.4.3. Exogenous N-heterocycles as substrates for AOX ................................... 151
3.4.3.1. Phenanthridine ................................................................................. 151
3.4.3.2. Phthalazine ...................................................................................... 152
3.4.3.3. Cinchonine ...................................................................................... 152
3.4.4. Endogenous and exogenous purines and purine analogs as substrates for XOR
.................................................................................................................. 152
3.4.4.1. Xanthine. ......................................................................................... 153
3.4.4.2. 1-methylxanthine. ............................................................................. 153
3.4.4.3. Allopurinol ...................................................................................... 156
3.4.4.4. 6-mercaptopurine (6MP). .................................................................. 156
3.4.4.4. 6-thioxanthine. ................................................................................. 156
3.4.3.4. Pyrazinamide ................................................................................... 157
3.5. Comparison of menadione, benzamidine and oxipurinol as molybdo-
flavoenzyme inhibitors in different species. ..................................................... 157
3.5.1. Determination of Ki for molybdo-flavoenzyme inhibitors in trout liver cytosol.
.................................................................................................................. 161
3.6. Purification of aldehyde oxidase. ............................................................. 169

VII
3.6.1. Purification of AOX from Wistar rat liver. ............................................. 169
3.6.2. SDS PAGE analysis of Wistar rat AOX ................................................. 173
3.6.3. Purification of AOX from rainbow trout liver. ........................................ 174
3.6.4. Determination of the native molecular mass of rainbow trout liver AOX using
Superose 6 gel filtration chromatography. ....................................................... 179
3.6.5. SDS PAGE analysis of rainbow trout AOX. ........................................... 181
4. Discussion. ....................................................................................................... 183
4.1. Quantification of molybdo-flavoenzyme activities in trout, human and rat. ... 183
4.1.1. Exogenous aldehydes as substrates for AOX .......................................... 185
4.1.1.1. Vanillin and DMAC ......................................................................... 185
4.1.2. Endogenous vitamin aldehydes as substrates for AOX ............................. 187
4.1.2.1. Vitamin B6 pyridoxal ....................................................................... 187
4.1.2.2. Vitamin A all-trans retinal ................................................................. 188
4.1.2.3. N1-methylnicotinamide (NMN) .......................................................... 189
4.1.3. Exogenous N-heterocycles as substrates for AOX. .................................. 191
4.1.3.1. Phenanthridine. ................................................................................ 191
4.1.3.2. Phthalazine. ..................................................................................... 193
4.1.3.3. Cinchonine. ..................................................................................... 194
4.1.3.4. Pyrazinamide. .................................................................................. 195
4.1.4. Endogenous and exogenous purines and purine analogs as substrates for XOR
.................................................................................................................. 196
4.1.4.1. Xanthine. ......................................................................................... 196
4.1.4.2. 1-methylxanthine. ............................................................................. 199
4.1.4.3. Allopurinol ...................................................................................... 199
4.1.4.4. 6-mercaptopurine (6MP) ................................................................... 200
4.2. Determination of kinetic parameters for aldehyde oxidase and xanthine
oxidoreductase inhibitors for trout, rat and human. ........................................... 202
4.3. Purification of AOX from rainbow trout and Wistar rat liver cytosol. ........... 204
4.4. Conclusions. ......................................................................................... 207
4.5. Recommendations for future work. .......................................................... 210
5. References ........................................................................................................ 212
6.0. Appendices. ................................................................................................... 237
6.1. Appendix 1. .......................................................................................... 237
6.2. Appendix 2. .......................................................................................... 238
6.3. Appendix 3. .......................................................................................... 240

VIII
List of Tables:
Table 1: Examples of mammalian molybdo-flavoenzyme substrates .................... 11
Table 2: Aldehyde oxidase catalyzed reduction of different compounds in
mammals. ................................................................................................................. 21
Table 3: Xanthine oxidoreductase catalyzed reduction of different compounds in
mammals. ................................................................................................................. 22
Table 4: Summary of the effects of prototypical inhibitors on human aldehyde
oxidase. .................................................................................................................... 24
Table 5: Summary of the effect of aldehyde oxidase inhibitors with non-human
species. ..................................................................................................................... 25
Table 6: Summary of the effects of xanthine oxidoreductase inhibitors allopurinol
and oxipurinol withdifferentmammalian species. .................................................... 28
Table 7: Summary of molybdo-flavoenzymes in mice ........................................... 32
Table 8: Summary of aldehyde oxidase genes and tissue distribution in different
species ...................................................................................................................... 33
Table 9: Summary of xanthine oxidoreductase tissue distribution in different
species ...................................................................................................................... 34
Table 10.Summary of in vitro studies of hepatic aldehyde oxidase activity in fish
species. ..................................................................................................................... 36
Table 11: Summary of fish species that have no detectable hepatic AOX activity.39
Table 12: Summary of extrahepatic and hepatic AOX activity in fish species ...... 40
Table 13: In vitro studies of hepatic xanthine oxidoreductase activity in fish
species measured using spectrophotometry. ............................................................ 42
Table 14: Summary of fish species that had no detectable XOR activity. ............. 44
Table 15: Summary of in vitro studies of hepatic xanthine oxidoreductase activity
in fish species using electrophoresis and histochemical dye methods .................... 45
Table 16: Extrahepatic XOR activity in fish ........................................................... 47
Table 17: HepaticXOR activity as a biomarkers for pollution in fish. ................... 49
Table 18: Extrahepatic XOR activity as biomarkers for pollution in fish. ............. 50
IX
Table 19: Hepatic and extrahepatic AOX activity as a biomarkers for pollution in
fish. .......................................................................................................................... 52
Table 20: AOX and XOR genes in fish, amphibians, reptiles, birds and mammals
................................................................................................................................. 58
Table 21: Summary of purification protocols for aldehyde oxidase from rodent
species. ..................................................................................................................... 60
Table 22: Summary of purification protocols for aldehyde oxidase from non-rodent
species. ..................................................................................................................... 61
Table 23: Summary of xanthine oxidoreductase purification from different species.
................................................................................................................................. 62
Table 24. Preparation of protein calibration standards. .......................................... 69
Table 25: List of stock substrates, products and solvent used to prepare them. ..... 70
Table 26: Wavelength and molar absorption coefficients used for the
spectrophotometric measurement of aldehyde oxidase activity .............................. 71
Table 27: Summary of xanthine oxidoreductase assay setup. ................................ 72
Table 28: Isocratic HPLC protocols for the measurement of MFE activity ........... 77
Table 29: Gradient HPLC protocols for the measurement of MFE activity ........... 78
Table 30: HPLC program for the separation of allopurinol, N1-methylnicotinamide
and their metabolites ................................................................................................ 79
Table 31:HPLC program for the separation of 6-mercaptopurine, 1-
methylxanthine, xanthine, phthalazine, pyrazinamide and their metabolites .......... 79
Table 32:HPLC program for the separation of N1-methylnicotinamide and its
metabolites on a polar cyan column ........................................................................ 79
Table 33:HPLC program for the separation of phenanthridine and 6(5H)
phenanthridone ........................................................................................................ 79
Table 34: Summary of AOX and XOR inhibitors assays ....................................... 83
Table 35: SDS-polyacrylamide gel electrophoresis reagents (SDS- PAGE) ......... 90
Table 36: Summary of Coomassie Blue and Silver stains used for protein
visualisation of SDS-PAGE. .................................................................................... 91
X
Table 37: Summary of gel filtration standards used for native molecular mass
determination ........................................................................................................... 92
Table 38: Summary of in vitro studies of hepatic aldehyde oxidase activity in
different species using HPLC and spectrophotometric assays with different
substrates ................................................................................................................ 118
Table 39: Kinetic constants for trout, rat and human liver AOX substrates in
spectrophotometric and HPLC assays ................................................................... 149
Table 40: Kinetic constants for trout, rat and human liver XOR substrates in
spectrophotometric and HPLC assays ................................................................... 155
Table 41: Summary of inhibition constant (Ki) and mode of inhibition of different
inhibitors with trout AOX and XDH. .................................................................... 168
Table 42: Summary of Wistar rat AOX purification. ........................................... 172
Table 43: Summary of rainbow trout AOX purification. ..................................... 178
Table 44: Elution volume and relative molecular mass of the proteins standards on
Superose 6 16/70 gel filtration chromatography ................................................... 179

XI
List of Figures:
Figure 1: The domain structure of the AOX and XDH enzyme family. .................. 3
Figure 2: Molybdenum Cofactor structure in molybdenum enzymes. ..................... 4
Figure 3: The movement of electron flow out from the molybdenum center of
molybdo-flavoenzymes. ............................................................................................. 5
Figure 4: Oxidative and reduction half reaction and electron flow out from the
molybdenum center of molybdo-flavoenzymes. ....................................................... 7
Figure 5: Postulated linear electron transfer sequence and site of electron egress to
acceptors .................................................................................................................... 8
Figure 6: Oxidation reaction by molybdo-flavoenzymes AOX and XOR. .............. 9
Figure 7: Oxygen atom transfer reaction molybdo-flavoenzyme involving an
aldehyde. .................................................................................................................... 9
Figure 8: Oxygen atom transfer reaction molybdo-flavoenzyme involving an N-
heterocycle ............................................................................................................... 10
Figure 9: Role of xanthine oxidoreductase in endogenous purine catabolism in
mammals. ................................................................................................................. 13
Figure 10: The role of xanthine oxidoreductase in caffeine metabolism ............... 14
Figure 11: Biotransformation of all-trans retinal to retinoic acid by aldehyde
oxidase ..................................................................................................................... 15
Figure 12: Oxidation of pyridoxal to 4-pyridoxic acid by aldehyde oxidase ......... 16
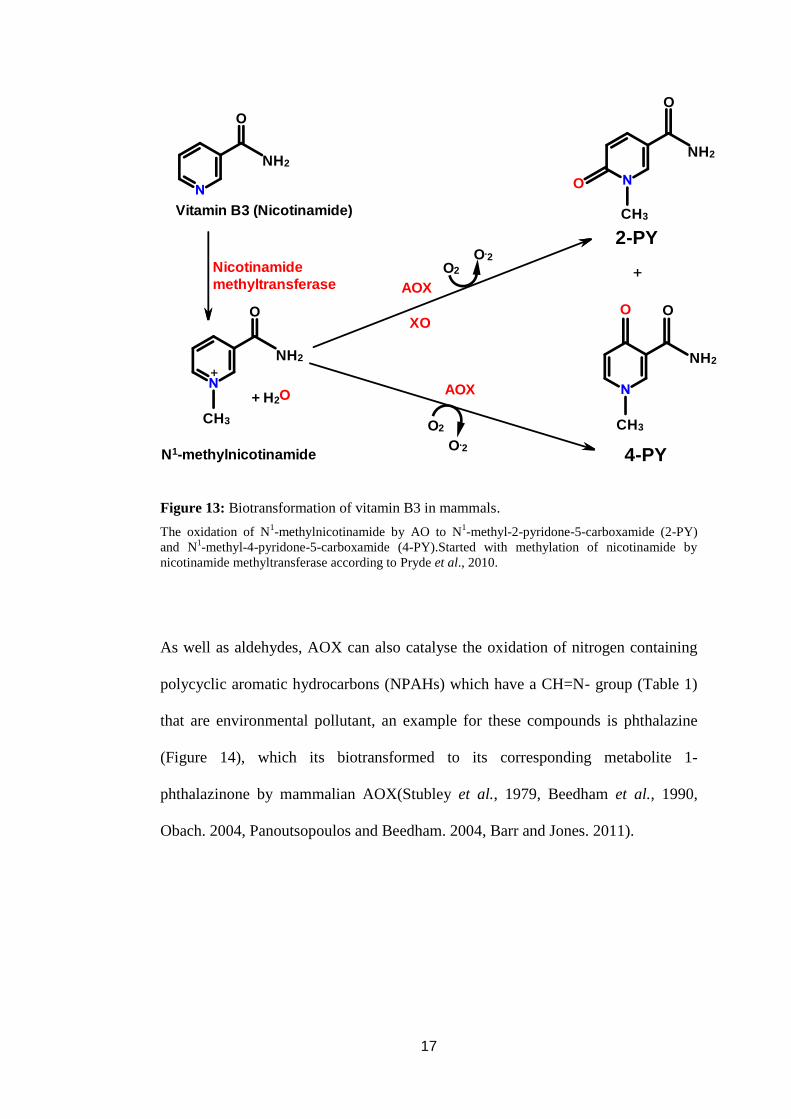
Figure 13: Biotransformation of vitamin B3 in mammals. .................................... 17
Figure 14: Oxidation of phthalazine by aldehyde oxidase to 1-phthalazinone ...... 18
Figure 15: Biotransformation of phenanthridine to its metabolite phenanthridinone
by AOX .................................................................................................................... 18
Figure 16: Metabolism of methotrexate to its corresponding metabolite 7-
hydroxymethotrexate by AOX. ............................................................................... 19
Figure 17: Biotransformation of 6-mercaptopurineby AOX and XOR. ................. 20
Figure 18: Structures of the aldehyde oxidase inhibitors. ...................................... 23
XII
Figure 19: Generation of the xanthine oxidoreductase inhibitor oxipurinol from
allopurinol. ............................................................................................................... 27
Figure 20: Summary of AOX and XDH genes in fish ........................................... 55
Figure 21: Proposed evolution of AOX and XDH genes in fish. ........................... 56
Figure 22: Summary of evolution of AOX and XDH genes in fishes, amphibians,
reptiles, birds and mammals. ................................................................................... 57
Figure 23: Eadie- Hofstee plot. ............................................................................... 81
Figure 24: Lineweaver-Burk plots with different types of inhibitors. .................... 84
Figure 25: AOX purification protocols. ................................................................. 87
Figure 26: Effect of pH on of trout, human and rat AOX activity. ........................ 95
Figure 27: Effect of the pH on of trout, human and rat XOR activity. ................... 96
Figure 28: Effect of the assay incubation temperature on of trout, human and rat
AOX activity. ........................................................................................................... 97
Figure 29: Effect of the assay incubation temperature on of trout, human and rat
XOR activity. ........................................................................................................... 99
Figure 30: Spectrophotometric assays of aldehyde oxidase activities using rainbow
trout, Wistar rat and human liver cytosol at 37˚C with AOX substrate DMAC ... 102
Figure 31: Spectrophotometric assays of aldehyde oxidase activities using rainbow
trout, Wistar rat and human liver cytosol at 37˚C with AOX substrate vanillin. .. 102
Figure 32: HPLC analysis of the in vitro biotransformation of vanillin by rainbow
trout cytosol. .......................................................................................................... 103
Figure 33: HPLC analysis of the in vitro biotransformation of vanillin by liver
cytosol. ................................................................................................................... 104
Figure 34: HPLC analysis of the in vitro biotransformation of endogenous
compound pyridoxal by liver cytosol from different species. ............................... 105
Figure 35: HPLC analysis of the in vitro biotransformation of endogenous
compound all-trans retinal by liver cytosol from different species. ...................... 106
Figure 36: HPLC analysis of the in vitro biotransformation of N1-
methylnicotinamide by liver cytosol from different species. ................................ 107

XIII
Figure 37: Spectrophotometric assays of aldehyde oxidase activities using rainbow
trout, Wistar rat and human liver cytosol at 37˚C with AOX substrate
phenanthridine. ...................................................................................................... 108
Figure 38: HPLC analysis of the in vitro biotransformation of phenanthridine by
trout cytosol. .......................................................................................................... 109
Figure 39: HPLC analysis of the in vitro biotransformation of phenanthridine by
rainbow trout, Wistar rat, and human liver cytosol. .............................................. 110
Figure 40: HPLC analysis of the in vitro biotransformation of phthalazine by
rainbow trout, Wistar rat and human liver cytosol ................................................ 111
Figure 41: HPLC analysis of the in vitro biotransformation of cinchonine to 2-
cinchoninone by rainbow trout, Wistar rat and human liver cytosol ..................... 112
Figure 42: HPLC analysis of the in vitro biotransformation of pyrazinamide by
rainbow trout liver cytosol at 37˚C. ....................................................................... 114
Figure 43: HPLC analysis of the in vitro biotransformation of pyrazinamide by
Wistar rat and human liver cytosol at 37°C. Incubation with O2 as an electron
acceptor. ................................................................................................................. 115
Figure 44: HPLC analysis of the in vitro biotransformation of pyrazinamide by
Wistar rat and human liver cytosol at 37°C.Incubation with NAD +as an electron
acceptor. ................................................................................................................. 116
Figure 45: Spectrophotometric assays of xanthine oxidoreductase activities using
rainbow trout, Wistar rat and human liver cytosol at 37˚C with XOR substrates. 120
Figure 46: HPLC analysis of the in vitro biotransformation of xanthine + NAD+
by
rainbow trout cytosol ............................................................................................. 121
Figure 47: HPLC analysis of the in vitro biotransformation of 1-methylxanthine +
NAD+
by rainbow trout cytosol ............................................................................. 122
Figure 48: HPLC analysis of the in vitro biotransformation of xanthine by rainbow
trout liver cytosol. .................................................................................................. 123
Figure 49: HPLC analysis of the in vitro biotransformation of 1-methylxanthine by
rainbow trout liver cytosol at 37ºC ........................................................................ 124
Figure 50: HPLC analysis of the in vitro biotransformation of xanthine by Wistar
rat liver cytosol. ..................................................................................................... 125
Figure 51: HPLC analysis of the in vitro biotransformation of 1-methylxanthine by
Wistar rat liver cytosol at 370C .............................................................................. 126

XIV
Figure 52: HPLC analysis of the in vitro biotransformation of xanthine by human
liver cytosol ........................................................................................................... 127
Figure 53: HPLC analysis of the in vitro biotransformation of 1-methylxanthine to
1-methyluric acid by human liver cytosol at 370C ................................................ 128
Figure 54: HPLC analysis of the in vitro biotransformation of xanthine by rainbow
trout liver cytosol with and without enzyme inhibitors ......................................... 130
Figure 55: HPLC analysis of the in vitro biotransformation of 1-methylxanthine by
rainbow trout liver cytosol with and without xanthine oxidoreductase and aldehyde
oxidase inhibitors ................................................................................................... 131
Figure 56: HPLC analysis of the in vitro biotransformation of xanthine by Wistar
rat liver cytosol with and without enzyme inhibitors ............................................ 132
Figure 57: HPLC analysis of the in vitro biotransformation of 1-methylxanthine by
Wistar rat liver cytosol with and without enzyme inhibitors ................................. 133
Figure 58: HPLC analysis of the in vitro biotransformation of xanthine by human
liver cytosol with and without enzyme inhibitors .................................................. 134
Figure 59: HPLC analysis of the in vitro biotransformation of 1-methylxanthine by
human liver cytosol with and without enzyme inhibitors ...................................... 135
Figure 60: HPLC analysis of the in vitro biotransformation of 6-mercaptopurine by
rabbit liver cytosol ................................................................................................. 137
Figure 61: HPLC analysis of analytes produced following the in vitro incubation of
6-mercaptopurine with rainbow trout liver cytosol at 37°C .................................. 138
Figure 62: HPLC analysis of analytes produced following the in vitro incubation of
6-mercaptopurine with Wistar rat liver cytosol at 37°C ........................................ 139
Figure 63: HPLC analysis of the in vitro biotransformation of 6-mercaptopurine by
human liver cytosol. ............................................................................................... 140
Figure 64: HPLC analysis of the in vitro biotransformation of 6-mercaptopurine by
Wistar rat liver cytosol with and without enzyme inhibitors ................................. 141
Figure 65: HPLC analysis of the in vitro biotransformation of 6-mercaptopurine by
human liver cytosol with and without enzyme inhibitors ...................................... 142
Figure 66: HPLC analysis of the in vitro biotransformation of 6-thioxanthine by
rainbow trout liver cytosol at 37°C ........................................................................ 143
XV
Figure 67: HPLC analysis of the in vitro biotransformation of 6-thioxanthine by
rainbow trout liver cytosol with and without enzyme inhibitors. .......................... 144
Figure 68: HPLC analysis of the in vitro biotransformation of allopurinol to
oxipurinol by Wistar rat liver cytosol at 37°C ....................................................... 145
Figure 69: HPLC analysis of the in vitro biotransformation of allopurinol by
human liver cytosol at 37°C .................................................................................. 146
Figure 70: HPLC analysis of the in vitro biotransformation of allopurinol by
rainbow trout liver cytosol at 37°C ........................................................................ 147
Figure 71: Inhibition of trout, human and rat aldehyde oxidase by menadione and
benzamidine. .......................................................................................................... 159
Figure 72: Inhibition of trout, human and rat xanthine oxidoreductase by
oxipurinol at pH 7.4. .............................................................................................. 160
Figure 73: Saturation kinetics plot for menadione inhibition with DMAC as an
AOX substrate in trout liver cytosol. ..................................................................... 162
Figure 74: Lineweaver-Burk plot for menadione inhibition with DMAC as an
AOX substrate in trout liver cytosol. ..................................................................... 162
Figure 75: Saturation kinetics plot for estradiol inhibition with DMAC as an AOX
substrate in trout liver cytosol. ............................................................................... 163
Figure 76: Lineweaver-Burk plot for estradiol inhibition with DMAC as an AOX
substrate in trout liver cytosol. ............................................................................... 163
Figure 77: Saturation kinetics plot for 17α-ethinyl estradiol inhibition with DMAC
as an AOX substrate in trout liver cytosol. ............................................................ 164
Figure 78: Lineweaver-Burk plot for 17α-ethinyl estradiol inhibition with DMAC
as an AOX substrate in trout liver cytosol. ............................................................ 164
Figure 79: Saturation kinetics plot for chlorpromazine inhibition with DMAC as an
AOX substrate in trout liver cytosol. ..................................................................... 165
Figure 80: Lineweaver-Burk plot for chlorpromazine inhibition with DMAC as an
AOX substrate in trout liver cytosol. ..................................................................... 165
Figure 81: Saturation kinetics plot for phenanthridine inhibition with DMAC as an
AOX substrate in trout liver cytosol. ..................................................................... 166
Figure 82: Lineweaver-Burk plot for phenanthridine inhibition with DMAC as an
AOX substrate in trout liver cytosol. ..................................................................... 166
XVI
Figure 83: Saturation kinetics plot for oxipurinol inhibition with xanthine as an
XOR substrate in trout liver cytosol. ..................................................................... 167
Figure 84: Lineweaver-Burk plot for oxipurinol inhibition with xanthine as an
XOR substrate in trout liver cytosol. ..................................................................... 167
Figure 85: Chromatography of heat treated ammonium sulphate fractionated rat
liver cytosol on a Q-sepharose column at pH 8.0 .................................................. 170
Figure 86: Mono-Q 5/10 anion exchange chromatography column of pooled
fractions from affinity chromatography step ......................................................... 171
Figure 87: SDS PAGE of purified hepatic AOX from Wistar rat liver. ............... 173
Figure 88: Thermal stability of rainbow trout, human and rat liver AOX activity at
55°C. ...................................................................................................................... 174
Figure 89: Chromatography of ammonium sulphate fractionated trout liver cytosol
on a Q-sepharose column at pH 8.6 ....................................................................... 175
Figure 90: Superose 6 16/70 gel filtration chromatography column of pooled active
fractions from Q-sepharose chromatography step ................................................. 176
Figure 91: Mono-Q 5/10 anion exchange chromatography column of pooled active
fractions from gel filtration chromatography step ................................................. 177
Figure 92: Calibration curve for determination of molecular mass of AOX by gel
filtration chromatography. ..................................................................................... 179
Figure 93: SDS PAGE of purified hepatic AOX from rainbow trout liver. ......... 181
XVII
List of Abbreviations:
Abbreviation: Definition:
2-PY: N1-methyl-2-pyridone-5-carboxamide
4-PY: N1-methyl-4-pyridone-3-carboxamide
6-MP: 6-mercaptopurine
ADP: Adenosine diphosphate
AhR: Aryl hydrocarbon receptors
ALDH: Aldehyde dehydrogenase
AMP: Adenosine monophosphate
AOX: Aldehyde oxidase
AOH1: Aldehyde oxidase homologue 1
ATP: Adenosine triphosphate
ATR: All-trans retinal (vitamin A)
BSA: Bovine serum albumin
CV: Coefficient of variation
CYP: Cytochrome P450
DAD: Diode array detector
DMAC: Dimethylaminocinnamaldehyde
DCPIP: 2, 6-dichlorophenol-indophenol
EBT: Erochrome black T
FAD: Flavin adenine dinucleotide
GMP: Guanosine monophosphate
IMP: Inosine monophosphate
HPLC: High performance liquid chromatography
H2O2: Hydrogen peroxide
kDa: kilo Dalton
Km: Michaelis constant
LOD: Limit of detection
XVIII
Abbreviation: Definition:
LOQ: Lower limit of Quantification
MFEs: Molybdo-flavoenzymes
MoCo: Molybdenum cofactor
MTT: Dimethylthiazol-diphenyl tetrazolium bromide
MB: Methylene blue
mM: Millimolar
NMN: N1-methylnicotinamide
NAD+: Nicotinamide adenine dinucleotide
INT: Iodonitro-tetrazolium
NPAHs: Nitrogen containing polycyclic aromatic hydrocarbons
NBT: Nitro blue tetrazolium
NADH: Nicotinamide adenine dinucleotide (reduced form)
PMS: Phenazine methosulphate
PAOX: Pseudogene aldehyde oxidase
PBS: Phosphate buffer saline
PCR: Polymerase chain reaction
RSD: Relative standard deviation
TTC: Tetrazolium chloride
TAN: Total ammonia nitrogen
XDH: Xanthine dehydrogenase
XO: Xanthine oxidase.
XOR: Xanthine oxidoreductase

1
1. Introduction.
The term used to describe the chemical substances which are foreign to animal life
is xenobiotics. These chemical substances include drugs,cosmetics,food additives,
environmental pollutants, pesticides, flavouring fragrances and industrial
chemicals(Idle and Gonzalez. 2007).Many of these chemical substances access our
bodies by the diet, atmosphere, drinking water and drug administration. These
substances go through a broad varieties of processes of detoxication of which
generally generate compounds that are much less toxic, much more polar, and also
quickly excretable (Timbrell. 2009). Of these processes oxidation has an important
purpose in the metabolism of such xenobiotics. The microsomal cytochrome P-450
mono-oxygenase plays an important role in this biotransformation process;
however the cytosolic enzymes are also involved in this biotransformation process.
This thesis is concerned with two cytosolic molybdo-flavoenzymes (MFEs),
namely aldehyde oxidase (AOX; EC 1. 2. 3. 1) and xanthine oxidoreductase (XOR;
EC 1. 2. 3. 2). In mammals the second of these enzymes, XOR, exists as two forms
xanthine dehydrogenase (XDH; EC 1. 17. 1. 4) and xanthine oxidase (XO; EC 1.
17. 3. 2) that are derived from a single gene and both have identical primary amino
acid sequence. The native dehydrogenase form that uses NAD+ as an electron
acceptor can be converted to the XO form that uses O2 as an electron acceptor by
cysteine oxidation or limited proteolysis (Nishino and Nishino. 1997, Nishino et al.,
2008). The change from the XDH to the XO form is associated with a
conformational change in protein structure that prevents the bulky NAD+
from
entering the electron acceptor binding site while the smaller oxygen can enter this
site (Nishino and Nishino. 1997, Nishino et al., 2008). The conversion of XDH to
XO has only been demonstrated in mammalian species that have specific cysteines

2
(e.g in rats XDH has cysteine 535 and cysteine 992) and lysines (e.g in rats XDH
has lysine 754 and lysine 771) that are the site of proteolytic cleavage. The
conversion of XDH to XO in vivo that result in the enzyme using molecular oxygen
as electron acceptor results in oxygen free radicals being generated which have
been shown to be responsible for protein damage, DNA mutation and cell
membrane disintegration linked with many diseases such as cancer, liver damage
and cardiovascular disease (Nishinaka et al., 2001). These enzymes are present in
almost all organisms from bacteria to human (Beedham. 2001, Garattini et al.,
2008, Garattini et al., 2009, Pryde et al., 2010, Garattini and Terao. 2011, Garattini
and Terao. 2012, Hartmann et al., 2012, Kurzawski et al., 2012, Garattini and
Terao. 2013).
1.1. Molybdo-flavoenzyme structure
Both MFEs enzymes, AOX and XOR, are composed of molybdenum cofactor
(MoCo), one flavin adenine dinucleotide (FAD) and a pair of non-identical metal
sulfur centers [2Fe-2S] (Palmer et al., 1969, Nishino. 1994, Borges et al., 2002,
Nishino et al., 2002, Garattini et al., 2008, Pryde et al., 2010, Garattini and Terao.
2011, Garattini and Terao. 2012, Garattini and Terao. 2013). Molybdo-
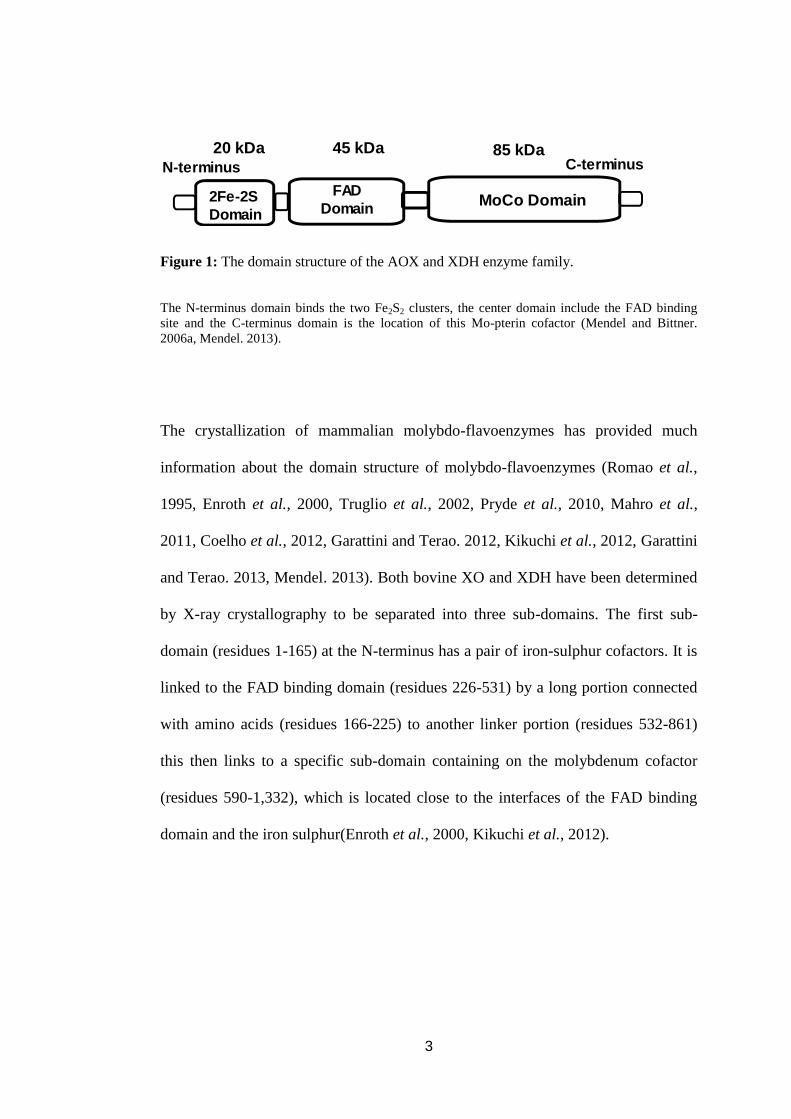
flavoenzymes are homodimers as active forms and are composed from a pair of
identical subunits of approximately 150 kDa (Figure 1). Their structure is split into
three distinct domains as follows: an 85 kDa C-terminal domain that include Moco
along with the substrate binding site, and an N-terminus that includes a 20 kDa
domains with a couple of [2Fe-2S] clusters, and a 45 kDa flavin adenine
dinucleotide (FAD) joining domain (Kisker. 1997, Hille. 2005, Mendel and Bittner.
2006a, Wollers. 2008, Garattini and Terao. 2012, Garattini and Terao. 2013,
Mendel. 2013).
3
2Fe-2S
Domain
N-terminus C-terminus20 kDa 45 kDa 85 kDa
FAD
DomainMoCo Domain
Figure 1: The domain structure of the AOX and XDH enzyme family.
The N-terminus domain binds the two Fe2S2 clusters, the center domain include the FAD binding
site and the C-terminus domain is the location of this Mo-pterin cofactor (Mendel and Bittner.
2006a, Mendel. 2013).
The crystallization of mammalian molybdo-flavoenzymes has provided much
information about the domain structure of molybdo-flavoenzymes (Romao et al.,
1995, Enroth et al., 2000, Truglio et al., 2002, Pryde et al., 2010, Mahro et al.,
2011, Coelho et al., 2012, Garattini and Terao. 2012, Kikuchi et al., 2012, Garattini
and Terao. 2013, Mendel. 2013). Both bovine XO and XDH have been determined
by X-ray crystallography to be separated into three sub-domains. The first sub-
domain (residues 1-165) at the N-terminus has a pair of iron-sulphur cofactors. It is
linked to the FAD binding domain (residues 226-531) by a long portion connected
with amino acids (residues 166-225) to another linker portion (residues 532-861)
this then links to a specific sub-domain containing on the molybdenum cofactor
(residues 590-1,332), which is located close to the interfaces of the FAD binding
domain and the iron sulphur(Enroth et al., 2000, Kikuchi et al., 2012).

4
1.2. Molybdenum cofactor and the catalytic mechanism of
molybdo-flavoenzymes
Molybdenum itself is biologically inactive unless bound to a tricyclic pterin
compound where it then forms molybdenum cofactor (Moco) (Figure 2). Moco is
situated at the active site of AOX and XOR(Mendel and Bittner. 2006b). The pterin
structure coordinates to the molybdenum metal by an enedithiolate side chain
(Hille. 2005). The molybdo-flavo enzymes, AOX and XOR, contain an active site
that is believed to be in a five-coordinate complex with two enedithiolate ligands of
the molybdopterin cofactor, one oxo group, one sulfide group, and one hydroxyl or
water molecule. This coordination results in a square pyramidal geometric structure
and is the site for substrate binding and enzyme inhibition (Brondino et al., 2005 ).
Mo
H
H
H
HH2N-
OH
Figure 2: Molybdenum Cofactor structure in molybdenum enzymes.
The active site structure is attached with the pyranopterin compound through two enedithiolate side
chains (green colour) to produce the molybdenum cofactor. Based on Mendel, 2013.

5
The molybdenum cofactor’s purpose is to transfer electrons out of the molybdenum
center following the oxidation reaction has taken place. This results in the reduction
of molybdenum from Mo (VI) to Mo (IV) (Hille. 2005, Okamoto et al., 2013). The
movement of electron flow in MFEs is shown in (Figure 3), in which the Fe/S I and
Fe/S II are a pair of iron-sulfur center.
Mo-pterin Fe/SIIFe/SI FAD
Electron movement
Figure 3: The movement of electron flow out from the molybdenum center of molybdo-
flavoenzymes. According to Okamoto et al., 2013.
The molybdo-flavoenzymes AOX and XOR exhibit two types of reactions at the
same time involving the molybdenum cofactor, oxidative and reductive half
reactions. The oxidative half reaction at the molybdenum site, and the reduction
half reaction at the FAD site are shown in (Figure 4) (Calzei et al., 1995, Hille and
Nishino. 1995, Nishino and Okamoto. 2000, Okamoto et al., 2004, Hille. 2005,
Brondino et al., 2006, Kitamura et al., 2006, Pryde et al., 2010, Okamoto et al.,
2013). Electron donors such as vanillin act at molybdenum site, reducing it from
Mo (VI) to the Mo (IV) state. The reducing equivalents transfer directly to the FAD
site or via the iron-sulfur center as shown in (Figure 5)(Calzei et al., 1995, Hille
and Nishino. 1995, Beedham. 1998, Kitamura et al., 2006, Beedham. 2010).
The reduction half reaction takes place at the FAD site, and the enzyme is
reoxidized by interaction with oxygen in case of AOX and XO or with NAD+ in
case of XDH, and FADH2 is reduced into FAD. The reduction of oxygen leads to
formation of superoxide anion and hydrogen peroxide, and these two products
6
damage the cell, but the cell itself has an enzyme to protect from this attack; for
superoxide anion the enzyme superoxide dismutase and for hydrogen peroxide the
enzyme hydrogen peroxidase (Kelley et al., 2010). XDH displays partial oxidase
activity under conditions in which NAD+ levels are diminished, such as the
ischemic/hypoxic microenvironment encountered in vascular inflammation (Harris
and Massey. 1997). This same inflammatory milieu leads to enhanced XO levels
and thus increased XO-derived ROS formation, resulting in activation of
redoxdependent cell signaling reactions and alterations in vascular function, and
reduction of NAD+
leads to formation of NADH and H+. In the presence of an
alternative electron donor, MFEs can mediate the reduction of various compounds
such as in my example, it reduced the fenthion sulfoxide to its reduced form
fenthion as shown in (Figure 4) (Kitamura et al., 2003, Okamoto et al., 2004, Hille.
2005, Kitamura et al., 2006, Beedham. 2010, Pryde et al., 2010). These enzymes
can be alternately reduced by the substrate after which re-oxidised by their
individual electron acceptors at the FAD site. In vitro, potassium ferricyanide and
2, 6-dichloroindophenol (DCIP) have proven to be effective unnatural electron
acceptors for these enzymes that it can be reduced at FAD site (Figure 4)
(Krenitsky et al., 1972, Beedham. 1985, Slef and Stadtman. 2000, Kitamura et al.,
2006).

7
O2.--
Vanillin
fenthion fenthion sulfoxide
Vanillic acid
CH3
CH3
H
H
CH3
H
CH3
H3CO
CH3CH3
H3CO
H3COH3CO
Reduction
half reaction
Reduced Mo(IV) cofactorOxidized Mo(VI) cofactor
FADH2FAD
O2
NAD+
H2O2
NADH+H+
Mo(V)
for AO and XO
for XDH
Oxidative
half reaction
+2e-
+H2
-2H+
+2H+
intra enzymatic
electron transfer
Figure 4: Oxidative and reduction half reaction and electron flow out from the
molybdenum center of molybdo-flavoenzymes.
According to (Hille and Nishino. 1995, Nishino and Okamoto. 2000, Okamoto et al., 2004,
Beedham. 2010, Okamoto et al., 2013).

8
The mechanism of AOX and XOR inhibitors was proposed by Fridovich and
Handler. (1962), Rajagopalan and Handler ( 1962, 1964 and 1968) and Beedham
C (1987) that suggest 4 electrons carriers in molybdenum center of rabbit hepatic
AOX and XOR are responsible for the mechanism and reaction with artificial
electron acceptors. These studies demonstrated that ferricyanide, methylene blue,
phenazine methosulphate react at the iron sulphur cluster and 2, 6 dichlorophenol-
indophenol (DCPIP) at near to the molybdenum cofactor and that dyes nitroblue
tetrazolium (NBT), trinitrobenzensulfonic acid and dimethylthiazol-
diphenyltetrazolium bromide (MTT) react at the FAD site. Cytochrome c and with
oxygen in addition to NAD+
also react at the FAD center as in seen (Figure 5)
(Fridovich and Handler. 1962, Rajagopalan et al., 1962, Rajagopalan and Handler.
1964a, Rajagopalan et al., 1968, Beedham. 1987).
Figure 5: Postulated linear electron transfer sequence and site of electron egress to
acceptors. Red colour indicates artificial electron acceptor and blue colour indicates natural
acceptors.

9
In molybdo-flavoenzymes reactions the oxygen atom used in the hydroxylation
reaction of the carbon center of substrates containing N-heterocycle or aldehyde
functional groups is derived from water molecule rather than that from oxygen (O2)
itself as shown in (Figure 6) (Hille. 2005).
AOX
XORR- H + 2H+ + 2e-R- H + H2
Substrate Water
Molecule
Oxidized
Substrate
Protons Reducing
Equivalents
Figure 6: Oxidation reaction by molybdo-flavoenzymes AOX and XOR.
Oxidation reaction catalyzed by molybdo-flavoenzymes AOX and XOR generating an oxidized
substrate and also two reducing equivalents (Hille and Sprecher. 1987, Xia et al., 1999, Beedham.
2001, Hille. 2005, Brondino et al., 2006, Okamoto et al., 2013).
An example of an aldehyde substrate (vanillin) and its corresponding metabolite a
carboxylic acid (vanillic acid) is shown in Figure 7, while another example for an
N-heterocycle (1-methylxanthine) and its corresponding metabolite a uric acid (1-
methyluric acid) is shown in Figure 8.
Vanillic acidVanillin
H
H
H
H
CH3 CH3
OAOX
H2 2H+ 2e-
Water
Molecule
Protons Reducing
Equivalents
Figure 7: Oxygen atom transfer reaction molybdo-flavoenzyme involving an aldehyde.
The oxygen incorporated into the vanillic acid is from a water molecule. According to (Obach.
2004, Arnaud. 2011).

10
CH3CH3
HH
H
1-methylxanthine
O
HH
XO
1-methyluric acid
H2 2H+ 2e-
Figure 8: Oxygen atom transfer reaction molybdo-flavoenzyme involving an N-
heterocycle
The oxygen incorporated into the 1-methyluric acid is from a water molecule. According to (Obach.
2004, Arnaud. 2011).
1.3. Substrate specificity of aldehyde oxidase and xanthine
oxidoreductase
Many different aliphatic compounds such as aromatic aldehydes and also N-
heterocyclic compounds are substrates for AOX and XOR that are biotransformed
to their carboxylic acid or hydroxylated N-heterocyclic metabolites (Beedham.
2001, Garattini et al., 2003, Garattini et al., 2008, Garattini and Terao. 2011,
Garattini and Terao. 2012, Garattini and Terao. 2013). Although the class of
substrates of MFEs are similar in their structure, AOX and XOR differ in inhibitor
response as well as substrate specificity (Krenitsky et al., 1986, Beedham. 2001,
Kitamura et al., 2006, Mendel and Bittner. 2006a, Kundu et al., 2007, Beedham.
2010, Pryde et al., 2010, Garattini and Terao. 2012, Garattini and Terao. 2013). A
list of AOX and XOR substrates that illustrate the substrate specificity of the two
enzymes are given in Table 1, many of which were utilised in the study detailed in
this thesis.

11
Table 1: Examples of mammalian molybdo-flavoenzyme substrates
Substrates AOX XOR References
Allopurinol
(hyperuricemia drug) ++ +++++
(Krenitsky et al., 1972, Krenitsky et al.,
1986, Reiter et al., 1990, Yamamoto et al.,
1991, Beedham. 2001, Garattini and Terao.
2011, Garattini and Terao. 2012, Garattini
and Terao. 2013)
Azaarenes
(phenanthridine,
phthalazine**
, acridine,
quinoline, isoquinoline, 1-
hydroxyisoquinoline, 3-
hydroxyisoquinoline,
quinoxaline, quinazoline and
cinnoline)
Environmental pollutants
+++++ -
++**
(Sorouraddin et al., 2009, Garattini and
Terao. 2011, Garattini and Terao. 2012,
Rashidi et al., 2013), (Beedham et al., 1990,
Obach. 2004, Panoutsopoulos and Beedham.
2004, Kitamura et al., 2006, Barr and Jones.
2011, Garattini and Terao. 2011, Garattini
and Terao. 2012, Garattini and Terao. 2013)
Cinchona alkaloid
(cinchonine, cinchonidine,
quinine and quinidine)
Drugs and environmental
pollutants
+++++ -
(Palmer et al., 1969, Beedham et al., 1992,
Itoh et al., 2006, Al-Tayib. 2009, Liu et al.,
2009)
Hypoxanthine
( endogenous purine) - +++++
(Krenitsky et al., 1972, Kitamura et al.,
2006, Chen et al., 2012, Pasalic et al., 2012,
Okamoto et al., 2013)
6-Mercaptopurine
(anti-cancer drug) ++ +++++
(Kitamura et al., 2006, Rashidi et al., 2007,
Garattini and Terao. 2011, Sorouraddin et
al., 2011, Garattini and Terao. 2012)
Methotrexate
(anti-cancer drug) +++++ -
(Johns. 1967, Beedham. 1985, Chladek et
al., 1997, Jordan et al., 1999, Kitamura et
al., 1999, Beedham. 2001, Kitamura et al.,
2006, Liu et al., 2009)
1-Methylxanthine
(caffeine metabolite) - +++++
(Krenitsky et al., 1972, Reinke et al., 1987,
Arnaud. 2011)
N1-Methylnicotinamide
(endogenous vitamin
metabolite)
+++++ +
(Murashige et al., 1966, Krenitsky et al.,
1972, Ohkubo and Fujimura. 1978,
Kitamura et al., 2006, Tayama et al., 2007,
Kitamura et al., 2008, Peretz et al., 2012)
Pyrazinamide
(tuberculosis drug) ++ +++++
(Yamamoto et al., 1987, Yamamoto et al.,
1991, Shibutani et al., 1999, Kitamura et al.,
2006)
Pyridoxal
(vitamin B6) +++++ -
(Stanulovic and Chaykin. 1971, Krenitsky et
al., 1972, Kitamura et al., 2006, Garattini
and Terao. 2011, Garattini and Terao. 2012,
Peretz et al., 2012, Garattini and Terao.
2013)
All-trans retinal
(vitamin A aldehyde) +++++ -
(Kitamura et al., 2006, Garattini et al., 2008,
Terao et al., 2009, Garattini and Terao.
2011, Garattini and Terao. 2012, Chen and
Reese. 2013, Garattini and Terao. 2013)
Vanillin
(present in food stuffs) +++++ -
(Beedham. 2001, Obach. 2004,
Panoutsopoulos et al., 2005, Garattini and
Terao. 2011, Garattini and Terao. 2012,
Garattini and Terao. 2013)
Xanthine
(endogenous purine) - +++++
(Krenitsky et al., 1972, Yamamoto et al.,
2007, Chen et al., 2012, Pasalic et al., 2012,
Okamoto et al., 2013)
(+++++ = high activity ++ = intermediate activity + = low activity - = no activity). ** Of the
azaarenes listed only phthalazine is a substrate for XOR.
12
With regards endogenous roles of MFEs the best known role of XOR is in
endogenous purine degradation in which it is involved in the biotransformation of
hypoxanthine into xanthine and into the more polar metabolite uric acid (Figure 9)
(Krenitsky et al., 1972, Nishino and Okamoto. 2000, Kitamura et al., 2006,
Garattini et al., 2008, Okamoto et al., 2013).

13
+ H2
Uric acid
+ H2
Inosine phosphorylase
IMP
ADP
ATP
AMP deaminase
Purine nucleosidase
phosphorylase
Purine nucleotide
phosphorylase
Adenosine
Nucleotidase
Adenosine deaminase
XO
XOXDH
XDHO2
O2
O2.-- + H2O2
O2.-- + H2O2
NAD+
NAD+
NADH
NADH
Nucleotidase
Guanine deaminase
2
Guanine
H
H
H
H
H
HHH
Hypoxanthine
Xanthine
GMP
Guanosine
H
H
H
H
AMP
Inosine
Figure 9: Role of xanthine oxidoreductase in endogenous purine catabolism in mammals.
ADP: adenosine diphosphate, AMP: adenosine monophosphate, ATP: adenosine triphosphate,
GMP: guanosine monophosphate, IMP: inosine monophosphate, XDH: xanthine dehydrogenase,
XO: xanthine oxidase(Pacher et al., 2006, Chen et al., 2012, Pasalic et al., 2012, Okamoto et al.,
2013).

14
Due to structural similarity to the endogenous substrates, many exogenous
methylated xanthines are also substrates for XOR. XOR is involved in the oxidative
metabolism of the exogenous food constituent and pharmacological agent caffeine
(1, 3, 7 trimethylxanthine). This is shown in Figure 10, where cytochrome P450
1A2 is involved in the initial demethylation steps and XOR is involved in the final
oxidation to generate the polar 1-methyluric acid that is excreted(Krenitsky et al.,
1972, Hamelin et al., 1994, Streetman et al., 2000, Arnaud. 2011).
2
2
2
2
2
N-demethylation
N-demethylation
O
O
HCHO
+ H O
HCHO
+ H O
NAD or O2 NADH or O.
H3CH3C
H3CH3C
CH3
CH3 CH3
CYP1A2
Caffeine
H
Paraxanthine
CYP1A2
H
H
H
H
1-methylxanthine
XOR
H
1-methyluric acid
Figure 10: The role of xanthine oxidoreductase in caffeine metabolism.
CYP: cytochrome P-450. XOR: xanthine oxidoreductase (Relling et al., 1992, Hamelin et al., 1994,
Baselt and Cravey. 1996, Arnaud. 2011).
With regards AOX there are three well documented endogenous substrates. All-
trans retinaldehyde is an endogenous substrate for AOX (Figure 11), that plays an
important role in the visual process. It has been suggested that AOX may play an
important role in this visual process by biotransformation of all-trans retinaldehyde
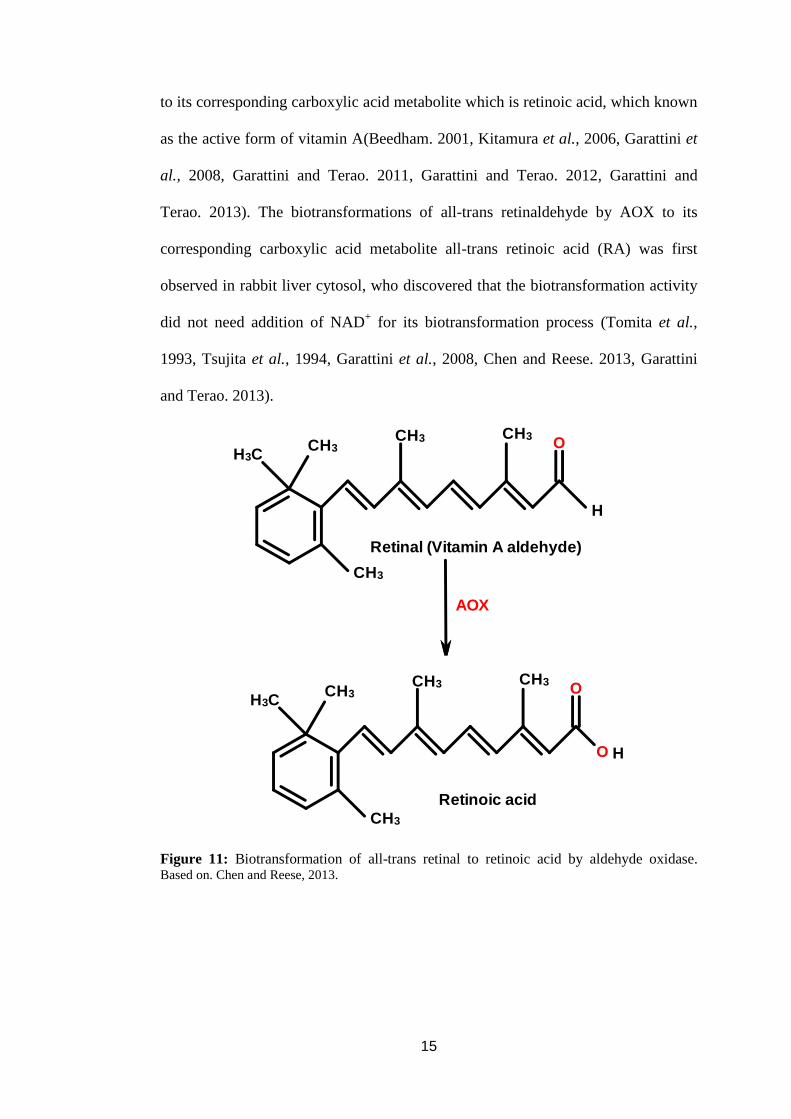
15
to its corresponding carboxylic acid metabolite which is retinoic acid, which known
as the active form of vitamin A(Beedham. 2001, Kitamura et al., 2006, Garattini et
al., 2008, Garattini and Terao. 2011, Garattini and Terao. 2012, Garattini and
Terao. 2013). The biotransformations of all-trans retinaldehyde by AOX to its
corresponding carboxylic acid metabolite all-trans retinoic acid (RA) was first
observed in rabbit liver cytosol, who discovered that the biotransformation activity
did not need addition of NAD+ for its biotransformation process (Tomita et al.,
1993, Tsujita et al., 1994, Garattini et al., 2008, Chen and Reese. 2013, Garattini
and Terao. 2013).
AOX
Retinal (Vitamin A aldehyde)
CH3CH3
CH3
CH3H3C
H
Retinoic acid
CH3
CH3
CH3 CH3
H3C
H
Figure 11: Biotransformation of all-trans retinal to retinoic acid by aldehyde oxidase. Based on. Chen and Reese, 2013.

16
Another endogenous aldehyde that is an AOX substrate is pyridoxal (vitamin B6).
Pyridoxal its biotransformed to its corresponding carboxylic acid metabolite (4-
pyridoxic acid) by AOX (Figure 12) (Beedham. 2001, Garattini et al., 2003,
Kitamura et al., 2006, Garattini et al., 2008, Garattini and Terao. 2011, Garattini
and Terao. 2012, Peretz et al., 2012, Garattini and Terao. 2013). Interestingly in
mice pyridoxal can be biotransformed by purified mouse aldehyde oxidase AOX1
as well as AOH1 but it is not a substrate for AOH2 (Garattini et al., 2008).
3 3
AOX
CH
H
H
H
Pyridoxal 4-Pyridoxic acid
CH
H
H
Figure 12: Oxidation of pyridoxal to 4-pyridoxic acid by aldehyde oxidase. According to.
Peretz et al., 2012.
As well as the oxidation of non-charged N-heterocyclic AOX is also involved in the
oxidation of charged N-heterocyclic which have a CH=N+ group. An example for
such a compounds as corresponding metabolite of vitamin B3 (N1-
methylnicotinamide) that metabolised by AOX and XO (Figure 13) (Murashige et
al., 1966, Ohkubo and Fujimura. 1978, Beedham. 1987, Shibata et al., 1988,
Beedham. 2001, Sugihara et al., 2006, Kundu et al., 2007, Pryde et al., 2010).
17
AOX
AOX
XO
N1-methylnicotinamide
O2
O2
O.2
O.2
+ H2
4-PY
2-PY
CH3
NH2
O
O
CH3
O O
NH2
NH2
Vitamin B3 (Nicotinamide)
Nicotinamide
methyltransferase
NH2
CH3
Figure 13: Biotransformation of vitamin B3 in mammals.
The oxidation of N1-methylnicotinamide by AO to N
1-methyl-2-pyridone-5-carboxamide (2-PY)
and N1-methyl-4-pyridone-5-carboxamide (4-PY).Started with methylation of nicotinamide by
nicotinamide methyltransferase according to Pryde et al., 2010.
As well as aldehydes, AOX can also catalyse the oxidation of nitrogen containing
polycyclic aromatic hydrocarbons (NPAHs) which have a CH=N- group (Table 1)
that are environmental pollutant, an example for these compounds is phthalazine
(Figure 14), which its biotransformed to its corresponding metabolite 1-
phthalazinone by mammalian AOX(Stubley et al., 1979, Beedham et al., 1990,
Obach. 2004, Panoutsopoulos and Beedham. 2004, Barr and Jones. 2011).

18
HAldehyde oxidase
Phthalazine 1-Phthalazinone
Figure 14: Oxidation of phthalazine by aldehyde oxidase to 1-phthalazinone (Obach. 2004,
Barr and Jones. 2011).
Another example for an nitrogen containing polycyclic aromatic hydrocarbons
(NPAHs) AOX substrate is phenanthridine that is biotransformed to more polar
metabolite phenanthridinone by AOX (Figure 15) aiding its excretion (Blumer et
al., 1977, Beedham. 2001, Kitamura et al., 2006, Sorouraddin et al., 2009).
Phenanthridine is an azaarene pollutant found in terrestrial and aquatic
environments from industrial activities associated with fossil fuels (Blumer et al.,
1977, Balch et al., 1995, Osborne et al., 1997, de Voogt and Laane. 2009).
H
Aldehyde oxidase
Phenanthridine Phenanthridinone
Figure 15: Biotransformation of phenanthridine to its metabolite phenanthridinone by
AOX. Based on .Sorouraddin et al., 2009.

19
One important drug substrate for AOX is the pteridine compound methotrexate (4-
amino-N10
-methylpteroyl-L-glutamic acid). This anti-leukemia drug is
biotransformed by AOX to7-hydroxymethotrexate (Figure 16) (Kitamura et al.,
2006, Garattini et al., 2008, Liu et al., 2009, Pryde et al., 2010, Garattini and Terao.
2011, Garattini and Terao. 2012, Garattini and Terao. 2013).
C
C
C
OH
OH
OH
OH
C
AOX
C CONH C C CH2H2
H2
H2
CH3
HH2
H2
H
Methotrexate (MTX)
7-hydroxymethotrexate (7-OH-MTX)
C CONH C C C
H2 H2
H2
H2
CH3
H
Figure 16: Metabolism of methotrexate to its corresponding metabolite 7-
hydroxymethotrexate by AOX. According to (Liu et al., 2009, Pryde et al., 2010, Garattini and
Terao. 2013).
Another example of a substrate for AOX as well as XOR is 6-mercaptopurine. This
purine drug is biotransformed by XO to 6-mercaptopurine-2-one (6-thioxanthine)
and 8-hydroxy-6-mercaptopurine and further biotransformation to its final
metabolite 6-thiouric acid by both AOX and XOR. 6-methylmercaptopurine which
is another metabolite of 6-mercaptopurineis produced by methyltransferase which
is also further biotransformation to final metabolite 8-oxo-6-methylmercaptopurine
by both XO and AOX (Figure 17) (Beedham. 2001, Kitamura et al., 2006, Rashidi
et al., 2007, Sorouraddin et al., 2011, Garattini and Terao. 2013).

20
SH
SH SH
SH
SCHSCH3 3
8-Oxo-6-methylmercaptopurine6-methylmercaptopurine
H
XOR
XOR
XOR
AOX
AOX
6-mercaptopurine-2-one
(6-thioxanthine)
6-thiouric acid
methyltransferase8-hydroxy-6-mercaptopurine
OH H
H
H
O
H
H
H
H
6-mercaptopurine
H
H
Figure 17: Biotransformation of 6-mercaptopurineby AOX and XOR.
According to (Beedham. 2001, Rashidi et al., 2007, Sorouraddin et al., 2011, Garattini and Terao.
2013)
21
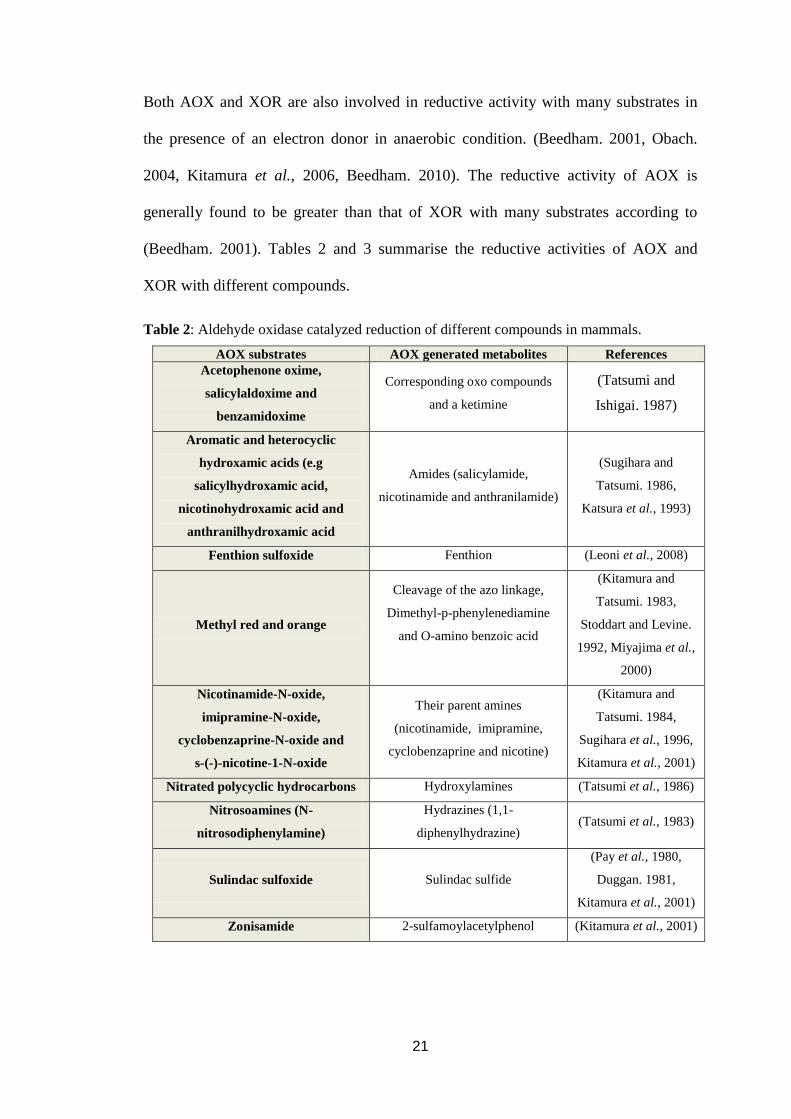
Both AOX and XOR are also involved in reductive activity with many substrates in
the presence of an electron donor in anaerobic condition. (Beedham. 2001, Obach.
2004, Kitamura et al., 2006, Beedham. 2010). The reductive activity of AOX is
generally found to be greater than that of XOR with many substrates according to
(Beedham. 2001). Tables 2 and 3 summarise the reductive activities of AOX and
XOR with different compounds.
Table 2: Aldehyde oxidase catalyzed reduction of different compounds in mammals.
AOX substrates AOX generated metabolites References
Acetophenone oxime,
salicylaldoxime and
benzamidoxime
Corresponding oxo compounds
and a ketimine
(Tatsumi and
Ishigai. 1987)
Aromatic and heterocyclic
hydroxamic acids (e.g
salicylhydroxamic acid,
nicotinohydroxamic acid and
anthranilhydroxamic acid
Amides (salicylamide,
nicotinamide and anthranilamide)
(Sugihara and
Tatsumi. 1986,
Katsura et al., 1993)
Fenthion sulfoxide Fenthion (Leoni et al., 2008)
Methyl red and orange
Cleavage of the azo linkage,
Dimethyl-p-phenylenediamine
and O-amino benzoic acid
(Kitamura and
Tatsumi. 1983,
Stoddart and Levine.
1992, Miyajima et al.,
2000)
Nicotinamide-N-oxide,
imipramine-N-oxide,
cyclobenzaprine-N-oxide and
s-(-)-nicotine-1-N-oxide
Their parent amines
(nicotinamide, imipramine,
cyclobenzaprine and nicotine)
(Kitamura and
Tatsumi. 1984,
Sugihara et al., 1996,
Kitamura et al., 2001)
Nitrated polycyclic hydrocarbons Hydroxylamines (Tatsumi et al., 1986)
Nitrosoamines (N-
nitrosodiphenylamine)
Hydrazines (1,1-
diphenylhydrazine) (Tatsumi et al., 1983)
Sulindac sulfoxide Sulindac sulfide
(Pay et al., 1980,
Duggan. 1981,
Kitamura et al., 2001)
Zonisamide 2-sulfamoylacetylphenol (Kitamura et al., 2001)

22
Table 3: Xanthine oxidoreductase catalyzed reduction of different compounds in mammals.
XOR substrates XOR generated metabolites References
6-bromomethyl-(9H)-purine 6-methylpurine (Porter. 1990)
Doxorubicin Its semiquinone metabolites (Yee and Pritsos. 1997,
Barnabe et al., 2002)
Mitomycin C 2,7-diaminomitosene (Pan et al., 1984, Gustafson
and Pritsos. 1992)
Nitrated polycyclichydrocarbons Hydroxylamines (Tatsumi et al., 1986)
S-(-)-nicotine-1-N-oxide Nicotine (Sugihara et al., 1996)
1.4. Molybdo-flavoenzymes inhibitors.
For many years, inhibitors of AOX and XOR have been described with varying
degrees of detail(Rajagopalan et al., 1962). The inhibitors have been used in many in
vitro systems such as partially purified enzyme, recombinant expressed enzyme, liver
cytosol and liver slices and across several species most notably rabbit, guinea pig and
human. Inhibitors are proposed to affect different domains and prosthetic groups in
AOX and XOR (Johns. 1967, Yoshihara and Tatsumi. 1985, Yoshihara and Tatsumi.
1997, Sugihara et al., 1999, Beedham. 2001, Kitamura et al., 2003, Vila et al., 2004,
Pacher et al., 2006, Diamond et al., 2010, Pryde et al., 2010, Barr and Jones. 2011).
1.4.1. Aldehyde oxidase inhibitors
Examples of AOX inhibitors are menadione, estradiol, chlorpromazine and
phenanthridine which are of widely differing chemical structure (Figure 18).
Menadione (vitamin K3) is a quinone that was discovered as a specific non-
competitive AOX inhibitor by Rajagopalan et al., (1962) in rabbit liver with N1-
methylnicotinamide as a substrate. Since then many other researchers have confirmed
this in a multitude of species summarised in Table 4 and 5 with a variety of AOX

23
substrates. Estradiol was found to be a non-competitive AOX inhibitor by Johns
(1967) in human liver with variety of AOX substrates as summarised in Table 4.
Raloxifene
Cl
Phenanthridine
CH3
HO
CH3
HO
Menadione
CH3
OH
Chlorpromazine
HO
Estradiol17α-ethinyl estradiol
Figure 18: Structures of the aldehyde oxidase inhibitors. According to Merck Index (2014)

24
Species/tissue Substrate Inhibitor Substrate
Concentration
Inhibitor
Concentration Ki or inhibition % Mode of inhibition References
Human/liver Phthalazine and
DMAC Raloxifene 5-100µM 1-10µM 0.8nM Uncompetitive (Choughule et al., 2013)
Human/ liver Phthalazine and
vanillin
Menadione, estradiol
and 17α-ethinyl
estradiol
2µM 50µM 0.29µM and 0.57µM
respectively
Mixed mode of inhibition,
almost uncompetitive (Obach. 2004)
Human /liver Phthalazine Menadione 2µM 50µM 0.20µM Non-competitive (Obach et al., 2004)
Human /liver Phthalazine Chlorpromazine 2µM 50µM 0.57µM competitive (Obach et al., 2004)
Human /liver Phthalazine estradiol, 17α-ethinyl
estradiol 2µM 50µM 0.29µM and 0.57µM Uncompetitive (Obach et al., 2004)
Human /liver Phthalazine Raloxifene 2µM 50µM 0.0029µM Uncompetitive (Obach et al., 2004)
Human /liver
Benzaldehyde,
phenazine methosulfate
(PMS)
Menadione 56 µM
15 µM, 0.08 µM
and
5 µM
55% Non-competitive (Johns. 1967)
Human /liver
Benzaldehyde,
phenazine methosulfate
(PMS)
β-estradiol 56 µM
15 µM, 0.08 µM
and
5 µM
50% Non-competitive (Johns. 1967)
Human /liver
Benzaldehyde,
phenazine methosulfate
(PMS)
Chlorpromazine 56 µM
15 µM, 0.08 µM
and
5 µM
51% Competitive (Johns. 1967)
Human /liver 2-Hydroxypyrimidine,
benzaldehyde Chlorpromazine 0.5µM
1 mM and 0.4
mM 45% Competitive (Johns. 1967)
Human/ liver 2-hydroxy-5-
fluropyrimidine Menadione 0.54µM 25 µM
46% Non-competitive (Johns. 1967)
Human/ liver Phthalazine and
DMAC
Raloxifene, estradiol,
ethinyl estradiol,
menadione and
chlorpromazine
5-100µM 0.1µm to 5µM 0.29µM, 0.57µM,
0.2µM and 0.57µM
Uncompetitive, non-
competitive
(Barr and Jones. 2011,
Barr and Jones. 2013)
Human/liver Phthalazine Chlorpromazine and
estradiol
0.03-25µM
(3µM) 50µM
0.27 µM and 0.62
µM respectively
Non-competitive and
uncompetitive (Nirogi et al., 2013)
Table 4: Summary of the effects of prototypical inhibitors on human aldehyde oxidase.
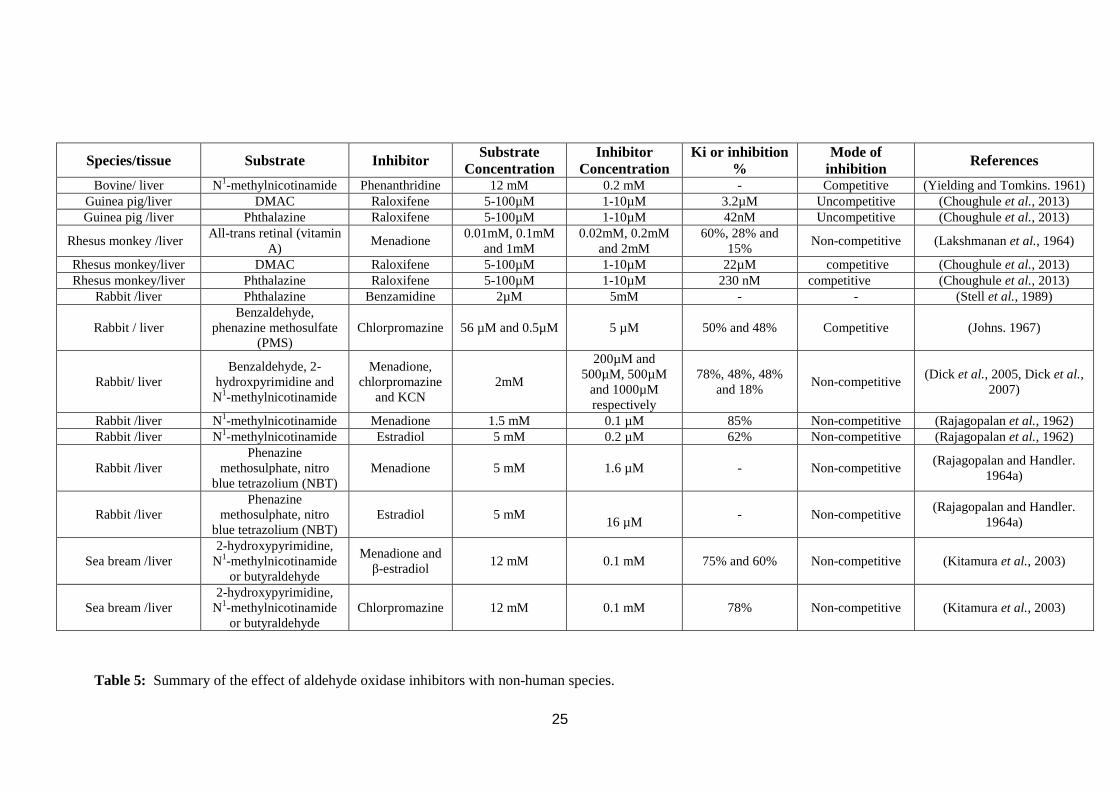
25
Species/tissue Substrate Inhibitor Substrate
Concentration
Inhibitor
Concentration
Ki or inhibition
%
Mode of
inhibition References
Bovine/ liver N1-methylnicotinamide Phenanthridine 12 mM 0.2 mM - Competitive (Yielding and Tomkins. 1961)
Guinea pig/liver DMAC Raloxifene 5-100µM 1-10µM 3.2µM Uncompetitive (Choughule et al., 2013)
Guinea pig /liver Phthalazine Raloxifene 5-100µM 1-10µM 42nM Uncompetitive (Choughule et al., 2013)
Rhesus monkey /liver All-trans retinal (vitamin
A) Menadione
0.01mM, 0.1mM
and 1mM
0.02mM, 0.2mM
and 2mM
60%, 28% and
15% Non-competitive (Lakshmanan et al., 1964)
Rhesus monkey/liver DMAC Raloxifene 5-100µM 1-10µM 22µM competitive (Choughule et al., 2013)
Rhesus monkey/liver Phthalazine Raloxifene 5-100µM 1-10µM 230 nM competitive (Choughule et al., 2013)
Rabbit /liver Phthalazine Benzamidine 2µM 5mM - - (Stell et al., 1989)
Rabbit / liver
Benzaldehyde,
phenazine methosulfate
(PMS)
Chlorpromazine 56 µM and 0.5µM 5 µM 50% and 48% Competitive (Johns. 1967)
Rabbit/ liver
Benzaldehyde, 2-
hydroxpyrimidine and
N1-methylnicotinamide
Menadione,
chlorpromazine
and KCN
2mM
200µM and
500µM, 500µM
and 1000µM
respectively
78%, 48%, 48%
and 18% Non-competitive
(Dick et al., 2005, Dick et al.,
2007)
Rabbit /liver N1-methylnicotinamide Menadione 1.5 mM 0.1 µM 85% Non-competitive (Rajagopalan et al., 1962)
Rabbit /liver N1-methylnicotinamide Estradiol 5 mM 0.2 µM 62% Non-competitive (Rajagopalan et al., 1962)
Rabbit /liver
Phenazine
methosulphate, nitro
blue tetrazolium (NBT)
Menadione 5 mM 1.6 µM - Non-competitive (Rajagopalan and Handler.
1964a)
Rabbit /liver
Phenazine
methosulphate, nitro
blue tetrazolium (NBT)
Estradiol 5 mM
16 µM - Non-competitive
(Rajagopalan and Handler.
1964a)
Sea bream /liver
2-hydroxypyrimidine,
N1-methylnicotinamide
or butyraldehyde
Menadione and
β-estradiol 12 mM 0.1 mM 75% and 60% Non-competitive (Kitamura et al., 2003)
Sea bream /liver
2-hydroxypyrimidine,
N1-methylnicotinamide
or butyraldehyde
Chlorpromazine 12 mM 0.1 mM 78% Non-competitive (Kitamura et al., 2003)
Table 5: Summary of the effect of aldehyde oxidase inhibitors with non-human species.

26
Since then many other researchers have confirmed this in human, rabbit and sea bream
liver as summarised in Table 4 and 5 with a variety of AOX substrates. The discovery
of the related xenoestrogen oral contraceptive drug 17α-ethinyl estradiol as an
uncompetitive AOX inhibitor was made by in Obach 2004 in human liver with
phthalazine and vanillin as a substrates. Another non-competitive inhibitor of AOX is
the drug chlorpromazine Johns (1967) in a different species with benzaldehyde and
phenazine methosulphate as a substrate as summarised in Table 5. Since then many
other researchers have confirmed this in a human, rabbit and sea bream liver as
summarised in Table 4 and 5 with a variety of AOX substrates. Interestingly the
osteoporosis drug raloxifene has been found to have competitive and non-competitive
properties as an AOX inhibitor by many researchers such as Barr and Jones 2011,
2013 and Choughule et al. (2013) in human, guinea pig and rhesus monkey liver with
phthalazine and DMAC as a substrate (Table 4). The environmental NPAHs,
phenanthridine is a competitive inhibitor in bovine liver with N1-methylnicotinamide
as a substrate (Yielding and Tomkins. 1961). Finally the first researchers to find
benzamidine as a specific AOX inhibitor was Stell et al. (1989) in rabbit liver with
phthalazine as a substrate as summarised in Table 5.
1.4.2. Oxipurinol as a specific xanthine oxidoreductase inhibitor
With regards XOR inhibitor oxipurinol is the best documented. The inhibitor
oxipurinol is generated when the anti-gout substrate drug allopurinol is
biotransformed by XOR (Figure 19).

27
Hypoxanthine
Xanthine oxidoreductase
Xanthine oxidase (Mo=S)
H+3H+ 2 e-H2
XO
XDH
O2 H2O2
NAD+NADH H+
inactive complex
H H
HH H
OxipurinolAllopurinol
Figure 19: Generation of the xanthine oxidoreductase inhibitor oxipurinol from allopurinol. According to Barr and Jones, 2011, Barr and Jones, 2013.
The first researcher to find allopurinol and oxipurinol as a specific XOR inhibitor was
by Elion. (1966) in bovine milk, mouse and human liver with xanthine as a substrate.
Since then many other researchers have confirmed this in a multitude of species
summarised in (Table 6) with xanthine and pterin as XOR substrates. The mode of
inhibition with allopurinol and oxipurinol is competitive (Okamoto et al., 2008) and
Nishino et al., 2008) (Table 6).

28
Species/tissue Substrate Inhibitor Substrate
Concentration
Inhibitor
Concentration Ki or inhibition % References
Bovine /milk Xanthine Oxipurinol 0.15mM 100µM 1 µM (Okamoto et al., 2008)
Bovine/ milk Hypoxanthine and xanthine Oxipurinol 0.15mM 100µM 0.1 µM (Nishino et al., 2008,
Okamoto et al., 2008)
Bovine/ milk Xanthine Allopurinol 0.15mM 3.3 µM 0.9 nM (Okamoto et al., 2003)
Bovine/ milk Xanthine Allopurinol 40 µM 14-28 µM 6.3µM (Elion. 1966)
Mouse/liver Xanthine Allopurinol 40 µM 14-28 µM 1.2 µM (Elion. 1966)
Human/liver Xanthine Allopurinol 40 µM 14-28 µM 1.1 µM (Elion. 1966)
Human/ liver Pterin Allopurinol 0.6-10µM 100µM 86% (Obach. 2004)
Human/ liver Xanthine Allopurinol 0.15mM 0.1-2mM 4 µM (Krenitsky et al., 1986)
Wistar rat/liver Pterin Allopurinol - 100µM - (Derbre et al., 2012)
Table 6: Summary of the effects of xanthine oxidoreductase inhibitors allopurinol and oxipurinol with different mammalian species.
29
1.5. Species variation in molybdo-flavoenzyme activity.
Molluscs, crustaceans, insects, bacteria, fungi and all vertebrate classes have been
found to contain the two molybdo-flavoenzymes (AOX and XOR)(Krenitsky et al.,
1972, Wurzinger and Hartenstein. 1974, Moura et al., 1976, Woolfolk and Downard.
1977, Pometto and Crawford. 1983, Turner et al., 1987, Glatigny and Scazzocchio.
1995, Romao et al., 1995, Xu and Johnson. 1995, Schrader et al., 1999, Beedham.
2001, Yasuhara et al., 2002, Garattini et al., 2008, Beedham. 2010).Many species
differences show marked quantitative effects when using cinchonidine as substrate the
AOX activity was lower in monkey than that in rabbits (Fukiya et al., 2010). When is
used zebularine as substrate with mouse, monkey and human and it was found that the
activity of AOX was highest with mouse than that with monkey and human(Klecker et
al., 2006).Sugihara et al.(1997) found when using benzaldehyde and N1-
methylnicotinamide as substrates with human and monkey that the AOX activity with
human was lower than that with monkey(Sugihara et al., 1997). In comparison, rabbit
AOX has lower reductase activity toward zonisamide as a substrate as compared to
monkey(Kitamura et al., 2001). When Kitamura and Tatsumi.(1984) used
nicotinamide N-oxide as substrate with rabbits, hogs, guinea pig, hamster, rat and
mice and it was found that all had similar AOX reductase activity(Kitamura and
Tatsumi. 1984). On the other hand,Hirao et al.(1994) found lower AOX reductase
activity with rat AOX than that with rabbit AOX when naphthalene 1,2-oxide and
also benzo [a] pyrene-4,5-oxide were used as substrates(Hirao et al., 1994).
30
1.5.1. Vertebrate molybdo-flavoenzymes
The number of MFE genes varies between mammals. It was found that the numbers of
active AOX genes in vertebrates are ranged from 1 to 4 (Dickinson. 1971, Lindsley
and Zimm. 1992 , Terao et al., 2006, Garattini et al., 2008, Garattini et al., 2009,
Terao et al., 2009, Garattini and Terao. 2011, Garattini and Terao. 2012, Garattini and
Terao. 2013, Kurosaki et al., 2013).Some vertebrates such as Glires have four of AOX
genes and one XOR gene (rat, mice, pika as well as rabbit)(Garattini et al., 2008,
Terao et al., 2009, Garattini and Terao. 2011, Garattini and Terao. 2013, Kurosaki et
al., 2013). Mouse AOXs are the best characterised AOX genes and proteins for all
vertebrates; Table 7 summarizes the tissue distribution and substrate specificity of
mouse AOX. It is interesting that other mammalian species possess a reduced
complement of functional MFE genes. Dogs (Canis lupus familiaris) possess two
AOX genes (AOX4 and AOX3L1) and one XOR, while bovine (Bos taurus) has three
AOX genes (AOX1, AOX4 and AOX3L1) and one XOR(Terao et al., 2006, Kurosaki
et al., 2013).Humans have just one functional AOX gene (AOX1) and one XOR gene
(Garattini et al., 2008, Garattini and Terao. 2012, Garattini and Terao. 2013, Kurosaki
et al., 2013).The chicken (Gallus gallus) possesses two AOX genes (AOX1 and
AOX2)and one XOR(Terao et al., 2006, Kurosaki et al., 2013).Cat (Felix catus) has
just one functional AOX gene (AOX3L1) and one XOR gene(Garattini and Terao.
2013, Kurosaki et al., 2013), while Cynomolgus monkey(Macaca fascicularis)and
Rhesus monkey (Macaca mulatta) have two AOX genes (AOX1 and AOX3L1) and
three AOX genes (AOX1,AOX4 and AOX3L1) respectively and one XOR(Garattini
and Terao. 2013, Kurosaki et al., 2013).Horse (Equus caballus) has three AOX genes
(AOX1, AOX4 and AOX3L1) and one XOR gene ((Kurosaki et al., 2013). Baboon
(Papio Hamadryas)has three AOX genes (AOX1, AOX4 and AOX3L1) and only one

31
XOR gene (Kurosaki et al., 2013). Interestingly dogs and cats do not express an AOX
enzyme in hepatic tissue unlike other mammalian species studied (Terao et al., 2006,
Garattini and Terao. 2013, Kurosaki et al., 2013).A listing of the current knowledge of
MFEs AOX and XOR in several non-glire species is given on (Table 8 and 9).

32
Table 7: Summary of molybdo-flavoenzymes in mice
The substrate specificity along with tissue distribution of molybdo-flavoenzymes in mice. Based on
(Kurosaki et al., 2013).
Old enzyme
nomenclature
of AOX/XOR
New enzyme
nomenclature
of AOX/XOR
Tissue distribution Known substrates References
AOX1 Aox1
Liver, lung, heart,
kidney, testis, brain,
eye, spinal cord and
spleen
Butyraldehyde, nicotinamide,
octanal, phthalazine, all-
trans retinaldehyde,
pyridoxal, vanillin, 2-
hydroxpyrimidine
(Moriwaki et al., 1996,
Kurosaki et al., 1999, Wright
et al., 1999, Kurosaki et al.,
2004, Vila et al., 2004,
Garattini et al., 2008,
Garattini et al., 2009,
Garattini and Terao. 2011,
Garattini and Terao. 2012,
Garattini and Terao. 2013,
Kurosaki et al., 2013)
AOH1 Aox3 Liver, lung and
testis
Benzaldehyde,butyraldehyde,
octanal,phthalazine,
phenanthridine, all-trans
retinaldehyde,
2-hydroxpyrimidine
(Tomita et al., 1993,
Moriwaki et al., 1996,
Kurosaki et al., 1999, Wright
et al., 1999, Terao et al.,
2001, Kurosaki et al., 2004,
Vila et al., 2004, Garattini et
al., 2008, Garattini et al.,
2009, Garattini and Terao.
2011, Garattini and Terao.
2012, Garattini and Terao.
2013, Kurosaki et al., 2013)
AOH2 Aox4
Skin, stomach,
Haderian gland,
sebaceous gland,
epidermis,eye,
pancreas, brain and
esophagus
Phenanthridine, all-trans
retinaldehyde
(Holmes. 1979, Sasai and De
Robertis. 1997, Terao et al.,
2001, Kurosaki et al., 2004,
Vila et al., 2004, Garattini et
al., 2008, Garattini et al.,
2009, Garattini and Terao.
2011, Garattini and Terao.
2012, Garattini and Terao.
2013, Kurosaki et al., 2013)
AOH3 Aox3L1
Skin, Bowmans
gland and olfactory
mucosa
Benzaldehyde, octanal,
phthalazine, all-trans
retinaldehyde,
2-hydroxpyrimidine
(Kurosaki et al., 2004, Vila et
al., 2004, Garattini et al.,
2008, Garattini et al., 2009,
Garattini and Terao. 2011,
Garattini and Terao. 2012,
Garattini and Terao. 2013,
Kurosaki et al., 2013)
XOR Xdh
Liver, muscle,
mammary glands,
oesophagus,
stomach,
duodenum, jejunum,
lleum, colon,
rectum, lung,
kidney, heart, small
intestine and spleen
Hypoxanthine, xanthine
(Yoshimura and Oka. 1989,
Terao et al., 1992, Falciani et
al., 1994, Kurosaki et al.,
1995, Kuroisaki et al., 1996,
McManaman et al., 1999,
McManaman et al., 2002 ,
Terao et al., 2006, Garattini et
al., 2008, Kurosaki et al.,
2013)

33
Table 8: Summary of aldehyde oxidase genes and tissue distribution in different species
Species AOX Tissue distribution References
Baboon
(Papio Hamadryas)
AOX1,AOX4 and
AOX3L1
Intestine extract. heart,
kidney and liver
(Holmes and Vandeberg.
1986, Garattini et al.,
2008, Kurosaki et al.,
2013)
Bovine
(Bos taurus) AOX1,AOX4 and
AOX3L1
Lung, eye, kidney,
testis, liver, spleen and
ciliary body
(Shimada et al., 1989,
Calzei et al., 1995,
Beedham. 2001, Terao et
al., 2006, Garattini et al.,
2008, Kurosaki et al.,
2013)
Cat
(Felix catus) AOX3L1
Small intestine and
kidney
(Krenitsky et al., 1974,
Beedham. 2001, Terao et
al., 2006, Garattini et al.,
2008, Garattini and Terao.
2013, Kurosaki et al.,
2013)
Chicken
(Gallus gallus) AOX1 and AOX2
Liver, Kidney brain,
skin, muscle, thymus,
trachea, lung, spleen,
pancreas, stomach,
adrenal gland and testis
(Krenitsky et al., 1974,
Nishino and Nishino.
1989, Nishino et al.,
1989, Terao et al., 2006,
Garattini et al., 2008,
Kurosaki et al., 2013)
Cynomolgus monkey
(Macaca fascicularis) AOX1 and AOX3L1 Liver and nasal mucosa
(Kawashima et al., 1999,
Sugihara et al., 2000,
Diamond et al., 2010, Van
Rompay. 2012, Kurosaki
et al., 2013)
Dog
(Canis lupus
familiaris) AOX4 and AOX3L1
Testis, Nasal mucosa,
lacrimal glands, skin
and oesophagus
(Krenitsky et al., 1974,
Vila et al., 2004, Terao et
al., 2006, Garattini et al.,
2008, Kurosaki et al.,
2013)
Horse
(Equus caballus) AOX1,AOX4 and
AOX3L1 Liver
(Seeley et al., 1984,
Prichard et al., 1991,
Räsänen et al., 1993,
Garattini et al., 2008,
Kurosaki et al., 2013)
Human
(Homo sapiens) AOX1 Lung, liver and brain
(Krenitsky et al., 1974,
Minoshima et al., 1995,
Terao et al., 1998,
Beedham. 2001,
Moriwaki et al., 2001,
Peretz et al., 2007,
Garattini et al., 2008,
Garattini and Terao. 2011,
Garattini and Terao. 2012,
Garattini and Terao. 2013,
Kurosaki et al., 2013)
Rhesus monkey
(Macaca mulatta)
AOX1,AOX4 and
AOX3L1 Liver and nasal mucosa
(Krenitsky et al., 1974,
Sugihara et al., 1997,
Garattini et al., 2008,
Fukiya et al., 2010,
Garattini and Terao. 2011,
Tawa et al., 2011,
Garattini and Terao. 2012,
Garattini and Terao. 2013,
Kurosaki et al., 2013)

34
Table 9: Summary of xanthine oxidoreductase tissue distribution in different species
Species Tissue distribution References
Baboon
(Papio Hamadryas) Intestine and liver
((Holmes and Vandeberg. 1986,
Garattini et al., 2008, Kurosaki et
al., 2013)
Bovine
(Bos taurus) Heart, liver, mammary gland and milk
(Shimada et al., 1989, Calzei et al.,
1995, Beedham. 2001, Terao et al.,
2006, Garattini et al., 2008,
Kurosaki et al., 2013)
Cat
(Felix catus) Liver, small intestine and kidney
(Krenitsky et al., 1974, Beedham.
2001, Terao et al., 2006, Garattini
et al., 2008, Kurosaki et al., 2013)
Chicken
(Gallus gallus)
Skin, lung, brain, liver, muscle, spinal
cord, thymus, trachea, spleen, pancreas,
stomach, adrenal gland and testis
(Nishino and Nishino. 1989,
Nishino et al., 1989, Terao et al.,
2006, Garattini et al., 2008,
Kurosaki et al., 2013)
Cynomolgus monkey
(Macaca fascicularis) Testis, small intestine, brain and liver
(Kawashima et al., 1999, Sugihara
et al., 2000, Diamond et al., 2010,
Van Rompay. 2012, Kurosaki et al.,
2013)
Dog
(Canis lupus familiaris) Nasal mucosa, skin, spleen, lacrimal
glands and oesophagus
(Krenitsky et al., 1974, Vila et al.,
2004, Terao et al., 2006, Garattini
et al., 2008, Kurosaki et al., 2013)
Horse
(Equus caballus) Lung, skeletal muscle, liver and small
intestine
(Seeley et al., 1984, Prichard et al.,
1991, Räsänen et al., 1993,
Garattini et al., 2008, Kurosaki et
al., 2013)
Human
(Homo sapiens) Spleen, lung, mammary gland, kidney,
liver, stomach, skeletal muscle and milk
(Krenitsky et al., 1974, Minoshima
et al., 1995, Terao et al., 1998,
Beedham. 2001, Moriwaki et al.,
2001, Peretz et al., 2007, Garattini
et al., 2008, Garattini and Terao.
2011, Garattini and Terao. 2012,
Garattini and Terao. 2013, Kurosaki
et al., 2013)
Rhesus monkey
(Macaca mulatta) Testis, small intestine, brain and liver
(Krenitsky et al., 1974, Sugihara et
al., 1997, Garattini et al., 2008,
Fukiya et al., 2010, Garattini and
Terao. 2011, Tawa et al., 2011,
Garattini and Terao. 2012, Garattini
and Terao. 2013, Kurosaki et al.,
2013)

35
1.5.2. Molybdo-flavoenzymes in fish
AOX and XOR in fish are responsible for metabolism of various compounds such as
aromatic aldehydes and N-heterocyclic compounds (Lakshmanan et al., 1964,
Krenitsky et al., 1974, Wurzinger and Hartenstein. 1974, Cleare et al., 1976, Kamiński
and Jeżewska. 1985, Tatsumi et al., 1992, Johnson et al., 1993, Schlenk. 1998,
Bleeker et al., 2001, Ueda et al., 2001, Ueda et al., 2002, Basha and Rani. 2003,
Kitamura et al., 2003, Pandey et al., 2003, Ziegler. 2003, Isamah and Asagba. 2004,
Resende et al., 2005, Asagba et al., 2010, Hegazi et al., 2010, Kurosaki et al., 2013).
These studies either measured the activity directly by monitoring substrate or product
concentrations or used artificial electron acceptors as shown in (Table 10 and Figure
3).
1.5.2.1. Aldehyde oxidase activity in fish liver
As described in previous sections AOX activity is principally found in hepatic tissue
of mammals(Garattini and Terao. 2013, Kurosaki et al., 2013) and several workers
have also demonstrated activity in this tissue in bony fish, among the most primitive
vertebrates to have this activity. The first report of AOX in fish was by Lakshamanan
et al. (1964) who examined the oxidation of the aldehydes of both vitamin A1 (all-
trans retinal) and vitamin A2 (3,4-dehydro-all-trans retinal) to the corresponding acids
by aldehyde oxidase enzyme in the liver of several freshwater-fish (Ophiocephalus
muralius, Labeo calbasu) and (Cyprinus carpio communis) as shown in (Table 10).
The study also found that the enzyme from freshwater-fish livers was inhibited by the
AOX inhibitor menadione (Lakshmanan et al., 1964).

36
Table 10.Summary of in vitro studies of hepatic aldehyde oxidase activity in fish species.
Common name, ( Latin name) Substrate Electron acceptor AOX activity References
African catfish
(Clarias gariepinus) Benzaldehyde 2,6-DCPIP 143.8
(Isamah and Asagba.
2004)
Electric catfish
(Malapterurus electricus) Benzaldehyde 2,6-DCPIP 130
(Isamah and Asagba.
2004)
African catfish
(Clarias gariepinus) Benzaldehyde 2,6-DCPIP 1316.8
7d , 629.35
21d (Asagba et al., 2010)
Lesser spangled emperor
(Lthrinus choerorynchus) Benzaldehyde MTT + (Johnson et al., 1993)
Rankin cod
(Epinephelus multinotatus) Benzaldehyde MTT + (Johnson et al., 1993)
Red emperor
(Lutjanus sebae) Benzaldehyde MTT + (Johnson et al., 1993)
Sea bream(Pagrus major) Benzaldehyde O2 4.35 (Kitamura et al., 2003)
Spangled emperor
(Lethrinus nebulosus) Benzaldehyde MTT + (Johnson et al., 1993)
Sea bream(Pagrus major) DMAC O2 7.3 (Kitamura et al., 2003)
Goldfish(Carassius auratus) 2-hydroxypyrimidine Fenthion sulphoxide 0.18 (Kitamura et al., 2003)
Goldfish(Carassius auratus) 2-hydroxypyrimidine 2-nitrofluorene + (Ueda et al., 2001)
Goldfish(Carassius auratus) 2-hydroxypyrimidine Sodium
nifurstyrenate ++ (Tatsumi et al., 1992)
Sea bream(Pagrus major) 2-hydroxypyrimidine 2-nitrofluorene 0.25 (Ueda et al., 2002)
Sea bream(Pagrus major) 2-hydroxypyrimidine Sodium
nifurstyrenate 6.5 (Tatsumi et al., 1992)
Smooth dogfish(Mustelus canis) 6-methylpurine Ferricyanide 73 (Krenitsky et al., 1974)
Largemouth bass
(Micropterus salmoides) 6-methylpurine Ferricyanide 10 (Krenitsky et al., 1974)
Florida pompano
(Trachinotus carolinus) 6-methylpurine Ferricyanide 10 (Krenitsky et al., 1974)
Sea mullet
(Menticirrhus saxatilis) 6-methylpurine Ferricyanide 10 (Krenitsky et al., 1974)
Blue fish(Pomatomus saltatrix) 6-methylpurine Ferricyanide 17 (Krenitsky et al., 1974)
Spanish mackerel (Scomberonorus maculatus)
6-methylpurine Ferricyanide <26 (Krenitsky et al., 1974)
Bluegill(Lepomis macrochirus) 6-methylpurine Ferricyanide 35 (Krenitsky et al., 1974)
Channel catfish
(Icatalurus punctatus) 6-methylpurine Ferricyanide 23 (Krenitsky et al., 1974)
Summer flounder
(Paralichthyes dentatus) 6-methylpurine Ferricyanide 47 (Krenitsky et al., 1974)
Goldfish(Carassius auratus) 6-methylpurine Ferricyanide 27 (Krenitsky et al., 1974)
Norfolk spot
(Leiostomus xanthurus) 6-methylpurine Ferricyanide 30 (Krenitsky et al., 1974)
Pumpkinseed sunfish
(Lepomis gibbosus) 6-methylpurine Ferricyanide 57 (Krenitsky et al., 1974)
Nile tilapia juveniles
(Oreochromis niloticus) Phthalazine Ferricyanide 275 (Hegazi et al., 2010)
Northern hog sucker
(Hypentelium nigricans) Vanillin O2 +
(Wurzinger and
Hartenstein. 1974)
White sucker
(Catostamus commersoni) Vanillin O2 +
(Wurzinger and
Hartenstein. 1974)
Northern pike(Esox lucius) Vanillin O2 + (Wurzinger and
Hartenstein. 1974)
Pumpkinseed sunfish
(Lepomis gibbosus) Vanillin O2 ++
(Wurzinger and
Hartenstein. 1974)
Walleye(Stizostedion vitreum) Vanillin O2 ++ (Wurzinger and
Hartenstein. 1974)
Orange-fin labeo
(Labeo calbasu) Vitamin A1 and A2 O2 67
A1, 70.2
A2 (Lakshmanan et al.,
1964)
Great snakehead
(Ophiocephalus muralius) Vitamin A1 and A2 O2 100.1
A1, 112.3
A2 (Lakshmanan et al.,
1964)
Common carp
(Cyprinus carpio communis) Vitamin A1 and A2 O2 41.9
A1, 42.55
A2 (Lakshmanan et al., 1964)
Abbreviations: AOX activity nmol/min/mg liver, DMAC - p-dimethylaminocinnamaldehyde, 2, 6 DCPIP -2, 6-dichlorophenol-indophenol. MTT - Dimethylthiazol-diphenyltetrazolium bromide, A1, A2- vitamin A1 and A2, 7d and 21d (Acclimatised for 14
days in large aquaria then kept in bowls of 20 litres for 7 days and 21 days).

37
Ten years later Krenitsky et al., (1974) examined the activity of AOX with 6-
methylpurine as a substrate and potassium ferricyanide as electron acceptor in the
liver of several fish. The study found that highest activity of AOX with pumpkinseed
sunfish (Lepomis gibbosus) and lowest activity with blue fish (Pomatomus saltatrix)
as shown in (Table 10) (Krenitsky et al., 1974). In the same years, Wurzinger and
Hartenstein, (1974) used vanillin as an AOX substrate with O2 as an electron acceptor
to measure AOX activity in livers of several fish species such as Northern hog sucker
(Hypentelium nigricans), Northern pike (Esox lucius), pumpkinseed sunfish (Lepomis
gibbosus) and walleye (Stizostedion vitreum) (Table 10)(Wurzinger and Hartenstein.
1974). Following these earlier studies it was not till two decades later that there was
further research published on fish AOX. Tatsumi et al, (1992) examined the activity
of aldehyde oxidase in goldfish (Carassius auratus) and sea bream (Pagrus major)
livers using 2-hydroxypyrimidine as aldehyde oxidase substrate and sodium
nifurstyrenate as electron acceptor as shown in (Table 10) (Tatsumi et al., 1992).
Johanson et al. (1993) examined allozymes of aldehyde oxidase (allelic variants of
this enzyme) in the livers of four different species of fish which are commercially
farmed in Australia, red emperor (Lutjanus sebae), spangled emperor (Lethrinus
nebulosus), lesser spangled emperor (Lethrinus choerorynchus) and Rankin cod
(Epinephelus multinotatus). This study used electrophoresis and stained the allozymes
in the gels, using benzaldehyde as AOX substrate and hypoxanthine as XOR substrate
(Table 10) (Johnson et al., 1993). The electron acceptor dimethyl-diphenyltetrazolium
bromide (MTT) was used to visualize electrophoretic variants of AOX and investigate
the genetic similarities of these species of fish. The study demonstrated that whilst
there was statistically significant variation in allelic frequencies in three of the species,
there were no clear geographical groupings of populations. Supporting previous
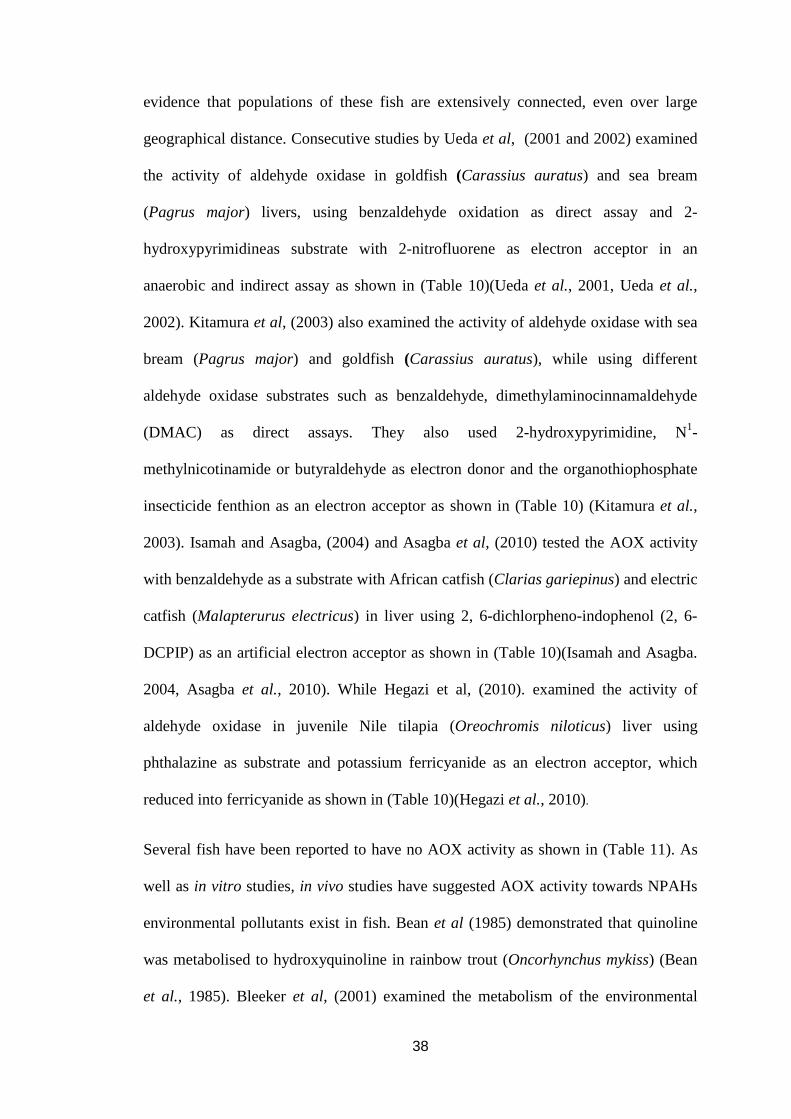
38
evidence that populations of these fish are extensively connected, even over large
geographical distance. Consecutive studies by Ueda et al, (2001 and 2002) examined
the activity of aldehyde oxidase in goldfish (Carassius auratus) and sea bream
(Pagrus major) livers, using benzaldehyde oxidation as direct assay and 2-
hydroxypyrimidineas substrate with 2-nitrofluorene as electron acceptor in an
anaerobic and indirect assay as shown in (Table 10)(Ueda et al., 2001, Ueda et al.,
2002). Kitamura et al, (2003) also examined the activity of aldehyde oxidase with sea
bream (Pagrus major) and goldfish (Carassius auratus), while using different
aldehyde oxidase substrates such as benzaldehyde, dimethylaminocinnamaldehyde
(DMAC) as direct assays. They also used 2-hydroxypyrimidine, N1-
methylnicotinamide or butyraldehyde as electron donor and the organothiophosphate
insecticide fenthion as an electron acceptor as shown in (Table 10) (Kitamura et al.,
2003). Isamah and Asagba, (2004) and Asagba et al, (2010) tested the AOX activity
with benzaldehyde as a substrate with African catfish (Clarias gariepinus) and electric
catfish (Malapterurus electricus) in liver using 2, 6-dichlorpheno-indophenol (2, 6-
DCPIP) as an artificial electron acceptor as shown in (Table 10)(Isamah and Asagba.
2004, Asagba et al., 2010). While Hegazi et al, (2010). examined the activity of
aldehyde oxidase in juvenile Nile tilapia (Oreochromis niloticus) liver using
phthalazine as substrate and potassium ferricyanide as an electron acceptor, which
reduced into ferricyanide as shown in (Table 10)(Hegazi et al., 2010).
Several fish have been reported to have no AOX activity as shown in (Table 11). As
well as in vitro studies, in vivo studies have suggested AOX activity towards NPAHs
environmental pollutants exist in fish. Bean et al (1985) demonstrated that quinoline
was metabolised to hydroxyquinoline in rainbow trout (Oncorhynchus mykiss) (Bean
et al., 1985). Bleeker et al, (2001) examined the metabolism of the environmental
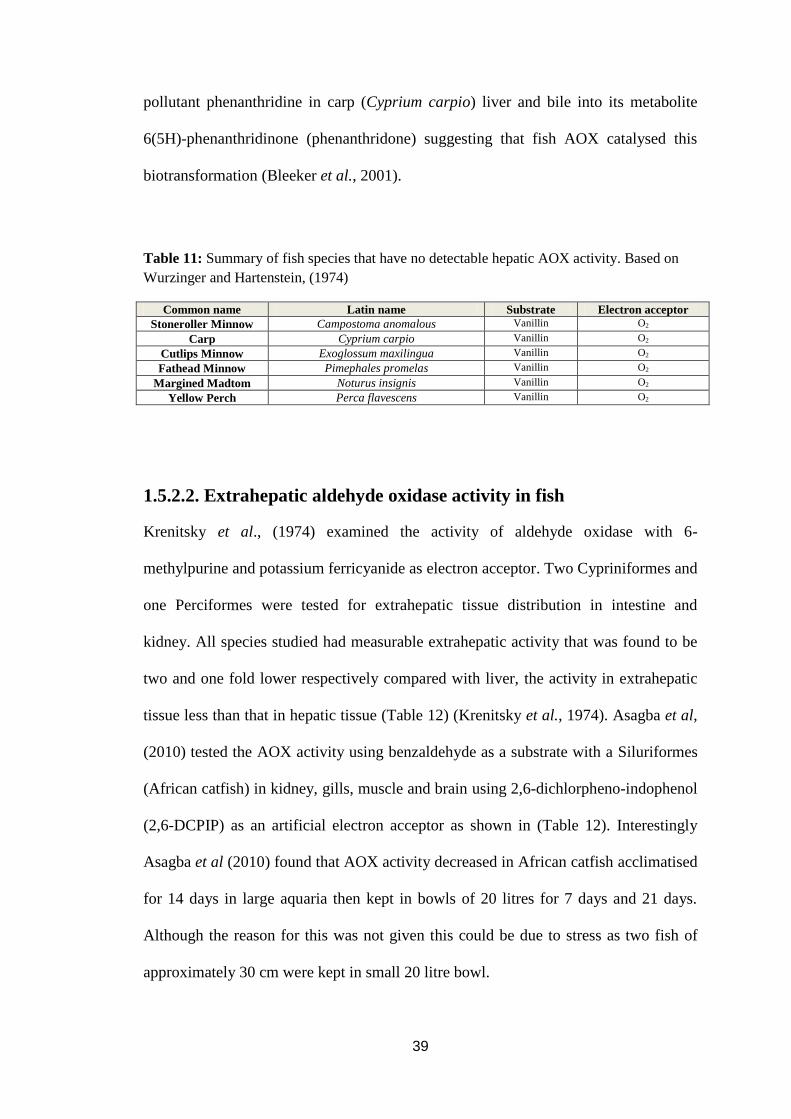
39
pollutant phenanthridine in carp (Cyprium carpio) liver and bile into its metabolite
6(5H)-phenanthridinone (phenanthridone) suggesting that fish AOX catalysed this
biotransformation (Bleeker et al., 2001).
Table 11: Summary of fish species that have no detectable hepatic AOX activity. Based on
Wurzinger and Hartenstein, (1974)
Common name Latin name Substrate Electron acceptor
Stoneroller Minnow Campostoma anomalous Vanillin O2
Carp Cyprium carpio Vanillin O2
Cutlips Minnow Exoglossum maxilingua Vanillin O2
Fathead Minnow Pimephales promelas Vanillin O2
Margined Madtom Noturus insignis Vanillin O2
Yellow Perch Perca flavescens Vanillin O2
1.5.2.2. Extrahepatic aldehyde oxidase activity in fish
Krenitsky et al., (1974) examined the activity of aldehyde oxidase with 6-
methylpurine and potassium ferricyanide as electron acceptor. Two Cypriniformes and
one Perciformes were tested for extrahepatic tissue distribution in intestine and
kidney. All species studied had measurable extrahepatic activity that was found to be
two and one fold lower respectively compared with liver, the activity in extrahepatic
tissue less than that in hepatic tissue (Table 12) (Krenitsky et al., 1974). Asagba et al,
(2010) tested the AOX activity using benzaldehyde as a substrate with a Siluriformes
(African catfish) in kidney, gills, muscle and brain using 2,6-dichlorpheno-indophenol
(2,6-DCPIP) as an artificial electron acceptor as shown in (Table 12). Interestingly
Asagba et al (2010) found that AOX activity decreased in African catfish acclimatised
for 14 days in large aquaria then kept in bowls of 20 litres for 7 days and 21 days.
Although the reason for this was not given this could be due to stress as two fish of
approximately 30 cm were kept in small 20 litre bowl.
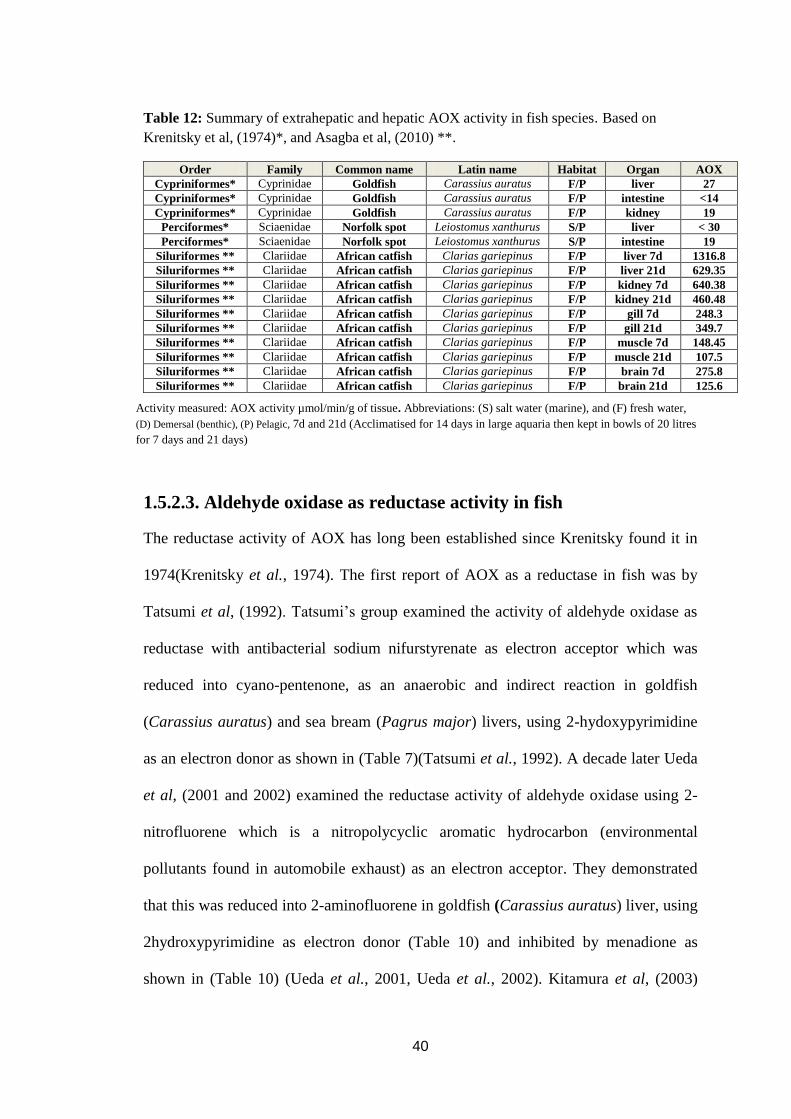
40
Table 12: Summary of extrahepatic and hepatic AOX activity in fish species. Based on
Krenitsky et al, (1974)*, and Asagba et al, (2010) **.
Order Family Common name Latin name Habitat Organ AOX
Cypriniformes* Cyprinidae Goldfish Carassius auratus F/P liver 27
Cypriniformes* Cyprinidae Goldfish Carassius auratus F/P intestine <14
Cypriniformes* Cyprinidae Goldfish Carassius auratus F/P kidney 19
Perciformes* Sciaenidae Norfolk spot Leiostomus xanthurus S/P liver < 30
Perciformes* Sciaenidae Norfolk spot Leiostomus xanthurus S/P intestine 19
Siluriformes ** Clariidae African catfish Clarias gariepinus F/P liver 7d 1316.8
Siluriformes ** Clariidae African catfish Clarias gariepinus F/P liver 21d 629.35
Siluriformes ** Clariidae African catfish Clarias gariepinus F/P kidney 7d 640.38
Siluriformes ** Clariidae African catfish Clarias gariepinus F/P kidney 21d 460.48
Siluriformes ** Clariidae African catfish Clarias gariepinus F/P gill 7d 248.3
Siluriformes ** Clariidae African catfish Clarias gariepinus F/P gill 21d 349.7
Siluriformes ** Clariidae African catfish Clarias gariepinus F/P muscle 7d 148.45
Siluriformes ** Clariidae African catfish Clarias gariepinus F/P muscle 21d 107.5
Siluriformes ** Clariidae African catfish Clarias gariepinus F/P brain 7d 275.8
Siluriformes ** Clariidae African catfish Clarias gariepinus F/P brain 21d 125.6
Activity measured: AOX activity µmol/min/g of tissue. Abbreviations: (S) salt water (marine), and (F) fresh water,
(D) Demersal (benthic), (P) Pelagic, 7d and 21d (Acclimatised for 14 days in large aquaria then kept in bowls of 20 litres
for 7 days and 21 days)
1.5.2.3. Aldehyde oxidase as reductase activity in fish
The reductase activity of AOX has long been established since Krenitsky found it in
1974(Krenitsky et al., 1974). The first report of AOX as a reductase in fish was by
Tatsumi et al, (1992). Tatsumi’s group examined the activity of aldehyde oxidase as
reductase with antibacterial sodium nifurstyrenate as electron acceptor which was
reduced into cyano-pentenone, as an anaerobic and indirect reaction in goldfish
(Carassius auratus) and sea bream (Pagrus major) livers, using 2-hydoxypyrimidine
as an electron donor as shown in (Table 7)(Tatsumi et al., 1992). A decade later Ueda
et al, (2001 and 2002) examined the reductase activity of aldehyde oxidase using 2-
nitrofluorene which is a nitropolycyclic aromatic hydrocarbon (environmental
pollutants found in automobile exhaust) as an electron acceptor. They demonstrated
that this was reduced into 2-aminofluorene in goldfish (Carassius auratus) liver, using
2hydroxypyrimidine as electron donor (Table 10) and inhibited by menadione as
shown in (Table 10) (Ueda et al., 2001, Ueda et al., 2002). Kitamura et al, (2003)

41
examined the activity of aldehyde oxidase as reductase using fenthion sulphoxide (an
insecticide) as electron acceptor which it reduced into fenthion in goldfish (Carassius
auratus), using 2-hydroxypyrimidine as an electron donor as shown in (Table 10)
(Kitamura et al., 2003). Collectively these studies on AOX as a reductase in fish liver
demonstrated that the enzyme has the capacity to reductively metabolise compounds
that are environmental pollutants demonstrating the importance of the study of this
important detoxication enzyme in these organisms. In vivo the physiological relevance
of reductase activity is not known as these xenobiotic electron acceptors will be
competing with a natural endogenous electron acceptor.
1.5.2.4. Xanthine oxidoreductase activity in fish
It was not until 10 years after AOX activity was reported in fish that the first report of
XOR activity in fish appeared Krenitsky et al, (1974). Using xanthine as XOR
substrate with NAD+ or ferricyanide as an electron acceptor as shown in (Table
13)Krenitsky et al (1974) found activity in 11 fish species (Krenitsky et al., 1974).
Wurzinger and Hartenstein, (1974) also examined the activity of XOR using
hypoxanthine as a XOR substrate, using NAD+ as an electron acceptor in the liver of
several fish species as shown in (Table 13) (Wurzinger and Hartenstein. 1974). Cleare
et al, (1976) demonstrated XOR activity with several fish liver species such as brill
(Scophthalmus rhombus), cod (Gadus morhua), dab (Limanda limanda), lemon sole
(Microstomus kitt), mackerel (Scomber scombrus), plaice (Pleuronectes platessa),
perch (Perca fluviatilis) and whiting (Merlangius merlangus) using xanthine as a
XOR substrate, O2 or 2,6-dichlorophenol-indophenol (2,6-DCPIP) and NAD+ as an
electron acceptor as shown in (Table 13)(Cleare et al., 1976).
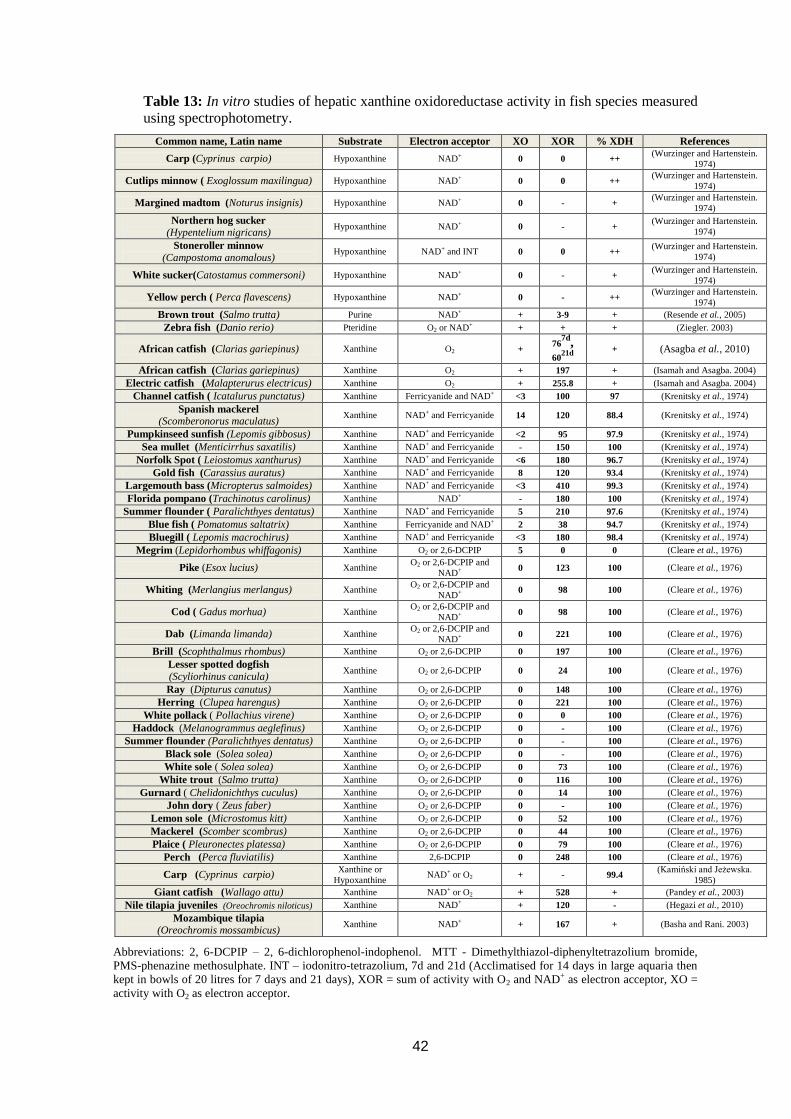
42
Table 13: In vitro studies of hepatic xanthine oxidoreductase activity in fish species measured
using spectrophotometry.
Common name, Latin name Substrate Electron acceptor XO XOR % XDH References
Carp (Cyprinus carpio) Hypoxanthine NAD+ 0 0 ++
(Wurzinger and Hartenstein.
1974)
Cutlips minnow ( Exoglossum maxilingua) Hypoxanthine NAD+ 0 0 ++ (Wurzinger and Hartenstein.
1974)
Margined madtom (Noturus insignis) Hypoxanthine NAD+ 0 - + (Wurzinger and Hartenstein.
1974)
Northern hog sucker
(Hypentelium nigricans) Hypoxanthine NAD+ 0 - +
(Wurzinger and Hartenstein.
1974)
Stoneroller minnow
(Campostoma anomalous) Hypoxanthine NAD+ and INT 0 0 ++
(Wurzinger and Hartenstein.
1974)
White sucker(Catostamus commersoni) Hypoxanthine NAD+ 0 - + (Wurzinger and Hartenstein.
1974)
Yellow perch ( Perca flavescens) Hypoxanthine NAD+ 0 - ++ (Wurzinger and Hartenstein.
1974)
Brown trout (Salmo trutta) Purine NAD+ + 3-9 + (Resende et al., 2005)
Zebra fish (Danio rerio) Pteridine O2 or NAD+ + + + (Ziegler. 2003)
African catfish (Clarias gariepinus) Xanthine O2 + 76
7d,
6021d
+ (Asagba et al., 2010)
African catfish (Clarias gariepinus) Xanthine O2 + 197 + (Isamah and Asagba. 2004)
Electric catfish (Malapterurus electricus) Xanthine O2 + 255.8 + (Isamah and Asagba. 2004)
Channel catfish ( Icatalurus punctatus) Xanthine Ferricyanide and NAD+ <3 100 97 (Krenitsky et al., 1974)
Spanish mackerel
(Scomberonorus maculatus) Xanthine NAD+ and Ferricyanide 14 120 88.4 (Krenitsky et al., 1974)
Pumpkinseed sunfish (Lepomis gibbosus) Xanthine NAD+ and Ferricyanide <2 95 97.9 (Krenitsky et al., 1974)
Sea mullet (Menticirrhus saxatilis) Xanthine NAD+ and Ferricyanide - 150 100 (Krenitsky et al., 1974)
Norfolk Spot ( Leiostomus xanthurus) Xanthine NAD+ and Ferricyanide <6 180 96.7 (Krenitsky et al., 1974)
Gold fish (Carassius auratus) Xanthine NAD+ and Ferricyanide 8 120 93.4 (Krenitsky et al., 1974)
Largemouth bass (Micropterus salmoides) Xanthine NAD+ and Ferricyanide <3 410 99.3 (Krenitsky et al., 1974)
Florida pompano (Trachinotus carolinus) Xanthine NAD+ - 180 100 (Krenitsky et al., 1974)
Summer flounder ( Paralichthyes dentatus) Xanthine NAD+ and Ferricyanide 5 210 97.6 (Krenitsky et al., 1974)
Blue fish ( Pomatomus saltatrix) Xanthine Ferricyanide and NAD+ 2 38 94.7 (Krenitsky et al., 1974)
Bluegill ( Lepomis macrochirus) Xanthine NAD+ and Ferricyanide <3 180 98.4 (Krenitsky et al., 1974)
Megrim (Lepidorhombus whiffagonis) Xanthine O2 or 2,6-DCPIP 5 0 0 (Cleare et al., 1976)
Pike (Esox lucius) Xanthine O2 or 2,6-DCPIP and
NAD+ 0 123 100 (Cleare et al., 1976)
Whiting (Merlangius merlangus) Xanthine O2 or 2,6-DCPIP and
NAD+ 0 98 100 (Cleare et al., 1976)
Cod ( Gadus morhua) Xanthine O2 or 2,6-DCPIP and
NAD+ 0 98 100 (Cleare et al., 1976)
Dab (Limanda limanda) Xanthine O2 or 2,6-DCPIP and
NAD+ 0 221 100 (Cleare et al., 1976)
Brill (Scophthalmus rhombus) Xanthine O2 or 2,6-DCPIP 0 197 100 (Cleare et al., 1976)
Lesser spotted dogfish
(Scyliorhinus canicula) Xanthine O2 or 2,6-DCPIP 0 24 100 (Cleare et al., 1976)
Ray (Dipturus canutus) Xanthine O2 or 2,6-DCPIP 0 148 100 (Cleare et al., 1976)
Herring (Clupea harengus) Xanthine O2 or 2,6-DCPIP 0 221 100 (Cleare et al., 1976)
White pollack ( Pollachius virene) Xanthine O2 or 2,6-DCPIP 0 0 100 (Cleare et al., 1976)
Haddock (Melanogrammus aeglefinus) Xanthine O2 or 2,6-DCPIP 0 - 100 (Cleare et al., 1976)
Summer flounder (Paralichthyes dentatus) Xanthine O2 or 2,6-DCPIP 0 - 100 (Cleare et al., 1976)
Black sole (Solea solea) Xanthine O2 or 2,6-DCPIP 0 - 100 (Cleare et al., 1976)
White sole ( Solea solea) Xanthine O2 or 2,6-DCPIP 0 73 100 (Cleare et al., 1976)
White trout (Salmo trutta) Xanthine O2 or 2,6-DCPIP 0 116 100 (Cleare et al., 1976)
Gurnard ( Chelidonichthys cuculus) Xanthine O2 or 2,6-DCPIP 0 14 100 (Cleare et al., 1976)
John dory ( Zeus faber) Xanthine O2 or 2,6-DCPIP 0 - 100 (Cleare et al., 1976)
Lemon sole (Microstomus kitt) Xanthine O2 or 2,6-DCPIP 0 52 100 (Cleare et al., 1976)
Mackerel (Scomber scombrus) Xanthine O2 or 2,6-DCPIP 0 44 100 (Cleare et al., 1976)
Plaice ( Pleuronectes platessa) Xanthine O2 or 2,6-DCPIP 0 79 100 (Cleare et al., 1976)
Perch (Perca fluviatilis) Xanthine 2,6-DCPIP 0 248 100 (Cleare et al., 1976)
Carp (Cyprinus carpio) Xanthine or
Hypoxanthine NAD+ or O2 + - 99.4
(Kamiński and Jeżewska.
1985)
Giant catfish (Wallago attu) Xanthine NAD+ or O2 + 528 + (Pandey et al., 2003)
Nile tilapia juveniles (Oreochromis niloticus) Xanthine NAD+ + 120 - (Hegazi et al., 2010)
Mozambique tilapia
(Oreochromis mossambicus) Xanthine NAD+ + 167 + (Basha and Rani. 2003)
Abbreviations: 2, 6-DCPIP – 2, 6-dichlorophenol-indophenol. MTT - Dimethylthiazol-diphenyltetrazolium bromide,
PMS-phenazine methosulphate. INT – iodonitro-tetrazolium, 7d and 21d (Acclimatised for 14 days in large aquaria then
kept in bowls of 20 litres for 7 days and 21 days), XOR = sum of activity with O2 and NAD+ as electron acceptor, XO =
activity with O2 as electron acceptor.

43
In addition, Kaminski and Jezewska, (1985) examined the activity of XOR in carp
(Cyprinus carpio) liver using xanthine or hypoxanthine as substrate and NAD+ or O2
as an electron acceptor as shown in (Table 13) (Kamiński and Jeżewska. 1985).
While, Johnson et al, (1993) examined the activity of XO with several fish liver
species such as lesser spangled emperor (Lthrinus choerorynchus), rankin cod
(Epinephelus multinotatus), red emperor (Lutjanus sebae) and spangled emperor
(Lethrinus nebulosus) with hypoxanthine as substrate and dimethylthiazol-
diphenyltetrazolium (MTT)as an electron acceptor as shown in (Table 15) (Johnson et
al., 1993). Pandey et al, (2003) used xanthine as XO substrate and(PMS) phenazine
methosulphate as an electron acceptor to examine the activity of XO in giant catfish
(Wallago attu) liver as shown in (Table 13)(Pandey et al., 2003). Basha and Rani,
(2003) examined the activity of XDH with Mozambique tilapia (Oreochromis
mossambicus) liver, using xanthine as substrate and NAD+ as an electron acceptor as
shown in (Table 13)(Basha and Rani. 2003). In addition, Ziegler, (2003) examined the
activity of XOR using pteridine as substrate and O2 or NAD+ as an electron acceptor
with zebra fish (Danio rerio) liver as shown in (Table 13) (Ziegler. 2003). Isamah and
Asagba, (2004) using xanthine as substrate and O2 as an electron acceptor to examine
the activity of XO in several Western Niger-Delta fish liver species such as African
catfish (Clarias gariepinus) and electric catfish (Malapterurus electricus) as shown in
(Table 13)(Isamah and Asagba. 2004). Resende et al, (2005) examined the activity of
XDH in brown trout (Salmo trutta) liver, using purine as substrate and NAD+ as an
electron acceptor, as shown in (Table 13) (Resende et al., 2005). Xanthine as substrate
and O2 as an electron acceptor in African catfish (Clarias gariepinus) liver from Delta
State, Nigeria as shown in (Table 13) (Asagba et al., 2010). In addition, Hegazi et al,
(2010) examined the activity of XDH in Nile tilapia juveniles (Oreochromis niloticus)

44
liver. Using xanthine as substrate and NAD+ as an electron acceptor, as shown in
(Table 13)(Hegazi et al., 2010). Several fish have been reported to have no XOR
activity as shown in (Table 14).
Table 14: Summary of fish species that had no detectable XOR activity.
Common name Latin name substrate Electron acceptor Reference
Smooth dogfish Mustelus
canis Xanthine NAD
+ and Ferricyanide (Krenitsky et al., 1974)
Northern pike Esox lucius Hypoxanthine NAD+
(Wurzinger and Hartenstein.
1974)
Pumpkinseed
sunfish
Lepomis
gibbosus Hypoxanthine NAD
+
(Wurzinger and Hartenstein.
1974)
Walleye Stizostedion
vitreum Hypoxanthine NAD
+
(Wurzinger and Hartenstein.
1974)

45
As well as the spectrophotometric studies above many different researchers also used
electrophoresis and histochemical dye methods to investigate the hepatic xanthine
oxidoreductase activity in different fish as seen in (Table 15).
Table 15: Summary of in vitro studies of hepatic xanthine oxidoreductase activity in fish species
using electrophoresis and histochemical dye methods
Common name, Latin name Substrate Electron
acceptor XOR XDH References
lesser spangled emperor
(Lthrinus choerorynchus) Hypoxanthine MTT + + (Johnson et al., 1993)
Rankin cod
(Epinephelus multinotatus) Hypoxanthine MTT + + (Johnson et al., 1993)
Red emperor ( Lutjanus sebae) Hypoxanthine MTT + + (Johnson et al., 1993)
Spangled emperor
(Lethrinus nebulosus) Hypoxanthine MTT + + (Johnson et al., 1993)
Spotted murrel (Channa punctatus) Xanthine MTT - - (Sastry and Rao. 1984)
Spotted murrel (Channa punctatus) Xanthine MTT - - (Sastry and Rao. 1982)
Barbell (Barbus bocagei) Xanthine PMS - - (Peixoto et al., 2013)
Orangefin labeo (Labeo calbasu) Hypoxanthine MTT + + (Singh et al., 2010)
White sea bream (Diplodus sargus) Hypoxanthine MTT + - (Lenfant. 2003)
Juvenile Chinese sturgeon
(Acipenser sinensis) Hypoxanthine MTT + - (Feng et al., 2012)
White crappie
(Pomoxis annularis) adult Hypoxanthine EBT + +
(Epifanio and Philipp.
1993)
White crappie (Pomoxis annularis)
embryos or larva Hypoxanthine EBT + -
(Epifanio and Philipp.
1994)
Black crappie
(Pomoxis nigromaculatus) adult Hypoxanthine EBT + +
(Epifanio and Philipp.
1993)
Black crappie
(Pomoxis nigromaculatus)
embryos or larva
Hypoxanthine EBT + - (Epifanio and Philipp.
1994)
Atlantic mackerel
(Scomber scombrus) Xanthine TTC + +
(Smith and Jamieson.
1978)
Japanese medaka (Oryzias latipes) Xanthine PMS + NBT + + (Nakano and Whiteley.
1965)
Abbreviations: TTC – Tetrazolium chloride, EBT – Erochrome black T, MTT - Dimethylthiazol-diphenyltetrazolium
bromide, PMS- phenazine methosulphate, NBT- nitro blue tetrazolium.
46
1.5.2.5. Extrahepatic xanthine oxidoreductase activity in fish
Krenitsky et al, (1974) used a spectrophotometric assay, xanthine as XOR substrate
and NAD+
or ferricyanide as electron acceptor to measure extrahepatic XOR activity
in several fish species. Two Cypriniformes and one Perciformes were tested for
extrahepatic tissue distribution in intestine and kidney XOR activity. All species
studied had measurable extrahepatic activity that was found to be 4-fold lower in
intestine and 1.5-fold more in kidney compared with liver , the highest activity was
found in the kidney of the goldfish (Carassius auratus) (Table 16) (Krenitsky et al.,
1974). The activity of extrahepatic XOR tested by Resende et al, (2005)was tested in
one Salmoniformes in which the activity found in kidney of brown trout (Salmo
trutta) was found to be 2-fold more compared with liver (Table 16)(Resende et al.,
2005). Hegazi et al, (2010) also examined the extrahepatic activity of XOR in one
Perciformes and found the activity in white muscle of juvenile Nile tilapia
(Oreochromis niloticus) 1.3-fold lower compared with liver (Table 16) (Hegazi et al.,
2010). Temple et al., (1979) examined the extrahepatic XOR activity in intestine of
goldfish (Carassius auratus) with 100% XDH (Temple et al., 1979). Sastry and Rao.
(1982 and 1984) found the activity of XOR in different tissue of spotted murrel
(Channa punctatus) in kidney, gills, brain, intestine and muscle (Sastry and Rao.
1982, Sastry and Rao. 1984). . Hari and Neeraja (2012) examined the extrahepatic
activity of XOR in one Cypriniformes and found the activity in the kidney of
Common carp (Cyprinus carpio) as XO(Hari and Neeraja. 2012). Nakano and
Whiteley (1965) examined the extrahepatic activity of XOR in one Beloniformes and
found the activity in intestines of Japanese medaka (Oryzias latipes) (Nakano and
Whiteley. 1965).
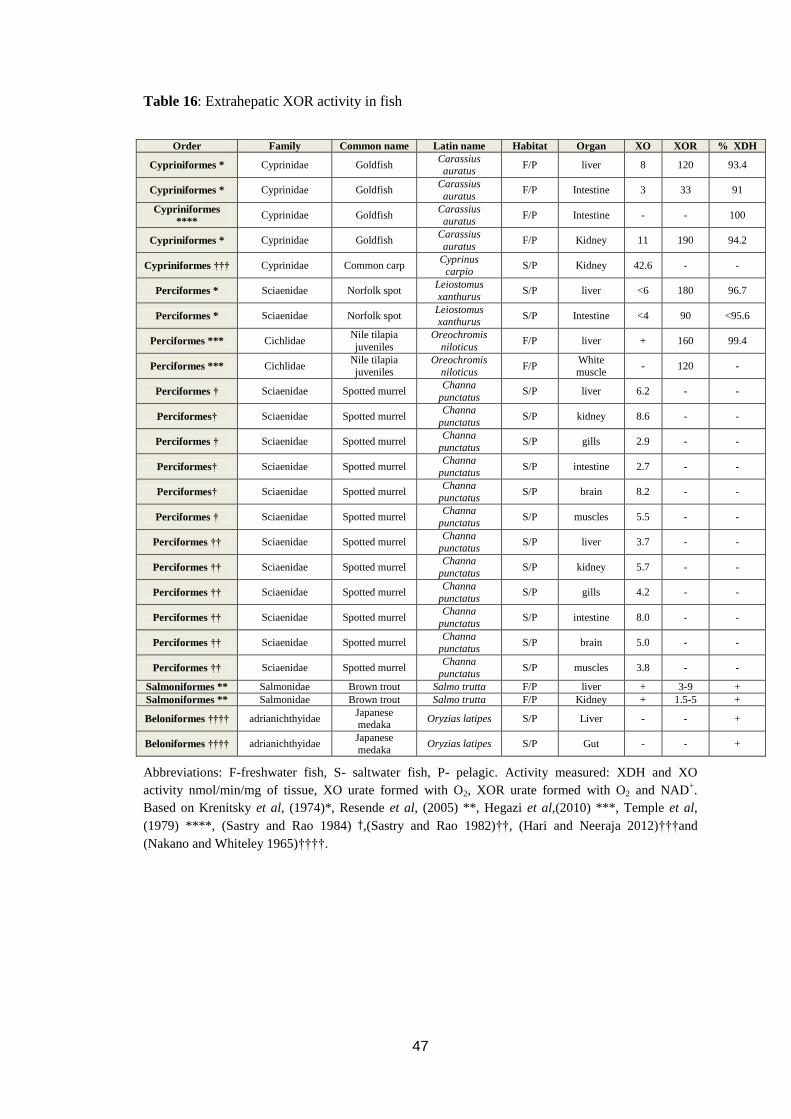
47
Table 16: Extrahepatic XOR activity in fish
Order Family Common name Latin name Habitat Organ XO XOR % XDH
Cypriniformes * Cyprinidae Goldfish Carassius auratus
F/P liver 8 120 93.4
Cypriniformes * Cyprinidae Goldfish Carassius
auratus F/P Intestine 3 33 91
Cypriniformes
**** Cyprinidae Goldfish
Carassius auratus
F/P Intestine - - 100
Cypriniformes * Cyprinidae Goldfish Carassius
auratus F/P Kidney 11 190 94.2
Cypriniformes ††† Cyprinidae Common carp Cyprinus
carpio S/P Kidney 42.6 - -
Perciformes * Sciaenidae Norfolk spot Leiostomus
xanthurus S/P liver <6 180 96.7
Perciformes * Sciaenidae Norfolk spot Leiostomus xanthurus
S/P Intestine <4 90 <95.6
Perciformes *** Cichlidae Nile tilapia
juveniles
Oreochromis
niloticus F/P liver + 160 99.4
Perciformes *** Cichlidae Nile tilapia
juveniles
Oreochromis
niloticus F/P
White
muscle - 120 -
Perciformes † Sciaenidae Spotted murrel Channa
punctatus S/P liver 6.2 - -
Perciformes† Sciaenidae Spotted murrel Channa
punctatus S/P kidney 8.6 - -
Perciformes † Sciaenidae Spotted murrel Channa
punctatus S/P gills 2.9 - -
Perciformes† Sciaenidae Spotted murrel Channa
punctatus S/P intestine 2.7 - -
Perciformes† Sciaenidae Spotted murrel Channa
punctatus S/P brain 8.2 - -
Perciformes † Sciaenidae Spotted murrel Channa
punctatus S/P muscles 5.5 - -
Perciformes †† Sciaenidae Spotted murrel Channa
punctatus S/P liver 3.7 - -
Perciformes †† Sciaenidae Spotted murrel Channa
punctatus S/P kidney 5.7 - -
Perciformes †† Sciaenidae Spotted murrel Channa
punctatus S/P gills 4.2 - -
Perciformes †† Sciaenidae Spotted murrel Channa
punctatus S/P intestine 8.0 - -
Perciformes †† Sciaenidae Spotted murrel Channa
punctatus S/P brain 5.0 - -
Perciformes †† Sciaenidae Spotted murrel Channa
punctatus S/P muscles 3.8 - -
Salmoniformes ** Salmonidae Brown trout Salmo trutta F/P liver + 3-9 +
Salmoniformes ** Salmonidae Brown trout Salmo trutta F/P Kidney + 1.5-5 +
Beloniformes †††† adrianichthyidae Japanese medaka
Oryzias latipes S/P Liver - - +
Beloniformes †††† adrianichthyidae Japanese
medaka Oryzias latipes S/P Gut - - +
Abbreviations: F-freshwater fish, S- saltwater fish, P- pelagic. Activity measured: XDH and XO
activity nmol/min/mg of tissue, XO urate formed with O2, XOR urate formed with O2 and NAD+.
Based on Krenitsky et al, (1974)*, Resende et al, (2005) **, Hegazi et al,(2010) ***, Temple et al,
(1979) ****, (Sastry and Rao 1984) †,(Sastry and Rao 1982)††, (Hari and Neeraja 2012)†††and
(Nakano and Whiteley 1965)††††.

48
1.5.3. Molybdo-flavoenzymes as pollution monitoring in fish
As AOX and XOR biotransform substrates to more polar compounds, several research
groups have measured the activity of these enzymes in animals exposed to pollutant to
determine if they are increased or decreased and could be used as pollution
biomarkers. Basha and Rani, (2003) examined induction of enzymes in fish in
response to oxidative stress caused by heavy metals (such as cadmium, zinc, mercury
and copper) which are released into ponds, lakes and rivers in industrial effluents in
India. They discovered significant elevations of detoxification enzymes including XO
in the liver and kidney of the freshwater teleost, tilapia (Oreochromis mossabicus),
using xanthine as substrate and NAD+, iodophenyl-tetrazolium chloride (INT) as
electron acceptor. As a result of cadmium toxicity and it was found that the XOR
increased ~1.8 fold in liver and in kidney(Table 17) (Basha and Rani. 2003). Pandey
et al. (2003) examined biomarker responses including XO in several tissues of the
freshwater giant catfish (Wallago attu), obtained from two different sites, which
varied in levels of pollution, along the river Yamuna in India (see Table 17 and
18),Water from the site, was more heavily polluted as a result of increased industrial
activity and chemical use, was found to have higher pH and lower level of dissolved
oxygen compared to the less polluted site. Using xanthine as substrate and phenazine
methosulphate (PMS) as electron acceptor, the researchers found that XO activity was
significantly higher in fish taken from the heavily polluted area and used this evidence
to propose that such XO be used future monitoring of aquatic ecosystem pollution.
They found that activity was increased 2.47-fold in liver, 4.49-fold in gill and 2.11-
fold in kidney(Pandey et al., 2003).Interestingly Sastry and Rao (1982 and 1984)
examined the pollution effect of mercuric chloride with spotted murrel (Channa
punctatus) liver and found no change on XOR activity by using xanthine as substrate
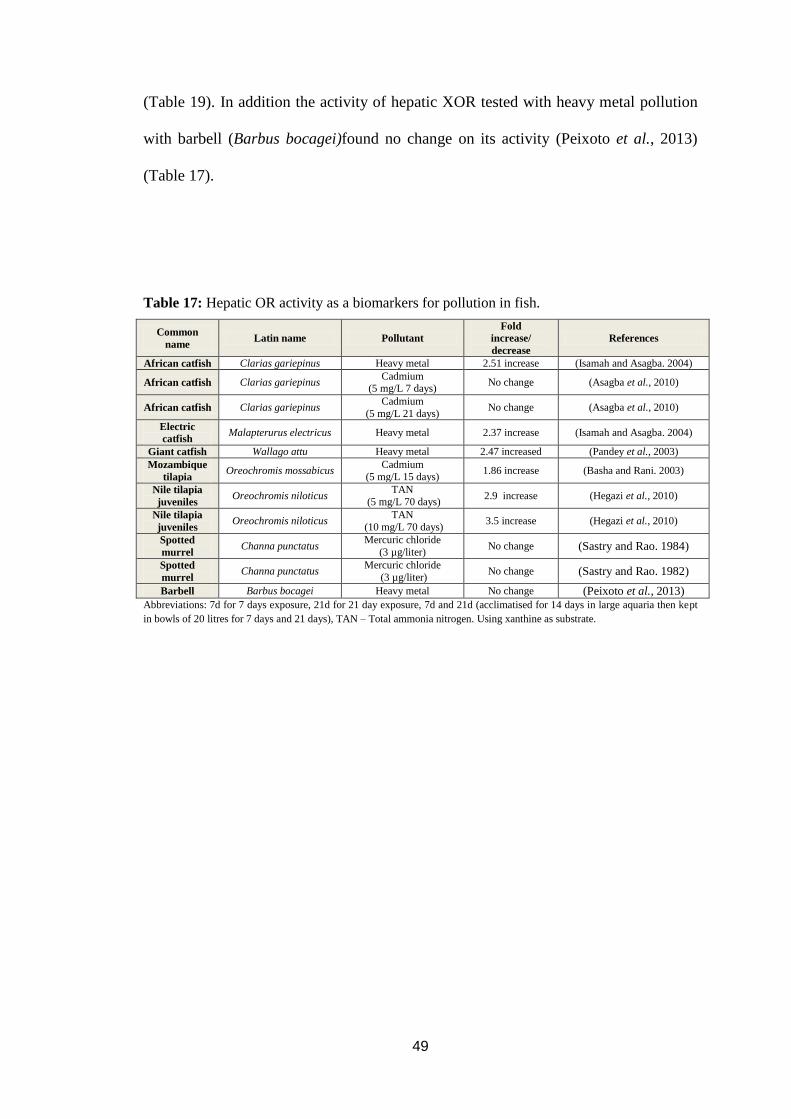
49
(Table 19). In addition the activity of hepatic XOR tested with heavy metal pollution
with barbell (Barbus bocagei)found no change on its activity (Peixoto et al., 2013)
(Table 17).
Table 17: Hepatic OR activity as a biomarkers for pollution in fish.
Common
name Latin name Pollutant
Fold
increase/
decrease
References
African catfish Clarias gariepinus Heavy metal 2.51 increase (Isamah and Asagba. 2004)
African catfish Clarias gariepinus Cadmium
(5 mg/L 7 days) No change (Asagba et al., 2010)
African catfish Clarias gariepinus Cadmium
(5 mg/L 21 days) No change (Asagba et al., 2010)
Electric
catfish Malapterurus electricus Heavy metal 2.37 increase (Isamah and Asagba. 2004)
Giant catfish Wallago attu Heavy metal 2.47 increased (Pandey et al., 2003)
Mozambique
tilapia Oreochromis mossabicus
Cadmium
(5 mg/L 15 days) 1.86 increase (Basha and Rani. 2003)
Nile tilapia
juveniles Oreochromis niloticus
TAN
(5 mg/L 70 days) 2.9 increase (Hegazi et al., 2010)
Nile tilapia
juveniles Oreochromis niloticus
TAN
(10 mg/L 70 days) 3.5 increase (Hegazi et al., 2010)
Spotted
murrel Channa punctatus
Mercuric chloride
(3 µg/liter) No change (Sastry and Rao. 1984)
Spotted
murrel Channa punctatus
Mercuric chloride
(3 µg/liter) No change (Sastry and Rao. 1982)
Barbell Barbus bocagei Heavy metal No change (Peixoto et al., 2013) Abbreviations: 7d for 7 days exposure, 21d for 21 day exposure, 7d and 21d (acclimatised for 14 days in large aquaria then kept
in bowls of 20 litres for 7 days and 21 days), TAN – Total ammonia nitrogen. Using xanthine as substrate.

50
Table 18: Extrahepatic XOR activity as biomarkers for pollution in fish.
Common
name Latin name Pollutant
Fold
increase/
decrease
Organ References
African catfish Clarias
gariepinus
Cadmium
(5 mg/L 7 days) 1.42 decreased Kidney (Asagba et al., 2010)
African catfish Clarias
gariepinus
Cadmium
(5 mg/L 21 days) 1.99 decreased Kidney (Asagba et al., 2010)
African catfish Clarias
gariepinus
Cadmium
(5 mg/L 7 days) 2.33 decreased Gill (Asagba et al., 2010)
African catfish Clarias
gariepinus
Cadmium
(5 mg/L 21 days) 2.28 decreased Gill (Asagba et al., 2010)
African catfish Clarias
gariepinus
Cadmium
(5 mg/L 7 days) No change Muscle (Asagba et al., 2010)
African catfish Clarias
gariepinus
Cadmium
(5 mg/L 21 days) No change Muscle (Asagba et al., 2010)
African catfish Clarias
gariepinus
Cadmium
(5 mg/L 7 days) No change Brain (Asagba et al., 2010)
African catfish Clarias
gariepinus
Cadmium
(5 mg/L 21 days) No change Brain (Asagba et al., 2010)
Giant catfish Wallago attu Heavy metal 2.11 increased Kidney (Pandey et al., 2003)
Giant catfish Wallago attu Heavy metal 4.49 increased Gill (Pandey et al., 2003)
Mozambique
tilapia
Oreochromis
mossabicus
Cadmium
(5 mg/L 15 days) 1.84 increase Kidney
(Basha and Rani.
2003)
Nile tilapia
juveniles
Oreochromis
niloticus
TAN
(5 mg/L 70 days) 2.25 increase
White
muscle (Hegazi et al., 2010)
Nile tilapia
juveniles
Oreochromis
niloticus
TAN
(10 mg/L 70 days) 2.6 increase
White
muscle (Hegazi et al., 2010)
Spotted murrel Channa
punctatus
Mercuric chloride
(3 µg/litre) No change Kidney
(Sastry and Rao.
1984)
Spotted murrel Channa
punctatus
Mercuric chloride
(3 µg/litre) 2 increase Gills
(Sastry and Rao.
1984)
Spotted murrel Channa
punctatus
Mercuric chloride
(3 µg/litre) No change Intestine Sastry and Rao.1984)
Spotted murrel Channa
punctatus
Mercuric chloride
(3 µg/litre) No change Brain
(Sastry and Rao.
1984)
Spotted murrel Channa
punctatus
Mercuric chloride
(3 µg/litre) No change Muscle Sastry and Rao.1984)
Spotted murrel Channa
punctatus
Mercuric chloride
(3 µg/litre) No change Kidney
(Sastry and Rao.
1982)
Spotted murrel Channa
punctatus
Mercuric chloride
(3 µg/litre) No change Kidney
(Sastry and Rao.
1982)
Spotted murrel Channa
punctatus
Mercuric chloride
(3 µg/litre) No change Kidney
(Sastry and Rao.
1982)
Spotted murrel Channa
punctatus
Mercuric chloride
(3 µg/litre) No change Kidney
(Sastry and Rao.
1982)
Spotted murrel Channa
punctatus
Mercuric chloride
(3 µg/litre) No change Kidney
(Sastry and Rao.
1982)
Common carp Cyprinus
carpio
Ammonia
(5 mg/L 7 days) 2 decrease Liver
(Hari and Neeraja.
2012)
Abbreviations: 7d for 7 days exposure, 21d for 21 day exposure, 7d and 21d (acclimatised for 14 days in large aquaria then kept in
bowls of 20 litres for 7 days and 21 days), TAN – Total ammonia nitrogen. All activity was measured using xanthine as substrate.

51
Isamah and Asagba, (2004) examined XO and AOX activity in the liver of electric
catfish (Malapterurus electricus) and African catfish (Clarias gariepinus), using
xanthine and benzaldehyde as substrate respectively, taken from two different sites
along the Warri river in the Western Niger-Delta (see Table 19). Different levels of
pollution as result of various effluent entries into the river were present at the two
sample sites. It was found that XO may act as a marker of stress due to pollution by
potentially increasing with elevated levels of contaminants and it found the activity of
XO increased 2.37-fold and AOX activity increased 1.46-fold in electric catfish
(Malapterurus electricus) and in African catfish (Clarias gariepinus) AOX activity
increased 2.35-fold and XO activity increased 2.51-fold (Table 17 and 19) (Isamah
and Asagba. 2004). Asagba et al. (2010) examined induction of antioxidant defences
in fish in response to oxidative stress caused by heavy metals such as cadmium, which
are released into ponds, lakes and rivers in industrial effluents. They examined the
effect of the exposure to cadmium over time on the activities of AOX in the liver,
kidney and gills and xanthine oxidase in the liver of the catfish (Clarias gariepinus),
using benzaldehyde and xanthine as substrate respectively(see Table 19). Asagba et
al. (2010) was found the cadmium inhibited the activity of AOX and xanthine XOR in
the liver, gill and kidney of catfish. They found the activity of AOX in liver decreased
35.7-fold, kidney with 7 day exposure decreased 2.23-fold and 21 day exposure
decreased 1.62-foldand gills with 7 day exposure decreased 3.28-fold and 21 day
exposure decreased 1.88-fold, while XO in kidney with 7 day exposure decreased
1.42-fold and 21 day exposure decreased 1.99-fold decreased and gills with 7 day
exposure decreased 2.33-fold and 21 day exposure decreased 2.28-fold (Asagba et al.,
2010). Hegazi et al. (2010) examined the induction of AOX and XO in liver with
phthalazine and xanthine as substrates respectively in liver and white muscle of
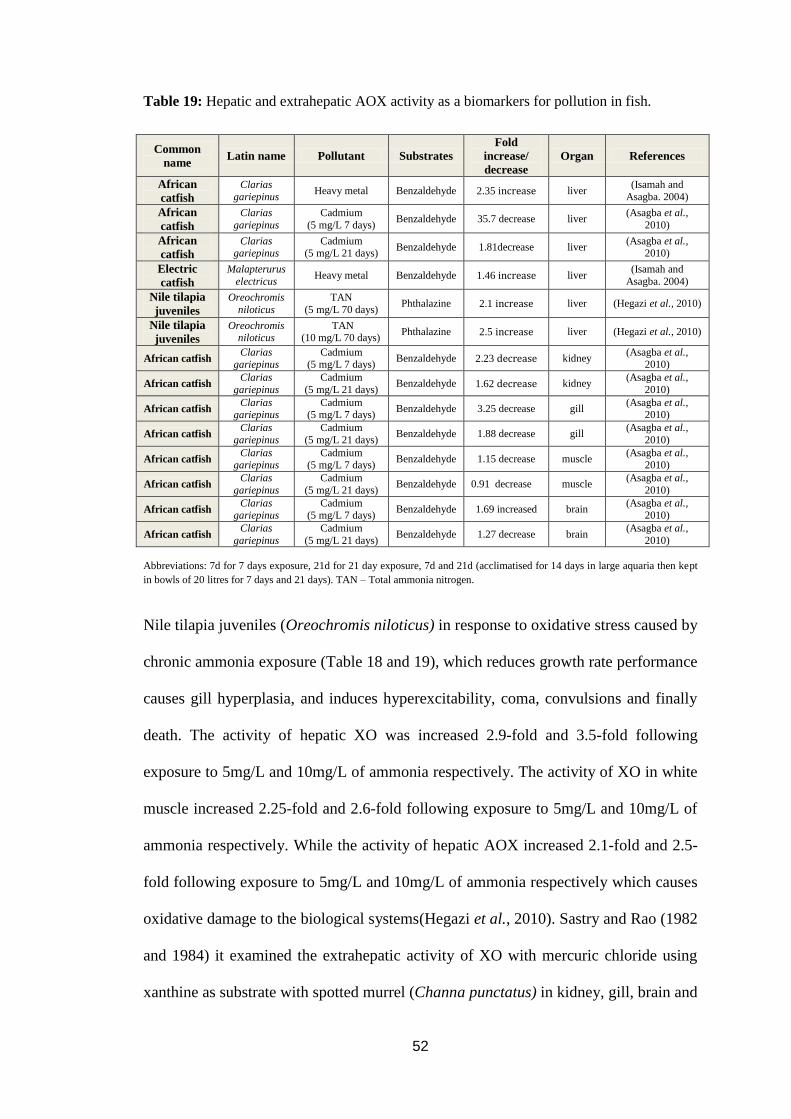
52
Table 19: Hepatic and extrahepatic AOX activity as a biomarkers for pollution in fish.
Common
name Latin name Pollutant Substrates
Fold
increase/
decrease
Organ References
African
catfish
Clarias
gariepinus Heavy metal Benzaldehyde 2.35 increase liver
(Isamah and
Asagba. 2004)
African
catfish
Clarias
gariepinus
Cadmium
(5 mg/L 7 days) Benzaldehyde 35.7 decrease liver
(Asagba et al.,
2010)
African
catfish
Clarias gariepinus
Cadmium (5 mg/L 21 days)
Benzaldehyde 1.81decrease liver (Asagba et al.,
2010)
Electric
catfish
Malapterurus
electricus Heavy metal Benzaldehyde 1.46 increase liver
(Isamah and
Asagba. 2004)
Nile tilapia
juveniles
Oreochromis
niloticus
TAN
(5 mg/L 70 days) Phthalazine 2.1 increase liver (Hegazi et al., 2010)
Nile tilapia
juveniles
Oreochromis niloticus
TAN (10 mg/L 70 days)
Phthalazine 2.5 increase liver (Hegazi et al., 2010)
African catfish Clarias
gariepinus Cadmium
(5 mg/L 7 days) Benzaldehyde 2.23 decrease kidney
(Asagba et al., 2010)
African catfish Clarias
gariepinus
Cadmium
(5 mg/L 21 days) Benzaldehyde 1.62 decrease kidney
(Asagba et al.,
2010)
African catfish Clarias
gariepinus Cadmium
(5 mg/L 7 days) Benzaldehyde 3.25 decrease gill
(Asagba et al., 2010)
African catfish Clarias
gariepinus
Cadmium
(5 mg/L 21 days) Benzaldehyde 1.88 decrease gill
(Asagba et al.,
2010)
African catfish Clarias
gariepinus Cadmium
(5 mg/L 7 days) Benzaldehyde 1.15 decrease muscle
(Asagba et al., 2010)
African catfish Clarias
gariepinus
Cadmium
(5 mg/L 21 days) Benzaldehyde 0.91 decrease muscle
(Asagba et al.,
2010)
African catfish Clarias
gariepinus Cadmium
(5 mg/L 7 days) Benzaldehyde 1.69 increased brain
(Asagba et al., 2010)
African catfish Clarias
gariepinus
Cadmium
(5 mg/L 21 days) Benzaldehyde 1.27 decrease brain
(Asagba et al.,
2010)
Abbreviations: 7d for 7 days exposure, 21d for 21 day exposure, 7d and 21d (acclimatised for 14 days in large aquaria then kept
in bowls of 20 litres for 7 days and 21 days). TAN – Total ammonia nitrogen.
Nile tilapia juveniles (Oreochromis niloticus) in response to oxidative stress caused by
chronic ammonia exposure (Table 18 and 19), which reduces growth rate performance
causes gill hyperplasia, and induces hyperexcitability, coma, convulsions and finally
death. The activity of hepatic XO was increased 2.9-fold and 3.5-fold following
exposure to 5mg/L and 10mg/L of ammonia respectively. The activity of XO in white
muscle increased 2.25-fold and 2.6-fold following exposure to 5mg/L and 10mg/L of
ammonia respectively. While the activity of hepatic AOX increased 2.1-fold and 2.5-
fold following exposure to 5mg/L and 10mg/L of ammonia respectively which causes
oxidative damage to the biological systems(Hegazi et al., 2010). Sastry and Rao (1982
and 1984) it examined the extrahepatic activity of XO with mercuric chloride using
xanthine as substrate with spotted murrel (Channa punctatus) in kidney, gill, brain and
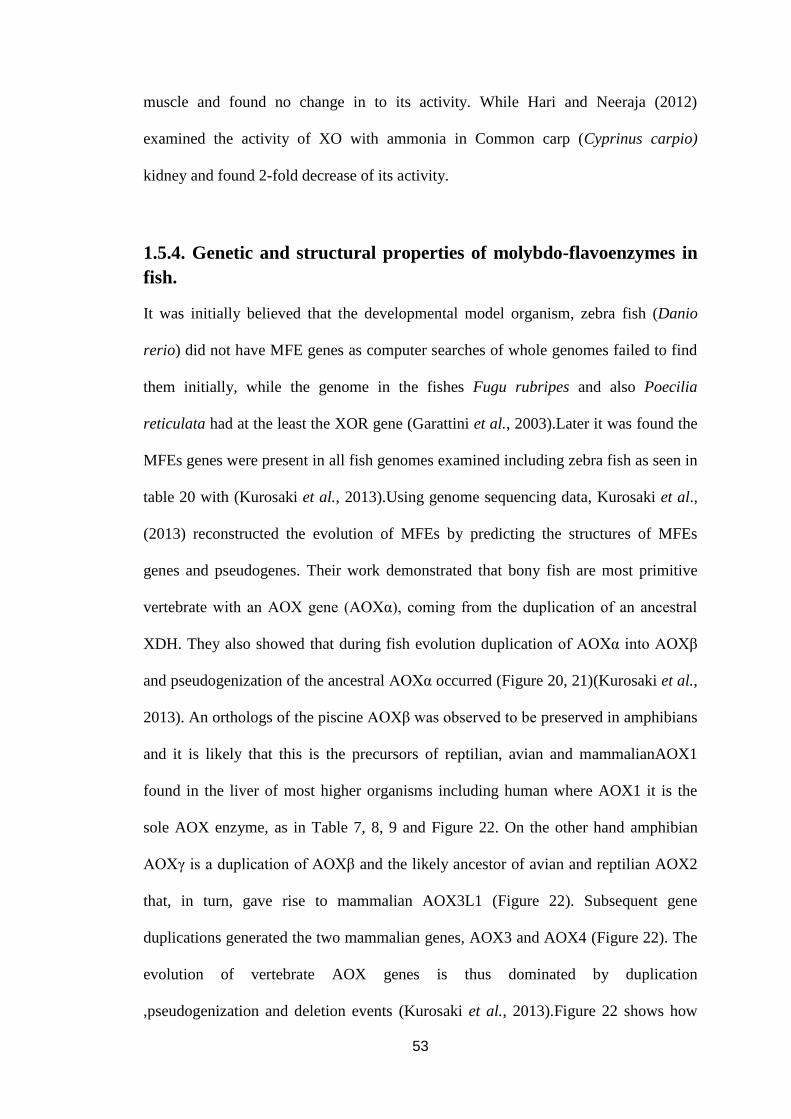
53
muscle and found no change in to its activity. While Hari and Neeraja (2012)
examined the activity of XO with ammonia in Common carp (Cyprinus carpio)
kidney and found 2-fold decrease of its activity.
1.5.4. Genetic and structural properties of molybdo-flavoenzymes in
fish.
It was initially believed that the developmental model organism, zebra fish (Danio
rerio) did not have MFE genes as computer searches of whole genomes failed to find
them initially, while the genome in the fishes Fugu rubripes and also Poecilia
reticulata had at the least the XOR gene (Garattini et al., 2003).Later it was found the
MFEs genes were present in all fish genomes examined including zebra fish as seen in
table 20 with (Kurosaki et al., 2013).Using genome sequencing data, Kurosaki et al.,
(2013) reconstructed the evolution of MFEs by predicting the structures of MFEs
genes and pseudogenes. Their work demonstrated that bony fish are most primitive
vertebrate with an AOX gene (AOXα), coming from the duplication of an ancestral
XDH. They also showed that during fish evolution duplication of AOXα into AOXβ
and pseudogenization of the ancestral AOXα occurred (Figure 20, 21)(Kurosaki et al.,
2013). An orthologs of the piscine AOXβ was observed to be preserved in amphibians
and it is likely that this is the precursors of reptilian, avian and mammalianAOX1
found in the liver of most higher organisms including human where AOX1 it is the
sole AOX enzyme, as in Table 7, 8, 9 and Figure 22. On the other hand amphibian
AOXγ is a duplication of AOXβ and the likely ancestor of avian and reptilian AOX2
that, in turn, gave rise to mammalian AOX3L1 (Figure 22). Subsequent gene
duplications generated the two mammalian genes, AOX3 and AOX4 (Figure 22). The
evolution of vertebrate AOX genes is thus dominated by duplication
,pseudogenization and deletion events (Kurosaki et al., 2013).Figure 22 shows how

54
AOX and XDH genes evolved in different species of vertebrates. Table 20
summarises our current knowledge of AOX and XDH genes and pseudogenes in fish,
amphibians, reptiles, birds and mammals (Kurosaki et al., 2013).

55
Figure 20: Summary of AOX and XDH genes in fish. Based on Kurosaki et al., 2013. The green colour indicates XDH genes, the yellow colour indicates AOXβ genes
and red colour indicates AOXαgenes. The numbers above the genes indicate the exons present and the crosses (X) indicate inactive pseudogenes that have exons missing.
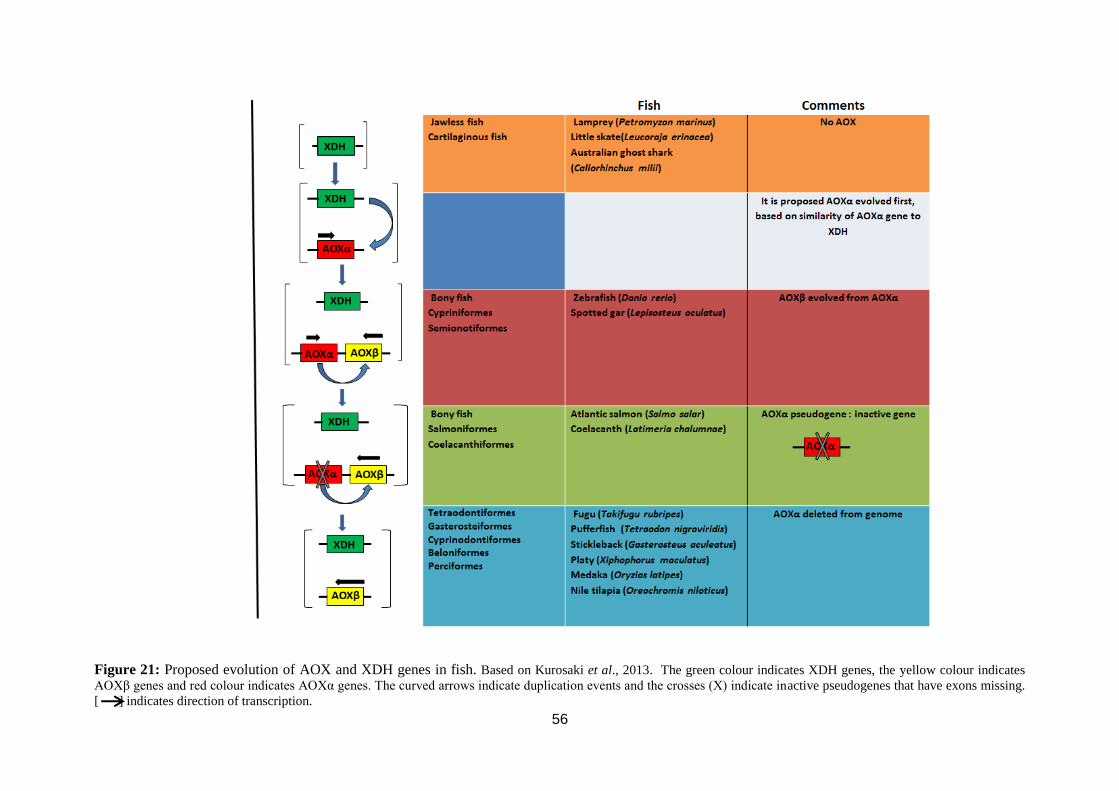
56
Figure 21: Proposed evolution of AOX and XDH genes in fish. Based on Kurosaki et al., 2013. The green colour indicates XDH genes, the yellow colour indicates
AOXβ genes and red colour indicates AOXα genes. The curved arrows indicate duplication events and the crosses (X) indicate inactive pseudogenes that have exons missing.
[ ] indicates direction of transcription.

57
Figure 22: Summary of evolution of AOX and XDH genes in fishes, amphibians, reptiles, birds and mammals. Based on Kurosaki et al., 2013.The green colour
indicates XDH genes, the yellow colour indicates AOXβ and AOX1 genes, red colour indicates AOXα genes, blue colour indicates (AOX2) and the purple colour indicates
(AOXƐ gene).The curved arrows indicate duplication events and the crosses (X) indicate inactive pseudogenes that have exons missing.[ ] Indicates direction of
transcription.
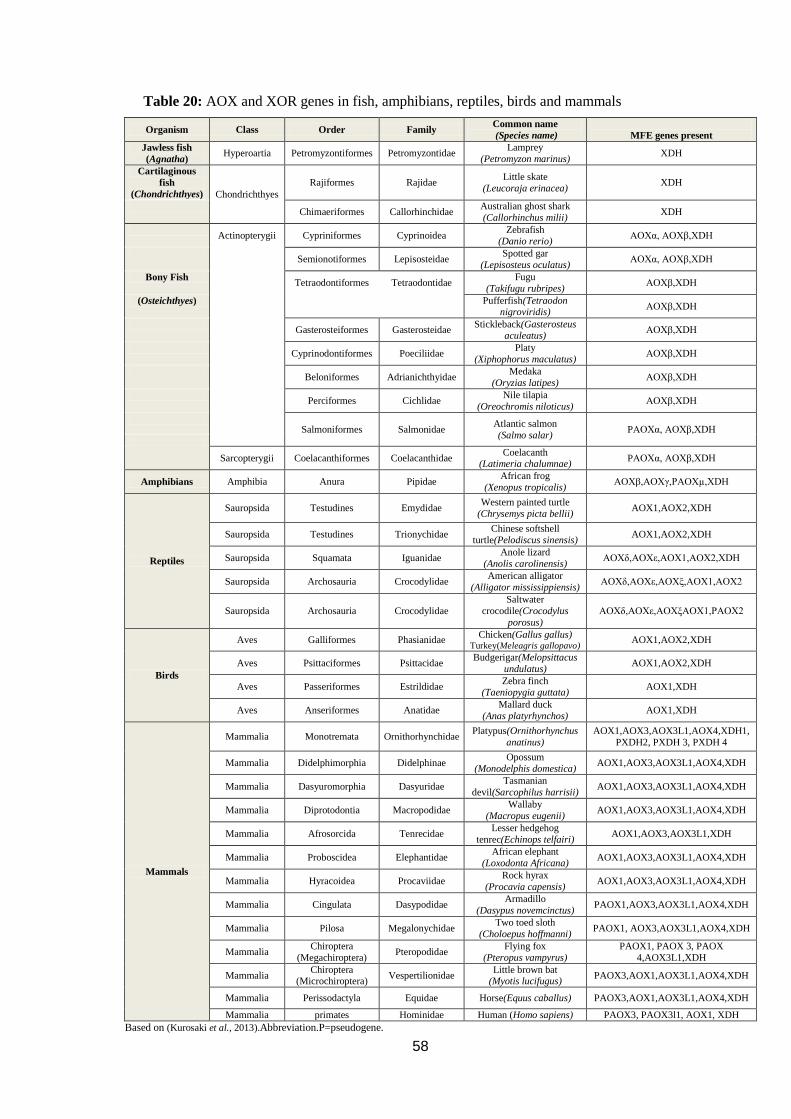
58
Table 20: AOX and XOR genes in fish, amphibians, reptiles, birds and mammals
Organism Class Order Family Common name
(Species name)
MFE genes present
Jawless fish
(Agnatha) Hyperoartia Petromyzontiformes Petromyzontidae
Lamprey
(Petromyzon marinus) XDH
Cartilaginous
fish
(Chondrichthyes) Chondrichthyes
Rajiformes Rajidae Little skate
(Leucoraja erinacea) XDH
Chimaeriformes Callorhinchidae
Australian ghost shark
(Callorhinchus milii) XDH
Actinopterygii Cypriniformes Cyprinoidea
Zebrafish
(Danio rerio) AOXα, AOXβ,XDH
Semionotiformes Lepisosteidae
Spotted gar
(Lepisosteus oculatus) AOXα, AOXβ,XDH
Bony Fish Tetraodontiformes Tetraodontidae
Fugu
(Takifugu rubripes) AOXβ,XDH
(Osteichthyes)
Pufferfish(Tetraodon nigroviridis)
AOXβ,XDH
Gasterosteiformes Gasterosteidae
Stickleback(Gasterosteus aculeatus)
AOXβ,XDH
Cyprinodontiformes Poeciliidae
Platy
(Xiphophorus maculatus) AOXβ,XDH
Beloniformes Adrianichthyidae
Medaka
(Oryzias latipes) AOXβ,XDH
Perciformes Cichlidae
Nile tilapia
(Oreochromis niloticus) AOXβ,XDH
Salmoniformes Salmonidae Atlantic salmon
(Salmo salar) PAOXα, AOXβ,XDH
Sarcopterygii Coelacanthiformes Coelacanthidae Coelacanth
(Latimeria chalumnae) PAOXα, AOXβ,XDH
Amphibians Amphibia Anura Pipidae African frog
(Xenopus tropicalis) AOXβ,AOXγ,PAOXµ,XDH
Reptiles
Sauropsida Testudines Emydidae Western painted turtle
(Chrysemys picta bellii) AOX1,AOX2,XDH
Sauropsida Testudines Trionychidae Chinese softshell
turtle(Pelodiscus sinensis) AOX1,AOX2,XDH
Sauropsida Squamata Iguanidae Anole lizard
(Anolis carolinensis) AOXδ,AOXε,AOX1,AOX2,XDH
Sauropsida Archosauria Crocodylidae American alligator
(Alligator mississippiensis) AOXδ,AOXε,AOXξ,AOX1,AOX2
Sauropsida Archosauria Crocodylidae
Saltwater
crocodile(Crocodylus
porosus)
AOXδ,AOXε,AOXξAOX1,PAOX2
Birds
Aves Galliformes Phasianidae Chicken(Gallus gallus)
Turkey(Meleagris gallopavo) AOX1,AOX2,XDH
Aves Psittaciformes Psittacidae Budgerigar(Melopsittacus
undulatus) AOX1,AOX2,XDH
Aves Passeriformes Estrildidae Zebra finch
(Taeniopygia guttata) AOX1,XDH
Aves Anseriformes Anatidae Mallard duck
(Anas platyrhynchos) AOX1,XDH
Mammals
Mammalia Monotremata Ornithorhynchidae Platypus(Ornithorhynchus
anatinus)
AOX1,AOX3,AOX3L1,AOX4,XDH1,
PXDH2, PXDH 3, PXDH 4
Mammalia Didelphimorphia Didelphinae Opossum
(Monodelphis domestica) AOX1,AOX3,AOX3L1,AOX4,XDH
Mammalia Dasyuromorphia Dasyuridae Tasmanian
devil(Sarcophilus harrisii) AOX1,AOX3,AOX3L1,AOX4,XDH
Mammalia Diprotodontia Macropodidae Wallaby
(Macropus eugenii) AOX1,AOX3,AOX3L1,AOX4,XDH
Mammalia Afrosorcida Tenrecidae Lesser hedgehog
tenrec(Echinops telfairi) AOX1,AOX3,AOX3L1,XDH
Mammalia Proboscidea Elephantidae African elephant
(Loxodonta Africana) AOX1,AOX3,AOX3L1,AOX4,XDH
Mammalia Hyracoidea Procaviidae Rock hyrax
(Procavia capensis) AOX1,AOX3,AOX3L1,AOX4,XDH
Mammalia Cingulata Dasypodidae Armadillo
(Dasypus novemcinctus) PAOX1,AOX3,AOX3L1,AOX4,XDH
Mammalia Pilosa Megalonychidae Two toed sloth
(Choloepus hoffmanni) PAOX1, AOX3,AOX3L1,AOX4,XDH
Mammalia Chiroptera
(Megachiroptera) Pteropodidae
Flying fox
(Pteropus vampyrus)
PAOX1, PAOX 3, PAOX
4,AOX3L1,XDH
Mammalia Chiroptera
(Microchiroptera) Vespertilionidae
Little brown bat (Myotis lucifugus)
PAOX3,AOX1,AOX3L1,AOX4,XDH
Mammalia Perissodactyla Equidae Horse(Equus caballus) PAOX3,AOX1,AOX3L1,AOX4,XDH
Mammalia primates Hominidae Human (Homo sapiens) PAOX3, PAOX3l1, AOX1, XDH
Based on (Kurosaki et al., 2013).Abbreviation.P=pseudogene.
59
1.6. Purification of aldehyde oxidase and xanthine oxidoreductase
enzymes.
MFEs have been purified from many different species with different methodologies as
summarised in the (Tables 21, 22 and 23). Tables 21 and 22 summarise purification
protocols for AOX from diverse number of organisms. Reviewing the literature on the
subject reveals that the initial step of purification of AOX is generally subcellular
fractionation to generate cytosol where the enzyme resides. A popular subsequent
purification method used for AOX is heat precipitation. This method can be a useful
step in the early stages of a purification scheme involving more heat stable proteins. It
is generally achieved by incubating the protein mixture at known temperature for 10
minute, then cool in ice for 15 minute, then centrifugation at high centrifuge for 15
minute. These results in the denaturation of the unwanted less stable proteins in the
mixture that are removed by precipitation. By this principle there can often by a 2-fold
purification of a heat stable protein in the supernatant fraction (Bonner. 2007).The
thermal stability of mammalian and Drosophila AOX has allowed this to be used
successfully in 15 out of 18 purification protocols. Temperatures used for these
purification protocols range from 50-68 °C with 50-55°C being the most common
temperature used (Table 21 and 22). Interestingly heat treatment (50 – 70 °C) is also
used in the purification of related MFEs, XOR (Table 23).
The next step commonly used in many AOX purification protocols is ammonium
sulphate fractionation (Table 21 and 22). In this method the solubility of proteins is
increased at low salt concentrations and is decreased at high salt concentrations. When
a salt such as ammonium sulphate is added to a protein solution, the ions in the
ammonium sulphate have a greater charge density than the proteins, they attract the

60
Species Tissue Enzyme Purification steps Molecular mass Substrates Fold purification a, b Yield % References
Guinea pig
(Cavia porcellus) Liver AOX
Cytosol, 30-50% (NH4)2SO4,
DEAE- cellulose,
FMN – sepharose 4B,
Sephacryl S-300
Native PAGE 300 kDa
SDS PAGE 148 kDa
2-hydroxypyrimidine,
N1-methylnicotinamide,
120
a 26 (Yoshihara and Tatsumi.
1985)
Hamster
(Hamster) Liver AOX
Cytosol, heat at 50 oC, 30-50%
(NH4)2SO4, DEAE-cellulose, phenyl-
Toyopearl, TSK-gel G3000SWXL
Native PAGE 288 kDa
SDS PAGE 145 kDa Benzaldehyde 89
a 12 (Sugihara et al., 1999)
Mouse
(Mus musculus) Liver AOH1 Cytosol, heat at 55 oC, 50% (NH4)2SO4,
Benzamidine sepharose 6B, MonoQ
SDSPAGE 147 kDa
Zymogram
MALDI-TOF MS
Phthalazine 173a 1.7 (Terao et al., 2001)
Mouse
(Mus musculus) Liver AOH2 Cytosol, heat at 55 oC, 50% (NH4)2SO4,
Benzamidine sepharose 6B, MonoQ
SDS PAGE 150 kDa
MALDI-TOF MS
Zymogram
All-trans retinaldehyde 346a 5 (Terao et al., 2009)
Mouse
(Mus musculus )
Nasal
epithelial
mucosa
AOH3 Cytosol, heat at 55 oC, 50% (NH4)2SO4,
MonoQ
SDS PAGE 150 kDa
MALDI-TOF MS
Zymogram
western blot
Phthalazine, All-trans
retinaldehyde,
Benzaldehyde,
2-hydroxypyrimidine,
Octanal
18a 26 (Kurosaki et al., 2004)
Mouse
(Mus musculus ) Liver AOX
Cytosol, 30-50% (NH4)2SO4,
Benzamidine sepharose 6B, DEAE-
cellulose
Native PAGE 265 kDa
SDS PAGE 138 kDa
Benzaldehyde, DMAC,
2-hydroxypyrimidine 140
a - (Yoshihara and Tatsumi.
1997)
Mouse
(Mus musculus) Liver AOX1
Cytosol, heat at 55 oC, 50%
(NH4)2SO4, Benzamidine sepharose
6B, MonoQ
SDS PAGE 150 kDa
MALDI-TOF MS
Zymogram,
western blot
Phthalazine 627a 3 (Vila et al., 2004)
Rat
(Rattus norvegicus) Liver AOX
Crude extract, heat at 55 oC, 60%
(NH4)2SO4, HTP column, Benzamidine
sepharose 6B, Sephadex G-25 column
Native PAGE 285 kDa
SDS PAGE 150 kDa DMAC 945
b 13 (Maia and Mira. 2002)
Abbreviation: p-dimethylaminocinnamaldehyde - DMAC a = from cytosol, b= from crud extract (homogenate)
Table 21: Summary of purification protocols for aldehyde oxidase from rodent species.
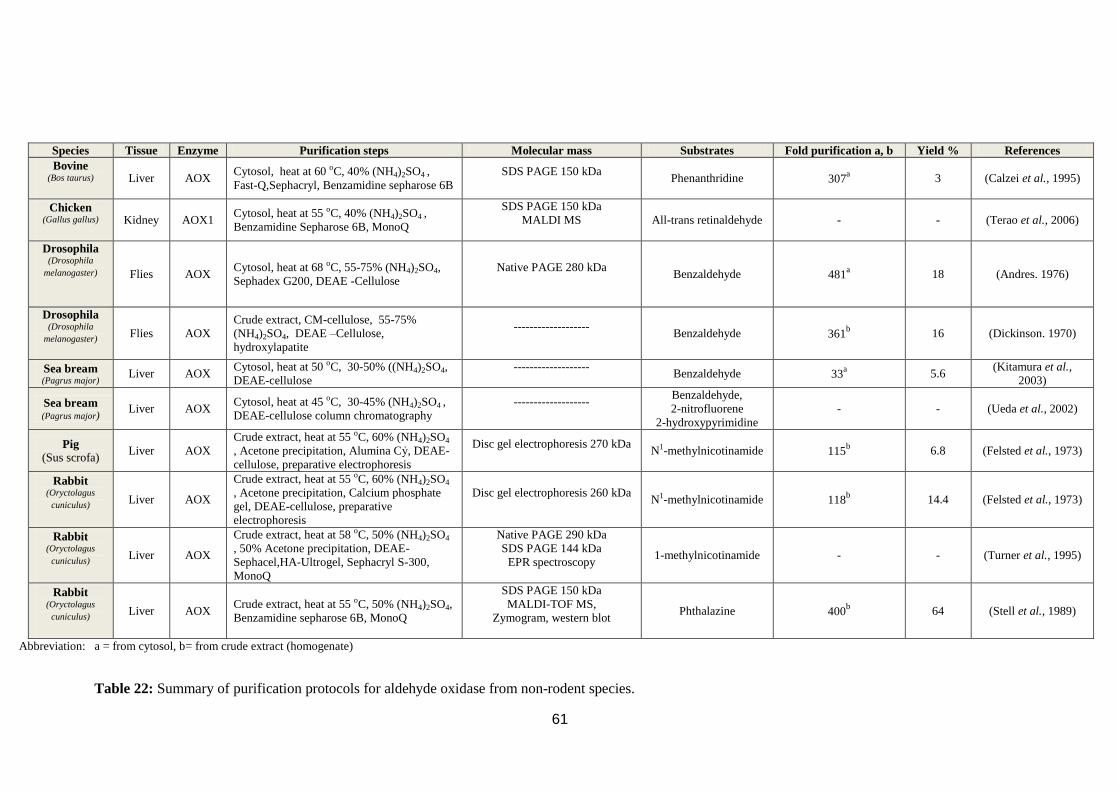
61
Species Tissue Enzyme Purification steps Molecular mass Substrates Fold purification a, b Yield % References
Bovine (Bos taurus) Liver AOX
Cytosol, heat at 60 oC, 40% (NH4)2SO4 ,
Fast-Q,Sephacryl, Benzamidine sepharose 6B
SDS PAGE 150 kDa
Phenanthridine 307
a 3 (Calzei et al., 1995)
Chicken (Gallus gallus) Kidney AOX1
Cytosol, heat at 55 oC, 40% (NH4)2SO4 ,
Benzamidine Sepharose 6B, MonoQ
SDS PAGE 150 kDa
MALDI MS
All-trans retinaldehyde - - (Terao et al., 2006)
Drosophila (Drosophila
melanogaster)
Flies AOX Cytosol, heat at 68 oC, 55-75% (NH4)2SO4,
Sephadex G200, DEAE -Cellulose
Native PAGE 280 kDa
Benzaldehyde 481
a 18 (Andres. 1976)
Drosophila (Drosophila
melanogaster) Flies AOX
Crude extract, CM-cellulose, 55-75%
(NH4)2SO4, DEAE –Cellulose,
hydroxylapatite
-------------------
Benzaldehyde 361
b 16 (Dickinson. 1970)
Sea bream (Pagrus major)
Liver AOX Cytosol, heat at 50 oC, 30-50% ((NH4)2SO4,
DEAE-cellulose
-------------------
Benzaldehyde 33
a 5.6
(Kitamura et al.,
2003)
Sea bream (Pagrus major)
Liver AOX Cytosol, heat at 45 oC, 30-45% (NH4)2SO4 ,
DEAE-cellulose column chromatography
-------------------
Benzaldehyde,
2-nitrofluorene
2-hydroxypyrimidine
-
-
(Ueda et al., 2002)
Pig
(Sus scrofa) Liver AOX
Crude extract, heat at 55 oC, 60% (NH4)2SO4
, Acetone precipitation, Alumina Cỷ, DEAE-
cellulose, preparative electrophoresis
Disc gel electrophoresis 270 kDa
N1-methylnicotinamide 115
b 6.8 (Felsted et al., 1973)
Rabbit (Oryctolagus
cuniculus) Liver AOX
Crude extract, heat at 55 oC, 60% (NH4)2SO4
, Acetone precipitation, Calcium phosphate
gel, DEAE-cellulose, preparative
electrophoresis
Disc gel electrophoresis 260 kDa
N1-methylnicotinamide 118
b 14.4 (Felsted et al., 1973)
Rabbit (Oryctolagus
cuniculus) Liver AOX
Crude extract, heat at 58 oC, 50% (NH4)2SO4
, 50% Acetone precipitation, DEAE-
Sephacel,HA-Ultrogel, Sephacryl S-300,
MonoQ
Native PAGE 290 kDa
SDS PAGE 144 kDa
EPR spectroscopy
1-methylnicotinamide - - (Turner et al., 1995)
Rabbit (Oryctolagus
cuniculus) Liver AOX
Crude extract, heat at 55 oC, 50% (NH4)2SO4,
Benzamidine sepharose 6B, MonoQ
SDS PAGE 150 kDa
MALDI-TOF MS,
Zymogram, western blot
Phthalazine 400b
64 (Stell et al., 1989)
Abbreviation: a = from cytosol, b= from crude extract (homogenate)
Table 22: Summary of purification protocols for aldehyde oxidase from non-rodent species.
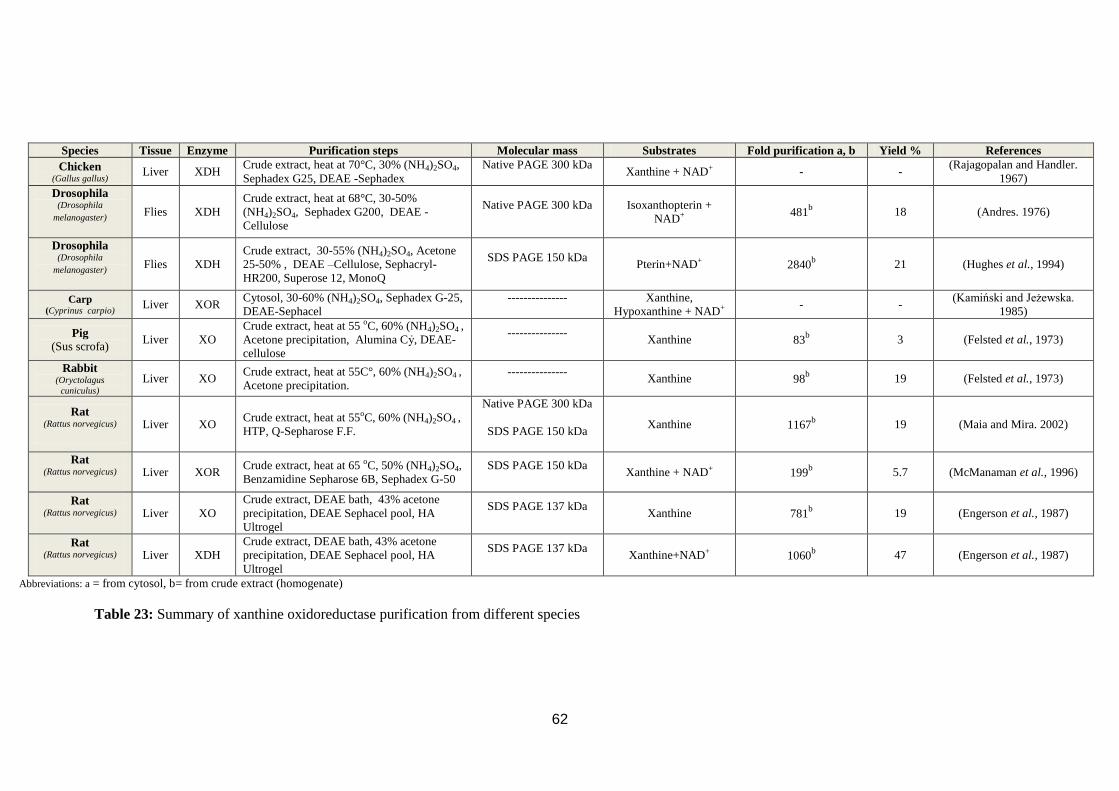
62
Species Tissue Enzyme Purification steps Molecular mass Substrates Fold purification a, b Yield % References
Chicken (Gallus gallus)
Liver XDH Crude extract, heat at 70°C, 30% (NH4)2SO4,
Sephadex G25, DEAE -Sephadex
Native PAGE 300 kDa
Xanthine + NAD+ - -
(Rajagopalan and Handler.
1967)
Drosophila (Drosophila
melanogaster) Flies XDH
Crude extract, heat at 68°C, 30-50%
(NH4)2SO4, Sephadex G200, DEAE -
Cellulose
Native PAGE 300 kDa
Isoxanthopterin +
NAD+ 481
b 18 (Andres. 1976)
Drosophila (Drosophila
melanogaster) Flies XDH
Crude extract, 30-55% (NH4)2SO4, Acetone
25-50% , DEAE –Cellulose, Sephacryl-
HR200, Superose 12, MonoQ
SDS PAGE 150 kDa
Pterin+NAD+ 2840
b 21 (Hughes et al., 1994)
Carp (Cyprinus carpio) Liver XOR
Cytosol, 30-60% (NH4)2SO4, Sephadex G-25,
DEAE-Sephacel
---------------
Xanthine,
Hypoxanthine + NAD+ - -
(Kamiński and Jeżewska.
1985)
Pig
(Sus scrofa) Liver XO
Crude extract, heat at 55 oC, 60% (NH4)2SO4 ,
Acetone precipitation, Alumina Cỷ, DEAE-
cellulose
---------------
Xanthine 83
b 3 (Felsted et al., 1973)
Rabbit (Oryctolagus
cuniculus)
Liver XO Crude extract, heat at 55C°, 60% (NH4)2SO4 ,
Acetone precipitation.
---------------
Xanthine 98
b 19 (Felsted et al., 1973)
Rat (Rattus norvegicus) Liver XO
Crude extract, heat at 55oC, 60% (NH4)2SO4 ,
HTP, Q-Sepharose F.F.
Native PAGE 300 kDa
SDS PAGE 150 kDa
Xanthine 1167b
19 (Maia and Mira. 2002)
Rat (Rattus norvegicus) Liver XOR
Crude extract, heat at 65 oC, 50% (NH4)2SO4,
Benzamidine Sepharose 6B, Sephadex G-50
SDS PAGE 150 kDa
Xanthine + NAD+ 199
b 5.7 (McManaman et al., 1996)
Rat (Rattus norvegicus) Liver XO
Crude extract, DEAE bath, 43% acetone
precipitation, DEAE Sephacel pool, HA
Ultrogel
SDS PAGE 137 kDa
Xanthine 781
b 19 (Engerson et al., 1987)
Rat (Rattus norvegicus) Liver XDH
Crude extract, DEAE bath, 43% acetone
precipitation, DEAE Sephacel pool, HA
Ultrogel
SDS PAGE 137 kDa
Xanthine+NAD+
1060b
47 (Engerson et al., 1987)
Abbreviations: a = from cytosol, b= from crude extract (homogenate)
Table 23: Summary of xanthine oxidoreductase purification from different species
63
water molecules away from the surfaces of the proteins. This exposes hydrophobic
patches on the proteins causing them to interact with each other forming inter-protein
complexes. When a protein complex becomes too large it comes out of solution as a
precipitate (Bonner. 2007). In all 18 protocols for AOX purification, ammonium
sulphate fractionation has been used as an enrichment step prior to chromatography
(Table 21 and 22). Sometimes a single ammonium sulphate fractionation is used but
some protocols use two steps of ammonium sulphate fractionation to generate a
narrower precipitation range (Table 21 and 22). Ammonium sulphate fractionation
used for the purification protocols of AOX range from 30-75 % saturation with 30-50
% saturation being the most common ammonium sulphate fractionation used.
With regards chromatography steps, four types of chromatography media have been
used in the purification of AOXs namely ion exchange, gel filtration, hydrophobic
interaction and affinity chromatography.
For AOX purification anion exchange media is the preferred ion exchange
chromatography reagent used to separate negatively charged proteins. The molecular
basis of this chromatography is that the resin in anion exchange columns contains
cationic (positively charged) sites to bind proteins with a net negative charge. The
bound proteins are then eluted by gradually increasing the salt concentration of the
eluting buffer. A typical elution used is a gradient of 0 – 1M NaCL(Bonner. 2007).
Anion exchange has been used in 10 out of 18 AOX purification protocols with
DEAE-cellulose, 7 out of 18 AOX purification protocols with Mono-Q and 1 out of
18 AOX purification protocols with FAST-Q media being used. Anion exchange has
been used in the purification of the related enzyme XOR (Table 23).

64
Gel filtration that separates molecules on the basis of their differences in size and
shape have been used in 4 out of 18 AOX purification protocols (Table 21 and 22).
Affinity chromatography that separates proteins on the basis of a reversible interaction
between a protein or group of proteins and a specific ligand have been used in 9 out of
18 AOX purification protocols (Table 21 and 22). 8 out of 18 AOX purification
protocols were with benzamidine sepharose 6B media being used on the basis of
benzamidine being a competitive inhibitor of AOX (Table 21 and 22) (Stell et al.,
1989).
A literature survey (Table 21 and 22) reveals that to obtain a homogeneous
preparation of AOX as assessed by SDS-PAGE or mass spectrometry generally the
enrichment factor from liver is 89 – 2840 folds (Table 21 and 22). In order to achieve
this yields range from 1.7 – 64 % (Table 21 and 22) liver AOX.
With regards substrates used to monitor the purification of AOX the most popular are
2-hydroxypyrimidine, N1-methylnicotinamide, benzaldehyde, phthalazine, all-trans
retinaldehyde, octanal, p-dimethylaminocinnamaldehyde (DMAC), phenanthridine
and 2-nitrofluorene (Table 21 and 22). In these assays which are generally
spectrophotometric some investigations do not directly measure substrate or product.
These indirect assays use artificial electron acceptors such as dichloroindophenol
(DCIP) and ferricyanide (Table 21 and 22).
With regards determining the native molecular mass of AOX, gel filtration has been
used in 23 out of 28 protocols to determine this native molecular mass of purified
enzyme preparations. These range from 212 – 300 kDa (Tables 21, 22 and 23).

65
1.7. Aims of the project.
As indicated in the introduction the study of MFEs in fish has received much less
attention than their mammalian counterparts. Of particular interest for aquatic
organisms is a group of nitrogen containing polycyclic aromatic hydrocarbons
(NPAHs) and their metabolites that are found as aquatic environmental pollutants
(Blumer et al., 1977, Balch et al., 1995, Osborne et al., 1997, de Voogt and Laane.
2009) are AOX substrates that are cytotoxic, embryotoxic, teratogenic, genotoxic and
carcinogenic (Southworth et al., 1979, Balch et al., 1995, Jung et al., 2001, Barron et
al., 2004, Peddinghaus et al., 2012, Brinkmann et al., 2014). These include AOX
substrates such as phenanthridine, quinoline, isoquinoline, hydroxyisoquinolines,
cinchonine, phthalazine, hydroxyphthalazines, quinazoline, hydroxyquinazolines and
acridine (Rajagopalan and Handler. 1964b, Palmer et al., 1969, Krenitsky et al., 1972,
McCormack et al., 1978, Stubley et al., 1979, Stubley and Stell. 1980, McMurtrey and
Knight. 1984, Beedham et al., 1992, Robertson and Bland. 1993, Rashidi. 1996,
Schofield et al., 2000, Beedham. 2001, Al-Tayib. 2009, Pryde et al., 2010, Barr and
Jones. 2013, Mu et al., 2014).
Despite NPAHs being important aquatic pollutants to date only one of these,
phthalazine, has been investigated as an AOX substrate in a fish species ( Nile tilapia
juveniles (Oreochromis niloticus)) (Hegazi et al., 2010).
The species focussed on in this research project and aims of this study are as follows:
Rainbow trout (Oncorhynchus mykiss) was the focus of this study for several reasons.
Rainbow trout is a member of the Salmonidae family, are widely distributed fish
species cultured in regions with cold and cool water temperatures around the world
(Harvey. 2004). They are important food and sport fish and the most cultivated cold
66
freshwater fish in the US, Canada and European countries (Wolf and Rumsey. 1985).
Due to its economic importance and ease of availability of tissue it is one of the most
rigorously studied fishes in many research areas including carcinogenesis, toxicology,
comparative immunology, disease ecology, physiology and nutrition (Behnke. 1992).
With regards MFEs rainbow trout belongs to a class of fish Salmonidae, that have a
single active AOX gene (AOXβ) that is the ancestral AOX gene that gave rise to
AOX1 the predominant hepatic AOX in rodents and the only AOX in
humans(Kurosaki et al., 2013). Despite the aforementioned reasons for studying AOX
in a Salmoniforme there has been no study to date (Tables 10, 11 and 12).
(a) The initial aim was to compare the biotransformation of endogenous and
exogenous substrates by AOX and XOR in rainbow trout, rat and human.
(b) Up until now there has been no published work on any fish AOX and XOR with
Km and Vmax measurements. An aim was therefore to determine the Km and Vmax
for MFEs in rainbow trout and compare it with results in rat and human using
spectrophotometric and HPLC assays.
(c) An additional aim of this project was to determine if environmental pollutants,
drugs and estrogens might inhibit AOX in fish.
(d) As there has been no report of the purification of any piscine AOX to
homogeneity, another goal was to purify the AOX enzyme from rainbow trout liver to
examine its molecular characteristics.

67
2.0. Materials and methods.
All reagents and chemicals were obtained from Fisher Scientific and Sigma / Aldrich
Chemical Company Ltd, Poole, UK. Solvents and mobile phase reagents were
obtained from different companies but were all for HPLC grade purity. The control of
substances hazardous to health (COSHH) risk assessment for all reagents and
chemicals were prepared before experiments were initiated.
Male Wistar rats (Rattus norvegicus) and male New Zealand white rabbit liver cytosol
were obtained from the biomedical services unit, University of Dundee (Dr
D.J.Clarke). Pooled human liver cytosol was obtained from Invitrogen Ltd. Immature
rainbow trout (Oncorhynchus mykiss) liver was obtained from Pennine Trout Farm
and Fishery, Calderbrook Road, Littleborough OL15 9HL, UK.
2.1. In vitro analysis of molybdo-flavoenzyme activity.
2.1.1. Preparation of cytosol.
For the preparation of cytosol all steps were carried out at 0 – 4°C. Approximately 10
g of liver, kidney and gill were weighed out and homogenised in 40 ml of cold buffer
(0.25 M sucrose, 10 mM Tris HCL pH 7.4) with a motor-driven tissue mortar fitted
with a Teflon pestle (clearance 0.15-0.23mm, speed 10000 rpm and 5 minute
duration) to produce a 25% w/v homogenate. The homogenate was then centrifuged at
4°C for 15 minutes at 10,000 xg, to pellet out the nuclear/mitochondrial fractions of
the homogenate. The supernatant was then removed and centrifuged for a further 60
minutes at 4°C at 105,000 xg to obtain the cytosolic fraction. This fraction was then
collected and separated into 0.5 ml aliquots and stored at -80°C.

68
2.1.2. Gel filtration of cytosol.
Gel filtration of cytosol was carried out in order to remove endogenous small
molecules, such as endogenous substrates and inhibitors, which may interfere with
enzyme assays. A PD-10 gel filtration column was used (GE Healthcare Bio-Science,
UK). Prior to use the column was allowed to drain before being equilibrated with 25
ml (5 column volumes) 50 mM Tris HCL pH 7.4. 2.5 ml of cytosol was then loaded
onto the column and eluted with 3.5 ml of 50 mM Tris HCL pH 7.4, the protein
containing fraction was then collected, pooled and aliquoted into 0.5 ml fractions in
1.5 ml polypropylene Eppendorf tubes to avoid repeated freeze/thawing and stored at -
80°C.
2.2. Protein determination.
The amount of protein in each sample was calculated using a modification of the
method described by Smith et al. using bovine serum albumin (BSA) as standard
(Smith et al., 1985). The bicinchoninic acid (BCA) based assay is available as a kit
from Sigma-Aldrich Co.
2.2.1. Bicinchoninic acid reagents.
a) 1000 ml solution containing bicinchoninic acid (40 g), sodium carbonate (Na2CO3)
(8 g), sodium tartrate (Na2C4H4O6 )(16 g) and sodium bicarbonate (NaHCO3 ) (9.5 g)
in 0.1N NaOH (final pH 11.25).Purchased from Sigma- Aldrich Co.
b) 25 ml solution containing 4% w/v copper sulphate pentahydrate (CuSO4.
5H2O).For preparing of a set protein standards a 1mg/ml stock solution of bovine
serum albumin (BSA) was prepared. This was then used to make the dilutions for the
calibration curve as shown in (Table 24).

69
Table 24. Preparation of protein calibration standards
Final protein concentration
(mg/mL) Volume BSA stock solution
(µl) Distilled water
(µl)
0
0.2
0.4
0.6
0.8
1.0
0
20
40
60
80
100
100
80
60
40
20
0
2.2.2. Bicinchoninic acid methodology.
a) The required amount of protein determination reagent was prepared by adding 1
part CuSO4. 5H2O 4% w/v solution to 50 parts bicinchoninic acid solution.
b) Bovine serum albumin standards or 1 in 20 dilution gel-filtered cytosol (20 µl
cytosol + 380 µl PBS) were prepared in duplicate.
c) 300 µl of freshly protein determination reagent was added to 15 µl of diluted
cytosol or protein standard and vortexed.
d) All tubes were incubated at 37°C for 30 minutes.
e) The absorbance at 562 nm was then measured on a microplate reader and distilled
water was used to zero the instrument.
2.3. Preparation of substrate stocks.
5 mM individual stock solution of AOX and XOR substrates and corresponding
metabolites were prepared with appropriate solvent as indicated in (Table 25). After
preparing the stock solutions, working standard solutions of 1 mM were prepared by
dilution with water.
ml/min

70
Table 25: List of stock substrates, products and solvent used to prepare them.
Substrate and product
(5mM stock solution) Comment AOX and XOR Solvent/treatment
Allopurinol Hyperuricemia drug AOX/XOR 10 mM NaOH
/sonicating
Oxipurinol Allopurinol metabolite AOX/XOR 10 mM NaOH
/sonicating
All-trans retinal Vitamin A AOX Absolute ethanol
Retinoic acid Vitamin A metabolite AOX Absolute ethanol
Cinchonine Anti-malarial drug AOX
dissolve in minimum
volume of 0.1M HC
then dH2O added
DMAC Colouring dye AOX Absolute ethanol
6-mercaptopurine Anti-cancer drug AOX/XOR 10 mM NaOH
/sonicating
6-thiouric acid 6-mercaptopurine
metabolite AOX/XOR
10 mM NaOH
/sonicating
1-methylxanthine Purine metabolism XOR 10 mM NaOH
/sonicating
1-methyl uric acid 1-methylxanthine
metabolite XOR
10 mM NaOH
/sonicating
N1- methylnicotinamide
Endogenous vitamin
metabolite AOX dH2O /sonicating
Phenanthridine Environmental pollutant AOX Absolute ethanol
Phenanthridone Phenanthridine metabolite AOX Absolute ethanol
Phthalazine Environmental pollutants AOX
Absolute ethanol
Phthalazinone Phthalazine metabolite AOX
Absolute ethanol
Pyrazinamide Tuberculosis drug
AOX/XOR 10 mM NaOH
/sonicating
Pyridoxal Vitamin B6 AOX
dissolve in minimum
volume of absolute
ethanol then dH2O
added
6-pyridoxic acid Pyridoxal metabolite AOX
dissolve in minimum
volume of absolute
ethanol then dH2O
added
Vanillin Food constituent AOX dH2O /heated to 700C
Vanillic acid Vanillin metabolite AOX dH2O /heated to 700C
Xanthine Purine metabolism XOR 10 mM NaOH
/sonicating
Uric acid Xanthine metabolite XOR 10 mM
NaOH/Sonicating
Abbreviation: DMAC – dimethylaminocinnamaldehyde.
2.4. Spectrophotometric determination of aldehyde oxidase activity.
AOX assays were performed with 40µl of gel filtered cytosol, 10µl of 1mM of
substrate (dimethylaminocinnamaldehyde (DMAC), phenanthridine or vanillin) and
50µl Tris HCL pH 7.4 at 37°C. Spectrophotometric molybdo-flavoenzyme assays
were conducted by using a microplate spectrophotometer (BioTek) at 37ºC. All assays
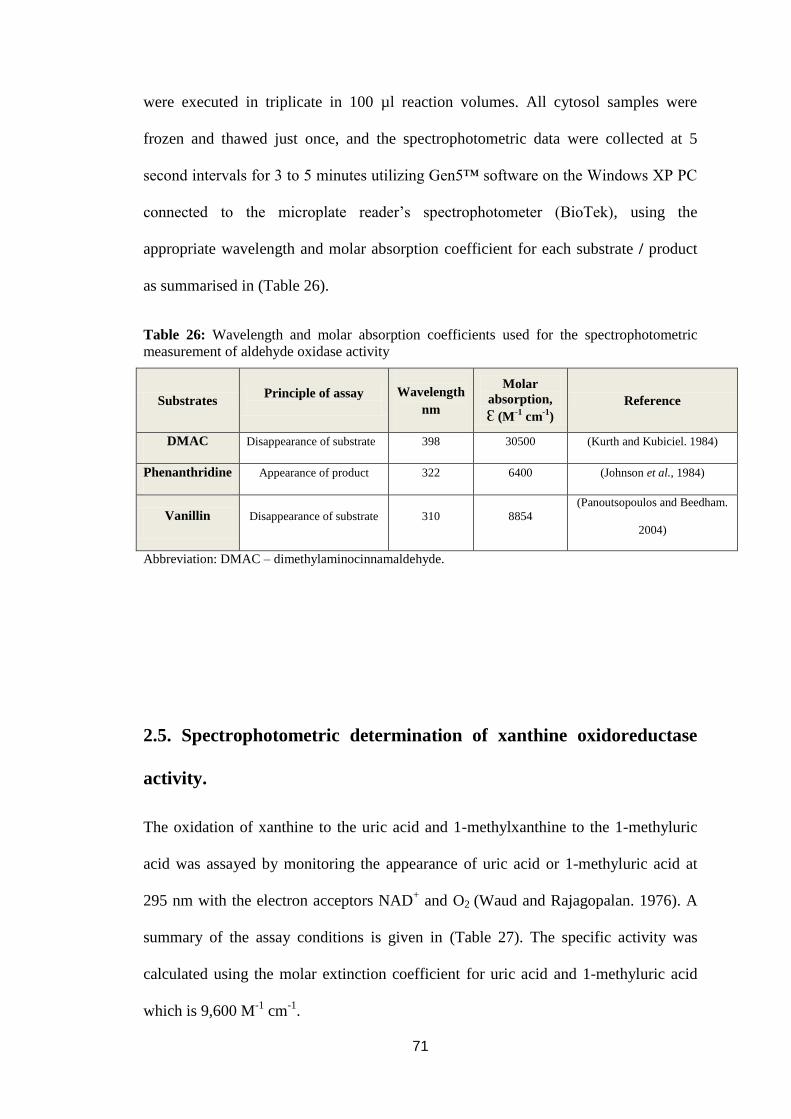
71
were executed in triplicate in 100 µl reaction volumes. All cytosol samples were
frozen and thawed just once, and the spectrophotometric data were collected at 5
second intervals for 3 to 5 minutes utilizing Gen5™ software on the Windows XP PC
connected to the microplate reader’s spectrophotometer (BioTek), using the
appropriate wavelength and molar absorption coefficient for each substrate / product
as summarised in (Table 26).
Table 26: Wavelength and molar absorption coefficients used for the spectrophotometric
measurement of aldehyde oxidase activity
Substrates Principle of assay
Wavelength
nm
Molar
absorption,
Ɛ (M-1
cm-1
)
Reference
DMAC Disappearance of substrate 398 30500 (Kurth and Kubiciel. 1984)
Phenanthridine Appearance of product 322 6400 (Johnson et al., 1984)
Vanillin Disappearance of substrate 310 8854
(Panoutsopoulos and Beedham.
2004)
Abbreviation: DMAC – dimethylaminocinnamaldehyde.
2.5. Spectrophotometric determination of xanthine oxidoreductase
activity.
The oxidation of xanthine to the uric acid and 1-methylxanthine to the 1-methyluric
acid was assayed by monitoring the appearance of uric acid or 1-methyluric acid at
295 nm with the electron acceptors NAD+ and O2 (Waud and Rajagopalan. 1976). A
summary of the assay conditions is given in (Table 27). The specific activity was
calculated using the molar extinction coefficient for uric acid and 1-methyluric acid
which is 9,600 M-1
cm-1
.
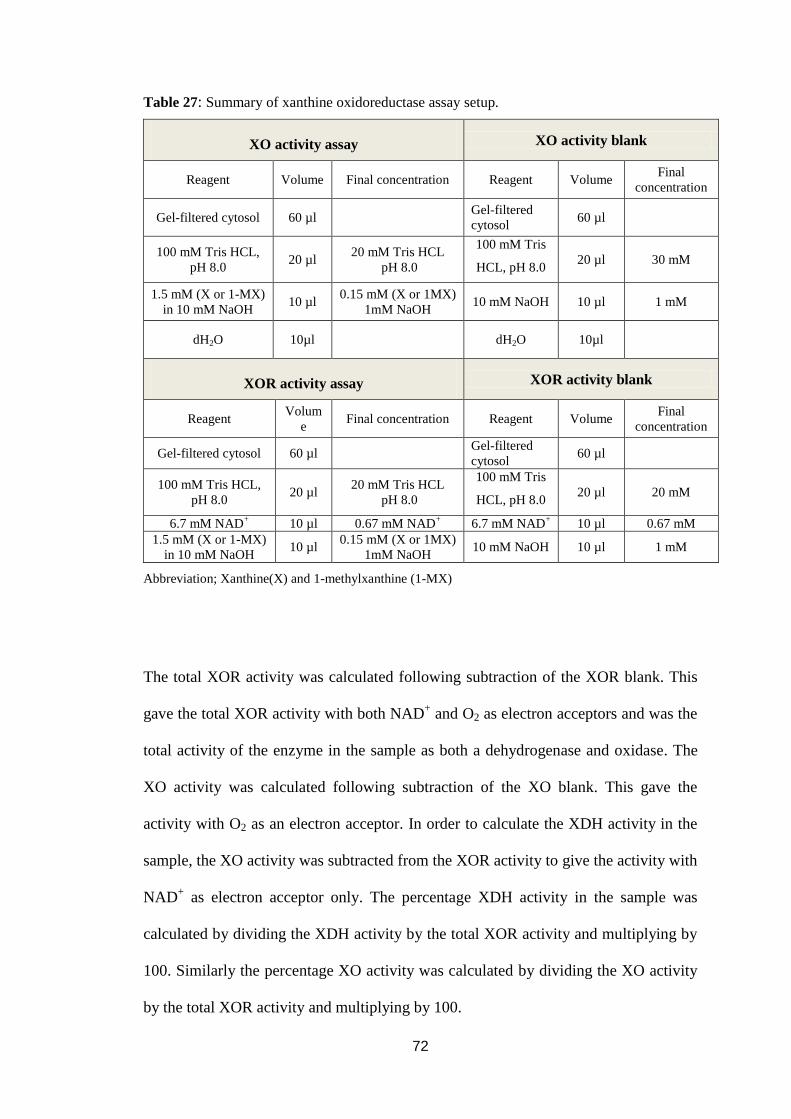
72
Table 27: Summary of xanthine oxidoreductase assay setup.
XO activity assay XO activity blank
Reagent Volume Final concentration Reagent Volume Final
concentration
Gel-filtered cytosol 60 µl Gel-filtered
cytosol 60 µl
100 mM Tris HCL,
pH 8.0 20 µl
20 mM Tris HCL
pH 8.0
100 mM Tris
HCL, pH 8.0 20 µl 30 mM
1.5 mM (X or 1-MX)
in 10 mM NaOH 10 µl
0.15 mM (X or 1MX)
1mM NaOH 10 mM NaOH 10 µl 1 mM
dH2O 10µl dH2O 10µl
XOR activity assay XOR activity blank
Reagent Volum
e Final concentration Reagent Volume
Final
concentration
Gel-filtered cytosol 60 µl Gel-filtered
cytosol 60 µl
100 mM Tris HCL,
pH 8.0 20 µl
20 mM Tris HCL
pH 8.0
100 mM Tris
HCL, pH 8.0 20 µl 20 mM
6.7 mM NAD+ 10 µl 0.67 mM NAD
+ 6.7 mM NAD
+ 10 µl 0.67 mM
1.5 mM (X or 1-MX)
in 10 mM NaOH 10 µl
0.15 mM (X or 1MX)
1mM NaOH 10 mM NaOH 10 µl 1 mM
Abbreviation; Xanthine(X) and 1-methylxanthine (1-MX)
The total XOR activity was calculated following subtraction of the XOR blank. This
gave the total XOR activity with both NAD+ and O2 as electron acceptors and was the
total activity of the enzyme in the sample as both a dehydrogenase and oxidase. The
XO activity was calculated following subtraction of the XO blank. This gave the
activity with O2 as an electron acceptor. In order to calculate the XDH activity in the
sample, the XO activity was subtracted from the XOR activity to give the activity with
NAD+ as electron acceptor only. The percentage XDH activity in the sample was
calculated by dividing the XDH activity by the total XOR activity and multiplying by
100. Similarly the percentage XO activity was calculated by dividing the XO activity
by the total XOR activity and multiplying by 100.
73
2.6. Determination of specific activity from spectrophotometric data.
The number of nmoles of substrate biotransformed per minute was calculated using
the absorbance change observed per minute using the relationship :c = A/Ɛl where c =
concentration (mM), A = absorbance, l = path length of absorbing solution in cm, Ɛ =
molar extinction coefficient. The light path for 100µl in a 96-well microplate was
0.681cm. Specific activity was then calculated as the number of nmoles of substrate
converted per minutes per mg of protein. The protein concentration of the sample was
measured as described in the section 2.2.
2.7. Determination of optimum conditions of molybdo-flavoenzymes.
As enzyme activity changes according to the reaction conditions changes in pH,
temperature and substrate concentration were investigated.
2.7.1. Determination of optimum pH of buffer.
The pH dependence of AOX and XDH were analyzed by assay of the enzymes at
37°C for 5 minutes at different pH values 5.6, 6.5, 7, 7.5 and 8.0 utilizing sodium
phosphate buffers (50 mM final concentration).
2.7.2. Temperature dependence of AOX and XOR activities.
This assay was performed to study the effects of incubation temperature on reaction
rates of enzyme activity at different incubation temperature. The aliquots of filtered
cytosol were assayed at 25, 30, 37, 40, 45, 55°C and 60°C in a microplate reader with
a final DMAC concentration of 100µM as substrate of AOX and a final xanthine
concentration of 100µM as substrate of XOR and 0.67mM NAD+ as an electron
acceptor. As summarized in (Tables 26 and 27).

74
2.7.3. Heat stability study.
The aliquots of filtered cytosol were incubated at 55˚C for 15, 30 and 60 minute in a
thermocycler machine (PCR machine) with a heated lid. The heated lid of the PCR
machine prevented evaporation and losses due to refluxing. The cytosols were
removed from heating and cooled in ice for 5 min and cooled cytosol centrifuged at
13,000 xg for 5 min and any precipitate discarded. The assays were performed on the
supernatant fraction using standard assay conditions for AOX activity with DMAC, as
summarized in section 2.4.
2.8. Assay of molybdo-flavoenzyme activity using high pressure liquid
chromatography.
All aldehydes and N- heterocyclic compounds mentioned before in section 2.3 (Table
25) were purchased from Sigma Aldrich and reagents required for the preparation of
the HPLC mobile phases were all of HPLC grade purity from the same company.
The analysis of aldehyde and N-heterocyclic compounds and their corresponding
metabolites were carried out by reverse phase HPLC. The system used comprised of a
Beckman Coulter System GoldTM
127 Solvent HPLC Module (dual pump) and a
programmable UV detector (module 166) or a programmable diode array detector
(module 168) along with injector designed with a 20 µl sample loop and auto sampler.
The analytical columns used were either: a Kromasil (25 cm X 4. 6 mm, 5µm; RP-
C18), Hypersil ODS (25 cm X 4. 6 mm, 5µm; RP-C18), LiChrosphere® (25 cm X 4
mm, 5µm; RP-C18) or Spherisorb® (5µm CNRP 4.6 X 15 cm; RP-C18). A guard
column with same stationery phase as the main chromatography column was used
upstream in the analytical column. These columns were from Phenomenex, UK and
Capital HPLC limited, UK. The mobile phases were filtered through a 0.45µm filter

75
before use. Isocratic and gradient methods were utilized to develop the optimal
conditions for the separation of analytes and the most highly sensitive method for the
determination of the different compounds.
5 mM individual stock solutions of AOX and XOR substrates and corresponding
metabolites were prepared within appropriate solvent as described in (Table 25) in
section 2.3. After preparing the stock solutions 1mM working standard solutions were
prepared by dilution along with water. Quantification was done using five standards
prepared from stock solutions with distilled water, 0.01, 0.02, 0.03, 0.05 and 0.1mM.
20µl of these compounds were injected onto the HPLC instrument starting with the
lowest concentration to give a range of 0.2 to 2 nmol, as documented in figures 1- 5 in
the Appendix 3. All stock's solutions were stored at 40C for up to 3 months with the
exception of vanillin and N1-methylnicotinamide, which were stored at -20
0C.
Calibration standards injected on the same day were used to calculate intra-day
accuracy and precision. This is a measure of the distribution of individual
measurements around the mean. This parameter was assessed by repeated analysis of
the same solution and expressed as the relative standard deviation (RSD) otherwise
known as the coefficient of variation (CV). % RSD for retention time was calculated
by dividing the standard deviation by the mean of retention time of three replicates in
the same day (Miller and Miller. 2005, Ghassan et al., 2010). The accuracy of the
assay was calculated by comparison of the nominal analyte concentration to the actual
concentration obtained from the linear regression line within the concentration
investigated (0.01, 0.02, 0.03, 0.05, 0.1mM) (Accuracy = nominal concentration /
actual concentration x 100). By using slope, intercept and the correlation coefficient
(RSQ or r2) for the linearity of the calibration curve was determined for each analyte.
The lower limit of quantification (LOQ) and limit of detection (LOD) were

76
determined for each analyte. According to international conference on harmonisation
(ICH) guidelines, the LOD is defined as the lowest concentration of an analyte in a
sample that can be detected but not quantified. The LOQ is the lowest amount of
analyte in a sample that can be quantitatively determined with suitable precision and
accuracy under the standard operational conditions of the method (ICH. 1994). The
lower LOQ and LOD of samples was defined as the lowest added analyte
concentration that can be measured with a low RSD and an accuracy of 100 ± 20%
that can be discriminated significantly from the basal concentration of analyte. The
ICH has listed two options available to calculate both the LOD and the LOQ of an
assay. One of these options are expressed as a concentration at a specified signal to
noise ratio, usually 3:1 and 10:1 for the signal to noise ratio for LOD and LOQ
respectively (ICH. 1994). The LOD and the lower of LOQ were calculated from the
mean of the slope (S) and standard deviation of the intercept of three calibration
curves using the linear regression method. The LOD and LOQ are calculated
according to the following equations: The LOD = 3.3 (SD/S) and the LOQ = 10
(SD/S) (ICH. 1994, Miller and Miller. 2005). All mobile phases and HPLC methods
for assay of MFE activity for allopurinol, 6-mercaptopurine, 1-methylxanthine,
xanthine, pyridoxal, all-trans retinal, vanillin, cinchonine, N1-methylnicotinamide,
phenanthridine, phthalazine and pyrazinamide are summarized in (Tables 28 and 29).
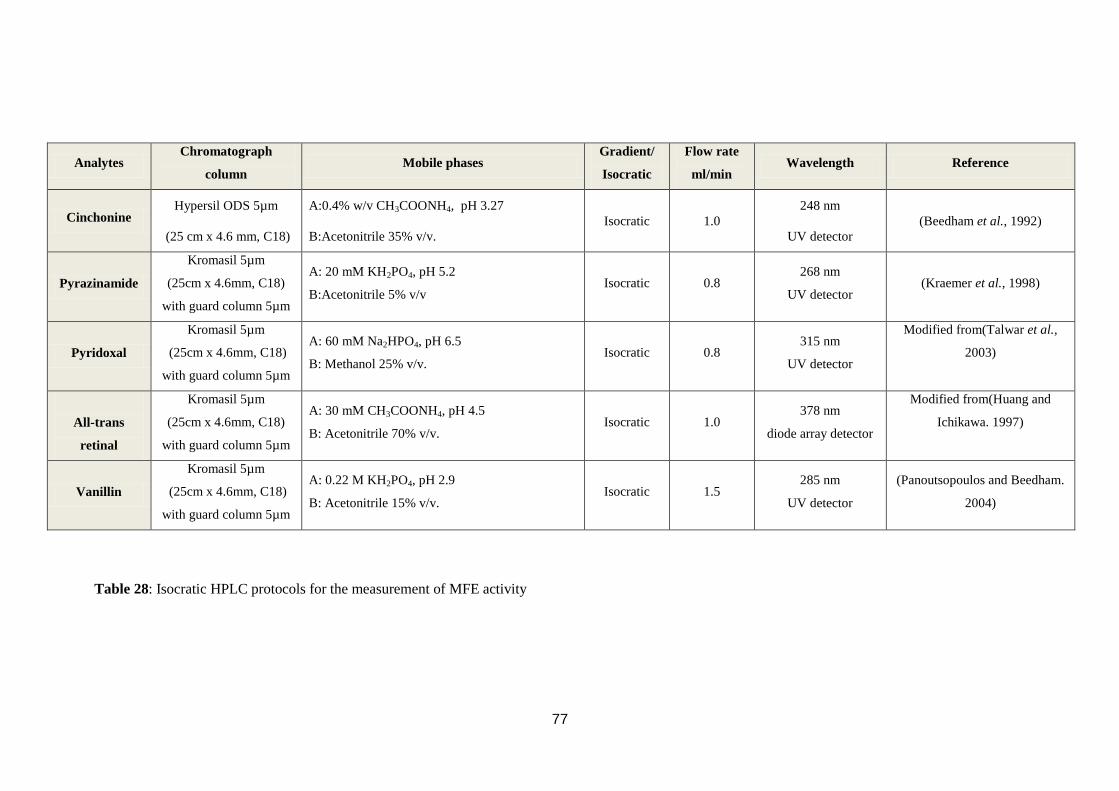
77
Analytes Chromatograph
column Mobile phases
Gradient/
Isocratic
Flow rate
ml/min Wavelength Reference
Cinchonine Hypersil ODS 5µm
(25 cm x 4.6 mm, C18)
A:0.4% w/v CH3COONH4, pH 3.27
B:Acetonitrile 35% v/v.
Isocratic 1.0
248 nm
UV detector
(Beedham et al., 1992)
Pyrazinamide
Kromasil 5µm
(25cm x 4.6mm, C18)
with guard column 5µm
A: 20 mM KH2PO4, pH 5.2
B:Acetonitrile 5% v/v Isocratic 0.8
268 nm
UV detector (Kraemer et al., 1998)
Pyridoxal
Kromasil 5µm
(25cm x 4.6mm, C18)
with guard column 5µm
A: 60 mM Na2HPO4, pH 6.5
B: Methanol 25% v/v. Isocratic 0.8
315 nm
UV detector
Modified from(Talwar et al.,
2003)
All-trans
retinal
Kromasil 5µm
(25cm x 4.6mm, C18)
with guard column 5µm
A: 30 mM CH3COONH4, pH 4.5
B: Acetonitrile 70% v/v. Isocratic 1.0
378 nm
diode array detector
Modified from(Huang and
Ichikawa. 1997)
Vanillin
Kromasil 5µm
(25cm x 4.6mm, C18)
with guard column 5µm
A: 0.22 M KH2PO4, pH 2.9
B: Acetonitrile 15% v/v. Isocratic 1.5
285 nm
UV detector
(Panoutsopoulos and Beedham.
2004)
Table 28: Isocratic HPLC protocols for the measurement of MFE activity

78
Analytes Chromatograph
column Mobile phases
Gradient/
Isocratic Flow rate ml/min Wavelength Reference
Allopurinol and
oxipurinol
Kromasil 5µm (25cm
x 4.6mm, C18) with
guard column 5µm
A: water H2O with addition of 0.1% v/v of
glacial acetic acid.
B: Acetonitrile.
Gradient
see table 30
Flow rate was varied
according to table 31
280 nm
UV detector This study
6-mercaptopurine and
6-thioxanthine
Kromasil 5µm (25cm
x 4.6mm, C18) with
guard column 5µm
A: water H2O with addition of 0.1% v/v of
glacial acetic acid.
B: Acetonitrile.
Gradient
see table 31
Flow rate was varied
according to table 32
280 nm
UV detector This study
N1- methylnicotinamide
(2PY and 4PY)
Water Spherisorb®
5um (CNRP 4.6 x
150 mm; C18)
A: 0.1% v/v of formic acid
B: Acetonitrile
Gradient
see table 32 0.8
254 nm
UV detector (Szafarz et al., 2010)
N1- methylnicotinamide
(2PY and 4PY)
Kromasil 5µm (25cm
x 4.6mm, C18) with
guard column 5µm
A: water H2O with addition of 0.1% v/v of
glacial acetic acid.
B: Acetonitrile
Gradient
see table 30
Flow rate was varied
according to table 31
280 nm
UV detector This study
Phenanthridine and
6(5H)-phenanthridone
Kromasil 5µm (25cm
x 4.6mm, C18) with
guard column 5µm
A: water H2O
B: Acetonitrile
Gradient
see table 33 1.5
254 nm
UV detector
Modified from(LaVoie et
al., 1985)
Phthalazine and
phthalazinone
Kromasil 5µm (25cm
x 4.6mm, C18) with
guard column 5µm
A: water H2O with addition of 0.1% v/v of
glacial acetic acid.
B: Acetonitrile.
Gradient
see table 31
Flow rate was varied
according to table 32
280 nm
UV detector This study
Xanthine and
1-methylxanthine
Kromasil 5µm (25cm
x 4.6 mm, C18) with
guard column 5µm
A: water H2O with addition of 0.1% v/v of
glacial acetic acid.
B: Acetonitrile
Gradient
see table 31
Flow rate was varied
according to table 32
280 nm
UV detector
Modified from(Begas et al.,
2007)
Pyrazinamide
5-hydroxypyrazinamide
Kromasil 5µm (25cm
x 4.6mm, C18) with
guard column 5µm
A: water H2O with addition of 0.1% v/v of
glacial acetic acid.
B: Acetonitrile
Gradient
see table 31
Flow rate was time
programmed with the
variation in the solvent
which was as follows see
table 32
268 nm
UV detector This study
Abbreviations: (2-PY) -N1-methyl-2-pyridone-5-carboxamide, (4-PY)-N
1-methyl-4-pyridone-5-carboxamide
Table 29: Gradient HPLC protocols for the measurement of MFE activity

79
Table 30: HPLC program for the separation of allopurinol, N1-methylnicotinamide and their
metabolites
Time Solvent A (%) Solvent B (%) Flow (mL/min)
0
16
16
20
20
24
100
100
85
85
100
100
0
0
15
15
0
0
0.8
0.8
1.2
1.2
0.8
0.8
Solvent A: water H2O with addition of 0.1% v/v of glacial acetic acid, Solvent B: Acetonitrile.
Table 31:HPLC program for the separation of 6-mercaptopurine, 1-methylxanthine, xanthine,
phthalazine, pyrazinamide and their metabolites
Time Solvent A (%) Solvent B (%) Flow (mL/min)
0
7
7
15
15
19
22.5
22.5
25
100
100
100
90
90
85
85
100
100
0
0
0
10
10
15
15
0
0
0.8
0.8
1.5
1.5
1
1
1
1.2
1.2
Solvent A: water H2O with addition of 0.1% v/v of glacial acetic acid, Solvent B: Acetonitrile.
Table 32:HPLC program for the separation of N1-methylnicotinamide and its metabolites on a
polar cyan column
Time Solvent A (%) Solvent B (%) Flow (mL/min)
0
1
2
3
4
5
6
9
9
15
55
61
67
72
78
84
90
90
55
55
45
39
33
28
22
16
10
10
45
45
0.8
0.8
0.8
0.8
0.8
0.8
0.8
0.8
0.8
0.8
Solvent A: 0.1% v/v of formic acid, Solvent B: Acetonitrile.
Table 33:HPLC program for the separation of phenanthridine and 6(5H) phenanthridone
Time Solvent A (%) Solvent B (%) Flow (mL/min)
0
1
6
12
15
15
20
95
90
50
0
0
90
90
5
10
50
100
100
10
10
1.5
1.5
1.5
1.5
1.5
1.5
1.5
Solvent A: water H2O, Solvent B: Acetonitrile.

80
2.8.1. HPLC analysis of the in vitro metabolism of molybdo-
flavoenzyme substrates.
HPLC assays of AOX and XOR were performed with a final volume of 100µl as
following, 50µl of gel filtered cytosol, 10µl of 1mM stock of substrates (vanillin,
pyridoxal, all-trans retinal, phenanthridine, phthalazine, N1-methylnicotinamide,
methotrexate, cinchonine, xanthine, 1-methylxanthine and 6-mercaptopurine and 40µl
(40 mM Tris HCL pH 7.4) at 37°C. XDH assays were similar with the exception that
30µl of (40 mM Tris HCL pH 7.4) was used and 10µl of 6.7mM NAD+
was added in
addition to the substrate. Reactions were terminated with the addition of 60µl of
acetonitrile and samples centrifuged at 12000 xg prior to chromatography of the
supernatant on HPLC.
Validation that a compound was a substrate for AOX or XOR was achieved using
enzyme specific inhibitors and electron acceptors.

81
2.9. Determination of Km and Vmax for molybdo-flavoenzymes.
The rate of oxidation of varying concentrations of substrate of AOX and XOR were
monitored such that linear reaction rates were observed and used for Km and Vmax
calculations. The volume of cytosol added was varied to provide suitable reaction
rates over the range of substrate concentrations used. The substrates concentrations
used were 25, 40, 55, 70, 85 and 100 µM for DMAC, vanillin, phenanthridine,
xanthine, 1-methylxanthine, pyridoxal, all-trans retinal, allopurinol, phthalazine and 6-
mercaptopurine. Specific activity was then calculated as described in section 2.6.
Eadie Hofstee plots V/[S] versus [V] were then plotted (Figure 23). The intercept on
the ordinate axis is Vmax and the slope is -Km, the line of best fit through the points
on plot was determined using linear regression by least squares method using
Microsoft Excel (Microsoft Office).
Figure 23: Eadie- Hofstee plot.

82
2.10. Determination of the mode of inhibition and inhibitor constant
(Ki)
The effects of the AOX and XOR inhibitors were studied as summarized in (Table 34)
using DMAC and xanthine in spectrophotometric assay. The stock inhibitors were
prepared in different solvents as follows. A stock solution of menadione was prepared
by dissolving 1mg in 1ml of dimethyl sulphoxide (DMSO). Estradiol, 17α-ethinyl
estradiol and phenanthridine stock solutions were prepared by dissolving 1mg in 1ml
of ethanol. 5µM, 10µM and 50µM inhibitor stock solutions were prepared from these
by dilution in water and one tenth of these were added to assays to give final
concentration 0.5, 1 and 5µM inhibitor. The XOR inhibitor oxipurinol was prepared as
a stock solution by dissolving in 10mM NaOH. 0.25mM, 0.5mM and 1mM oxipurinol
stock solutions were prepared from this by dilution in water and one tenth of these
were added to assays to give final concentration of 25µM, 50µM and 100µM
oxipurinol.
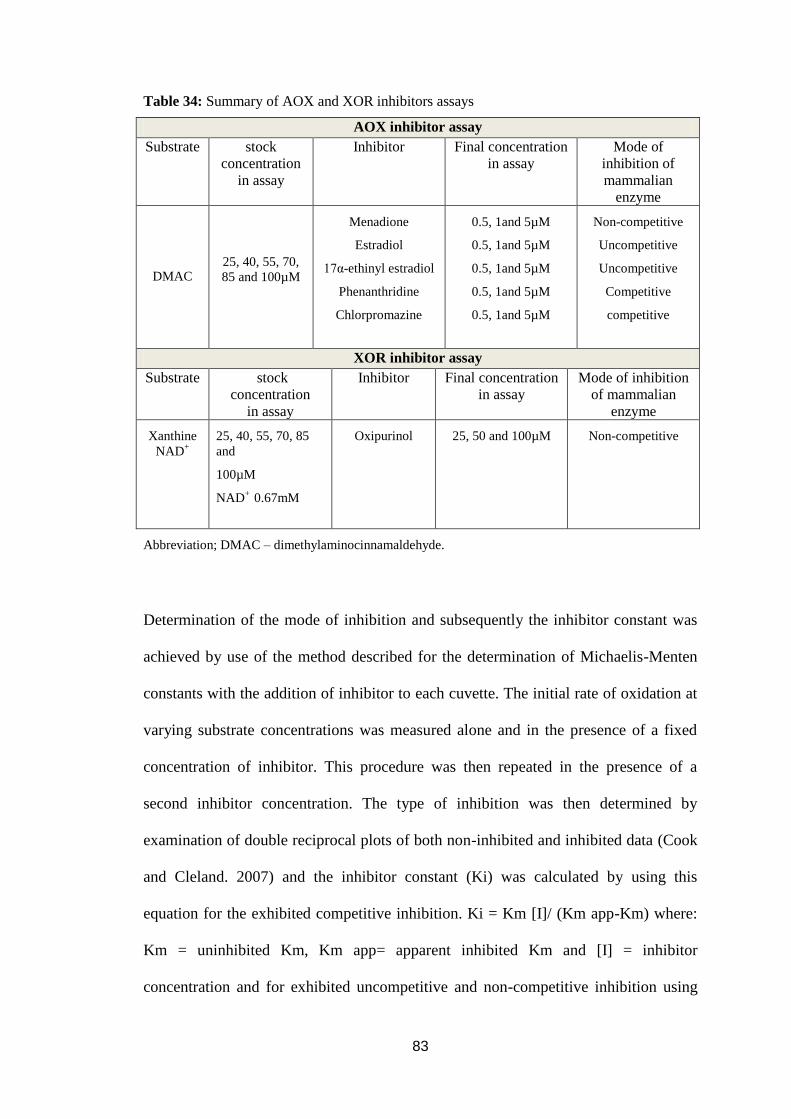
83
Table 34: Summary of AOX and XOR inhibitors assays
AOX inhibitor assay
Substrate stock
concentration
in assay
Inhibitor Final concentration
in assay
Mode of
inhibition of
mammalian
enzyme
DMAC
25, 40, 55, 70,
85 and 100µM
Menadione
Estradiol
17α-ethinyl estradiol
Phenanthridine
Chlorpromazine
0.5, 1and 5µM
0.5, 1and 5µM
0.5, 1and 5µM
0.5, 1and 5µM
0.5, 1and 5µM
Non-competitive
Uncompetitive
Uncompetitive
Competitive
competitive
XOR inhibitor assay
Substrate stock
concentration
in assay
Inhibitor Final concentration
in assay
Mode of inhibition
of mammalian
enzyme
Xanthine
NAD+
25, 40, 55, 70, 85
and
100µM
NAD+
0.67mM
Oxipurinol 25, 50 and 100µM Non-competitive
Abbreviation; DMAC – dimethylaminocinnamaldehyde.
Determination of the mode of inhibition and subsequently the inhibitor constant was
achieved by use of the method described for the determination of Michaelis-Menten
constants with the addition of inhibitor to each cuvette. The initial rate of oxidation at
varying substrate concentrations was measured alone and in the presence of a fixed
concentration of inhibitor. This procedure was then repeated in the presence of a
second inhibitor concentration. The type of inhibition was then determined by
examination of double reciprocal plots of both non-inhibited and inhibited data (Cook
and Cleland. 2007) and the inhibitor constant (Ki) was calculated by using this
equation for the exhibited competitive inhibition. Ki = Km [I]/ (Km app-Km) where:
Km = uninhibited Km, Km app= apparent inhibited Km and [I] = inhibitor
concentration and for exhibited uncompetitive and non-competitive inhibition using

84
this equation. Ki = [Vmax app][I]/Vmax, where Vmax = uninhibited Vmax, Vmax
app= apparent inhibited Vmax and [I] = inhibitor concentration. To determine Km and
Vmax for these calculations Lineweaver-Burk plots1/V versus 1/[S] were plotted. The
intercept on the ordinate axis is 1/Vmax and the slope is Km/Vmax. From these plots
the mode of inhibition was also determined. (Figure 24) illustrates the different plots
expected for competitive (Figure 24 A), uncompetitive (Figure 24 B) and non-
competitive (Figure 24 C).
Figure 24: Lineweaver-Burk plots with different types of inhibitors.

85
2.11. Purification of aldehyde oxidase
2.11.1. Chromatography instruments media and concentrators used
The instrument used was a GE Healthcare AKTA FPLC System with dual pump and
fraction collector operated with Unicorn 4.11 Software. Chromatography media used
was Q Sepharose 30/100, Superose 6 prep grade XK 16/70, MonoQ 5/50 GL,
benzamidine Sepharose 6B and Mono P HR 5/20 were purchased from VWR
International Ltd .UK. The centrifugal concentrators used were Amicon Ultra-15,
Ultracel-PL Membrane, purchased from Millipore (UK) Ltd. All mobile phases were
of FPLC grade purity and were filtered through a 0.45µm filter before use. Isocratic
and gradient chromatography methods were using to develop the optimal conditions
for the purification of enzymes from original sample.
2.11.2. Buffers used in purification protocols.
The following buffers were used in the course of the purification:
Buffer A: 20mM Tris-HCL, 1mM cysteine, 5% (v/v) glycerol. The pH of this buffer
was varied depending on chromatographic conditions required.
Buffer B: 20mM Tris-HCL, 1mM cysteine, 5% (v/v) glycerol, 0.3-0.6M KCL. The pH
of this buffer was varied depending on chromatographic conditions required.
Buffer C: 0.075M Tris HCL pH 9.3.
Buffer D: 10% (v/v) polybuffer 96, adjusted to pH 6.0 with glacial acetic acid.
Buffer E: 0.1mM glycine pH 9.0, 0.1M NaCL.
Buffer F: 0.1mM glycine pH 9.0, 0.1M NaCL, 20mM benzamidine.
Buffer G: 20mM Tris-HCL pH8.0, 1mM cysteine, 5% (v/v) glycerol, 0.1M NaCL.
86
All buffers were prepared from ultrapure reagents dissolved in Milli Q grade water
and filtered through 0.45µM filters (Millipore, U.K.).
2.11.3. Purification of AOX
Purification of enzyme activity was monitored throughout the purification procedure
with DMAC as substrate. Protein elution was monitored at 280nm with an on-line
spectrophotometric detection cell in the FPLC instrument. All procedure was carried
out at 0 - 4°C. (Figure 25) summarises the protein purification protocols used.
2.11.3.1. Preparation of cytosol.
Cytosol was prepared as previously described in section 2.1.1. with 20 to 70 g of fresh
liver.
2.11.3.2. Heat treatment step.
Cytosol was subjected to heat treatment in a water bath at 55°C for 15 minutes and
after that cooled on ice for 10 minute then centrifuged at 10,000 xg for 15 minutes.
The supernatant was then removed and used for subsequent experiments.
2.11.3.3. Ammonium sulphate fractionation step.
Cytosol or heat treated supernatant derived from cytosol were subjected to ammonium
sulphate fractionation as follows. Finely ground ammonium sulphate was added
slowly to the sample with stirring to a concentration of 13.82g/100ml. This solution
was stirred for a further 20 minutes and then centrifuged at 15,000 xg for 15 minutes
to pellet protein precipitated by a 25% ammonium sulphate saturation. The
supernatant was then subjected to a further fractionation so that the final ammonium
sulphate concentration was 14.91g/100ml (60% saturation) and after stirring and
centrifuging as in the first ammonium sulphate fractionation step the pellet was
resuspended in approximately 5ml of buffer A.

87
Procedure 1
Cytosol preparation
Heat treatmentat55°C
25-50% ammonium
sulphate fractionation
Q-sepharose 30/100 anion
exchange chromatography
Benzamidine 6B affinity
chromatography
MonoQ 5/50 anion exchange
chromatography
Procedure 2
Cytosol preparation
25-50% ammonium
sulphate fractionation
Q-sepharose 30/100 anion
exchange chromatography
Benzamidine 6B affinity
chromatography
MonoQ 5/50 anion exchange
chromatography
Procedure 3
Cytosol preparation
25-50% ammonium
sulphate fractionation
Q-sepharose 30/100 anion
exchange chromatography
Mono P HR 5/20
chromatography
Procedure 4
Cytosol preparation
25-50% ammonium
sulphate fractionation
Q-sepharose 30/100 anion
exchange chromatography
Superose 6 16/70 gel filtration
chromatography
MonoQ 5/50 anion exchange
chromatography
Figure 25: AOX purification protocols.

88
The sample was then dialysed against three changes of 100 volumes of buffer A over
a 24 hour period and the dialysate centrifuged at 15,000 xg for 15 minutes to remove
any undissolved material. The sample was then subjected to chromatography for
further purification.
2.11.3.4. Q-Sepharose anion exchange fast flow chromatography.
In this case the pH of buffer A and B was varied from pH 8.0 to pH 8.6 in different
chromatographic runs. The dimensions of the Q-Sepharose column were 2.5 x 55cm
and the flow rate was 10ml/minute. Following ammonium sulphate fractionation 10ml
of the sample was applied to the Q-Sepharose column which had previously been
equilibrated with buffer A. Unbound protein was eluted with 140ml of buffer A and
protein retained on the column was eluted with 150ml of a gradient of 0.6M KCL in
buffer B. The fractions containing AOX activity were pooled and concentrated to 4-
5ml by ultrafiltration using Amicon Ultra-15 centrifugal concentrator. Following this
anion exchange chromatography step, pooled fractions were further purified by
affinity chromatography or chromatofocusing or size exclusion followed by a further
anion chromatographic step on MonoQ, as outlined in (Figure 25).
2.11.3.5. Affinity chromatography on benzamidine Sepharose 6B.
Benzamidine Sepharose 6B was used as an affinity matrix to bind AOX (Figure 25).
In procedure 1 the AOX-active pooled fractions from the anion exchange columns Q-
Sepharose were dialysed in 100 volumes of buffer E, with three changes over 24 hours
and applied to a 15ml bed volume benzamidine Sepharose 6B column (2.5 x 10cm) at
a flow rate was 0.5ml/minute. After application the flow was stopped for 30 minutes
to facilitate binding of AOX to the benzamidine-ligands. Unbound material was then
eluted at a flow rate of 1ml/minute by washing the column with 6 ml of buffer E.
Bound AOX was eluted by sequential batch elution with 10ml of 5mM benzamidine,
89
10ml of 10mM benzamidine and 10ml of 20mM benzamidine in buffer F. The column
was regenerated for further use by washing the column with 20 ml of 2M NaCL to
remove any protein still bound and the re-equilibrated in buffer E.
2.11.3.6. Chromatofocusing on Mono P HR 5/20.
The pooled fractions from the Q-sepharose anion exchange step were passed through a
Sephadex G25 column (PD 10; 9.1ml bed volume) equilibrated with buffer C for
buffer exchange prior to chromatofocusing. 2ml of protein of the resultant sample was
then applied to a Mono P HR 5/20 column fitted to an AKTA FPLC system which had
previously been equilibrated with buffer C. The column was then washed with two
column volumes of buffer C at flow rate of 1ml/minute followed by 35ml of buffer D
to generate a pH gradient from pH 9.3 to pH 6.0 over 30ml. Any material still bound
to the column was then removed by a 2M NaCL elution.
2.11.3.7. Gel filtration chromatography.
A Superose 6 16/70 column equilibrated with buffer G was used as a step to separate
proteins on the basis of their differences in their native molecular mass (Figure 25). In
procedure 4, 0.5ml of the AOX active concentrated fraction from Q-sepharose anion
exchange chromatography was applied to the Superose column and eluted at a flow
rate of 1ml/minute with 140ml of buffer G using 0.1M NaCL as isocratic elution. The
column was then equilibrated with the buffer G for the next run.

90
2.11.3.8. MonoQ chromatography.
This was used as a final step for the purification of AOX as it has proved a suitable
medium for the final purification step of AOX in other species (Table 22). In thiscase
the pH buffer A and B were varied from pH 8.0 to pH 8.6 in different
chromatographic runs, the column dimensions were 5 x 50 mm and the flow rate was
1ml/minute. Following equilibration with 2 bed volumes of buffer A, 0.3ml of
concentrated protein sample containing AOX was eluted by washing the column with
2ml of buffer A to remove unbound protein and bound protein was eluted with 20ml
of a linear gradient of 0-0.3M KCL in buffer B. Active AOX fractions eluted by the
salt were pooled and concentrated to 1-2ml by ultrafiltration using Amicon Ultra-15
membrane. The column was then regenerated for further use by washing the column
with one bed volume of each of the following: 1M NaCL, 1.5M NaOH, and 20% (v/v)
ethanol. The column was the re-equilibrated in buffer A.
2.11.4. Sodium dodecyl sulphate polyacrylamide gel electrophoresis
Sodium dodecyl sulphate polyacrylamide gel electrophoresis (SDS-PAGE), a
technique for separating of proteins according to their mass was used to monitor the
purification of AOX(Laemmli. 1970). All SDS-PAGE gels and reagents were from Life
Technologies Ltd, UK. The material for SDS-PAGE is described in the (Table 35) and
the protocols used according to Life Technology (www.lifetechnologies.com).
Table 35: SDS-polyacrylamide gel electrophoresis reagents (SDS- PAGE)
Materials
Gel used NuPAGE® Novex® 3-8% Tris-Acetate Gel 1.5 mm
Running buffer NuPAGE® Tris-Acetate SDS
Sample buffer NuPAGE® LDS
Ladder HiMark™ Unstained Protein Standard
Denaturing agent DTT
Antioxidant agent NuPAGE® Antioxidant (N,N-dimethylformarmide)
Abbreviations: LDS- Lithium dodecyl sulphate, DTT-Dithiothreitol, concentration DTT 5% (w/v), MOPS SDS- 3-(N-
morpholino) propanesulfonic acid, concentration MOPS 0.6M, SDS 2% and pH 8.4±0.1.

91
2.11.4.1. Staining of SDS polyacrylamide gels
For the staining of SDS PAGE gels Coomassie blue and silver staining methods were
used. All materials used purchased from Sigma Aldrich Company UK. The summary
of the two methods are given in (Table 36).
Table 36: Summary of Coomassie Blue and Silver stains used for protein visualisation of
SDS-PAGE.
Staining Materials Method
Coomassie
blue
For 500ml of
Coomassie blue stain.
1) 1.25g Serva G blue.
2) 228ml methanols.
3) 46ml acetic acid.
4) 226ml distilled H2O
Stir for 15 minute.
5) Filter through
general grade whatman
filter paper.
1) Stain gels with gentle shaking for at least 30
minutes with Coomassie blue stain heated to 600C
or two hours at room temperature.
2) Destain overnight with 10% v/v methanol, 15%
v/v acetic acid, 75% v/v distilled H2O.
Reference (Laemmli. 1970)
Staining Materials Method
Silver
1) Oxidiser, 3.4mM
potassium dichromate
with 0.0032N Nitric
Acid.
2) Silver nitrate
solution
0.012M silver nitrate.
3) Developing agent
0.28M sodium
carbonate+0.5ml/L
formalin.
1) Soak gel 2 times for 10 minutes in 40%
methanol+10% acetic acid (200ml/gel).
2) Soak gel 2 times for 10 minutes with 10%
ethanol+5% acetic acid(200ml/gel).
3) Soak gel for 10minutes in oxidiser (200ml/gel at
RT).
4) Wash with distilled H2O three times for 10
minutes or until gel colourless (200ml/gel at RT).
5) Soak for 30 minute in 0.012M silver nitrate
(200ml/gel) at RT.
6) Wash with distilled H2Ofor two minutes.
7) Develop three times with developing reagent for
1, 5 and 3minutes respectively (200ml/gel at RT).
8) Stop with 5% v/v acetic acid for 5 minutes, then
immerses gel in deionised H2O.
Reference (De Moreno et al., 1985)
Abbreviations: room temperature (RT)

92
2.11.4.2. Determination of native molecular mass using Superose 6
chromatography.
The gel filtration marker kit for protein molecular masses 29,000-700,000 Da was
obtained from Sigma Aldrich UK. A summary and concentration of the standards used
in the calibration curve for the Superose 6 16/70 chromatography is shown in (Table
37). The buffer used for prepare the standard proteinswas20mM Tris HCl pH8.0,
1mM cysteine and 5% (v/v) glycerol with 0.1M NaCL. 1 ml of each prepared standard
was injected onto the FPLC starting with the highest molecular mass standard Dextran
blue 2,000,000 Da first followed by protein mixture containing all proteins listed in
(Table 37). The method and sample preparation was according to (Whitaker. 1963,
Andrews. 1964, Marshall. 1970)noting that the Blue Dextran was not mixed with
other standards because many proteins bind to dextran. Blue dextran and the protein
standards were applied in 1 ml volume and eluted with a 1 ml/minute flow rate.
Table 37: Summary of gel filtration standards used for native molecular mass determination
Standard protein Approximate Molecular
mass
Recommended
concentration
Carbonic anhydrase from bovine erythrocytes 29000 Da 3mg/1ml
Albumin, bovine serum 66000 Da 10mg/1ml
Alcohol dehydrogenase from yeast 150000 Da 5mg/1ml
β-Amylase from sweet potato 200000 Da 4mg/1ml
Apoferritin from horse spleen 443000 Da 10mg/1ml
Thyroglobulin, bovine 669000 Da 8mg/1ml
Blue Dextran 2000000 Da 2mg/1ml
Absorbance was recorded at 280nm and a graph was drawn by plotting the logarithms
of molecular mass of all standards versus to the elution volume of the standards. This
graph was used to calculate the molecular mass of AOX.

93
2.12. Statistical analysis.
2.12.1. ANOVA-test
Each experiment was repeated at least three times. Statistical analysis was carried out
using Microsoft Excel 2010 software. The result of each experiment was determined
as the mean ± standard deviation. Data were then analysed for significance using one
way ANOVA. Differences with p values ≤0.05 were considered statistically
significant.
94
3. Results.
The section of results is divided into 6 main sections as follows. Firstly sections 3.1,
3.2 and 3.3 describe the quantification of molybdo-flavoenzyme activity in rainbow
trout, human and rat using spectrophotometric and HPLC assays. In sections 3.4 and
3.5 the determination of the kinetic parameters and comparison different inhibitors of
AOX and XOR in different species are described. The final section 3.6 covers the
purification of AOX from rat and trout.
3.1. Quantification of molybdo-flavoenzyme activity
A number of spectrophotometric assays were used to measure the relative reaction
rates of the AOX and XOR. Three spectrophotometric assays measured the rate of
biotransformation of two aldehyde compounds vanillin and
dimethylaminocinnamaldehyde (DMAC) and one N-heterocyclic AOX substrate
phenanthridine with molecular oxygen as an electron acceptor. A further
spectrophotometric XOR assay was performed using endogenous substrate xanthine
and the caffeine metabolite, 1-methylxanthinewith O2 or with NAD+
plus O2 as
electron acceptors. These assays were carried out with 20 – 40 µl of gel filtered
cytosol at 37ºC as described in materials and methods section 2.4 to give linear
reaction kinetics. As the majority of MFEs substrates and products cannot be
quantified by spectrophotometry, HPLC assays were used to measure MFEs oxidation
rates for 13 substrates. In order to optimise the experimental conditions for the assays
a series of experiments were performed to assess the optimal pH and temperature. In
addition prior to performing HPLC assays the methods were tested for accuracy and
precision.
ml/min
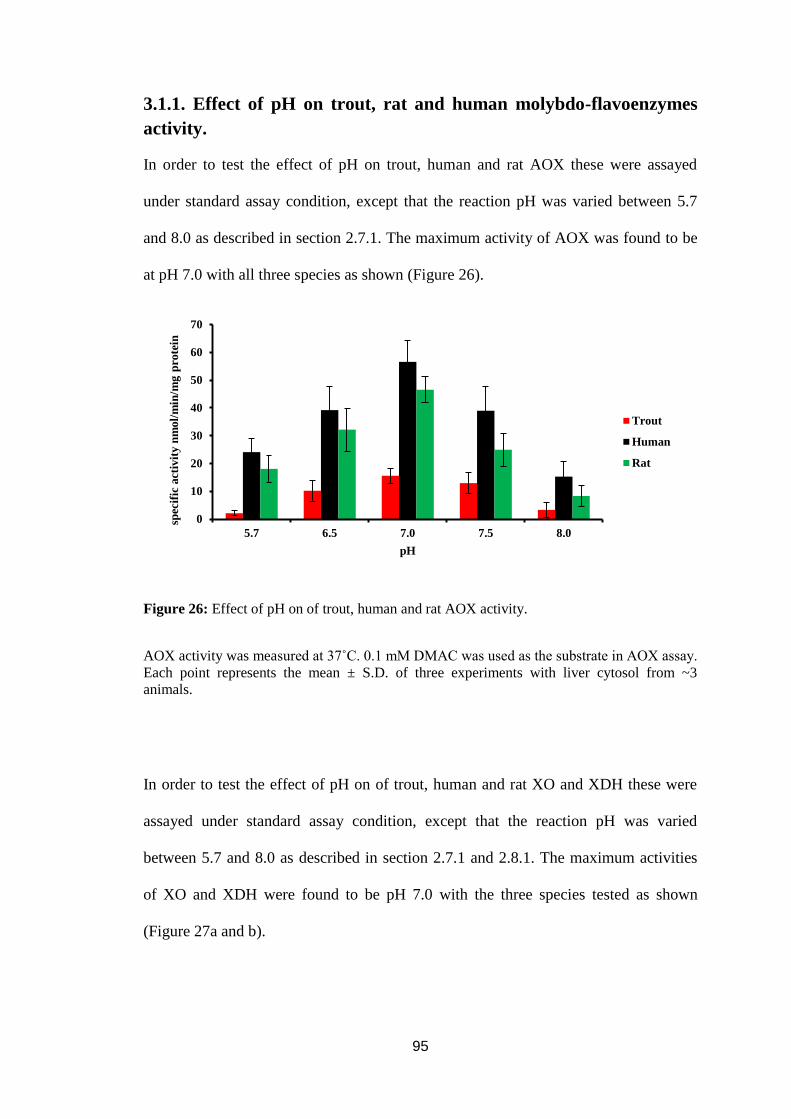
95
3.1.1. Effect of pH on trout, rat and human molybdo-flavoenzymes
activity.
In order to test the effect of pH on trout, human and rat AOX these were assayed
under standard assay condition, except that the reaction pH was varied between 5.7
and 8.0 as described in section 2.7.1. The maximum activity of AOX was found to be
at pH 7.0 with all three species as shown (Figure 26).
Figure 26: Effect of pH on of trout, human and rat AOX activity.
AOX activity was measured at 37˚C. 0.1 mM DMAC was used as the substrate in AOX assay.
Each point represents the mean ± S.D. of three experiments with liver cytosol from ~3
animals.
In order to test the effect of pH on of trout, human and rat XO and XDH these were
assayed under standard assay condition, except that the reaction pH was varied
between 5.7 and 8.0 as described in section 2.7.1 and 2.8.1. The maximum activities
of XO and XDH were found to be pH 7.0 with the three species tested as shown
(Figure 27a and b).
0
10
20
30
40
50
60
70
5.7 6.5 7.0 7.5 8.0
spec
ific
act
ivit
y n
mol/
min
/mg
pro
tein
pH
Trout
Human
Rat

96
Figure 27: Effect of the pH on of trout, human and rat XOR activity.
The (a) XO activity was measured at 37˚C with 0.15 mM xanthine and O2 as electron
acceptor. (b) XDH activity was measured at 37˚C with 0.15 mM xanthine and 0.67 mM NAD+
plus O2 as electron acceptor. Each point represents the mean ± S.D. of three experiments with
pooled cytosol from ~3 animals.
0
5
10
15
20
25
30
35
40
45
50
5.7 6.5 7.0 7.5 8.0
spec
ific
act
ivit
y n
mol/
min
/mg
pro
tein
pH
(a)
Human
Rat
0
5
10
15
20
25
30
35
40
45
50
5.7 6.5 7.0 7.5 8.0
spec
ific
act
ivit
y n
mol/
min
/mg
pro
tein
pH
(b)
Trout
Human
Rat

97
3.1.2. Effect of temperature on trout, rat and human molybdo-
flavoenzymes activity.
In the initial assays 37˚C was used for assays but in order to determine if this was the
optimum temperature to use a series of experiments were performed. In order to test
effect of temperature on the activity of trout, rat and human AOX this was measured
as at different incubation temperatures as described in section 2.7.2. The rate of
reaction of trout AOX with DMAC increase gradually with increasing temperature
from 25˚C to 37˚C then decreased gradually until it fell to < 10 % at 55˚C and 60˚C
compared to the activity at 37°C as shown in (Figure 28). The activity at 60°C was ~
10% obtained at 37°C. The rate of reaction of human and rat AOX with DMAC
increase gradually with increasing temperature from 25˚C to 37˚C then decrease
gradually as shown in (Figure 28) and the activity of human and rat at 60°C was ~
60% obtained at 37°C respectively. As the maximum reaction rate was obtained at
37˚C for AOX enzymes, this temperature was therefore selected for all assays.
Figure 28: Effect of the assay incubation temperature on of trout, human and rat AOX
activity.
Enzyme activity was measured with 0.1 mM DMAC was used as the substrate in AOX assays. Each
point represents the mean ± S.D. of three experiments with pooled cytosol from 3 animals.
0
5
10
15
20
25
25 30 37 45 55 60
spec
ific
act
ivit
y n
mol/
min
/mg
pro
tein
Temperature ºC
Trout
Human
Rat

98
In order to test the effect of temperature on the activity of trout, human and rat XOR
this was measured at different incubation temperatures. The rate of reaction of human
and rat XO with xanthine and O2 as an electron acceptor. Gradually increasing with
increase temperature from 25˚C to 37˚C then decrease gradually as shown in figure
29a and the activity of human and rat at 60°C was ~ 60% obtained at 37°C
respectively. The rate of reaction of trout XOR with xanthine and NAD+
with O2 as
electron acceptors. Increasing gradually with increasing temperature from 25˚C to
37˚C then decreased gradually until fell to near zero at 55˚C and 60˚C as shown in
(Figure 29b). The activity at 60°C was ~ 5% of that obtained at 37°C. The rate of
reaction of human and rat XDH with xanthine and NAD+ increase gradually with
increasing temperature from 25˚C to 37˚C then gradually decrease as shown in (Figure
29b) the activity of human and rat at 60°C was ~ 60% obtained at 37°C respectively .
As the maximum reaction rate was obtained at 37˚C for XOR enzyme, this
temperature was therefore selected for all assays.

99
Figure 29: Effect of the assay incubation temperature on of trout, human and rat XOR
activity.
Enzyme activity was measured with (a) 0.15 mM xanthine and O2 as an electron acceptor. (b) 0.15 mM
xanthine and 0.67 mM NAD+
plus O2 as an electron acceptors. Each point represents the mean ± S.D. of
three experiments with pooled cytosol from ~3 animals.
0
5
10
15
20
25
25 30 37 45 55 60
spec
ific
act
ivit
y n
mol/
min
/mg
pro
tein
Temperature ºC
(a)
Human
Rat
0
5
10
15
20
25
25 30 37 45 55 60
spec
ific
act
ivit
y n
mol/
min
/mg
pro
tein
Temperature ºC
(b)
Trout
Human
Rat

100
3.1.3. Validation of the accuracy and precision of HPLC assays
The precision of the various HPLC assays was determined by injecting five
concentrations (0.01, 0.02, 0.03, 0.05 and 0.1 mM) of all AOX and XOR substrates
and the products listed in materials and methods section 2.8., three times on the same
day to determine the intra-day variation. The intra-day variation assessed as the
coefficient of variation in peak area ratio. The relative standard deviation (%RSD)
calculation for retention time was described in section 2.8. The lower the value is the
better the assay performance. At lower level it was below 3.5% for 3 replicates, see
Appendix3 (Table 1). The accuracy of the assay was calculated by comparison of the
nominal analyte concentration to the actual concentration obtained from the linear
regression line within the concentration range investigated (0.01 mM to 0.1 mM), see
Appendix3(Table 2). Appendix3 (Table 2) showed that the intra-day values ranged
between 95.1-100.8%. The precision of all concentrations of analyte was
approximately less than ± 5%. The calibration graphs obtained with these HPLC
methods were linear over the concentration range used and the (r2) values were 0.92 to
0.99 for each analyte when plotted for the mean peak area for three injections against
the actual concentration (Figures 1- 5 in Appendix 3). This demonstrates that these
HPLC methods are precise and repeatable and can be successfully used to analyse
MFE catalysed biotransformations in this study. In addition to accuracy and precision
tests, the limit of detection (LOD) and the limit of quantification (LOQ) were
calculated for each of the analytes in section 2.5.2.3. The LOD of all substrates and
products were ranged between 0.1-5.4 nmol and LOQ was ranged from 0.9 to 94
nmol. From these results, it can be concluded that the HPLC methods were
sufficiently sensitive to detect low concentrations of substrates and products of

101
molybdo-flavoenzyme catalysed reactions enzymes. The results of linearity, limit of
detection and limit of quantification are presented in Appendix3 (Table 3).
3.2. Screening of molybdo-flavoenzyme activities.
Following optimisation and validation of the assays, AOX and XOR activities in
rainbow trout, Wistar rat and human cytosols were assessed using a multitude of
spectrophotometric and HPLC assays prior to scrutinising the Km and Vmax for
different substrates.
3.2.1. AOX activity with exogenous aldehydes in trout tissue and
mammalian liver cytosol.
The substrates used to evaluate AOX activity in this research included the exogenous
food flavouring agent vanillin (4-hydroxy-3-methoxybenzaldehyde) and artificial dye
dimethylaminocinnamaldehyde (DMAC). (Figures 30 and 31) illustrate
spectrophotometric assays with the two aldehyde substrates vanillin and DMAC. This
demonstrated that liver cytosols from all three species had measurable AOX activity
towards these two aromatic aldehydes. In contrast rainbow trout kidney and gill
cytosols had no measurable activity towards these substrates (data not shown). In
order to check unequivocally if there was no AOX activity towards vanillin in kidney
and gill cytosols an HPLC assay was used. This showed that even following a 120
minute incubation with this substrate there was no vanillic acid formed in contrast to
liver cytosol (Figure 32). (Figure 33) shows an HPLC chromatogram for all liver
cytosol from trout, rat and human with vanillin.

102
Figure 30: Spectrophotometric assays of aldehyde oxidase activities using rainbow trout,
Wistar rat and human liver cytosol at 37˚C with AOX substrate DMAC. For assays using 50
µL rainbow trout [red], 30 µL Wistar rat [green] and 20 µL human [black] liver cytosol. 100
µM final substrate concentrations were used. For analysis conditions see section 2.4.
Figure 31: Spectrophotometric assays of aldehyde oxidase activities using rainbow trout,
Wistar rat and human liver cytosol at 37˚C with AOX substrate vanillin. For assays using
rainbow trout [red], Wistar rat [green] and human [black] liver cytosol. For all assays 100 µM
final substrate concentrations were used. For analysis conditions see section 2.4.
0.4
0.45
0.5
0.55
0.6
0.65
0.7
0 1 2 3 4 5
OD
Time (minute)
Trout
Rat
Human
0.55
0.6
0.65
0.7
0.75
0.8
0.85
0.9
0 1 2 3 4 5
OD
Time (minute)
Trout
Rat
Human

103
Figure 32: HPLC analysis of the in vitro biotransformation of vanillin by rainbow trout
cytosol. (a) Liver, (b) kidney and (c) gill liver cytosol. Times at the left hand side of the
chromatograms indicate incubation times. HPLC chromatograms are offset on the vertical
axis to allow comparison between different incubation times. Analytes were injected onto a C-
18 column (Kromasil 5 µm) and eluted with a 0.22 M KH2PO4: acetonitrile system (85: 15)
as mobile phase. The wavelength of the detection was 285 nm.
Time (minutes)
Time (minutes)
Time (minutes)
(a)
(b)
(c)
Rainbow trout
Liver
Vanillin
AOX
Rainbow trout
Kidney
Vanillin
AOX
Rainbow trout
Gill
Vanillin
AOX

104
Figure 33: HPLC analysis of the in vitro biotransformation of vanillin by liver cytosol.
HPLC chromatogram of the in vitro oxidation of vanillin to vanillic acid by (a) rainbow trout,
(b) Wistar rat and (c) human liver cytosol. Times at the left hand side of the chromatograms
indicate incubation times. HPLC chromatograms are offset on the vertical axis to allow
comparison between different incubation times. Analytes were injected onto a C-18 column
(Kromasil 5 µm) and eluted with a 0.22 M KH2PO4: acetonitrile system (85: 15) as mobile
phase. The wavelength of the detection was 285 nm.
Time (minutes)
Time (minutes)
Time (minutes)
(a)
(b)
(c)
Rainbow trout
Liver
Vanillin
AOX
Rat
Liver
Vanillin
AOX
Human
Liver
Vanillin
AOX

105
3.2.2. HPLC analysis of AOX activity with endogenous vitamins and
vitamin metabolites.
When the endogenous vitamin B6 (pyridoxal) was incubated with rainbow trout,
Wistar rat and human liver cytosol its metabolite pyridoxic acid was generated with
cytosols from all three species (Figure 34).
Figure 34: HPLC analysis of the in vitro biotransformation of endogenous compound
pyridoxal by liver cytosol from different species. HPLC chromatogram of the in vitro oxidation of
pyridoxal to pyridoxic acid by (a) rainbow Trout, (b) Wistar rat, (c) human liver cytosol. Times at the
left hand side of the chromatograms indicate incubation times. HPLC chromatograms are offset on the
vertical axis to allow comparison between different incubation times. Analytes were injected onto a C-
18 column (Kromasil 5 µm) using methanol: 60 mM Na2HPO4 (25: 75) as mobile phase. The
wavelength of the detection was 315 nm.
Time (minutes)
Time (minutes)
Time (minutes)
(a)
(b)
(c)
Rainbow trout
Liver
Pyridoxal
AOX
Rat
Liver
Pyridoxal
AOX
Human
Liver
Pyridoxal
AOX

106
When all-trans retinal (vitamin A) was incubated with rainbow trout, Wistar rat and
human liver cytosol, the AOX metabolite retinoic acid was generated with cytosols
from all three species (Figure 35).
Figure 35: HPLC analysis of the in vitro biotransformation of endogenous compound all-
trans retinal by liver cytosol from different species. HPLC chromatogram of the in vitro oxidation
of all-trans retinal to retinoic acid by (a) rainbow Trout, (b) Wistar rat, (c) human liver cytosol. Times
at the left hand side of the chromatograms indicate incubation times. HPLC chromatograms are offset
on the vertical axis to allow comparison between different incubation times. Analytes were injected
onto a C-18 column (Kromasil 5 µm) and eluted with a 30 mM CH3COONH4: acetonitrile (30: 70) as
mobile phase. The wavelength of the detection was 378 nm.
Time (minutes)
Time (minutes)
Time (minutes)
(a)
(b)
(c)
Rainbow trout
Liver
Retinal
AOX
Rat
Liver
Retinal
AOX
Human
Liver
Retinal
AOX

107
When liver cytosol from rainbow trout, Wistar rat and human were incubated with N1-
methylnicotinamide (NMN)two products (Figure 36) were observed with retention
times of (9 minute) N1-methyl-2-pyridone-5-carboxamide (2-PY) and (12 minute) N
1-
methyl-4-pyridone-5-carboxamide (4-PY) (Szafarz et al., 2010).
Figure 36: HPLC analysis of the in vitro biotransformation of N1-methylnicotinamide by liver
cytosol from different species. HPLC chromatogram of the in vitro oxidation of N1-methylnicotinamide
to (2-PY and 4-PY) by (a) rainbow Trout, (b) Wistar rat, (c) human liver cytosol. Times at the left hand side
of the chromatograms indicate incubation times. HPLC chromatograms are offset on the vertical axis to
allow comparison between different incubation times. Analytes were injected onto a C-18 column
(Spherisorb; CNRP 5 µm) and eluted with a 0.8 % v/v formic acid: acetonitrile gradient as described in
section 2.5.3 as mobile phase. The wavelength of the detection was 254 nm.
Time (minutes)
Time (minutes)
Time (minutes)
(a)
(b)
(c)
Rainbow trout
Liver
NMN
AOX
Rat
Liver
NMN
AOX
Human
Liver
NMN
AOX
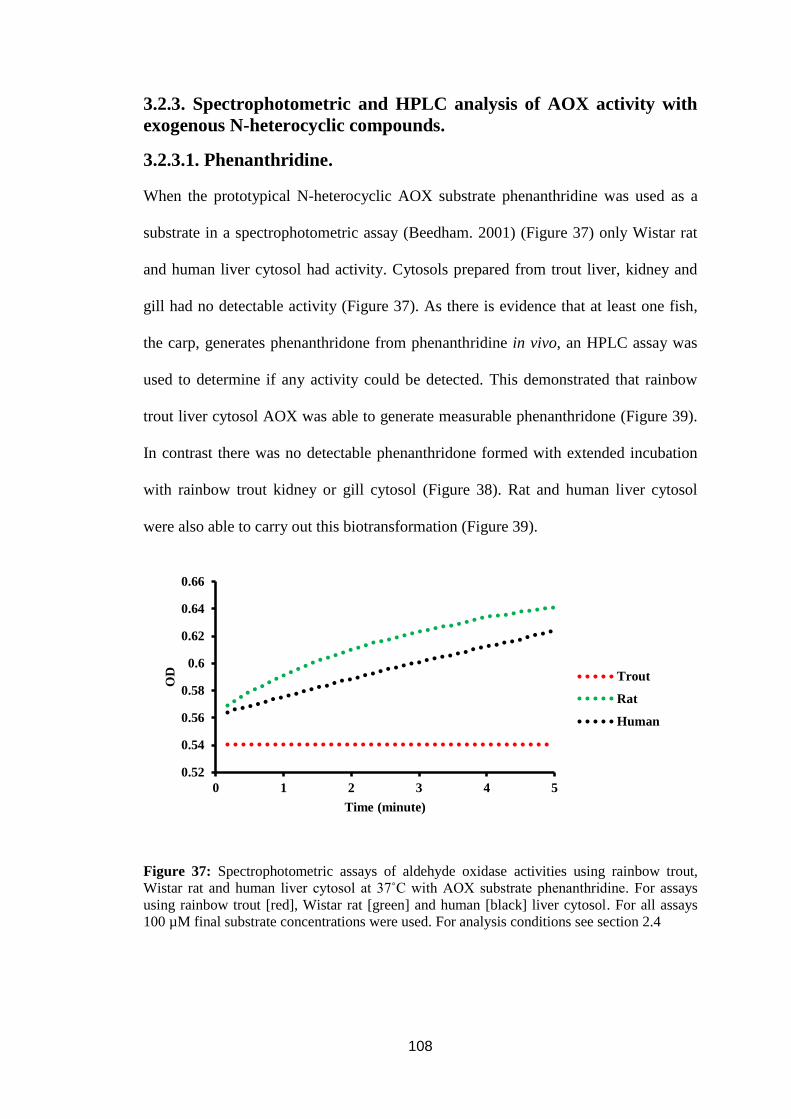
108
3.2.3. Spectrophotometric and HPLC analysis of AOX activity with
exogenous N-heterocyclic compounds.
3.2.3.1. Phenanthridine.
When the prototypical N-heterocyclic AOX substrate phenanthridine was used as a
substrate in a spectrophotometric assay (Beedham. 2001) (Figure 37) only Wistar rat
and human liver cytosol had activity. Cytosols prepared from trout liver, kidney and
gill had no detectable activity (Figure 37). As there is evidence that at least one fish,
the carp, generates phenanthridone from phenanthridine in vivo, an HPLC assay was
used to determine if any activity could be detected. This demonstrated that rainbow
trout liver cytosol AOX was able to generate measurable phenanthridone (Figure 39).
In contrast there was no detectable phenanthridone formed with extended incubation
with rainbow trout kidney or gill cytosol (Figure 38). Rat and human liver cytosol
were also able to carry out this biotransformation (Figure 39).
Figure 37: Spectrophotometric assays of aldehyde oxidase activities using rainbow trout,
Wistar rat and human liver cytosol at 37˚C with AOX substrate phenanthridine. For assays
using rainbow trout [red], Wistar rat [green] and human [black] liver cytosol. For all assays
100 µM final substrate concentrations were used. For analysis conditions see section 2.4
0.52
0.54
0.56
0.58
0.6
0.62
0.64
0.66
0 1 2 3 4 5
OD
Time (minute)
Trout
Rat
Human
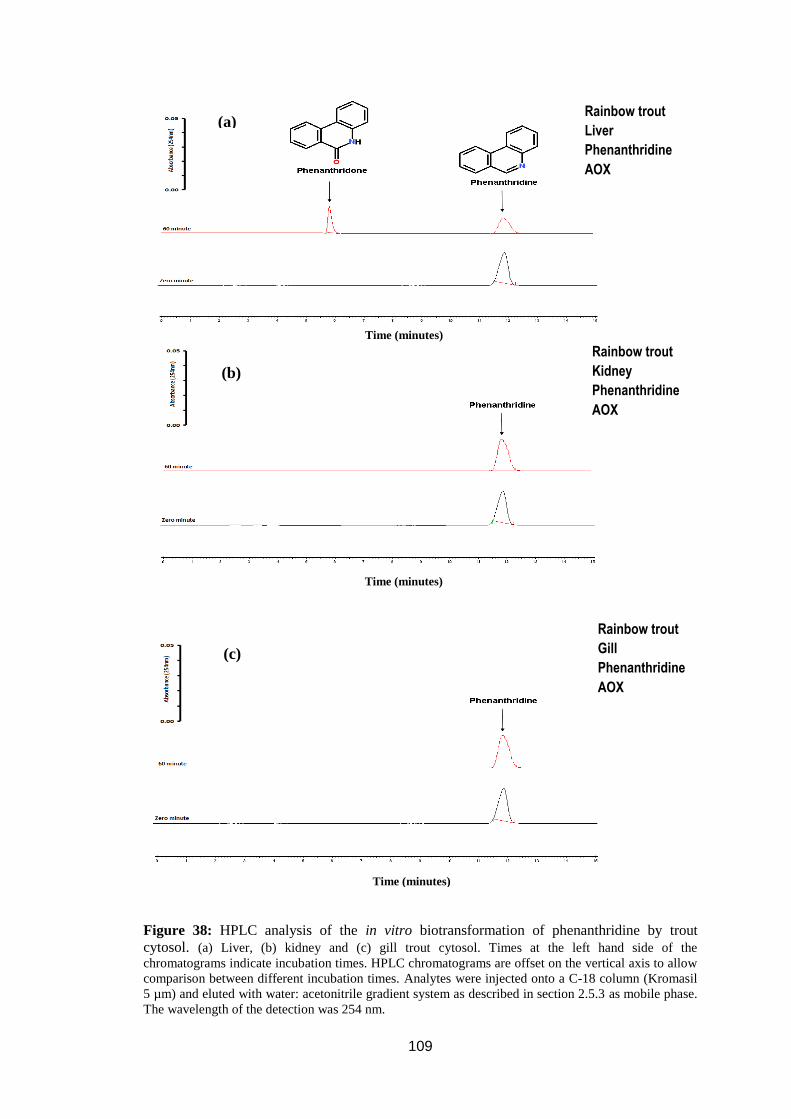
109
Figure 38: HPLC analysis of the in vitro biotransformation of phenanthridine by trout
cytosol. (a) Liver, (b) kidney and (c) gill trout cytosol. Times at the left hand side of the
chromatograms indicate incubation times. HPLC chromatograms are offset on the vertical axis to allow
comparison between different incubation times. Analytes were injected onto a C-18 column (Kromasil
5 µm) and eluted with water: acetonitrile gradient system as described in section 2.5.3 as mobile phase.
The wavelength of the detection was 254 nm.
Time (minutes)
Time (minutes)
Time (minutes)
(a)
(b)
(c)
Rainbow trout
Liver
Phenanthridine
AOX
Rainbow trout
Kidney
Phenanthridine
AOX
Rainbow trout
Gill
Phenanthridine
AOX

110
Figure 39: HPLC analysis of the in vitro biotransformation of phenanthridine by rainbow
trout, Wistar rat, and human liver cytosol. (a) rainbow trout, (b) Wistar rat, (c) human liver cytosol.
HPLC chromatogram of the in vitro oxidation of phenanthridine to phenanthridone. Times at the left
hand side of the chromatograms indicate incubation times. HPLC chromatograms are offset on the
vertical axis to allow comparison between different incubation times. Analytes were injected onto a C-
18 column (Kromasil 5 µm) and eluted with water: acetonitrile gradient system as described in section
2.5.3 as mobile phase. The wavelength of the detection was 254 nm.
Time (minutes)
Time (minutes)
Time (minutes)
(a)
(b)
(c)
Rainbow trout
Liver
Phenanthridine
AOX
Rat
Liver
Phenanthridine
AOX
Human
Liver
Phenanthridine
AOX
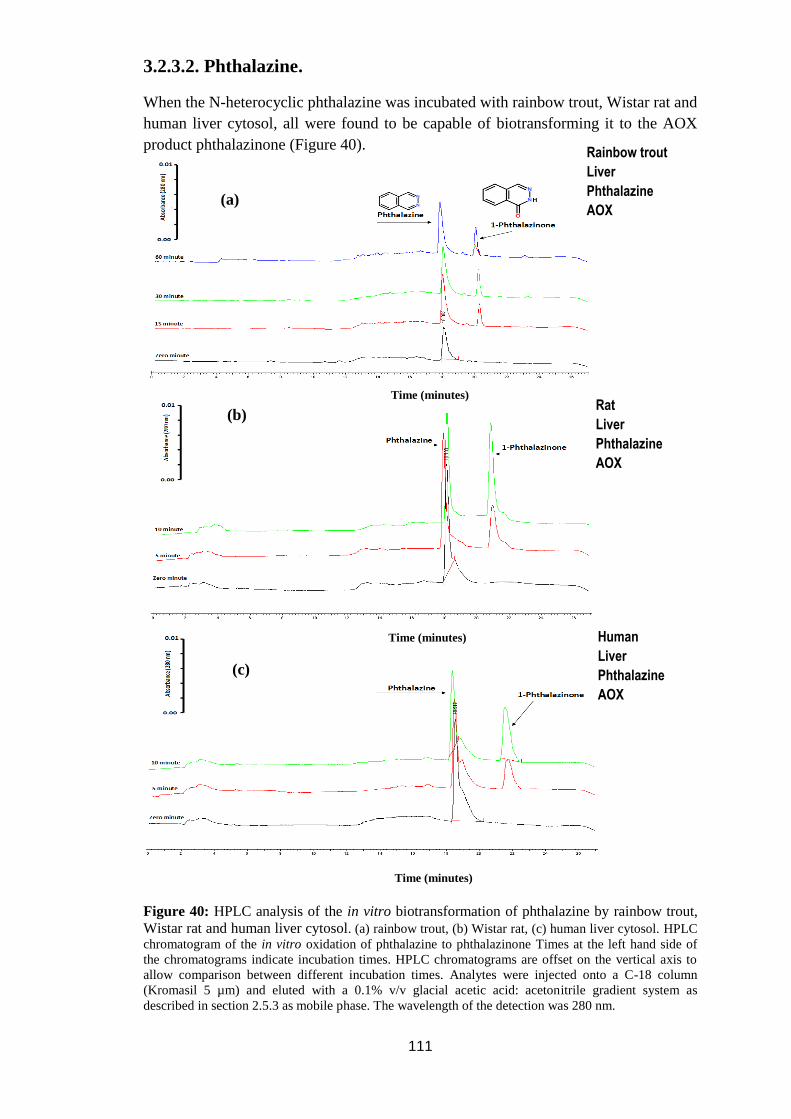
111
3.2.3.2. Phthalazine.
When the N-heterocyclic phthalazine was incubated with rainbow trout, Wistar rat and
human liver cytosol, all were found to be capable of biotransforming it to the AOX
product phthalazinone (Figure 40).
Figure 40: HPLC analysis of the in vitro biotransformation of phthalazine by rainbow trout,
Wistar rat and human liver cytosol. (a) rainbow trout, (b) Wistar rat, (c) human liver cytosol. HPLC
chromatogram of the in vitro oxidation of phthalazine to phthalazinone Times at the left hand side of
the chromatograms indicate incubation times. HPLC chromatograms are offset on the vertical axis to
allow comparison between different incubation times. Analytes were injected onto a C-18 column
(Kromasil 5 µm) and eluted with a 0.1% v/v glacial acetic acid: acetonitrile gradient system as
described in section 2.5.3 as mobile phase. The wavelength of the detection was 280 nm.
(a)
(b)
(c)
Time (minutes)
Time (minutes)
Time (minutes)
Rainbow trout
Liver
Phthalazine
AOX
Rat
Liver
Phthalazine
AOX
Human
Liver
Phthalazine
AOX

112
3.2.3.3. Cinchonine.
When anti-malaria drug N-heterocycle cinchonine was incubated with rainbow trout,
Wistar rat and human liver cytosol, a metabolite of cinchonine was detected by HPLC
with all samples (Figure 41) that had a retention time (12 minute) indicative of 2’-
cinchoninone (Beedham et al., 1992).
Figure 41: HPLC analysis of the in vitro biotransformation of cinchonine to 2-cinchoninone
by rainbow trout, Wistar rat and human liver cytosol. (a) rainbow trout, (b) Wistar rat, (c) human
liver cytosol. Times at the left hand side of the chromatograms indicate incubation times. HPLC
chromatograms are offset on the vertical axis to allow comparison between different incubation times.
Analytes were injected onto a C-18 column (Kromasil 5 µm) and eluted with a 0.4% w/v
CH3COONH4: acetonitrile (65: 35) as mobile phase. The wavelength of the detection was 248 nm.
Time (minutes)
Time (minutes)
Time (minutes)
(a)
(b)
(c)
Rainbow trout
Liver
Cinchonine
AOX
Rat
Liver
Cinchonine
AOX
Human
Liver
Cinchonine
AOX
113
3.2.3.4. Pyrazinamide.
In mammals the tuberculosis drug pyrazinamide is biotransformed by AOX and XOR.
Pyrazinamide was incubated with rainbow trout, Wistar rat and human liver cytosol
with O2 or with NAD+
as electron acceptor and HPLC analysis were carried out. After
incubation with rainbow trout liver cytosol with O2 or with NAD+ (Figure 42). The
incubation of rainbow trout liver cytosol with pyrazinamide in the presence of O2 as
an electron acceptor for 240 minute incubation time did not show the production of
any metabolite peak as seen in (Figure 42a). In contrast, the incubation of trout liver
cytosol with pyrazinamide with NAD+ as an electron acceptor generated 5-
hydroxypyrazinamide (Figure 42b). In contrast Wistar rat and human liver cytosol
displayed activity with both O2 and NAD+ as electron acceptor (Figure 43 and 44),
indicating that in these species pyrazinamide was a substrate for both oxidase and
dehydrogenase enzymes.

114
Figure 42: HPLC analysis of the in vitro biotransformation of pyrazinamide by rainbow trout
liver cytosol at 37˚C. Incubation (a) with O2(b) with NAD+
as an electron acceptor. Times at
the left hand side of the chromatograms indicate incubation times. HPLC chromatograms are
offset on the vertical axis to allow comparison between different incubation times. Analytes
were injected onto a C-18 column (Kromasil 5 µm) and eluted with a 20 mM KH2PO4:
acetonitrile (95: 5) as mobile phase. The wavelength of the detection was 268 nm.
Time (minutes)
Time (minutes)
(a)
(b)
Rainbow trout
Liver
Pyrazinamide
+ O2
AOX
Rainbow trout
Liver
Pyrazinamide
+ NAD+
XOR

115
Figure 43: HPLC analysis of the in vitro biotransformation of pyrazinamide by Wistar rat and
human liver cytosol at 37°C. Incubation with O2 as an electron acceptor. (a) Wistar rat, (b)
human liver cytosol. Times at the left hand side of the chromatograms indicate incubation
times. HPLC chromatograms are offset on the vertical axis to allow comparison between
different incubation times. Analytes were injected onto a C-18 column (Kromasil 5 µm) and
eluted with a 20 mM KH2PO4: acetonitrile (95: 5) as mobile phase. The wavelength of the
detection was 268 nm.
Time (minutes)
(a)
(b)
Time (minutes)
Rat
Liver
Pyrazinamide
+ O2
AOX
Human
Liver
Pyrazinamide
+ O2
AOX

116
Figure 44: HPLC analysis of the in vitro biotransformation of pyrazinamide by Wistar rat and
human liver cytosol at 37°C.Incubation with NAD +as an electron acceptor. (a) Wistar rat, (b)
human liver cytosol. Times at the left hand side of the chromatograms indicate incubation
times. HPLC chromatograms are offset on the vertical axis to allow comparison between
different incubation times. Analytes were injected onto a C-18 column (Kromasil 5 µm) and
eluted with a 20 mM KH2PO4: acetonitrile (95: 5) as mobile phase. The wavelength of the
detection was 268 nm.
Time (minutes)
Time (minutes)
(a)
(b)
Rat
Liver
Pyrazinamide
+ NAD+
XOR
Human
Liver
Pyrazinamide
+ NAD+
XOR
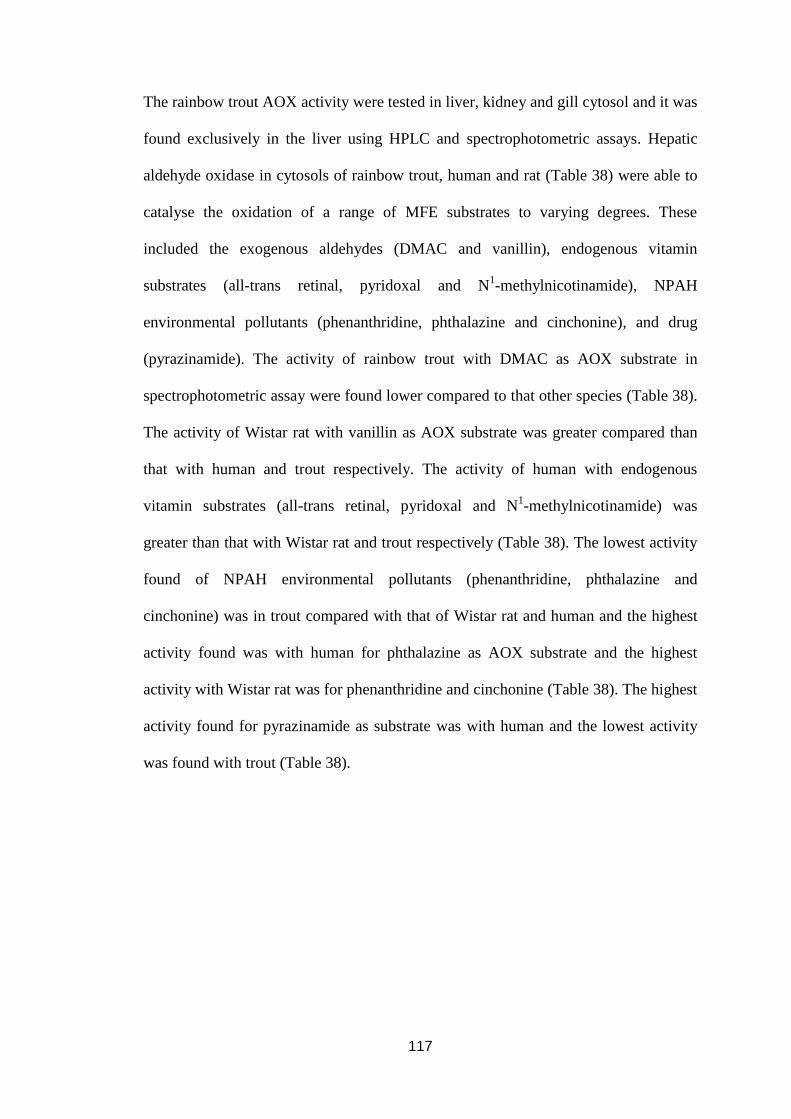
117
The rainbow trout AOX activity were tested in liver, kidney and gill cytosol and it was
found exclusively in the liver using HPLC and spectrophotometric assays. Hepatic
aldehyde oxidase in cytosols of rainbow trout, human and rat (Table 38) were able to
catalyse the oxidation of a range of MFE substrates to varying degrees. These
included the exogenous aldehydes (DMAC and vanillin), endogenous vitamin
substrates (all-trans retinal, pyridoxal and N1-methylnicotinamide), NPAH
environmental pollutants (phenanthridine, phthalazine and cinchonine), and drug
(pyrazinamide). The activity of rainbow trout with DMAC as AOX substrate in
spectrophotometric assay were found lower compared to that other species (Table 38).
The activity of Wistar rat with vanillin as AOX substrate was greater compared than
that with human and trout respectively. The activity of human with endogenous
vitamin substrates (all-trans retinal, pyridoxal and N1-methylnicotinamide) was
greater than that with Wistar rat and trout respectively (Table 38). The lowest activity
found of NPAH environmental pollutants (phenanthridine, phthalazine and
cinchonine) was in trout compared with that of Wistar rat and human and the highest
activity found was with human for phthalazine as AOX substrate and the highest
activity with Wistar rat was for phenanthridine and cinchonine (Table 38). The highest
activity found for pyrazinamide as substrate was with human and the lowest activity
was found with trout (Table 38).

118
Table 38: Summary of in vitro studies of hepatic aldehyde oxidase activity in different
species using HPLC and spectrophotometric assays with different substrates
Substrate Species Activity
DMAC Rainbow trout
Wistar rat
Human
+++
++++
+++++
Vanillin Rainbow trout
Wistar rat
Human
++
+++++
+++
Pyridoxal Rainbow trout
Wistar rat
Human
++
++++
+++++
All-trans retinal Rainbow trout
Wistar rat
Human
++
++++
+++++
N1-methylnicotinamide
Rainbow trout
Wistar rat
Human
+
++++
+++++
Phenanthridine Rainbow trout
Wistar rat
Human
+
+++++
++++
Phthalazine Rainbow trout
Wistar rat
Human
++
++++
+++++
Cinchonine Rainbow trout
Wistar rat
Human
++
+++++
++++
Pyrazinamide Rainbow trout
Wistar rat
Human
+
+++++
++++ (+++++ = ultra-high activity,++++ =high activity, +++ = intermediate activity, ++ = low activity,
+ = very low activity).

119
3.3. Spectrophotometric and HPLC analysis of molybdo-flavoenzyme
activity with endogenous purine and purine analogue substrates.
3.3.1. Xanthine and 1-methylxanthine.
For XOR activity two substrates were assessed using spectrophotometry. These were
the endogenous purine catabolite xanthine and the major caffeine metabolite 1-
methylxanthine. (Figure 45) illustrates spectrophotometric assays with the xanthine
demonstrating that liver cytosols from Wistar rat and human had measurable XOR
activity with and without NAD+. In contrast rainbow trout liver cytosol only had
measurable XOR activity in presence of NAD+ (Figure 45b). Similar
spectrophotometric results were obtained with 1-methylxanthine (data not shown).
Rainbow trout kidney and gill cytosols had no measurable activity towards either of
these substrates.
In order to check unequivocally if there was no XDH activity towards xanthine and 1-
methylxanthinein kidney and gill cytosols a sensitive HPLC assay was used, this
showed that even following a 120 minute incubation with these substrates there was
no uric acid metabolite formed in contrast to liver cytosol (Figures 46 and
47).Reflecting the results from the spectrophotometric assay even after an extended 2
hour incubation no uric acid metabolite was formed with O2 as an electron acceptor.
When xanthine and 1-methylxanthine were incubated with rainbow trout liver cytosol
(Figures 48 and 49) there were appreciable levels of uric acid produced with NAD+ as
electron acceptor. This was in contrast to that found when rat and human liver cytosol
was incubated with these substrates where both electron acceptors were utilised
resulting in uric acid metabolite being formed with both the endogenous and
exogenous purine (Figures 50, 51, 52 and 53).
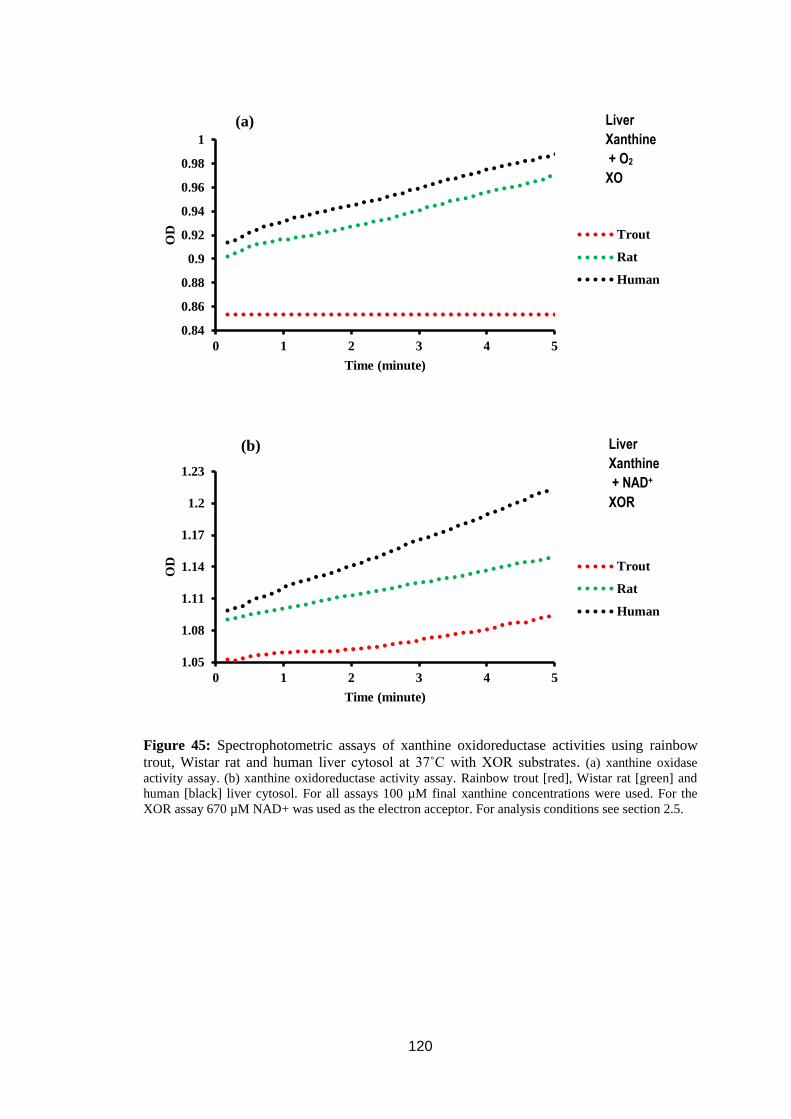
120
Figure 45: Spectrophotometric assays of xanthine oxidoreductase activities using rainbow
trout, Wistar rat and human liver cytosol at 37˚C with XOR substrates. (a) xanthine oxidase
activity assay. (b) xanthine oxidoreductase activity assay. Rainbow trout [red], Wistar rat [green] and
human [black] liver cytosol. For all assays 100 µM final xanthine concentrations were used. For the
XOR assay 670 µM NAD+ was used as the electron acceptor. For analysis conditions see section 2.5.
0.84
0.86
0.88
0.9
0.92
0.94
0.96
0.98
1
0 1 2 3 4 5
OD
Time (minute)
Trout
Rat
Human
1.05
1.08
1.11
1.14
1.17
1.2
1.23
0 1 2 3 4 5
OD
Time (minute)
Trout
Rat
Human
(a)
(b)
Liver
Xanthine
+ O2
XO
Liver
Xanthine
+ NAD+
XOR

121
Figure 46: HPLC analysis of the in vitro biotransformation of xanthine + NAD+
by rainbow
trout cytosol. The chromatogram(a) Liver, (b) Kidney and (c) Gill trout cytosol with xanthine and
NAD+. Times at the left hand side of the chromatograms indicate incubation times. HPLC
chromatograms are offset on the vertical axis to allow comparison between different incubation times
.Analytes were injected onto a C-18 column (Kromasil 5 µm) and eluted with a 0.1% v/v glacial acetic
acid: acetonitrile gradient system as described in section 2.5.3 as mobile phase. The wavelength of the
detection was 280 nm.
(a)
(b)
(c)
Time/minute
Time/minute
Time/minute
Rainbow trout
Liver
Xanthine
+ NAD+
XOR
Rainbow trout
Kidney
Xanthine
+ NAD+
XOR
Rainbow trout
Gill
Xanthine
+ NAD+
XOR

122
Figure 47: HPLC analysis of the in vitro biotransformation of 1-methylxanthine + NAD+
by
rainbow trout cytosol. The chromatogram (a) Liver, (b) Kidney and (c) Gill trout cytosol with
xanthine and NAD+. Times at the left hand side of the chromatograms indicate incubation times. HPLC
chromatograms are offset on the vertical axis to allow comparison between different incubation times
.Analytes were injected onto a C-18 column (Kromasil 5 µm) and eluted with a 0.1% v/v glacial acetic
acid: acetonitrile gradient system as described in section 2.5.3 as mobile phase. The wavelength of the
detection was 280 nm.
(b)
(c)
Time/minute
Time/minute
Time/minute
(a)
Rainbow trout
Liver
1-methylxanthine
+ NAD+
XOR
Rainbow trout
Kidney
1-methylxanthine
+ NAD+
XOR
Rainbow trout
Gill
1-methylxanthine
+ NAD+
XOR
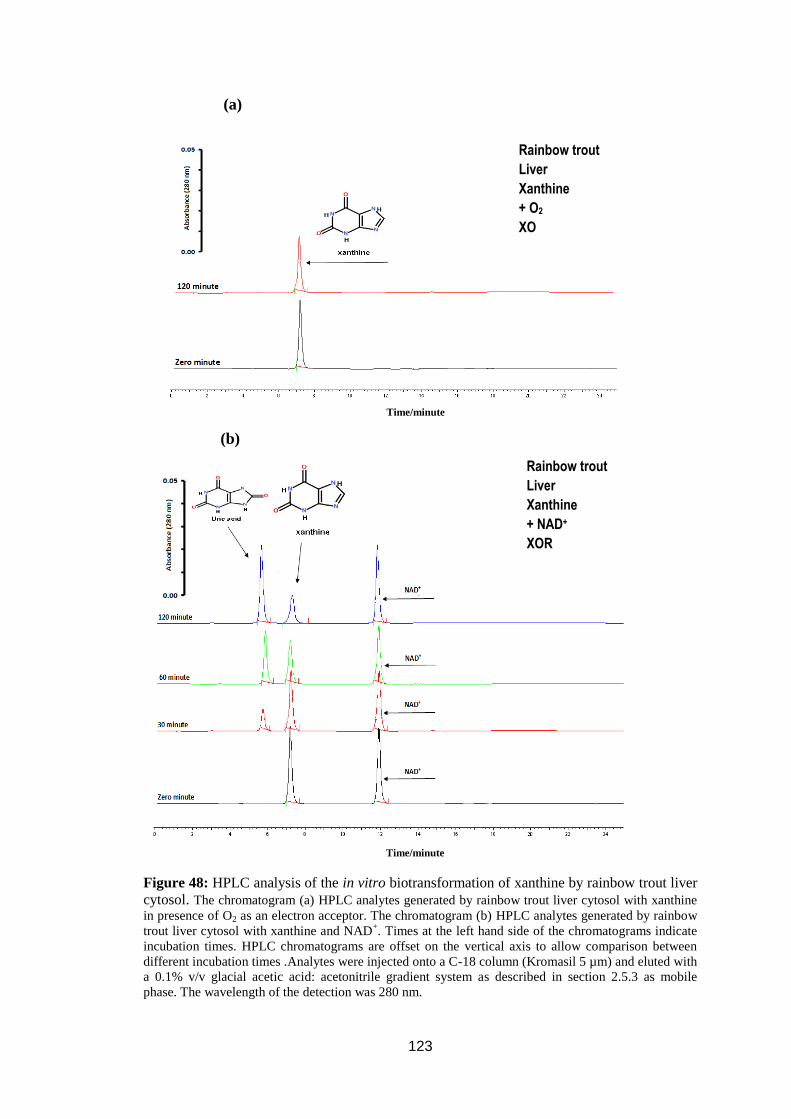
123
Figure 48: HPLC analysis of the in vitro biotransformation of xanthine by rainbow trout liver
cytosol. The chromatogram (a) HPLC analytes generated by rainbow trout liver cytosol with xanthine
in presence of O2 as an electron acceptor. The chromatogram (b) HPLC analytes generated by rainbow
trout liver cytosol with xanthine and NAD+. Times at the left hand side of the chromatograms indicate
incubation times. HPLC chromatograms are offset on the vertical axis to allow comparison between
different incubation times .Analytes were injected onto a C-18 column (Kromasil 5 µm) and eluted with
a 0.1% v/v glacial acetic acid: acetonitrile gradient system as described in section 2.5.3 as mobile
phase. The wavelength of the detection was 280 nm.
(a)
(b)
Time/minute
Time/minute
(a)
Rainbow trout
Liver
Xanthine
+ O2
XO
Rainbow trout
Liver
Xanthine
+ NAD+
XOR
Time/minute

124
Figure 49: HPLC analysis of the in vitro biotransformation of 1-methylxanthine by rainbow
trout liver cytosol at 37ºC. The chromatogram (a) HPLC analytes generated by rainbow trout liver
cytosol with 1-methylxanthine in the presence of O2 as an electron acceptor. The chromatogram (b)
HPLC analytes generated by trout liver cytosol with 1-methylxanthine and NAD+
as an electron
acceptor.
Times at the left hand side of the chromatograms indicate incubation times. HPLC
chromatograms are offset on the vertical axis to allow comparison between different incubation times
.Analytes were injected onto a C-18 column (Kromasil 5 µm) and eluted with a 0.1% v/v glacial acetic
acid: acetonitrile gradient system as described in section 2.5.3 as mobile phase. The wavelength of the
detection was 280 nm.
Time (minutes)
Time (minutes)
(a)
(b)
Rainbow trout
Liver
1-methylxanthine
+ O2
XO
Rainbow trout
Liver
1-methylxanthine
+ NAD+
XOR

125
Figure 50: HPLC analysis of the in vitro biotransformation of xanthine by Wistar rat liver
cytosol. The chromatogram (a) HPLC analytes generated by rat liver cytosol with xanthine and O2 as
electron acceptor. The chromatogram (b) HPLC analytes generated by Wistar rat liver cytosol with
xanthine and NAD+. The amount of NAD
+ added to incubation 675µM. Times at the left hand side of
the chromatograms indicate incubation times. HPLC chromatograms are offset on the vertical axis to
allow comparison between different incubation times. Analytes were injected onto a C-18 column
(Kromasil 5 µm) and eluted with a 0.1% v/v glacial acetic acid: acetonitrile gradient system as
described in section 2.5.3 as mobile phase. The wavelength of the detection was 280 nm.
Time (minutes)
Time (minutes)
(b)
Time (minutes)
(a)
Rat
Liver
Xanthine
+ O2
XO
Rat
Liver
Xanthine
+ NAD+
XOR

126
Figure 51: HPLC analysis of the in vitro biotransformation of 1-methylxanthine by Wistar rat
liver cytosol at 370C. The chromatogram (a) HPLC analytes generated by Wistar rat liver cytosol
with 1-methylxanthine and O2 as an electron acceptor. The chromatogram (b) HPLC chromatogram for
incubation of Wistar rat liver cytosol with 1-MX and NAD+
as an electron acceptor. Times at the left
hand side of the chromatograms indicate incubation times. HPLC chromatograms are offset on the
vertical axis to allow comparison between different incubation times .Analytes were injected onto a C-
18 column (Kromasil 5 µm) and eluted with a 0.1% v/v glacial acetic acid: acetonitrile gradient system
as described in section 2.5.3 as mobile phase. The wavelength of the detection was 280 nm.
Time (minutes)
Time (minutes)
(a)
(b)
Rat
Liver
1-methylxanthine
+ O2
XO
Rat
Liver
1-methylxanthine
+ NAD+
XOR

127
Figure 52: HPLC analysis of the in vitro biotransformation of xanthine by human liver
cytosol. The chromatogram (a) HPLC analytes generated by human liver cytosol with xanthine and O2
as electron acceptor. The chromatogram (b) HPLC analytes generated by human liver cytosol with
xanthine and NAD+. The amount of NAD
+ added to incubation 675µM. Times at the left hand side of
the chromatograms indicate incubation times. HPLC chromatograms are offset on the vertical axis to
allow comparison between different incubation times Analytes were injected onto a C-18 column
(Kromasil 5 µm) and eluted with a 0.1% v/v glacial acetic acid: acetonitrile gradient system as
described in section 2.5.3 as mobile phase. The wavelength of the detection was 280 nm.
Time (minutes)
(a)
(b)
Human
Liver
Xanthine
+ O2
XO
Human
Liver
Xanthine
+ NAD+
XOR
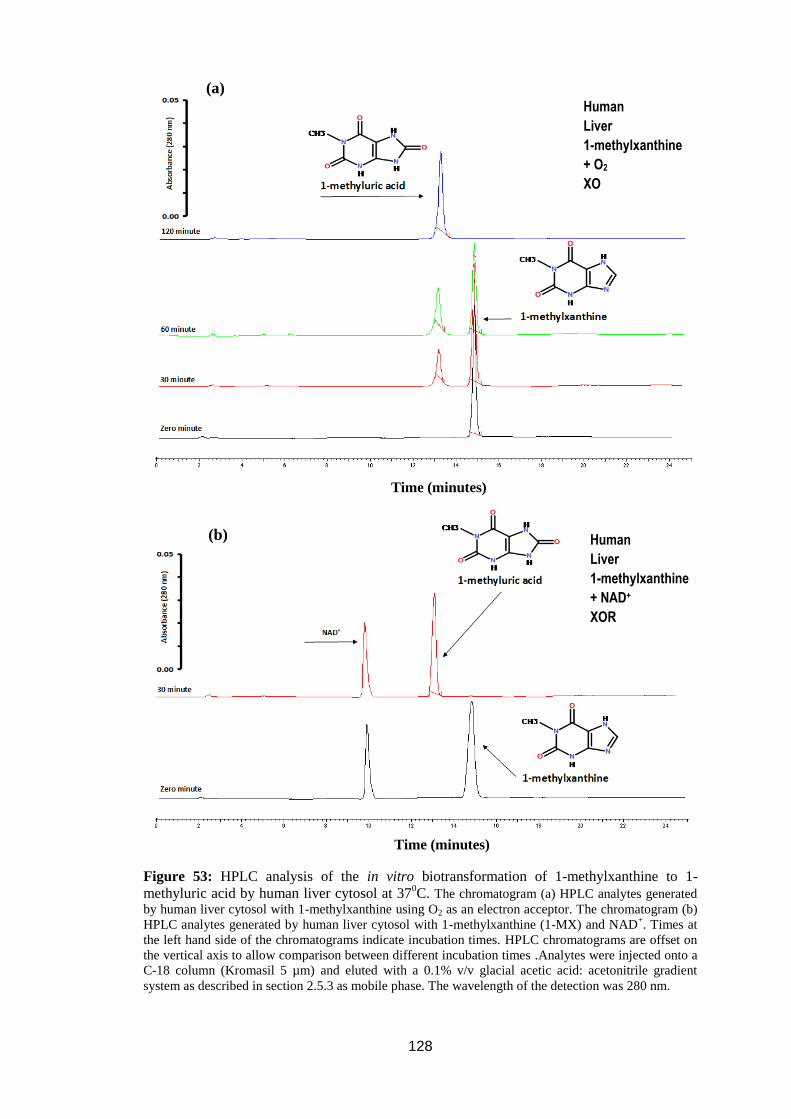
128
Figure 53: HPLC analysis of the in vitro biotransformation of 1-methylxanthine to 1-
methyluric acid by human liver cytosol at 370C. The chromatogram (a) HPLC analytes generated
by human liver cytosol with 1-methylxanthine using O2 as an electron acceptor. The chromatogram (b)
HPLC analytes generated by human liver cytosol with 1-methylxanthine (1-MX) and NAD+. Times at
the left hand side of the chromatograms indicate incubation times. HPLC chromatograms are offset on
the vertical axis to allow comparison between different incubation times .Analytes were injected onto a
C-18 column (Kromasil 5 µm) and eluted with a 0.1% v/v glacial acetic acid: acetonitrile gradient
system as described in section 2.5.3 as mobile phase. The wavelength of the detection was 280 nm.
Time (minutes)
Time (minutes)
(a)
(b)
Human
Liver
1-methylxanthine
+ O2
XO
Human
Liver
1-methylxanthine
+ NAD+
XOR

129
When the liver cytosol from all three species was incubated with the XOR inhibitor
oxipurinol and AOX inhibitor menadione, oxipurinol gave 100% inhibition while the
menadione did not have any effect (Figures 54, 55, 56, 57, 58 and 59), this illustrates
that XOR is responsible for biotransformation of xanthine and 1-methylxanthine to
their metabolites in these species.

130
Figure 54: HPLC analysis of the in vitro biotransformation of xanthine by rainbow trout liver
cytosol with and without enzyme inhibitors. The chromatogram of xanthine, NAD+ plus (a)
oxipurinol and (b) menadione. Red line with inhibitor and black line without inhibitor. The amount of
inhibitor added to incubation its 100µM. Times at the left hand side of the chromatograms indicate
incubation times. HPLC chromatograms are offset on the vertical axis to allow comparison between
different incubation times. Analytes were injected onto a C-18 column (Kromasil 5 µm) and eluted with
a 0.1% v/v glacial acetic acid: acetonitrile gradient system as described in section 2.5.3 as mobile
phase. The wavelength of the detection was 280 nm.
Time (minutes)
Time (minutes)
(a)
(b)
Rainbow trout
Liver
Xanthine
+ NAD+
+ Oxipurinol
XOR
Rainbow trout
Liver
Xanthine
+ NAD+
+ Menadione
XOR

131
Figure 55: HPLC analysis of the in vitro biotransformation of 1-methylxanthine by rainbow
trout liver cytosol with and without xanthine oxidoreductase and aldehyde oxidase inhibitors. HPLC chromatogram for incubation of trout liver with (1-MX), NAD
+ with (a) oxipurinol, (b)
menadione. Red lines with inhibitors and black lines without inhibitors. The amount of inhibitors added
to incubation its 100µM. Times at the left hand side of the chromatograms indicate incubation times.
HPLC chromatograms are offset on the vertical axis to allow comparison between different incubation
times. Analytes were injected onto a C-18 column (Kromasil 5 µm) and eluted with a 0.1% v/v glacial
acetic acid: acetonitrile gradient system as described in section 2.5.3 as mobile phase. The wavelength
of the detection was 280 nm.
(a)
Time (minutes)
Time (minutes)
(b)
Rainbow trout
Liver
1-methylxanthine
+ NAD+
+ Oxipurinol
XOR
Rainbow trout
Liver
1-methylxanthine
+ NAD+
+ Menadione
XOR

132
Figure 56: HPLC analysis of the in vitro biotransformation of xanthine by Wistar rat liver
cytosol with and without enzyme inhibitors. HPLC chromatogram for incubation of Wistar rat
liver cytosol with xanthine and (a) oxipurinol, (b) menadione. Red lines with inhibitors and
black lines without inhibitors. The amount of inhibitor added to incubation its 100µM. Times
at the left hand side of the chromatograms indicate incubation times. HPLC chromatograms
are offset on the vertical axis to allow comparison between different incubation times.
Analytes were injected onto a C-18 column (Kromasil 5 µm) and eluted with a 0.1% v/v
glacial acetic acid: acetonitrile gradient system as described in section 2.5.3 as mobile phase.
The wavelength of the detection was 280 nm.
Time (minutes) (b)
Time (minutes)
(a)
Rat
Liver
Xanthine
+ O2
+ Oxipurinol
XO
Rat
Liver
Xanthine
+ O2
+ Menadione
XO
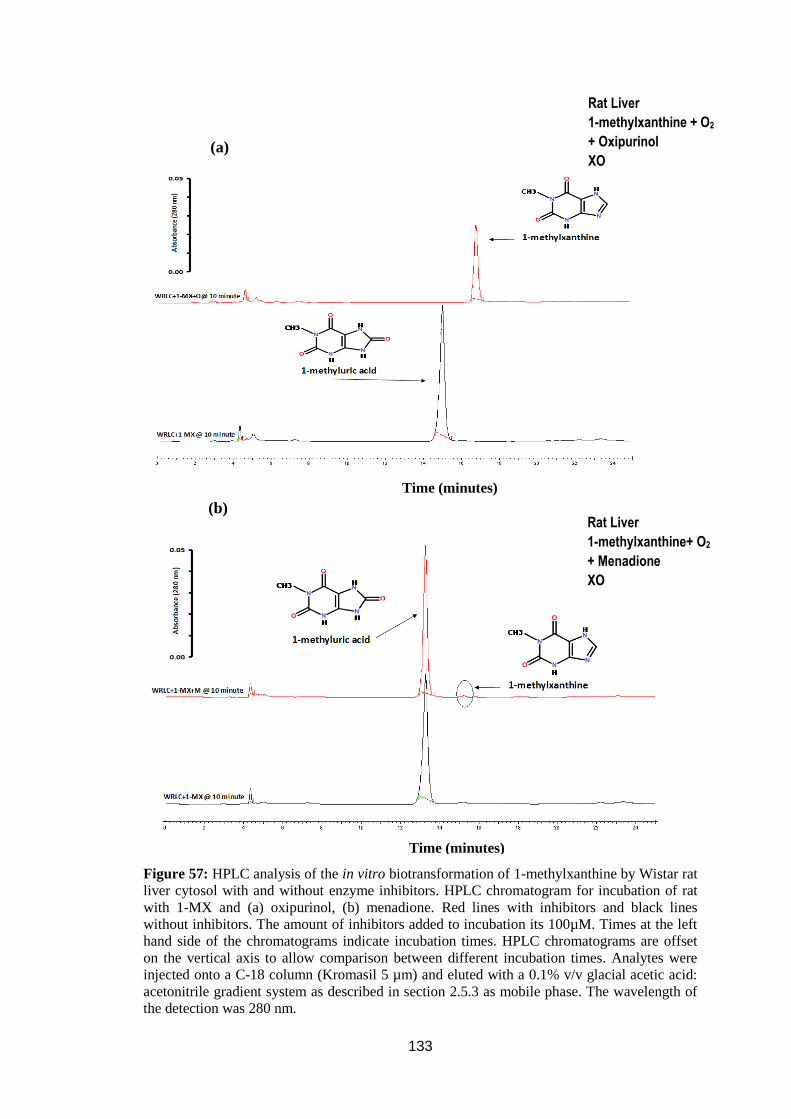
133
Figure 57: HPLC analysis of the in vitro biotransformation of 1-methylxanthine by Wistar rat
liver cytosol with and without enzyme inhibitors. HPLC chromatogram for incubation of rat
with 1-MX and (a) oxipurinol, (b) menadione. Red lines with inhibitors and black lines
without inhibitors. The amount of inhibitors added to incubation its 100µM. Times at the left
hand side of the chromatograms indicate incubation times. HPLC chromatograms are offset
on the vertical axis to allow comparison between different incubation times. Analytes were
injected onto a C-18 column (Kromasil 5 µm) and eluted with a 0.1% v/v glacial acetic acid:
acetonitrile gradient system as described in section 2.5.3 as mobile phase. The wavelength of
the detection was 280 nm.
Time (minutes)
Time (minutes)
(a)
(b)
Rat Liver
1-methylxanthine + O2
+ Oxipurinol
XO
Rat Liver
1-methylxanthine+ O2
+ Menadione
XO

134
Figure 58: HPLC analysis of the in vitro biotransformation of xanthine by human liver
cytosol with and without enzyme inhibitors. The chromatogram of human liver cytosol with
xanthine and (a) oxipurinol, (b) menadione. Red lines with inhibitors and black lines without
inhibitors The amount of inhibitor added to incubation its 100µM. Times at the left hand side
of the chromatograms indicate incubation times. HPLC chromatograms are offset on the
vertical axis to allow comparison between different incubation times. Analytes were injected
onto a C-18 column (Kromasil 5 µm) and eluted with a 0.1% v/v glacial acetic acid:
acetonitrile gradient system as described in section 2.5.3 as mobile phase. The wavelength of
the detection was 280 nm.
Time (minutes)
Time (minutes)
(b)
(a)
Human
Liver
Xanthine
+ O2
+ Menadione
XO
Human
Liver
Xanthine
+ O2
+ Oxipurinol
XO

135
Figure 59: HPLC analysis of the in vitro biotransformation of 1-methylxanthine by human
liver cytosol with and without enzyme inhibitors. HPLC chromatogram for incubation of
human liver with 1-MX and (a) oxipurinol, (b) menadione. Red lines with inhibitors and black
lines without inhibitors. The amount of inhibitors added to incubation its 100µM. Times at the
left hand side of the chromatograms indicate incubation times. HPLC chromatograms are
offset on the vertical axis to allow comparison between different incubation times. Analytes
were injected onto a C-18 column (Kromasil 5 µm) and eluted with a 0.1% v/v glacial acetic
acid: acetonitrile gradient system as described in section 2.5.3 as mobile phase. The
wavelength of the detection was 280 nm.
Time (minutes)
Time (minutes)
Time (minutes)
(a)
(b)
Human Liver
1-methylxanthine
+ O2
+ Oxipurinol
XO
Human Liver
1-methylxanthine
+ O2
+ Menadione
XO
136
3.3.3. 6-mercaptopurine.
6-mercaptopurine (6-MP) is a thiopurine anti-leukemia drug in which carbon 6 of
purine has been substituted with a sulphur atom. In mammals 6-MP is oxidized to 6-
thiouric acid via 6-thioxanthine or 8-oxo-6-mercaptopurine by AOX or XOR (Figure
17) although there is some controversy over the in vitro studies (Krenitsky et al.,
1972, Hall and Krenitsky. 1986, Rashidi et al., 2007). In order to validate the assay in
this study, rabbit liver cytosol was incubated with 6-MP and the products generated
analysed by HPLC. This demonstrated that when rabbit cytosol was incubated with 6-
MP with O2 as sole electron acceptor it was biotransformed to 6-thiouric acid via 6-
thioxanthine (Figure 60). This confirmed that the HPLC procedure and incubation
conditions had successfully detected and resolved the expected 6-MP metabolites
confirming the lack of detectable activity in rainbow trout liver cytosol towards this
substrate was not due to experimental conditions. According to the in vitro
experiments with rainbow trout, Wistar rat and human in this study, trout liver cytosol
incubated with 6-MP with and without NAD+ as an electron acceptor for 60 minute
incubation time no peak of 6-thiouric acid formed (Figure 61). In contrast Wistar rat
and human liver cytosol incubated with 6-mercaptopurine is a substrate for either
XOR or AOX using O2 or NAD+ as electron acceptors (Figures 62 and 63). On the
other hand as in the (Figures 64 and 65), in the Wistar rat and human liver cytosol
incubated with XOR inhibitor oxipurinol and AOX inhibitor menadione it was found
that oxipurinol produced 100% inhibition while menadione did not have any effect.
This shows that XOR was responsible for biotransformation of 6-mercaptopurine (6-
MP) to 6-thiouric acid. Due to the 6-MP not being a substrate for rainbow trout it was
decided to test 6-thioxanthine as a substrate for either XOR or AOX of rainbow trout
liver cytosol without and with NAD+ as electron acceptors (Figure 66). On the other
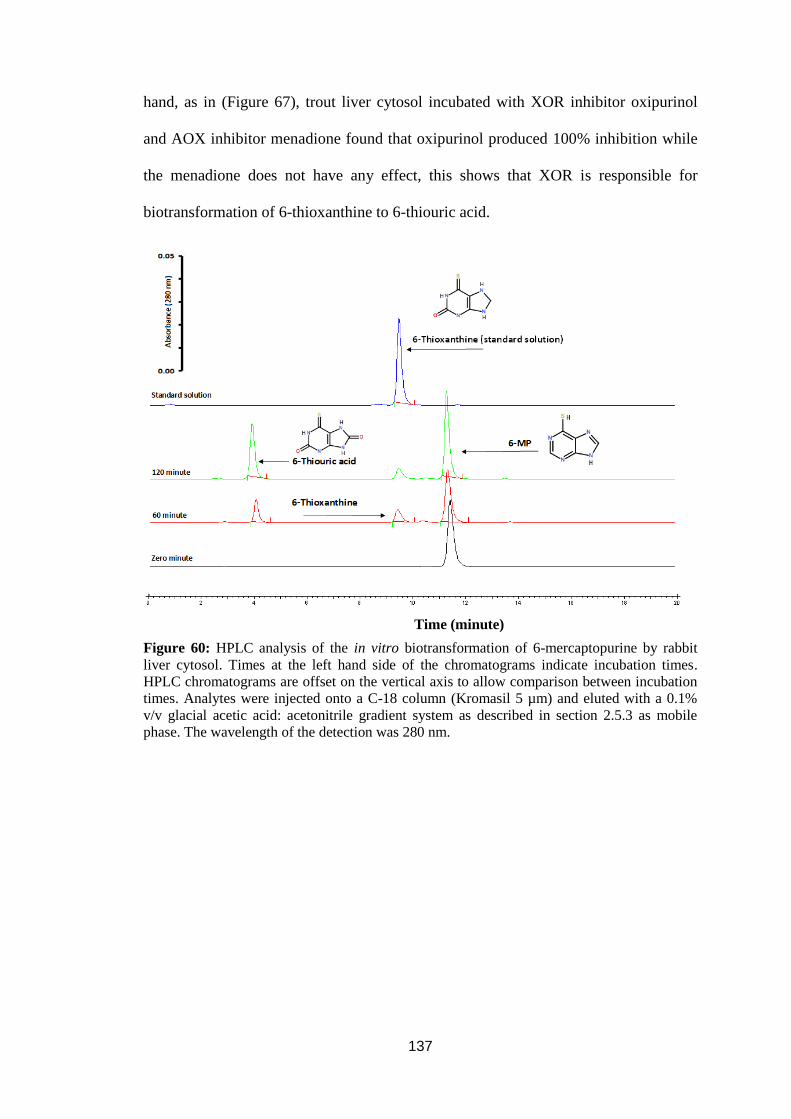
137
hand, as in (Figure 67), trout liver cytosol incubated with XOR inhibitor oxipurinol
and AOX inhibitor menadione found that oxipurinol produced 100% inhibition while
the menadione does not have any effect, this shows that XOR is responsible for
biotransformation of 6-thioxanthine to 6-thiouric acid.
Figure 60: HPLC analysis of the in vitro biotransformation of 6-mercaptopurine by rabbit
liver cytosol. Times at the left hand side of the chromatograms indicate incubation times.
HPLC chromatograms are offset on the vertical axis to allow comparison between incubation
times. Analytes were injected onto a C-18 column (Kromasil 5 µm) and eluted with a 0.1%
v/v glacial acetic acid: acetonitrile gradient system as described in section 2.5.3 as mobile
phase. The wavelength of the detection was 280 nm.
Time (minute)

138
Figure 61: HPLC analysis of analytes produced following the in vitro incubation of 6-
mercaptopurine with rainbow trout liver cytosol at 37°C. HPLC chromatogram (a) of analytes
generated following incubation of 6-MP with trout liver cytosol and O2 as an electron acceptor. HPLC
chromatogram (b) of analytes generated following incubation of 6-MP with trout liver cytosol and
NAD+ as an electron acceptor. Times at the left hand side of the chromatograms indicate incubation
times. HPLC chromatograms are offset on the vertical axis to allow comparison between different
incubation times. Analytes were injected onto a C-18 column (Kromasil 5 µm) and eluted with a 0.1%
v/v glacial acetic acid: acetonitrile gradient system as described in section 2.5.3 as mobile phase. The
wavelength of the detection was 280 nm.
Time (minutes)
Time (minutes)
(a)
(b)
Rainbow trout
Liver
6-mercaptopurine
+ O2
XO
Rainbow trout
Liver
6-mercaptopurine
+ NAD+
XOR

139
Figure 62: HPLC analysis of analytes produced following the in vitro incubation of 6-
mercaptopurine with Wistar rat liver cytosol at 37°C. HPLC chromatogram (a) of analytes
generated following incubation of 6-MP and O2 as an electron acceptor. HPLC chromatogram
(b) of analytes generated following incubation of 6-MP and NAD+. Times at the left hand side
of the chromatograms indicate incubation times. HPLC chromatograms are offset on the
vertical axis to allow comparison between different incubation times .Analytes were injected
onto a C-18 column (Kromasil 5 µm) and eluted with a 0.1% v/v glacial acetic acid:
acetonitrile gradient system as described in section 2.5.3 as mobile phase. The wavelength of
the detection was 280 nm.
Time (minutes)
Time (minutes)
(a)
(b)
Rat
Liver
6-mercaptopurine
+ O2
XO
Rat
Liver
6-mercaptopurine
+ NAD+
XOR
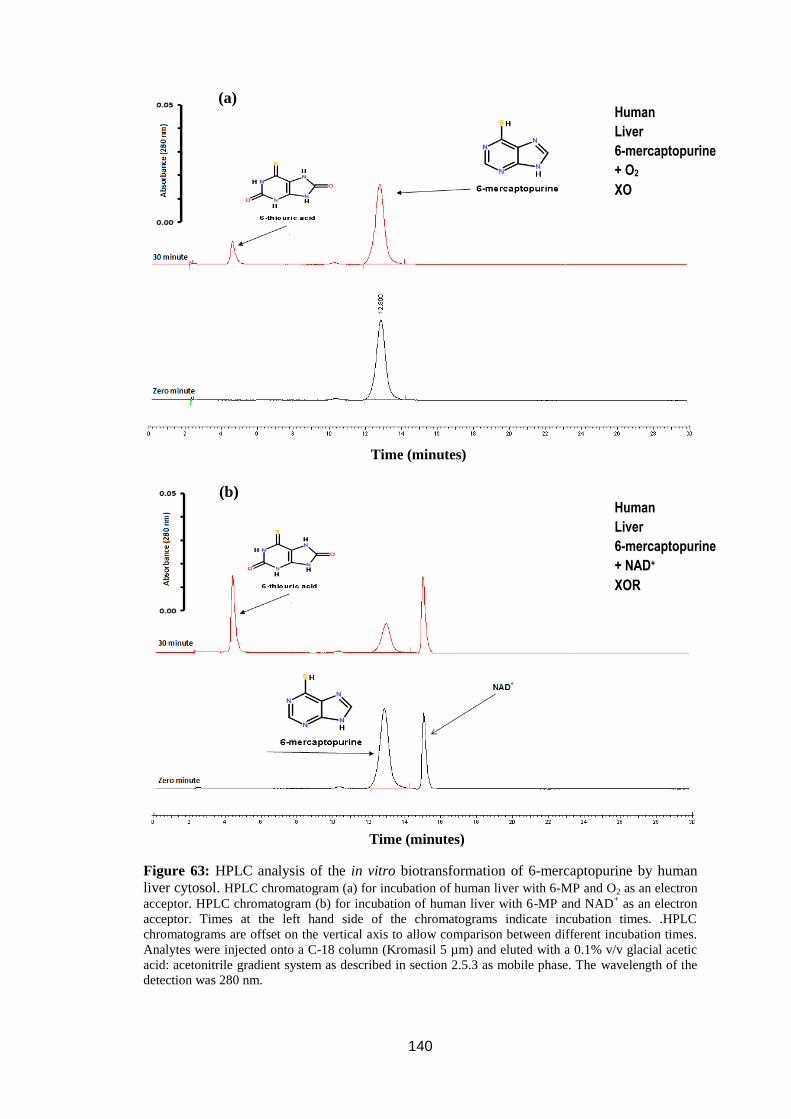
140
Figure 63: HPLC analysis of the in vitro biotransformation of 6-mercaptopurine by human
liver cytosol. HPLC chromatogram (a) for incubation of human liver with 6-MP and O2 as an electron
acceptor. HPLC chromatogram (b) for incubation of human liver with 6-MP and NAD+ as an electron
acceptor. Times at the left hand side of the chromatograms indicate incubation times. .HPLC
chromatograms are offset on the vertical axis to allow comparison between different incubation times.
Analytes were injected onto a C-18 column (Kromasil 5 µm) and eluted with a 0.1% v/v glacial acetic
acid: acetonitrile gradient system as described in section 2.5.3 as mobile phase. The wavelength of the
detection was 280 nm.
Time (minutes)
Time (minutes)
(a)
(b)
Human
Liver
6-mercaptopurine
+ O2
XO
Human
Liver
6-mercaptopurine
+ NAD+
XOR
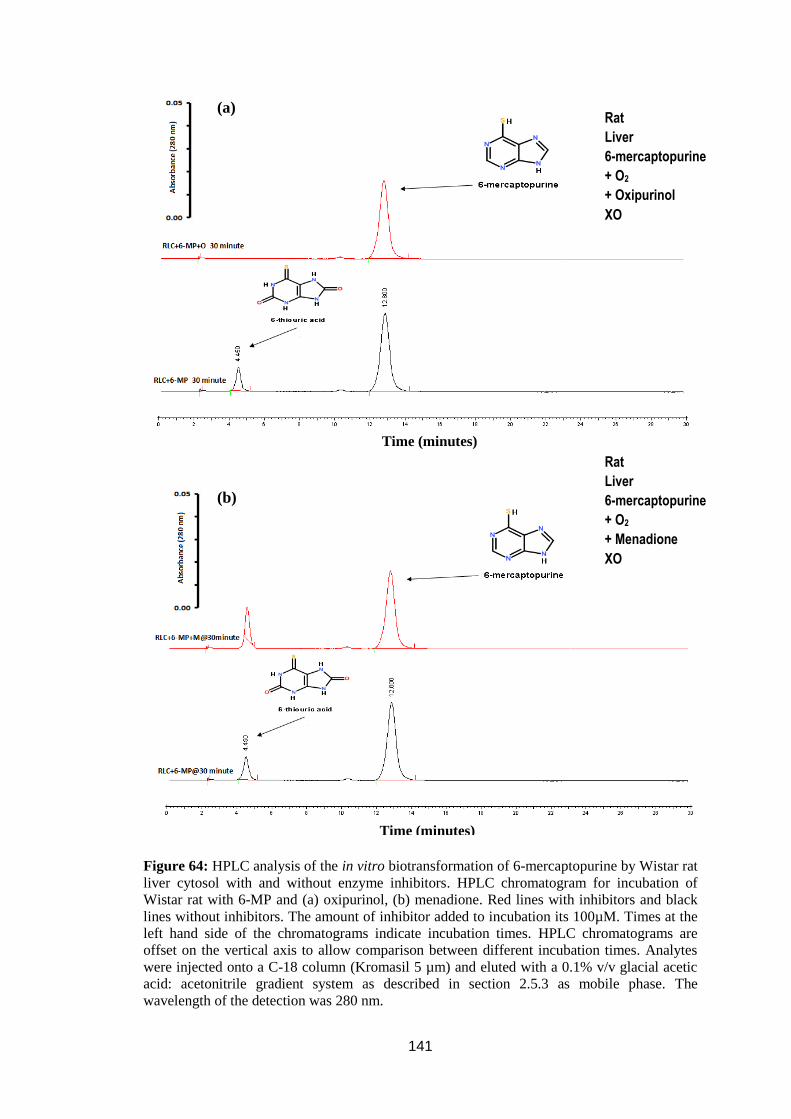
141
Figure 64: HPLC analysis of the in vitro biotransformation of 6-mercaptopurine by Wistar rat
liver cytosol with and without enzyme inhibitors. HPLC chromatogram for incubation of
Wistar rat with 6-MP and (a) oxipurinol, (b) menadione. Red lines with inhibitors and black
lines without inhibitors. The amount of inhibitor added to incubation its 100µM. Times at the
left hand side of the chromatograms indicate incubation times. HPLC chromatograms are
offset on the vertical axis to allow comparison between different incubation times. Analytes
were injected onto a C-18 column (Kromasil 5 µm) and eluted with a 0.1% v/v glacial acetic
acid: acetonitrile gradient system as described in section 2.5.3 as mobile phase. The
wavelength of the detection was 280 nm.
Time (minutes)
Time (minutes)
(a)
(b)
Rat
Liver
6-mercaptopurine
+ O2
+ Oxipurinol
XO
Rat
Liver
6-mercaptopurine
+ O2
+ Menadione
XO
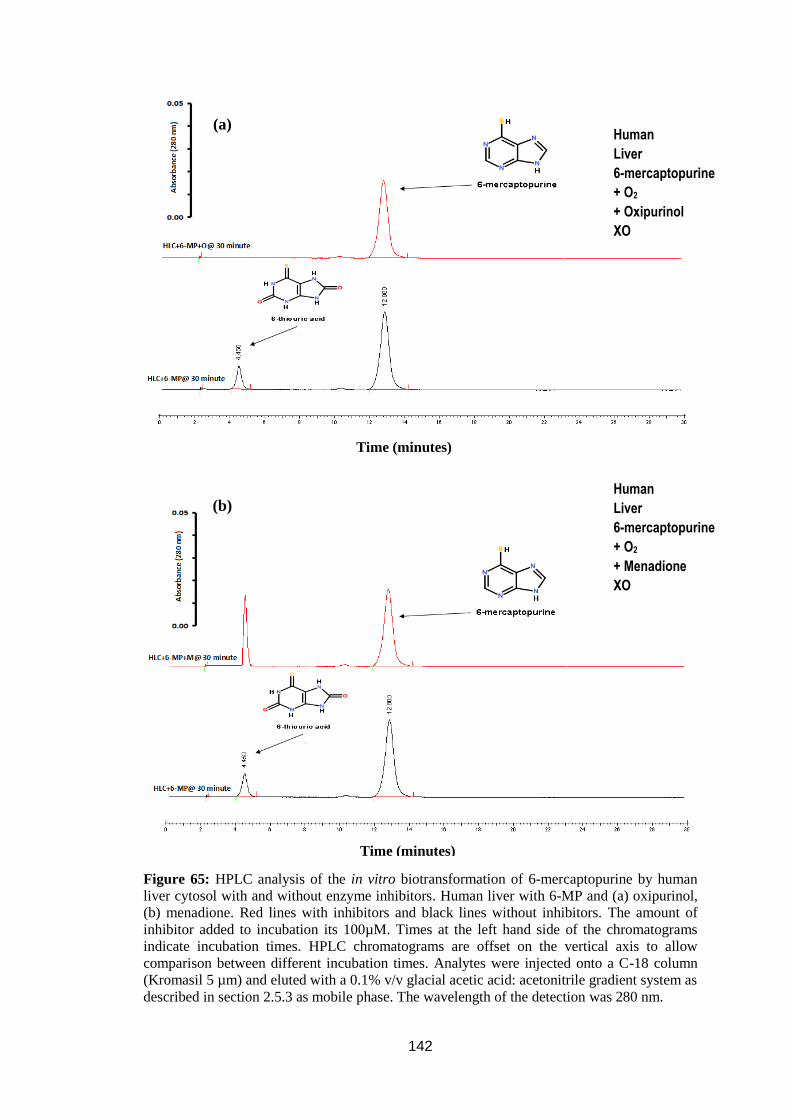
142
Figure 65: HPLC analysis of the in vitro biotransformation of 6-mercaptopurine by human
liver cytosol with and without enzyme inhibitors. Human liver with 6-MP and (a) oxipurinol,
(b) menadione. Red lines with inhibitors and black lines without inhibitors. The amount of
inhibitor added to incubation its 100µM. Times at the left hand side of the chromatograms
indicate incubation times. HPLC chromatograms are offset on the vertical axis to allow
comparison between different incubation times. Analytes were injected onto a C-18 column
(Kromasil 5 µm) and eluted with a 0.1% v/v glacial acetic acid: acetonitrile gradient system as
described in section 2.5.3 as mobile phase. The wavelength of the detection was 280 nm.
Time (minutes)
Time (minutes)
(a)
(b)
Human
Liver
6-mercaptopurine
+ O2
+ Oxipurinol
XO
Human
Liver
6-mercaptopurine
+ O2
+ Menadione
XO

143
Figure 66: HPLC analysis of the in vitro biotransformation of 6-thioxanthine by rainbow
trout liver cytosol at 37°C. HPLC chromatograms (a) generated by rainbow trout liver cytosol
with 6-thioxanthine and O2as electron acceptor. HPLC chromatograms (b) generated by Trout
liver cytosol with 6-thioxanthine and NAD+
as electron acceptor. Times at the left hand side of
the chromatograms indicate incubation times. HPLC chromatograms are offset on the vertical
axis to allow comparison between different incubation times .Analytes were injected onto a C-
18 column (Kromasil 5 µm) and eluted with a 0.1% v/v glacial acetic acid: acetonitrile
gradient system as described in section 2.5.3 as mobile phase. The wavelength of the detection
was 280 nm.
Time (minutes)
Time (minutes)
(b)
(a)
Rainbow trout
Liver
6-thioxanthine
+ O2
XO
Rainbow trout
Liver
6-thioxanthine
+ NAD+
XOR
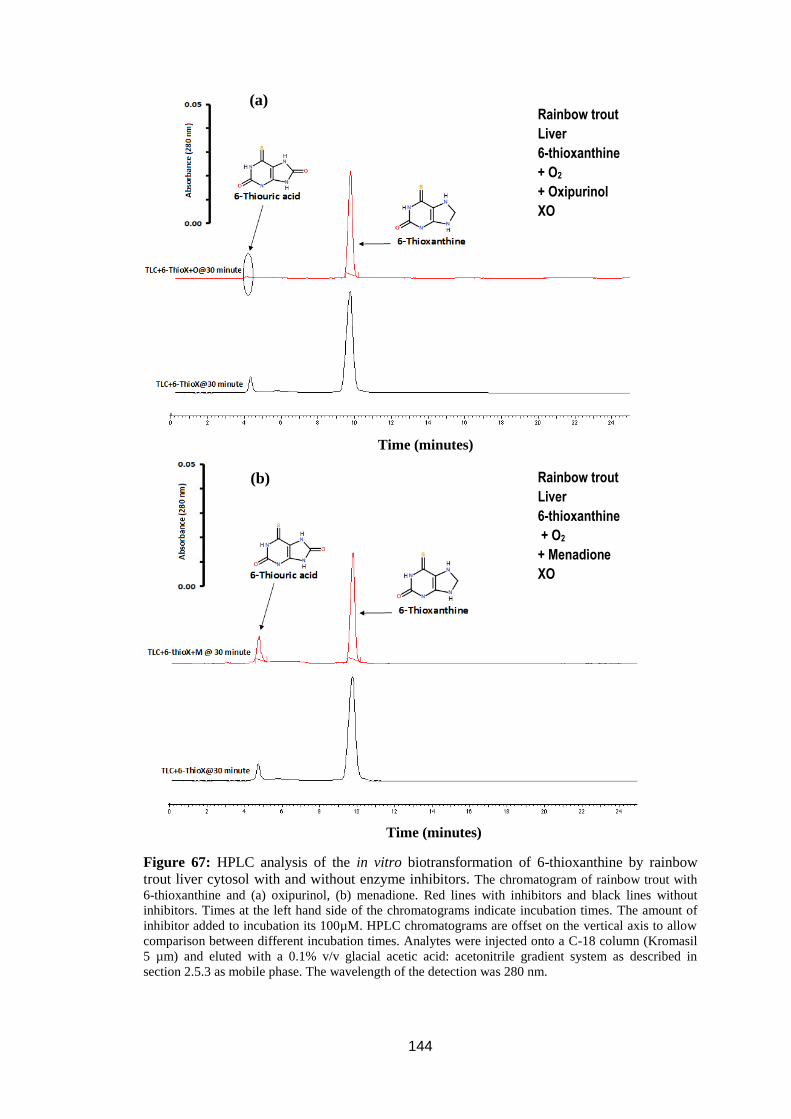
144
Figure 67: HPLC analysis of the in vitro biotransformation of 6-thioxanthine by rainbow
trout liver cytosol with and without enzyme inhibitors. The chromatogram of rainbow trout with
6-thioxanthine and (a) oxipurinol, (b) menadione. Red lines with inhibitors and black lines without
inhibitors. Times at the left hand side of the chromatograms indicate incubation times. The amount of
inhibitor added to incubation its 100µM. HPLC chromatograms are offset on the vertical axis to allow
comparison between different incubation times. Analytes were injected onto a C-18 column (Kromasil
5 µm) and eluted with a 0.1% v/v glacial acetic acid: acetonitrile gradient system as described in
section 2.5.3 as mobile phase. The wavelength of the detection was 280 nm.
Time (minutes)
Time (minutes)
(a)
(b)
Rainbow trout
Liver
6-thioxanthine
+ O2
+ Oxipurinol
XO
Rainbow trout
Liver
6-thioxanthine
+ O2
+ Menadione
XO
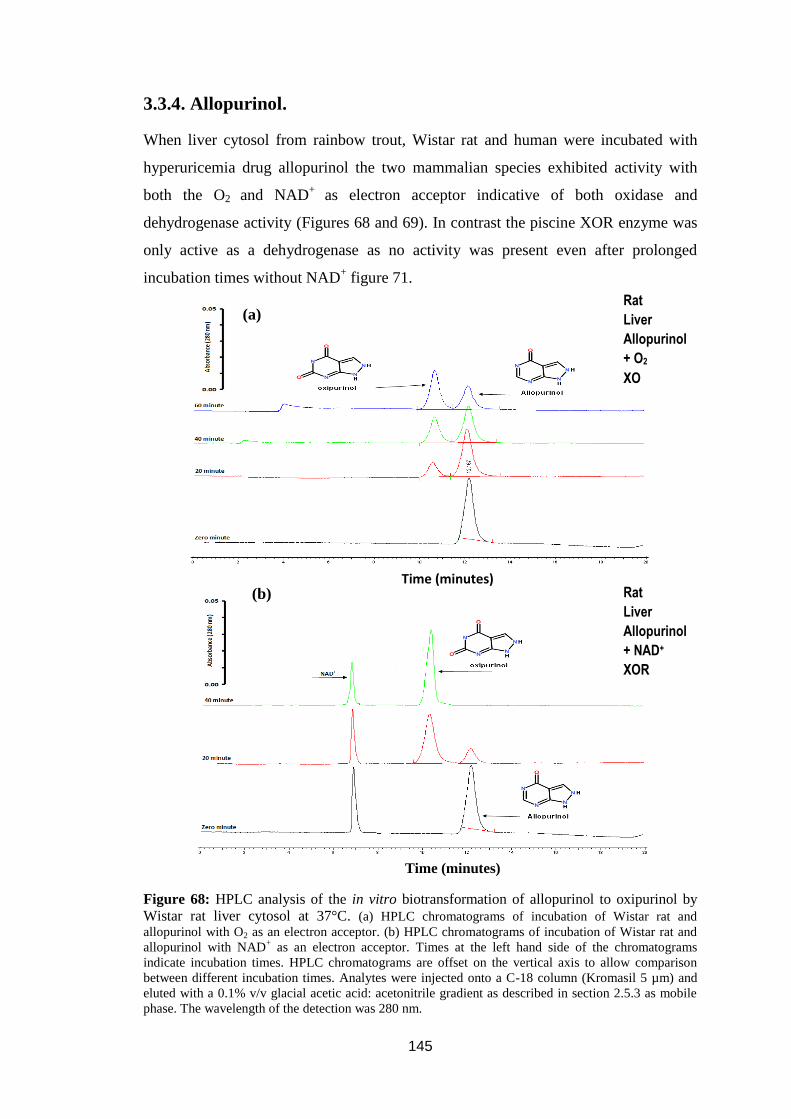
145
3.3.4. Allopurinol.
When liver cytosol from rainbow trout, Wistar rat and human were incubated with
hyperuricemia drug allopurinol the two mammalian species exhibited activity with
both the O2 and NAD+
as electron acceptor indicative of both oxidase and
dehydrogenase activity (Figures 68 and 69). In contrast the piscine XOR enzyme was
only active as a dehydrogenase as no activity was present even after prolonged
incubation times without NAD+ figure 71.
Figure 68: HPLC analysis of the in vitro biotransformation of allopurinol to oxipurinol by
Wistar rat liver cytosol at 37°C. (a) HPLC chromatograms of incubation of Wistar rat and
allopurinol with O2 as an electron acceptor. (b) HPLC chromatograms of incubation of Wistar rat and
allopurinol with NAD+ as an electron acceptor. Times at the left hand side of the chromatograms
indicate incubation times. HPLC chromatograms are offset on the vertical axis to allow comparison
between different incubation times. Analytes were injected onto a C-18 column (Kromasil 5 µm) and
eluted with a 0.1% v/v glacial acetic acid: acetonitrile gradient as described in section 2.5.3 as mobile
phase. The wavelength of the detection was 280 nm.
Time (minutes)
Time (minutes)
(a)
(b)
Rat
Liver
Allopurinol
+ O2
XO
Rat
Liver
Allopurinol
+ NAD+
XOR

146
Figure 69: HPLC analysis of the in vitro biotransformation of allopurinol by human liver
cytosol at 37°C. (a) HPLC chromatograms of incubation of human and allopurinol with O2 as an
electron acceptor. (b) HPLC chromatograms of incubation of human and allopurinol with NAD+ as
an electron acceptor. Times at the left hand side of the chromatograms indicate incubation times.
HPLC chromatograms are offset on the vertical axis to allow comparison between different incubation
times. Analytes were injected onto a C-18 column (Kromasil 5 µm) and eluted with a 0.1% v/v glacial
acetic acid: acetonitrile gradient as described in section 2.5.3 as mobile phase. The wavelength of the
detection was 280 nm.
Time (minutes)
Time (minutes)
(a)
(b)
Human
Liver
Allopurinol
+ O2
XO
Human
Liver
Allopurinol
+ NAD+
XOR
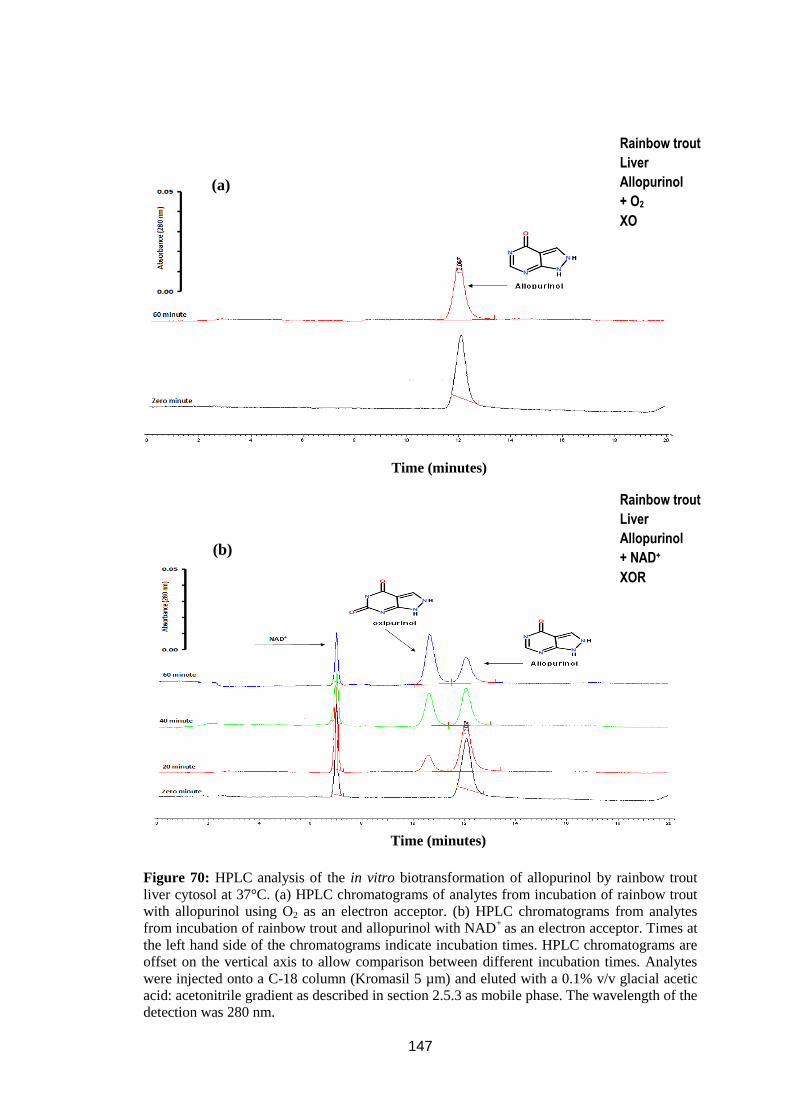
147
Figure 70: HPLC analysis of the in vitro biotransformation of allopurinol by rainbow trout
liver cytosol at 37°C. (a) HPLC chromatograms of analytes from incubation of rainbow trout
with allopurinol using O2 as an electron acceptor. (b) HPLC chromatograms from analytes
from incubation of rainbow trout and allopurinol with NAD+
as an electron acceptor. Times at
the left hand side of the chromatograms indicate incubation times. HPLC chromatograms are
offset on the vertical axis to allow comparison between different incubation times. Analytes
were injected onto a C-18 column (Kromasil 5 µm) and eluted with a 0.1% v/v glacial acetic
acid: acetonitrile gradient as described in section 2.5.3 as mobile phase. The wavelength of the
detection was 280 nm.
Time (minutes)
Time (minutes)
(a)
(b)
Rainbow trout
Liver
Allopurinol
+ O2
XO
Rainbow trout
Liver
Allopurinol
+ NAD+
XOR

148
3.4. Determination of the kinetic parameters for aldehyde oxidase
and xanthine oxidoreductase in trout, rat and human
Km and Vmax were calculated for the oxidation of exogenous aldehydes, endogenous
vitamin and purines and exogenous N-heterocycles as substrates for AOX and XOR as
described in methods section 2.8. Mean values of Km, Vmax and substrate efficiency
(Ks = Vmax/Km) of AOX and XOR were determined using Eadie-Hofstee plots that
gave good correlation coefficients (r2)> 0.97 Appendix 3 (Figures 6 – 25). The
advantage of this linearization method is that it tends to distribute the points more
evenly so that it gives equal weight to data points in any range of substrate
concentration or reaction rate.
3.4.1. Exogenous aldehydes as substrates for AOX
The Km and Vmax were calculated for two exogenous aromatic aldehyde compounds,
vanillin and dimethylaminocinnamaldehyde (DMAC) by AOX.
The results obtained in the present study shows that DMAC and vanillin were good
substrates of trout AOX. The enzyme kinetic parameters for AOX for all species are
listed in table 38. Km values for DMAC and vanillin were 21.5 ± 1.05 µM and 53.2 ±
2.1 µM respectively for trout liver cytosols. Vmax values obtained 0.69 ± 0.13
nmol/min/mg protein and 1.51 ± 0.18 nmol/min/mg protein respectively. The Km
values for DMAC in trout were approximately 4 and 7-fold higher than that in rat and
human. The Km value of vanillin in the trout was approximately 5 and 10-fold higher
compared with that in rat and human respectively in spectrophotometric assay and
Vmax value was similar for both mammalian species. The substrate efficiency (Ks)
value of DMAC and vanillin in the trout was lower compared with that in rat and
human respectively see Appendix3(figures 6 - 25) (Table 39).

149
Table 39: Kinetic constants for trout, rat and human liver AOX substrates in
spectrophotometric and HPLC assays
Species Substrates Km**
(µM)
Vmax
(nmol/min/mg
protein)
Ks = (Vmax/ Km)
(ml/min/mg
protein)
Rainbow
trout
DMAC
Vanillin
Vanillin
Pyridoxal
All-trans retinal
N1-methylnicotinamide
Phenanthridine
Phthalazine
Cinchonine
21.5 ± 1.05a
53.2 ± 2.11a
54.2 ± 0.64
121.9 ± 3.69
124.7 ± 2.27
273.9 ± 2.89
55.0 ± 1.63
61.2 ± 1.41
174.7 ± 2.55
0.69 ± 0.13a
1.51 ± 0.18a
1.89 ± 0.27
1.41 ± 0.69
2.22 ± 0.62
1.63 ± 1.33
1.78 ± 0.55
2.02 ± 0.46
1.63 ± 1.33
0.032
0.028
0.035
0.012
0.017
0.006
0.032
0.033
0.009
Wistar
rat
DMAC
Vanillin
Vanillin
Pyridoxal
All-trans retinal
N1-methylnicotinamide
Phenanthridine
Phthalazine
Cinchonine
5.4 ± 1.62a
9.7 ± 1.56a
10.2 ± 0.55*
46.4 ± 2.51
30.9 ± 1.23
156.2 ± 3.68
5.60 ± 0.65*
10.5 ± 0.55
37.3 ± 1.99
2.24 ± 0.07a
3.77 ± 0.21a
5.97 ± 0.05
6.28 ± 0.59
5.16 ± 0.56
5.92 ± 0.68*
2.43 ± 0.14
5.79 ± 0.08
4.53 ± 0.52
0.415*
0.388
0.585*
0.135
0.166
0.037
0.433*
0.551
0.121
Human
DMAC
Vanillin
Vanillin
Pyridoxal
All-trans retinal
N1-methylnicotinamide
Phenanthridine
Phthalazine
Cinchonine
3.4 ± 1.21a
5.5 ± 1.83a
8.1± 0.36
34.1 ± 1.97*
12.6 ± 0.58
139.5 ± 2.86
3.2 ± 0.23a
9.8 ± 0.59*
43.8 ± 1.62
3.14 ± 0.07a
4.65 ± 0.10a
6.29 ± 0.04*
9.16 ± 0.56
8.32 ± 0.06
6.69 ± 0.74
4.16 ± 0.14a
9.43 ± 0.07*
8.69 ± 0.53
0.923
0.845
0.776*
0.268
0.660*
0.047
1.300
0.962*
0.198
Values shown are the mean ± S.D. The typical results are from three independent
experiments. (*P< 0.05 one way ANOVA are marked with asterisks) compared with the
rainbow trout, **n = 3. (a)-Spectrophotometric assays,

150
3.4.2. Endogenous vitamin aldehydes as substrates for AOX
Two endogenous vitamin aldehydes, pyridoxal (vitamin B6), all-trans retinal (vitamin
A) and N1-methylnicotinamide (NMN) (a vitamin B3 metabolite) were used as AOX
substrates. The Km value of endogenous vitamin was measured using an HPLC assays
with trout, rat and human liver cytosols, Km, Vmax and Ks values are summarized in
(Table 39).
3.4.2.1. Vitamin B6 (pyridoxal)
The Km value of trout AOX with pyridoxal its 121.9 ± 3.6 µM was approximately 3-
fold more than that for mammalian AOX with Wistar rat and human of 46.4 ± 0.55
µM and 34.1 ± 1.97 µM respectively (Table 39). The Vmax value of trout AOX with
pyridoxal found to be 1.41 ± 0.69 nmol/min/mg protein and was approximately 6 and
9-fold lower than that Wistar rat and human respectively. The substrate efficiency
(Ks) value of trout AOX was lower compared than that of human and rat respectively
(Table 39).
3.4.2.2. Vitamin A (all-trans retinal)
The Km value of trout AOX with all-trans retinal was 124.7 ± 2.27 µM was
approximately 4-fold greater than that measured with Wistar rat with all-trans retinal
and ~ 10 fold more than that of human AOX (Table 39). The Vmax value of trout
AOX with all-trans retinal was 2.22 ± 0.62 nmol/min/mg protein and was
approximately 3 and 4-fold lower than that Wistar rat and human respectively. The
substrate efficiency (Ks) value of trout with all-trans retinal was lower than that of rat
and human respectively (Table 39).
151
3.4.2.3. N1-methylnicotinamide
The Km value of N1-methylnicotinamide was measured and it was found to be 273.9
± 2.89 µM with trout AOX, 156.2 ± 3.68 µM with Wistar rat AOX and 139.5 ± 2.86
µM with human AOX. The activity of trout AOX with N1-methylnicotinamide
approximately 1.5-fold more than that of mammalian AOX with N1-
methylnicotinamide table 38. The Vmax value of Wistar rat and human with N1-
methylnicotinamide was approximately 5 and 6-foldgreaterrespectivelythan the
piscine AOX. The substrate efficiency (Ks) value of trout AOX with N1-
methylnicotinamide was lower than that both mammalian species (Table 39).
3.4.3. Exogenous N-heterocycles as substrates for AOX
The Km, Vmax and Ks values were calculated for three exogenous NPAHs that are
environmental pollutants (phenanthridine, phthalazine and cinchonine) are shown in
(Table 39).
3.4.3.1. Phenanthridine
Phenanthridine oxidation by trout cytosol was below detection limits of the
spectrophotometric assay at all substrate concentrations used. However the activity
was measurable with a sensitive HPLC assay. The Km value of exogenous N-
heterocyclic phenanthridine with trout it was 55.0 ± 1.63µM. On other hand, the Km
value of mammalian enzyme Wistar rat and human with exogenous N-heterocyclic
phenanthridine were 5.60 ± 0.65 µM, 3.20 ± 0.23 µM respectively (Table 39). The
Km of the piscine AOX with phenanthridine was approximately 10 times greater than
that with mammalian AOX. The Vmax value of Wistar rat and human with
phenanthridine was approximately 2 and 4 times respectively more than that with trout
AOX. The substrate efficiency (Ks) value of Wistar rat and human with
phenanthridine was greater than that with trout AOX (Table 39).

152
3.4.3.2. Phthalazine
The Km value of exogenous N-heterocyclic phthalazine with trout it was 61.2 ± 1.41
µM. On other hand, the Km value of mammalian enzyme Wistar rat and human with
exogenous N-heterocyclic phthalazine was 10.50 ± 0.55 µM and 9.8 ± 0.59 µM (Table
39). The Km of the piscine AOX with exogenous N-heterocyclic phthalazine was
approximately 6 times higher than that with rat and human AOX activity. The Vmax
value of trout AOX with phthalazine found to be 2.02 ± 0.46 nmol/min/mg protein
and was approximately 2 and 4 times lower than that Wistar rat and human
respectively. The substrate efficiency (Ks) value of trout AOX with phthalazine was
lower compared with Wistar rat and human respectively (Table 39).
3.4.3.3. Cinchonine
The Km value of exogenous N-heterocyclic cinchonine with rainbow trout AOX
approximately 4-fold higher than that two mammalian AOX with cinchonine (Table
39). The Vmax value of Wistar rat and human with cinchonine was approximately 4
and 8-fold greater than that trout AOX. The substrate efficiency (Ks) value of human
AOX was greater compared than that Wistar rat and trout respectively (Table 39).

153
3.4.4. Endogenous and exogenous purines and purine analogs as
substrates for XOR
The Km, Vmax and Ks values of purines and purine analogs were measured using
spectrophotometric and HPLC assays with rainbow trout, Wistar rat and human as in
(Table 40).
3.4.4.1. Xanthine.
The Km value for O2-dependent xanthine oxidase assay for human was approximately
2-fold lower than that of rat in spectrophotometer and HPLC assay (Table 40). The
Km value of NAD-dependent xanthine dehydrogenase with trout in
spectrophotometric assay was 2-fold and 3-fold higher than that Wistar rat and human
respectively (Table 40). The Km value of NAD-dependant xanthine dehydrogenase
with trout in HPLC assay were 3 times higher than that with Wistar rat and human
(Table 40). The NAD-dependant Vmax value for xanthine dehydrogenase with Wistar
rat and human was approximately 5 and 7-fold greater than that O2-dependant
respectively (Table 40). The substrate efficiency (Ks) value of NAD-dependent
xanthine dehydrogenase with trout in spectrophotometer was lower compared with
that in Wistar rat and human respectively (Table 40).
3.4.4.2. 1-methylxanthine.
The NAD-dependent Km value for 1-methylxanthine as an XDH substrate for trout
was approximately 2-fold higher than that of other species as in (Table 40). The O2-
dependant Km value for 1-methylxanthine as substrate for both mammals was similar,
and the NAD-dependant Vmax value for 1-methylxanthine dehydrogenase with
Wistar rat and human was approximately 5 and 8-fold greater than the O2-
dependantactivity respectively (Table 40). The NAD-dependent substrate efficiency
(Ks) value for 1-methylxanthine as an XDH substrate for trout was lower than that of
154
other species (Table 40). The O2-dependant substrate specificity (Ks) value for 1-
methylxanthine as substrate for human was greater compared with that Wistar rat
(Table 40).

155
Table 40: Kinetic constants for trout, rat and human liver XOR substrates in
spectrophotometric and HPLC assays
Species Substrates Km** (μM)
Vmax
(nmol/min/mg protein)
Ks = Vmax / Km
(ml/min/mg
protein)
Rainbow
trout
Xanthine+NAD+
Xanthine+NAD+
1-MX+NAD+
1-MX+NAD+
6-Thioxanthine + O2
6-Thioxanthine+NAD+
Allopurinol +NAD+
Pyrazinamide + O2
Pyrazinamide +NAD+
13.5 ± 1.9a
15.8 ± 0.58
17.6 ± 1.23a
18.2 ± 0.55
39.9 ± 0.85
30.9±1.52
63.2 ± 0.98
ND
209.5 ± 2.40
0.56 ± 0.15a
0.77 ± 0.03
0.52 ± 0.14a
0.51 ± 0.05
1.67 ± 0.30
5.01 ± 0.98
0.56 ± 0.75
ND
1.21 ± 0.74
0.041
0.048
0.029
0.028
0.026
0.099
0.008
ND
0.005
Wistar
rat
Xanthine
Xanthine
Xanthine+NAD+
Xanthine+NAD+
1-MX + O2
1-MX+NAD+
1-MX+NAD+
6-MP + O2
6-MP+NAD+
Allopurinol + O2
Allopurinol +NAD+
Pyrazinamide + O2
Pyrazinamide +NAD+
13.2 ± 1.7a
9.2 ± 0.45
5.5 ± 1.45a
6.4 ±0.81
10.7 ± 0.56*
9.2 ± 0.62a
8.2 ± 0.62
29.1 ± 0.85
24.6±0.85*
20.9 ± 0.76
15.30±1.05
163.3 ± 1.46
92.2 ± 1.20*
1.69 ± 0.11a
1.27±0.17
4.27 ± 0.87a
5.17 ± 0.15*
1.01 ± 0.04
5.31± 0.10a
5.13 ± 0.95
1.61 ± 0.06*
3.68±0.45
1.19 ± 0.08
3.53±0.27
1.30 ± 1.33*
4.25 ± 1.06
0.128
0.138
0.776*
0.807
0.094
0.577*
0.625
0.055
0.149
0.056
0.230*
0.007
0.046
Human
Xanthine
Xanthine
Xanthine+NAD+
Xanthine+NAD+
1-MX + O2
1-MX+NAD+
1-MX+NAD+
6-MP + O2
6-MP+NAD+
Allopurinol + O2
Allopurinol+NAD+
Pyrazinamide + O2
Pyrazinamide +NAD+
3.0 ± 0.65a
5.5 ± 0.50*
1.9 ± 0.20a
2.4 ± 0.35
7.0 ± 0.58*
6.6 ± 1.05a
5.7 ± 0.30
25.7 ± 0.51
20.80±0.41
16.7 ± 0.62*
15±0.25
153.1 ± 2.05
90.7 ± 1.00
1.41 ± 0.01a
1.97±0.05
5.48 ± 0.07a
7.25 ± 0.17*
1.02 ± 0.15
8.31 ± 0.96a
8.18 ± 0.85
1.73 ± 0.04*
6.62±0.64
1.73 ± 0.05
5.52± 1.07*
1.07 ± 0.37
6.41 ± 0.94
0.470
0.358
2.884*
3.021*
0.145
1.259*
1.435*
0.067
0.318
0.103
0.368*
0.006
0.070
The values shown are the mean ± S.D. The typical results are from three independent
experiments. (*P< 0.05 one way ANOVA are marked with asterisks) compared with the
rainbow trout, **n = 3. (a)-Spectrophotometric assays.
156
3.4.4.3. Allopurinol
The NAD-dependant Km values for allopurinol as an XDH substrate with trout was
approximately 4-fold greater than that both mammalian species (Table 40). The O2-
dependant Km value for allopurinol as XO substrate with Wistar rat and human are
similar as in (Table 40). The NAD-dependant Vmax value for allopurinol as XDH
substrate with Wistar rat and human was approximately 3 and 5-fold more than that
O2-dependant Vmax value respectively (Table 40). The NAD-dependant substrate
efficiency (Ks) values for allopurinol as an XDH substrate with trout was lower
compared than that with Wistar rat and human respectively (Table 40). The O2-
dependant substrate efficiency (Ks) value for allopurinol as XO substrate with human
was lower than that with Wistar rat (Table 40).
3.4.4.4. 6-mercaptopurine (6MP).
The NAD-dependant Km value for 6-MP as an XDH substrate with both mammalian
are similar as in (Table 40).The NAD-dependant Vmax value for 6-MP with Wistar
rat and human was approximately 3 and 6-fold greater than that O2-dependant Vmax
value (Table 40).The NAD and O2- dependent substrate efficiency (Ks) value for 6-
MP with Wistar rat was lower than that with human (Table 40).
3.4.4.4. 6-thioxanthine.
The NAD-dependant Vmax value for 6-thioxanthine as an XOR substrate with trout
was approximately 2-fold greater than that O2-dependant Vmax value (Table 40). The
O2-dependant substrate efficiency (Ks) value for 6-thioxanthine as an XOR substrate
with trout was lower than that with NAD-dependent (Table 40).Due to time
constraints activities were not measured for the mammalian species.
157
3.4.3.4. Pyrazinamide
With the anti-tuberculosis drug pyrazinamide no activity was found with O2 as an
electron acceptor with rainbow trout cytosol. In contrast, pyrazinamide was
biotransformed in the presence of O2 with the both mammalian enzymes with Km
values for both Wistar rat and human being similar as in (Table 40). When NAD+ was
used as an electron acceptor both Wistar rat and human had approximately 4 and 6-
fold enhanced Vmax respectively and the trout cytosol had measurable NAD-
dependent activity. The Km value for the trout enzyme was approximately 2-fold
higher than two mammalian enzymes (Table 40). The NAD-dependent substrate
efficiency (Ks) value of trout with pyrazinamide as XDH substrate was found to be
lower compared with that Wistar rat and human respectively (Table 40). The O2-
dependent substrate efficiency (Ks) value for both mammalians with pyrazinamide as
substrate was similar (Table 40).
3.5. Comparison of menadione, benzamidine and oxipurinol as
molybdo-flavoenzyme inhibitors in different species.
Inhibition of AOX was determined with menadione and benzamidine, whereas
inhibition of XOR was determined with oxipurinol (Figure 72). Enzyme activity was
measured spectrophotometrically and inhibitor concentrations used were from 0.5 µM
to 5 µM menadione and from 25µM to 100µM for benzamidine and oxipurinol
respectively. As seen in (Figure 71a), the AOX inhibitor 5µM menadione strongly
inhibited AOX in trout liver with approximately 80% inhibition, while with rat and
human enzymes were inhibited ~ 90%. Another AOX inhibitor tested was
benzamidine which has been shown to be an inhibitor of AOX in rabbit and rat (Stell
et al., 1989, Maia and Mira. 2002) and has been found to be a good affinity ligand for
158
the purification of AOXs in rabbit, rat, mouse, bovine and chicken (Tables 21 and 22).
Benzamidine inhibition is pH dependent with higher pH giving stronger inhibition.
Whereas 100µM benzamidine inhibited rat and human AOX ~ 80% at pH 7.4 and by
~ 90% for both rat and human at pH 9.0, in contrast 100µM benzamidine did not
inhibit trout AOX either pH (Figures 71b and 71c). The XOR inhibitor oxipurinol at
100µM inhibited XDH in trout, rat and human liver cytosol with ~ 60%, ~ 92% and~
95% inhibition respectively.
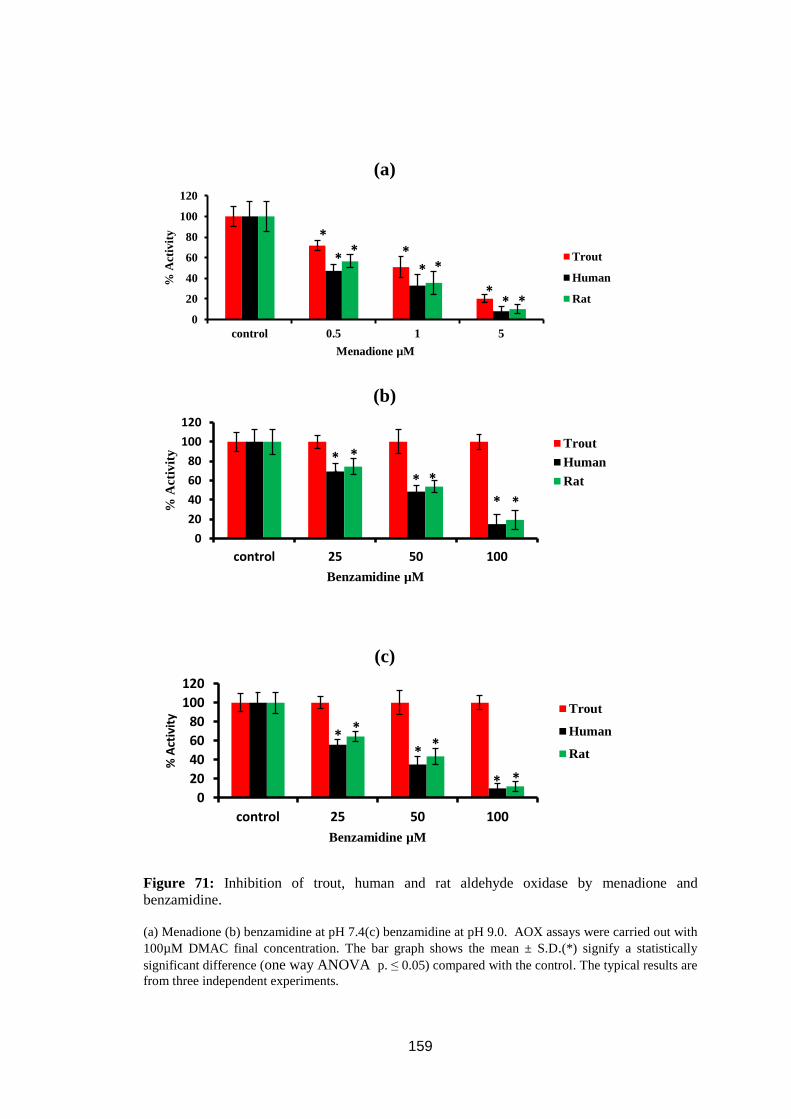
159
Figure 71: Inhibition of trout, human and rat aldehyde oxidase by menadione and
benzamidine.
(a) Menadione (b) benzamidine at pH 7.4(c) benzamidine at pH 9.0. AOX assays were carried out with
100µM DMAC final concentration. The bar graph shows the mean ± S.D.(*) signify a statistically
significant difference (one way ANOVA p. ≤ 0.05) compared with the control. The typical results are
from three independent experiments.
0
20
40
60
80
100
120
control 0.5 1 5
% A
ctiv
ity
Menadione µM
(a)
Trout
Human
Rat
0
20
40
60
80
100
120
control 25 50 100
% A
ctiv
ity
Benzamidine µM
(b)
Trout
Human
Rat
0
20
40
60
80
100
120
control 25 50 100
% A
ctiv
ity
Benzamidine µM
(c)
Trout
Human
Rat
* *
*
*
*
*
*
*
* *
*
* *
* * *
* *
* * *
*
*

160
Figure 72: Inhibition of trout, human and rat xanthine oxidoreductase by oxipurinol at pH
7.4.
(a) oxipurinol. XO assays were carried out with 100µM xanthine final concentration (b) oxipurinol.
XOR assays were carried out with 100µM xanthine final concentration and670µM NAD+ final
concentration as electron acceptor. The bar graph shows the mean ± S.D. (*) signify a statistically
significant difference (one way ANOVA p. ≤ 0.05) compared with the control. The typical results are
from three independent experiments.
0
20
40
60
80
100
120
control 25 50 100
% A
ctiv
ity
Oxipurinol µM
(a)
Human
Rat
0
20
40
60
80
100
120
control 25 50 100
% A
ctiv
ity
Oxipurinol µM
(b)
Trout
Human
Rat
*
* *
*
*
*
*
*
*
* *
*
*

161
3.5.1. Determination of Ki for molybdo-flavoenzyme inhibitors in
trout liver cytosol.
In order to determine the Ki for AOX and XOR inhibitors with the trout liver
molybdo-flavoenzymes a series of experiments were conducted with menadione,
ethinyl estradiol, estradiol, chlorpromazine, phenanthridine and oxipurinol with 25µM
to 100µM substrate concentration and 0.5µM to 5µM inhibitor concentration except
oxipurinol concentration from 25µM to 100µM. Lineweaver-Burk plots from this data
were used to determine the inhibitor constant Ki. (Figures 73 to 84) show the effect of
these inhibitors on trout liver AOX and XDH. (Table 41) summarises the inhibition
constants (Ki) and mode of inhibition of different inhibitors with trout AOX and
XDH.

162
Figure 73: Saturation kinetics plot for menadione inhibition with DMAC as an AOX
substrate in trout liver cytosol.
The concentration of DMAC as aldehyde oxidase substrate was varied from 25µM to 100µM and
menadione concentration ranged from 0.5µM to 5µM. The typical results are from three independent
experiments.
Figure 74: Lineweaver-Burk plot for menadione inhibition with DMAC as an AOX substrate
in trout liver cytosol.
The concentration of DMAC as aldehyde oxidase substrate varied from 25µM to 100µM and
menadione concentration ranged from 0.5µM to 5µM. The typical results are from three independent
experiments.
0
0.05
0.1
0.15
0.2
0.25
0.3
0.35
0.4
0 20 40 60 80 100
v (
nm
ol/
min
/mg
pro
tein
)
DMAC (µM)
0µM menadione
0.5µM menadione
1µM menadione
2µM menadione
5µM menadione
0
5
10
15
20
25
30
35
-0.08 -0.04 0 0.04 0.08 0.12 0.16 0.2
1/ v
(nmol/min/mg
protein)
1/[DMAC] (µM)-1
0µM menadione
0.5µM menadione
1µM menadione
2µM menadione
5µM menadione

163
Figure 75: Saturation kinetics plot for estradiol inhibition with DMAC as an AOX substrate
in trout liver cytosol.
The concentration of DMAC as aldehyde oxidase substrate was varied from 25µM to 100µM and
estradiol concentration ranged from 0.5µM to 5µM. The typical results are from three independent
experiments.
Figure 76: Lineweaver-Burk plot for estradiol inhibition with DMAC as an AOX substrate in
trout liver cytosol.
The concentration of DMAC as aldehyde oxidase substrate was varied from 25µM to 100µM and
estradiol concentration ranged from 0.5µM to 5µM. The typical results are from three independent
experiments.
0
0.05
0.1
0.15
0.2
0.25
0.3
0.35
0 20 40 60 80 100
V (
nm
ol/
min
/mg
pro
tein
)
DMAC (µM)
0µM estradiol
0.5µM estradiol
1µM estradiol
2µM estradiol
5µM estradiol
0
2
4
6
8
10
12
14
-0.1 -0.05 0 0.05 0.1 0.15 0.2
1/V
(nmol/min/mg
protein)
1/[DMAC](µM)-1
0µM estradiol
0.5µM estradiol
1µM estradiol
2µM estradiol
5µM estradiol
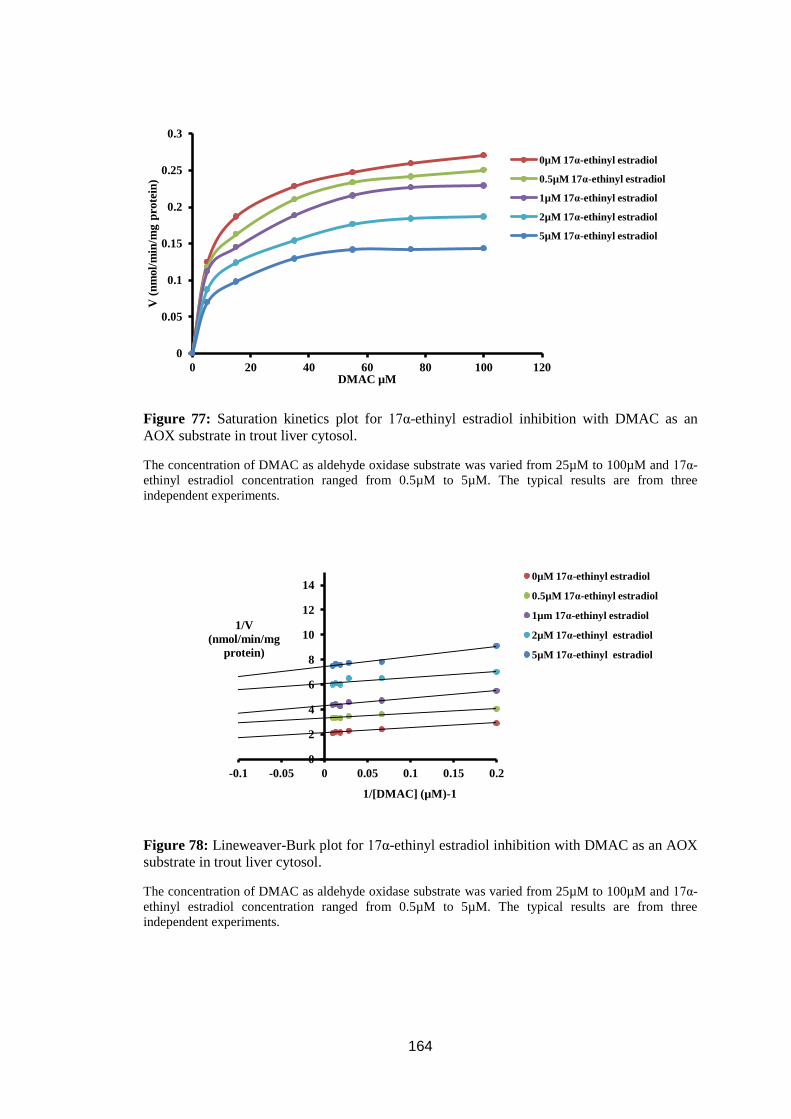
164
Figure 77: Saturation kinetics plot for 17α-ethinyl estradiol inhibition with DMAC as an
AOX substrate in trout liver cytosol.
The concentration of DMAC as aldehyde oxidase substrate was varied from 25µM to 100µM and 17α-
ethinyl estradiol concentration ranged from 0.5µM to 5µM. The typical results are from three
independent experiments.
Figure 78: Lineweaver-Burk plot for 17α-ethinyl estradiol inhibition with DMAC as an AOX
substrate in trout liver cytosol.
The concentration of DMAC as aldehyde oxidase substrate was varied from 25µM to 100µM and 17α-
ethinyl estradiol concentration ranged from 0.5µM to 5µM. The typical results are from three
independent experiments.
0
0.05
0.1
0.15
0.2
0.25
0.3
0 20 40 60 80 100 120
V (
nm
ol/
min
/mg
pro
tein
)
DMAC µM
0µM 17α-ethinyl estradiol
0.5µM 17α-ethinyl estradiol
1µM 17α-ethinyl estradiol
2µM 17α-ethinyl estradiol
5µM 17α-ethinyl estradiol
0
2
4
6
8
10
12
14
-0.1 -0.05 0 0.05 0.1 0.15 0.2
1/V
(nmol/min/mg
protein)
1/[DMAC] (µM)-1
0µM 17α-ethinyl estradiol
0.5µM 17α-ethinyl estradiol
1µm 17α-ethinyl estradiol
2µM 17α-ethinyl estradiol
5µM 17α-ethinyl estradiol

165
Figure 79: Saturation kinetics plot for chlorpromazine inhibition with DMAC as an AOX
substrate in trout liver cytosol.
The concentration of DMAC as aldehyde oxidase substrate was varied from 25µM to 100µM and
chlorpromazine concentration ranged from 0.5µM to 5µM. The typical results are from three
independent experiments.
Figure 80: Lineweaver-Burk plot for chlorpromazine inhibition with DMAC as an AOX
substrate in trout liver cytosol.
The concentration of DMAC as aldehyde oxidase substrate was varied from 25µM to 100µM and
chlorpromazine concentration ranged from 0.5µM to 5µM. The typical results are from three
independent experiments.
0
0.1
0.2
0.3
0.4
0.5
0.6
0.7
0 20 40 60 80 100
V (
nm
ol/
min
/mg
pro
tein
)
DMAC (µM)
0µM chlorpromazine
0.5µM chlorpromazine
1µM chlorpromazine
2µM chlorpromazine
5µM chlorpromazine
0
5
10
15
20
25
30
-0.1 -0.06 -0.02 0.02 0.06 0.1 0.14 0.18 0.22
1/v
(nmol/min/mg
protein)
1/[DMAC] (µM)-1
0µM chlorpromazine
0.5µM chlorpromazine
1µm chlorpromazine
2µM chlorpromazine
5µM chlorpromazine

166
Figure 81: Saturation kinetics plot for phenanthridine inhibition with DMAC as an AOX
substrate in trout liver cytosol.
The concentration of DMAC as aldehyde oxidase substrate was varied from 25µM to 100µM and
phenanthridine concentration ranged from 0.5µM to 5µM. The typical results are from three
independent experiments.
Figure 82: Lineweaver-Burk plot for phenanthridine inhibition with DMAC as an AOX
substrate in trout liver cytosol.
The concentration of DMAC as aldehyde oxidase substrate was varied from 25µM to 100µM and
phenanthridine concentration ranged from 0.5µM to 5µM. The typical results are from three
independent experiments.
0
0.1
0.2
0.3
0.4
0.5
0.6
0 20 40 60 80 100
v (
nm
ol/
min
/mg
pro
tein
)
DMAC (µM)
0µM phenanthridine
0.5µM phenanthridine
1µM phenanthridine
2µM phenanthridine
5µM phenanthridine
0
5
10
15
20
25
-0.15 -0.1 -0.05 0 0.05 0.1 0.15 0.2
1/v
(nmol/min/mg
protein)
1/[DMAC] (µM)-1
0µM phenanthridine
0.5µM phenanthridine
1µm phenanthridine
2µM phenanthridine
5µM phenanthridine

167
Figure 83: Saturation kinetics plot for oxipurinol inhibition with xanthine as an XOR
substrate in trout liver cytosol.
The concentration of xanthine + NAD+ as xanthine dehydrogenase substrate was varied from25µM to
100µM with 6.7mM NAD+
and oxipurinol concentration ranged from 25µM to 100µM. The typical
results are from three independent experiments.
Figure 84: Lineweaver-Burk plot for oxipurinol inhibition with xanthine as an XOR substrate
in trout liver cytosol.
The concentration of xanthine + NAD+ as xanthine dehydrogenase substrate was varied from 25µM to
100µM with 6.7mM NAD+
and oxipurinol concentration ranged from 25µM to 100µM. The typical
results are from three independent experiments.
0
0.1
0.2
0.3
0.4
0.5
0.6
0.7
0.8
0.9
0 20 40 60 80 100
v (
nm
ol/
min
/mg
pro
tein
)
Xanthine (µM)
0µM oxipurinol
25µM oxipurinol
50µM oxipurinol
100µM oxipurinol
0
1
2
3
4
5
6
7
8
9
10
-0.1 -0.05 0 0.05 0.1 0.15 0.2
1/v
(nmol/min/mg
protein)
1/[Xanthine](µM-1)
0µM oxipurinol
25µM oxipurinol
50µm oxipurinol
100µM oxipurinol

168
Table 41: Summary of inhibition constant (Ki) and mode of inhibition of different inhibitors
with trout AOX and XDH.
AOX inhibitor Ki (µM)**
Mode of inhibition
Menadione 0.17 ± 0.03 Non-competitive
Estradiol 0.34 ± 0.05 Uncompetitive
Ethinyl estradiol 0.44±0.05 Uncompetitive
Chlorpromazine 0.76 ±0.06 Competitive
Phenanthridine 0.77±0.07 Competitive
XOR inhibitor Ki (µM) **
Mode of inhibition
Oxipurinol 0.37±0.06 Non-competitive
The values shown are the (average ± S.D**
), obtained from three separate liver cytosol fractions for each
trout.
It was found that all AOX inhibitors had a Ki values between 0.1µM to 1µM with the
lowest Ki value with menadione. The weakest AOX inhibitors found were
phenanthridine and chlorpromazine. Lineweaver-Burk plot analysis revealed that the
inhibitors had different modes of inhibition. Menadione was a non-competitive
inhibitor, while estradiol and 17α-ethinyl estradiol were uncompetitive inhibitors. In
contrast, chlorpromazine and phenanthridine were competitive inhibitors. Despite its
structural similarity to XOR substrates xanthine and hypoxanthine, oxipurinol was
found to be a non-competitive inhibitor.
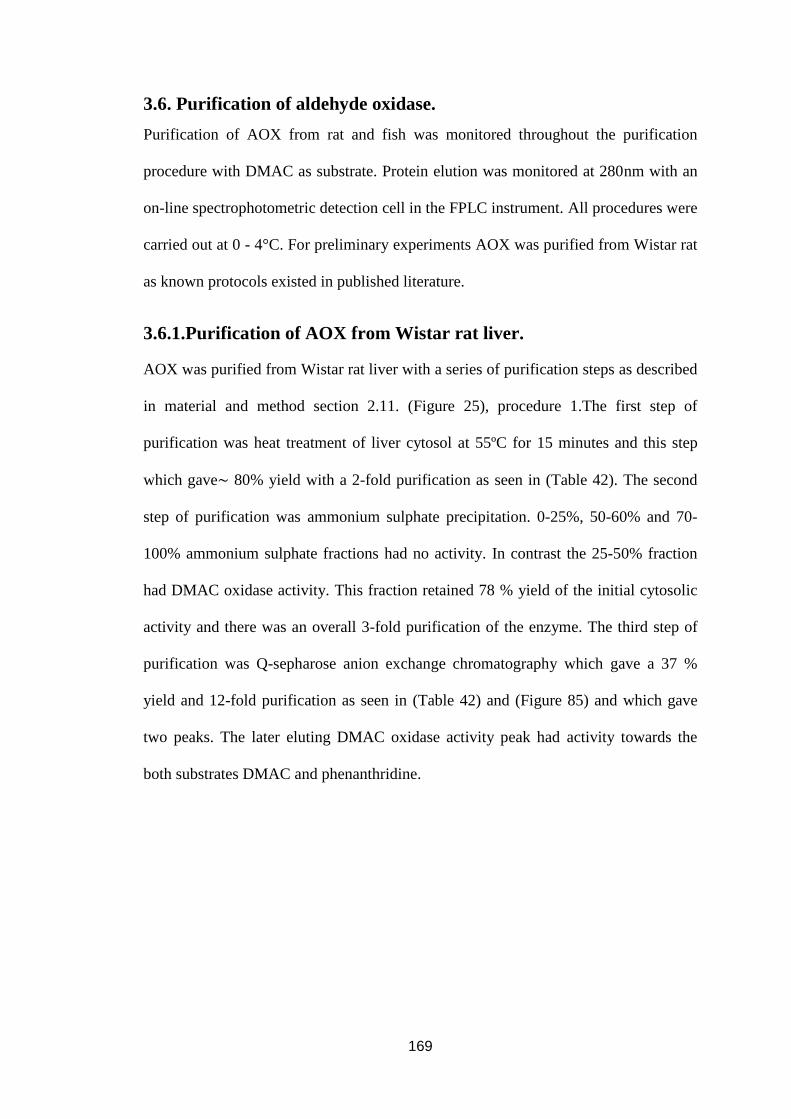
169
3.6. Purification of aldehyde oxidase.
Purification of AOX from rat and fish was monitored throughout the purification
procedure with DMAC as substrate. Protein elution was monitored at 280nm with an
on-line spectrophotometric detection cell in the FPLC instrument. All procedures were
carried out at 0 - 4°C. For preliminary experiments AOX was purified from Wistar rat
as known protocols existed in published literature.
3.6.1.Purification of AOX from Wistar rat liver.
AOX was purified from Wistar rat liver with a series of purification steps as described
in material and method section 2.11. (Figure 25), procedure 1.The first step of
purification was heat treatment of liver cytosol at 55ºC for 15 minutes and this step
which gave~ 80% yield with a 2-fold purification as seen in (Table 42). The second
step of purification was ammonium sulphate precipitation. 0-25%, 50-60% and 70-
100% ammonium sulphate fractions had no activity. In contrast the 25-50% fraction
had DMAC oxidase activity. This fraction retained 78 % yield of the initial cytosolic
activity and there was an overall 3-fold purification of the enzyme. The third step of
purification was Q-sepharose anion exchange chromatography which gave a 37 %
yield and 12-fold purification as seen in (Table 42) and (Figure 85) and which gave
two peaks. The later eluting DMAC oxidase activity peak had activity towards the
both substrates DMAC and phenanthridine.

170
Figure 85: Chromatography of heat treated ammonium sulphate fractionated rat liver cytosol
on a Q-sepharose column at pH 8.0. Using 20mM Tris HCL pH8.0 with 1mM cysteine and 5% (v/v)
glycerol. Following elution of unbound proteins a linear 0 – 600 mM KCL gradient was applied.
Fractions were collected at 1ml/minute and assayed for DMAC oxidase activity. Protein was monitored
at 280 nm with an online detector. The result was typical from three independent experiments.
Following concentration using an Amicon concentrator, the peak eluting with high salt
(DMAC oxidase peak 2) was further purified by affinity chromatography using
benzamidine sepharose 6B as described in materials and methods and following
elution of unbound proteins, AOX containing fractions were batch eluted with 10ml of
5mM benzamidine. Pooled and dialysed AOX-active fractions from this step were
then subjected to chromatography on a Mono-Q 5/10 anion exchange column (Figure
86). Overall this last step in the purification gave a 22% yield and 227-fold
purification of AOX from Wistar rat liver cytosol as seen in (Table 42).
0
10
20
30
40
50
60
70
0
0.5
1
1.5
2
2.5
3
0 100 200 300 400 500
DM
AC
oxid
ase
act
ivit
y µ
mo
les/
ml
(⧳ )
Ab
sorb
an
ce a
t 2
80
nm
( —
)
Elution volume (ml)

171
Figure 86: Mono-Q 5/10 anion exchange chromatography column of pooled fractions from
affinity chromatography step. Using 20mM Tris HCL pH8.6 with 1mM cysteine and 5% (v/v)
glycerol. Following elution of unbound proteins a linear 0 – 300 mM KCL gradient was applied.
Fractions were collected at 5ml/minute and assayed for DMAC oxidase activity. Protein was monitored
at 280 nm with an online detector. The result from three independent experiments.
A summary of purification of Wistar rat AOX is given in (Table 42).
0
5
10
15
20
25
30
35
40
0
0.05
0.1
0.15
0.2
0.25
0.3
0.35
0.4
0.45
0 5 10 15 20 25 30 35
DM
AC
oxid
ase
act
ivit
y µ
mo
les/
ml
(⧳)
Ab
sorb
an
ce a
t 2
80
nm
(─
)
Elution volume (ml)

172
Table 42: Summary of Wistar rat AOX purification.
Purification stage Volume
[ml]
Total protein
[mg]
Total activity
[nmol/min]
Specific activity
[nmol/min/mg protein] Yield % Purification fold
Cytosol preparation 36.6 7593.3 21109.4 2.78 100 1
Heat treatment at 55ºC 26.9 3037.3 16887.5 5.56 80 2
25-50% Ammonium sulphate precipitation 6.8 1895.1 16676.3 8.80 79 3
Qsepharose ion exchange chromatography 1.5 235.8 7873.8 33.39 37.3 12
Benzamidine Sepharose 6B affinity chromatography 0.5 32.2 5973.9 185.15 28.3 67
MonoQ ion Exchange chromatography 0.3 7.4 4686.3 631.83 22.2 227
The data shown is from a typical experiment.

173
3.6.2. SDS PAGE analysis of Wistar rat AOX
The SDS PAGE was used as described in materials and methods section 2.11.4 to
analyse purified fractions figure 87 demonstrates that the purified preparations
contained several polypeptide bands < 66kDa indicating that the enzyme had
undergone proteolysis.
Figure 87: SDS PAGE of purified hepatic AOX from Wistar rat liver.
The lane [1] cytosol 20µg, lane [2] purified AOX 5µg from Mono Q, lane [3] molecular mass markers.
The principle and procedure of SDS PAGE and staining as described in method and material section
2.10.1 table 14. The result obtained represents a typical result from three independent purification
experiments.
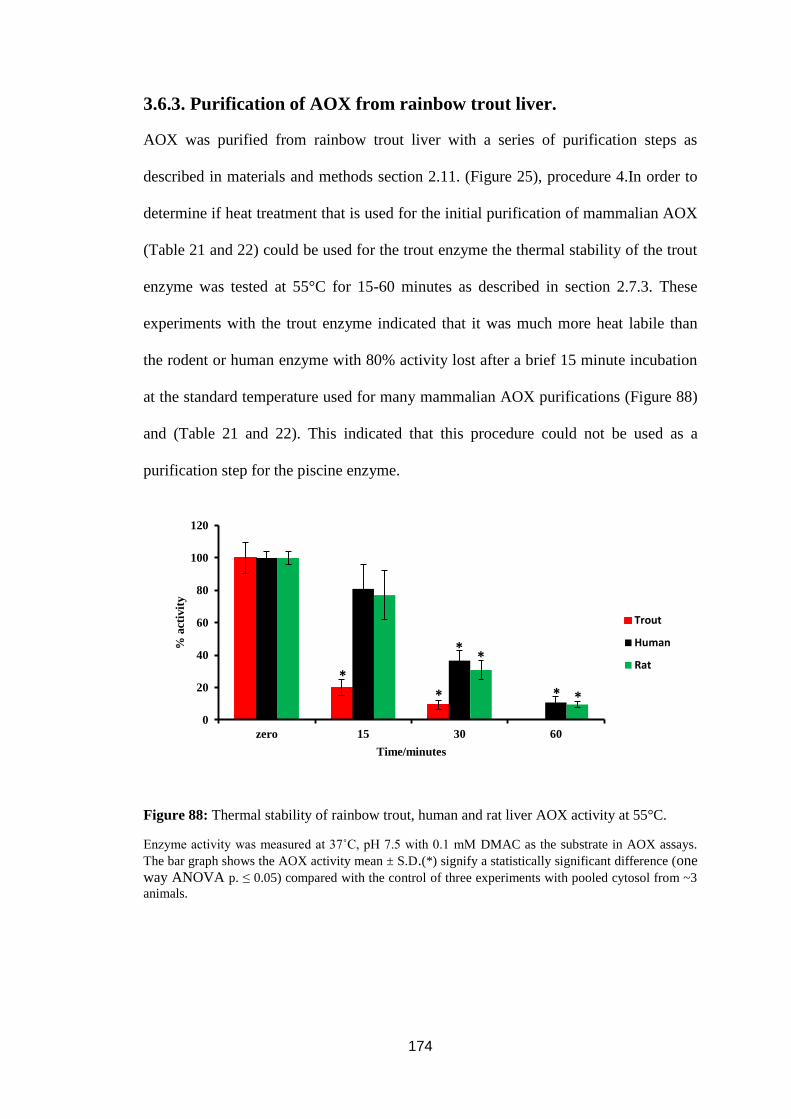
174
3.6.3. Purification of AOX from rainbow trout liver.
AOX was purified from rainbow trout liver with a series of purification steps as
described in materials and methods section 2.11. (Figure 25), procedure 4.In order to
determine if heat treatment that is used for the initial purification of mammalian AOX
(Table 21 and 22) could be used for the trout enzyme the thermal stability of the trout
enzyme was tested at 55°C for 15-60 minutes as described in section 2.7.3. These
experiments with the trout enzyme indicated that it was much more heat labile than
the rodent or human enzyme with 80% activity lost after a brief 15 minute incubation
at the standard temperature used for many mammalian AOX purifications (Figure 88)
and (Table 21 and 22). This indicated that this procedure could not be used as a
purification step for the piscine enzyme.
Figure 88: Thermal stability of rainbow trout, human and rat liver AOX activity at 55°C.
Enzyme activity was measured at 37˚C, pH 7.5 with 0.1 mM DMAC as the substrate in AOX assays.
The bar graph shows the AOX activity mean ± S.D.(*) signify a statistically significant difference (one
way ANOVA p. ≤ 0.05) compared with the control of three experiments with pooled cytosol from ~3
animals.
0
20
40
60
80
100
120
zero 15 30 60
% a
ctiv
ity
Time/minutes
Trout
Human
Rat*
*
*
*
*
*
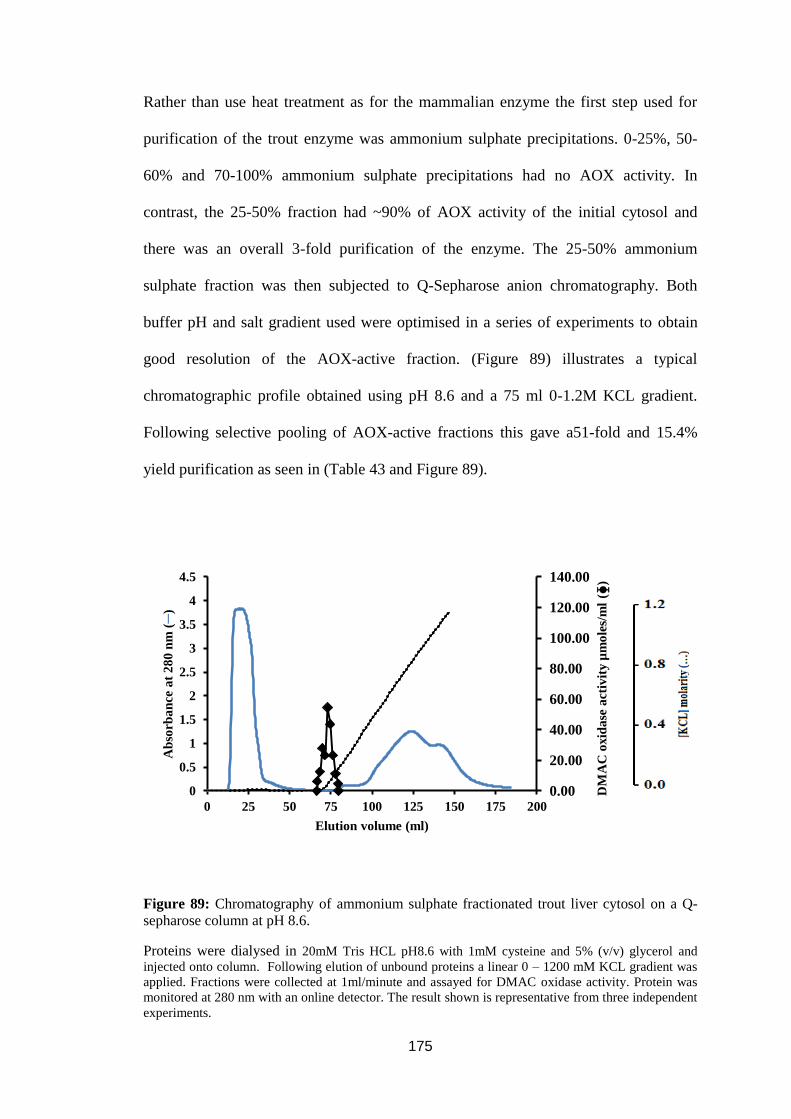
175
Rather than use heat treatment as for the mammalian enzyme the first step used for
purification of the trout enzyme was ammonium sulphate precipitations. 0-25%, 50-
60% and 70-100% ammonium sulphate precipitations had no AOX activity. In
contrast, the 25-50% fraction had ~90% of AOX activity of the initial cytosol and
there was an overall 3-fold purification of the enzyme. The 25-50% ammonium
sulphate fraction was then subjected to Q-Sepharose anion chromatography. Both
buffer pH and salt gradient used were optimised in a series of experiments to obtain
good resolution of the AOX-active fraction. (Figure 89) illustrates a typical
chromatographic profile obtained using pH 8.6 and a 75 ml 0-1.2M KCL gradient.
Following selective pooling of AOX-active fractions this gave a51-fold and 15.4%
yield purification as seen in (Table 43 and Figure 89).
Figure 89: Chromatography of ammonium sulphate fractionated trout liver cytosol on a Q-
sepharose column at pH 8.6.
Proteins were dialysed in 20mM Tris HCL pH8.6 with 1mM cysteine and 5% (v/v) glycerol and
injected onto column. Following elution of unbound proteins a linear 0 – 1200 mM KCL gradient was
applied. Fractions were collected at 1ml/minute and assayed for DMAC oxidase activity. Protein was
monitored at 280 nm with an online detector. The result shown is representative from three independent
experiments.
0.00
20.00
40.00
60.00
80.00
100.00
120.00
140.00
0
0.5
1
1.5
2
2.5
3
3.5
4
4.5
0 25 50 75 100 125 150 175 200
DM
AC
oxid
ase
act
ivit
y µ
mo
les/
ml
(⧳)
Ab
sorb
an
ce a
t 2
80
nm
(─
)
Elution volume (ml)
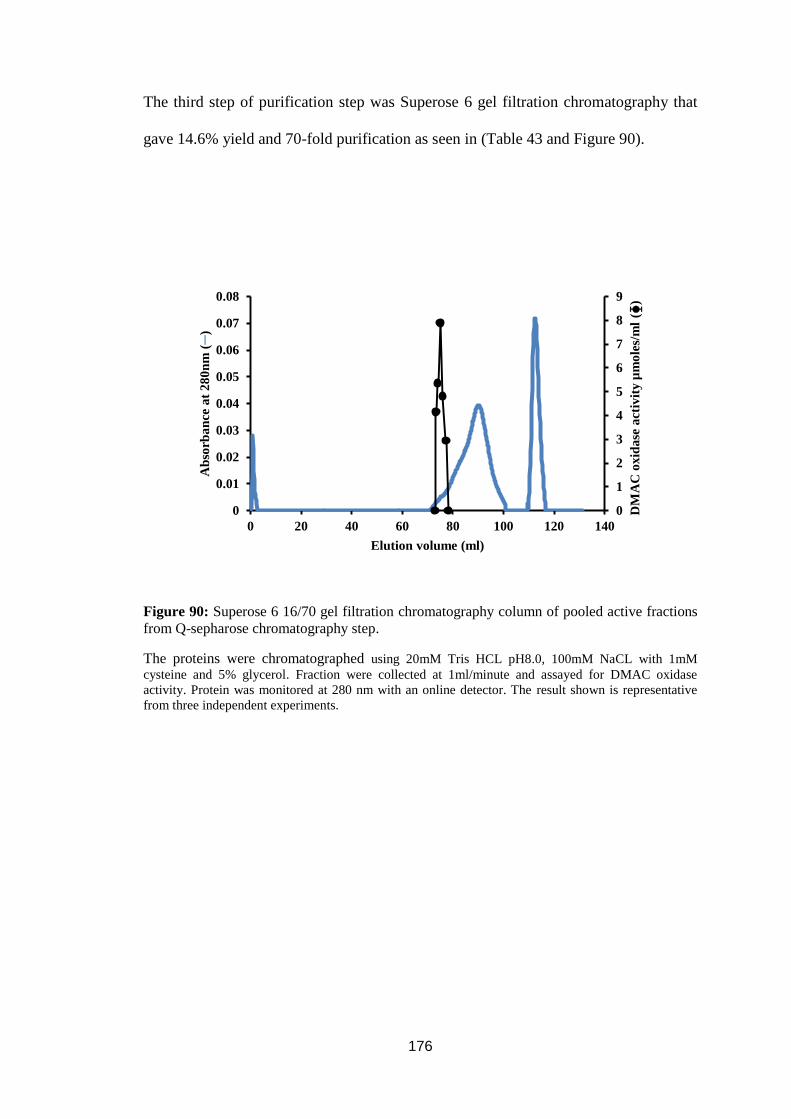
176
The third step of purification step was Superose 6 gel filtration chromatography that
gave 14.6% yield and 70-fold purification as seen in (Table 43 and Figure 90).
Figure 90: Superose 6 16/70 gel filtration chromatography column of pooled active fractions
from Q-sepharose chromatography step.
The proteins were chromatographed using 20mM Tris HCL pH8.0, 100mM NaCL with 1mM
cysteine and 5% glycerol. Fraction were collected at 1ml/minute and assayed for DMAC oxidase
activity. Protein was monitored at 280 nm with an online detector. The result shown is representative
from three independent experiments.
0
1
2
3
4
5
6
7
8
9
0
0.01
0.02
0.03
0.04
0.05
0.06
0.07
0.08
0 20 40 60 80 100 120 140
DM
AC
oxid
ase
act
ivit
y µ
mo
les/
ml
(⧳)
Ab
sorb
an
ce a
t 2
80
nm
(─
)
Elution volume (ml)
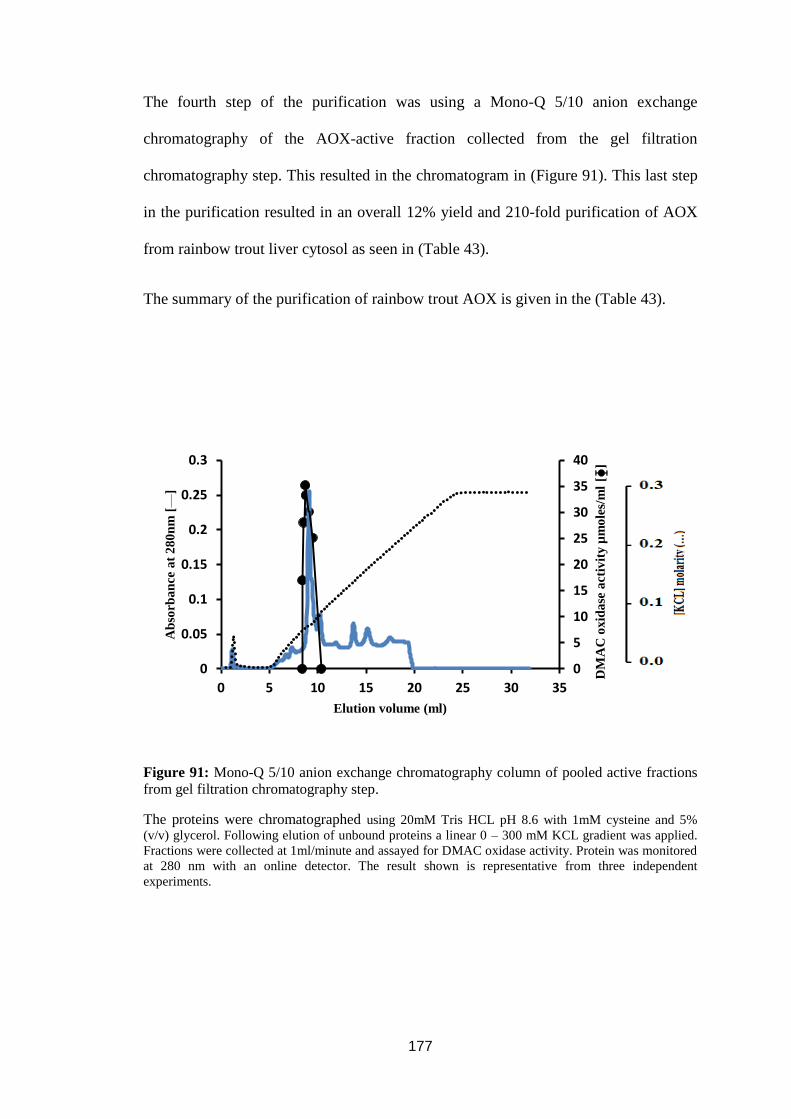
177
The fourth step of the purification was using a Mono-Q 5/10 anion exchange
chromatography of the AOX-active fraction collected from the gel filtration
chromatography step. This resulted in the chromatogram in (Figure 91). This last step
in the purification resulted in an overall 12% yield and 210-fold purification of AOX
from rainbow trout liver cytosol as seen in (Table 43).
The summary of the purification of rainbow trout AOX is given in the (Table 43).
Figure 91: Mono-Q 5/10 anion exchange chromatography column of pooled active fractions
from gel filtration chromatography step.
The proteins were chromatographed using 20mM Tris HCL pH 8.6 with 1mM cysteine and 5%
(v/v) glycerol. Following elution of unbound proteins a linear 0 – 300 mM KCL gradient was applied.
Fractions were collected at 1ml/minute and assayed for DMAC oxidase activity. Protein was monitored
at 280 nm with an online detector. The result shown is representative from three independent
experiments.
0
5
10
15
20
25
30
35
40
0
0.05
0.1
0.15
0.2
0.25
0.3
0 5 10 15 20 25 30 35
DM
AC
oxid
ase
act
ivit
y µ
mo
les/
ml
[⧳]
Ab
sorb
an
ce a
t 2
80
nm
[—
]
Elution volume (ml)

178
Table 43: Summary of rainbow trout AOX purification.
Purification stage Volume
[ml]
Total protein
[mg]
Total activity
[nmol/min]
Specific activity
[nmol/min/mg protein] Yield % Purification fold
Cytosol preparation 27.4 1138.91 1161.7 1.02 100 1
25-50% ammonium sulphate fractionation 5.3 344.03 1073.4 3.12 92.4 3
Q-sepharose anion exchange chromatography 1.5 3.38 178.9 52.96 15.4 51
Superose 6 gel filtration chromatography 0.5 2.36 169.6 71.76 14.6 70
Mono Q anion Exchange chromatography 0.3 0.71 149.8 214.61 12.9 210
The data shown is from a single representative experiment from typical data from three independent experiments.
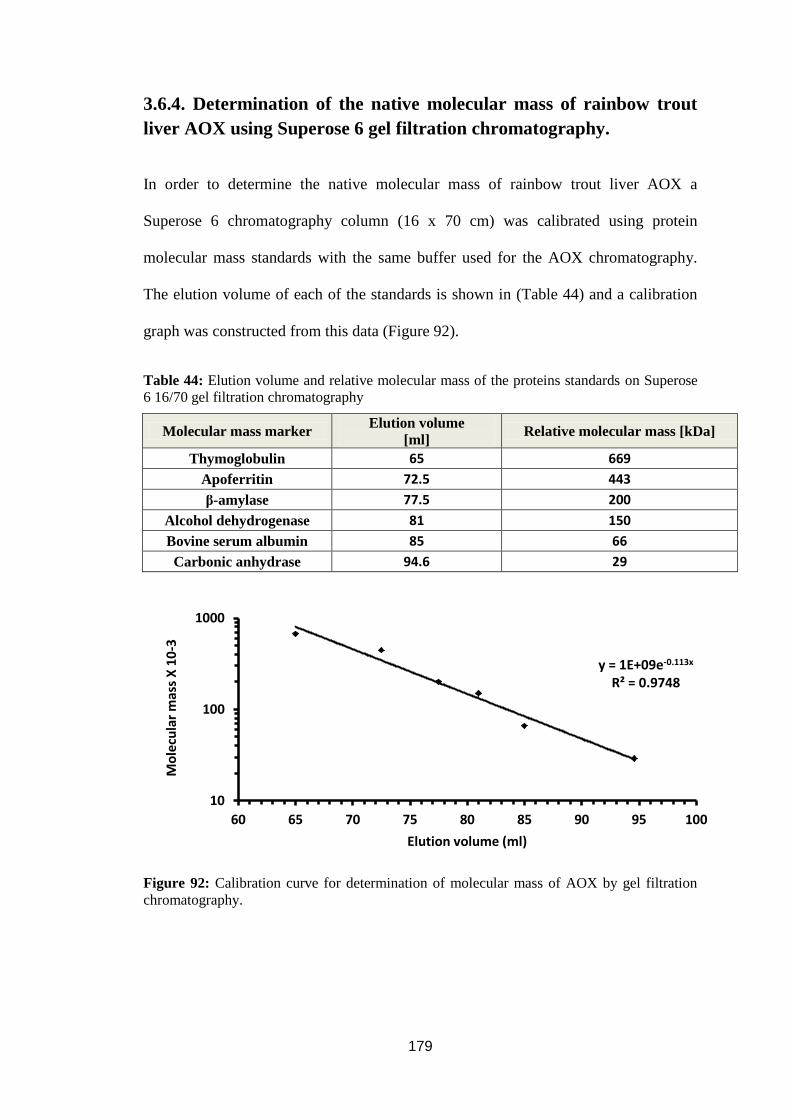
179
3.6.4. Determination of the native molecular mass of rainbow trout
liver AOX using Superose 6 gel filtration chromatography.
In order to determine the native molecular mass of rainbow trout liver AOX a
Superose 6 chromatography column (16 x 70 cm) was calibrated using protein
molecular mass standards with the same buffer used for the AOX chromatography.
The elution volume of each of the standards is shown in (Table 44) and a calibration
graph was constructed from this data (Figure 92).
Table 44: Elution volume and relative molecular mass of the proteins standards on Superose
6 16/70 gel filtration chromatography
Molecular mass marker Elution volume
[ml] Relative molecular mass [kDa]
Thymoglobulin 65 669
Apoferritin 72.5 443
β-amylase 77.5 200
Alcohol dehydrogenase 81 150
Bovine serum albumin 85 66
Carbonic anhydrase 94.6 29
Figure 92: Calibration curve for determination of molecular mass of AOX by gel filtration
chromatography.
y = 1E+09e-0.113x R² = 0.9748
10
100
1000
60 65 70 75 80 85 90 95 100
Mo
lecu
lar
mas
s X
10
-3
Elution volume (ml)

180
As the elution volume of the peak of rainbow trout liver AOX activity in Superose 6
16/70 was 75ml, the native molecular mass of the fish AOX was calculated from the
equation (y = 1E+09e-0.113x
) derived from the calibration curve. The mass calculated
was 295 kDa. This suggests that the enzyme was a homodimer of ~ 150 kDa subunits
as has been shown in mammals, however the SDS-PAGE gel analysis did not have
any band of this mass. Instead the final purified preparation was composed of many
polypeptides less than 150 kDa. This suggests that the trout AOX retained activity in a
proteolysed form. Such as phenomenon is also found with proteolysed mammalian
XOR that also retains activity and an overall native mass similar to the intact enzyme
estimated by gel filtration chromatography (Engerson et al., 1987).

181
3.6.5. SDS PAGE analysis of rainbow trout AOX.
The SDS PAGE used its described in method and material section 2.11.4 to analyse
purified fractions (Figure 93) demonstrates that the purified preparations contained
several polypeptide bands < 55kDa. This suggests that the enzyme had undergone
significant proteolysis as the expected single subunit mass was 150 kDa.
Figure 93: SDS PAGE of purified hepatic AOX from rainbow trout liver.
The lane [1] cytosol 20µg, lane [2] purified AOX5µg from Mono Q, lane [3] molecular mass markers.
The principle and procedure of SDS PAGE and staining as described in method and material section
2.10.1 table 14. The result obtained represents a typical result from three independent purification
experiments.

182
As well as the aforementioned methods outlined above two others were tested. In
order to determine if chromatofocusing could be used as a purification step following
concentration of the fraction from Q-sepharose anion exchange column,
chromatofocusing was performed on a Mono P HR 5/20 column with 0.075M Tris
HCL pH 9.3 and a pH 9.3 to pH 6.0 gradient was generated with 10% (v/v) polybuffer
96, adjusted to pH 6.0 with glacial acetic acid. Following chromatography fractions
were assayed for DMAC oxidase activity. No activity was found in any fraction. In
addition as benzamidine sepharose is frequently used as an affinity matrix for the
purification of mammalian AOX this was tested with partially purified trout liver
AOX. This was unsuccessful and not entirely unexpected as benzamidine was not an
effective inhibitor of the trout enzyme (Figure 71).
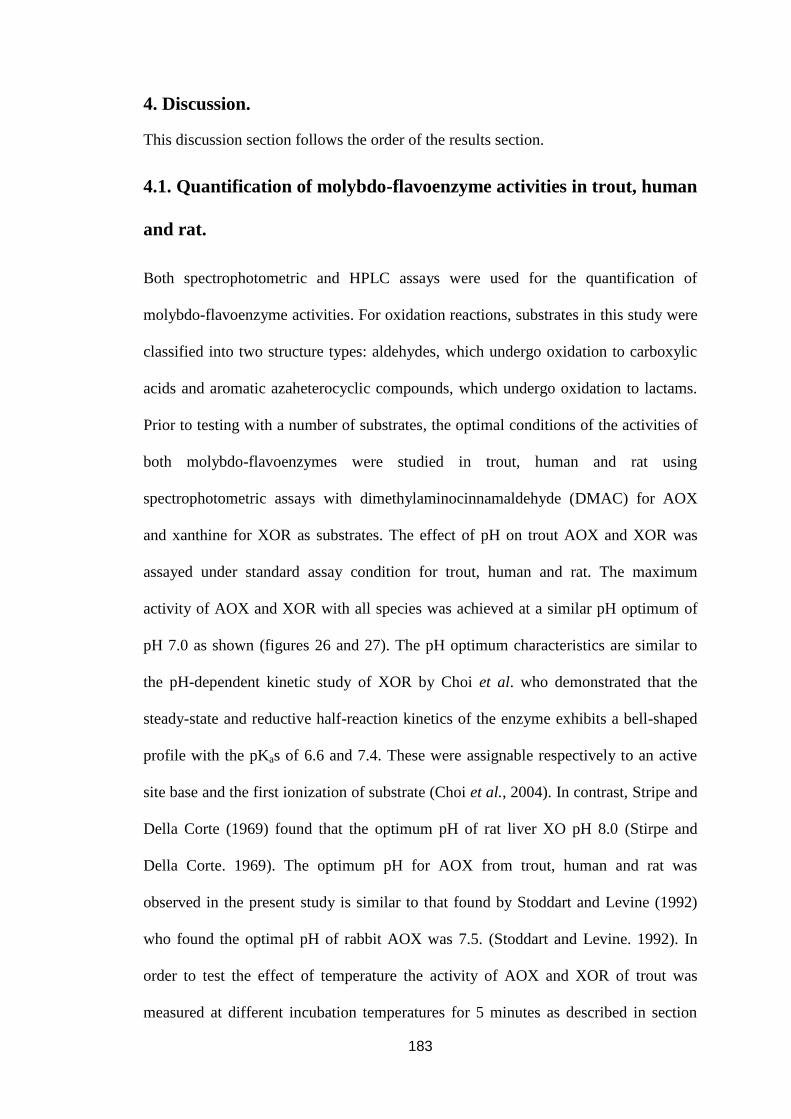
183
4. Discussion.
This discussion section follows the order of the results section.
4.1. Quantification of molybdo-flavoenzyme activities in trout, human
and rat.
Both spectrophotometric and HPLC assays were used for the quantification of
molybdo-flavoenzyme activities. For oxidation reactions, substrates in this study were
classified into two structure types: aldehydes, which undergo oxidation to carboxylic
acids and aromatic azaheterocyclic compounds, which undergo oxidation to lactams.
Prior to testing with a number of substrates, the optimal conditions of the activities of
both molybdo-flavoenzymes were studied in trout, human and rat using
spectrophotometric assays with dimethylaminocinnamaldehyde (DMAC) for AOX
and xanthine for XOR as substrates. The effect of pH on trout AOX and XOR was
assayed under standard assay condition for trout, human and rat. The maximum
activity of AOX and XOR with all species was achieved at a similar pH optimum of
pH 7.0 as shown (figures 26 and 27). The pH optimum characteristics are similar to
the pH-dependent kinetic study of XOR by Choi et al. who demonstrated that the
steady-state and reductive half-reaction kinetics of the enzyme exhibits a bell-shaped
profile with the pKas of 6.6 and 7.4. These were assignable respectively to an active
site base and the first ionization of substrate (Choi et al., 2004). In contrast, Stripe and
Della Corte (1969) found that the optimum pH of rat liver XO pH 8.0 (Stirpe and
Della Corte. 1969). The optimum pH for AOX from trout, human and rat was
observed in the present study is similar to that found by Stoddart and Levine (1992)
who found the optimal pH of rabbit AOX was 7.5. (Stoddart and Levine. 1992). In
order to test the effect of temperature the activity of AOX and XOR of trout was
measured at different incubation temperatures for 5 minutes as described in section

184
2.7.2. The rate of reaction of trout AOX and XOR gradually increased with increase
temperature from 25˚C up to 37˚C, and the activity dramatically decreased after 45ºC
with less than 10% remaining at 60ºC (Figure 28). In contrast the rate of reaction of
human and rat AOX and XOR gradually increased with increase temperature from
25ºC up to 37ºC, then the activity decreased gradually until 60ºC with approximately
50% activity remaining at highest temperature. These results resemble those with most
animal enzymes that become denatured at temperatures above 40˚C (Figure 28). This
present result showed that the assay temperature of 37˚C is suitable for use with the
trout, human and rat MFE. The contrast in the thermolability of the piscine and
mammalian AOXs may reflect differences in the primary amino acid sequence of
mammalian AOXs that may have increased hydrophobic, ionic and hydrogen bonding
that are known to stabilise proteins at elevated temperatures. At present it is not
known which amino acid residues are involved in this.
As well as optimising incubation conditions all HPLC protocols for analytes were
tested for method linearity, accuracy and precision were checked. Regression for
calibration (r2) standards injected were more than 0.997 for all analytes tested.
Accuracy for the method was more than 95% and precision < 3.5%, calculated by
using three injections on the same day as calibration standards (intraday) (Tables 1
and 2 in Appendixes 3). For the linearity for the results, the lower limit of
Quantification (LOQ) and limit of detection (LOD) were determined for each analyte
(Table 3 in Appendix 3). According to (Miller and Miller. 2005) these methods have
acceptable limits for both accuracy and precision and were therefore used to analyzed
samples from this study.

185
4.1.1. Exogenous aldehydes as substrates for AOX
Two exogenous aromatic aldehyde compounds, vanillin and (DMAC), were used as
substrates of AOX. Enzyme activity of AOX was measured spectrophotometrically
using two different substrates (DMAC and vanillin) with O2 as electron acceptor as
follows. These were chosen for the following reasons. DMAC is a specific substrate
for rat AOX (Kurth and Kubiciel. 1984, Moriwaki et al., 1998, Maia and Mira. 2002).
Vanillin has also been shown to be a good substrate with a high affinity for AOX
(Panoutsopoulos and Beedham. 2004).
4.1.1.1. Vanillin and DMAC
Vanillin is an aromatic aldehyde found in food material as an additive and it can be
biotransformed to its carboxylic metabolite with O2 as an electron acceptor primarily
by AOX. In the presence of NAD+, aldehyde dehydrogenase (ALDH) plays a
significant role (Beedham. 2001, Obach et al., 2004, Sahi et al., 2008, Pryde et al.,
2010, Garattini and Terao. 2013). Only two studies have directly measured the
kinetics of a substrates disappearance or product generation spectrophotometrically on
mammals, mollusks, crustaceans, insects and fish AOX. Wurzinger and Hartenstein
(1974) used vanillin as substrate of fish and mammalian AOX with O2 as an electron
acceptor in a spectrophotometric assay measuring vanillic acid production (Wurzinger
and Hartenstein. 1974). Using (DMAC) and vanillin substrates of fish AOX with O2
as an electron acceptor (Wurzinger and Hartenstein. 1974, Maia and Mira. 2002,
Kitamura et al., 2003, Choughule et al., 2013).
Km and Vmax were determined from the Eadie- Hofstee plot of V versus V/[S] as
described in the section materials and methods using simple rapid spectrophotometric
assays. The lowest Km value for an AOX substrate was found with DMAC being 21.5
± 1.05 µM (mean ± SD) with trout and 3.4 ± 1.2 µM with human and 5.4 ± 1.6 µM
186
with rat. In agreement with the present result Li et al. (2009) found that the DMAC is
an excellent substrate for rat liver AOX with a low Km value (9.6 µM) (Liu et al.,
2009). The results of this study indicated that DMAC is a better substrate of trout
AOX than vanillin with a Km value 2-fold higher (53.2 ± 2.1 µM). The Km values for
DMAC in trout were approximately 4 and 7-fold higher than that in rat and human.
The Km value of vanillin in the trout was approximately 5 and 10-fold higher
compared with that in rat and human respectively in spectrophotometric assay and
Vmax value was similar for both mammalian species (see Appendix 3 Figures 6 - 24)
(Table 39). The Km value for trout AOX with vanillin was approximately two times
more than that found guinea pig liver AOX that has a Km value of 92 µM
(Panoutsopoulos et al., 2005). Obach, (2004) found vanillin is an excellent substrate
for human liver AOX with a low Km of 2.7 µM (Obach. 2004). Vanillin has also been
used to study species variation of aldehyde oxidase occurrence in 79 species.
Wurzinger and Hartestein (1974) found vanillin to be a substrate of aldehyde oxidase
from mollusks, crustaceans, insects and fish. Panoutsopoulos and Beedham (2004)
incubated guinea pig AOX with vanillin and as shown by HPLC its metabolite vanillic
acid formed quickly (Panoutsopoulos and Beedham. 2004). In this study trout liver,
kidney and gill cytosol were incubated with vanillin and products analysed by HPLC.
With trout kidney and gill cytosol no vanillic acid peak formed, while when incubated
with trout liver cytosol the vanillic acid peak formed (Figure 34a). The trout kidney
and gill lack AOX activity and the activity are found only in the liver. The lack of
measurable AOX activity in kidney and gill contrasts that found by Krenitsky et al
1974 who measured AOX in the kidney of a Cypriniformes goldfish (Carassius
auratus) and Asagba et al 2010 who found AOX activity in the kidney and gill of a
Siluriforme African catfish (Clarias gariepinus). The Km of vanillin with trout liver
187
AOX determined using HPLC was found to be 57.20 ± 0.6 µM, which is ~ two times
more than that found with human and rat AOX (Table 39).
4.1.2. Endogenous vitamin aldehydes as substrates for AOX
Two endogenous vitamin aldehydes, pyridoxal (vitamin B6), all-trans retinal (vitamin
A) and the vitamin B3 metabolite N1-methylnicotinamide (NMN) were used as
aldehyde substrates of AOX.
4.1.2.1. Vitamin B6 pyridoxal
Vitamin B6 is a water-soluble compound that contains a pyridine ring that is present
in nature as several different forms such as pyridoxal , pyridoxine (PN), pyridoxamine
and the active form is pyridoxal 5'-phosphate (PLP) (Fitzpatrick et al., 2007). PLP is
the coenzymatically active form of vitamin B6 and plays an important role in
maintaining the biochemical homeostasis of the body (Meister. 1990, Snell. 1990).
There are more than 100 PLP-dependent enzymes in a cell that perform essential roles
in various metabolic pathways including amino acid metabolism (such as amino acid
synthesis and degradation), fatty acid metabolism (such as the synthesis of
polyunsaturated fatty acids) and carbohydrate metabolism (such as the breakdown of
glycogen) (Mooney et al., 2009). The preferred degradation route from PLP to 4-
pyridoxic acid involves the dephosphorylation of PLP by a phosphatase followed
separately by the actions of AOX and β-nicotinamide adenosine dinucleotide-
dependent dehydrogenase (Schwartz and Kjeldgaard. 1951, Stanulovic and Chaykin.
1971). When pyridoxal was incubated with trout, rat and human cytosol pyridoxic
acid was produced (Figures 35) with Km value for trout AOX 121.9 ± 3.6 µM, rat
AOX Km value of 46.4 ± 2.51 µM and human AOX Km value of 34.1 ± 1.97 µM
respectively (Table 39). The Km value of trout AOX with pyridoxal is three times

188
more than that with human and rat AOX activity with pyridoxal. The Vmax value of
trout AOX with pyridoxal found to be 1.41 ± 0.69 nmol/min/mg protein and was
approximately 6 and 9-fold lower than that Wistar rat and human respectively.
4.1.2.2. Vitamin A all-trans retinal
Another potential substrate of AOX of physiological importance is all-trans-
retinaldehyde which it oxidised to retinoic acid (Haung et al., 1999). Retinoic acid is a
key regulator of the homoeostasis of keratinized epithelia and a recognized
morphogen of the vertebrate organisms (Chambon. 1996), although its role in fish is
less well understood. All-trans retinal congeners are components of rhodopsin visual
system in all vertebrate and invertebrates including fish (Lee et al., 1996, Seki et al.,
1998). Interestingly the all-trans retinal determination network that is responsible for
controlling eye development is one of the most extensively studied gene regulatory
networks in both invertebrate and vertebrate species (Datta et al., 2011) . The first
report of fish AOX being involved in the biotransformation of all-trans retinal was by
Lakshamanan et al. (1964) who examined the oxidation of the aldehydes of both
vitamin A1 (all-trans retinal) and vitamin A2 (3, 4-dehydro-all-trans retinal) to the
corresponding acids by AOX enzyme in the liver of several freshwater-fish
(Ophiocephalus muralius, Labeo calbasu and Cyprinus carpio communis) as shown in
(Table 10). The study also found that the enzyme from these freshwater fish livers was
inhibited by the AOX inhibitor menadione (Lakshmanan et al., 1964). Although the
genes and proteins that control eye development are fully understood proteins that
might regulate the levels of all-trans retinal and retinoic acid in fish are poorly
understood. In this study, it was important to establish if trout AOX is capable of
oxidizing all-trans retinaldehyde to its metabolite retinoic acid like vertebrate AOX
(Huang and Ichikawa. 1994, Haung et al., 1999, Kitamura et al., 2006, Garattini et al.,

189
2008, Terao et al., 2009, Garattini and Terao. 2011, Garattini and Terao. 2012).
Incubation of trout cytosol with all-trans retinaldehyde generated retinoic acid (Figure
36a). This indicated that all-trans retinal is a substrate for trout AOX. These finding
are consistent with Lakshamanan et al. (1964) who first observed the role of AOX in
the oxidation of all-trans retinaldehyde to retinoic acid in fish by liver AOX
(Lakshmanan et al., 1964) and Huang and Ichikawa, (1994) and Tsujita et al. (1994)
who first observed the role of AOX in the oxidation of all-trans retinaldehyde to
retinoic acid without NAD+ in rabbit by liver cytosol AOX (Huang and Ichikawa.
1994, Tsujita et al., 1994). The Km value for trout, rat and human with all-trans retinal
was determined using HPLC and it was found that Km value of trout AOX with all-
trans retinal of 124.7 ± 2.27 µM, rat AOX Km value of 30.9 ± 1.23 µM and human
AOX Km value of 12.6 ± 0.58 µM (Table 39). The Km value of trout AOX with all-
trans retinal was ten and four times more than that human and rat AOX activity with
all-trans retinal respectively. The Vmax value of trout AOX with all-trans retinal was
2.22 ± 0.62 nmol/min/mg protein and it found to be approximately 3 and 4-fold lower
than that Wistar rat and human respectively (Table 39).The Km values found in this
study were of a similar magnitude to those found by Schumann et al., 2009 it found
the Km value of all-trans retinaldehyde (vitamin A) with mouse AOX1 of 55.8 ± 8.8
µM (Schumann et al., 2009).
4.1.2.3. N1-methylnicotinamide (NMN)
Another vitamin tested in this study was N1-methylnicotinamide (NMN) which is
often used as a marker for aldehyde oxidase (Felsted and Chaykin. 1967, Stanulovic
and Chaykin. 1971, Beedham. 1987, Sugihara et al., 2006). NMN is formed from
nicotinamide by nicotinamide N-methyltransferase which is widely distributed in
animals (Yan et al., 1997) . Many findings are consistent with the role of AOX in the
190
conversion of NMN to N1-methyl-2-pyridone-5-carboxamide (2-PY) and N
1-methyl-
4-pyridone-5-carboxamide (4-PY) in the final steps of the nicotinamide degradation
pathway (Felsted and Chaykin. 1967, Stanulovic and Chaykin. 1971, Beedham. 1987,
Sugihara et al., 2006, Peretz et al., 2012). Previously Kitamura et al, (2003) examined
the activity of AOX from sea bream (Pagrus major) and goldfish (Carassius auratus),
while using N1-methylnicotinamide as electron donor and organothiophosphate
insecticide fenthion sulphoxide as an electron acceptor as shown in (Table
10)(Kitamura et al., 2003). Rather than measure NMN metabolites Kitamura’s study
measured fenthion. In this study when NMN was incubated with trout, rat and human
cytosol two product peaks were found (Figures 36) suggesting that there was AOX
activity towards this compound. Based on what is found in mammals it is assumed
that these might be N1-methyl-2-pyridone-5-carboxamide (2-PY) and N
1-methyl-4-
pyridone-5-carboxamide (4-PY) (Figure 36). The metabolism of NMN to 2-PY and 4-
PY has been reported to be catalysed by AOX in a number of mammals including
humans (Felsted and Chaykin. 1967, Stanulovic and Chaykin. 1971, Sugihara et al.,
2006). NMN showed different metabolic profiles in mice and humans by AOX in vivo
and in vitro; for example the major product was 2-PY in humans, whereas in mice
were 2-PY and 4-PY (Kitamura et al., 2008). The ratio of 2-PY/4-PY from NMN
differs and varies among species (Kitamura et al., 2006, Garattini et al., 2008,
Kitamura et al., 2008, Garattini and Terao. 2011). Krenitsky et al. (1986) reported that
the N1-methylnicotinamide is substrate of human liver XO with very high Km value
of 48 mM (Krenitsky et al., 1986). In contrast, Krenitsky et al. (1972) reported that N-
methylnicotinamide is an excellent substrate of rabbit liver AOX with low Km value
of 1 mM (Krenitsky et al., 1986). Hall and Krenitsky (1986) reported that the N-
methylnicotinamide is a substrate of rabbit AOX with Km value of 7.9 mM (Hall and

191
Krenitsky 1986). In contrast, Rajagopalan and Handler (1964) incubated the N1-
methylnicotinamide with rabbit liver AOX and found that the Km value at pH 10 was
80 µM and at pH 7.8 was 300 µM respectively. These studies measured N1-
methynicotinamide indirectly using 2, 6-dichlorophenolindol (2, 6-DCPIP) as electron
acceptor. In this study for the first time N1-methylnicotinamide oxidation by AOX
was assayed in trout liver cytosol using sensitive a HPLC method as a new direct
assay for evaluating the AOX activity in trout. This indicated that N1-
methylnicotinamide is a substrate for trout AOX. The Km value of N1-
methylnicotinamide measured was found of 273.9 ± 2.89 µM with trout AOX, 156.2 ±
3.68 µM with Wistar rat AOX and 139.5 ± 2.86 µM with human AOX and Vmax 1.63
± 1.33 nmol/min/mg protein, 5.92 ± 0.68 nmol/min/mg protein and 6.69 ± 0.74
nmol/min/mg protein with trout, rat and human respectively as in (Table 39). The Km
of trout AOX with N1-methylnicotinamide ~ 1.5-fold more than that of mammalian
AOX with N1-methylnicotinamide.The Km measured in this study were of the same
magnitude as that found with N1-methylnicotinamide with mouse AOX3 128.5 ± 5.8
µM (Coelho et al., 2012, Mahro et al., 2013).The Vmax value of Wistar rat and
human with N1-methylnicotinamide was approximately 5 and 6-fold greater
respectively than the piscine AOX (Table 39).
4.1.3. Exogenous N-heterocycles as substrates for AOX.
Four exogenous N-heterocycles, phenanthridine, phthalazine, pyrazinamide,
cinchonine were used as N-heterocycles substrates of AOX.
4.1.3.1. Phenanthridine.
Phenanthridine is an NPAH pollutant found in terrestrial and aquatic environments
from industrial activities associated with fossil fuels (Blumer et al., 1977). NPAHs are
therefore a cause for concern both to humans and aquatic wildlife. Several papers

192
reported that the phenanthridine is a good substrate and has a very high affinity
towards AOX (Stubley and Stell. 1980, Rashidi. 1996, Beedham. 2001). In the AOX
spectrophotometric assays one N-heterocyclic compound, phenanthridine was used as
a substrate. Enzyme activity of AOX was measured spectrophotometrically using
phenanthridine as substrate with O2 as electron acceptor as follows. These were
chosen for the following reasons, phenanthridine has been shown to be a good specific
substrate for monitoring mammalian AOX activity in many studies (Lake et al., 2002,
Pirouzpanah et al., 2006, Sorouraddin et al., 2008) . Phenanthridine is a specific
substrate of mammalian AOX (Table 1). At present it is not known whether AOX in
aquatic species such as fish can metabolise phenanthridine to a more polar metabolite
(phenanthridone) aiding its excretion. However, Bleeker et al, (2001) examined the
metabolism of the environmental pollutant phenanthridine in carp (Cyprium carpio)
liver and bile into its metabolite 6(5H)-phenanthridinone (phenanthridone) suggesting
that fish AOX catalyses this biotransformation. NPAHs are derivatives of polycyclic
aromatic hydrocarbons in which one carbon atom is substituted by a nitrogen atom.
Phenanthridine has been identified in air, marine and freshwater environments, and in
ground water. High environmental concentrations in the field result from human
activities such as combustion of fossil fuels. The presence of the electronegative
nitrogen atom makes NPAHs more water soluble than their homocyclic analogues;
this increase their mobility and bioavailability in aquatic environments (Bleeker et al.,
2001). The activity with phenanthridine was not detectable with trout liver cytosol
using the standard spectrophotometric assay. It was a good substrate with both rat and
human in my study and with a Km value of 5.6 ± 0.65 µM with rat and Km value of
3.2 ± 1.23µM with human. This agreement with phenanthridine as a specific substrate
of AOX has been used in several papers and Km previously has been estimated were

193
< 1 μM with rabbit and guinea pig liver AOX enzyme and 6 μM and 14 μM with rat
and human liver AOX respectively (Stubley and Stell. 1980, Rashidi et al., 1997,
Beedham. 2001). In this study trout liver, kidney and gill cytosol incubated with
phenanthridine and product analysed by HPLC, with trout kidney and gill cytosol no
6(5H)-phenanthridinone (phenanthridone) metabolite peak found. This indicated no
AOX activity in trout kidney and gill, while in trout liver cytosol the 6(5H)-
phenanthridinone (phenanthridone) metabolite formed (Figure 39a) with a Km value
of 55.0 ± 1.63 µM. The Km values of trout AOX with phenanthridine it found seven
and six times more than that human and rat AOX activity respectively. The Vmax
value of Wistar rat and human with phenanthridine was approximately 2 and 4 times
respectively more than that with trout AOX (Table 38).In contrast, Hartmann et al.,
(2012) it found the Km value of phenanthridine with pure human AOX of 3.9 ± 0.8
µM. On other hand, Coelho et al., (2012) and Mahro et al., (2013) it found the Km
value of phenanthridine with mouse AOX3 32.3 ± 1.4 µM and 32 ± 1 µM respectively
(Coelho et al., 2012, Mahro et al., 2013).
4.1.3.2. Phthalazine.
Phthalazine an aromatic heterocyclic compounds which have a CH=N- group, which
its biotransformed to its corresponding metabolite 1-phthalazinone by mammalian
AOX (Stubley et al., 1979, Beedham et al., 1990, Obach. 2004, Panoutsopoulos and
Beedham. 2004, Barr and Jones. 2011). In this study phthalazine was incubated with
trout, rat and human liver cytosol and its metabolite was formed (Figure 40). The Km
value determined for trout, rat and human AOX with phthalazine was 61.2 ± 1.41 µM,
10.5 ± 0.55 µM and 9.80 ± 0.59 µM respectively (Table 39). The Km value for trout
AOX activity was therefore six and two times more than that human and rat AOX
respectively. The Vmax value of trout AOX with phthalazine found to be 2.02 ± 0.46
194
nmol/min/mg protein and was approximately 2 and 4 times lower than Wistar rat and
human respectively (Table 39).study by Beedham et al., (1995) which incubated
human, rabbit, guinea pig and baboon liver cytosol with phthalazine, determined the
Km for human AOX was41µM (Beedham et al., 1995). This result is similar with
trout and was ~ 4-fold higher than that with rat and human in this study. Barr and
Jones (2011 and 2013) incubated human liver cytosol with phthalazine, identified its
metabolite formed 1-phthalazinone using HPLC and determined the Km of human
AOX with phthalazine and it found it to be 8.0 ± 0.4 µM (Barr and Jones. 2011, Barr
and Jones. 2013). This result is similar what was found with human cytosol in this
study. On other hand Hartmann et al., (2012) measured the activity of phthalazine
spectrophotometrically with pure human AOX using 2,6-dichlorophenol-indophenol
(2,6-DCIP) as electron acceptor and it found the Km value of phthalazine with human
AOX of 1.3 ± 0.3 µM; this result was ~ 10-fold lower than human in this study due to
use of an artificial electron transport. On other hand Schumann et al., 2009 found the
Km value of phthalazine with mouse AOX1 of 11.4 ± 4.0 µM (Schumann et al., 2009)
and this agrees with the Km value of phthalazine with human in this study. In contrast
Coelho et al., 2012 and Mahro et al., 2013 found the Km value of phthalazine with
mouse AOX3 was 1.4 ± 0.2 µM (Coelho et al., 2012, Mahro et al., 2013); this result
was ~ 10-fold lower than human and rat in this study.
4.1.3.3. Cinchonine.
Cinchonine is a cinchona alkaloid a widely used in the treatment of malaria (Hunter.
1988). All four cinchona alkaloids, quinine, quinidine, cinchonine and cinchonidine,
are oxidised by AOX to the 2'-quinolone derivatives in mammals (Palmer et al., 1969,
Stubley et al., 1979, Beedham et al., 1992, Zhao and Ishizaki. 1997, Al-Tayib. 2009).
When cinchonine was incubated with trout, rat and human cytosol a metabolite of
195
cinchonine was produced (Figures 41) suggesting AOX plays an role in the
metabolism of cinchonine in these species. The Km value of cinchonine with rainbow
trout AOX was ~ 4-fold higher than that of two mammalian AOXs (Table 39).The
Vmax value of Wistar rat and human AOX with cinchonine was approximately 4 and
8-fold greater than that of trout AOX (Table 39). A study by Fukiya et al., 2010,
found the Km value of cinchonidine with rabbit of 124 ± 2.44 µM (Fukiya et al.,
2010) this was similar to that found with trout and was ~ 3-fold higher than that found
with rat and human AOX in this study.
4.1.3.4. Pyrazinamide.
Pyrazinamide is a drug used to treat tuberculosis that is metabolised to 5-
hydroxypyrazinamide by the action of XOR and AOX in mammals (Moriwaki et al.,
1993, Mehmedagic et al., 1997, Mehmedagic et al., 2002, Kitamura et al., 2006).
When pyrazinamide was incubated with trout in the presence of O2 as an electron
acceptor there was no production of 5-hydroxypyrazinamide (Figure 42a), but when
pyrazinamide was incubated with trout in the presence of NAD+, 5-
hydroxypyrazinamide was produced (Figures 42b). This was in contrast with that
found when pyrazinamide was incubated with both rat and human liver cytosol as 5-
hydroxy pyrazinamide was formed both in presence of NAD+
and without of
NAD+(Figures 44a, 44b, 45a and 45b). The Km value for the NAD
+-dependent trout
enzyme was approximately 2-fold higher than that two mammalian enzyme (Table
40). With the addition of NAD+ to the assay the Vmax of the rat and human activities
were increased about 4 and 6-fold respectively than when oxygen was the sole
electron acceptor. This result was consistent with finding in previous in vitro study,
which confirmed that both AOX and XOR can oxidise pyrazinamide to 5-
hydroxypyrazinamide in humans and rats (Yamamoto et al., 1987, Moriwaki et al.,
196
1993). As in (table 38) the AOX substrate specificity is different from different
substrate with the same species as well as with different species tested in this study.
For more affinity of substrate to trout AOX found DMAC the best followed with
vanillin and the lowest affinity found with N1-methylnicotinamide as it have high Km
value and lower substrate efficiency (Ks) value. On other hand, the substrate
specificity with two mammalian species rat and human AOX have high specificity
with DMAC and vanillin with lowest Km value and highest substrate efficiency (Ks)
value and lowest specificity with N1-methylnicotinamide as high Km value and lowest
substrate efficiency (Ks) value. These different in specificity due to differentiation in
amino acid sequence with different species as mentioned with (Pryde et al., 2010) it
used modelling of different AOX substrates to expect its reaction with enzyme and
measured by using X-ray crystallography to find the activity of different substrates
with the AOX.
4.1.4. Endogenous and exogenous purines and purine analogs as
substrates for XOR
4.1.4.1. Xanthine.
Kinetic analyses of XOR enzymes revealed that the endogenous purine xanthine is the
preferred substrate for XOR(Moriwaki et al., 1993). In this study using the standard
spectrophotometric assay the Km value of rat and human for XO with xanthine using
O2 as an electron acceptor was 13.2 ± 1.7 µM (mean ± SD) and 3.0 ± 0.65 µM (mean
± SD), respectively, while the Km value of rat and human for XDH with xanthine
using NAD+ as an electron acceptor was 5.5 ± 1.45 µM (mean ± SD) and 1.9 ± 0.2
µM (mean ± SD), respectively. The NAD-dependant Vmax value for xanthine
dehydrogenase with Wistar rat and human was approximately 5 and 7-fold greater
than that O2-dependant respectively (Table 40). In contrast the trout XOR enzyme
197
only displayed activity in the presence of NAD+
as an electron acceptor as no activity
with O2 was detected even after prolonged 120 minute incubations using a sensitive
HPLC assay (Figure 48 b). The Km value of trout for XDH with xanthine using NAD+
as an electron acceptor was 2-3-fold higher than the mammalian enzymes (13.5 ± 1.9
µM (mean ± SD) (Table 40). This Km value is similar to that obtained by Kaminski
and Jezewska (1985) who found that the Km of the carp (Cyprinus carpio) enzyme
was 24.7 µM. The Km value obtained with the piscine enzyme using xanthine as a
XDH substrate was about 2.5 and 6-fold higher than those obtained with rat and
human respectively. The activity of XOR in the three species was inhibited by the
XOR inhibitor oxipurinol (Figures 54, 56 and 58).These finding agree with Kaminski
and Jezewska, (1985) who observed that XDH of carp (Cyprinus carpio) converted
xanthine to uric acid only with NAD+ present and reported that allopurinol is a potent
inhibitor of carp (Cyprinus carpio) XOR (Kamiński and Jeżewska. 1985). On other
hand, Schumann et al., (2009) examined the activity of xanthine with mouse XDH and
it measured its Km value and it found of 59 ± 10 µM (Schumann et al., 2009)this
result was ~ 4-fold greater than trout and was~ 10-fold greater than rat and was ~ 25-
fold higher than human in this study. The Km value of mouse XDH was ~ 10-fold
greater than rat which may be due to species variation in molybdo-flavoenzyme
activity. Krenitsky et al. (1986) reported that the xanthine is an substrate of human
liver XO that have low Km value of 7.0 μM (Krenitsky et al., 1986). This result is
similar to that with found with human in this study.
The lack of detectable XO activity is similar to that found by other investigators with
fish XOR (Krenitsky et al., 1974, Wurzinger and Hartenstein. 1974, Cleare et al.,
1976, Kamiński and Jeżewska. 1985). However in their assays a much less sensitive
spectrophotometric assay was used which might not detect XO activity. The current

198
study which used a 120 minute incubation and a sensitive HPLC assay therefore
unequivocally proves no XO activity exists with trout liver XOR. These results
contrast with these by a number of investigators that have seemingly measured XO
activity (Sastry and Rao. 1984, Basha and Rani. 2003, Pandey et al., 2003, Asagba et
al., 2010, Hegazi et al., 2010, Hari and Neeraja. 2012). In these studies where XO has
been apparently measured it important to note that either crude homogenates or crude
post nuclear or mitochondrial supernatants were used and additionally gel filtered was
not carried out to remove small molecules that may interfere with the assay. This
would therefore result in erroneous measurement of XOR activities. As the study
describe in this thesis and other studies have used cytosol that has been gel filtered do
not detect any activity with O2 as an electron acceptor it is likely that studies that
detect XO with crude non-gel filtered extracts gave false positive results. This is
backed up by the fact that all studies that have used the correct procedure with non-
mammalian species have consistently not found measurable XO activity. These
included fish, amphibians, reptiles and birds where the enzyme exists as a non-
convertible XDH form (Kamiński and Jeżewska. 1985, Frost et al., 1986, Zakrzewska
and Jeźewska. 1989, Nishino et al., 2008). In addition XORs in non-mammalian
species lack the cysteines required for the XO conversion. Protein sequence
information from chicken and Drosophila XOR revealed that these NAD-dependant
XDHs lack a cysteines (cysteine 535 and cysteine 992) necessary for this XO
conversion (Nishino and Nishino. 1997, Nishino et al., 2008). Similarly fish XORs
also lack these cysteines (D. J. Clarke personal communication).
199
4.1.4.2. 1-methylxanthine.
Previous studies with bovine milk xanthine oxidase demonstrated it catalyses the
oxidation of 1-methylxanthine, 7-methylxanthine and theophylline, to varying degrees
with the 1-methylxanthine being the best substrate (Krenitsky et al., 1972). In this
study the caffeine metabolite 1-methylxanthine was tested as a substrate for trout, rat
and human XOR. Trout cytosolic XOR was also able to convert 1-methylxanthine to
1-methyluric acid when NAD+ was present as an electron acceptor (Figure 49b), but
no product was formed without NAD+ (Figure 49a). The Km value of trout for XDH
with 1-methylxanthine using NAD+ as an electron acceptor was 17.6 ± 1.23µM (mean
± SD) (Table 40). The Km value obtained with the piscine enzymes using 1-
methylxanthine as XDH substrate was about 2-fold higher than those obtained with
human and rat respectively (Table40). The NAD-dependant Vmax value for 1-
methylxanthine dehydrogenase with Wistar rat and human was approximately 5 and
8-fold greater respectively than the O2-dependant (Table 40). The Km value of rat and
human XOR in my study with 1-methylxanthine using NAD+ as an electron acceptor
were similar being 9.2 ± 0.62 µM (mean ± SD) and 8.6 ± 1.05 µM (mean ± SD),
respectively (Table 40). 1-methylxanthine oxidation was inhibited in the presence of
XOR inhibitor oxipurinol in all three species tested (Figures 55a, 57a and 59a). These
results agree with Reinke et al. (1987) who found the XDH of rat can catalyse the
oxidation of 1-methylxanthine to 1-methyluric acid (Reinke et al., 1987).
4.1.4.3. Allopurinol
The exogenous purine, allopurinol, is a prodrug that is metabolised to oxipurinol by
the action of both AOX and XOR (Reiter et al., 1990, Ichida et al., 1998, Pacher et
al., 2006, Yu et al., 2009).When allopurinol was incubated with trout liver cytosol
with O2 as an electron acceptor no activity was detected indicating it was not a

200
substrate for AOX or XO in this species. Similar to the two xanthine substrates when
NAD+ was included in the incubation allopurinol was biotransformed to oxipurinol
indicating that trout XDH was capable of this biotransformation. In contrast when the
two mammalian liver cytosols were incubated with allopurinol, oxipurinol was formed
with O2 and NAD+
(Figures 67 and 68) indicating AOX/XO and XDHs involvement
in this drug biotransformation as has been previously shown by others (Reiter et al.,
1990, Yamamoto et al., 1991, Moriwaki et al., 1993) . The Km value of allopurinol
with trout cytosol in presence of NAD+ as an electron acceptor was 63.2 ± 0.98 µM
with a Vmax value of 2.06 ± 0.75 nmol/min/mg protein, in contrast, the rat and human
liver cytosol metabolise allopurinol as XO in presence of O2 as an electron acceptor
and with Km value of 20.9 ± 0.76 µM and 16.7 ± 0.05 µM respectively, and as XDH
in presence of NAD+
as an electron acceptor and with Km value of 15.30 ± 1.05 µM
and 15.0 ± 0.25 µM respectively with rat and human. The Km value of trout XDH was
four times more than that of rat and human XDH activity (Table 40). The NAD-
dependant Vmax value for allopurinol as XDH substrate with Wistar rat and human
was approximately 3 and 5-fold respectively more than that O2-dependant Vmax
value(Table 40).The Km results are in higher than that reported by Krenitsky et al.
(1986) who reported that the allopurinol is an substrate of human liver XO with a low
Km value of 1.7 μM (Krenitsky et al., 1986).
4.1.4.4. 6-mercaptopurine (6MP)
In the present study, the anti-cancer drug 6-mercaptopurine (6-MP) was incubated
with the cytosolic fraction of trout, rat and human. Both rat and human cytosolic
fraction biotransformed 6-MP directly to 6-thiouric acid in the presence of NAD+ or
without NAD+ (Figures 62a, 62b, 64a and 64b) and this activity was inhibited by the
XOR inhibitor oxipurinol (Figures 63a and 65a) but was not inhibited by menadione
201
an AOX inhibitor (Figures 63b and 65b). This suggests XOR was the major enzyme
responsible for 6-MP to 6-thiouric acid conversion in the two mammalian species. The
NAD-dependant Km value for 6-MP as an XDH substrate with both mammalian are
similar as in (Table 40). The NAD-dependant Vmax value for 6-MP with Wistar rat
and human was approximately 3 and 6-fold greater than that O2-dependant Vmax
value (Table 40).In contrast no metabolites were formed when 6-MP was incubated
with trout liver cytosol with or without NAD+ (Figure 60) indicating this was not a
substrate for trout AOX or XOR.
In order to determine if the structurally related metabolite of 6-MP, 6-thioxanthine
was also not a substrate for the trout enzyme; 6-thioxanthine was incubated with trout
liver cytosol with and without NAD+. 6-thiouric acid was formed with both O2 and
NAD+ as electron acceptors, with enhanced activity with NAD
+ (Figure 66). This
activity was inhibited by the XOR inhibitor oxipurinol but not by the AOX inhibitor
menadione (Figure 67).The NAD-dependant Vmax value for 6-thioxanthine as an
XOR substrate with trout was approximately 3-fold greater than that O2-dependant
Vmax value (Table 40). Due to time constraints 6-thioxanthine was not used as a
substrate for the mammalian species. The substrate specificity and species differences
between 6-mercaptopurine and 6-thioxanthine in trout, rat and human XOR may be
due to amino acid differences at the active site of the enzymes.

202
4.2. Determination of kinetic parameters for aldehyde oxidase and
xanthine oxidoreductase inhibitors for trout, rat and human.
In this study preliminary experiments were performed with three well documented
inhibitors of AOX and XOR. In this study the AOX inhibitor benzamidine did not
have any effect with trout liver cytosol at two pH 7.4 and 9.0 as seen in (Figures 71a
and 71b), while with human and rat liver cytosol it resulted in 80-90% inhibition using
100µM benzamidine. When the prototypical AOX inhibitor menadione was used the
AOX activity was inhibited 80-92% in the three species tested using a 5 µM final
concentration (Figure 70). The XOR inhibitor oxipurinol inhibited the two
mammalian XORs 90-95% whereas the trout XOR was inhibited ~ 60% with 100µM
final concentration of this inhibitor (Figure 72).
In order to further understand the mode and kinetics of inhibition with trout AOX and
XOR this was scrutinised with six different inhibitors and the mode of inhibition and
Ki determined using Lineweaver-Burk plots. Menadione had a Ki of 0.17 ± 0.03µM
and mode of inhibition non-competitive inhibition as seen in (Figures 73 and 74) and
(Table 41). The inhibition effect of estradiol and 17α-ethinyl estradiol as inhibitors
with trout AOX was uncompetitive with Ki values of 0.34 ± 0.05 µM and 0.44 ± 0.05
µM respectively (Figures 75, 76, 77 and 78). The mode of inhibition and Ki value of
chlorpromazine as AOX inhibitor with trout was also tested and a Ki value of 0.76 ±
0.06 µM was obtained and mode of inhibition as competitive (Figures 79 and 80), the
environmental pollutant NPAH phenanthridine was found to be competitive inhibitor
of trout AOX with a Ki value of 0.77 ± 0.7 µM as in (Figures 81 and 82) which is 3-
fold higher than that found with bovine AOX (Table 5). When the XOR inhibitor
oxipurinol was tested with trout XOR the mode of inhibition was non-competitive

203
inhibition with Ki value of 0.37 ± 0.06 µM as in (Figures 84 and 85) as similar that it
found with bovine in introduction (Table 6).
In conclusion all six different inhibitors tested displayed similar modes of inhibition in
trout to that found in mammals (Table 4, 5 and 6).
204
4.3. Purification of AOX from rainbow trout and Wistar rat liver
cytosol.
Prior to the purification of AOX from rainbow trout and Wistar rat liver a literature
survey was carried out to establish the best methodologies to use to purify AOX.
AOX has been purified from many different species with different methodologies as
summarised in the (Tables 21 and 22). Reviewing the literature on the subject reveals
that the initial step of purification of AOX is generally subcellular fractionation to
generate cytosol where the enzyme resides. A popular subsequent purification method
used for AOX is heat precipitation as mammalian AOXs are thermotolerant. In some
purification protocols buffers used to purify AOX contain dithiothreitol and cysteine
to protect proteins containing sulfhydryl groups. (Rajagopalan and Handler. 1967,
Felsted et al., 1973, Andres. 1976, MacGibbon et al., 1979, Yoshihara and Tatsumi.
1985, Stell et al., 1989, Hughes et al., 1994, Calzei et al., 1995, Turner et al., 1995,
McManaman et al., 1996, Yoshihara and Tatsumi. 1997, Sugihara et al., 1999, Terao
et al., 2001, Maia and Mira. 2002, Kitamura et al., 2003, Kurosaki et al., 2004, Vila et
al., 2004, Terao et al., 2006, Terao et al., 2009, Mahro et al., 2011). Prior to initiating
experiments to purify AOX from the piscine species, in order to check procedures
were operating successfully initially AOX was purified from Wistar rat liver cytosol
using procedure 1 in materials and methods section (Figure 25). Heat treatment, Q-
sepharose anion exchange chromatography, affinity chromatography using
benzamidine 6B Sepharose column and MonoQ anion exchange chromatography
successfully gave a 227-fold purification and a 22 % yield. The fold purification was
about 4-fold lower than Maia and Mira (2002) found. When AOX was purified from
rainbow trout a different procedure was used, as the piscine enzyme was more heat
liable than that rodent enzyme with 80% activity lost after a brief 15 minute
incubation at the 55°C standard temperature used for mammalian AOX purification

205
(Tables 21 and 22 and Figure 88). The heat treatment step was therefore omitted from
the procedure for purification of AOX from rainbow trout. In addition the affinity
chromatography step was also not useful for purification of AOX from rainbow trout,
due to the benzamidine not being an effective inhibitor of rainbow trout AOX (Figure
71). The alternative procedure used to purify the AOX from rainbow trout liver started
with the second step of the purification of AOX from rat liver, this was ammonium
sulphate precipitation that successfully purified the piscine enzyme 3-fold.
Subsequently a series of chromatography steps were carried out including Q-
sepharose anion exchange chromatography, gel filtration chromatography on Superose
6 16/70 and the final step was MonoQ anion exchange chromatography. This resulted
in a 210-fold purification and 12.9 % yield. The native molecular mass of rainbow
trout AOX estimated using gel filtration was found to be similar to its mammalian,
avian and insect counterparts being ~ 295 kDa (Table 22). SDS PAGE indicated the
trout AOX had undergone extensive proteolysis as several low molecular mass
polypeptides were apparent at less than the expected monomeric mass of the enzyme
of 150 kDa. This result is in agreement with other researchers that purified AOX from
another fish the Sea bream (Pagrus major) that also suggested proteolysis had
occurred during purification (Kitamura et al., 2003). Despite this the procedure used
in this laboratory had a much enhanced success compared with Kitamura et al. (2003)
in that the partially purified AOX from Sea bream liver was only purified 33-fold with
a 5.5 % yield. A possible solution to the problems of purification of piscine AOX
might be to add a protease inhibitors such as phenylmethylsulfonyl fluoride (PMSF).
Another solution to characterising purified AOX in fish is to use a recombinant
protein expression system in which piscine AOX cDNA is expressed in bacteria and
subsequently purified using a simple protocol that would avoid the proteases that are

206
found in animal liver. Such a system has been used successfully to study mouse,
monkey, rat and human AOX (Kane et al., 2006, Schumann et al., 2009).

207
4.4. Conclusions.
This study aimed to determine whether a fish rainbow trout (Oncorhynchus mykiss)
can biotransform AOX and XOR substrates like their mammalian counterparts. To
date there has been no study of AOX in any Salmoniforme despite their commercial
and scientific importance.
Rainbow trout AOX and XOR activities were tested in liver, kidney and gill cytosol
and it was found exclusively in the liver using HPLC and spectrophotometric assays.
Hepatic cytosols of rainbow trout, human and rat were able to catalyse the oxidation
of a range of MFE substrates to varying degrees. These included the exogenous
aldehydes (DMAC and vanillin), endogenous vitamin substrates (all-trans retinal,
pyridoxal and N1-methylnicotinamide), NPAH environmental pollutants
(phenanthridine, phthalazine and cinchonine), and drugs (allopurinol and
pyrazinamide). The exogenous purine and purine analogues xanthine, 1-
methylxanthine, 6-mercaptopurine, 6-thioxanthine were also biotransformed by XOR
in all species tested (Table 1). The study also demonstrated that the XOR activity of
rainbow trout was exclusively NAD+-dependant activity unlike that in the two
mammalian species tested (Table 40). When Eadie-Hofstee plots were used to
determine kinetic values of rainbow trout MFE activities with different substrates and
compared with human and rat and it was found that the Km was higher and the Vmax
lower in rainbow trout. This study therefore demonstrated that a piscine AOX has the
ability to metabolise several NPAH environmental pollutants and is capable of the
oxidative biotransformation of several endogenous vitamin substrates like its
mammalian counterparts. With regards to the physiological role of NPAH
biotransformation by AOX this is an important detoxication mechanism as several
studies in vivo and ex vivo have demonstrated that NPAHs are harmful. AOX
208
substrates phenanthridine, phthalazine, isoquinoline and acridine together with several
benzoacridine and dibenzoacridine have been shown to be cytotoxic in cultured cell
lines such as H4IIE rat hepatoma and mouse embryonic carcinoma P19/A15 cell lines
(Sovadinova et al., 2006, Beníšek et al., 2011). Bleeker et al (1999) also demonstrated
that NPAH compounds acridine, benzo[c]acridine, benzo[a]acridine, quinoline,
benzo[f]quinoline, benzo[h]quinoline and phenanthridine were toxic to Chironomus
riparius (midge) (Bleeker et al., 1999). Benzoquinoline-diones have also been shown
to be teratogenic to cricket embryos resulting in extra heads and legs (Walton et al.,
1983). Many of the harmful effects of NPAHs have also been documented in fish
species. Baylock et al., (1985) found that acridine was toxic to fathead minnows
(Pimephales promelas) (Blaylock et al., 1985),whilst acridine and quinoline have also
been shown to cause embryotoxicity in rainbow trout (Salmo
gairdneri=Oncorhynchus mykiss) (Black et al., 1983), largemouth bass (Micropterus
salmoides) (Black et al., 1983) and zebrafish (Danio rerio) (Peddinghaus et al., 2012).
As well as in vivo studies ex vivo work using the fish hepatoma PLHC-1 cell line
(derived from Poeciliopsis lucida) has also shown that benzo[a]acridine and dibenz[a,
h]acridine are cytotoxic (Jung et al., 2001). Very recently research utilising the
rainbow trout liver cell line RTL-W1 has shown that acridine is genotoxic in
micronucleus assays (Brinkmann et al., 2014). With regards compounds that interfere
with AOX biotransformation several compounds were tested in these studies that have
physiological importance. Endogenous steroids (estradiol) and drugs (menadione and
chlorpromazine) and exogenous environmental pollutants (phenanthridine and 17α-
ethinyl estradiol) were inhibitors of the piscine AOX enzyme. These results may
therefore have important physiological consequences for fish that live in an aquatic
environment exposed to pollutants such as NPAHs, estrogens and drugs(Furlong and

209
Carpenter. 1982, Jobling et al., 1996, Schultz et al., 2001, Schultz et al., 2003, Vulliet
and Cren-Olivé. 2011, Brulik et al., 2013)as it may have effects on vitamin A, B3 or
B6 metabolism (Spinneker et al., 2007, Van der Sluijs et al., 2011). With regards
compounds that effect XOR biotransformation the compounds tested were of less
physiological importance to a fish, but the results reveal species similarities and
differences exist. Whereas oxipurinol was a potent inhibitor of XOR in all species
tested, in contrast to the mammalian AOXs benzamidine did not inhibit the piscine
AOX.
In order to further characterise trout AOX protein purification was carried out. In
contrast to mammalian AOX, the piscine enzyme was not thermotolerant at 55°C nor
was it inhibited by benzamidine, thus heat treatment and affinity chromatography
could not be used as a purification steps. Trout AOX was purified 210-fold using
ammonium sulphate fractionation, together with ion exchange and gel filtration
chromatography. The native molecular mass of the piscine AOX was 295 kDa, which
is similar to mammalian AOXs.
In conclusion this study yields new insight into groups of anthropogenic
environmental pollutants, drugs and vitamins that are substrates and inhibitors of
piscine AOX that is an ancestral vertebrate AOX.

210
4.5. Recommendations for future work.
This study could be expanded to analyse a wider range of xenobiotics including drugs
that are potential piscine MFE substrates. A particular focus could be NPAHs which
are well documented aquatic environmental pollutants (Blumer et al., 1977, Balch et
al., 1995, Osborne et al., 1997, de Voogt and Laane. 2009) that are cytotoxic,
embryotoxic, teratogenic, genotoxic and carcinogenic (Southworth et al., 1979, Balch
et al., 1995, Jung et al., 2001, Barron et al., 2004, Peddinghaus et al., 2012,
Brinkmann et al., 2014).
Another set of compounds that could be tested are MFEs reductase substrates such as
acetophenone oxime, salicylaldoxime, benzamidoxime, aromatic and heterocyclic
hydroxamic acids, fenthion sulfoxide, sulindac sulfoxide and zonisamide (Table 2)
some of which are found in aquatic environment.
Another area that could be researched is the induction of MFEs by NPAHs.
Although cytochrome P450 have been well documented to be induced by PAHs
including NPAHs in mammals (Sovadinova et al., 2006, Beníšek et al., 2011) the
effect of such compounds on MFEs have received scant attention. There have been the
only two studies with two environmental polycyclic aromatic hydrocarbons (PAHs)
demonstrating that such compounds can induce MFEs. Johnson et al., (1984) found
that oral administration of the NPAH phthalazine (50mg/kg/day) to female rabbits
caused an 2 to 3-fold increase in the activity of the hepatic AOX and XOR, whereas
there was no effect on microsomal cytochrome P-450 activity (Johnson et al., 1984).
Sugihara et al., (2001) demonstrated that 2, 3, 7, 8-tetrachlorodibenzo-p-dioxin
(TCDD) induced hepatic XOR and AOX in liver of mice about 3-fold and 1.5-fold
respectively (Sugihara et al., 2001). This suggests that induction of MFEs in fish
211
might be a useful monitor for NPAH pollution to complement the use of CYP1A
induction in environmental monitoring (Stagg et al., 2000, Basu et al., 2001, Tom et
al., 2001). In order to determine the extent of NPAHs induction of MFEs in fish,
investigations could be conducted by treating fish in laboratory conditions with a
range of NPAHs to determine if MFE induction occurs. MFEs could also be measured
in fish from polluted environments to determine if there is a correlation between
NPAHs levels and MFEs activity.
212
5. References
Al-Tayib, Y. 2009. In vitro hepatic metabolism of cinchona antimalarials by hamster
enzymes. J.B Ap Sci 5, 17-25.
Andres, R. Y. 1976. Aldehyde oxidase and xanthine dehydrogenase from wild-type
Drosophila melanogaster and immunologically cross-reacting material from
ma-1 mutants. Purification by immunoadsorption and characterization. Eur J
Biochem, 62, 591-600.
Andrews, P. 1964. Estimation of the molecular weights of proteins by Sephadex gel-
filtration. Biochem J, 91, 222-33.
Arnaud, M. J. 2011. Pharmacokinetics and metabolism of natural methylxanthines in
animal and man. Handb Exp Pharmacol, 200, 33-91.
Asagba, S. O.,G. E. Eriyamremu,J. O. T. Emudainohwo & I. Okoro 2010. Oxidative
enzymes in tissues of the catfish (Clarias gariepinus) exposed to varying levels
of cadmium. Environ, 30, 260-266.
Balch, G.,C. Metcalfe & S. Huestis 1995. Identification of potential fish carcinogens
in sediment from Hamilton Harbour, Ontario, Canada. Environ Toxicol Chem,
14, 79-91.
Barnabe, N.,J. A. Zastre,S. Venkataram & B. B. Hasinoff 2002. Deferiprone protects
against doxorubicin-induced myocyte cytotoxicity. Free Radic Biol Med, 33,
266-75.
Barr, J. T. & J. P. Jones 2011. Inhibition of human liver aldehyde oxidase:
implications for potential drug-drug interactions. Drug Metab Dispos, 39,
2381-6.
Barr, J. T. & J. P. Jones 2013. Evidence for substrate-dependent inhibition profiles for
human liver aldehyde oxidase. Drug Metab Dispos, 41, 24-9.
Barron, M. G.,R. Heintz & S. D. Rice 2004. Relative potency of PAHs and
heterocycles as aryl hydrocarbon receptor agonists in fish. Mar Environ Res,
58, 95-100.
Baselt, R. C. & R. H. Cravey 1996. Disposition of toxic drugs and chemicals in man
Year Book medical Publishers, Inc.USA.
Basha, P. S. & A. U. Rani 2003. Cadmium-induced antioxidant defense mechanism in
freshwater teleost Oreochromis mossambicus (Tilapia). Ecotoxicol Environ
Saf, 56, 218-21.
Basu, N.,S. Billiard,N. Fragoso,A. Omoike,S. Tabash,S. Brown & P. Hodson 2001.
Ethoxyresorufin-O-deethylase induction in trout exposed to mixtures of
polycyclic aromatic hydrocarbons. Environ Toxicol Chem, 20, 1244-51.
213
Bean, R. M.,D. D. Dauble,B. L. Thomas,R. William Hanf Jr & E. K. Chess 1985.
Uptake and biotransformation of quinoline by rainbow trout. Aquatic
Toxicology, 7, 221-239.
Beedham, C. 1985. Molybdenum hydroxylases as drug metabolising enzymes. Drug
Metab. Rev. , 16, 11-156.
Beedham, C. 1987. Molybdenum hydroxylases: biological distribution and substrate-
inhibitor specificity. Prog Med Chem, 24, 85-127.
Beedham, C. 1998. Oxidation of carbon via molybdenum hydroxylases. Drug metab,
39-52.
Beedham, C. 2001. Molybdenum hydroxylase, In: Enzyme Systems that Metabolise
Drugs and Other Xenobiotics C. Ioannides (Ed.),John Wiley & Sons Ltd
Beedham, C. 2010. Xanthine oxidoreductase and aldehyde oxidase, Comprehensive
Toxicology Copyright, 2010 Elsevier Ltd. All rights reserved.
Beedham, C.,Y. Al-Tayib & J. A. Smith 1992. Role of guinea pig and rabbit hepatic
aldehyde oxidase in oxidative in vitro metabolism of cinchona antimalarials.
Drug Metab Dispos, 20, 889-95.
Beedham, C.,S. E. Bruce,D. J. Critchley & D. J. Rance 1990. 1-substituted
phthalazines as probes of the substrate-binding site of mammalian
molybdenum hydroxylases. Biochem Pharmacol, 39, 1213-21.
Beedham, C.,D. J. Critchley & D. J. Rance 1995. Substrate specificity of human liver
aldehyde oxidase toward substituted quinazolines and phthalazines: a
comparison with hepatic enzyme from guinea pig, rabbit, and baboon. Arch
Biochem Biophys, 319, 481-90.
Begas, E.,E. Kouvaras,A. Tsakalof,S. Papakosta & E. K. Asprodini 2007. In vivo
evaluation of CYP1A2, CYP2A6, NAT-2 and xanthine oxidase activities in a
Greek population sample by the RP-HPLC monitoring of caffeine metabolic
ratios. Biomed Chromatogr, 21, 190-200.
Behnke, R. J. 1992. Native trout of western North America. American Fisheries
Society monograph (USA). no. 6.
Beníšek, M.,P. Kubincová,L. Bláha & K. Hilscherová 2011. The effects of PAHs and
N-PAHs on retinoid signaling and Oct-4 expression in vitro. Toxicology
letters, 200, 169-175.
Black, J. A.,W. J. Birge,A. G. Westerman & P. C. Francis 1983. Comparative aquatic
toxicology of aromatic hydrocarbons. Fundam Appl Toxicol, 3, 353-8.
Blaylock, B.,M. Frank & J. McCarthy 1985. Comparative toxicity of copper and
acridine to fish, Daphnia and algae. Environ Toxicol Chem, 4, 63-71.
214
Bleeker, E. A.,L. Noor,M. H. Kraak,P. de Voogt & W. Admiraal 2001. Comparative
metabolism of phenanthridine by carp (Cyprinus carpio) and midge larvae
(Chironomus riparius). Environ Pollut, 112, 11-7.
Bleeker, E. A. J.,H. A. Leslie,D. Groenendijk,M. Plans & W. Admiraal 1999. Effects
of exposure to azaarenes on emergence and mouthpart development in the
midge Chironomus riparius (Diptera : Chironomidae). Environ Toxicol Chem,
18, 1829-1834.
Blumer, M.,T. Dorsey & J. Sass 1977. Azaarenes in recent marine sediments. Science,
195, 283-5.
Bonner, P. L. R. 2007. Protein Purification, Taylor & Francis.
Borges, F.,E. Fernandes & F. Roleira 2002. Progress towards the discovery of
xanthine oxidase inhibitors. Curr Med Chem, 9, 195-217.
Brinkmann, M.,H. Blenkle,H. Salowsky,K. Bluhm,S. Schiwy,A. Tiehm & H. Hollert
2014. Genotoxicity of heterocyclic PAHs in the micronucleus assay with the
fish liver cell line RTL-W1. PLoS One, 9, e85692.
Brondino, C. D.,M. G. Rivas,M. J. Romao,J. J. Moura & I. Moura 2006. Structural
and electron paramagnetic resonance (EPR) studies of mononuclear
molybdenum enzymes from sulfate-reducing bacteria. Acc Chem Res, 39, 788-
96.
Brondino, C. D.,M. J. Romao,I. Moura & J. J. G. Moura 2005 Molybdenum and
tungsten enzymes: the xanthine oxidase family. Curr. Opin. Chem. Biol., 10,
1-6.
Brulik, J.,Z. Simek & P. de Voogt 2013. A new liquid chromatography–tandem mass
spectrometry method using atmospheric pressure photo ionization for the
simultaneous determination of azaarenes and azaarones in Dutch river
sediments. J Chromatogr A, 1294, 33-40.
Calzei, L.,C. Raviolo,E. Ghibaudi,L. de Gioia,M. Salmona,G. Cazzaniga,M.
Kurosaki,M. Terao & G. E. 1995. Purification, cDNA cloning, and tissue
distribution of bovine liver aldehyde oxidase. J Biol Chem, 270, 31037-45.
Chambon, P. 1996. A decade of molecular biology of retinoic acid receptors. FASEB
J, 10, 940-54.
Chen, Q.,H. C. Park,M. S. Goligorsky,P. Chander,S. M. Fischer & S. S. Gross 2012.
Untargeted plasma metabolite profiling reveals the broad systemic
consequences of xanthine oxidoreductase inactivation in mice. PLoS One, 7,
e37149.
Chen, Y. & D. H. Reese 2013. A screen for disruptors of the retinol (vitamin A)
signaling pathway. Birth Defects Res B Dev Reprod Toxicol, 98, 276-82.
Chiamvimonvat, N.,B. O'Rourke,T. J. Kamp,R. G. Kallen,F. Hofmann,V. Flockerzi &
E. Marban 1995. Functional consequences of sulfhydryl modification in the
215
pore-forming subunits of cardiovascular Ca2+ and Na+ channels. Circ Res, 76,
325-34.
Chladek, J.,J. Martinkova & L. Sispera 1997. An in vitro study on methotrexate
hydroxylation in rat and human liver. Physiol Res, 46, 371-9.
Choi, E. Y.,A. L. Stockert,S. Leimkuhler & R. Hille 2004. Studies on the mechanism
of action of xanthine oxidase. J Inorg Biochem, 98, 841-8.
Choughule, K. V.,J. T. Barr & J. P. Jones 2013. Evaluation of rhesus monkey and
guinea pig hepatic cytosol fractions as models for human aldehyde oxidase.
Drug Metab & Dispos, 41, 1852-1858.
Cleare, W. F.,S. Bree & M. P. Coughlan 1976. Urate oxidase and xanthine
dehydrogenase activities in liver extracts from fish caught in Irish waters.
Comp Biochem Physiol B, 54, 117-9.
Coelho, C.,M. Mahro,J. Trincao,A. T. Carvalho,M. J. Ramos,M. Terao,E. Garattini,S.
Leimkuhler & M. J. Romao 2012. The first mammalian aldehyde oxidase
crystal structure: insights into substrate specificity. J Biol Chem, 287, 40690-
702.
Cook, P. F. & W. W. Cleland 2007. Enzyme kinetics and mechanism, Garland Sci
New York.
Datta, R. R.,T. Cruickshank & J. P. Kumar 2011. Differential selection within the
Drosophila retinal determination network and evidence for functional
divergence between paralog pairs. Evol Dev, 13, 58-71.
De Moreno, M. R.,J. F. Smith & R. V. Smith 1985. Silver staining of proteins in
polyacrylamide gels - increased sensitivity through a combined coomassie blue
silver stain procedure. Anal Biochem, 151, 466-470.
de Voogt, P. & R. W. Laane 2009. Assessment of azaarenes and azaarones (oxidized
azaarene derivatives) in the Dutch coastal zone of the North Sea.
Chemosphere, 76, 1067-74.
Derbre, F.,B. Ferrando,M. C. Gomez-Cabrera,F. Sanchis-Gomar,V. E. Martinez-
Bello,G. Olaso-Gonzalez,A. Diaz,A. Gratas-Delamarche,M. Cerda & J. Viña
2012. Inhibition of xanthine oxidase by allopurinol prevents skeletal muscle
atrophy: role of p38 MAPKinase and E3 ubiquitin ligases. PloS one, 7,
e46668.
Diamond, S.,J. Boer,T. P. Maduskuie, Jr.,N. Falahatpisheh,Y. Li & S. Yeleswaram
2010. Species-specific metabolism of SGX523 by aldehyde oxidase and the
toxicological implications. Drug Metab Dispos, 38, 1277-85.
Dick, R. A.,D. B. Kanne & J. E. Casida 2005. Identification of aldehyde oxidase as
the neonicotinoid nitroreductase. Chem Res Toxicol, 18, 317-323.
Dick, R. A.,D. B. Kanne & J. E. Casida 2007. Nitroso-imidacloprid irreversibly
inhibits rabbit aldehyde oxidase. Chem Res Toxicol, 20, 1942-6.
216
Dickinson, W. J. 1970. The genetics of aldehyde oxidase in Drosophila melanogaster.
Gene, 66, 487-96.
Dickinson, W. J. 1971. Aldehyde oxidase in Drosophila melanogaster: a system for
genetic studies on developmental regulation. Dev Biol, 26, 77-86.
Duggan, D. E. 1981. Sulindac: therapeutic implications of the prodrug/pharmacophore
equilibrium. Drug Metab Rev, 12, 325-37.
Elion, G. B. 1966. Enzymatic and metabolic studies with allopurinol. Ann Rheum Dis,
25, 608-14.
Engerson, T. D.,T. G. McKelvey,D. B. Rhyne,E. B. Boggio,S. J. Snyder & H. P. Jones
1987. Conversion of xanthine dehydrogenase to oxidase in ischemic rat
tissues. J Clin Invest, 79, 1564-70.
Enroth, C.,B. T. Eger,K. Okamoto,T. Nishino & E. F. Pai 2000. Crystal structures of
bovine milk xanthine dehydrogenase and xanthine oxidase: structure-based
mechanism of conversion. Proc Natl Acad Sci U S A, 97, 10723-8.
Epifanio, J. & D. Philipp 1993. Linkage Analysis of 10 Enzyme Loci in the Genus
Pomoxis (Pisces: centrarchidae). Journal of Heredity, 84, 116-121.
Epifanio, J. M. & D. P. Philipp 1994. Ontogeny of gene expression in Pomoxis
(Pisces: Centrarchidae). Developmental genetics, 15, 119-128.
Falciani, F.,M. Terao,S. Goldwurm,A. Ronchi,A. Gatti,C. Minoia,M. Li Calzi,M.
Salmona,G. Cazzaniga & E. Garattini 1994. Molybdenum(VI) salts convert the
xanthine oxidoreductase apoprotein into the active enzyme in mouse L929
fibroblastic cells. Biochem J, 298 69-77.
Felsted, R. L. & S. Chaykin 1967. N1-methylnicotinamide oxidation in a number of
mammals. J Biol Chem, 242, 1274-1279.
Felsted, R. L.,A. E. Chu & S. Chaykin 1973. Purification and properties of the
aldehyde oxidases from hog and rabbit livers. J Biol Chem, 248, 2580-7.
Feng, G.-P.,P. Zhuang,L.-Z. Zhang,J.-Y. Liu,M. Duan,F. Zhao & W.-G. Yan 2012.
Effects of water temperature on metabolic enzyme and antioxidase activities in
juvenile Chinese sturgeon (Acipenser sinensis). Acta Hydrobiologica Sinica,
36, 137-142.
Fitzpatrick, T.,N. Amrhein,B. Kappes,P. Macheroux,I. Tews & T. Raschle 2007. Two
independent routes of de novo vitamin B6 biosynthesis: not that different after
all. Biochem. J, 407, 1-13.
Fridovich, I. & P. Handler 1962. Xanthine oxidase v. differential inhibition of the
reduction of various electron acceptors. J Biol Chem, 237, 916-921.
Frost, S. K.,M. E. Borchert & S. Thorsteinsdottir 1986. Rapid and sensitive thin-layer
chromatographic assay procedure for measuring xanthine dehydrogenase
activity from tissue extracts. J Chromatogr, 382, 314-20.
217
Fukiya, K.,K. Itoh,S. Yamaguchi,A. Kishiba,M. Adachi,N. Watanabe & Y. Tanaka
2010. A single amino acid substitution confers high cinchonidine oxidation
activity comparable with that of rabbit to monkey aldehyde oxidase 1. Drug
Metab Dispos, 38, 302-7.
Furlong, E. T. & R. Carpenter 1982. Azaarenes in Puget Sound Sediments.
Geochimica Et Cosmochimica Acta, 46, 1385-1396.
Garattini, E.,M. Fratelli & M. Terao 2008. Mammalian aldehyde oxidases: genetics,
evolution and biochemistry. Cell Mol Life Sci, 65, 1019-48.
Garattini, E.,M. Fratelli & M. Terao 2009. The mammalian aldehyde oxidase gene
family. Hum Genomics, 4, 119-30.
Garattini, E.,R. R. Mendel,M. J. Romao,R. Wright & M. Terao 2003. Mammalian
molybdo-flavoenzymes, an expanding family of proteins: structure, genetics,
regulation, function and pathophysiology. Biochem J, 372, 15-32.
Garattini, E. & M. Terao 2011. Increasing recognition of the importance of aldehyde
oxidase in drug development and discovery. Drug Metab Rev, 43, 374-86.
Garattini, E. & M. Terao 2012. The role of aldehyde oxidase in drug metabolism.
Expert Opin Drug Metab Toxicol, 8, 487-503.
Garattini, E. & M. Terao 2013. Aldehyde oxidase and its importance in novel drug
discovery: present and future challenges. Expert Opin Drug Discov, 8, 641-54.
Ghassan, Z. A.,F. A. Muthanna,M. S. Ibrahim,Z. Omar,C. Mallikarjun,S. M.
Elrashid,F. Y. Mun,H. Sakeena,B. Mahiran,A. S. Munavvar & M. N. Azmin
2010. HPLC method modification and validation for quantification of
Ibuprofen. Int J Pharm Sci, 4, 404-409.
Glatigny, A. & C. Scazzocchio 1995. Cloning and molecular characterization of hxA,
the gene coding for the xanthine dehydrogenase (purine hydroxylase I) of
Aspergillus nidulans. J Biol Chem, 270, 3534-50.
Gustafson, D. L. & C. A. Pritsos 1992. Bioactivation of mitomycin C by xanthine
dehydrogenase from EMT6 mouse mammary carcinoma tumors. J Natl
Cancer Inst, 84, 1180-5.
Hall, W. W. & T. A. Krenitsky 1986. Aldehyde oxidase from rabbit liver: specificity
toward purines and their analogs. Archives Biochem Biophysic, 251, 36-46.
Hamelin, B. A.,K. Xu,F. Valle,L. Manseau,M. Richer & M. LeBel 1994. Caffeine
metabolism in cystic fibrosis: enhanced xanthine oxidase activity. Clin
Pharmacol Ther, 56, 521-9.
Hari, P. & P. Neeraja 2012. Ambient ammonia stress on certain detoxifying enzymes
in kidney tissues of fish, Cyprinus carpio. Int J Pharm Biochem Sci, 4, 213-
217.

218
Harris, C. M. & V. Massey 1997. The oxidative half-reaction of xanthine
dehydrogenase with NAD; reaction kinetics and steady-state mechanism. J
Biol Chem, 272, 28335-41.
Hartmann, T.,M. Terao,E. Garattini,C. Teutloff,J. F. Alfaro,J. P. Jones & S.
Leimkuhler 2012. The impact of single nucleotide polymorphisms on human
aldehyde oxidase. Drug Metab Dispos, 40, 856-64.
Harvey, D. J. 2004. Aquaculture outlook. Electronic Outlook report from the
Economic Research Service LDP-AQS-20.
Haung, D.,A. Furukawa & Y. Ichikawa 1999. Molecular cloning of retinal
oxidase/aldehyde oxidase cDNAs from rabbit and mouse livers and functional
expression of recombinant mouse retinal oxidase cDNA in Escherichia coli.
Arch Biochem Biophys. , 364(2):264-72.
Hegazi, M. M.,Z. I. Attia & O. A. Ashour 2010. Oxidative stress and antioxidant
enzymes in liver and white muscle of Nile tilapia juveniles in chronic
ammonia exposure. Aquat Toxicol, 99, 118-25.
Hille, R. 2005. Molybdenum-containing hydroxylases. Arch Biochem Biophys, 433,
107-16.
Hille, R. & T. Nishino 1995. Flavoprotein structure and mechanism. 4. Xanthine
oxidase and xanthine dehydrogenase. FASEB J, 9, 995-1003.
Hille, R. & H. Sprecher 1987. On the mechanism of action of xanthine oxidase.
Evidence in support of an oxo transfer mechanism in the molybdenum-
containing hydroxylases. J Biol Chem, 262, 10914-10917.
Hirao, Y.,S. Kitamura & K. Tatsumi 1994. Epoxide reductase activity of mammalian
liver cytosols and aldehyde oxidase. Carcinogenesis, 15, 739-43.
Holmes, R. S. 1979. Genetics, ontogeny, and testosterone inducibility of aldehyde
oxidase isozymes in the mouse: evidence for two genetic loci (Aox-I and Aox-
2) closely linked on chromosome 1. Biochem Genet, 17, 517-27.
Holmes, R. S. & J. L. Vandeberg 1986. Aldehyde dehydrogenases, aldehyde oxidase
and xanthine oxidase from baboon tissues: phenotypic variability and
subcellular distribution in liver and brain. Alcohol, 3, 205-14.
Huang, D. Y. & Y. Ichikawa 1994. Two different enzymes are primarily responsible
for retinoic acid synthesis in rabbit liver cytosol. Biochem Biophys Res
Commun, 205, 1278-83.
Huang, D. Y. & Y. Ichikawa 1997. Purification and characterization of a novel
cytosolic NADP(H)-dependent retinol oxidoreductase from rabbit liver.
Biochim Biophys Acta, 1338, 47-59.
Hughes, R. K.,B. Bennett & R. C. Bray 1994. Xanthine Dehydrogenase from
Drosophila-Melanogaster - Purification and Properties of the Wild-Type
219
Enzyme and of a Variant Lacking Iron-Sulfur Centers (Vol 31, Pg 3073,
1992). Biochem, 33, 8384-8384.
Hunter, C. 1988. Cinchona spp.: micropropagation, and the in vitro production of
quinine and quinidine. Med Arom Plant I. Springer.
ICH 1994. Validation of analytical methods: definitions and terminology. ICH Q2 A.
Ichida, K.,M. Yoshida,R. Sakuma & T. Hosoya 1998. Two siblings with classical
xanthinuria type 1: significance of allopurinol loading test. Intern Med, 37, 77-
82.
Idle, J. R. & F. J. Gonzalez 2007. Metabolomics. Cell Metab, 6, 348-51.
Isamah, G. K. & S. O. Asagba 2004. A comparative study on the archives of xanthine
oxidase and aldehyde oxidase in different fish species from two rivers in the
Western Niger-Delta. Environ Monit Assess, 91, 293-300.
Itoh, K.,M. Yamamura,W. Takasaki,T. Sasaki,A. Masubuchi & Y. Tanaka 2006.
Species differences in enantioselective 2-oxidations of RS-8359, a selective
and reversible MAO-A inhibitor, and cinchona alkaloids by aldehyde oxidase.
Biopharm Drug Dispos, 27, 133-9.
Jobling, S.,J. P. Sumpter,D. Sheahan,J. A. Osborne & P. Matthiessen 1996. Inhibition
of testicular growth in rainbow trout (Oncorhynchus mykiss) exposed to
estrogenic alkylphenolic chemicals. Environ Toxicol Chem, 15, 194-202.
Johns, D. G. 1967. Human liver aldehyde oxidase: differential inhibition of oxidation
of charged and uncharged substrates. J Clin Invest, 46, 1492-505.
Johnson, C.,C. Stubley-Beedham & J. G. Stell 1984. Elevation of molybdenum
hydroxylase levels in rabbit liver after ingestion of phthalazine or its
hydroxylated metabolite. Biochem Pharmacol, 33, 3699-705.
Johnson, M.,D. Hebbert & M. Moran 1993. Genetic analysis of populations of north-
western Australian fish species. Mar Freshwater Res, 44, 673-685.
Jordan, C. G.,M. R. Rashidi,H. Laljee,S. E. Clarke,J. E. Brown & C. Beedham 1999.
Aldehyde oxidase-catalysed oxidation of methotrexate in the liver of guinea-
pig, rabbit and man. J Pharm Pharmacol, 51, 411-8.
Jung, D. K.,T. Klaus & K. Fent 2001. Cytochrome P450 induction by nitrated
polycyclic aromatic hydrocarbons, azaarenes, and binary mixtures in fish
hepatoma cell line PLHC-1. Environ Toxicol Chem, 20, 149-59.
Kamiński, Z. W. & M. M. Jeżewska 1985. Xanthine:NAD+ oxidoreductase in the
liver of the teleostean fish Cyprinus carpio. Comp Biochem Phys B, 80, 371-
375.
Kane, C. D.,O. L. Francone & K. A. Stevens 2006. Differential regulation of the
cynomolgus, human, and rat acyl-CoA oxidase promoters by PPARalpha.
Gene, 380, 84-94.

220
Katsura, H.,S. Kitamura & K. Tatsumi 1993. Purification and characterization of
salicylhydroxamic acid reductase from rat liver. Arch Biochem Biophys, 302,
356-61.
Kawashima, K.,K. Hosoi,T. Naruke,T. Shiba,M. Kitamura & T. Watabe 1999.
Aldehyde oxidase-dependent marked species difference in hepatic metabolism
of the sedative-hypnotic, Zaleplon, between monkeys and rats. Drug Metab
Dispos, 27, 422-428.
Kelley, E. E.,N. K. Khoo,N. J. Hundley,U. Z. Malik,B. A. Freeman & M. M. Tarpey
2010. Hydrogen peroxide is the major oxidant product of xanthine oxidase.
Free Radical Biology and Medicine, 48, 493-498.
Kikuchi, H.,H. Fujisaki,T. Furuta,K. Okamoto,S. Leimkuhler & T. Nishino 2012.
Different inhibitory potency of febuxostat towards mammalian and bacterial
xanthine oxidoreductases: insight from molecular dynamics. Sci Rep, 2, 331.
Kisker, C. 1997. Molecular basis of sulfite oxidase deficiency from the structure of
sulfite oxidase. Cell, 91, 973-983.
Kitamura, S.,K. Nakatani,K. Sugihara & S. Ohta 1999. Strain differences of the ability
to hydroxylate methotrexate in rats. Comp Biochem Physiol C Pharmacol
Toxicol Endocrinol, 122, 331-6.
Kitamura, S.,K. Nitta,Y. Tayama,C. Tanoue,K. Sugihara,T. Inoue,T. Horie & S. Ohta
2008. Aldehyde oxidase-catalyzed metabolism of N1-methylnicotinamide in
vivo and in vitro in chimeric mice with humanized liver. Drug Metab Dispos,
36, 1202-5.
Kitamura, S.,K. N. K. Ohashi,K. Sugihara,R. Hosokawa,Y. Akagawa & S. Ohta 2001.
Extremely high drug-reductase activity based on aldehyde oxidase in monkey
liver. Biol Pharm Bull, 24, 856-9.
Kitamura, S.,K. Sugihara & S. Ohta 2006. Drug-metabolizing ability of molybdenum
hydroxylases. Drug Metab Pharmacokinet, 21, 83-98.
Kitamura, S.,T. Suzuki,T. Kadota,M. Yoshida,K. Ohashi & S. Ohta 2003. In vitro
metabolism of fenthion and fenthion sulfoxide by liver preparations of sea
bream, goldfish, and rats. Drug Metab Dispos, 31, 179-86.
Kitamura, S. & K. Tatsumi 1983. Azoreductase activity of liver aldehyde oxidase.
Chem Pharm Bull (Tokyo), 31, 3334-7.
Kitamura, S. & K. Tatsumi 1984. Involvement of liver aldehyde oxidase in the
reduction of nicotinamide N-oxide. Biochem Biophys Res Commun, 120, 602-
6.
Klecker, R. W.,R. L. Cysyk & J. M. Collins 2006. Zebularine metabolism by aldehyde
oxidase in hepatic cytosol from humans, monkeys, dogs, rats, and mice:
influence of sex and inhibitors. Bioorg Med Chem, 14, 62-6.
221
Kraemer, H. J.,U. Feltkamp & H. Breithaupt 1998. Quantification of pyrazinamide
and its metabolites in plasma by ionic-pair high-performance liquid
chromatography. Implications for the separation mechanism. J Chromatogr B
Biomed Sci Appl, 706, 319-28.
Krenitsky, T. A.,S. M. Neil,G. B. Elion & G. H. Hitchings 1972. A comparison of the
specificities of xanthine oxidase and aldehyde oxidase. Arch Biochem Biophys,
150, 585-99.
Krenitsky, T. A.,T. Spector & W. W. Hall 1986. Xanthine oxidase from human liver:
purification and characterization. Arch Biochem Biophys, 247, 108-19.
Krenitsky, T. A.,J. V. Tuttle,E. L. Cattau, Jr. & H. D. Wang 1974. A comparison of
the distribution and electron acceptor specificities of xanthine oxidase and
aldehyde oxidase. Comp Biochem Physiol B, 49, 687-703.
Kundu, T. K.,R. Hille,M. Velaytham & J. L. Zweier 2007. Characterization of
superoxide production from aldehyde oxidase: an important source of oxidants
in biological tissues. Arch Biochem Biophys, 460, 113-21.
Kuroisaki, M.,M. Terao,L. Calzi,S. Zanotta & E. Garattini 1996. Expression of
xanthine oxidoreductase in mouse mammary epithelium during pregnancy and
lactation: regulation of gene expression by glucocorticoids and prolactin.
Biochem J, 319, 801-10.
Kurosaki, M.,M. Bolis,M. Fratelli,M. M. Barzago,L. Pattini,G. Perretta,M. Terao & E.
Garattini 2013. Structure and evolution of vertebrate aldehyde oxidases: from
gene duplication to gene suppression. Cell Mol Life Sci, 70, 1807-30.
Kurosaki, M.,S. Demontis,M. M. Barzago,E. Garattini & M. Terao 1999. Molecular
cloning of the cDNA coding for mouse aldehyde oxidase: tissue distribution
and regulation in vivo by testosterone. Biochem J, 341 71-80.
Kurosaki, M.,M. Li Calzi,E. Scanziani,E. Garattini & M. Terao 1995. Tissue- and
cell-specific expression of mouse xanthine oxidoreductase gene in vivo:
regulation by bacterial lipopolysaccharide. Biochem J, 306 225-34.
Kurosaki, M.,M. Terao,M. M. Barzago,A. Bastone,D. Bernardinello,M. Salmona & E.
Garattini 2004. The aldehyde oxidase gene cluster in mice and rats. Aldehyde
oxidase homologue 3, a novel member of the molybdo-flavoenzyme family
with selective expression in the olfactory mucosa. J Biol Chem, 279, 50482-
98.
Kurth, J. & A. Kubiciel 1984. Method for the photometric determination of aldehyde
oxidase activity. Biomed Biochim Acta, 43, 1223-6.
Kurzawski, M.,K. Dziewanowski,K. Safranow & M. Drozdzik 2012. Polymorphism
of genes involved in purine metabolism (XDH, AOX1, MOCOS) in kidney
transplant recipients receiving azathioprine. Ther Drug Monit, 34, 266-74.
Laemmli, U. K. 1970. Cleavage of structural proteins during the assembly of the head
of bacteriophage T4. Nature, 227, 680-5.

222
Lake, B.,S. Ball,J. Kao,A. Renwick,R. Price & J. Scatina 2002. Metabolism of
zaleplon by human liver: evidence for involvement of aldehyde oxidase.
Xenobiotica, 32, 835-847.
Lakshmanan, M. R.,C. S. Vaidyanathan & H. R. Cama 1964. Oxidation of vitamin A1
aldehyde and vitamin A2 aldehyde to the corresponding acids by aldehyde
oxidase from different species. Biochem J, 90, 569-73.
LaVoie, E. J.,A. Shigematsu & D. Hoffmann 1985. Metabolites of phenanthridine
formed by rat liver homogenate. Drug Metab Dispos, 13, 71-5.
Lee, R. D.,C. F. Thomas,R. G. Marietta & W. S. Stark 1996. Vitamin A, visual
pigments, and visual receptors in Drosophila. Microsc Res Tech, 35, 418-430.
Lenfant, P. 2003. Demographic and genetic structures of white sea bream populations
(Diplodus sargus, Linnaeus, 1758) inside and outside a Mediterranean marine
reserve. C R Bio, 326, 751-760.
Leoni, C.,F. M. Buratti & E. Testai 2008. The participation of human hepatic P450
isoforms, flavin-containing monooxygenases and aldehyde oxidase in the
biotransformation of the insecticide fenthion. Toxicol Appl Pharmacol, 233,
343-52.
Lindsley, D. & G. Zimm 1992 The genome of Drosophila melanogaster. , Academic
Press, New York.
Liu, P.,S. Liang,B. J. Wang & R. C. Guo 2009. Construction of expression system of
rabbit aldehyde oxidase cDNA for the clarification of species differences. Eur
J Drug Metab Pharmacokinet, 34, 205-11.
MacGibbon, A. K.,R. L. Motion,K. E. Crow,P. D. Buckley & L. F. Blackwell 1979.
Purification and properties of sheep-liver aldehyde dehydrogenases. Eur J
Biochem, 96, 585-95.
Mahro, M.,N. F. Brás,N. M. Cerqueira,C. Teutloff,C. Coelho,M. J. Romão & S.
Leimkühler 2013. Identification of Crucial Amino Acids in Mouse Aldehyde
Oxidase 3 That Determine Substrate Specificity. PloS one, 8, e82285.
Mahro, M.,C. Coelho,J. Trincao,D. Rodrigues,M. Terao,E. Garattini,M. Saggu,F.
Lendzian,P. Hildebrandt,M. J. Romao & S. Leimkuhler 2011. Characterization
and crystallization of mouse aldehyde oxidase 3: from mouse liver to
Escherichia coli heterologous protein expression. Drug Metab Dispos, 39,
1939-45.
Maia, L. & L. Mira 2002. Xanthine oxidase and aldehyde oxidase: a simple procedure
for the simultaneous purification from rat liver. Arch Biochem Biophys, 400,
48-53.
Marshall, J. J. 1970. Comments on the use of Blue Dextran in gel chromatography. J
Chrom A, 53, 379-380.
223
McCormack, J.,B. Allen & C. Hodnett 1978. Oxidation of quinazoline and
quinoxaline by xanthine-oxidase and aldehyde oxidase. J Heterocyclic Chem,
15, 1249-1254.
McManaman, J. L.,M. C. Neville & R. M. Wright 1999. Mouse mammary gland
xanthine oxidoreductase: purification, characterization, and regulation. Arch
Biochem Biophys, 371, 308-16.
McManaman, J. L.,C. A. Palmer,R. M. Wright & M. C. Neville 2002 Functional
regulation of xanthine oxidoreductase expression and localization in the mouse
mammary gland: evidence of a role in lipid secretion. J Physiol. , 1;545, 567-
79.
McManaman, J. L.,V. Shellman,R. M. Wright & J. E. Repine 1996. Purification of rat
liver xanthine oxidase and xanthine dehydrogenase by affinity chromatography
on benzamidine-sepharose. Arch Biochem Biophys, 332, 135-41.
McMurtrey, K. D. & T. J. Knight 1984. Metabolism of acridine by rat-liver enzymes.
Mutat Res, 140, 7-11.
Mehmedagic, A.,P. Verite,S. Menager,C. Tharasse,C. Chabenat,D. Andre & O. Lafont
1997. Determination of pyrazinamide and its main metabolites in rat urine by
high-performance liquid chromatography. J Chromatogr B Biomed Sci Appl,
695, 365-72.
Mehmedagic, A.,P. Verite,S. Menager,C. Tharasse,C. Chabenat,D. Andre & O. Lafont
2002. Investigation of the effects of concomitant caffeine administration on the
metabolic disposition of pyrazinamide in rats. Biopharm Drug Dispos, 23,
191-5.
Meister, A. 1990. On the transamination of enzymes. Ann N Y Acad Sci, 585, 13-31.
Mendel, R. R. 2013. The molybdenum cofactor. J Biol Chem, 288, 13165-72.
Mendel, R. R. & F. Bittner 2006a. Cell biology of molybdenum. Biochimica. Et.
Biophysica. Acta, 1763, 621-635.
Mendel, R. R. & F. Bittner 2006b. Cell biology of molybdenum. . Biochimica. Et.
Biophysica. Acta, 1763, 621-635.
Miller, J. & J. C. Miller 2005. Statistics and Chemometrics for Analytical Chemistry,
Person education limited; Fifth edition.
Minoshima, S.,Y. Wang,K. Ichida,T. Nishino & N. Shimizu 1995. Mapping of the
gene for human xanthine dehydrogenase (oxidase) (XDH) to band p23 of
chromosome 2. Cytogenet Cell Genet, 68, 52-3.
Miyajima, M.,I. Sagami,S. Daff,C. T. Migita & T. Shimizu 2000. Azo reduction of
methyl red by neuronal nitric oxide synthase: The important role of FMN in
catalysis. Biochem Biophysi R Com, 275, 752-758.

224
Mooney, S.,J. E. Leuendorf,C. Hendrickson & H. Hellmann 2009. Vitamin B6: a long
known compound of surprising complexity. Molecules, 14, 329-51.
Moriwaki, Y.,T. Yamamoto,Y. Nasako,S. Takahashi,M. Suda,K. Hiroishi,T. Hada &
K. Higashino 1993. In vitro oxidation of pyrazinamide and allopurinol by rat
liver aldehyde oxidase. Biochem Pharmacol, 46, 975-981.
Moriwaki, Y.,T. Yamamoto,S. Takahashi,Z. Tsutsumi & T. Hada 2001. Widespread
cellular distribution of aldehyde oxidase in human tissues found by
immunohistochemistry staining. Histol Histopathol, 16, 745-53.
Moriwaki, Y.,T. Yamamoto,K. Yamaguchi,S. Takahashi & K. Higashino 1996.
Immunohistochemical localization of aldehyde and xanthine oxidase in rat
tissues using polyclonal antibodies. Histochem Cell Biol, 105, 71-9.
Moriwaki, Y.,T. Yamamoto,J. Yamakita,S. Takahashi & K. Higashino 1998.
Comparative localization of aldehyde oxidase and xanthine oxidoreductase
activity in rat tissues. Histochem J, 30, 69-74.
Moura, J. J.,A. V. Xavier,M. Bruschi,J. Le Gall,D. O. Hall & R. Cammack 1976. A
molybdenum-containing iron-sulphur protein from Desulphovibrio gigas.
Biochem Biophys Res Commun, 72, 782-9.
Mu, P.,M. Zheng,M. Xu,Y. Zheng,X. Tang,Y. Wang,K. Wu,Q. Chen,L. Wang & Y.
Deng 2014. N-oxide reduction of quinoxaline-1,4-dioxides catalyzed by
porcine aldehyde oxidase SsAOX1. Drug Metab Dispos, 42, 511-9.
Murashige, K.,D. McDaniel & S. Chaykin 1966. N1- methylnicotinamide oxidation in
hog liver. Biochimica et Biophysica Acta (BBA)-Enzymology and Biological
Oxidation, 118, 556-565.
Nakano, E. & A. H. Whiteley 1965. Differentiation of multiple molecular forms of
four dehydrogenases in the teleost, Oryzias latipes, studied by disc
electrophoresis. J Exp Zool, 159, 167-79.
Nirogi, R.,V. Kandikere,R. C. Palacharla,G. Bhyrapuneni,V. B. Kanamarlapudi,R. K.
Ponnamaneni & A. K. Manoharan 2013. Identification of a suitable and
selective inhibitor towards aldehyde oxidase catalyzed reactions. Xenobiotica,
1-8.
Nishinaka, Y.,H. Masutani,H. Nakamura & J. Yodoi 2001. Regulatory roles of
thioredoxin in oxidative stress-induced cellular responses. Redox Rep, 6, 289-
95.
Nishino, T. 1994. The conversion of xanthine dehydrogenase to xanthine oxidase and
the role of the enzyme in reperfusion injury. J Biochem, 116, 1-6.
Nishino, T.,Y. Amaya,S. Kawamoto,Y. Kashima & K. Okamoto 2002. Purification
and characterization of multiple forms of rat liver xanthine oxidoreductase
expressed in baculovirus-insect cell system. J Biochem, 132, 597-606.

225
Nishino, T. & T. Nishino 1989. The nicotinamide adenine dinucleotidebinding site of
chicken liver xanthine dehydrogenase: evidence for alteration of the redox
potential of the flavin by NAD-binding or modification of the NAD-binding
site and isolation of a modified peptide. J. Biol. Chem. , 264, 5458-5473.
Nishino, T. & T. Nishino 1997. The conversion from the dehydrogenase type to the
oxidase type of rat liver xanthine dehydrogenase by modification of cysteine
residues with fluorodinitrobenzene. J Biol Chem, 272, 29859-64.
Nishino, T. & K. Okamoto 2000. The role of the [2Fe-2s] cluster centers in xanthine
oxidoreductase. J Inorg Biochem, 82, 43-9.
Nishino, T.,K. Okamoto,B. T. Eger,E. F. Pai & T. Nishino 2008. Mammalian xanthine
oxidoreductase - mechanism of transition from xanthine dehydrogenase to
xanthine oxidase. FEBS J, 275, 3278-89.
Nishino, T.,L. M. Schopfer & V. Massey 1989. Reactivity of chicken liver xanthine
dehydrogenase containing modified flavins. J Biol Chem, 264, 6075-85.
Obach, R. S. 2004. Potent inhibition of human liver aldehyde oxidase by raloxifene.
Drug Metab Dispos, 32, 89-97.
Obach, R. S.,P. Huynh,M. C. Allen & C. Beedham 2004. Human liver aldehyde
oxidase: inhibition by 239 drugs. J Clin Pharmacol, 44, 7-19.
Ohkubo, M. & S. Fujimura 1978. Loss of activity of an N1-methyl-4-pyridone-5-
carboxamide-forming N1-methylnicotinamide oxidase in livers of rats fed 2-
acetylaminofluorene. Cancer Res, 38, 697-702.
Okamoto, K.,B. T. Eger,T. Nishino,S. Kondo,E. F. Pai & T. Nishino 2003. An
extremely potent inhibitor of xanthine oxidoreductase. Crystal structure of the
enzyme-inhibitor complex and mechanism of inhibition. J Biol Chem, 278,
1848-55.
Okamoto, K.,B. T. Eger,T. Nishino,E. F. Pai & T. Nishino 2008. Mechanism of
inhibition of xanthine oxidoreductase by allopurinol: crystal structure of
reduced bovine milk xanthine oxidoreductase bound with oxipurinol.
Nucleosides Nucleotides Nucleic Acids, 27, 888-93.
Okamoto, K.,T. Kusano & T. Nishino 2013. Chemical nature and reaction
mechanisms of the molybdenum cofactor of xanthine oxidoreductase. Curr
Pharm Des, 19, 2606-14.
Okamoto, K.,K. Matsumoto,R. Hille,B. T. Eger,E. F. Pai & T. Nishino 2004. The
crystal structure of xanthine oxidoreductase during catalysis: implications for
reaction mechanism and enzyme inhibition. Proc Natl Acad Sci U S A, 101,
7931-6.
Osborne, P. J.,M. R. Preston & H.-y. Chen 1997. Azaarenes in sediments, suspended
particles and aerosol associated with the River Mersey estuary. Mar Chem, 58,
73-83.
226
Pacher, P.,A. Nivorozhkin & C. Szabo 2006. Therapeutic effects of xanthine oxidase
inhibitors: renaissance half a century after the discovery of allopurinol.
Pharmacol Rev, 58, 87-114.
Palmer, K. H.,B. Martin,B. Baggett & M. E. Wall 1969. The metabolic fate of orally
administered quinidine gluconate in humans. Biochem Pharmacol, 18, 8145-
60.
Pan, S. S.,P. A. Andrews,C. J. Glover & N. R. Bachur 1984. Reductive activation of
mitomycin C and mitomycin C metabolites catalyzed by NADPH-cytochrome
P-450 reductase and xanthine oxidase. J Biol Chem, 259, 959-66.
Pandey, S.,S. Parvez,I. Sayeed,R. Haque,B. Bin-Hafeez & S. Raisuddin 2003.
Biomarkers of oxidative stress: a comparative study of river Yamuna fish
Wallago attu (Bl. & Schn.). Sci Total Environ, 309, 105-15.
Panoutsopoulos, G. I. & C. Beedham 2004. Enzymatic oxidation of phthalazine with
guinea pig liver aldehyde oxidase and liver slices: inhibition by isovanillin.
Acta Biochim Pol, 51, 943-51.
Panoutsopoulos, G. I.,D. Kouretas,E. G. Gounaris & C. Beedham 2005. Enzymatic
oxidation of vanillin, isovanillin and protocatechuic aldehyde with freshly
prepared Guinea pig liver slices. Cell Physiol Biochem, 15, 89-98.
Pasalic, D.,N. Marinkovic & L. Feher-Turkovic 2012. Uric acid as one of the
important factors in multifactorial disorders - facts and controversies.
Biochemia Medica, 22, 63-75.
Pay, G. F.,R. B. Wallis & D. Zelaschi 1980. A metabolite of sulphinpyrazone that is
largely responsible for the effect of the drug on the platelet prostaglandin
pathway. Biochem Soc Trans, 8, 727-8.
Peddinghaus, S.,M. Brinkmann,K. Bluhm,A. Sagner,G. Hinger,T. Braunbeck,A.
Eisenträger,A. Tiehm,H. Hollert & S. H. Keiter 2012. Quantitative assessment
of the embryotoxic potential of NSO-heterocyclic compounds using zebrafish
(Danio rerio). Reproductive Toxicology, 33, 224-232.
Peixoto, F. P.,J. Carrola,A. M. Coimbra,C. Fernandes,P. Teixeira,L. Coelho,I.
Conceicao,M. M. Oliveira & A. Fontainhas-Fernandes 2013. Oxidative stress
responses and histological hepatic alterations in barbel, barbus bocagei, from
vizela river, portugal. Rev Inter de Contam Amb, 29, 29-38.
Peretz, H.,M. S. Naamati,D. Levartovsky,A. Lagziel,E. Shani,I. Horn,H. Shalev & D.
Landau 2007. Identification and characterization of the first mutation
(Arg776Cys) in the c-terminal domain of the human molybdenum cofactor
sulfurase (HMCS) associated with type II classical xanthinuria. Mol Genet
Metab, 91, 23-9.
Peretz, H.,D. G. Watson,G. Blackburn,T. Zhang,A. Lagziel,M. Shtauber-Naamati,T.
Morad,E. Keren-Tardai,V. Greenshpun,S. Usher,H. Shalev,D. Landau & D.
Levartovsky 2012. Urine metabolomics reveals novel physiologic functions of

227
human aldehyde oxidase and provides biomarkers for typing xanthinuria.
Metab, 8, 951-959.
Pirouzpanah, S.,M. R. Rashidi,A. Delazar,S. V. Razavieh & A. Hamidi 2006.
Inhibitory effects of Ruta graveolens L. extract on guinea pig liver aldehyde
oxidase. Chem Pharm Bull (Tokyo), 54, 9-13.
Pometto, A. L., 3rd & D. L. Crawford 1983. Whole-cell bioconversion of vanillin to
vanillic acid by Streptomyces viridosporus. Appl Environ Microbiol, 45, 1582-
5.
Porter, D. J. 1990. Xanthine oxidase-catalyzed reductive debromination of 6-
(bromomethyl)-9H-purine with concomitant covalent modification of the FAD
prosthetic group. J Biol Chem, 265, 13540-6.
Prichard, M.,N. G. Ducharme,P. A. Wilkins,H. N. Erb & M. Butt 1991. Xanthine
oxidase formation during experimental ischemia of the equine small intestine.
Can J Vet Res, 55, 310-4.
Pryde, D. C.,D. Dalvie,Q. Hu,P. Jones,R. S. Obach & T. D. Tran 2010. Aldehyde
oxidase: an enzyme of emerging importance in drug discovery. J Med Chem,
53, 8441-60.
Rajagopalan, K. & P. Handler 1964a. Hepatic aldehyde oxidase II. differential
inhibition of electron transfer to various electron acceptors. J of Biolo Chem,
239, 2022-2026.
Rajagopalan, K. & P. Handler 1964b. Hepatic aldehyde oxidase III. The substrate-
binding site. Journal of Biological Chemistry, 239, 2027-2035.
Rajagopalan, K. V.,I. Fridovich & P. Handler 1962. Hepatic aldehyde oxidase. I.
Purification and properties. J Biol Chem, 237, 922-8.
Rajagopalan, K. V. & P. Handler 1967. Purification and properties of chicken liver
xanthine dehydrogenase. J Biol Chem, 242, 4097-107.
Rajagopalan, K. V.,P. Handler,G. Palmer & H. Beinert 1968. Studies of aldehyde
oxidase by electron paramagnetic resonance spectroscopy. II. Kinetic studies
by rapid freezing. J Biol Chem, 243, 3797-806.
Räsänen, L. A.,U. Karvonen & A. R. Pösö 1993. Localization of xanthine
dehydrogenase mRNA in horse skeletal muscle by in situ hybridization with
digoxigenin-labelled probe. Biochem J. , 15;292 ( Pt 3), 639-41.
Rashidi, M. 1996. In vitro oxidation of purines by hepatic molybdenum hydroxylases.
PhD Thesis, University of Bradford.
Rashidi, M. R.,C. Beedham,S. Smith & S. Davaran 2007. In vitro Study of 6-
mercaptopurine Oxidation Catalysed by Aldehyde Oxidase and Xanthine
Oxidase. Drug Metab. Pharmacokinet. , 22 299–306.

228
Rashidi, M. R.,M. Dehghany,G. Dehghan,A. Jouyban & A. Faridi 2013. Aldehyde
oxidase activity and stability in water-miscible organic solvents. Appl Biochem
Biotechnol, 169, 901-10.
Rashidi, M. R.,J. A. Smith,S. E. Clarke & C. Beedham 1997. In vitro oxidation of
famciclovir and 6-deoxypenciclovir by aldehyde oxidase from human, guinea
pig, rabbit, and rat liver. Drug Metab Dispos, 25, 805-13.
Reinke, L. A.,M. Nakamura,L. Logan,H. D. Christensen & J. M. Carney 1987. In vivo
and in vitro 1-methylxanthine metabolism in the rat. Evidence that the
dehydrogenase form of xanthine oxidase predominates in intact perfused liver.
Drug Metab Dispos, 15, 295-9.
Reiter, S.,H. A. Simmonds,N. Zollner,S. L. Braun & M. Knedel 1990. Demonstration
of a combined deficiency of xanthine oxidase and aldehyde oxidase in
xanthinuric patients not forming oxipurinol. Clin Chim Acta, 187, 221-34.
Relling, M. V.,J. S. Lin,G. D. Ayers & W. E. Evans 1992. Racial and gender
differences in N-acetyltransferase, xanthine oxidase, and CYP1A2 activities.
Clin Pharmacol Ther, 52, 643-58.
Resende, A. D.,E. Rocha & A. Lobo-Da-Cunha 2005. Activity of purine catabolism
enzymes during the reproductive cycle of male and female brown trout (Salmo
trutta). Trends in Comparative Endocrinol and Neurobiol. New York: New
York Acad Sciences.
Robertson, I. G. & T. J. Bland 1993. Inhibition by SKF-525A of the aldehyde oxidase-
mediated metabolism of the experimental antitumour agent acridine
carboxamide. Biochem Pharmacol, 45, 2159-62.
Romao, M. J.,M. Archer,I. Moura,J. J. Moura,J. LeGall,R. Engh,M. Schneider,P. Hof
& R. Huber 1995. Crystal structure of the xanthine oxidase-related aldehyde
oxido-reductase from D. gigas. Science, 270, 1170-6.
Sahi, J.,K. K. Khan & C. B. Black 2008. Aldehyde oxidase activity and inhibition in
hepatocytes and cytosolic fractions from mouse, rat, monkey and human. Drug
Metab Lett, 2, 176-83.
Sasai, Y. & E. M. De Robertis 1997. Ectodermal patterning in vertebrate embryos.
Dev Biol, 182, 5-20.
Sastry, K. & D. Rao 1982. Chronic effects of mercuric chloride on the activities of
some enzymes in certain tissues of the fresh water murrel, (Channa punctatus).
Chemosph, 11, 1203-1209.
Sastry, K. & D. Rao 1984. Effect of mercuric chloride on some biochemical and
physiological parameters of the freshwater murrel, Channa punctatus. Environ
Res, 34, 343-350.
Schlenk, D. 1998. Occurrence of flavin-containing monooxygenases in non-
mammalian eukaryotic organisms. Comp Biochem Physiol C Pharmacol
Toxicol Endocrinol, 121, 185-95.

229
Schofield, P. C.,I. G. Robertson & J. W. Paxton 2000. Inter-species variation in the
metabolism and inhibition of N-[(2′-dimethylamino) ethyl] acridine-4-
carboxamide (DACA) by aldehyde oxidase. Biochemical pharmacology, 59,
161-165.
Schrader, T.,A. Rienhofer & J. R. Andreesen 1999. Selenium-containing xanthine
dehydrogenase from Eubacterium barkeri. Eur J Biochem, 264, 862-71.
Schultz, I. R.,G. Orner,J. L. Merdink & A. Skillman 2001. Dose-response
relationships and pharmacokinetics of vitellogenin in rainbow trout after
intravascular administration of 17alpha-ethynylestradiol. Aquat Toxicol, 51,
305-18.
Schultz, I. R.,A. Skillman,J. M. Nicolas,D. G. Cyr & J. J. Nagler 2003. Short term
exposure to 17α ethynylestradiol decreases the fertility of sexually maturing
male rainbow trout (Oncorhynchus mykiss). Environ Toxicol Chem, 22, 1272-
1280.
Schumann, S.,M. Terao,E. Garattini,M. Saggu,F. Lendzian,P. Hildebrandt & S.
Leimkuhler 2009. Site directed mutagenesis of amino acid residues at the
active site of mouse aldehyde oxidase AOX1. PLoS One, 4, e5348.
Schwartz, R. & N. O. Kjeldgaard 1951. The enzymic oxidation of pyridoxal by liver
aldehyde oxidase. Biochem J, 48, 333-7.
Seeley, T. L.,P. B. Mather & R. S. Holmes 1984. Electrophoretic analyses of alcohol
dehydrogenase, aldehyde dehydrogenase, aldehyde reductase, aldehyde
oxidase and xanthine oxidase from horse tissues. Comp Biochem Physiol B,
78, 131-9.
Seki, T.,K. Isono,K. Ozaki,Y. Tsukahara,Y. Shibata‐Katsuta,M. Ito,T. Irie & M.
Katagiri 1998. Priority Paper The metabolic pathway of visual pigment
chromophore formation in Drosophila melanogaster. Europ J Biochem, 257,
522-527.
Shibata, K.,T. Kawada & K. Iwai 1988. Simultaneous micro-determination of
nicotinamide and its major metabolites, N1-methyl-2-pyridone-5-carboxamide
and N1-methyl-4-pyridone-3-carboxamide, by high-performance liquid
chromatography. J Chromatogr, 424, 23-8.
Shibutani, Y.,T. Ueo,T. Yamamoto,S. Takahashi,Y. Moriwaki & K. Higashino 1999.
A case of classical xanthinuria (type 1) with diabetes mellitus and Hashimoto's
thyroiditis. Clin Chim Acta, 285, 183-9.
Shimada, S.,H. K. Mishima,H. Nikaido,S. Kitamura & K. Tatsumi 1989. Purification
of aldehyde oxidase from bovine ciliary body. Curr Eye Res, 8, 721-6.
Singh, R. K.,K. K. Lal,V. Mohindra,P. Punia,R. S. Sah,A. K. Mishra,R. Kumar,B.
Mishra & W. Lakra 2010. Assessing genetic differentiation in geographic
populations of Labeo calbasu using allozyme markers. Biochem genet, 48,
760-778.

230
Slef, W. T. & T. C. Stadtman 2000. Selenium-dependent metabolism of purines: A
selenium-dependent purine hydroxylase and xanthine dehydrogenase were
purified from Clostridium purinolyticum and characterized. PNAS 97, 7208-
7213.
Smith, P. & A. Jamieson 1978. Enzyme polymorphisms in the atlantic mackerel
Scomber scombrus. Comp Biochem & Physiol Part B: Comp Bio chem, 60,
487-489.
Smith, P. K.,R. I. Krohn,G. T. Hermanson,A. K. Mallia,F. H. Gartner,M. D.
Provenzano,E. K. Fujimoto,N. M. Goeke,B. J. Olson & D. C. Klenk 1985.
Measurement of protein using bicinchoninic acid. Anal Biochem, 150, 76-85.
Snell, E. E. 1990. Vitamin B6 and decarboxylation of histidine. Ann N Y Acad Sci,
585, 1-12.
Sorouraddin, M.-H.,E. Fooladi,A. Naseri & M.-R. Rashidi 2008. A novel
spectrophotometric method for determination of kinetic constants of aldehyde
oxidase using multivariate calibration method. J Biochem Biophys Methds, 70,
999-1005.
Sorouraddin, M.-H.,M.-Y. Khani,K. Amini,A. Naseri,D. Asgari & M.-R. Rashidi
2011. Simultaneous determination of 6-mercaptopurine and its oxidative
metabolites in synthetic solutions and human plasma using spectrophotometric
multivariate calibration methods. BioImpacts : BI, 1, 53-62.
Sorouraddin, M. H.,E. Fooladi,A. Naseri & M. R. Rashidi 2009. Development of a
sensitive spectrofluorometric-multivariate calibration method for enzyme
kinetic of aldehyde oxidase. Iran J Pharm Res, 8, 169-177.
Southworth, G.,B. Parkhurst & J. Beauchamp 1979. Accumulation of acridine from
water, food, and sediment by the fathead minnow, Pimephales promelas.
Water, Air, and Soil Pollution, 12, 331-341.
Sovadinova, I.,L. Blaha,J. Janosek,K. Hilscherova,J. P. Giesy,P. D. Jones & I.
Holoubek 2006. Cytotoxicity and aryl hydrocarbon receptor-mediated activity
of n-heterocyclic polycyclic aromatic hydrocarbons: structure-activity
relationships. Environ Toxicol Chem, 25, 1291-7.
Spinneker, A.,R. Sola,V. Lemmen,M. Castillo,K. Pietrzik & M. Gonzalez-Gross 2007.
Vitamin B 6 status, deficiency and its consequences-an overview. Nutrición
Hospitalaria, 22, 0212-1611.
Stagg, R. M.,J. Rusin,M. E. McPhail,A. D. McIntosh,C. F. Moffat & J. A. Craft 2000.
Effects of polycyclic aromatic hydrocarbons on expression of CYP1A in
salmon (Salmo salar) following experimental exposure and after the Braer oil
spill. Environ Toxicol Chem, 19, 2797-2805.
Stanulovic, M. & S. Chaykin 1971. Aldehyde oxidase: catalysis of the oxidation of N
1 -methylnicotinamide and pyridoxal. Arch Biochem Biophys, 145, 27-34.

231
Stell, J. G.,A. J. Warne & C. Lee-Woolley 1989. Purification of rabbit liver aldehyde
oxidase by affinity chromatography on benzamidine sepharose 6B. J
Chromatogr, 475, 363-72.
Stirpe, F. & E. Della Corte 1969. The regulation of rat liver xanthine oxidase.
Conversion in vitro of the enzyme activity from dehydrogenase (type D) to
oxidase (type O). J Biol Chem, 244, 3855-63.
Stoddart, A. M. & W. G. Levine 1992. Azoreductase activity by purified rabbit liver
aldehyde oxidase. Biochem Pharmacol, 43, 2227-35.
Streetman, D. S.,J. S. Bertino, Jr. & A. N. Nafziger 2000. Phenotyping of drug-
metabolizing enzymes in adults: a review of in-vivo cytochrome P450
phenotyping probes. Pharmacogen, 10, 187-216.
Stubley, C. & J. Stell 1980. Investigation of the substrate‐binding site of aldehyde
oxidase. J Pharm Pharmacol, 32, 51P-51P.
Stubley, C.,J. G. Stell & D. W. Mathieson 1979. The oxidation of azaheterocycles
with mammalian liver aldehyde oxidase. Xenobiotica, 9, 475-84.
Sugihara, K.,Y. Katsuma,S. Kitamura,S. Ohta,M. Fujitani & H. Shintani 2000.
Cynomolgus monkey liver aldehyde oxidase: extremely high oxidase activity
and an attempt at purification. Comp Biochem Phys C, 126, 53-60.
Sugihara, K.,Y. Katsuma,C. Tanaka & S. Kitamura 1999. Purification and some
properties of hamster liver aldehyde oxidase. Biol Pharm Bull, 22, 1246-8.
Sugihara, K.,S. Kitamura & K. Tatsumi 1996. S-(-)-nicotine-1'-N-oxide reductase
activity of rat liver aldehyde oxidase. Biochem Mol Biol Int, 40, 535-41.
Sugihara, K.,S. Kitamura,K. Tatsumi,T. Asahara & K. Dohi 1997. Differences in
aldehyde oxidase activity in cytosolic preparations of human and monkey
liver. Biochem Mol Biol Int, 41, 1153-60.
Sugihara, K.,S. Kitamura,T. Yamada,S. Ohta,K. Yamashita,M. Yasuda & Y. Fujii-
Kuriyama 2001. Aryl Hydrocarbon Receptor (AhR)-Mediated Induction of
Xanthine Oxidase/Xanthine Dehydrogenase Activity by 2, 3, 7, 8-
Tetrachlorodibenzo-p-dioxin. Biochem Biophys Res communications, 281,
1093-1099.
Sugihara, K. & K. Tatsumi 1986. Participation of liver aldehyde oxidase in reductive
metabolism of hydroxamic acids to amides. Arch Biochem Biophys, 247, 289-
93.
Sugihara, K.,Y. Tayama,K. Shimomiya,D. Yoshimoto,S. Ohta & S. Kitamura 2006.
Estimation of aldehyde oxidase activity in vivo from conversion ratio of N1-
methylnicotinamide to pyridones, and intraspecies variation of the enzyme
activity in rats. Drug Metab Dispos, 34, 208-12.
Szafarz, M.,M. Lomnicka,M. Sternak,S. Chlopicki & J. Szymura-Oleksiak 2010.
Simultaneous determination of nicotinic acid and its four metabolites in rat
232
plasma using high performance liquid chromatography with tandem mass
spectrometric detection (LC/MS/MS). J Chromatogr B Analyt Technol Biomed
Life Sci., 878, 895-902.
Talwar, D.,T. Quasim,D. C. McMillan,J. Kinsella,C. Williamson & D. S. J. O’Reilly
2003. Optimisation and validation of a sensitive high-performance liquid
chromatography assay for routine measurement of pyridoxal 5-phosphate in
human plasma and red cells using pre-column semicarbazide derivatisation. J
Chromatogr B, 792, 333-343.
Tatsumi, K. & M. Ishigai 1987. Oxime-metabolizing activity of liver aldehyde
oxidase. Arch Biochem Biophys, 253, 413-8.
Tatsumi, K.,S. Kitamura,M. Kato & K. Hiraoka 1992. Metabolism of sodium
nifurstyrenate, a veterinary antimicrobial nitrofuran, in animals and fish. Drug
Metab Dispos, 20, 226-33.
Tatsumi, K.,S. Kitamura & N. Narai 1986. Reductive metabolism of aromatic nitro
compounds including carcinogens by rabbit liver preparations. Cancer Res, 46,
1089-93.
Tatsumi, K.,H. Yamada & S. Kitamura 1983. Evidence for involvement of liver
aldehyde oxidase in reduction of nitrosamines to the corresponding hydrazine.
Chem Pharm Bull (Tokyo), 31, 764-7.
Tawa, M.,K. Yamamizu,A. Geddawy,T. Shimosato,T. Imamura,K. Ayajiki & T.
Okamura 2011. Impairment by hypoxia or hypoxia/reoxygenation of nitric
oxide-mediated relaxation in isolated monkey coronary artery: the role of
intracellular superoxide. J Pharmacol Sci, 116, 188-96.
Tayama, Y.,K. Miyake,K. Sugihara,S. Kitamura,M. Kobayashi,S. Morita,S. Ohta &
K. Kihira 2007. Developmental changes of aldehyde oxidase activity in young
Japanese children. Clin Pharmacol Ther, 81, 567-72.
Temple, N. J.,P. Martin & M. Connock 1979. Intestinal peroxisomes of goldfish
(Carassius auratus) examination for hydrolase, dehydrogenase and carnitine
acetyltransferase activities. Comp Biochem & Physiol Part B: Comp Biochem,
64, 57-63.
Terao, M.,G. Cazzaniga,P. Ghezzi,M. Bianchi,F. Falciani,P. Perani & E. Garattini
1992. Molecular cloning of a cDNA coding for mouse liver xanthine
dehydrogenase. Regulation of its transcript by interferons in vivo. Biochem J,
283 ( Pt 3), 863-70.
Terao, M.,M. Kurosaki,M. M. Barzago,M. Fratelli,R. Bagnati,A. Bastone,C.
Giudice,E. Scanziani,A. Mancuso,C. Tiveron & E. Garattini 2009. Role of the
molybdoflavoenzyme aldehyde oxidase homolog 2 in the biosynthesis of
retinoic acid: generation and characterization of a knockout mouse. Mol Cell
Biol, 29, 357-77.
Terao, M.,M. Kurosaki,M. M. Barzago,E. Varasano,A. Boldetti,A. Bastone,M. Fratelli
& E. Garattini 2006. Avian and canine aldehyde oxidases. Novel insights into
233
the biology and evolution of molybdo-flavoenzymes. J Biol Chem, 281,
19748-61.
Terao, M.,M. Kurosaki,S. Demontis,S. Zanotta & E. Garattini 1998. Isolation and
characterization of the human aldehyde oxidase gene: conservation of
intron/exon boundaries with the xanthine oxidoreductase gene indicates a
common origin. Biochem J, 332 383-93.
Terao, M.,M. Kurosaki,M. Marini,M. A. Vanoni,G. Saltini,V. Bonetto,A. Bastone,C.
Federico,S. Saccone,R. Fanelli,M. Salmona & E. Garattini 2001. Purification
of the aldehyde oxidase homolog 1 (AOH1) protein and cloning of the AOH1
and aldehyde oxidase homolog 2 (AOH2) genes. Identification of a novel
molybdo-flavoprotein gene cluster on mouse chromosome 1. J Biol Chem,
276, 46347-63.
Thomas, J. A.,B. Poland & R. Honzatko 1995. Protein sulfhydryls and their role in the
antioxidant function of protein S-thiolation. Archives of biochemistry and
biophysics, 319, 1-9.
Timbrell, J. 2009. Principles of Biochemical Toxicology, informa healthcare. New
York, US.
Tom, D. J.,L. E. Lee,J. Lew & N. C. Bols 2001. Induction of 7-ethoxyresorufin-O-
deethylase activity by planar chlorinated hydrocarbons and polycyclic
aromatic hydrocarbons in cell lines from the rainbow trout pituitary. Comp
Biochem Physiol A Mol Integr Physiol, 128, 185-98.
Tomita, S.,M. Tsujita & Y. Ichikawa 1993. Retinal oxidase is identical to aldehyde
oxidase. FEBS Lett, 336, 272-274.
Truglio, J. J.,K. Theis,S. Leimkuhler,R. Rappa,K. V. Rajagopalan & C. Kisker 2002.
Crystal structures of the active and alloxanthine-inhibited forms of xanthine
dehydrogenase from Rhodobacter capsulatus. Structure, 10, 115-25.
Tsujita, M.,S. Tomita,S. Miura & Y. Ichikawa 1994. Characteristic properties of
retinal oxidase (retinoic acid synthase) from rabbit hepatocytes. Biochim
Biophys Acta, 1204, 108-16.
Turner, N.,B. Barata,R. C. Bray,J. Deistung,J. Le Gall & J. J. Moura 1987. The
molybdenum iron-sulphur protein from Desulfovibrio gigas as a form of
aldehyde oxidase. Biochem J, 243, 755-61.
Turner, N.,W. A. Doyle,A. M. Ventom & R. C. Bray 1995. Properties of rabbit liver
aldehyde oxidase and the relationship of the enzyme to xanthine oxidase and
dehydrogenase. Eur J Biochem, 232, 646-57.
Ueda, O.,S. Kitamura,Y. Huruse,T. Saito,Y. Kanzaki,Y. Yano,K. Tatsumi & S. Ohta
2001. Metabolism of 2-nitrofluorene, an environmental pollutant, and 2-
acetylaminofluorene in fish. Bull Environ Contam Toxicol, 66, 371-8.
234
Ueda, O.,S. Kitamura & S. Ohta 2002. Metabolism of 2-nitrofluorene, an
environmental pollutant, by liver preparations of sea bream, Pagrus major.
Xenobiotica, 32, 667-682.
Van der Sluijs, I.,S. M. Gray,M. C. P. Amorim,I. Barber,U. Candolin,A. P. Hendry,R.
Krahe,M. E. Maan,A. C. Utne-Palm & H.-J. Wagner 2011. Communication in
troubled waters: responses of fish communication systems to changing
environments. Evol Ecol, 25, 623-640.
Van Rompay, K. K. 2012. The use of nonhuman primate models of HIV infection for
the evaluation of antiviral strategies. AIDS Res Hum Retroviruses, 28, 16-35.
Vila, R.,M. Kurosaki,M. M. Barzago,M. Kolek,A. Bastone,L. Colombo,M.
Salmona,M. Terao & E. Garattini 2004. Regulation and biochemistry of mouse
molybdo-flavoenzymes. The DBA/2 mouse is selectively deficient in the
expression of aldehyde oxidase homologues 1 and 2 and represents a unique
source for the purification and characterization of aldehyde oxidase. J Biol
Chem, 279, 8668-83.
Vulliet, E. & C. Cren-Olivé 2011. Screening of pharmaceuticals and hormones at the
regional scale, in surface and groundwaters intended to human consumption.
Environ Pollut, 159, 2929-2934.
Walton, B. T.,C.-H. Ho,C. Ma,E. O'Neill & G. Kao 1983. Benzoquinolinediones:
activity as insect teratogens. Science, 222, 422-423.
Waud, W. R. & K. V. Rajagopalan 1976. The mechanism of conversion of rat liver
xanthine dehydrogenase from an NAD+-dependent form (type D) to an O2-
dependent form (type O). Arch Biochem Biophys, 172, 365-79.
Whitaker, J. R. 1963. Determination of Molecular Weights of Proteins by Gel
Filtration of Sephadex. Anal Chem, 35, 1950-1953.
Wolf, K. & G. Rumsey 1985. The Representative Research Animal: Why Rainbow
Trout (Salmo gairdneri Rich.). J. Appli. Ichthyo, 1, 131-138.
Wollers, S. 2008. Binding of sulfurated molybdenum cofactor to the C-terminal
domain of ABA3 from Arabidopsis thaliana provides insight into the
mechanism of molybdenum cofactor sulfuration. J. Biol. Chem., 283, 9642-
9650.
Woolfolk, C. A. & J. S. Downard 1977. Distribution of xanthine oxidase and xanthine
dehydrogenase specificity types among bacteria. J Bacteriol, 130, 1175-91.
Wright, R.,D. A. Clayton,M. G. Riley,J. L. McManaman & J. E. Repine 1999. cDNA
cloning, sequencing, and characterization of male and female rat liver
aldehyde oxidase (rAOX1). Differences in redox status may distinguish male
and female forms of hepatic APX. J Biol Chem, 274, 3878-86.
Wurzinger, K. H. & R. Hartenstein 1974. Phylogeny and correlations of aldehyde
oxidase, xanthine oxidase, xanthine dehydrogenase and peroxidase in animal
tissues. Comp Biochem Physiol B, 49, 171-85.

235
Xia, M.,R. Dempski & R. Hille 1999. The reductive half-reaction of xanthine oxidase.
Reaction with aldehyde substrates and identification of the catalytically labile
oxygen. J Biol Chem, 274, 3323-30.
Xu, J. & R. C. Johnson 1995. aldB, an RpoS-dependent gene in Escherichia coli
encoding an aldehyde dehydrogenase that is repressed by Fis and activated by
Crp. J Bacteriol, 177, 3166-75.
Yamamoto, T.,K. Kario,M. Suda,Y. Moriwaki,S. Takahashi & K. Higashino 1991. A
case of xanthinuria: a study on the metabolism of pyrazinamide and
allopurinol. Jpn J Med, 30, 430-4.
Yamamoto, T.,Y. Moriwaki,S. Takahashi,T. Hada & K. Higashino 1987. In vitro
conversion of pyrazinamide into 5-hydroxypyrazinamide and that of
pyrazinoic acid into 5-hydroxypyrazinoic acid by xanthine oxidase from
human liver. Biochem Pharmacol, 36, 3317-8.
Yamamoto, T.,K. Schoonjans & J. Auwerx 2007. Sirtuin functions in health and
disease. Mol Endocrinol, 21, 1745-55.
Yan, L.,D. M. Otterness,T. L. Craddock & R. M. Weinshilboum 1997. Mouse liver
nicotinamide N-methyltransferase: cDNA cloning, expression, and nucleotide
sequence polymorphisms. Biochem Pharmacol, 54, 1139-49.
Yasuhara, A.,M. Akiba-Goto,K. Fujishiro,H. Uchida,T. Uwajima & K. Aisaka 2002.
Production of aldehyde oxidases by microorganisms and their enzymatic
properties. J Biosci Bioeng, 94, 124-9.
Yee, S. B. & C. A. Pritsos 1997. Comparison of oxygen radical generation from the
reductive activation of doxorubicin, streptonigrin, and menadione by xanthine
oxidase and xanthine dehydrogenase. Arch Biochem Biophys, 347, 235-41.
Yielding, K. L. & G. M. Tomkins 1961. An effect of L-leucine and other essential
amino acids on the structure and activity of glutamic dehydrogenase. Proc Natl
Acad Sci U S A, 47, 983-9.
Yoshihara, S. & K. Tatsumi 1985. Guinea pig liver aldehyde oxidase as a sulfoxide
reductase: its purification and characterization. Arch Biochem Biophys, 242,
213-24.
Yoshihara, S. & K. Tatsumi 1997. Purification and characterization of hepatic
aldehyde oxidase in male and female mice. Arch Biochem Biophys, 338, 29-
34.
Yoshimura, M. & T. Oka 1989. Isolation and structural analysis of the mouse beta-
casein gene. Gene, 78, 267-75.
Yu, C. L.,T. M. Louie,R. Summers,Y. Kale,S. Gopishetty & M. Subramanian 2009.
Two distinct pathways for metabolism of theophylline and caffeine are
coexpressed in Pseudomonas putida CBB5. J Bacteriol, 191, 4624-32.

236
Zakrzewska, B. & M. M. Jeźewska 1989. Comparison of xanthine: NAD+
oxidoreductase from liver of toad Bufo viridis and other vertebrates.
Comparative Biochemistry and Physiology Part B: Comparative Biochemistry,
94, 361-365.
Zhao, X. J. & T. Ishizaki 1997. The In vitro hepatic metabolism of quinine in mice,
rats and dogs: comparison with human liver microsomes. J Pharmacol Exp
Ther, 283, 1168-76.
Ziegler, I. 2003. The pteridine pathway in zebrafish: regulation and specification
during the determination of neural crest cell-fate. Pigment Cell Res, 16, 172-
82.

237
6.0. Appendices.
6.1. Appendix 1.
Table 1:Fish species order and family. Common name Scientific name Order Family Habitat
African Catfish Clarias Gariepinus Siluriformes Clariidae F/P
Blue Fish Pomatomus Saltatrix Perciformes Pomatomidae S/D
Bluegill Lepomis Macrochirus Perciformes Centrarchidae F/D
Brill Scophthalmus Rhombus Pleuronectiformes Scophthalmidae S/D
Black Sole Solea Solea Pleuronectiformes Soleidae S/D
Brown Trout Salmo Trutta Salmoniformes Salmonidae F/P
Carp Cyprium Carpio Cypriniformes Cyprinidae F/P
Cutlips Minnow Exoglossum Maxilingua Cypriniformes Cyprinidae F/P
Common Carp Cyprinus Carpio Communis Cypriniformes Cyprinidae F/D
Channel Catfish Icatalurus Punctatus Siluriformes Ictaluridae F/P
Cod Gadus Morhua Gadiformes Gadidae S/D
Dab Limanda Limanda Pleuronectiformes Pleuronectidae S/D
Electric Catfish Malapterurus Electricus Siluriformes Malapteruridae F/D
Fathead Minnow Pimephales Promelas Cypriniformes Cyprinidae F/P
Florida Pompano Trachinotus Carolinus Perciformes Carangidae S/P
Goldfish Carassius Auratus Cypriniformes Cyprinidae F/P
Great Snakehead Ophiocephalus Muralius Perciformes Channidae F/P
Gurnard Chelidonichthys Cuculus Scorpaeniformes Triglidae S/D
Herring Clupea Harengus Clupeiformes Clupeidae S/P
Haddock Melanogrammus Aeglefinus Gadiformes Gadidae S/D
John Dory Zeus Faber Zeiformes Zeidae S/P
Largemouth Bass Micropterus Salmoides Perciformes Centrarchidae F/P
Lesser Spotted Dogfish Scyliorhinus Canicula Carcharhiniformes Scyliorhinidae S/P
Lemon Sole Microstomus Kitt Pleuronectiformes Pleuronectidae S/D
Margined Madtom Noturus Insignis Siluriformes Ictaluridae F/P
Mozambique Tilapia Oreochromis Mossambicus Perciformes Cichlidae F/P
Mackerel Scomber Scombrus Perciformes Scombridoe S/P
Megrim Lepidorhombus Whiffagonis Pleuronectiformes Scophthalmidae S/D
Northern Hog Sucker Hypentelium Nigricans Cypriniformes Catostomidae F/D
Norfolk Spot Leiostomus Xanthurus Perciformes Sciaenidae S/P
Northern Pike Esox Lucius Esociformes Esocidae F/D
Nile Tilapia Juveniles Oreochromis Niloticus Perciformes Cichlidae F/P
Orange-Fin Labeo Labeo Calbasu Cypriniformes Cyprinidae F/P
Pumpkinseed Sunfish Lepomis Gibbosus Perciformes Centrarchidae F/P
Perch Perca Fluviatilis Perciformes Percidae F/D
Pike Esox Lucius Esociformes Esocidae S/D
Plaice Pleuronectes Platessa Pleuronectiformes Pleuronectidae S/D
Ray Dipturus Canutus Rajiformes Rajidae S/P
Rankin Cod Epinephelus Multinotatus Perciformes Serranidae S/D
Red Emperor Lutjanus Sebae Perciformes Lutjanidae S/D
Smooth Dogfish Mustelus Canis Carcharhiniformes Triakidae S/P
Spangled Emperor Lethrinus Nebulosus Perciformes Lethrinidae S/P
Stoneroller Minnow Campostoma Anomalous Cypriniformes Cyprinidae F/P
Spanish Mackerel Scomberonorus Maculatus Perciformes Scombridae S/D
Sea Mullet Menticirrhus Saxatilis Perciformes Sciaenidae S/D
Summer Flounder Paralichthyes Dentatus Pleuronectiformes Paralichthyidae S/D
White Sucker Catostamus Commersoni Cypriniformes Catostomidae F/D
Walleye Stizostedion Vitreum Perciformes Percidae F/P
Whiting Merlangius Merlangus Gadiformes Gadidae S/P
White Pollack Pollachius Virene Gadiformes Gadidae S/P&D
White Sole Solea Solea Pleuronectiformes Soleidae S/D
White Trout Salmo Trutta Salmoniformes Salmonidae S/D
Yellow Perch Perca Flavescens Perciformes Cichlidae F/P
Zebra Fish Danio Rerio Cypriniformes Cyprinids F/P
Abbreviations: F-freshwater fish, S- saltwater fish, P- pelagic, D-demersal.

238
6.2. Appendix 2.
Figure 1: Diagram showing pump flow rate (red line) and pump gradient (blue line) change
for allopurinol and oxipurinol.
Figure 2:Diagram showing pump flow rate (red line) and pump gradient (blue line) change
for purines, phthalazine and pyrazinamide.

239
Figure 3:Diagram showing pump flow rate (red line) and pump gradient (blue line)
change for N1-methylnicotinamide.
Figure 4:Diagram showing pump flow rate (red line) and pump gradient (blue line)
change for phenanthridine and 6(5H)-phenanthridone.
ml/min

240
6.3. Appendix 3.
Table 1:% RSD of retention time of three replicates was the same day of calibration standard
for intra- day precision.
The % RSD for retention time between injections is in the range of 0.09-3.31.
%RSD for retention time (n=3)
Analyte 0.01mM 0.02mM 0.03mM 0.05mM 0.1mM
Allopurinol 0.61 1.23 2.26 0.22 1.28
Cinchonine 1.66 1.68 0.15 2.11 0.74
Hypoxanthine 1.11 1.36 0.39 0.78 0.75
6-Mercaptopurine 2.51 0.68 0.39 1.11 0.17
Methotrexate 0.97 1.01 1.12 1.19 0.27
1-Methylxanthine 1.61 1.25 1.86 1.02 0.61
1-Methyluric acid 0.72 0.98 1.02 1.23 0.88
N1-methylnicotinamide 1.12 2.13 0.52 0.27 1.66
Oxipurinol 0.87 2.05 1.83 0.59 1.18
Phenanthridine 2.25 3.17 1.13 0.22 0.78
Phenanthridone 2.41 2.14 2.17 1.21 0.26
Phthalazine 0.87 2.21 3.21 1.34 1.19
1-Pthalazone 2.11 1.06 1.27 0.31 0.25
Pyridoxal 1.41 0.18 0.24 0.89 1.86
Pyridoxic acid 2.14 0.77 0.26 1.13 0.66
Pyrazinamide 1.12 1.51 0.57 1.42 1.29
6-Thioxanthine 1.51 2.22 0.35 0.16 2.32
Uric acid 1.22 1.53 0.52 1.37 2.26
Vanillin 1.02 2.23 0.42 0.25 1.16
Vanillic acid 0.77 1.61 0.89 0.35 0.59
Xanthine 1.21 0.98 0.19 0.11 1.79

241
Table 2:% Accuracy calculated for intra-day analysis of compounds used in HPLC analysis in
this study.
Mean ± SD of accuracy (%) (n=3)
Nominal concentration
Analyte 0.01 mM 0.02 mM 0.03 mM 0.05 mM 0.1 mM
Allopurinol 98.2 ± 1.2 99.2 ± 1.1 97.1 ± 0.7 98.5 ± 1.3 98.5 ± 1.7
Cinchonine 97.5 ± 1.5 98.3 ± 0.8 97.8 ± 1.4 105.6 ± 0.2 96.9 ± 1.2
Hypoxanthine 99.6 ± 1.1 99.5 ± 1.7 99.7 ± 2.1 99.5 ± 1.1 99.6 ± 1.9
6-Mercaptopurine 98.2 ± 0.3 97.2 ± 1.6 95.5 ± 1.7 98.8 ± 1.1 99.2 ± 1.7
Methotrexate 99.3 ± 1.3 97.1 ± 1.7 98.9 ± 0.5 96.1 ± 2.4 98.9 ± 1.8
1-Methylxanthine 98.5 ± 2.5 100.3 ± 0.9 99.8 ± 2.3 98.1 ± 0.7 99.9 ± 0.2
1-Methyluric acid 95.1 ± 1.1 97.3 ± 0.4 96.2 ± 0.9 99.9 ± 0.2 96.7 ± 0.7
N1-methylnicotinamide 95.1 ± 0.7 98.5 ± 0.4 99.9 ± 0.4 100.3 ± 0.7 96.8 ± 1.4
Oxipurinol 99.2 ± 2.1 99.1 ± 1.1 100.4 ± 2.2 96.6 ± 1.9 98.8 ± 2.1
Phenanthridine 100.6 ± 1.9 99.8 ± 1.4 99.2 ± 0.3 99.1 ± 1.3 100.8 ± 1.1
Phenanthridone 99.5 ± 0.7 97.5 ± 0.2 99.5 ± 1.7 99.5 ± 1.1 99.5 ± 0.8
Phthalazine 99.1 ± 1.3 98.7 ± 2.2 95.2 ± 1.7 98.9 ± 1.5 99.8 ± 1.5
1-pthalazone 98.6 ± 1.5 100.4 ± 0.2 98.7 ± 1.8 99.5 ± 2.1 95.6 ± 2.3
Pyridoxal 98.2 ± 0.7 97.9 ± 1.6 95.9 ± 2.3 99.9 ± 0.6 100.2 ± 1.7
Pyridoxic acid 98.4 ± 1.5 95.4 ± 0.7 99.1 ± 2.4 98.2 ± 1.8 99.2 ± 1.3
Pyrazinamide 100.5 ± 0.4 97.3 ± 1.3 99.9 ± 1.1 99.3 ± 1.2 98.3 ± 2.2
6-Thioxanthine 100.2 ± 0.2 98.4 ± 2.3 98.5 ± 1.1 99.8 ± 1.9 98.2 ± 1.3
Uric acid 95.6 ± 1.7 99.7 ± 1.1 99.7 ± 1.2 98.3. ± 1.9 97.2 ± 0.7
Vanillin 97.1 ± 1.2 99.1 ± 1.1 98.8 ± 1.1 95.2 ± 1.7 98.5 ± 0.7
Vanillic acid 97.1 ± 1.7 98.5 ± 1.8 100.5 ± 0.4 97.5 ± 1.3 99.1 ± 0.9
Xanthine 97.4 ± 1.2 99.6 ± 1.3 100.2 ± 0.1 99.8 ± 0.7 99.6 ± 2.1
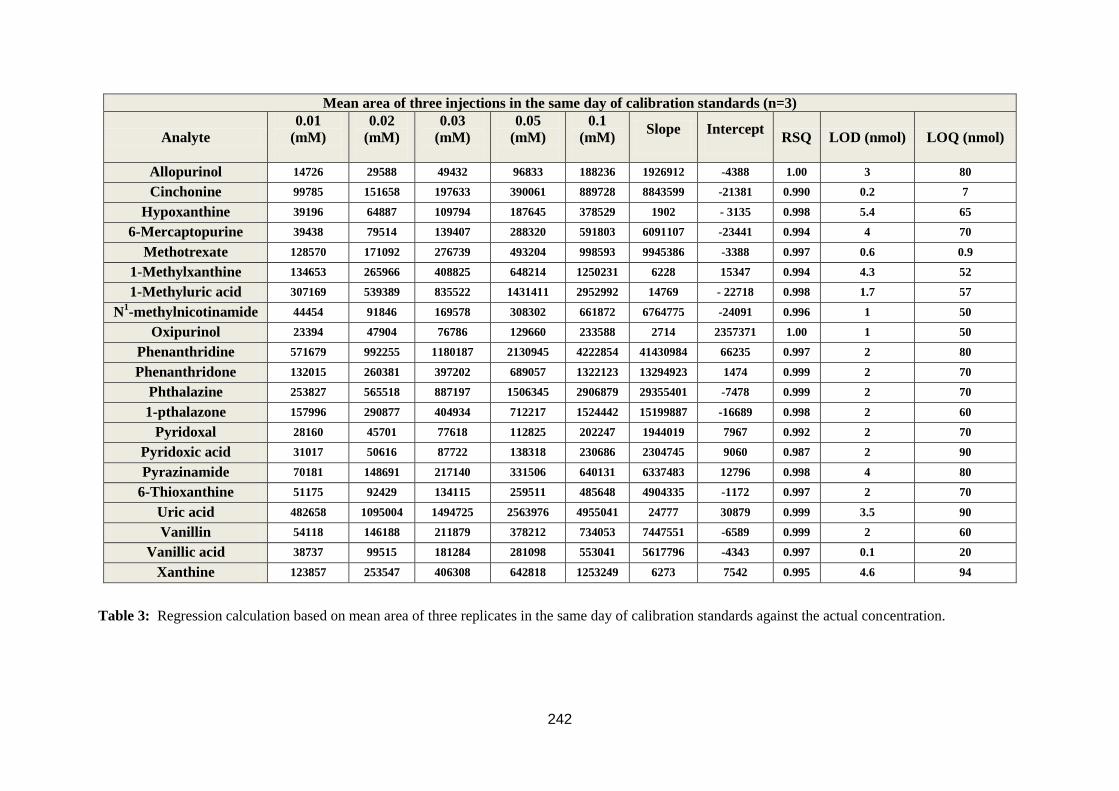
242
Mean area of three injections in the same day of calibration standards (n=3)
Analyte
0.01
(mM)
0.02
(mM)
0.03
(mM)
0.05
(mM)
0.1
(mM)
Slope
Intercept
RSQ LOD (nmol) LOQ (nmol)
Allopurinol 14726 29588 49432 96833 188236 1926912 -4388 1.00 3 80
Cinchonine 99785 151658 197633 390061 889728 8843599 -21381 0.990 0.2 7
Hypoxanthine 39196 64887 109794 187645 378529 1902 - 3135 0.998 5.4 65
6-Mercaptopurine 39438 79514 139407 288320 591803 6091107 -23441 0.994 4 70
Methotrexate 128570 171092 276739 493204 998593 9945386 -3388 0.997 0.6 0.9
1-Methylxanthine 134653 265966 408825 648214 1250231 6228 15347 0.994 4.3 52
1-Methyluric acid 307169 539389 835522 1431411 2952992 14769 - 22718 0.998 1.7 57
N1-methylnicotinamide 44454 91846 169578 308302 661872 6764775 -24091 0.996 1 50
Oxipurinol 23394 47904 76786 129660 233588 2714 2357371 1.00 1 50
Phenanthridine 571679 992255 1180187 2130945 4222854 41430984 66235 0.997 2 80
Phenanthridone 132015 260381 397202 689057 1322123 13294923 1474 0.999 2 70
Phthalazine 253827 565518 887197 1506345 2906879 29355401 -7478 0.999 2 70
1-pthalazone 157996 290877 404934 712217 1524442 15199887 -16689 0.998 2 60
Pyridoxal 28160 45701 77618 112825 202247 1944019 7967 0.992 2 70
Pyridoxic acid 31017 50616 87722 138318 230686 2304745 9060 0.987 2 90
Pyrazinamide 70181 148691 217140 331506 640131 6337483 12796 0.998 4 80
6-Thioxanthine 51175 92429 134115 259511 485648 4904335 -1172 0.997 2 70
Uric acid 482658 1095004 1494725 2563976 4955041 24777 30879 0.999 3.5 90
Vanillin 54118 146188 211879 378212 734053 7447551 -6589 0.999 2 60
Vanillic acid 38737 99515 181284 281098 553041 5617796 -4343 0.997 0.1 20
Xanthine 123857 253547 406308 642818 1253249 6273 7542 0.995 4.6 94
Table 3: Regression calculation based on mean area of three replicates in the same day of calibration standards against the actual concentration.
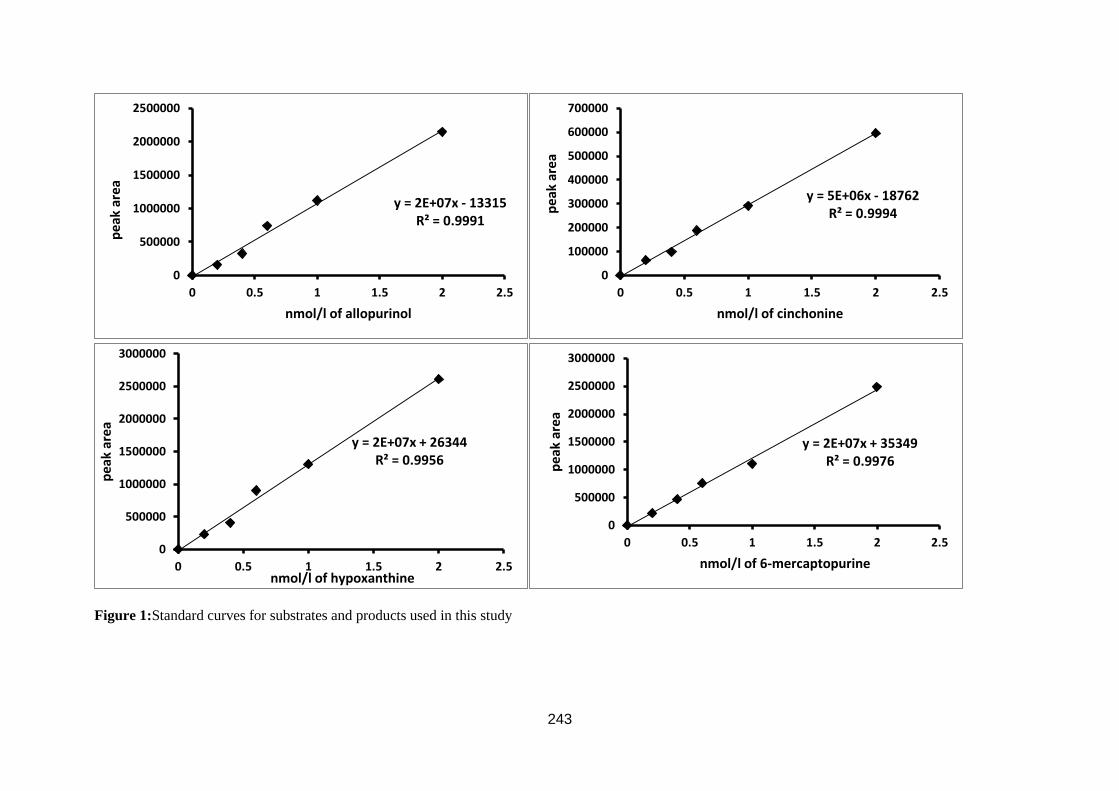
243
Figure 1:Standard curves for substrates and products used in this study
y = 2E+07x - 13315 R² = 0.9991
0
500000
1000000
1500000
2000000
2500000
0 0.5 1 1.5 2 2.5
pe
ak a
rea
nmol/l of allopurinol
y = 5E+06x - 18762 R² = 0.9994
0
100000
200000
300000
400000
500000
600000
700000
0 0.5 1 1.5 2 2.5
pe
ak a
rea
nmol/l of cinchonine
y = 2E+07x + 26344 R² = 0.9956
0
500000
1000000
1500000
2000000
2500000
3000000
0 0.5 1 1.5 2 2.5
pea
k ar
ea
nmol/l of hypoxanthine
y = 2E+07x + 35349 R² = 0.9976
0
500000
1000000
1500000
2000000
2500000
3000000
0 0.5 1 1.5 2 2.5p
eak
are
a nmol/l of 6-mercaptopurine

244
Figure 2:Standard curves for substrates and products used in this study
y = 1E+07x + 661.64 R² = 0.9996
0
200000
400000
600000
800000
1000000
1200000
1400000
0 0.5 1 1.5 2 2.5
pea
k ar
ea
nmol/l of methotrexate
y = 8E+06x + 635.82 R² = 0.9974
0
200000
400000
600000
800000
1000000
0 0.5 1 1.5 2 2.5
pe
ak a
rea
nmol/l of 1-methylxanthine
y = 3E+07x - 20236 R² = 0.9974
0
500000
1000000
1500000
2000000
2500000
3000000
3500000
0 0.5 1 1.5 2 2.5
pe
ak a
rea
nmol/l of N1 -methylnicoteinamide
y = 9E+06x - 7761.6 R² = 0.9989
0
200000
400000
600000
800000
1000000
1200000
0 0.5 1 1.5 2 2.5p
eak
are
a nmol/l of oxipurinol

245
Figure 3:Standard curves for substrates and products used in this study
y = 5E+06x - 6704.3 R² = 0.9999
0
1000000
2000000
3000000
4000000
5000000
6000000
0 0.5 1 1.5 2 2.5
pe
ak a
rea
nmol/l of phenanthridine
y = 1E+07x + 139700 R² = 0.9993
0
500000
1000000
1500000
2000000
2500000
0 0.5 1 1.5 2 2.5
pe
ak a
rea
nmol/l of phenanthridinone
y = 3E+06x - 3020.6 R² = 0.9991
0
50000
100000
150000
200000
250000
300000
350000
0 0.5 1 1.5 2 2.5
pea
k ar
ea
nmol/l of phthalzine
y = 5E+06x - 6571.8 R² = 0.9992
0
100000
200000
300000
400000
500000
600000
700000
0 0.5 1 1.5 2 2.5p
eak
are
a nmol/l of phthalazinone

246
Figure 4:Standard curves for substrates and products used in this study
y = 2E+07x + 100612 R² = 0.9996
0
50000
100000
150000
200000
250000
300000
0 0.5 1 1.5 2 2.5
pe
ak a
rea
nmol/l of pyridoxal
y = 7E+06x + 15261 R² = 0.9999
0
50000
100000
150000
200000
250000
300000
0 0.5 1 1.5 2 2.5
pe
ak a
rea
nmol/l of pyridoxic acid
y = 2E+06x - 9418.8 R² = 0.9989
0
500000
1000000
1500000
2000000
2500000
3000000
3500000
0 0.5 1 1.5 2 2.5
pea
k ar
ea
nmol/l of pyrazinamide
y = 3E+06x - 1556.1 R² = 0.9989
0
50000
100000
150000
200000
250000
300000
350000
0 0.5 1 1.5 2 2.5p
eak
are
a nmol/l of 6-thioxanthine
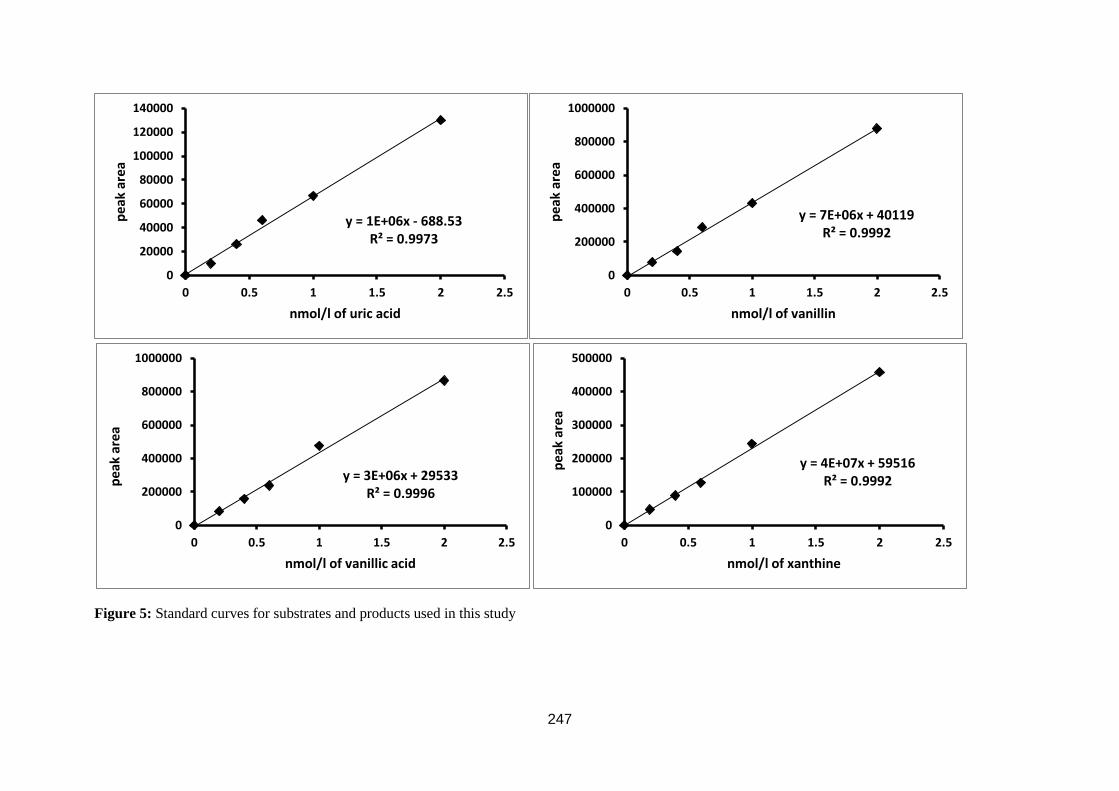
247
Figure 5: Standard curves for substrates and products used in this study
y = 1E+06x - 688.53 R² = 0.9973
0
20000
40000
60000
80000
100000
120000
140000
0 0.5 1 1.5 2 2.5
pe
ak a
rea
nmol/l of uric acid
y = 7E+06x + 40119 R² = 0.9992
0
200000
400000
600000
800000
1000000
0 0.5 1 1.5 2 2.5
pe
ak a
rea
nmol/l of vanillin
y = 3E+06x + 29533 R² = 0.9996
0
200000
400000
600000
800000
1000000
0 0.5 1 1.5 2 2.5
pea
k ar
ea
nmol/l of vanillic acid
y = 4E+07x + 59516 R² = 0.9992
0
100000
200000
300000
400000
500000
0 0.5 1 1.5 2 2.5p
eak
are
a nmol/l of xanthine
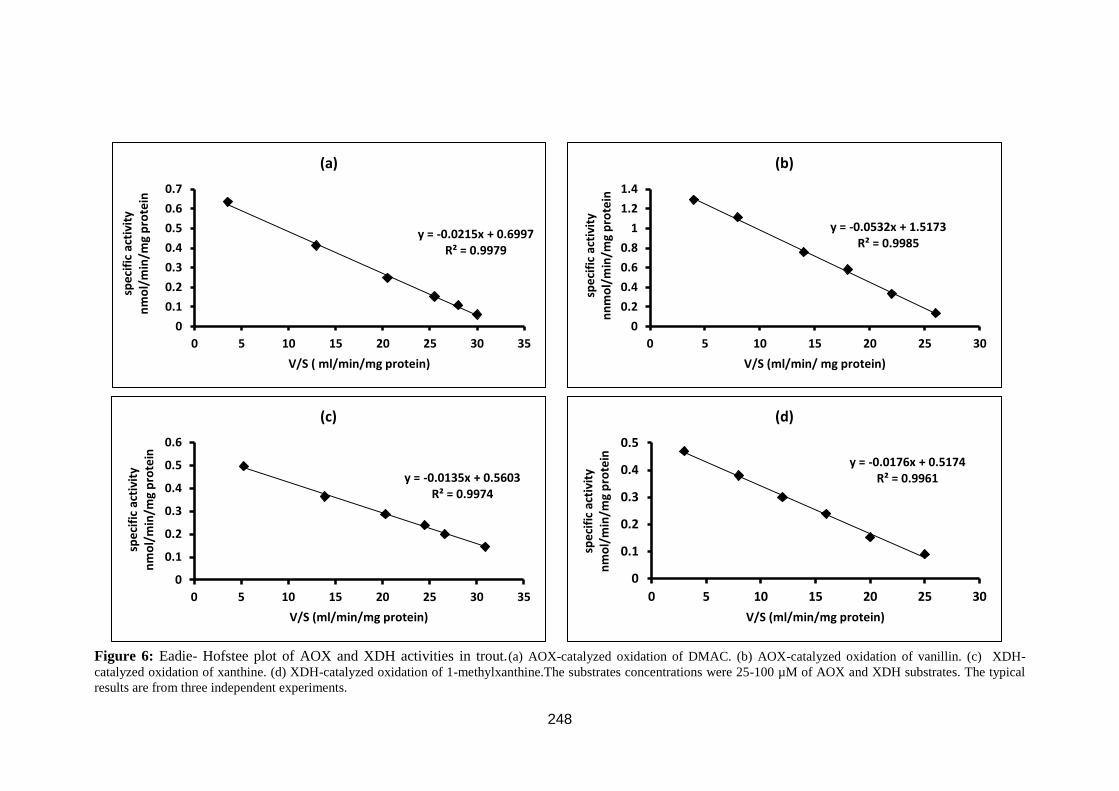
248
y = -0.0532x + 1.5173 R² = 0.9985
0
0.2
0.4
0.6
0.8
1
1.2
1.4
0 5 10 15 20 25 30
spe
cifi
c ac
tivi
ty
nn
mo
l/m
in/m
g p
rote
in
V/S (ml/min/ mg protein)
(b)
y = -0.0176x + 0.5174 R² = 0.9961
0
0.1
0.2
0.3
0.4
0.5
0 5 10 15 20 25 30sp
eci
fic
acti
vity
n
mo
l/m
in/m
g p
rote
in
V/S (ml/min/mg protein)
(d)
y = -0.0135x + 0.5603 R² = 0.9974
0
0.1
0.2
0.3
0.4
0.5
0.6
0 5 10 15 20 25 30 35
spe
cifi
c ac
tivi
ty
nm
ol/
min
/mg
pro
tein
V/S (ml/min/mg protein)
(c)
y = -0.0215x + 0.6997 R² = 0.9979
0
0.1
0.2
0.3
0.4
0.5
0.6
0.7
0 5 10 15 20 25 30 35
spe
cifi
c ac
tivi
ty
nm
ol/
min
/mg
pro
tein
V/S ( ml/min/mg protein)
(a)
Figure 6: Eadie- Hofstee plot of AOX and XDH activities in trout.(a) AOX-catalyzed oxidation of DMAC. (b) AOX-catalyzed oxidation of vanillin. (c) XDH-
catalyzed oxidation of xanthine. (d) XDH-catalyzed oxidation of 1-methylxanthine.The substrates concentrations were 25-100 µM of AOX and XDH substrates. The typical
results are from three independent experiments.

249
y = -0.0039x + 0.2251 R² = 0.997
0
0.05
0.1
0.15
0.2
0.25
0 10 20 30 40
spe
cifi
c ac
tivi
ty
nm
ol/
min
/mg
pro
tein
V/S (ml/min/mg protein)
(c)
y = -0.0054x + 2.2456 R² = 0.9956
0
0.05
0.1
0.15
0.2
0.25
0 10 20 30 40
spe
cifi
c ac
tivi
ty
nm
ol/
min
/mg
pro
tein
V/S (ml/min/mg protein)
(a)
y = -0.0097x + 3.7765 R² = 0.9995
0
0.1
0.2
0.3
0.4
0.5
0.6
0.7
0.8
0 5 10 15 20 25 30
spe
cifi
c ac
tivi
ty
nm
ol/
min
/mg
pro
tein
V/S (ml/min/mg protein )
(b)
Figure 7: Eadie- Hofstee plot of AOX activities in rat.(a) AOX-catalyzed oxidationof DMAC. (b) AOX-catalyzed oxidation of vanillin. (c) AOX-catalyzed oxidation of
phenanthridine. The substrates concentrations were 25-100 µM of AOX substrates. The typical results are from three independent experiments.

250
y = -0.0055x + 4.2793 R² = 0.9946
0
0.05
0.1
0.15
0.2
0.25
0.3
0 10 20 30 40
spe
cifi
c ac
tivi
ty
nm
ol/
min
/mg
pro
tein
V/S (ml/min/mg protein)
(b)
y = -0.0092x + 4.3136 R² = 0.9929
0
0.05
0.1
0.15
0.2
0.25
0.3
0.35
0 5 10 15 20 25 30
spe
cifi
c ac
tivi
ty
nm
ol/
min
/mg
pro
tein
V/S (ml/min/mg protein)
( c)
y = -0.0132x + 0.6945 R² = 0.9973
0
0.1
0.2
0.3
0.4
0.5
0.6
0.7
0 10 20 30 40 50
spe
cifi
c ac
tivi
ty
nm
ol/
min
/mg
pro
tein
V/S (ml/min/mg protein)
(a)
Figure 8: Eadie- Hofstee plot of XOR activities in rat. (a) XO-catalyzed oxidation of xanthine. (b) XDH-catalyzed oxidation of xanthine. (c) XDH-catalyzed oxidation
of 1-methylxanthine. The substrates concentrations were 25-100 µM of XOR substrates. The typical results are from three independent experiments.

251
y = -0.0034x + 3.1448 R² = 0.9921
0
0.02
0.04
0.06
0.08
0.1
0.12
0.14
0.16
0 10 20 30 40
spe
cifi
c ac
tivi
ty
nm
ol/
min
/mg
pro
tein
V/S (ml/min/mg protein)
(a)
y = -0.0055x + 4.6539 R² = 0.9958
0
0.1
0.2
0.3
0.4
0.5
0.6
0.7
0 5 10 15 20 25 30
spe
cifi
c ac
tivi
ty
nm
ol/
min
/mg
pro
tein
V/S (ml/min/mg protein)
(b)
y = -0.0032x + 4.1683 R² = 0.9948
0
0.05
0.1
0.15
0.2
0 10 20 30 40
spe
cifi
c ac
tivi
ty
nm
ol/
min
/mg
pro
tein
V/S (ml/min/mg protein)
( c)
Figure 9: Eadie- Hofstee plot of AOX activities in human. (a) AOX-catalyzed oxidation of DMAC. (b) AOX-catalyzed oxidation of vanillin. (c) AOX-catalyzed
oxidation of phenanthridine. The substrates concentrations were 25-100 µM of AOX substrates. The typical results are from three independent experiments.

252
y = -0.003x + 0.4176 R² = 0.9986
0
0.02
0.04
0.06
0.08
0.1
0.12
0 10 20 30 40
spe
cifi
c ac
tivi
ty
nm
ol/
min
/mg
pro
tein
V/S (ml/min/mg protein)
(a)
y = -0.0019x + 5.483 R² = 0.9965
0
0.01
0.02
0.03
0.04
0.05
0.06
0.07
0.08
0 10 20 30 40
spe
cifi
c ac
tivi
ty
nm
ol/
min
/mg
pro
tein
V/S (ml/min/mg protein)
(b)
y = -0.0066x + 6.3108 R² = 0.9912
0
0.5
1
1.5
2
2.5
0 10 20 30 40
spe
cifi
c ac
tivi
ty
nm
ol/
min
/mg
pro
tein
V/S (ml/min/mg protein)
(c )
Figure 10: Eadie- Hofstee plot of XOR activities in human. (a) XO-catalyzed oxidation of xanthine. (b) XDH-catalyzed oxidation of xanthine. (c) XDH-catalyzed
oxidation of 1-methylxanthine. The substrates concentrations were 25-100 µM of XOR substrates. The typical results are from three independent experiments.

253
Figure 11: Eadie- Hofstee plot of AOX activities in rainbow trout. (a) AOX-catalyzed oxidation of vanillin. (b) AOX-catalyzed oxidation of pyridoxal. (c) AOX-catalyzed
oxidation of all-trans retinal. (d)AOX-catalyzed oxidation of N1-methylnicotinamide. The substrates concentrations were 25-100 µM of AOX substrates. The typical results
are from three independent experiments.
y = -0.054x + 1.8934 R² = 0.9984
0
0.2
0.4
0.6
0.8
1
1.2
1.4
1.6
1.8
0 5 10 15 20 25 30 35
spe
cifi
c ac
tivi
ty n
mo
l/m
in/m
g p
rote
in
V/S (ml/min/mg protein )
(a)
y = -0.1219x + 1.4073 R² = 0.9859
0
0.2
0.4
0.6
0.8
1
1.2
1.4
0 5 10 15 20 25 30 35
spe
cifi
c ac
tivi
ty n
mo
l/m
in/m
g p
rote
in
V/S (ml/min/mg protein)
(b)
y = -0.1247x + 2.2261 R² = 0.9954
0
0.5
1
1.5
2
2.5
3
3.5
0 5 10 15 20 25 30
spe
cifi
c ac
tivi
ty n
mo
l/m
in/m
g p
rote
in
V/S (ml/min/mg protein)
(c)
y = -0.2739x + 1.6387 R² = 0.9961
0
2
4
6
8
10
0 5 10 15 20 25 30 35sp
eci
fic
acti
vity
nm
ol/
min
/mg
pro
tein
V/S (ml/min/mg protein)
(d)

254
Figure 12: Eadie- Hofstee plot of AOX activities in rainbow trout. (a) AOX-catalyzed oxidation of phenanthridine. (b) AOX-catalyzed oxidation of phthalazine. (c)
AOX-catalyzed oxidation of cinchonine. The substrates concentrations were 25-100 µM of AOX substrates. The typical results are from three independent experiments.
y = -0.055x + 1.7817 R² = 0.997
0
0.5
1
1.5
2
0 5 10 15 20 25 30 35
spe
cifi
c ac
tivi
ty n
mo
l/m
in/m
g p
rote
in
V/S (ml/min/mg protein)
(a)
y = -0.0612x + 2.0232 R² = 0.9903
0
0.5
1
1.5
2
2.5
0 10 20 30 40
spe
cifi
c ac
tivi
ty n
mo
l/m
in/m
g p
rote
in
V/S (ml/min/mg protein)
(b)
y = -0.1747x + 1.6385 R² = 0.999
0
1
2
3
4
5
6
0 5 10 15 20 25 30 35
spe
cifi
c ac
tivi
ty n
mo
l/m
in/m
g p
rote
in
V/S (ml/min/mg protein)
(c)
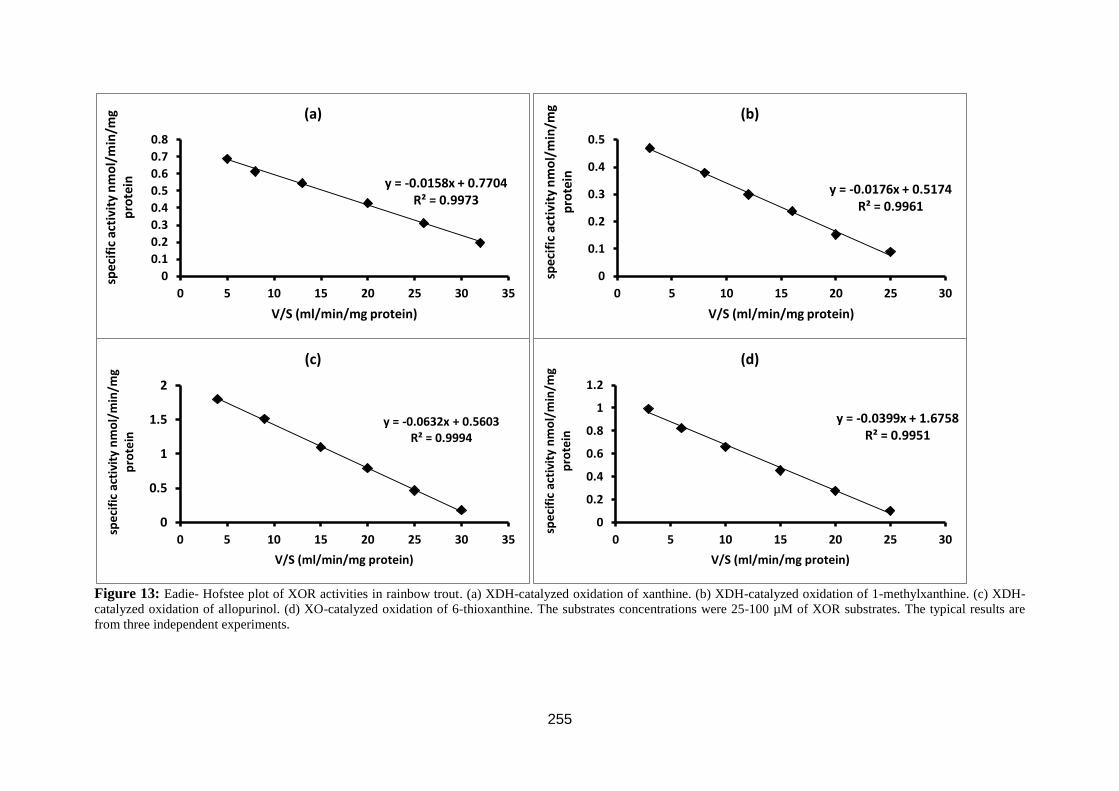
255
Figure 13: Eadie- Hofstee plot of XOR activities in rainbow trout. (a) XDH-catalyzed oxidation of xanthine. (b) XDH-catalyzed oxidation of 1-methylxanthine. (c) XDH-
catalyzed oxidation of allopurinol. (d) XO-catalyzed oxidation of 6-thioxanthine. The substrates concentrations were 25-100 µM of XOR substrates. The typical results are
from three independent experiments.
y = -0.0158x + 0.7704 R² = 0.9973
0
0.1
0.2
0.3
0.4
0.5
0.6
0.7
0.8
0 5 10 15 20 25 30 35
spec
ific
act
ivit
y n
mo
l/m
in/m
g p
rote
in
V/S (ml/min/mg protein)
(a)
y = -0.0176x + 0.5174 R² = 0.9961
0
0.1
0.2
0.3
0.4
0.5
0 5 10 15 20 25 30
spec
ific
act
ivit
y n
mo
l/m
in/m
g p
rote
in
V/S (ml/min/mg protein)
(b)
y = -0.0632x + 0.5603 R² = 0.9994
0
0.5
1
1.5
2
0 5 10 15 20 25 30 35
spe
cifi
c ac
tivi
ty n
mo
l/m
in/m
g p
rote
in
V/S (ml/min/mg protein)
(c)
y = -0.0399x + 1.6758 R² = 0.9951
0
0.2
0.4
0.6
0.8
1
1.2
0 5 10 15 20 25 30sp
eci
fic
acti
vity
nm
ol/
min
/mg
pro
tein
V/S (ml/min/mg protein)
(d)

256
Figure 14: Eadie- Hofstee plot of XOR activities in rainbow trout. (a) XDH-catalyzed oxidation
of 6-thioxanthine. (b) XDH-catalyzed oxidation of pyrazinamide. The substrates concentrations were
25-100 µM of XDH substrates. The typical results are from three independent experiments.
y = -0.0309x + 0.8752 R² = 0.9942
0
0.2
0.4
0.6
0.8
1
0 5 10 15 20 25 30
spe
cifi
c ac
tivi
ty n
mo
l/m
in/m
g p
rote
in
V/S (ml/min/mg protein)
(a)
y = -0.2095x + 2.8601 R² = 0.9989
0
1
2
3
4
5
6
7
0 5 10 15 20 25 30 35
spe
cifi
c ac
tivi
ty n
mo
l/m
in/m
g p
rote
in
V/S (ml/min/mg protein)
(b)
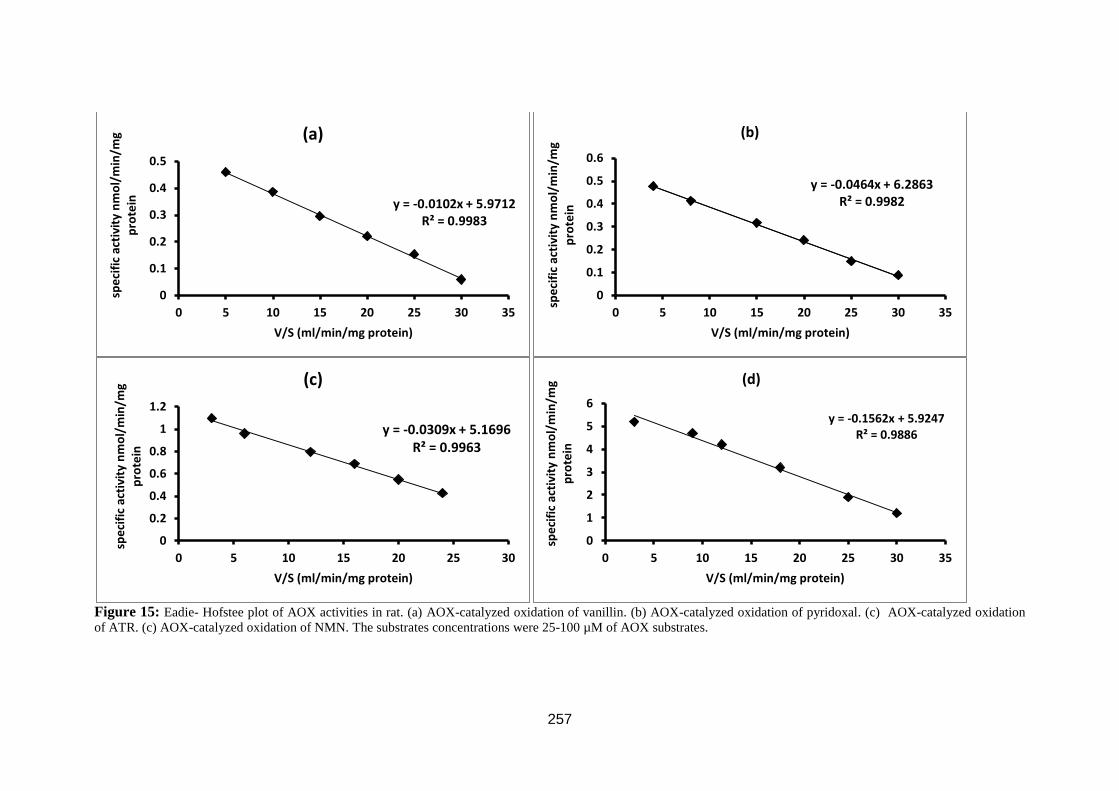
257
Figure 15: Eadie- Hofstee plot of AOX activities in rat. (a) AOX-catalyzed oxidation of vanillin. (b) AOX-catalyzed oxidation of pyridoxal. (c) AOX-catalyzed oxidation
of ATR. (c) AOX-catalyzed oxidation of NMN. The substrates concentrations were 25-100 µM of AOX substrates.
y = -0.0102x + 5.9712 R² = 0.9983
0
0.1
0.2
0.3
0.4
0.5
0 5 10 15 20 25 30 35
spe
cifi
c ac
tivi
ty n
mo
l/m
in/m
g p
rote
in
V/S (ml/min/mg protein)
(a)
y = -0.0464x + 6.2863 R² = 0.9982
0
0.1
0.2
0.3
0.4
0.5
0.6
0 5 10 15 20 25 30 35
spe
cifi
c ac
tivi
ty n
mo
l/m
in/m
g p
rote
in
V/S (ml/min/mg protein)
(b)
y = -0.0309x + 5.1696 R² = 0.9963
0
0.2
0.4
0.6
0.8
1
1.2
0 5 10 15 20 25 30
spe
cifi
c ac
tivi
ty n
mo
l/m
in/m
g p
rote
in
V/S (ml/min/mg protein)
(c)
y = -0.1562x + 5.9247 R² = 0.9886
0
1
2
3
4
5
6
0 5 10 15 20 25 30 35sp
eci
fic
acti
vity
nm
ol/
min
/mg
pro
tein
V/S (ml/min/mg protein)
(d)

258
Figure 16: Eadie- Hofstee plot of AOX activities in rat. (a) AOX-catalyzed oxidation of phenanthridine. (b) AOX-catalyzed oxidation of phthalazine. (c) AOX-
catalyzed oxidation of cinchonine. (d) AOX-catalyzed oxidation of pyrazinamide. The substrates concentrations were 25-100 µM of AOX substrates.
y = -0.0056x + 2.4353 R² = 0.9915
0
0.1
0.2
0.3
0.4
0.5
0 10 20 30 40
spe
cifi
c ac
tivi
ty n
mo
l/m
in/m
g p
rote
in
V/S (ml/min/mg protein)
(a)
y = -0.0105x + 5.7927 R² = 0.9938
0
0.1
0.2
0.3
0.4
0.5
0.6
0.7
0.8
0 10 20 30 40
spe
cifi
c ac
tivi
ty n
mo
l/m
in/m
g p
rote
in
V/S (ml/min/mg protein)
(b)
y = -0.0373x + 4.5379 R² = 0.9962
0
0.2
0.4
0.6
0.8
1
1.2
1.4
1.6
0 5 10 15 20 25 30 35
spe
cifi
c ac
tivi
ty n
mo
l/m
in/m
g p
rote
in
V/S (ml/min/mg protein)
(c)
y = -0.1633x + 5.3048 R² = 0.9942
0
1
2
3
4
5
6
0 5 10 15 20 25 30 35sp
eci
fic
acti
vity
nm
ol/
min
/mg
pro
tein
V/S (ml/min/mg protein)
(d)

259
Figure 17: Eadie- Hofstee plot of XOR activities in rat. (a) XO-catalyzed oxidation of xanthine. (b) XDH-catalyzed oxidation of xanthine. (c) XO-catalyzed oxidation of 1-
MX. (d) XDH-catalyzed oxidation of 1-MX. The substrates concentrations were 25-100 µM of AOX substrates.
y = -0.0092x + 0.522 R² = 0.9885
0
0.1
0.2
0.3
0.4
0.5
0.6
0 5 10 15 20 25 30 35
spec
ific
act
ivit
y n
mo
l/m
in/m
g p
rote
in
V/S (ml/min/mg protein)
(a)
y = -0.0064x + 5.17 R² = 0.9885
0
0.1
0.2
0.3
0.4
0.5
0.6
0 5 10 15 20 25 30 35
spec
ific
act
ivit
y n
mo
l/m
in/m
g p
rote
in
V/S (ml/min/mg protein)
(b)
y = -0.0107x + 0.3473 R² = 0.9932
0
0.05
0.1
0.15
0.2
0.25
0.3
0.35
0 5 10 15 20 25 30
spec
ific
act
ivit
y n
mo
l/m
in/m
g p
rote
in
V/S (ml/min/mg protein)
(c)
y = -0.0082x + 5.1336 R² = 0.9929
0
0.05
0.1
0.15
0.2
0.25
0.3
0.35
0 5 10 15 20 25 30sp
ecif
ic a
ctiv
ity
nm
ol/
min
/mg
pro
tein
V/S (ml/min/mg protein)
(d)

260
Figure 18: Eadie- Hofstee plot of XOR activities in rat. (a) XO-catalyzed oxidation of 6-MP. (b) XDH-catalyzed oxidation of 6-MP. (c) XO-catalyzed oxidation of
allopurinol. (d) XDH-catalyzed oxidation of allopurinol. The substrates concentrations were 25-100 µM of AOX substrates.
y = -0.0291x + 1.6139 R² = 0.9933
0
0.1
0.2
0.3
0.4
0.5
0.6
0.7
0.8
0 5 10 15 20 25 30
spe
cifi
c ac
tivi
ty n
mo
l/m
in/m
g p
rote
in
V/S (ml/min/mg protein)
(a)
y = -0.0246x + 3.6846 R² = 0.9847
0
0.1
0.2
0.3
0.4
0.5
0.6
0.7
0 5 10 15 20 25 30
spe
cifi
c ac
tivi
ty n
mo
l/m
in/m
g p
rote
in
V/S (ml/min/mg protein)
(b)
y = -0.0209x + 1.1911 R² = 0.9972
0
0.1
0.2
0.3
0.4
0.5
0.6
0.7
0 5 10 15 20 25 30 35
spe
cifi
c ac
tivi
ty n
mo
l/m
in/m
g p
rote
in
V/S (ml/min/mg protein)
(c)
y = -0.0153x + 3.5323 R² = 0.9902
0
0.1
0.2
0.3
0.4
0.5
0.6
0 5 10 15 20 25 30 35sp
eci
fic
acti
vity
nm
ol/
min
/mg
pro
tein
V/S (ml/min/mg protein)
(d)

261
Figure 19: Eadie- Hofstee plot of XDH activities in rat. XDH-catalyzed oxidation of
pyrazinamide. The substrates concentrations were 25-100 µM of XDH substrates. The typical results
are from three independent experiments.
y = -0.0922x + 4.2555 R² = 0.9893
0
0.5
1
1.5
2
2.5
3
3.5
0 5 10 15 20 25 30 35
Spe
cifi
c ac
tivi
ty n
mo
l/m
in/m
g p
rote
in
V/S (ml/min/mg protein)
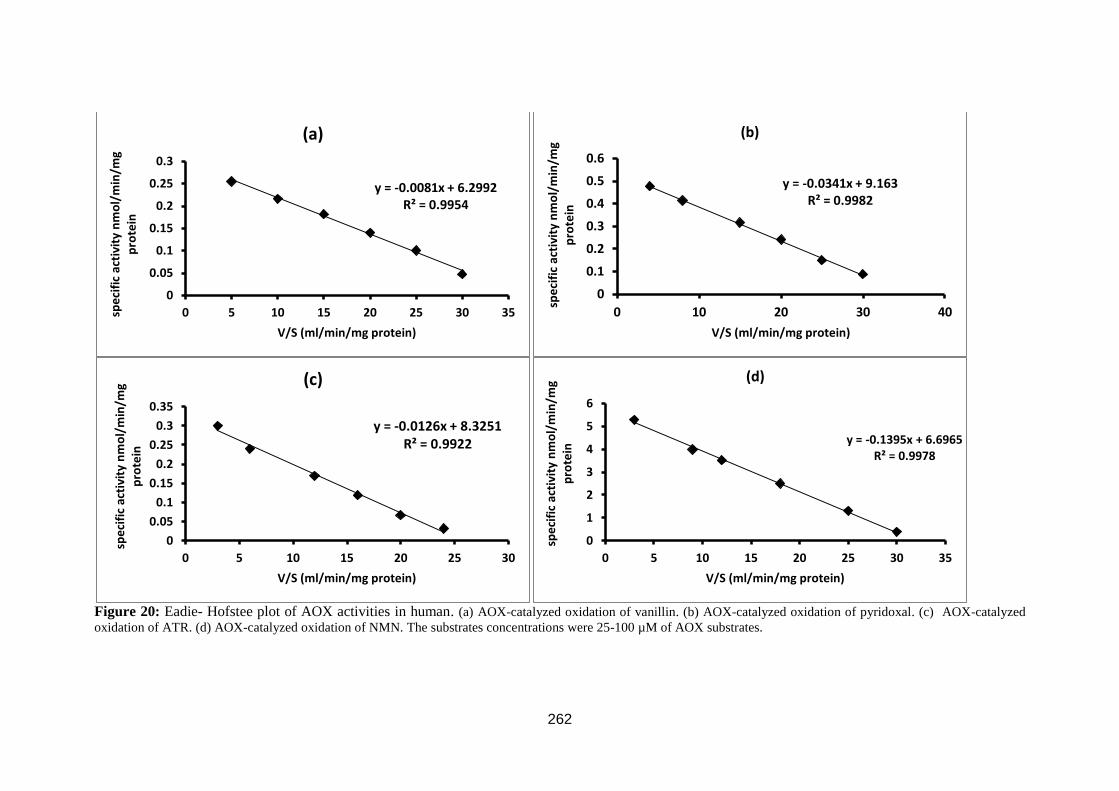
262
Figure 20: Eadie- Hofstee plot of AOX activities in human. (a) AOX-catalyzed oxidation of vanillin. (b) AOX-catalyzed oxidation of pyridoxal. (c) AOX-catalyzed
oxidation of ATR. (d) AOX-catalyzed oxidation of NMN. The substrates concentrations were 25-100 µM of AOX substrates.
y = -0.0081x + 6.2992 R² = 0.9954
0
0.05
0.1
0.15
0.2
0.25
0.3
0 5 10 15 20 25 30 35spe
cifi
c ac
tivi
ty n
mo
l/m
in/m
g p
rote
in
V/S (ml/min/mg protein)
(a)
y = -0.0341x + 9.163 R² = 0.9982
0
0.1
0.2
0.3
0.4
0.5
0.6
0 10 20 30 40
spe
cifi
c ac
tivi
ty n
mo
l/m
in/m
g p
rote
in
V/S (ml/min/mg protein)
(b)
y = -0.0126x + 8.3251 R² = 0.9922
0
0.05
0.1
0.15
0.2
0.25
0.3
0.35
0 5 10 15 20 25 30
spe
cifi
c ac
tivi
ty n
mo
l/m
in/m
g p
rote
in
V/S (ml/min/mg protein)
(c)
y = -0.1395x + 6.6965 R² = 0.9978
0
1
2
3
4
5
6
0 5 10 15 20 25 30 35sp
eci
fic
acti
vity
nm
ol/
min
/mg
pro
tein
V/S (ml/min/mg protein)
(d)
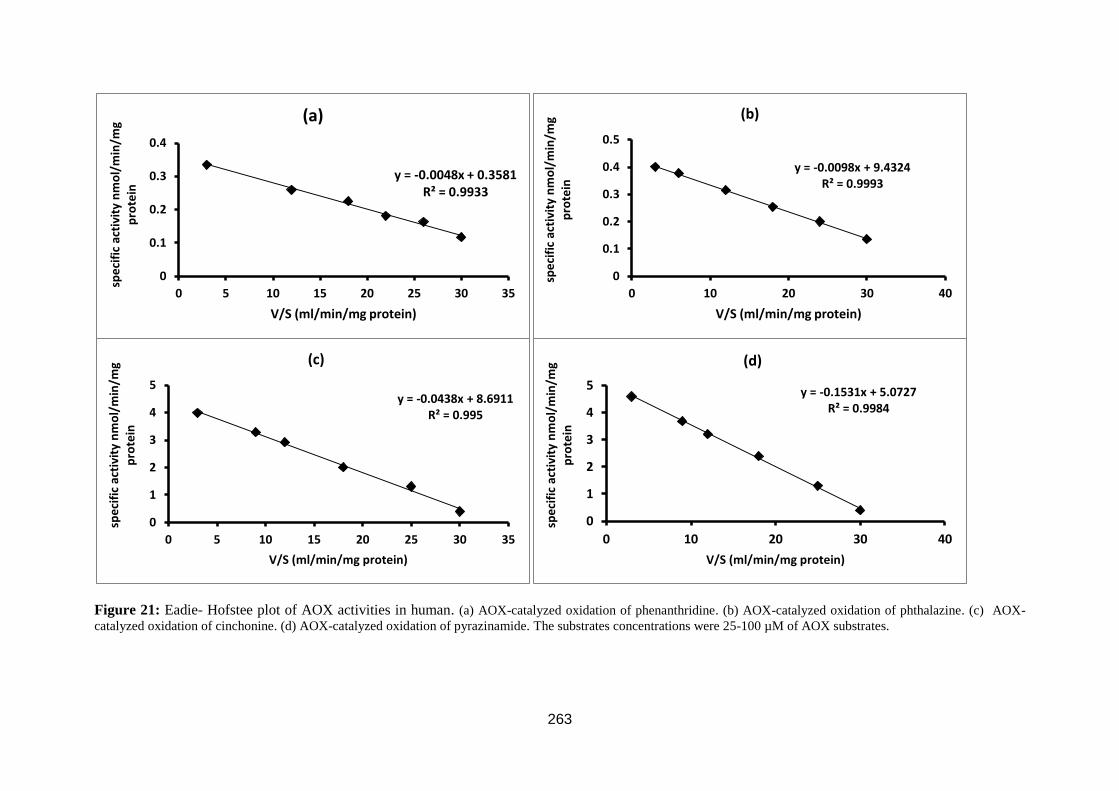
263
Figure 21: Eadie- Hofstee plot of AOX activities in human. (a) AOX-catalyzed oxidation of phenanthridine. (b) AOX-catalyzed oxidation of phthalazine. (c) AOX-
catalyzed oxidation of cinchonine. (d) AOX-catalyzed oxidation of pyrazinamide. The substrates concentrations were 25-100 µM of AOX substrates.
y = -0.0048x + 0.3581 R² = 0.9933
0
0.1
0.2
0.3
0.4
0 5 10 15 20 25 30 35
spe
cifi
c ac
tivi
ty n
mo
l/m
in/m
g p
rote
in
V/S (ml/min/mg protein)
(a)
y = -0.0098x + 9.4324 R² = 0.9993
0
0.1
0.2
0.3
0.4
0.5
0 10 20 30 40
spe
cifi
c ac
tivi
ty n
mo
l/m
in/m
g p
rote
in
V/S (ml/min/mg protein)
(b)
y = -0.0438x + 8.6911 R² = 0.995
0
1
2
3
4
5
0 5 10 15 20 25 30 35
spe
cifi
c ac
tivi
ty n
mo
l/m
in/m
g p
rote
in
V/S (ml/min/mg protein)
(c)
y = -0.1531x + 5.0727 R² = 0.9984
0
1
2
3
4
5
0 10 20 30 40sp
eci
fic
acti
vity
nm
ol/
min
/mg
pro
tein
V/S (ml/min/mg protein)
(d)

264
Figure 22: Eadie- Hofstee plot of XOR activities in human. (a) XO-catalyzed oxidation of xanthine. (b) XDH-catalyzed oxidation of xanthine. (c) XO-catalyzed
oxidation of 1-MX. (d) XDH-catalyzed oxidation of 1-MX. The substrates concentrations were 25-100 µM of AOX substrates.
y = -0.0055x + 0.4706 R² = 0.9936
0
0.1
0.2
0.3
0.4
0.5
0 5 10 15 20 25 30 35
spe
cifi
c ac
tivi
ty n
mo
l/m
in/m
g p
rote
in
V/S (ml/min/mg protein)
(a)
y = -0.0024x + 7.2572 R² = 0.9921
0
0.05
0.1
0.15
0.2
0.25
0.3
0 5 10 15 20 25 30 35
spe
cifi
c ac
tivi
ty n
mo
l/m
in/m
g p
rote
in
V/S (ml/min/mg protein)
(b)
y = -0.007x + 0.2666 R² = 0.9975
0
0.05
0.1
0.15
0.2
0.25
0.3
0 5 10 15 20 25 30
spec
ific
act
ivit
y n
mo
l/m
in/m
g p
rote
in
V/S (ml/min/mg protein)
(c)
y = -0.0057x + 8.1897 R² = 0.9664
0
0.05
0.1
0.15
0.2
0 5 10 15 20 25 30sp
eci
fic
acti
vity
nm
ol/
min
/mg
pro
tein
V/S (ml/min/mg protein)
(d)
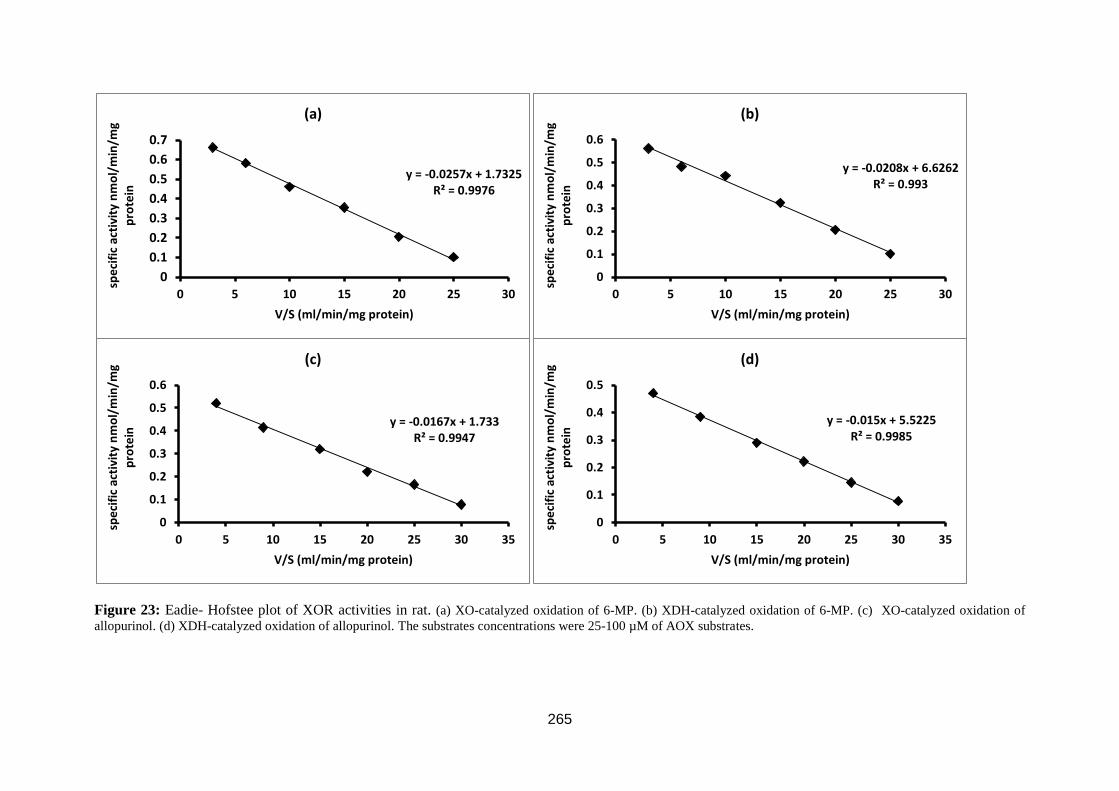
265
Figure 23: Eadie- Hofstee plot of XOR activities in rat. (a) XO-catalyzed oxidation of 6-MP. (b) XDH-catalyzed oxidation of 6-MP. (c) XO-catalyzed oxidation of
allopurinol. (d) XDH-catalyzed oxidation of allopurinol. The substrates concentrations were 25-100 µM of AOX substrates.
y = -0.0257x + 1.7325 R² = 0.9976
0
0.1
0.2
0.3
0.4
0.5
0.6
0.7
0 5 10 15 20 25 30
spe
cifi
c ac
tivi
ty n
mo
l/m
in/m
g p
rote
in
V/S (ml/min/mg protein)
(a)
y = -0.0208x + 6.6262 R² = 0.993
0
0.1
0.2
0.3
0.4
0.5
0.6
0 5 10 15 20 25 30
spe
cifi
c ac
tivi
ty n
mo
l/m
in/m
g p
rote
in
V/S (ml/min/mg protein)
(b)
y = -0.0167x + 1.733 R² = 0.9947
0
0.1
0.2
0.3
0.4
0.5
0.6
0 5 10 15 20 25 30 35
spe
cifi
c ac
tivi
ty n
mo
l/m
in/m
g p
rote
in
V/S (ml/min/mg protein)
(c)
y = -0.015x + 5.5225 R² = 0.9985
0
0.1
0.2
0.3
0.4
0.5
0 5 10 15 20 25 30 35sp
eci
fic
acti
vity
nm
ol/
min
/mg
pro
tein
V/S (ml/min/mg protein)
(d)

266
Figure 24: Eadie- Hofstee plot of XOR activities in human. XDH-catalyzed oxidation of
pyrazinamide. The substrates concentrations were 25-100 µM of AOX substrates. The typical
results are from three independent experiments.
y = -0.0907x + 6.4132 R² = 0.9881
0
0.5
1
1.5
2
2.5
3
3.5
0 5 10 15 20 25 30 35
Spe
cifi
c ac
tivi
ty n
mo
l/m
in/m
g p
rote
in
V/S (ml/min/mg protein)
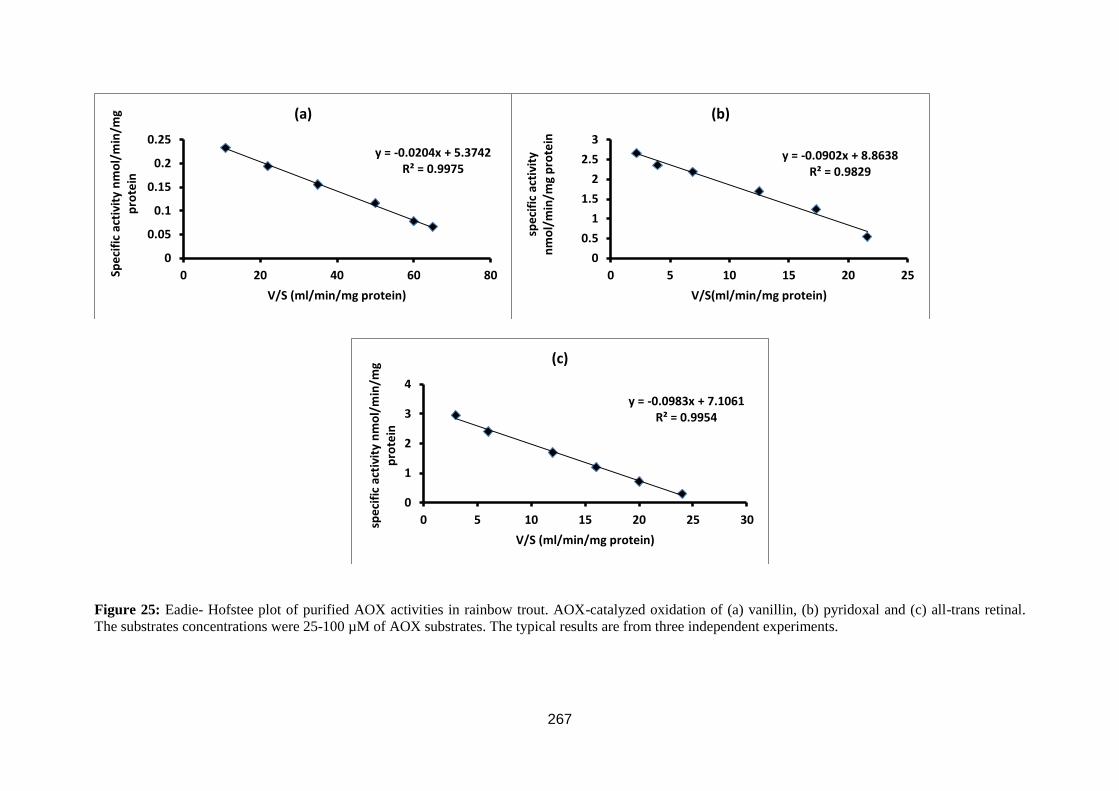
267
Figure 25: Eadie- Hofstee plot of purified AOX activities in rainbow trout. AOX-catalyzed oxidation of (a) vanillin, (b) pyridoxal and (c) all-trans retinal.
The substrates concentrations were 25-100 µM of AOX substrates. The typical results are from three independent experiments.
y = -0.0204x + 5.3742 R² = 0.9975
0
0.05
0.1
0.15
0.2
0.25
0 20 40 60 80Spe
cifi
c ac
tivi
ty n
mo
l/m
in/m
g p
rote
in
V/S (ml/min/mg protein)
(a)
y = -0.0902x + 8.8638 R² = 0.9829
0
0.5
1
1.5
2
2.5
3
0 5 10 15 20 25
spe
cifi
c ac
tivi
ty
nm
ol/
min
/mg
pro
tein
V/S(ml/min/mg protein)
(b)
y = -0.0983x + 7.1061 R² = 0.9954
0
1
2
3
4
0 5 10 15 20 25 30spe
cifi
c ac
tivi
ty n
mo
l/m
in/m
g p
rote
in
V/S (ml/min/mg protein)
(c)