investigation of antibiotic identity among bacterial antibiotic … · 2019-12-10 · antibiotic...
TRANSCRIPT

Investigation of Antibiotic Identity Among Bacterial Antibiotic Producers
A Major Qualifying Project Report:
Submitted to the Faculty of
WORCESTER POLYTECHNIC INSTITUTE
In Partial Fulfillment of the Requirements for the Degree of Bachelor of Science in:
BIOLOGY AND BIOTECHNOLOGY
Ronan Ball and Cole Royer
Project Advisor: Professor Mike Buckholt
12/13/19

Table of Contents
Acknowledgements………………………………………………………………..3
Abstract……………………………………………………………………………3
Introduction and Background………………………………………………………4
1. Antibiotic Overview……………………………………………………4
2. Antibiotic Resistance Threat……………………………………………6
3. The Small World Initiative………………………………………………11
4. Project Overview…………………………………………………………12
5. Project Summary…………………………………………………………15
Methods and Procedures……………………………………………………………...16
1. Testing BB2915 Bacterial Isolates for Growth…………………………...16
2. Testing BB2915 Bacterial Isolates for Antibiotic Production……………16
3. Liquid Cultures…………………………………………………………...17
4. Organic Extraction……………………………………………………….18
5. Test of Organic Extraction……………………………………………….19
6. High Performance/Pressure Liquid Chromatography ……………………19
7. HPLC Fraction Test………………………………………………………20
8. Thin Layer Chromatography……………………………………………..21
9. TLC Fraction Test……………………………………………………….22
10. Gas Chromatography/Mass Spectrometry………………………………23
11. Polymerase Chain Reaction……………………………………………..24
12. Gel Electrophoresis and Sequencing …………………………………….25
MQP Flow Chart ……………………………………………………………………..27
Results and Discussion……………………………………………………………….28
1. Bacterial Growth and Antibiotic Production…………………………………28
2. Antibiotic Extraction…………………………………………………………36
3. Thin Layer Chromatography ………………………………………………..41
4. High Performance/Pressure Liquid Chromatography……………………….45
5. Gas Chromatography/Mass spectrometry…………………………………...50
6. PCR and Sequencing ………………………………………………………..59
Concluding Remarks/Future Directions…………………………………………….63
Appendix/Supplemental results …………………………………………………….65
Works Cited .………………………………………………………………………..82

Acknowledgements
Special thanks to Professor Mike Buckholt, who was an indispensable resource throughout the
project. Thanks is also in order to Professor Drew Brodeur who assisted with the gas
chromatography and mass spectrometry procedure and analysis.
Abstract
Our Major Qualifying Project focused on the isolation and characterization of antibiotics
produced by bacteria isolated in BB2915. Our project extended the work of these
undergraduates by extracting the antibiotic from the producer, identifying the bacterial species
from which it came, and analyzing the antibiotic’s structural features and chemical properties in
hopes of identification. We have successfully extracted antibiotic from four isolates and
determined producer identity down to the genus level by PCR amplification of the 16s rRNA
sequence. Thin Layer and high-performance liquid chromatography allowed determination of
antibiotic structural features and gas chromatography/mass spectroscopy allowed molecular
weight determination. As a result of this investigation, we can state that Sphaerochaeta,
Gramella, Aminivibrio, and Leptotrichia bacterial genera are able to produce antimicrobial
compounds. Based on the molecular weight and structural analysis we have performed, bacteria
in the Sphaerochaeta genus likely produce the antibiotic D-cycloserine. Bacteria in the genus
Aminivibrio likely produce the antibiotic 5-azatcytide. Bacteria in the Leptotrichia genus likely
produce the antibiotic amikacin hydrate, and bacteria in the Gramella genus produce one of the
macrolide antibiotics neomycin, ribostamycin, or paromomycin. Our literature review showed
that these genera of bacteria either have no characterized antibiotic production (Aminivibrio,
Sphaerochaeta) or poorly characterized antibiotic production (Gramella, Leptotrichia), meaning
that our work could have identified novel producers of these clinically important antibiotics.

Part 1: Introduction and Background
Section 1- Antibiotic Overview
The discovery of antibiotics was one of the most influential medical achievements of our
time. These miracle drugs have saved millions of lives and brought humanity out of a time
where the smallest wound or infection could lead to death (“Antimicrobial…”, 2014).
Unfortunately, their effectiveness as a therapy is declining due to the rise of antibiotic resistant
organisms and a historical lack of interest in antibiotic discovery by the pharmaceutical industry
(Wencewicz, 2019). To combat this troubling issue, our MQP team will be taking bacterial
antibiotic producers isolated in a WPI biology undergraduate lab course and extracting and
identifying the specific antibiotic produced. The goal is to discover what antibiotic types are
produced by certain species of bacteria, and if any bacteria isolated produce novel antibiotics. If
successful, this will lead to a new source of known antibiotics and potentially novel antibiotics
that could have therapeutic effectiveness.
In their essence, antibiotics are any molecule that has antimicrobial activity, but does
not harm host or producer tissue. These compounds can be synthesized by organisms naturally or
created artificially in a chemical laboratory (Gould, 2016). Many bacterial species produce
antibiotics that kill competing organisms as a part of their secondary metabolism. This type of
metabolism is not necessary for the organism’s survival but results in the production of
metabolites that give the organism some competitive advantage. Antibiotics give this advantage
by killing off competing bacterial species. This metabolic process presents an interesting
opportunity for discovery of novel antibiotics that may have medical use. If the species an
antibiotic producer is trying to out compete happens to be related to a human pathogen, then the
antibiotic produced could very well kill the microbe that is harming humans as well as the
original target and be harnessed as a treatment (Xu, et al, 2019). Antibiotics can also be
synthesized directly in a chemical laboratory by joining together different organic functional
groups in such a way that the resulting molecule inhibits or destroys a key function or structure
of a target pathogenic bacteria (Huigens, et al, 2010). In all, there are a total of 12 major classes
of antibiotics that have been discovered or synthesized since the discovery of penicillin in the
early 20th century; many of which are summarized in table 1 with their mechanism of action
detailed (Calderon and Sabundayo, 2007 and Cohen, Powderly & Opal, 2017).
The effectiveness and availability of antibiotics have made them one of the most
prescribed medications in the world, but they are not without limitations. Since they act on
specific structural components and processes in the bacterial cell, the target organisms can
become immune to their effects by mutating the antibiotic target in such a way that no longer
allows the molecule to be an effective antimicrobial agent. This type of resistance is a rising
global threat with enormous consequences (Wencewicz, 2019).
Antibiotic Mechanism of Action
B-Lactams1
Inhibit cell wall synthesis by interfering with
structural crosslinking of Peptidoglycan -
Kills Bacteria2
Glycopeptides1 Inhibit cell wall synthesis by preventing
peptidoglycan polymer formation- Kills
Bacteria2
Tetracyclines1 Inhibits protein synthesis by binding to the
30s ribosomal subunit and preventing the
binding of tRNA- Stops Growth2
Macrolides1 Inhibits protein synthesis by binding to the
50s ribosomal subunit and causing premature
dissociation of the tRNA- Stops Growth2
Streptogramins1 Inhibits protein synthesis by binding to the
50s ribosomal subunit and blocking tRNA
incorporation and mRNA translation - Kills
Bacteria2
Oxazolidinoues1
Inhibits protein synthesis by preventing
assembly of the ribosome - Stops Growth2
Chloramphenicol1 Inhibits protein synthesis by inhibiting
peptidyl transferase activity- Stops Growth2
Aminoglycosides1 Inhibits protein synthesis by disrupting
translational accuracy by binding to an
aminoacyl site of the ribosomal RNA - Kills
Bacteria2
Quinolones1 Interferes with DNA replication by inhibiting
DNA gyrase enzyme and preventing the
unwinding of DNA supercoils- Kills Bacteria2
Ansamycins1 Interferes with RNA activity by binding to
and inhibiting several RNA polymerases-
Kills Bacteria2
Lipopeptides1 Membrane Disruption by incorporating into
the bacterial membrane and disrupting the
membrane potential- Kills Bacteria2
Sulfonamides1 Acts as a competitive inhibitor to precursor in
the folic acid synthesis metabolic pathway -
Stops Growth2
Table 1: Antibiotic Classes and Mechanisms of Action (Calderon and Sabundayo, 2007)1
and (Cohen, Powderly & Opal, 2017)2
This table provides a summary of the major classes of antibiotics and how they work.
Section 2- The Antibiotic Resistance Threat
Antibiotic resistance is a problem as old as antibiotics themselves. As Figure 1 shows,
bacterial resistance to an antibiotic appears soon after that antibiotic is introduced to the clinical
world. Bacterial infections from these resistant strains are extremely difficult to treat because the
very therapy designed to treat the infection is no longer effective. Unfortunately, this is not a
problem of the future, as the US Center for Disease Control estimates that antibiotic resistant
bacteria kill at least 23,000 and infect 2 million people per year (“About Antimicrobial

Resistance, Antibiotic/Antimicrobial Resistance”, n.d.). These numbers demonstrate a clear and
present health risk, which current studies assert is getting worse (Wencewicz, 2019).
Antibiotic resistance occurs in part because antibiotics kill bacteria by targeting a specific
structure or process like those described in the preceding section. In any population of bacterial
cells that the antibiotic is targeting, a few will likely have mutations in their genetic code that
alter the antibiotic target or make it inaccessible, leading to that compound no longer being able
to kill or stop the growth of the bacteria. Since the antibiotic is unable to kill the bacterium with
the mutation, the organism is selected for and the mutated gene is passed on at a higher
frequency, introducing antibiotic resistance to the bacterial infection (Lu, et al, 2018). This
resistance can also spread throughout the colony rapidly as a result of Horizontal Gene Transfer
(HGT), which is the movement of genetic information between through a means other than
reproduction. This means that genes that mutate the antibiotic target (either from a resistant
bacterium or the environment) can be transferred to other organisms in the colony without
replication, increasing speed of antibiotic resistance spread (Burmeister, A. R., 2015). HGT
occurs in three main ways: Transformation, Conjugation, and Transduction. Transformation is
where nonresistant bacteria incorporate resistant DNA from their environment. Conjugation is
where bacteria have genes conferring resistance directly transferred to them from a resistant
bacterium. Finally, transduction is where bacteriophages remove the resistance gene from the
resistant bacterium upon excision from the cell and transfer it to a non-resistant bacterium upon
viral integration (Li, et al, 2019).
The rise of antibiotic resistance may be complex and multifaceted but can be broken
down into a few major issues. The first is volume of use; antibiotics are often used in hospitals
and inpatient care at a level higher than clinically needed. “Drug medley’s”, drug courses

containing multiple broad-spectrum antibiotics, have frequently replaced the use of small
targeted antibiotics specific for the infecting organism. This is dangerous, as overuse of broad-
spectrum antibiotics can cause bacteria that are not killed during treatment to become resistant to
a wider variety of therapies all at once (Talkington, K., 2018). A second contributing factor to
the rise of antibiotic resistance is appropriate use issues. Antibiotics are often prescribed
incorrectly or unnecessarily by practitioners and used incorrectly by patients in ways that lead to
resistance. The magnitude of this problem was illustrated by a study in the Journal of American
Medicine that found over 30% of oral antibiotics prescribed by physicians were clinically
unnecessary. The same study also found that patients frequently misused their prescriptions by
stopping the medication before the course was up and using old medication for illnesses that do
not require antibiotics. This level of inappropriate prescription and use contributes to the rise in
resistance seen on a global scale because it causes bacteria present in the body naturally (and
unnaturally) to be exposed to antibiotics, which can lead to natural resistance (Fleming-Dutra, et
al, 2016). Animal agriculture antibiotic use, where large quantities of human use antibiotics are
sold to agriculture locations for use on their animals, is a third major contributor to the rise of
resistance. This sort of antibiotic use is generally untargeted and used as a preventative measure
for animal disease. Antibiotic resistant bacteria may be created in these situations when we are
exposed to antibiotics non-clinically by runoff into the water supply or transfer from animals to
human hosts (Witt, 1998).
Combatting the issue of antibiotic resistance is no easy task. Along with doctor, patient,
and industry education, there are many research facilities working to find a way to discover a
replacement for antibiotics as a therapy or a way in which they can bypass the method of
bacterial resistance. Unfortunately, none of these methods have reached clinical efficacy as of

this writing. One of the easiest responses to antibiotic resistance is the simple discovery of new
antibiotics that human pathogens cannot resist. While some pharmaceutical companies are still
working on antibiotic discovery, most have abandoned the process as it is not profitable, and as a
result no new classes of antibiotics were discovered in a nearly three-decade period (World
Health Organization, 2014). Although this trend is slowly changing (8 new clinically effective
antibiotics have been discovered in the five-year period between 2010 and 2015), there is still a
gap between need and supply of antibiotics (World Health Organization, 2015). To fill this void,
the Small Earth Initiative has begun to crowdsource antibiotic discovery to undergraduate
students across the country (Hernadez, et al, 2015).

,Figure 1 – Chart comparing Antibiotic Resistance Appearance against Antibiotic
Introduction date (Timeline of Antibiotic Resistance Compared to Antibiotic Development, nd)

Section 3- Small World Initiative
The Small World Initiative is a program that was started in 2012 at Yale university by Jo
Handelsman to crowdsource the discovery of new antibiotics to combat resistance. Since its
inception, the program has grown to 109 participating colleges and universities whose
undergraduates are attempting to discover new antibiotics that can be used to combat pathogenic
bacterial infections. This is accomplished by students around the world isolating bacteria from
soil samples at their location and searching for environmental bacteria that show potential
antibiotic production by their ability to inhibit the growth of competing bacteria. By utilizing
such a diverse range of locations and researchers it becomes more likely that new antibiotic
producing bacteria will be discovered. Along with this, the initiative provides the ability to gain a
more accurate outlook on trends that govern antibiotic production in bacteria, such as
environment and location. It is the initiative’s hope that this crowdsourcing will help solve the
antibiotic resistance crisis through the discovery of novel, clinically effective antibiotics
(Hernandez, et al, 2015).
WPI participates in the small world initiative through the course BB 2915. In this class
students (us among them) gathered environmental soil samples and isolated and plated bacteria
found within the soil. This was followed by searching for bacteria that showed signs of antibiotic
production (zone of inhibition-ZOI) against bacteria it was plated with. Any bacteria that showed
a ZOI and prevented growth of neighboring bacteria was though to produce antibiotics. These
species were then tested against pathogenic relatives of microbes such as Enterococcus faecium
and Pseudomonas putida among others to look for potential clinical use. Any that inhibited the
growth of a pathogen relative were PCR’d and sequenced to determine their identity. The term

ended at this point and every bacterial culture that showed areas of inhibition against pathogen
relatives were stored in freezers for later identification or use.
Section 4- Our Project
While BB 2915 was an excellent course, the limitations of a 7-week term meant that
students were never able to characterize the antibiotics that were produced by their discovered
bacteria. This means that while we have a bank of antibiotic producing bacteria, we have no idea
what types of antibiotics they are producing or if the antibiotics would be of any use against
pathogenic organisms on their own. With this in mind, the goal of our Major Qualifying Project
is to build upon the work of our peers by taking the antibiotic producing bacteria they isolated,
extracting the antibiotics, and analyzing them to see what they are, what properties they have,
and if any could be of potential clinical use.
This will be done by first going back to archived isolates from previous years and
ensuring that each one is still able to grow and produce antibiotics. This is an essential step,
because the bacterial cell cultures from BB 2915 were stored at -80 degrees Celsius and this
temperature could cause cellular damage that could inhibit growth or secondary metabolism
(Simione and Brown, 1991). Once the isolates have been shown to grow and produce antibiotic,
the antibiotic will be extracted from the culture by a standard organic extraction procedure. The
success of this will be determined by the extract’s ability to inhibit bacterial growth in a filter
disk assay. Once we have a successful extraction and bacterial identity, the project moves to its
most challenging yet interesting phase: identification and characterization of the extracted
antibiotic (Hernadez, et al, 2015).
This task will be primarily undertaken using analytical chemistry methods that determine
structural features and chemical characteristics of the unknown antibiotic. These results can then

be compared to databases and known antibiotic standards to determine if the extracted antibiotic
is novel, or an already known compound. The four main chemical techniques that will be
implemented to accomplish this are gas chromatography (GC), infrared spectroscopy (IR), mass
spectrometry (mass spec), and high-performance liquid chromatography (HPLC) and Thin Layer
Chromatography (TLC).
Gas chromatography is powerful tool for separating and analyzing chemical compounds.
It works by injecting a liquid sample of chemical (antibiotic in this case) into the GC column. A
gas (usually Helium) will move the injected antibiotic through the column, but the motion will be
inhibited by the antibiotic’s absorption into the column walls. Because the rate at which a
molecule moves through the column is a specific property of the compound, the retention time
can be used to qualitatively compare our unknown with other antibiotics (Pavia, et al, 2006).
Mass spectrometry is a powerful technique that allows the elucidation of the mass of
different compounds in a mixture. It accomplishes this by vaporizing and ionizing the given
compound and sending it through an apparatus towards a detector. The ions will pass through a
magnetic field as they move through the machine, which will deflect the ions based on their
mass. The detector will read which ions are present at different deflections and show the
abundance of different ions, by plotting m/z ratios (mass to charge). Because ions with a single
charge have an m/z that is the same as the molar mass of the molecule, we can use the resulting
plot to figure out the molar mass of the compounds in the given sample, and the functional
groups that a unknown compound potentially contains. This will allow us to determine structural
features of our antibiotic (Azman, et al, 2013).
Thin Layer Chromatography is an additional chromatography technique that uses a plate
of silica, glass, or cellulose as a stationary phase. The solvent (which can be several different
organic solvent mixtures) will travel up the plate through capillary action and take the sample
that had been spotted on the plate with it. The ratio between the distance up the plated the
sample moved and the distance the solvent moved is termed the Rf value and this value is a
unique property of the sample compound. Thus, if the Rf value of an unknown extract can be
compared to that of a known antibiotic standard, it gives strong evidence for identification
especially if the values are the same over a number of different solvents (Moody and Lewis,
1989).
Finally, we will use HPLC, to separate, purify, and identify our antibiotic. HPLC is a
modified form of column chromatography where high pressure will pump the mobile phase
solvent and antibiotic sample into a stationary phase. The antibiotic will move through the
stationary phase at a unique time based on its affinity for the compound, and as such will reach a
detector at a time that is different for each compound. Because of this, compounds in the organic
extract mixture can be jointly separated and identified as HPLC is often used in conjunction with
identification methods such as IR, Mass Spec or Ultraviolet spectroscopy (Jehl, et al, 1990).
Fractionation of TLC and HPLC will help us ensure that the peaks and bands we are visualizing
are indeed the antibiotic, and potentially give purified samples for GC/MS analysis.
These chemical techniques will help us to identify the antibiotics that we extracted from
the BB 2915 producers or at least allow us to determine some structural features of them. At this
point we will run a polymerase chain reaction to amplify the DNA of our producers and
sequence this DNA to determine producer identity. This will allow us to search in the literature
for any known antibiotic production from this species or the genus it belongs to. We can use
published information about these antibiotics to determine if any of them match the
experimentally determined characteristics of our producer extracted antibiotics. At the end of the
project it is our hope to have a catalogue of isolated antibiotics produced by bacteria isolated in
BB 2915, as well as an assessment of any new potential source of clinically effective antibiotics
(Hernadez, et al, 2015).
Section 5: Project Summary
This MQP has allowed us to identify with reasonable confidence the identity of
antibiotics produced from four bacterial isolates uncovered in the BB2915 class, and the genus of
the bacterial producers. After showing that the isolates were able to grow and produce
antibiotics after year long storage at -80 degrees Celsius, the antibiotics from isolates 23, 22, 4,
and 10 were extracted from the producer colony and run through the analytical procedures
described above. These chemical techniques gave us structural features and molecular weights
of the compounds in our isolate extracts. This allowed us to match those compounds with
known antibiotics who have similar structures and molecular weights. If the source of the known
antibiotic (bacterial produced as opposed to artificially synthesized) and its spectrum of activity
matched the behavior of the isolate produced antibiotic, then the known antibiotic was deemed
likely to be the one our isolate was producing. In addition, our isolates were sequenced to
determine producer identity. This allowed us to search the literature and see if any known
antibiotic production for species matched the results we obtained, or state novel antibiotic
production for the species.

Part 2: Methods and Procedures
Section 1: Testing BB2915 Bacterial Isolates for Growth
Bacterial isolates that were frozen and saved from the 2018 BB2915 class were streaked
onto LB (Luria-Bertini) plates to see if they could still form viable cultures, with all streaking
and plating methods adapted from the Small World Initiative research handbook (Hernandez et
al, 2015). This streak growth was done to ensure that long term storage at -80 degrees Celsius
did not cause any cellular damage that would inhibit normal growth (Simione and Brown, 1991).
Twenty different isolates in total were tested for growth by first removing them from the freezer
and letting them thaw. Once thawed, 50 uL of the isolate was placed on an LB plate and streaked
with spreading beads. The plates were then incubated for 24 hours at 37 degrees Celsius before
being checked for bacterial growth. If no growth was seen after 24 hours, the plate was returned
to the incubator for an additional day but discarded if no growth was seen after 48 hours. This
was done for 20 isolates and all isolates tested can be found in Appendix I (In the final there will
be an appendix table summarizing all isolates tested). All isolates that were able to grow after
storage were streak plated, grown in the 37-degree Celsius incubator for 24 hours, and stored in a
4 C fridge (Hernandez et al, 2015).
Section 2: Testing BB2915 Bacterial Isolates for Antibiotic Production
Bacterial isolates that had been shown to grow successfully were then tested for antibiotic
production to ensure that the long term -80 C storage did not affect their ability to produce
secondary metabolites (Simione and Brown, 1991). This was done by plating the isolates
together on the same LB plate as “tester” strains (gram negative E. coli and B. subtilis) and

looking for a zone of inhibition (ZOI) around the plated isolate. A ZOI would signal the isolate is
producing antibiotics that are inhibiting the growth of the tester bacteria. The tester bacteria were
taken from a liquid culture (detailed below) and spreading beads were used to spread 50 uL of
the liquid culture on an LB plate. After 10 minutes a sterile loop was used to transfer a small
portion of a bacterial culture to be tested on to the LB plate and incubated for 24 hours at 37
degrees Celsius. If the isolate had inhibited the growth of either strain of the tester bacteria, it
was assumed that the isolate was still able to produce antibiotics after storage (Hernandez, et al,
2019).
Section 3: Liquid Cultures
To make plating and streaking easier, liquid cultures were made of both tester bacteria
strains, and any isolate that demonstrated strong antibiotic production. To do this, 10 mL of LB
broth was placed in a 50 mL conical tube. The liquid E coli culture was created by adding 20 uL
concentrated E coli (provided by Professor Buckholt) to 10 mL LB broth and incubated for 48
hours at 37 C before storage in a 4 C refrigerator. This procedure was repeated using any
bacterial isolate that exhibited strong antibiotic production, except that the 20 uL of concentrated
solution came from the freezer stock. The B. subtilis culture was made by using a sterile loop to
scrape an agar slant culture (again provided by Professor Buckholt), with the loop then being
deposited and stirred in the 10 mL of LB broth before incubation. After incubation, all liquid
cultures were tested for success by streaking them onto an LB plate and observing culture
formation after 24 hours in the 37 degree C incubator.

Section 4: Organic Extraction
Isolates that displayed antibiotic production were cultured using by taking the previously
created liquid cultures and transferring 50-100 uL of the solution onto solid LB media agar plates
before using glass beads to spread the culture onto as much of the plate as possible. These plates
were incubated for 24 hours at 37 degrees Celsius or until abundant colony growth was observed.
The agar was then cut up, placed in a plastic 50 mL conical tube and frozen by either immersion
in liquid nitrogen or placement in a -80-degree Celsius freezer for 24 hours. Frozen isolates were
then heated in a 50-degree Celsius water bath for five minutes. The goal of freezing and thawing
was to kill the bacteria without harming the structural integrity of the antibiotic. Once extracts
had been thawed, organic solvent was added to the isolates. The original solvents used were 12
mL of methanol and an 8 mL ethyl acetate 4 mL water combination (Hernandez, et al, 2015).
Since methanol solvent samples had continued bacterial contamination even after filtration
(evidenced by bacteria growing off of the filter disk when the extract was plated), additional
solvents were used as a replacement for methanol namely 12 mL of chloroform and 10 mL of
acetone (Rajan and Kannabiran, 2014). The solvent isolate mixtures were initially shaken on a
rocking shaker for 1 hour, but later shaken on the rocking shaker for 24 hours after it was
determined that 1 hour was likely not enough time for the extraction to occur. After shaking, the
extract (organic layer only for ethyl acetate extracts) were allowed to settle so that the remaining
agar separated to the bottom of the conical tube. Using a pipet, the liquid portion was removed
from what remained of the top agar and run through a stereological filter to remove any
remaining bacteria. The filtered extract was then placed in a fume hood inside a 50 mL beaker
until the solvent had evaporated (Hernandez, et al, 2015).

Section 5: Test of Organic Extraction
In order to show that the extraction procedure above had successfully extracted
antibiotics from the bacterial colonies, the extracts were tested to see if they could inhibit the
growth of E. coli and B. subtilis. This was done by re-dissolving the extracts in 10 mL of solvent
and soaking sterile antibiotic filter disks in 30 uL of the re-dissolved extract. The filter disks
were then plated on LB agar plates that had either gram-positive or gram-negative tester strain
spread onto them using glass beads (50-100 uL) and the plates were incubated for 24 hours at 37
degrees Celsius. A negative control was run where the filter disks were soaked in 30 mL of only
solvent and plated. For an extract to be considered successful, the ZOI around the filter disk had
to be larger than the negative control ZOI of the extract used. Extracts that met this criterion
were assumed to have antibiotic in them and were carried forward into the analytical analysis
stage (Hernandez et al, 2015).
Section 6: High-Performance/Pressure Liquid Chromatography
The first analytical technique we used to separate, purify and identify our antibiotic was
HPLC with UV detection. The lab machine was an Agilent 1000 series with a Zorbax Rx-C18
column (4.6X25mm, 5 uL, 300 A) and a DAD 1 UV and visible lamp. A wash run with 100%
acetonitrile solvent was performed to clear out the column and ensure that no contamination was
present from previous runs. Once the wash was completed, organic extracts were placed in the
machine and run through a previously programed procedure from Richard Wobbe that can be
seen in table 2 (Wobbe, 2015). Isolates that were tested using HPLC were all four previously
discovered antibiotic producers and Ethyl Acetate that was used as a solvent in the other

solutions. The graphs at the end of these procedures were saved and analyzed for information
regarding potential antibiotic identities.
Time (min) % Solvent A % Solvent B Volume (mL)
0 92 8
4.25 92 8 4.25
29.25 20 80 25
37.55 20 80 8.3
37.56 10 90
45.85 10 90 8.3
45.86 92 8
54.15 92 8 8.3
Table 2: HPLC run procedure
Table 2 details the HPLC procedure from Richard Wobble that the extracts were run through.
Solvent A is .1% formic acid in dH20, and solvent B is 0.1% formic acid in acetonitrile (Wobbe,
2015).
Section 7: HPLC Fraction Test
The HPLC fractionation test was done to determine which HPLC peaks had antimicrobial
activity, and as such were likely the antibiotic. The Agilent 1000 series HPLC instrument was
used once again with the same procedure as before (Wobbe, 2015). To perform the
fractionation, a previously identified HPLC peak of extract of 23 (4.109 minutes) was focused
on. Extract 23 was run through the instrument and at this time the waste pipe was utilized to
extract the liquid being analyzed by the machine (Manzi & Hayes, 2001). Once the peak had
completed its passage the waste pipe was closed, and the extracted liquid stored. The liquid was
then later tested against E. Coli and Bacillus Subtilis for inhibitory activity. Tester bacteria were
spread onto LB plates and 3 drops (approx. 3-4 ul per drop) of the fractionation liquid was placed

onto different sections of the LB plate and incubated for 48 hours at 37 degrees C. A zone of
inhibition would signal that that fraction had inhibitory activity and was likely the antibiotic
(Buckholt, 2019). Unfortunately, due to time constraints and technical issues with the
instrument, only this one peak from 23 was able to be analyzed this way.
Section 8: Thin Later Chromatography (TLC)
The second analytical technique we used to attempt to identify our antibiotics and their
structural components was Thin Layer Chromatography. This was done by cutting Whatman
TLC paper into 3X1.5-inch rectangles. Half an inch up from the bottom of the paper, a mark
was made using a pencil, and a 2 uL drop of the antibiotic extract was placed there. This was
done for all the extracts to be tested as well as an ethyl acetate control. These chromatography
papers were then placed into a 50 mL beaker under a fume hood containing the solvent to be
tested against (solvent list found in table 3 below). The TLC papers were allowed to sit until the
solutions had traveled roughly ¾ of the way up the TLC paper (between 20-60 minutes). The
papers were then removed from the solutions and placed under a 365nm UV light to show how
far each extract had traveled up the paper. The distance the extract traveled was measured and
recorded as was the distance traveled by the solvent they had been immersed in. Rf values were
calculated by dividing the distance traveled by the antibiotic extract by the total distance the
solvent they had been placed in had traveled. These decimal numbers were then compared to a
list of standards to attempt to show if any previously discovered antibiotic was present in our
solutions and give elucidation of possible structural components of our antibiotic (Wobbe, 2015)
.
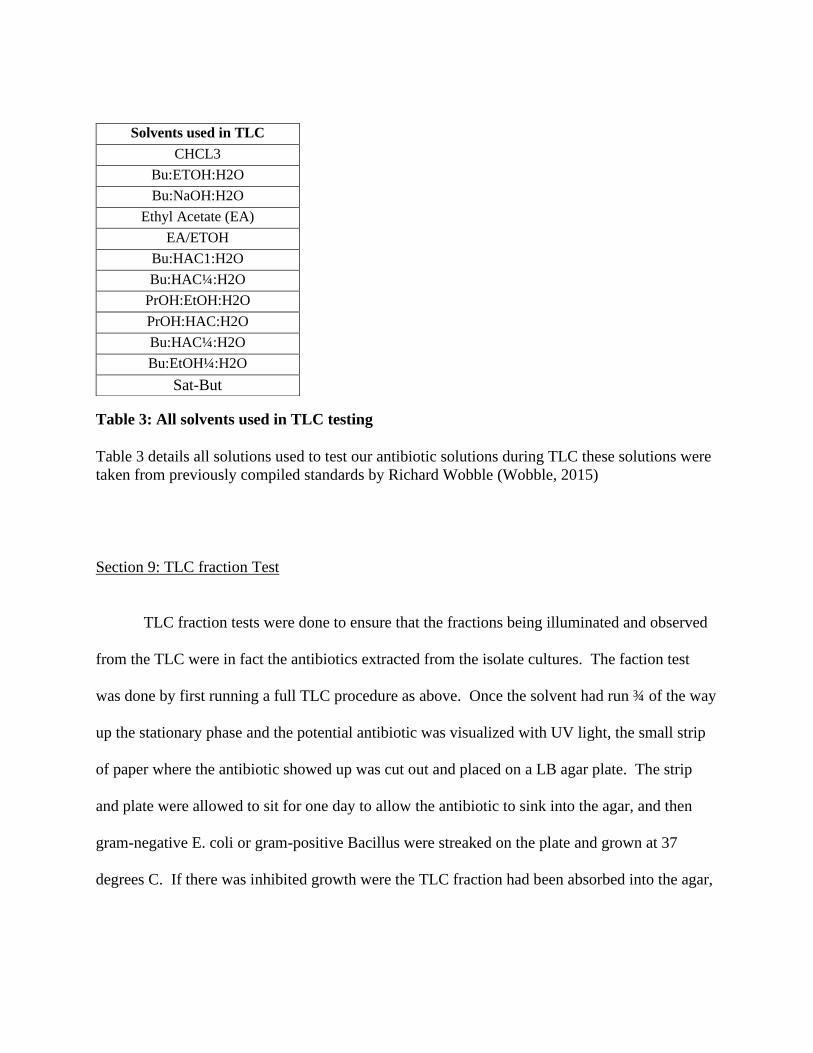
Table 3: All solvents used in TLC testing
Table 3 details all solutions used to test our antibiotic solutions during TLC these solutions were
taken from previously compiled standards by Richard Wobble (Wobble, 2015)
Section 9: TLC fraction Test
TLC fraction tests were done to ensure that the fractions being illuminated and observed
from the TLC were in fact the antibiotics extracted from the isolate cultures. The faction test
was done by first running a full TLC procedure as above. Once the solvent had run ¾ of the way
up the stationary phase and the potential antibiotic was visualized with UV light, the small strip
of paper where the antibiotic showed up was cut out and placed on a LB agar plate. The strip
and plate were allowed to sit for one day to allow the antibiotic to sink into the agar, and then
gram-negative E. coli or gram-positive Bacillus were streaked on the plate and grown at 37
degrees C. If there was inhibited growth were the TLC fraction had been absorbed into the agar,
Solvents used in TLC
CHCL3
Bu:ETOH:H2O
Bu:NaOH:H2O
Ethyl Acetate (EA)
EA/ETOH
Bu:HAC1:H2O
Bu:HAC¼:H2O
PrOH:EtOH:H2O
PrOH:HAC:H2O
Bu:HAC¼:H2O
Bu:EtOH¼:H2O
Sat-But
then this was taken as good indication that this fraction was indeed the antibiotic (Buckholt,
2019).
Section 10: Gas Chromatography and Mass Spectrometry (GC/MS)
The last analytical procedure used to help identify our antibiotics was GC/MS. This was
done by loading .5 mL of our extracts into an Agilent 7890 GC/MS system. An EA control run
was also performed. The GC/MS had a starting and post run temp of 40 C, a max oven temp of
325 C, and an equilibration time of 1 minute. The runs had a ramp rate of 20 C per minute and a
max value of 300 C with a hold time of five minutes. The runs took approximately 20 minutes
each. The machine gave us an elution chromatogram that plotted absorbance level versus time.
This allowed us to visualize the different compounds that were in our extract in a similar way to
the HPLC traces. The mass spec produced a graph for each major peak that plotted abundance
vs mass to charge ratio. The machine cross-referenced this information with a database to
deliver a list of potential compound identities with a percent likelihood for each. This data was
used in a similar way to the TLC data in that it allowed us to see what general structural features
our antibiotic might have (no percent likelihood was high enough for us to definitively identify a
whole compound). This also allowed us to determine the rough molecular weights of the
compounds in our extracts (Brodeur, 2019).
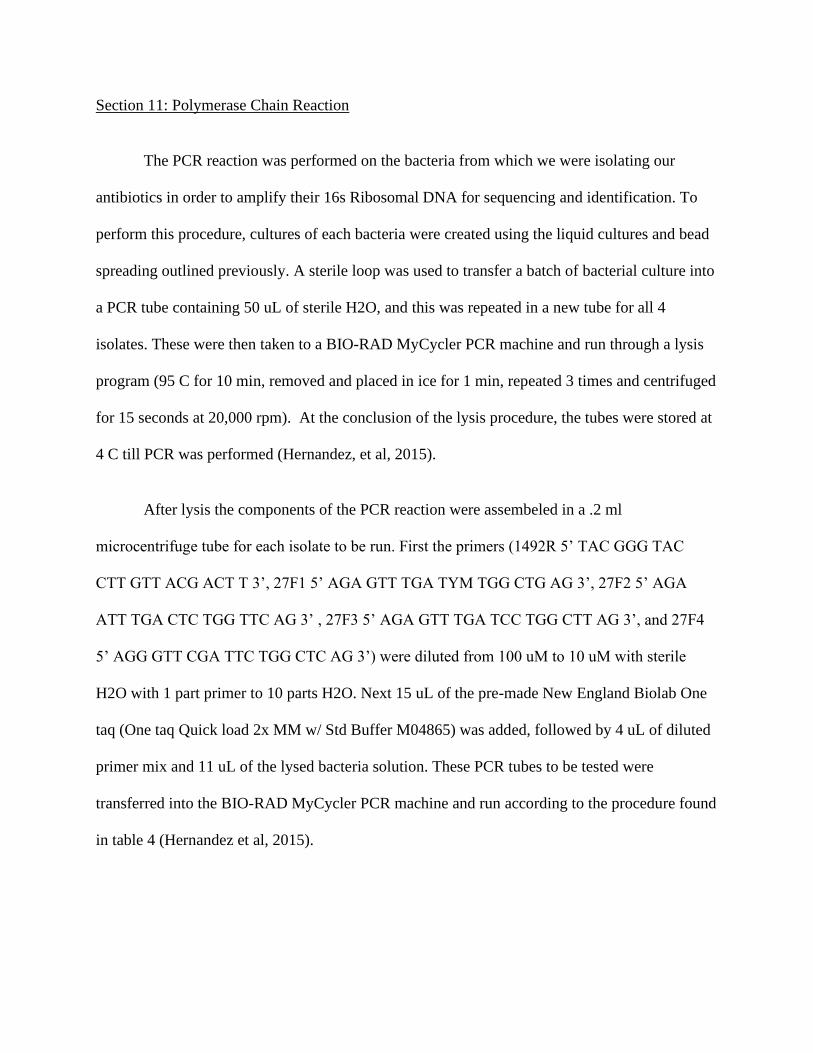
Section 11: Polymerase Chain Reaction
The PCR reaction was performed on the bacteria from which we were isolating our
antibiotics in order to amplify their 16s Ribosomal DNA for sequencing and identification. To
perform this procedure, cultures of each bacteria were created using the liquid cultures and bead
spreading outlined previously. A sterile loop was used to transfer a batch of bacterial culture into
a PCR tube containing 50 uL of sterile H2O, and this was repeated in a new tube for all 4
isolates. These were then taken to a BIO-RAD MyCycler PCR machine and run through a lysis
program (95 C for 10 min, removed and placed in ice for 1 min, repeated 3 times and centrifuged
for 15 seconds at 20,000 rpm). At the conclusion of the lysis procedure, the tubes were stored at
4 C till PCR was performed (Hernandez, et al, 2015).
After lysis the components of the PCR reaction were assembeled in a .2 ml
microcentrifuge tube for each isolate to be run. First the primers (1492R 5’ TAC GGG TAC
CTT GTT ACG ACT T 3’, 27F1 5’ AGA GTT TGA TYM TGG CTG AG 3’, 27F2 5’ AGA
ATT TGA CTC TGG TTC AG 3’ , 27F3 5’ AGA GTT TGA TCC TGG CTT AG 3’, and 27F4
5’ AGG GTT CGA TTC TGG CTC AG 3’) were diluted from 100 uM to 10 uM with sterile
H2O with 1 part primer to 10 parts H2O. Next 15 uL of the pre-made New England Biolab One
taq (One taq Quick load 2x MM w/ Std Buffer M04865) was added, followed by 4 uL of diluted
primer mix and 11 uL of the lysed bacteria solution. These PCR tubes to be tested were
transferred into the BIO-RAD MyCycler PCR machine and run according to the procedure found
in table 4 (Hernandez et al, 2015).

PCR Cycling Program
95 C for 10 min (1 cycle)
95 C for 30 sec (1 cycle)
58 C for 45 sec (1 cycle)
72 C for 1:40 min (30 cycles)
4 C until removed
Table 4 – PCR procedure
This table details the procedure for PCR performed on our bacterial isolates it was
taken from the Small World Initiative (Hernandez et al, 2015).
Section 12: Gel Electrophoresis and Sequencing
Once the PCR had been completed, the PCR products were stored at 4 C until gel
electrophoresis could be performed to test the success of the reaction. To create the gel, a
procedure from Edvotek inc was used (E. Inc, 2013). First 30 mL of 1x Taq was added to 0.23 g
of agarose gel powder in a 250 mL Erlenmeyer flask. This flask was placed into a microwave
and heated for 1 min. The flask was removed and manually swirled to complete mixture. The
agarose was cooled at room temperature until it was 60 C. A gel casting tray was then obtained
and the Agarose solution poured into it and allowed to cool until hardened, which took about 30
minutes (E. Inc, 2013). To run the gel, casting tray was placed into the electrophoresis chamber
and was covered with 1x electrophoresis buffer. Twenty-five uL of the PCR DNA samples were
loaded into one well each, and the positive and negative electrodes of the apparatus were
connected to the power source. Electrophoresis was run at 100 volts for 20-25 min or until clear
band movement had occurred (E. inc, Agarose Gel Electrophoresis). If no band movement was

seen the PCR procedure was repeated from the beginning including cell lysis. If band movement
was apparent, PCR products were collected and sent for sequencing at Eton Biosciences. To send
for sequencing, each PCR product was placed into a plastic bag with the 1492 reverse primer
used in the PCR procedure. Colonies were also sent directly to the company for sequencing
(“Eton…”, 2019). After 24-48 hours DNA sequences were received back from the lab and input
into BLAST from the National Center for Biotechnology Information (NCBI) (“Basic...”, 2019).
The highest percentage similarity results were recorded and used for research into any potential
previously discovered antibiotics that these bacteria were known to produce.

Prove that Bacterial frozen isolates can still grow by streak plating on LB plates
Prove that isolates still produced
antibiotic
YES
No= discard and pick new isolates
No= discard isolate and pick a new one
Extract antibiotic from isolates and test for success
YES
Inhibition observed from pure antibiotic
No Inhibition observed from pure antibiotic
Chemical analytics to determine
antibiotic features
HPLC
Mass Spec
GC
TLC
Use analytical results to
Determine identity or structure of
antibiotic
Known
Novel
PCR to uncover producer identity and log antibiotic
production
PCR to uncover producer identity
Test against different pathogen
relatives
Compile data about what novel
antibiotic can be effective against
MQP Flow Chart This flow chart shows the outline and progression of this MQP
Part 3: Results and Discussion
Section 1: Bacterial Growth and Antibiotic Production
The first stage of our project involved proving that isolates from BB2915 were still able
to grow viable cultures and produce antibiotics. This was necessary because after the conclusion
of BB2915 in 2018, the isolates were stored in a -80 C freezer for over a year, and it is possible
that this storage damaged the bacteria’s ability to grow and produce secondary metabolites
(Simione and Brown, 1991). To test the frozen bacteria from BB2915 for their ability to grow
viable cultures, the isolates were removed from the freezer and streak plated on LB plates. A
total of 30 different bacteria samples were plated, one per LB plate and after 24-48 hours of
incubation at 37 C the bacterial cultures were removed, and growth was observed (Hernandez, et
al, 2015). Figure 2 shows an example of what successful growth looks like on an agar plate, and
table 5 shows a summary of all 30 bacteria tested. Of the 30 bacteria plated, 24 demonstrated
growth after 48 hours (an 80% success rate). These results demonstrate that the method of
freezing the bacterial cultures used in Microbes to Molecules (BB 2905) allows most bacteria to
remain viable. The six bacteria that did not survive the process may have been less resistant to
the freezing process or were simply unable to grow on the LB plates used.

Figure 2: Isolate growth
This figure shows five different 2018 Microbes to Molecules bacterial isolates that were able to
successfully grow on LB plates.
Bacteria Plated Growth No Growth
8-2018
HC – 2018
28-2018
27-2018
17-2018
38-2018
13-2018
25-2018
23-2018
22-2018

32-2018
11-2018
12-2018
10-2018
33-2018
4-2018
35-2018
36-2018
37-2018
14-2018
15-2018
16-2018
41-2018
42-2018
7-2018
44-2018
5-2018
20-2018
45-2018
Table 5: Isolate growth
This table shows a list of all bacteria unfrozen and tested on LB plates. Bacteria that showed the
ability to grow received a check mark in the growth column and those that did not grow receive a
check mark in the did not grow column. Isolates are named by the number the lab students gave
them and the year (2018) of the class.
Once it had been demonstrated that the majority of bacterial cultures from BB2915 could
grow viable cultures, it was next shown that they were still able to exhibit the antimicrobial
activity that was seen in the Microbes to Molecules course, and that freezing had not disrupted

the secondary metabolic processes that produced antibiotics (Simione and Brown, 1991). This
was done by taking the isolates that were able to successfully grow and testing them against E.
Coli (gram negative) and Bacillus Subtilis (gram positive) tester bacteria. The spread patch
procedure detailed in the methods was used to plate both bacteria at the same time on an LB
plate. After 24-48 hours of growth at 37 degrees C, each LB plate was removed from incubation
and observed for antibiotic activity. This activity was signified by the isolate bacteria having a
Zone of Inhibition (ZOI) around its plated colony, that inhibited the growth of the bacteria
(Hernandez, et al, 2015). Table 6 shows that a total of six bacteria (4, 22, 23, 10, 7, 28) out of
the 23 tried were still able to produce antibiotics that inhibited the tester strains. Figures 3-8
show the zones of inhibition that prove the isolates in question were still able to produce
antibiotics after the yearlong storage, and figure 9 shows a negative control with a bacteria that
was known not to produce antibiotics. These results show that while a large percentage of
bacteria from BB2915 were still able to grow after storage, only a small number were still able to
exhibit the antimicrobial activity that was observed in that lab. This could be because the long-
term storage damaged the bacteria in a way that allowed them to grow but not produce secondary
metabolites, or that the bacterial isolates produced antibiotics in a certain condition that was not
replicated here. For example, some BB2915 students grew bacteria on different media types
(Todd-Hewett Agar and R2A among others), and in stressful conditions (consistently under
bright light, placed in a 20 C fridge or a 45 C incubator) in an effort to induce secondary
metabolism (Hernandez, et al, 2015). Thus, if the archived isolates only produced antibiotics
under one of the conditions or media that we did not use, it is understandable why we did not see
antimicrobial activity from that isolate. The above results are of great importance to our project
because they allowed us to find six isolates from BB2915 that were still able to grow and

produce antibiotics, as well as give insight into the spectrum of activity the antibiotics these
isolates produce have. The six isolates that were seen to produce antibiotics were moved
forward into the extraction phase.
Bacteria Tested ZOI against E.Coli (Yes/No) ZOI against Bacillus Subtilis (Yes/No)
8-2018 No No
HC – 2018 No No
28-2018 No Yes
27-2018 No No
17-2018 No No
13-2018 No No
25-2018 No No
23-2018 Yes Yes
22-2018 Yes Yes
32-2018 No No
11-2018 No No
12-2018 No No
10-2018 Yes Yes
33-2018 No No
4-2018 Yes Yes
37-2018 No No
14-2018 No No
15-2018 No No
41-2018 No No
42-2018 No No

7-2018 Yes No
5-2018 No No
20-2018 No No
Table 6: Isolate Antibiotic Production
Table 4 shows the results of the spread patch assays performed on 23 different isolate bacteria.
Zones of inhibition against tester bacteria were seen for six of these isolates
Figure 3: Isolate 23 Inhibition
This figure shows a zone of inhibition for isolate 23 against the bacillus tester (right) and E.coli
tester (left), indicating that this isolate has the ability to inhibit gram positive and negative
bacteria.
Figure 4: Isolate 4 Inhibition
This figure shows a zone of inhibition for isolate 4 against the bacillus tester (right) and E.coli
tester (left), indicating that this isolate has the ability to inhibit gram positive and negative
bacteria.
ZOI = Zone around the isolate with no tester growth
ZOI = Zone around the isolate with no tester growth
ZOI = Zone around the isolate with no tester growth
ZOI = Zone around the isolate with no tester growth
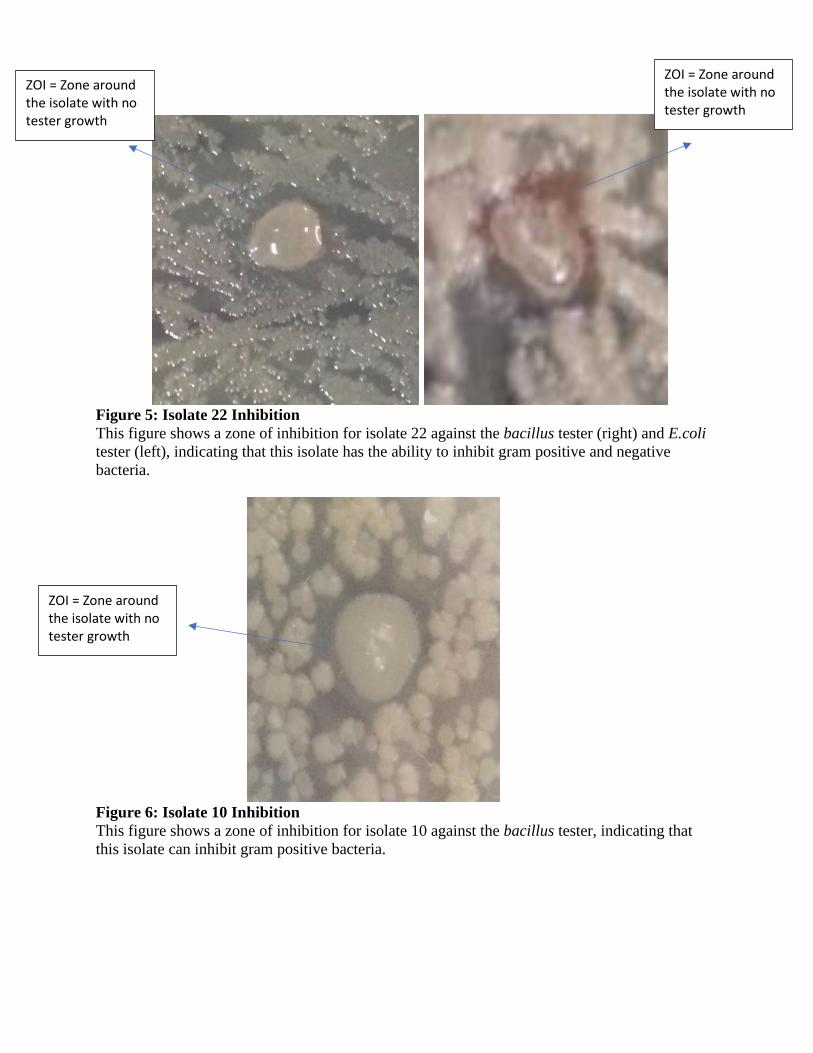
Figure 5: Isolate 22 Inhibition
This figure shows a zone of inhibition for isolate 22 against the bacillus tester (right) and E.coli
tester (left), indicating that this isolate has the ability to inhibit gram positive and negative
bacteria.
Figure 6: Isolate 10 Inhibition
This figure shows a zone of inhibition for isolate 10 against the bacillus tester, indicating that
this isolate can inhibit gram positive bacteria.
ZOI = Zone around the isolate with no tester growth
ZOI = Zone around the isolate with no tester growth
ZOI = Zone around the isolate with no tester growth
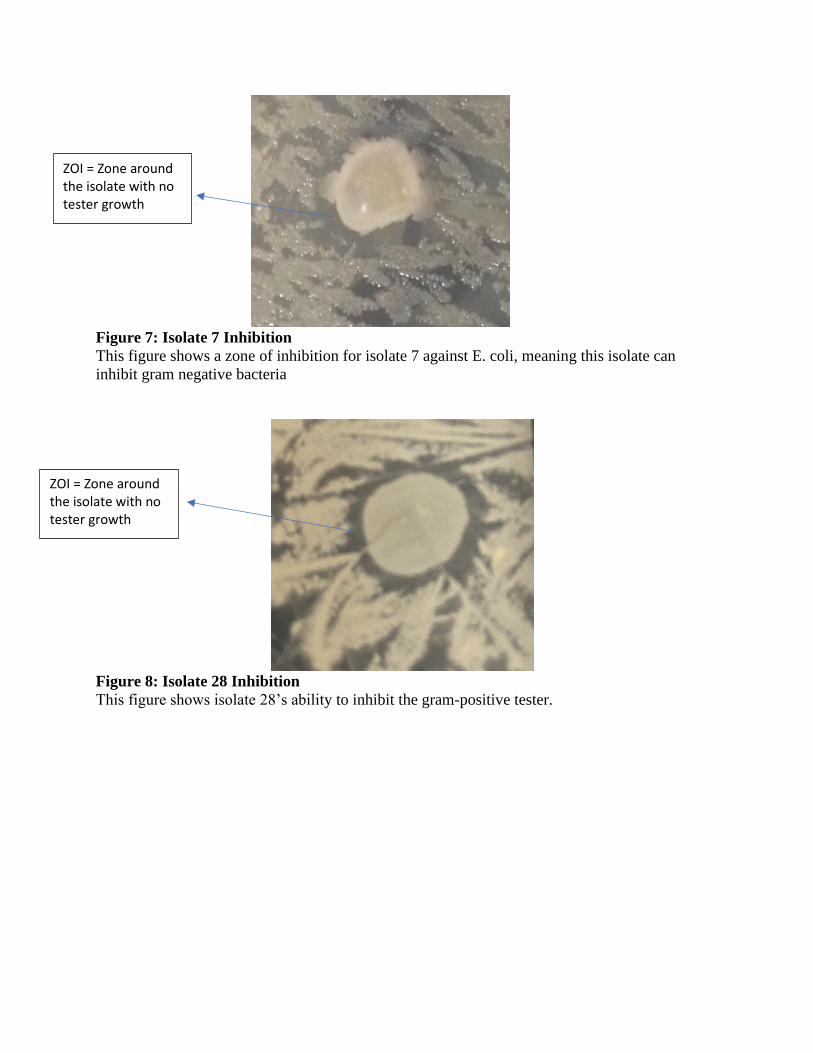
Figure 7: Isolate 7 Inhibition
This figure shows a zone of inhibition for isolate 7 against E. coli, meaning this isolate can
inhibit gram negative bacteria
Figure 8: Isolate 28 Inhibition
This figure shows isolate 28’s ability to inhibit the gram-positive tester.
ZOI = Zone around the isolate with no tester growth
ZOI = Zone around the isolate with no tester growth

Figure 9: Negative Control
This figure shows two bacteria that were known to be unable to inhibit the growth of the tester
strains (E.coli on the left, Bacillus on the right). No ZOI can be seen
Section 2: Extraction of Antibiotic from Producer
After it had been shown that six of our bacterial isolates were still able to grow viable
cultures and produce secondary metabolites that inhibited the growth of tester bacteria, the next
stage of our project entailed extracting these metabolites from their bacterial producer. The goal
of this stage was to obtain a pure organic extract containing the antibiotic which could then be
used in subsequent identification procedures like HPLC, TLC, and GC/MS.
Extractions were attempted with four different solvents: methanol, acetone, chloroform,
and ethyl acetate, and the success tested with a filter disk assay or patch assay (Hernadez, et al,
2015). As figure 10 shows, methanol, acetone, and chloroform extractions were unsuccessful
(success was defined as the pure extract having a lager ZOI than the solvent negative control).
When methanol or acetone was used the bacteria were not completely killed, even after the
extract had been filtered with a stereological filter. This made it impossible to tell if any
inhibition came from antibiotics in the extract, or antibiotics produced from the bacterial cells in

the extract. Chloroform had the opposite problem. It was so harsh; it killed the tester bacteria.
This resulted in a large ZOI for our negative control and made it hard to tell if any observed
ZOI’s were due to antibiotic presence, or simply the solvent itself.
Figure 10: Methanol Acetone and Chloroform Extractions
This figure shows an unsuccessful extraction with methanol (left), acetone (center) and
chloroform (right). Bacterial growth was still noted even after the extraction procedure with
methanol and acetone. Chloroform killed the tester bacteria, making it impossible to know if
antibiotics had been extracted (Control is bottom, extract is top—both have ZOI’s, but no
difference can be seen.)
The fourth solvent tried was ethyl acetate. This solvent was deemed suitable because it
was able to kill the bacteria during the extraction but did not harm the tester bacteria in the
negative control. Using this solvent, four of the six isolates that showed antibiotic production
were able to have their antibiotics successfully extracted from the producer colony. Success was
determined by the extract’s ability to inhibit the growth of tester bacteria in a filter disk assay.
Since the EA negative control had no ZOI for either tester bacteria strain, it was assumed that
antibiotics were present in any extract that inhibited the growth of tester bacteria. Note that the
EA E.coli control is present in figure 11, and the EA Bacillus control is present in the individual
results figures (Hernadez, et al, 2015).

Figure 11: Ethyl Acetate Negative Control
This figure shows the negative control for the filter disk assay where the disk was soaked in just
ethyl acetate. No ZOI can be seen.
Isolate 4
Figure 12 shows the extraction results for isolate 4. The filter disk assay shows that the
extract of this isolate was able to successfully inhibit both gram negative E. coli and gram-
positive Bacillus, just as the isolate was able to in figure 3. This means that the antibiotic being
produced by the colony in figure 5 has likely been successfully separated from the colony and is
present in the extract.
Figure 12: Organic Extraction Results for Isolate 4
This figure shows the results of the filter disk assay used to determine if antibiotics had been
successfully extracted from producer colony 4. E. coli test is on the left, Bacillus test with a
control (bottom disk) is on the right.
ZOI = Zone around the isolate with no tester growth
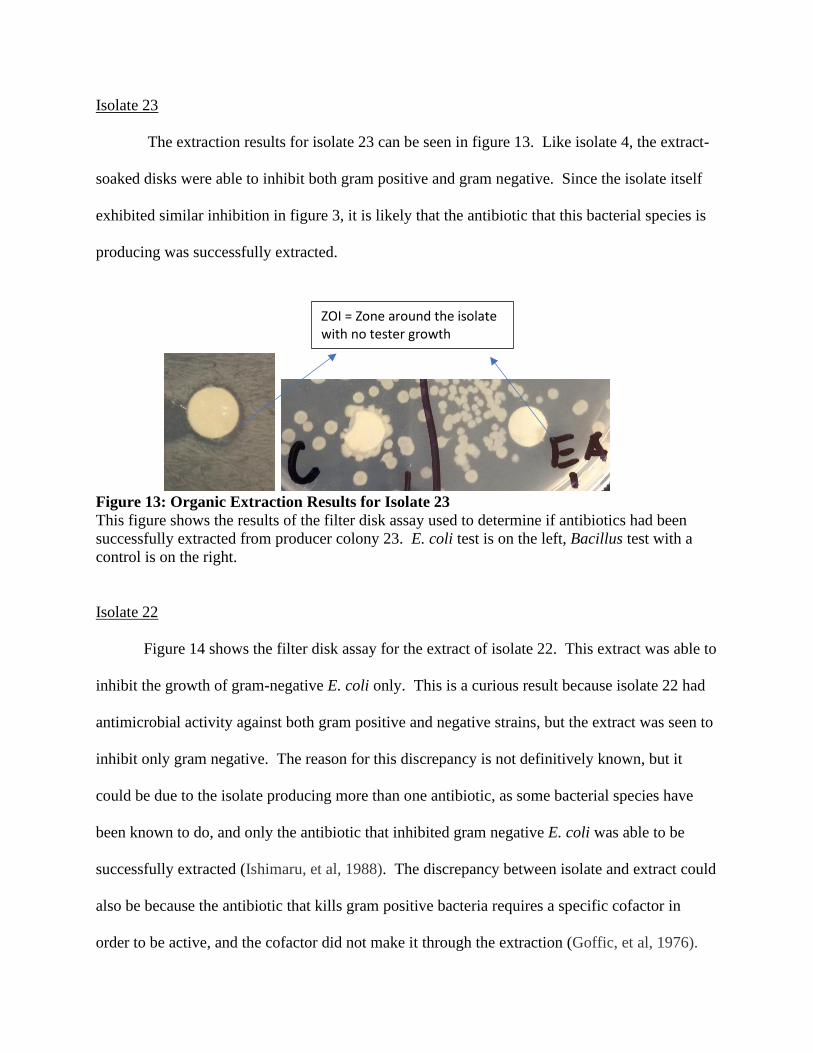
Isolate 23
The extraction results for isolate 23 can be seen in figure 13. Like isolate 4, the extract-
soaked disks were able to inhibit both gram positive and gram negative. Since the isolate itself
exhibited similar inhibition in figure 3, it is likely that the antibiotic that this bacterial species is
producing was successfully extracted.
Figure 13: Organic Extraction Results for Isolate 23
This figure shows the results of the filter disk assay used to determine if antibiotics had been
successfully extracted from producer colony 23. E. coli test is on the left, Bacillus test with a
control is on the right.
Isolate 22
Figure 14 shows the filter disk assay for the extract of isolate 22. This extract was able to
inhibit the growth of gram-negative E. coli only. This is a curious result because isolate 22 had
antimicrobial activity against both gram positive and negative strains, but the extract was seen to
inhibit only gram negative. The reason for this discrepancy is not definitively known, but it
could be due to the isolate producing more than one antibiotic, as some bacterial species have
been known to do, and only the antibiotic that inhibited gram negative E. coli was able to be
successfully extracted (Ishimaru, et al, 1988). The discrepancy between isolate and extract could
also be because the antibiotic that kills gram positive bacteria requires a specific cofactor in
order to be active, and the cofactor did not make it through the extraction (Goffic, et al, 1976).
ZOI = Zone around the isolate with no tester growth

Figure 14: Organic Extraction Results for Isolate 22
This figure shows the results of the filter disk assay used to determine if antibiotics had been
successfully extracted from producer colony 22 that could inhibit E. coli.
Isolate 10
Finally, figure 15 shows that the extract from isolate 10 was able to inhibit the gram-
positive tester strain. As the isolate itself inhibited only gram-positive bacteria in the figure 4
patch test, it is likely that the antibiotic this bacterial species is producing was successfully
extracted, because the extract has similar inhibition behavior to the colony it came from.
Figure 15: Organic Extraction Results for Isolate 10
This figure shows the results of the filter disk assay used to determine if antibiotics had been
successfully extracted from producer colony 10 that could inhibit Bacillus. The negative control
is on the bottom left.
The results of these extractions allow us to conclude that for four of the six isolates (28
and 7 were never able to be successfully extracted from) antibiotics were able to be extracted
from the producer colony. This gives us an antibiotic containing solution that can be used in
ZOI = Zone around the isolate with no tester growth
ZOI = Zone around the isolate with no tester growth

analytical tests to try and uncover the structure and characteristics of the antibiotics our bacteria
are producing.
Section 3: Thin Layer Chromatography
The first analytical procedure done was Thin Layer chromatography (TLC). The goal of
this method was to observe how the antibiotics in our extract traveled in specific mobile phases.
This information could then be compared to the results of antibiotic standards (15 common
antibiotics) run through the same procedure by Dr. Rick Wobbe (Wobbe, 2015). If our antibiotic
extract had similar Rf values as any of the standards, then they likely interacted with the mobile
and stationary phases the same way the standard antibiotic did. This means it is likely that the
antibiotic we isolated from our producers has similar structural features to the standards it shared
Rf values with, as they behaved the same way in specific solvents. Thus, doing TLC and
comparing the results to the standards can allow us to determine broad structural features of the
antibiotics our bacteria produce (Wobbe, 2015). These structural features will give us guidance
when investigating potential producer species and making a final determination on antibiotic
identity based on that species (section 3.5 and 3.6).
TLC was performed 60 total times with 12 different solvents as described in the methods.
Figure 16 shows an example of the TLC plates for two specific solvents. Upon visualization
with 365 nm UV light, the distance the band traveled with respect to the solvent was used to
calculate the Rf value (Rf = Distance band/Distance solvent). This number represents how the
compound interacts with the solvent and stationary phase, and similar Rf’s mean similar
interaction. Plates like those seen in figure 13 were obtained for all four isolates with 12

different solvents. The EA control was also run for all 12 solvents, and was never illumined at
365 nm, so any band on an extract plate was assumed to be the extract antibiotic (Wobbe, 2015).
Figure 16: TLC result example
This figure shows two examples of the TLC Plates after the mobile solvent phase (1-
BuOH:EtOH:H20 on the right and 1-BuOH:HAc:H20 on the left) had been allowed to run up the
plate. Extract 23 had a clear band that ran closely with the solvent (Rf value close to 1) when
illuminated with the 365nm UV light. Plates such as these were obtained for each of the four
extracts and EA control for all 12 solvents, and can be viewed in the appendix
To provide proof that the bands seen on the TLC plate were indeed the antibiotic and not
some other organic cellular extract, a fractionation test was done. This was performed by
excising the portion of the TLC plate that had the compound band on it and placing it on a streak
plate of tester bacteria. If the visualized compound was indeed antibiotic, it would sink into the
agar and inhibit the growth of the tester bacteria. Thus, if there was reduced bacterial growth on
the area that the plate had been put down, it is evidence that the compounds visualized on the
TLC plate were indeed the extracted antibiotics (Buckholt, 2019). As figure 17 shows, fractions
from extracts 23, and 4 were able to have partial inhibition of E. coli growth compared to the
control. The inhibition seen was less than that seen from the pure extract or colony likely due to
the fraction having very low concentration of antibiotic. Isolate 10 and 4’s fraction did not
inhibit the E. coli. This was expected for 10 because this isolate’s colony and extract only
inhibited gram-positive bacteria. The fraction from isolate 4’s inability to inhibit E. coli was
Extract Band

interesting, because both the extract and isolate inhibited this bacterium, but this could be due to
the antibiotic not being present on the TLC plate in high enough concentration to kill the
bacteria. Unfortunately, the gram-positive bacillus tester bacteria did not grow thick enough
cultures for this experiment to be run with it.
Figure 17: TLC Fractionation Test
This figure shows the results of the fractionation test. On the right is the plate with all four isolates with
the visible squares of partial inhibition in the top corner being isolates 4 and 23. Left is the TLC plate
with the isolate 23 band on it that demonstrated a ZOI without removing the paper
Once we had shown that the bands present were likely antibiotics using fractionation, we
proceeded to run TLC for all extracts with the 12 different solvents. Rf values were obtained for
each run and can be seen in table 7. Once we had obtained the different Rf values, we could
compare the results of our extracts to the antibiotic standard Rf values published by Rick Wobbe.
Since we followed the exact same procedure Dr. Wobbe did, we were able to see what antibiotic
standards had similar Rf values, and hence similar structure, as our extracted antibiotics. A
summarization of these comparisons can be seen in table 8 (Wobbe, 2015).
23 22 4 10
Solvent Rf Rf Rf Rf
CHCl3 .6 .02 None None
1-BuOH:EtOH:H20 (4:1:5) .95 .98 .98 None
1-BuOH:NaOH:H20 (4:1:5) .87 .84 None .8
Ethyl Acetate (EA) None .06 .96 None
EA:EtOH (9:1) .97 .99 .96 None
1-BuOH:HAc:H20 (4:1:5) .98 .97 .97 .94

1-BuOH:HAc:H20 (4:.25:5) .99 .98 .95 None
1-PrOH:EtOH:H20 (4:.25:5) .15 None None None
1-PrOH:HAc:H20 (4:.25:5) .12 None None None
Saturated 1-BuOH None None None None
1-BuOH:HAc:H20 (4:.25:5) None .75 .98 None
1-BuOH:EtOH:H20 (4:.25:5) None .96 .80 None
Table 7: TLC Rf Values
This table shows the Rf values of our four extracts for 12 different solvents. Results were
viewed at 365nm, none means that no band was visualized at this wavelength. Highlighted
residues were done on silica gel plates instead of Whatman paper.
Isolate Antibiotic Similarity
23 Rifampin 5 solvents (42%)
22 Erythromycin 6 solvents (50%)
4 Rifampin 4 solvents (33%)
10 N/A N/A
Table 8: Similarity Summary
This table shows which antibiotic standards had similar Rf values as our isolates and for how
many solvents of the 12 the Rf values were similar (percent of total solvents run there was
similarity for).
Table 8 shows that isolates 23 and 4 had similar Rf values as rifampin (figure 18) for five
and four of the solvents respectively. This means that our isolated antibiotic could have
structural similarities to this antibiotic, including aromatic structure, large oxygen content, and
nitrogen containing rings. Isolate 22 had similar Rf values as erythromycin (figure 19) for six
solvents, meaning that the isolate antibiotic could share structural features like a large alcohol
and ether content, and low nitrogen content (Millipore Sigma, 2019).
Figure 18: Rifampicin Structure (Millipore Sigma, 2019) Figure 19: Erythromycin Structure (Millipore Sigma, 2019)

Isolate 10 had interesting TLC results, that were not what was expected. Figures 6 and
15 show that the isolate and extract inhibited tester bacteria. However, table 7 shows that the
compound in the extract was not visible in many of the TLC trials run. This happened a few
times for the other isolates, but none of them came close to being visualized as sparingly as 10
was. A couple explanations exist for these puzzling results. First, it is not out of the question
that the secondary metabolite produced had vastly different structural characteristics than the
standards Dr. Wobbe used. This would have resulted in the compound not being illuminated at
the wavelength that the standards were illuminated at. It is also possible that the concentration of
antibiotic in the extract was too low to show up on TLC consistently, even after repeated
evaporation of the EA solvent. Figure 12 shows lighter inhibition for this extract than others,
lending support to this explanation.
Overall, TLC allowed us to determine likely structural characteristics for three of our four
extracted antibiotics. These characteristics can be used in the literature review of our sequencing
and GC/MS results (section 3.5 and 3.6), to see if any of the antibiotics our bacteria (or species
closely related to them) are known to produce have similar structural characteristics to the ones
we identified our extracted antibiotics as having. If this is the case it provides strong evidence
for antibiotic identity.
Section 4: High Performance Liquid Chromatography
The second analytical procedure done on the antibiotic extracts was High Performance
Liquid Chromatography (HPLC). The goal was the same as TLC; we had hoped to use HPLC to
uncover structural features of our antibiotics that could aid in identification. All four isolate

extracts were separated by the HPLC instrument and visualized at four different wavelengths of
UV light—246 nm, 273 nm, 285 nm, and 330 nm (Wobbe 2015). Figures 20-22 show the
resulting traces of isolates 4, 23, and 22. Isolate 10’s trace and the EA control were
unfortunately wiped from the computer when the system malfunctioned. On the traces we did
have, a pattern was seen throughout them. Ethyl Acetate was the largest and broadest peak that
eluted around 5-5.5 minutes depending on the wavelength of visualization. A series of smaller
peaks were present in all traces clumping in the 1-4-minute range and having varying strengths.
Isolate 22 also had a small peak at minute 50 in the 246 nm wavelength visualization. Figure 23
shows the result of the fractionation test for the peak at 4.019 minutes in isolate 23. The black
circles represent where the fractions were spotted in the LB plates, and no tester bacteria grew in
these locations. This means that the compound that eluted at 4.019 minutes has antimicrobial
activity that matches what the isolate and extract had and could be the antibiotic this isolate is
producing. Unfortunately, due to time constraints and technical issues with the instrument, only
this one peak from 23 was able to be analyzed this way.
Unfortunately, these results were not of great use. While they did prove that compounds
other than the EA solvent were present in our extract, the traces did not closely match any of the
antibiotic standards we compared them too (Harrington, et al, 2017). This meant that no
significant structural comparisons could be made about our antibiotics from this procedure, and
identification must proceed with information gained from other analytical methods. The
antibiotics standards used came from a previous MQP that was done using the same HPLC
instrument and a very similar procedure, but as noted our results did not resemble theirs. Their
traces had numerous peaks well past the EA solvent peak, while we saw this only on one trace
for one wavelength. This discrepancy could be due to two reasons. One, it is likely that we have

different antibiotics in our extract than the other team, and as such our elution profiles would not
share peaks. The difference in traces (mainly our lack of high elution time peaks) could also be
due to our extracts having too low an antibiotic concentration. This could be fixed in future
experiments by evaporating the solvent and re-dissolving the extract (Harrington, et al, 2017).
Figure 20: Isolate 4 HPLC
This figure shows the chromatogram from the HPLC of isolate 4’s extract. Elution time is
shown on the x- axis (minutes) and the y-axis represents the intensity of absorbance in mAU
(milli-absorbance units). Wavelength of each graph is shown at the top after Sig=.

Figure 21: Isolate 23 HPLC
This figure shows the chromatogram from the HPLC of isolate 23’s extract. Elution time is
shown on the x- axis (minutes) and the y-axis represents the intensity of absorbance in mAU
(milli-absorbance units). Wavelength of each graph is shown at the top after Sig=.

Figure 22: Isolate 22 HPLC
This figure shows the chromatogram from the HPLC of isolate 22’s extract. Elution time is
shown on the x- axis (minutes) and the y-axis represents the intensity of absorbance in mAU
(milli-absorbance units). Wavelength of each graph is shown at the top after Sig=.

Figure 23: HPLC Fractionation
This figure shows the results of the fractionation test run for the peak in extract 23 that eluted at
4.019 minutes. Clear zones of inhibition can be seen where the fraction was plated (black
circles) against both E. coli (left) and Bacillus (right) tester strains.
Section 5: Gas Chromatography/Mass Spectrometry
The final analytical procedure done was GC/MS, with the goal being to identify structural
features of our antibiotic that can aid in identification. In addition, MS allowed molecular
weight determination of the different compounds in our antibiotic extracts. The extracts were
run through the GC/MS instrument and figure 24 shows the GC trace obtained for each, with
each peak representing a compound that eluted at a different time, and the height of the peak
corresponding to the abundance of the compound. The trace in and of itself was not useful for
identification, because unlike HPLC/TLC we had no antibiotic GC standards to compare our
results to. However, we were able to use the mass spec analysis to determine key information
about the content of our extracts. MS attempted to calculate the molecular weight of our

compounds and identify them based on their behavior in the GC column. While none of the
compounds identified by MS had greater than the 95% similarity to the extract compounds that
was needed to be sure of identity, the percent similarities were high enough that we could use the
results to get general structural information and molecular weight estimates about the compounds
in our extracts (Brodeur, 2019).
Panel A: GC trace for isolate 10 Panel B: GC trace for isolate 22
Panel C: GC trace for isolate 23 Panel D: GC trace for isolate 4
Figure 24: GC traces for the four isolate extracts.
This figure shows the GC traces for isolates 10, 22, 23, and 4 (panels A-D respectively). Traces
are plotted from with retention time (minutes) on the x axis and abundance on the y-axis

An example of this can be seen in table 9 where isolate 10 was seen to have a GC peak at
14.083 minutes that was identified as 1-H-Indole, 1-Methyl-2-Phenyl (MW=237 g/mol). While
the 83% similarity was not enough to state without doubt that this was the identity of the extract
compound, it does allow us to conclude that this compound in extract 10 has a similar molecular
weight (it eluted at the same time as 1-H-Indole, 1-Methyl-2-Phenyl in the GC) and similar
general structural features as the MS identified compound (Brodeur, 2019).
Tables 9 through 12 present the GC/MS results and state the molecular weights and
structural features our extract compounds are likely to have based on the GC/MS analysis.
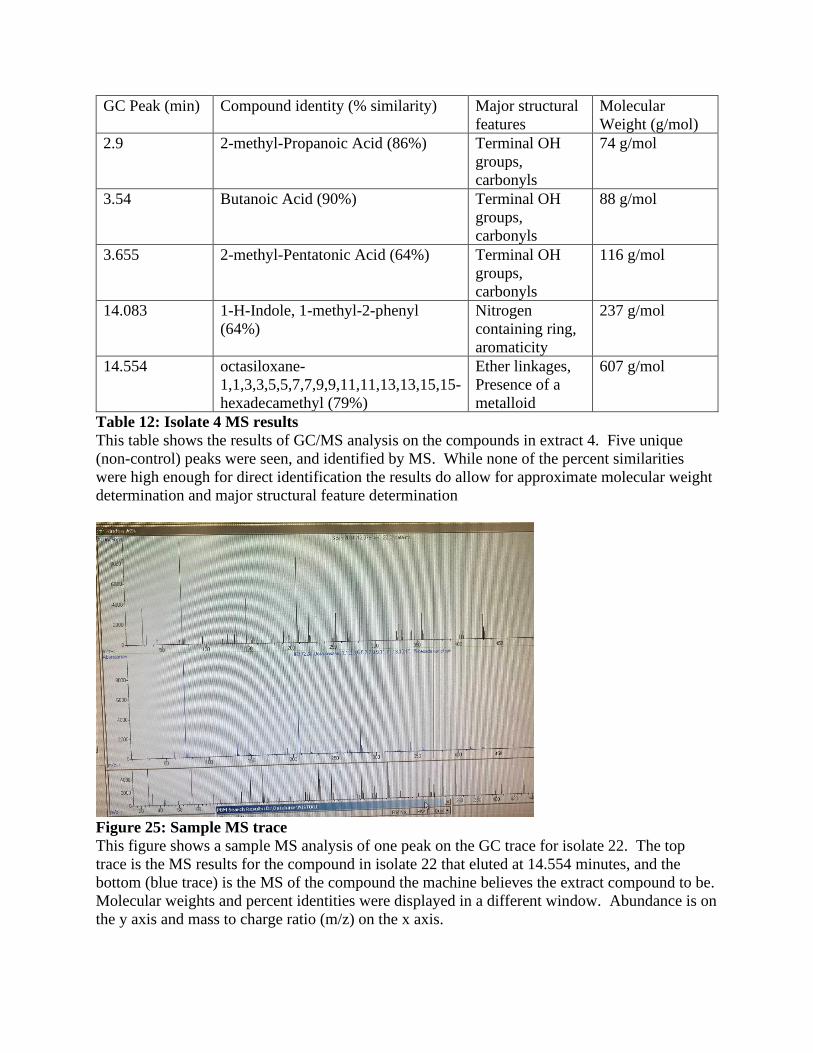
Figure 25 shows an example MS trace for an extract compound in extract 22, with the rest of the
MS traces being presented in the appendix. Note the control EA GC trace shown in figure 26.
This trace had major peaks at 1.2, 1.35, 1.85, 2.1, and 2.3 minutes, and as such any peak on an
extract that differed from these values was assumed to be a compound unique to the extract and
potentially the antibiotic.
GC Peak (min) Compound identity (%
similarity)
Major structural
features
Molecular Weight
(g/mol)
2.875 2-methyl-propanoic acid
(88%)
Terminal OH
groups, carbonyls
88 g/mol
3.6 3-mehtyl-butanoic acid (90%) Terminal OH
groups, carbonyls
102 g/mol
14.083 1-H-Indole, 1-methyl-2-phenyl
(83%)
Nitrogen
containing ring,
aromaticity
237 g/mol
14.554 Heptasiloxane-
1,1,3,3,5,5,7,7,9,9,11,11,13,13-
tetradecamethyl (72%)
Ether linkages,
Presence of a
metalloid
577.2 g/mol
Table 9: Isolate 10 MS results
This table shows the results of GC/MS analysis on the compounds in extract 10. Four unique
(non-control) peaks were seen, and identified by MS. While none of the percent similarities
were high enough for direct identification the results do allow for approximate molecular weight
determination and major structural feature determination

GC Peak (min) Compound identity (% similarity) Major structural
features
Molecular
Weight (g/mol)
1.117 1,3-bis(3-phenoxyphenoxy) (78%) Phenol groups,
aromatic ether
linkages
446.5 g/mol
3.54 Butanoic Acid (92%) Terminal OH
groups,
carbonyls
88 g/mol
3.655 Hexanoic Acid (86%) Terminal OH
groups,
carbonyls
116 g/mol
14.554 octasiloxane-
1,1,3,3,5,5,7,7,9,9,11,11,13,13,15,15-
hexadecamethyl (72%)
Ether linkages,
Presence of a
metalloid
607 g/mol
Table 10: Isolate 22 MS results
This table shows the results of GC/MS analysis on the compounds in extract 22. Four unique
(non-control) peaks were seen, and identified by MS. While none of the percent similarities
were high enough for direct identification the results do allow for approximate molecular weight
determination and major structural feature determination
GC Peak (min) Compound identity (% similarity) Major structural
features
Molecular
Weight (g/mol)
2.259 Di-n-propyl ether (91%) Ether linkages 102 g/mol
3.54 Butanoic Acid (83%) Terminal OH
groups,
carbonyls
88 g/mol
3.65 Hexanoic Acid (88%) Terminal OH
groups,
carbonyls
116 g/mol
Table 11: Isolate 23 MS results
This table shows the results of GC/MS analysis on the compounds in extract 22. Three unique
(non-control) peaks were seen, and identified by MS. While none of the percent similarities
were high enough for direct identification the results do allow for approximate molecular weight
determination and major structural feature determination
GC Peak (min) Compound identity (% similarity) Major structural
features
Molecular
Weight (g/mol)
2.9 2-methyl-Propanoic Acid (86%) Terminal OH
groups,
carbonyls
74 g/mol
3.54 Butanoic Acid (90%) Terminal OH
groups,
carbonyls
88 g/mol
3.655 2-methyl-Pentatonic Acid (64%)
Terminal OH
groups,
carbonyls
116 g/mol
14.083 1-H-Indole, 1-methyl-2-phenyl
(64%)
Nitrogen
containing ring,
aromaticity
237 g/mol
14.554 octasiloxane-
1,1,3,3,5,5,7,7,9,9,11,11,13,13,15,15-
hexadecamethyl (79%)
Ether linkages,
Presence of a
metalloid
607 g/mol
Table 12: Isolate 4 MS results
This table shows the results of GC/MS analysis on the compounds in extract 4. Five unique
(non-control) peaks were seen, and identified by MS. While none of the percent similarities
were high enough for direct identification the results do allow for approximate molecular weight
determination and major structural feature determination
Figure 25: Sample MS trace
This figure shows a sample MS analysis of one peak on the GC trace for isolate 22. The top
trace is the MS results for the compound in isolate 22 that eluted at 14.554 minutes, and the
bottom (blue trace) is the MS of the compound the machine believes the extract compound to be.
Molecular weights and percent identities were displayed in a different window. Abundance is on
the y axis and mass to charge ratio (m/z) on the x axis.

Figure 26: GC control trace
This figure shows the GC trace from a control run with just ethyl acetate. Prominent peaks were
seen at 1.2, 1.35, 1.85, 2.1, and 2.3 minutes, with the large peak between 1.8 and 2 being ethyl
acetate. These peaks were ignored in the experimental traces.
We now have structural characteristics about our antibiotics from three analytical
procedures and probable molecular weights of the compounds in our extracts. This allows us to
begin to narrow down antibiotic possibilities for our producers. This was done by going one by
one through a database of almost 400 antibiotics and searching for those that matched up with
compounds in our extracts in terms of molecular weight, structural features and bactericidal
ability (Millipore Sigma, 2019).
The antibiotic 5-Azatcytide, whose structure can be seen in figure 27, closely matched a
compound in the isolate 4 extract. This antibiotic had a molecular weight of 244.2 g/mol, which
is only 7 g/mol away from the GC estimate for the compound in extract four that eluted at 14.083
minutes. This antibiotic also contains a nitrogen ring, aromaticity, terminal alcohol’s and a
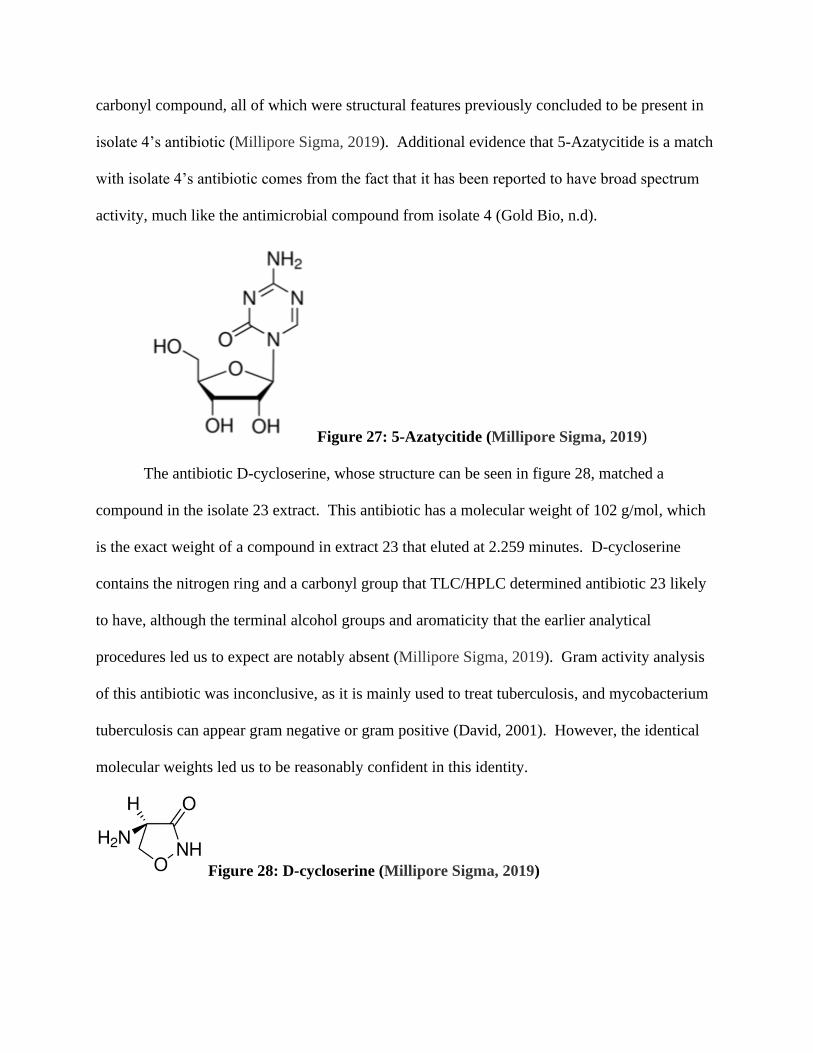
carbonyl compound, all of which were structural features previously concluded to be present in
isolate 4’s antibiotic (Millipore Sigma, 2019). Additional evidence that 5-Azatycitide is a match
with isolate 4’s antibiotic comes from the fact that it has been reported to have broad spectrum
activity, much like the antimicrobial compound from isolate 4 (Gold Bio, n.d).
Figure 27: 5-Azatycitide (Millipore Sigma, 2019)
The antibiotic D-cycloserine, whose structure can be seen in figure 28, matched a
compound in the isolate 23 extract. This antibiotic has a molecular weight of 102 g/mol, which
is the exact weight of a compound in extract 23 that eluted at 2.259 minutes. D-cycloserine
contains the nitrogen ring and a carbonyl group that TLC/HPLC determined antibiotic 23 likely
to have, although the terminal alcohol groups and aromaticity that the earlier analytical
procedures led us to expect are notably absent (Millipore Sigma, 2019). Gram activity analysis
of this antibiotic was inconclusive, as it is mainly used to treat tuberculosis, and mycobacterium
tuberculosis can appear gram negative or gram positive (David, 2001). However, the identical
molecular weights led us to be reasonably confident in this identity.
Figure 28: D-cycloserine (Millipore Sigma, 2019)

The antibiotic Amikacin Hydrate, whose structure can be seen in figure 29, closely
matched a compound in the isolate 10 extract. With a molecular weight of 585.6 g/mole, this
antibiotic was only 8.4 g/mol away from the GC estimate for a compound in extract 10 that
eluted at 14.554 minutes. While structural data is limited for isolate 10 due to its failures in TLC
and HPLC, amikacin hydrate did have the ether linkages the MS analysis suggested the 14.554-
minute compound would have (Millipore Sigma, 2019). The main detractor for this antibiotic is
the fact that it has been reported to have only limited activity against gram positive organisms,
while isolate 10 was only observed to inhibit the gram-positive tester (Schiffman, 1977). While
this is concerning, limited is not none, and it is not out of the question that this antibiotic is able
to kill the bacillus tester even though we were unable to find evidence in the literature of this
antibiotic killing bacterial genus.
Figure 29: Amikacin Hydrate (Millipore Sigma, 2019)
The antibiotics Neomycin, Paromomycin, and Ribostamycin, whose structures can be
seen in figures 30-32, matched a compound in the isolate 22 extract. Neomycin had a molecular
weight of 614 g/mol, which is only 7 g/mol away from the GC/MS estimate for the compound in
extract 22 that eluted at 14.554 minutes. Neomycin has the oxygen containing rings and ether
linkages the HPLC/TLC analysis suggested 22’s antibiotic would have, although it does contain
a higher nitrogen content than those procedures had predicted 22’s antibiotic would have.

Paromomycin had a molecular weight of 615 g/mol, only 8 g/mol off the GC/MS estimate for the
14.554-minute compound. It too has the oxygen containing rings and ether linkages the
HPLC/TLC analysis suggested 22’s antibiotic would have, but like neomycin, it does have a
higher nitrogen content than those procedures had predicted for isolate 22’s antibiotic.
Ribostamycin had a molecular weight of 454.47, only 8 g/mol off the GC/MS estimate for the
compound that eluted at 1.117 minutes. Ribostamycin contains the ether linkages and oxygen
containing rings that the antibiotic was predicated to have in TLC/HPLC but has a higher
nitrogen content with numerous terminal amino groups in its structure (Millipore Sigma, 2019).
All three of these antibiotics had broad spectrum activity like isolate 22 and its extract were seen
to have (Waksman, et al, 1950; Davidson, et al, 2009; Inouye, et al, 1989). While we are unable
to decisively conclude an antibiotic identity for 22 from between these three, they are all
macrolides, meaning that the antibiotic produced from isolate 22 likely belongs to this class
(Millipore Sigma, 2019).
Figure 30: Neomycin (Millipore Sigma, 2019) Figure 31: Paromomycin (Millipore Sigma, 2019) Figure 32: Ribostamycin (Millipore Sigma, 2019)
Overall, GC/MS was a powerful tool that gave us additional structural information and
the approximate molecular weights of the compounds in our extracts. The molecular weights
were crucial pieces of information as they allowed us to search antibiotic databases and narrow
down possibilities for each isolate. By doing so we were able to obtain antibiotics (or a class of
antibiotics in the case of isolate 22) that matched the chemical and structural features of the
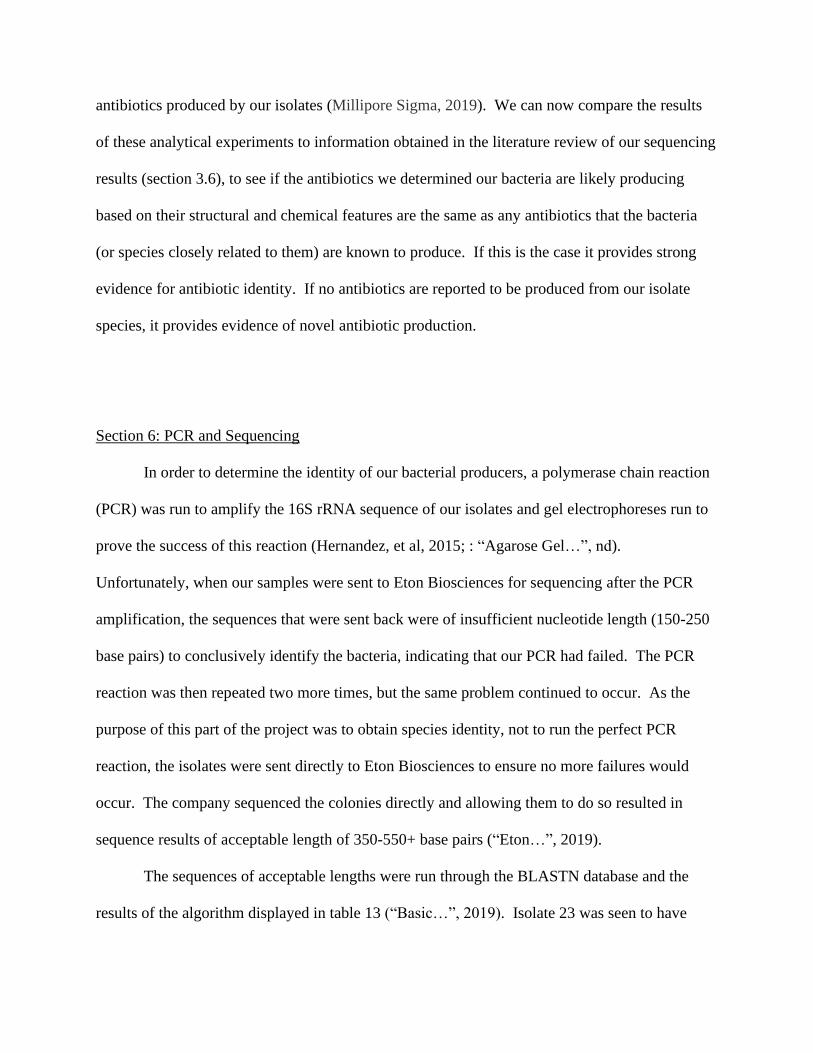
antibiotics produced by our isolates (Millipore Sigma, 2019). We can now compare the results
of these analytical experiments to information obtained in the literature review of our sequencing
results (section 3.6), to see if the antibiotics we determined our bacteria are likely producing
based on their structural and chemical features are the same as any antibiotics that the bacteria
(or species closely related to them) are known to produce. If this is the case it provides strong
evidence for antibiotic identity. If no antibiotics are reported to be produced from our isolate
species, it provides evidence of novel antibiotic production.
Section 6: PCR and Sequencing
In order to determine the identity of our bacterial producers, a polymerase chain reaction
(PCR) was run to amplify the 16S rRNA sequence of our isolates and gel electrophoreses run to
prove the success of this reaction (Hernandez, et al, 2015; : “Agarose Gel…”, nd).
Unfortunately, when our samples were sent to Eton Biosciences for sequencing after the PCR
amplification, the sequences that were sent back were of insufficient nucleotide length (150-250
base pairs) to conclusively identify the bacteria, indicating that our PCR had failed. The PCR
reaction was then repeated two more times, but the same problem continued to occur. As the
purpose of this part of the project was to obtain species identity, not to run the perfect PCR
reaction, the isolates were sent directly to Eton Biosciences to ensure no more failures would
occur. The company sequenced the colonies directly and allowing them to do so resulted in
sequence results of acceptable length of 350-550+ base pairs (“Eton…”, 2019).
The sequences of acceptable lengths were run through the BLASTN database and the
results of the algorithm displayed in table 13 (“Basic…”, 2019). Isolate 23 was seen to have

greater than 95% similarity to Sphaerochaeta Pleomorpha. While this is not high enough
similarity to say this is the exact species, the greater than 95% identity allows us to state with
confidence that isolate 23 belongs to the Sphaerochaeta genus. An extensive literature search
could not find any documented antibiotic production for this genus. This means that we may
have demonstrated the first instance of antimicrobial activity in the Sphaerochaeta genus. This
is an important discovery, because our analytical tests determined the antibiotic produced is
likely D-cycloserine, which is used to treat tuberculosis (“Cycloserine…”, 2016). This antibiotic
is normally produced by Streptomyces, and as such we may have uncovered a novel producer of
this clinically important antibiotic (Gottlieb and Shaw, 2012).
Isolate 4 was seen to have 100% similarity to Aminivibrio Pyurvatiphilus. Because the
percent identity is 100% and Aminivibrio Pyurvatiphilus is the only species in the Aminivibiro
genus, we are confident that isolate 4 is this species (Honda, et al, 2013). Our review of the
literature also found no documented antibiotic production for the Aminivibiro genus. Since this
genus only had one species, we extended our search out to the family level and saw that the
Synergistaceae family also had no reported instances of antimicrobial activity. While the genus
and family appear to be poorly studied, our project may have found the first instance of antibiotic
production by this family of bacteria (Jumas-Bilak and Marchandin, 2014). This is important
because our chemical testes determined the antibiotic isolate 4 was producing is likely 5-
Azacitidine, which has been clinically effective in treating non-lymphoblastic leukemia and has
documented but poorly characterized antimicrobial activity (Vujjini, et al, 2013; Muller and
Florek, 2009). This antibiotic has been documented to be produced by Streptoverticullum
Ladakanus, and as such we may have uncovered a new source of this anti-cancer drug (Vujjini,
et al, 2013).

Isolate 10 was seen to have greater than 93% similarity to Leptotrichia Buccalis. This
percent similarity is high enough to allow us to state that isolate 10 is likely a member of the
Leptotricha genus. Vijay Gundi and colleagues report that the Leptotricha genus has
antimicrobial activity against gram positive bacteria, just like isolate 10 and its extract were seen
to have. Unfortunately, the group did not pursue structural or chemical analysis of the
antimicrobial compound produced (Gundi, et al, 2004). Our results support this work by
demonstrating that a bacterium belonging to the genus Leptotricha can produce antibiotics that
inhibit gram positive bacteria. Our project also expands upon this work by demonstrating that
the antibiotic produced is likely amikacin hydrate, a derivative of the Streptomyces produced
kanamycin A (Sneader, 2005; Ramirez and Tolmasky, 2017). By showing that this derivative
(which is effective against a wide variety of infections) is likely produced by a bacterium in the
Leptotricha genus, we have demonstrated that at least one of the antibiotics produced by this
genus has clinical importance (Ramirez and Tolmasky, 2017).
Isolate 22 had 100% identity for several bacteria in the Gramella genus. The database
algorithm was not able to differentiate between the species, but the 100% identity for all of them
allows us to be confident that 22 belongs to the Gramella genus. While no documented
antibiotic production was found for the Gramella genus, Lyudmila Romanenko and colleagues
have shown that other genera of marine bacteria who have similar habitats to many Gramella
species do exhibit antimicrobial properties. However, this investigation was limited in that the
authors only tested the isolates against gram positive bacteria and never analyzed any
antimicrobial compounds produced for structural and chemical features (Romanenko, et al,
2013). This means that our work may have found the first documented instance of Gramella
antibiotic production. This is significant because the macrolide antibiotics we determined the

Gramella isolate to likely be producing are clinically effective against several pathogenic
bacteria (Satoshi, 2002).
Isolate (base pairs) Identity (% similarity)
4 (384) Aminivibrio pyruvatiphilus (100%)
10 (584) Leptotrichia buccalis (93.75%)
23 (534) Sphaerochaeta pleomorpha (95.45%)
22 (347) Gramella aquimixticola (100%)
Gramella lutea (100%)
Gramella sediminilitoris (100%)
Gramella aestuariivivens (100 %)
Table 13: Sequencing results and isolate identity
Table 13 shows the sequencing results and the BLASTN predicted identities of our four isolates.
Overall, PCR and sequencing allowed us to determine the identity of our isolates. This
was a crucial final piece of our puzzle as it allowed us to search established literature for
antimicrobial information about our isolates. We found that the Aminivibrio genus and
Sphaerochaeta genus isolates 4 and 23 respectively belong to have no documented antibiotic
production. This could mean that we have uncovered antimicrobial activity in these genera and
novel producers of 5-Azacitidine and D-cycloserine (the antibiotics our analytic testes
determined isolates 4 and 23 respectively to be producing). We also found that the Leptotricha
genus isolate 10 likely belongs to had documented antibiotic production. Our MQP was able to
support this work and expand on it by showing that a member of this genus produces a gram-
positive killing antibiotic that is likely amikacin hydrate (Gundi, et al, 2004). Finally, while no
documented antibiotic production was found for the Gramella genus isolate 22 is believed to be
a member of, we found that other genera of marine bacteria who have similar habitats to many
Gramella species do exhibit antimicrobial properties (Romanenko, et al, 2013). Our project
allowed us to expand upon this knowledge by documenting antibiotic production in the Gramella
genus and determining the antibiotics produced likely belong to the macrolide class.
While no literature search by two people can hope to be comprehensive, we believe that
our efforts were robust enough to support the conclusions stated above. All the genera that our
isolates belong to have very poorly characterized antimicrobial production if it has been
characterized at all. As such, this project is the first, or among the first, work to characterize the
antimicrobial activity of the bacteria in these genera down to the chemical and structural features
of the specific antibiotics produced.
Section 4: Concluding Remarks and Future Directions
This MQP has allowed us to take four different bacterial isolates from the BB2915
laboratory course and demonstrate their antimicrobial activities, determine their identity down to
the genus level, and use structural features and chemical properties to determine the type of
antibiotic likely being produced. A literature review then allowed us to put this information in
the context of any previously documented antibiotic production for that genus, or state that our
work was then only instance of antimicrobial activity for that genus that could be found. Table
14 provides a brief summary of the overall results and conclusions of this MQP. If this project
was going to be contented, the future directions would concentrate on doing additional analytical
procedures to ensure our determined antibiotic identities were the correct ones. This could
include IR spectroscopy, size exclusion chromatograph, or column chromatography among
others. Redoing the HPLC to get more complete and more useful results would also be of great

help. In addition to the information these analytical techniques would generate, the antibiotics
we believed our bacteria to be producing could be ordered and run as standards through the TLC
and GC/MS instruments. If they behaved the same way and gave the same results as the
antibiotics in our extracts, then that would be excellent evidence that our conclusions were
correct. As always, additional searching of the literature could be done to see if there was any
documented antibiotic production among our isolates that we missed.
Isolate Antimicrobial Activity Identity (Genus) Antibiotic
Produced
Documented
production in
the Literature
10 Kills Bacillus Subtilis (gram
positive)
Leptotricha Amikacin
Hydrate
Yes- but not
structural
investigation
23 Kills Bacillus Subtilis (gram
positive) and E. coli (gram
negative)
Sphaerochaeta D-cycloserine No
22 Kills Bacillus Subtilis (gram
positive) and E. coli (gram
negative)
Gramella Macrolide Class Yes- but not
structural
investigation
4 Kills Bacillus Subtilis (gram
positive) and E. coli (gram
negative)
Aminivibrio 5-Azacitidine No
Table 14: Overall MQP results
Table 14 displays our overall results and conclusions of this MQP including what the
antimicrobial activity of our isolates was, what genus they belonged to, and what type of
antibiotics they produce

Appendix and Supplemental Data
TLC plates for all solvents 1-BuOH:EtOH:H20 (4:1:5)
1-PrOH:EtOH:H20 (4:.25:5)

1-PrOH:HAc:H20 (4:.25:5)
1-BuOH:HAc:H2O (4:1:5)
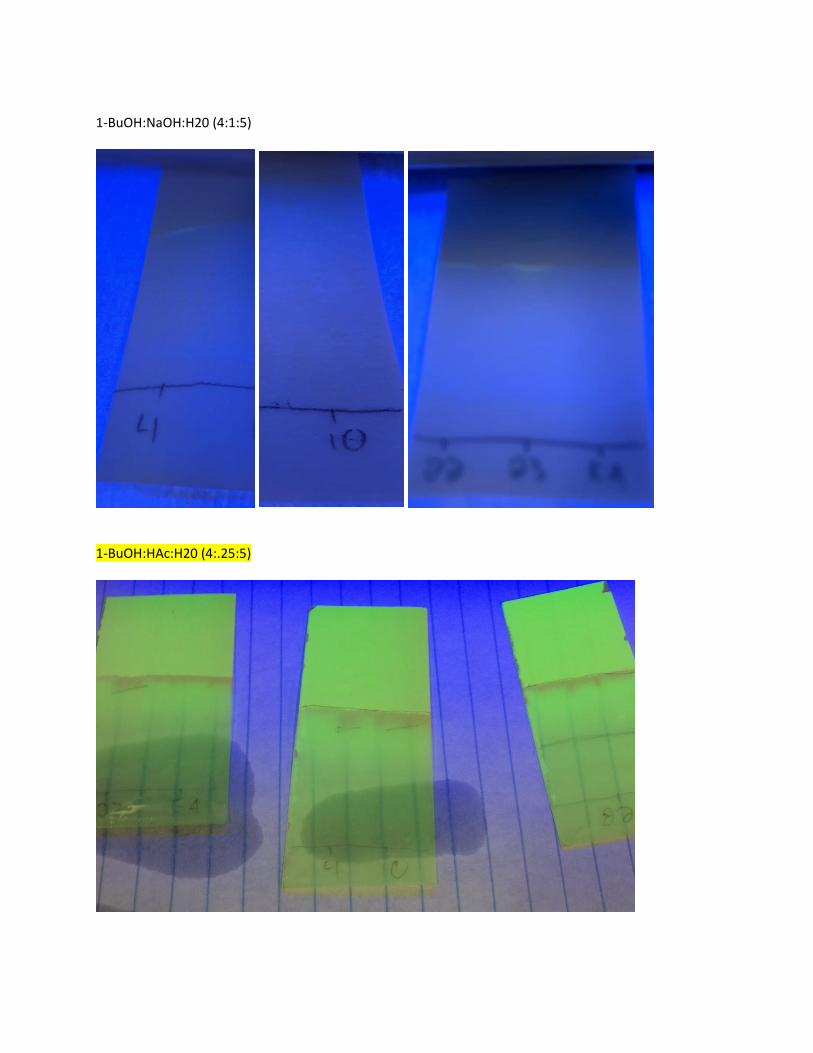
1-BuOH:NaOH:H20 (4:1:5)
1-BuOH:HAc:H20 (4:.25:5)

1-BuOH:EtOH:H20 (4:.25:5)
Saturated 1-BuOH

Ethyl Acetate (EA)
Note: The plate on the right was not labeled but contains 10 and the EA control. Neither was seen to have any bands on the plate. The dots on the right-hand plate correspond to the band position and the line is the solvent distance. Chloroform

Note: The unlabeled plate contained extract and was not seen to have any bands on the plate. The dots on the left-hand plate correspond to the band position and the line is the solvent distance. EA: EtOH (9:1)
1-BuOH:HAc:H2O (4:.25:5)

GC Traces and Mass spec analysis Isolate 23
Peak 3.34 minutes
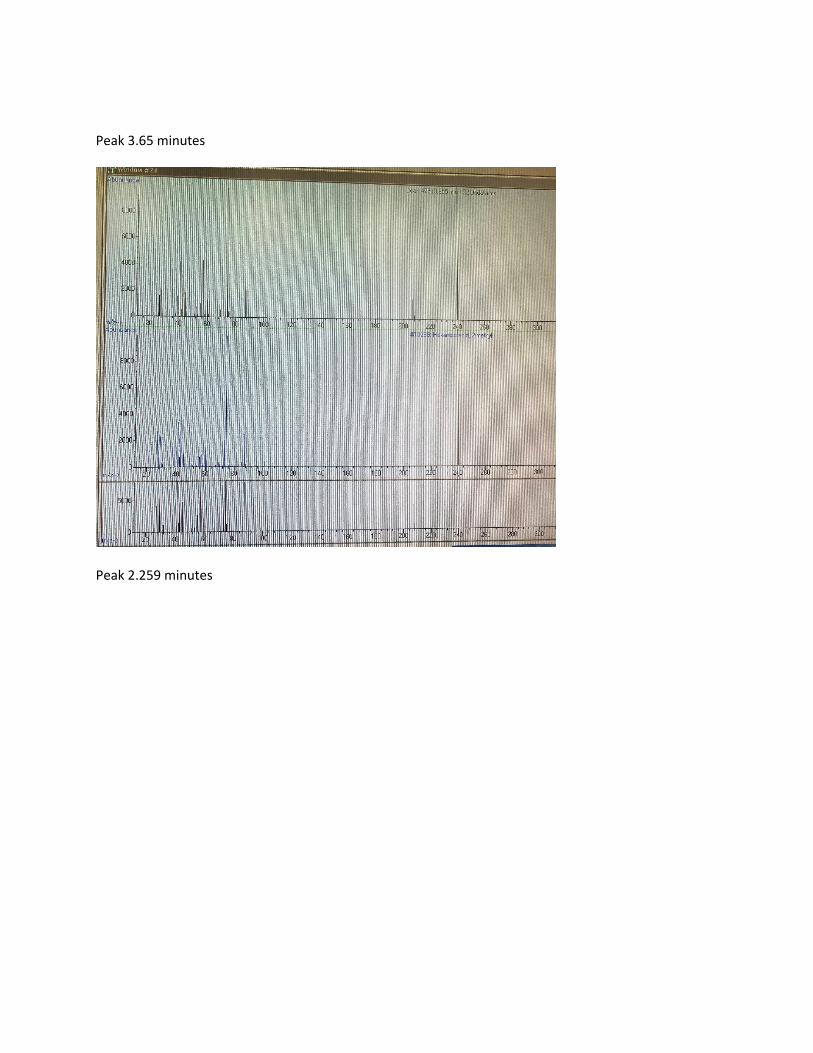
Peak 3.65 minutes
Peak 2.259 minutes

Isolate 22
Peak 1.117 minutes
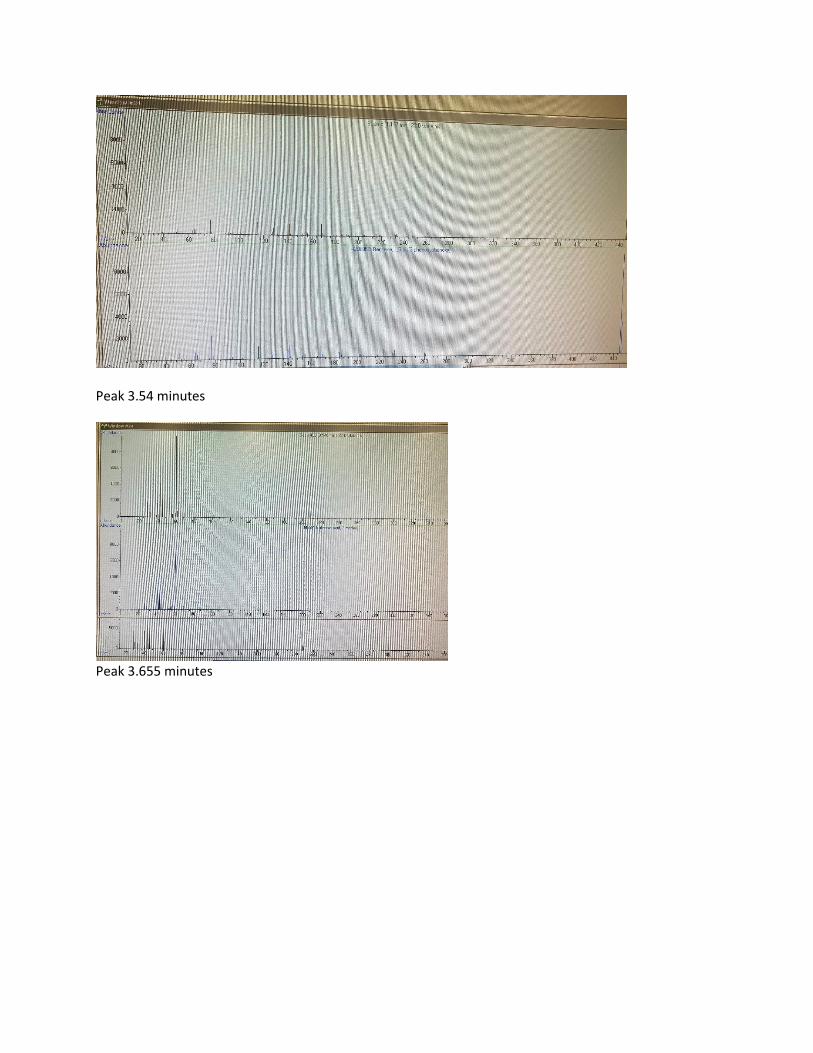
Peak 3.54 minutes
Peak 3.655 minutes

Peak 14.554 minutes
Isolate 10

Peak 2.975 minutes
Peak 3.6 minutes

Peak 14.083 minutes
Peak 14.554 minutes

Isolate 4
Peak 2.9 minutes

Peak 3.54 minutes
Peak 3.665 minutes

Peak 14.803 minutes
Peak 14.554 minutes


Works Cited
Azman, A., Barrett, J., Darragh, M., Esteb, J., Mcnulty, L., Morgan, P., … Wilson, A. (2013).
Adding Gas Chromatography-Mass Spectrometry Data to a Melting Point and Thin-Layer
Chromatography Laboratory. Journal of Chemical Education, 90(1), 140–141.
https://doi.org/10.1021/ed300490x
Basic Local Alignment Search Tool. (2019). National Center for Biotechnology Information.
Retrieved from https://blast.ncbi.nlm.nih.gov/Blast.cgi
Brodeur, Drew. (2019). Personal Communication
Buckholt, Mike. (2019). Personal Communication
Burmeister, A. R. (2015, July 29). Horizontal Gene Transfer. Retrieved from
https://www.ncbi.nlm.nih.gov/pmc/articles/PMC4536854/
Calderon CB, Sabundayo BP (2007). Antimicrobial Classifications: Drugs for Bugs. In Schwalbe R,
Steele-Moore L, Goodwin AC. Antimicrobial Susceptibility Testing Protocols. CRC Press.
Taylor & Frances group. ISBN 978-0-8247-4100-6
Cohen, J., Powderly, W. G., & Opal, S. M. (2017). Infectious diseases. Amsterdam: Elsevier.
"Cycloserine". The American Society of Health-System Pharmacists. 20 December 2016.
David, S. (2001). Synergic activity of D-cycloserine and beta-chloro-D-alanine against
Mycobacterium tuberculosis. Journal of Antimicrobial Chemotherapy, 47(2), 203–206. doi:
10.1093/jac/47.2.203
Davidson, R. N., Boer, M. den, & Ritmeijer, K. (2009). Paromomycin. Transactions of the Royal
Society of Tropical Medicine and Hygiene 103(7), 653-660.
Davies, J., & Davies, D. (2010, September 1). Origins and Evolution of Antibiotic Resistance.
Retrieved from https://mmbr.asm.org/content/74/3/417
Eton Biosciences . (2019). Retrieved from https://www.etonbio.com/ordering.php.
Fleming-Dutra, K. E., Hersh, A. L., Shapiro, D. J., Bartoces, M., Enns, E. A., File, T. M., … Hicks,
L. A. (2016, May 3). Prevalence of Inappropriate Antibiotic Prescriptions Among US
Ambulatory Care Visits, 2010-2011. Retrieved from
https://www.ncbi.nlm.nih.gov/pubmed/27139059
Goffic, F. L., Martel, A., Capmau, M. L., Baca, B., Goebel, P., Chardon, H., … Bouanchaud, D. H.
(1976). New Plasmid-Mediated Nucleotidylation of Aminoglycoside Antibiotics in

Staphylococcus aureus. Antimicrobial Agents and Chemotherapy, 10(2), 258–264. doi:
10.1128/aac.10.2.258
Gold Bio. (n.d). Amikacin Hydrate. Retrieved from
https://www.goldbio.com/product/3033/amikacin-hydrate.
Gould, K. (2016). Antibiotics: from prehistory to the present day. Journal of Antimicrobial
Chemotherapy, 71(3), 572–575. doi: 10.1093/jac/dkv484
Gottlieb, David; Shaw, Paul D. (2012). Mechanism of Action. Springer Science & Business Media.
p. 41. ISBN 9783642460517
Gundi, V. A., Desbriere, R., & La Scola, B. (2004). Leptotrichia amnionii and the female
reproductive tract. Emerging infectious diseases, 10(11), 2056–2057.
doi:10.3201/eid1011.031019
Harrington, C. H., Googins, M. R., & Jotikasthira , P. (2017). Isolation and Analysis of Antibiotic
Compounds from Soil Microbes . WPI Major Qualifying Projects.
Harry W. Lewis & Christopher J. Moody (13 Jun 1989). Experimental Organic Chemistry:
Principles and Practice (Illustrated ed.). WileyBlackwell. pp. 159–173. ISBN 978-0-632-02017-1
Hernandez, S., Tsang, T., Bascom-Slack, C., & Handelsman, J. (2015). Small world initiative.
United States: Small World Initiative Press.
Honda, T., Fujita, T., & Tonouchi, A. (2013). Aminivibrio pyruvatiphilus gen. nov., sp. nov., an
anaerobic, amino-acid-degrading bacterium from soil of a Japanese rice field. International
Journal Of Systematic And Evolutionary Microbiology, 63(Pt 10), 3679–3686. doi:
10.1099/ijs.0.052225-0
Huigens, R. W., Reyes, S., Reed, C. S., Bunders, C., Rogers, S. A., Steinhauer, A. T., & Melander,
C. (2010). The chemical synthesis and antibiotic activity of a diverse library of 2-
aminobenzimidazole small molecules against MRSA and multidrug-resistant A. baumannii.
Bioorganic & Medicinal Chemistry, 18(2), 663–674. doi: 10.1016/j.bmc.2009.12.003
Inc., E. (2013, May 30). Retrieved October 9, 2019, from
https://www.youtube.com/watch?v=EZjNuqSEPbY.
Inc, E. (n.d.). Agarose Gel Electrophoresis. Retrieved October 10, 2019, from
https://www.edvotek.com/Electrophoresis_Guide.pdf
Inouye, S., Watanabe, T., & Kitasato, I. (1989). Comparative antimicrobial activities of ribostamycin,
gentamicin, ampicillin and lincomycin in vitro and in vivo. Drugs Under Experimental and
Clinical Research, 15(10), 465–476.

Ishimaru, C. A., Klos, E. J., & Brubaker, R. R. (1988). Multiple Antibiotic Production by Erwinia
Herbicola . Disease Control and Pest Management, 78, 746–750.
Jehl, F., Gallion, C., & Monteil, H. (1990). High-performance liquid chromatography of antibiotics.
Journal of Chromatography B: Biomedical Sciences and Applications, 531, 509–548. doi:
https://doi.org/10.1016/S0378-4347(00)82293-8
Jumas-Bilak E., Marchandin H. (2014) The Phylum Synergistetes. In: Rosenberg E., DeLong E.F.,
Lory S., Stackebrandt E., Thompson F. (eds) The Prokaryotes. Springer, Berlin, Heidelberg
Li, B., Qiu, Y., Song, Y., Lin, H., & Yin, H. (2019). Dissecting horizontal and vertical gene transfer
of antibiotic resistance plasmid in bacterial community using microfluidics. Environment
International, 131, 105007. doi: 10.1016/j.envint.2019.105007
Lu, J., Jin, M., Nguyen, S. H., Mao, L., Li, J., Coin, L. J. M., … Guo, J. (2018). Non-antibiotic
antimicrobial triclosan induces multiple antibiotic resistance through genetic mutation.
Environment International. doi: 10.1101/267302
Miller, R. G. J. (Roy Gabriel Jonathan), Adams, David Michael, and Stace, B. C. 1972. Laboratory
Methods in Infrared Spectroscopy. 2d ed. London: Heyden. Print.
Millipore Sigma (2019). Chemical Structure Class - Antibiotics. Retrieved from
https://www.sigmaaldrich.com/life-science/biochemicals/biochemical
products.html?TablePage=14836602.
Muller, A., & Florek, M. (2009). 5-Azacytidine/Azacitidine. Small Molecules in Oncology, 159–170.
Pavia, L., Gary M. Lampman, George S. Kritz, Randall G. Engel (2006). Introduction to Organic
Laboratory Techniques (4th Ed.). Thomson Brooks/Cole. pp. 797–817. ISBN 978-0-495-28069-
9.
Ramirez, M., & Tolmasky, M. (2017). Amikacin: Uses, Resistance, and Prospects for
Inhibition. Molecules, 22(12), 2267. doi: 10.3390/molecules22122267
Romanenko, L. A., Tanaka, N., Kalinovskaya, N. I., & Mikhailov, V. V. (2013). Antimicrobial
potential of deep surface sediment associated bacteria from the Sea of Japan. World Journal of
Microbiology and Biotechnology, 29(7), 1169–1177. doi: 10.1007/s11274-013-1276-6
Rajan BM and Kannabiran. (2014). Extraction and Identification of Antibacterial Secondary
Metabolites from Marine Streptomyces sp. VITBR2K. Int J Mol Cell Med. 3(3) 430-437.
Satoshi, Omura. (2002). Macrolide antibiotics: chemistry, biology, and practice. Amsterdam:
Academic Press.
Schiffman, D. O. (1977). Evaluation of Amikacin Sulfate (Amikin). Jama, 238(14), 1547. doi:
10.1001/jama.1977.03280150117049

Simione, F.P. and Brown, E.M. (1991). ATCC Preservation Methods: Freezing and Freeze Drying.
American Type Culture Collection, Rockville, Maryland.
Sneader, Walter (2005). Drug Discovery: A History. John Wiley & Sons.
p. 302. ISBN 9780471899792.
Talkington, K. (2018, August 29). Trends in U.S. Antibiotic Use, 2018. Retrieved from
https://www.pewtrusts.org/en/research-and-analysis/issue-briefs/2018/08/trends-in-us-antibiotic-
use-2018
Vujjini, S. K., Varanasi, G., Arevelli, S., Kandala, S. C., Tirumalaraju, S. R., Bandichhor, R., …
Cherukupally, P. (2013). An Improved and Scalable Process for the Synthesis of 5-Azacytidine:
An Antineoplastic Drug. Organic Process Research & Development, 17(2), 303–306. doi:
10.1021/op300192e
Waksman, S. A., Katz, E., & Lechevalier, H. (1950). Antimicrobial properties of neomycin. Journal
of Laboratory and Clinical Medicine, 36(1), 93–99.
Wencewicz, T. A. (2019). Crossroads of Antibiotic Resistance and Biosynthesis. Journal of
Molecular Biology, 431(18), 3370–3399. doi: https://doi.org/10.1016/j.jmb.2019.06.033
Witte, W. (1998). BIOMEDICINE: Medical Consequences of Antibiotic Use in Agriculture.
Science, 279(5353), 996–997. doi: 10.1126/science.279.5353.996
Wobbe, R. (2015). Methods for Purifying and Analyzing Antibacterial Compounds from Soil
Microbes in an Undergraduate Laboratory Course. Worcester Polytechnic Institute- Department
of Chemistry and Biochemistry
World Health Organization (2014, April). The World Health Organization. Retrieved from
https://www.who.int/drugresistance/documents/surveillancereport/en/
"WHO Model List of Essential Medicines (19th List)" (PDF). World Health Organization. April
2015.
Xu, L., Ye, K.-X., Dai, W.-H., Sun, C., Xu, L.-H., & Han, B.-N. (2019). Comparative Genomic
Insights into Secondary Metabolism Biosynthetic Gene Cluster Distributions of Marine
Streptomyces. Marine Drugs, 17(9), 498. doi: 10.3390/md17090498
(2014). Antimicrobial Resistance Global Report on Surveillance. Antimicrobial Resistance Global
Report on Surveillance. Geneva, Su: World Health Organization.
(n.d.). About Antimicrobial Resistance | Antibiotic/Antimicrobial Resistance | CDC. Retrieved from
https://www.cdc.gov/drugresistance/about.html
(n.d.). Retrieved from https://www.cdc.gov/drugresistance/ar-images/antibiotic-resistance-
timeline.png