investigation of gearbox vibration transmission paths … j. dempsey glenn research center,...
TRANSCRIPT

Paula J. DempseyGlenn Research Center, Cleveland, Ohio
AKM Anwarul IslamYoungstown State University, Youngstown, Ohio
Jason Feldman and Chris LarsenEtegent Technologies, Ltd., Cincinnati, Ohio
Investigation of Gearbox Vibration TransmissionPaths on Gear Condition Indicator Performance
NASA/TM—2013-216617
December 2013
https://ntrs.nasa.gov/search.jsp?R=20150021366 2018-05-28T11:25:18+00:00Z

NASA STI Program . . . in Pro le
Since its founding, NASA has been dedicated to theadvancement of aeronautics and space science. TheNASA Scienti c and Technical Information (STI)program plays a key part in helping NASA maintainthis important role.
The NASA STI Program operates under the auspicesof the Agency Chief Information Of cer. It collects,organizes, provides for archiving, and disseminatesNASA’s STI. The NASA STI program provides accessto the NASA Aeronautics and Space Database andits public interface, the NASA Technical ReportsServer, thus providing one of the largest collectionsof aeronautical and space science STI in the world.Results are published in both non-NASA channelsand by NASA in the NASA STI Report Series, whichincludes the following report types:
• TECHNICAL PUBLICATION. Reports ofcompleted research or a major signi cant phaseof research that present the results of NASAprograms and include extensive data or theoreticalanalysis. Includes compilations of signi cantscienti c and technical data and informationdeemed to be of continuing reference value.NASA counterpart of peer-reviewed formalprofessional papers but has less stringentlimitations on manuscript length and extent ofgraphic presentations.
• TECHNICAL MEMORANDUM. Scienti cand technical ndings that are preliminary orof specialized interest, e.g., quick releasereports, working papers, and bibliographies thatcontain minimal annotation. Does not containextensive analysis.
• CONTRACTOR REPORT. Scienti c andtechnical ndings by NASA-sponsoredcontractors and grantees.
• CONFERENCE PUBLICATION. Collectedpapers from scienti c and technicalconferences, symposia, seminars, or othermeetings sponsored or cosponsored by NASA.
• SPECIAL PUBLICATION. Scienti c,technical, or historical information fromNASA programs, projects, and missions, oftenconcerned with subjects having substantialpublic interest.
• TECHNICAL TRANSLATION. English-language translations of foreign scienti c andtechnical material pertinent to NASA’s mission.
Specialized services also include creating customthesauri, building customized databases, organizingand publishing research results.
For more information about the NASA STIprogram, see the following:
• Access the NASA STI program home page athttp://www.sti.nasa.gov
• E-mail your question to [email protected]
• Fax your question to the NASA STIInformation Desk at 443–757–5803
• Phone the NASA STI Information Desk at 443–757–5802
• Write to: STI Information Desk
NASA Center for AeroSpace Information 7115 Standard Drive Hanover, MD 21076–1320

Paula J. DempseyGlenn Research Center, Cleveland, Ohio
AKM Anwarul IslamYoungstown State University, Youngstown, Ohio
Jason Feldman and Chris LarsenEtegent Technologies, Ltd., Cincinnati, Ohio
Investigation of Gearbox Vibration TransmissionPaths on Gear Condition Indicator Performance
NASA/TM—2013-216617
December 2013
National Aeronautics andSpace Administration
Glenn Research CenterCleveland, Ohio 44135

Available from
NASA Center for Aerospace Information7115 Standard DriveHanover, MD 21076–1320
National Technical Information Service5301 Shawnee Road
Alexandria, VA 22312
Available electronically at http://www.sti.nasa.gov
Trade names and trademarks are used in this report for identi cationonly. Their usage does not constitute an of cial endorsement,either expressed or implied, by the National Aeronautics and
Space Administration.
Level of Review: This material has been technically reviewed by technical management.

NASA/TM—2013-216617 1
Investigation of Gearbox Vibration Transmission Paths onGear Condition Indicator Performance
Paula J. DempseyNational Aeronautics and Space Administration
Glenn Research CenterCleveland, Ohio 44135
AKM Anwarul IslamYoungstown State University
Youngstown, Ohio 44555
Jason Feldman and Chris LarsenEtegent Technologies, Ltd.
Cincinnati, Ohio 45212
AbstractHelicopter health monitoring systems use vibration signatures generated from damaged components
to identify transmission faults. For damaged gears, these signatures relate to changes in dynamics due tothe meshing of the damaged tooth. These signatures, referred to as condition indicators (CI), can performdifferently when measured on different systems, such as a component test rig, or a full-scale transmissiontest stand, or an aircraft. These differences can result from dissimilarities in systems design andenvironment under dynamic operating conditions. The static structure can also filter the response betweenthe vibration source and the accelerometer, when the accelerometer is installed on the housing.
To assess the utility of static vibration transfer paths for predicting gear CI performance,measurements were taken on the NASA Glenn Spiral Bevel Gear Fatigue Test Rig. The vibrationmeasurements were taken to determine the effect of torque, accelerometer location and gearbox design onaccelerometer response. Measurements were taken at the housing and compared while impacting the gearset near mesh. These impacts were made at gear mesh to simulate gear meshing dynamics. Data measuredon a helicopter gearbox installed in a static fixture were also compared to the test rig. The behavior of thestructure under static conditions was also compared to CI values calculated under dynamic conditions.Results indicate that static vibration transfer path measurements can provide some insight into spiral bevelgear CI performance by identifying structural characteristics unique to each system that can affect specificCI response.
IntroductionHelicopter transmission health is important to helicopter safety because helicopters depend on the
power train for propulsion lift and flight maneuvering. Health and Usage Monitoring Systems (HUMS)capable of predicting impending transmission component failure for “on-condition” maintenance have thepotential to decrease operating and maintenance costs, and increase safety and aircraft availability. “On-condition” maintenance refers to maintenance when HUMS “condition indicators” indicate decreasedperformance, instead of relying on time-based maintenance intervals. These HUMS “conditionindicators” (CI) are typically vibration signatures generated from fault patterns produced when damagedcomponents interact with their environment. For gear CIs, these signatures relate to changes in dynamicsat the gear mesh due to tooth damage.
Condition indicators can perform differently when measured on a component test rig or a full-scaletransmission test stand or an aircraft. Damage progression tests are being performed in the Spiral BevelGear Fatigue Test Rig, as shown in Figure 1, at NASA Glenn Research Center (GRC). The objective of

NASA/TM—2013-216617 2
Figure 1.—Spiral bevel gear fatigue test rig at NASA GRC.
Figure 2.—Three spiral bevel geared systems.
these tests, as outlined in Reference 1, are to determine if ‘seeded or accelerated fault’ tests, in which acomponent is tested with a known fault, can be used as evidence that a HUMS condition indicator willreliably detect tooth damage when installed on a helicopter. Performing these tests will also identifylimitations using seeded fault test rig data to demonstrate helicopter CI performance. For this approach,existing in-service HUMS flight data from spiral bevel gears installed in a helicopter nose gearbox (NGB)will be compared to test rig spiral bevel gear failure progression data. The field data analysis of spiralbevel gears condition indicators determined the CIs that performed the best in the field. The informationlearned from this analysis, documented in References 2 and 3, was fed into the development of the spiralbevel gear rig test plan.
In addition to performing dynamic tests of gears with varying levels of damage to gear teeth,measurements were taken to characterize differences in structural dynamics between the helicopter andtest rig gearboxes. Although the transfer path can change under dynamic conditions due to load andspeed, the static structure also filters the response between the vibration source and the accelerometer onthe housing. Understanding structural differences between systems may provide insight into thedifference in performance of diagnostic tools between such systems.
The approach used to assess the effectiveness of vibration transfer paths in predicting CI performancewas to compare measurements on three spiral bevel geared systems. These three systems, as shown inFigure 2, are a helicopter NGB, an NGB fixture (an NGB removed from a helicopter and installed in astatic fixture), and a test rig (spiral bevel gear fatigue test rig). The latter two are installed at NASA GRC.

NASA/TM—2013-216617 3
This comparison required taking measurements on the helicopter NGB or NGB fixture that can becompared to future measurements on the test rig. Limited accessibility to the gear mesh within thehelicopter NGB made it impossible to simulate an impact of gear teeth at the source, directly betweenmeshing gear teeth. However, the NGB fixture enabled the application of impacts close to the gear meshwith varying torques—common during aircraft operations. Results from comparisons of frequencyresponse functions between the helicopter NGB and NGB fixture under similar conditions found bothsystems to be consistent. These results are detailed in Reference 4. To determine if transfer pathmeasurements under static conditions can provide insight into the gear CI performance during operation,measurements under dynamic conditions were required.
The objective of this paper was to assess the utility of vibration transfer paths of the test rig in a staticcondition for predicting its gear CI performance during its operation. The focus was on the the signaltransmission from the gear mesh inside the gear box to the accelerometer installed on the gearbox externalhousing.
Measurements were taken on the static test rig to determine the effect of torque, accelerometerlocation and gearbox design on the accelerometer response to impacts near the gear mesh. Impacts of thegear set near mesh were made to simulate gear meshing dynamics. Data measured on the the NGBfixture, per Reference 4, were also compared to those of the test rig. Inferences were made comparingvibration measurements of the structure collected under static conditions to CI values calculated underdynamic conditions.
Test FacilityTests were performed in the test rig at NASA GRC. A detailed description of this test facility, as
illustrated in Figure 1, can be found in References 5 and 6. In addition to developing gear healthmonitoring tools, the test facility has been used to study the effects of gear material, gear tooth design,and lubrication on the fatigue strength of gears. Two sets of spiral bevel gears are installed in the test rigand tested simultaneously. Facing the gearboxes per Figure 1, the left gear set (pinion/gear) is referencedas ‘left’ and the right gear set (pinion/gear) is referenced as ‘right’ within this paper.
Figure 3 shows the cross-sectional view of the test rig. The facility operates in a closed-looparrangement where the load is locked into the loop via a split shaft and a thrust piston on the slave side ofthe rig. This forces a helical gear into mesh per Figure 3. The rotation is obtained using a drive motorconnected through v-belts to the helical gear. The spiral bevel gears on the left side operate where thepinion drives the gear. The right side of the facility acts as a speed increaser where the gear drives the
Figure 3.—Cross-section of the test rig.

NASA/TM—2013-216617 4
pinion. The concave side of the pinion is always in contact with the convex side of the gear on both theleft and right side of the gearbox. Load and speed are monitored by torque and speed sensors. The 41-tooth gear and 19-tooth pinion gear set are typically tested at a gear speed of 3500 rpm and a pinion speedof 7553 rpm with a gear torque of approximately 8000 in.-lb and a pinion torque of 3707 in.-lb.
Turbine engine oil that meets DOD-L-87354 specifications is used in the test rig. Both gear sets arelubricated with oil jets pumped from an oil reservoir. The lubrication exits the gearbox, and flows throughan inductance type in-line oil debris (OD) sensor and then a magnetic chip detector. A strainer and athree-micron filter are located downstream of the OD sensor to capture any debris before returning to thesensor and the gearbox.
Data Acquisition and Instrumentation for Dynamic TestsDuring dynamic tests, three data acquisition systems were used. Vibration, oil debris, torque and
speed data were collected once every minute with the NASA GRC data acquisition system, referred to asthe Mechanical Diagnostic System Software (MDSS). Vibration and speed data were collected from asecond set of sensors with a helicopter HUMS referred to as the Modern Signal Processing Unit (MSPU).Operational parameters were collected with a third system referred to as the Daytronic. These operationalparameters included torque, speed, right and left gearbox oil inlet, and outlet temperatures and pressures.
A non-contact rotary transformer shaft-mounted torque sensor was used to measure torques duringtesting. Thermocouples were used to measure inlet and outlet oil temperatures. The inductance type ODsensor was used to measure the debris generated during fatigue damage to the gear teeth. Also measuredwere chip indications from the chip detector, when the gap was closed with debris.
For the MDSS system, accelerometers, with a frequency range of 0.7 to 20 kHz and a resonantfrequency of 70 kHz, were installed on the right and left side of the test rig housing. Theseaccelerometers were referred to as high frequency (HF) accelerometers in the analysis that follows. TheMDSS HF accelerometers were mounted on the housing, radially and vertically with respect to the pinion,as shown in Figure 4. This orientation was chosen because the calculated forces at the mesh indicated theaccelerometer would see the largest forces in this orientation. Speed is measured with optical tachometersmounted on the left pinion shaft and left gear shaft to produce a separate once-per-rev tachometer (tach)pulse for the pinion and gears.
For the MSPU system, accelerometers, with a frequency range of 0.5 to 5 kHz and a resonantfrequency of 26 kHz, are also installed on the right and left side of the test rig. These accelerometers arereferred to as the Dytran in the analysis that follows. A magnetic tachometer is installed on the rightpinion to measure pinion pulses per tooth pass in the MSPU system. The accelerometers were mounted onthe housing, in close proximity to the MDSS accelerometers, radially and vertically with respect to thepinion, as shown in Figure 4.
Figure 4.—Locations of accelerometers.

NASA/TM—2013-216617 5
Condition Indicator AnalysisFor condition indicator calculations, vibration data were collected for the right and left pinion/gear
sets using accelerometers mounted on the right and left side of the test rig gearbox per Figure 4. Datawere collected at sample rates that provided sufficient vibration data for calculating time synchronousaveraged (TSA) data. The TSA refers to techniques for averaging vibration signals over severalrevolutions of the shaft, in the time domain, to improve signal-to-noise ratio (Ref. 7). Using a once perrevolution signal, the vibration signal is interpolated into a fixed number of points per shaft revolution.Signals synchronous with the shaft speed will intensify relative to the non-periodic signals.
Since helicopter gears generate vibration signals synchronous with speed, all helicopter gearcondition indicators are calculated from TSA data. Gear vibration condition indicators are indexescalculated from vibration signal information. Many are based on statistical measurements of vibrationenergy. Signal processing techniques used to calculate a gear CI from the TSA vibration signal arediscussed in detail in Reference 8. Some gear CI’s are calculated directly from the time domain TSAsignal, such as the root mean square (RMS), while others are calculated from the TSA converted to thefrequency domain, such as the Sideband Index (SI).
Time synchronous averaging of the vibration data collected from the left and right accelerometer isperformed in the MDSS system for pinions via the pinion tach pulse and for gears via the gear tach pulse.The MSPU system uses the magnetic tachometer installed at the pinion to calculate the TSA for both thepinion and the gear. The gear ratio is used to process the pinion data at the correct speed for the gear.Note that accelerometers installed on the left side of the test rig were used to measure vibration andcalculate CIs for the pinion and gear installed on the left side of the gearbox. Accelerometers installed onthe right side of the gearbox were used to measure vibration and calculate CIs for the pinion and gearinstalled on the right side of the gearbox.
Figure 5 illustrates the information used to calculate the TSA for the right gear and pinion. Using thesample rate of 200 kHz for one second duration and the speed of both shafts, the number of TSA averagesfor each acquisition is determined. Each average consists of one revolution of the shaft. Each average ismade up of the number of linearly interpolated points rounded down to a power of two. A power of two
Figure 5.—Information used to calculate TSA.
NASA/TM—2013-216617 6
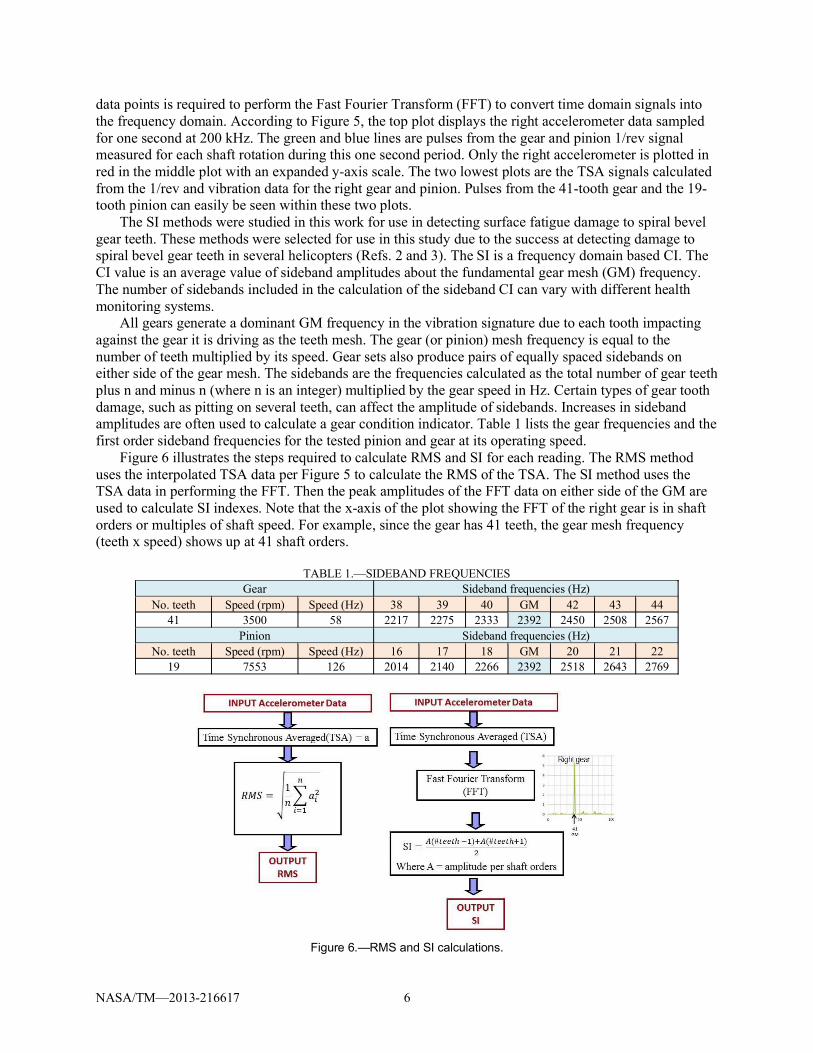
data points is required to perform the Fast Fourier Transform (FFT) to convert time domain signals intothe frequency domain. According to Figure 5, the top plot displays the right accelerometer data sampledfor one second at 200 kHz. The green and blue lines are pulses from the gear and pinion 1/rev signalmeasured for each shaft rotation during this one second period. Only the right accelerometer is plotted inred in the middle plot with an expanded y-axis scale. The two lowest plots are the TSA signals calculatedfrom the 1/rev and vibration data for the right gear and pinion. Pulses from the 41-tooth gear and the 19-tooth pinion can easily be seen within these two plots.
The SI methods were studied in this work for use in detecting surface fatigue damage to spiral bevelgear teeth. These methods were selected for use in this study due to the success at detecting damage tospiral bevel gear teeth in several helicopters (Refs. 2 and 3). The SI is a frequency domain based CI. TheCI value is an average value of sideband amplitudes about the fundamental gear mesh (GM) frequency.The number of sidebands included in the calculation of the sideband CI can vary with different healthmonitoring systems.
All gears generate a dominant GM frequency in the vibration signature due to each tooth impactingagainst the gear it is driving as the teeth mesh. The gear (or pinion) mesh frequency is equal to thenumber of teeth multiplied by its speed. Gear sets also produce pairs of equally spaced sidebands oneither side of the gear mesh. The sidebands are the frequencies calculated as the total number of gear teethplus n and minus n (where n is an integer) multiplied by the gear speed in Hz. Certain types of gear toothdamage, such as pitting on several teeth, can affect the amplitude of sidebands. Increases in sidebandamplitudes are often used to calculate a gear condition indicator. Table 1 lists the gear frequencies and thefirst order sideband frequencies for the tested pinion and gear at its operating speed.
Figure 6 illustrates the steps required to calculate RMS and SI for each reading. The RMS methoduses the interpolated TSA data per Figure 5 to calculate the RMS of the TSA. The SI method uses theTSA data in performing the FFT. Then the peak amplitudes of the FFT data on either side of the GM areused to calculate SI indexes. Note that the x-axis of the plot showing the FFT of the right gear is in shaftorders or multiples of shaft speed. For example, since the gear has 41 teeth, the gear mesh frequency(teeth x speed) shows up at 41 shaft orders.
TABLE 1.—SIDEBAND FREQUENCIESGear Sideband frequencies (Hz)
No. teeth Speed (rpm) Speed (Hz) 38 39 40 GM 42 43 4441 3500 58 2217 2275 2333 2392 2450 2508 2567
Pinion Sideband frequencies (Hz)No. teeth Speed (rpm) Speed (Hz) 16 17 18 GM 20 21 22
19 7553 126 2014 2140 2266 2392 2518 2643 2769
Figure 6.—RMS and SI calculations.

NASA/TM—2013-216617 7
Data Acquisition for Transfer Path MeasurementsModal analysis is primarily concerned with resonant frequencies or natural frequencies of a structure.
It is typically performed by exciting a structure with a known force and measuring the vibration responseat various locations on the structure. Frequency response functions (FRF) are used to analyze structuraldynamics under static condtions and to estimate modal parameters for the analysis of mechanical systems.The FRF is used to measure the input-output relationship between two points on a structure as a functionof frequency. Coherence is used to measure the linear dependence between the output and input signals asa function of frequency.
Vibration transfer path (VTP) measurements were recorded on the test rig at NASA GRC from June 3to June 7, 2013. The objective of this effort was to perceive how an accelerometer responds to the impactsat the gear mesh as they travel through the structure. Since the structure filters this reponse, it can impacta CI’s ability to detect tooth damage at the mesh. The transmission or transfer path of the test rig gearboxwas determined by applying an impact force at the mesh and measuring its response with accelerometersinstalled on the gearbox housing. The same MDSS and MSPU accelerometers used for dynamicmeasurements were used for VTP measurements on the test rig, as shown in Figure 4.
Since the purpose of these tests was to determine the effect of the structure on the gear CI, the FRFsfocused on the frequency ranges used for gear CI sideband index. Most of the FRF measurements weremade with an instrumented impact hammer. The hammer provides good excitation up to 6400 Hz. Forsome test conditions, a commercial reaction-mass shaker in the form of a piezoelectric actuator was used.
The Kolmogorov–Smirnov test (K-S test) was used to compare the FRFs under different conditions.The KS test is a nonparametric test for the equality of continuous, one-dimensional probabilitydistributions that can be used to compare two samples. The KS statistic quantifies a distance between theempirical cumulative distribution functions (CDF) of two samples. The two-sample KS test is one of themost useful and general nonparametric methods for comparing two samples, as it is sensitive todifferences in both location and shape of the CDF of the two samples (Ref. 9). The Kolmogorov-Smirnovstatistic ',D nn is defined by Equations (1) and (2).
xFxFsup nnxnn ',2,1',D (1)
ni in xXI
nxF
11 (2)
Where, is the supremum (greatest) distance between the empirical distribution functions F1,n and',2 nF of the first and second samples, respectively, and xXI i is the indicator function equal to 1 ifxX i , or 0 otherwise. In K-S tests, factor ',D nn represents the maximum vertical distance between the
CDF curves of two comparable vectors (herein FRF amplitudes for the helicopter NGB and the test rig).KS Similarity factors between the FRF vectors were derived by subtracting ',D nn from unity.

NASA/TM—2013-216617 8
Results for Spiral Bevel Gear Fatigue Rig Under Static ConditionsThe first part of the analysis was to characterize the test rig under static conditions. FRF
measurements were made under different conditions to compare transfer paths from the gear/pinion toothmesh to the accelerometers on the housing. For these tests, impacts were made at the gear mesh on the leftpinion, and the response of the MSPU and MDSS accelerometers on the right and left side of the test rigwere compared. The impacts at the gear mesh with the hammer were made on the pinion gear tooth in thevertical direction, as shown in Figure 7. This impact orientation was selected since the largest tooth forceat the mesh was calculated for this direction.
Varying Loads
The effects of loads on the transfer path were examined by impacting the hammer on the left pinion inthe vertical direction and measuring its response with the MDSS system accelerometers. Accelerationswere measured with the HF accelerometers from 0 to 6400 Hz. The test gears were loaded by applying astatic torque in the loop. Four design loads were applied and are listed in Table 2. Similarity factors werethan calculated comparing the 29 percent design load to the other three loads and are listed in Table 2.According to Table 2, similarity factors above 0.9 indicated the FRFs were similar under varying loads.Representative plots of FRF, Coherence and CDF at 104 percent design load compared to 29 percent loadare shown in Figure 8.
Figure 7.—Impact on left pinion in the vertical direction.
TABLE 2.—KOLMOGOROV-SMIRNOV (KS) SIMILARITY TESTS FOR FRFS AT3 LOADS COMPARED TO 29 PERCENT LOAD
Percent design load Gear torque,in.-lb
Pinion torque,in.-lb
KS similarity factor
29 2347 1088 na53 4264 1976 0.9178 6252 2897 0.90
104 8283 3838 0.92

NASA/TM—2013-216617 9
These plots were also generated for a narrow frequency band (1800 to 3000 Hz) around the gear meshand its sidebands for 3500 rpm gear speed (Table 1). This expanded scale is highlighted in yellow inFigure 8. Similarity factors calculated comparing the 29 percent design load to the other three loads arelisted in Table 3. According to Table 3, similarity factors calculated for the narrow band were lower thanthe full range and decreased with an increase in load. Plots of FRF, Coherence and CDF at the three loadscompared to 29 percent design load are shown in Figure 9. These results indicate that for the mostaccurate system structural characterization, loads similar to the operating loads should be applied duringtransfer path measurements. Further discussion of results will focus on measurements taken at the loadclosest to operating load under dynamic conditions. This load is highlighted in Table 3.
Figure 8.—FRF, Coherence and CDF at 104 percent design load compared to29 percent load.
0 1 2 3 4 5 6 710-4
10-3
10-2
10-1
Frequency (kHz)
HF Accel Left FRF comparison under load for vertical impact on left pinion
29% Load104% Load
0 1 2 3 4 5 6 70
0.5
1
Frequency (kHz)
HF Accel Left Coherence comparison under load for vertical impact on left pinion
29% Load104% Load
-0.01 0 0.01 0.02 0.03 0.04 0.05 0.06 0.070
0.2
0.4
0.6
0.8
1
FRF Amplitude (g/lbf)
HF Accel Left CDF comparison under load for vertical impact on left pinion
29% Load104% Load

NASA/TM—2013-216617 10
TABLE 3.—KS SIMILARITY TESTS FOR FRFS AT 3 LOADS COMPAREDTO 29 PERCENT LOAD WITHIN A FREQUENCY BAND
Percent design load Gear torque,in.-lb
Pinion torque,in.-lb
KS similarity factor
29 2347 1088 na53 4264 1976 0.7478 6252 2897 0.71
104 8283 3838 0.70
Figure 9.—FRF, Coherence and CDF at 53, 78, and 104 percent loads compared to 29 percent load.
1.8 2 2.2 2.4 2.6 2.8 310-3
10-2
10-1
Frequency (kHz)
HF Accel Left FRF comparison under load for vertical impact on left pinion
29% Load53% Load
1.8 2 2.2 2.4 2.6 2.8 30
0.5
1
Frequency (kHz)
HF Accel Left Coherence comparison under load for vertical impact on left pinion
29% Load53% Load
0 0.005 0.01 0.015 0.02 0.025 0.03 0.035 0.04 0.0450
0.2
0.4
0.6
0.8
1
FRF Amplitude (g/lbf)
HF Accel Left CDF comparison under load for vertical impact on left pinion
29% Load53% Load
1.8 2 2.2 2.4 2.6 2.8 310-3
10-2
10-1
Frequency (kHz)
HF Accel Left FRF comparison under load for vertical impact on left pinion
29% Load78% Load
1.8 2 2.2 2.4 2.6 2.8 30
0.5
1
Frequency (kHz)
HF Accel Left Coherence comparison under load for vertical impact on left pinion
29% Load78% Load
0 0.005 0.01 0.015 0.02 0.025 0.03 0.035 0.04 0.0450
0.2
0.4
0.6
0.8
1
FRF Amplitude (g/lbf)
HF Accel Left CDF comparison under load for vertical impact on left pinion
29% Load78% Load
1.8 2 2.2 2.4 2.6 2.8 310-3
10-2
10-1
Frequency (kHz)
HF Accel Left FRF comparison under load for vertical impact on left pinion
29% Load104% Load
1.8 2 2.2 2.4 2.6 2.8 30
0.5
1
Frequency (kHz)
HF Accel Left Coherence comparison under load for vertical impact on left pinion
29% Load104% Load
0 0.005 0.01 0.015 0.02 0.025 0.03 0.035 0.04 0.0450
0.2
0.4
0.6
0.8
1
FRF Amplitude (g/lbf)
HF Accel Left CDF comparison under load for vertical impact on left pinion
29% Load104% Load

NASA/TM—2013-216617 11
Coupling Between Left and Right Pinion
The test rig was designed to test two sets of spiral bevel gears simultaneously with the right and leftpinions connected by a cross shaft. This design can make it more challenging to isolate tooth damage onone side of the gearbox from the other side. To investigate how damage on one side can potentially affectthe other, impacts were made at the left pinion at 104 percent load and measured on the right and left sideaccelerometers. Figure 10 shows plots of FRF, Coherence and CDF at 104 percent load measured with theMDSS HF accelerometers on right and left sides of the gearbox. A KS similarity value of 0.65 wascalculated for the 0 to 6400 Hz frequency range. The FRF amplitude measured on the left side was higher
Figure 10.—FRF, Coherence and CDF at 104 percent load measuredon right and left with HF accels.
0 1 2 3 4 5 6 710
-5
10-4
10-3
10-2
10-1
Frequency (kHz)
HF Accel Left and Right, vert. imp. on left pin at 8283 lb-in preload
HF Accel LeftHF Accel Right
0 1 2 3 4 5 6 70
0.2
0.4
0.6
0.8
1
Frequency (kHz)
HF Accel Left and Right Coherence, vert. imp. on left pin at 8283 lb-in preload
HF Accel LeftHF Accel Right
-0.01 0 0.01 0.02 0.03 0.04 0.05 0.06 0.070
0.2
0.4
0.6
0.8
1
FRF Amplitude (g/lbf)
HF Accel Left and Right CDF, vert. imp. on left pin at 8283 lb-in preload
HF Accel LeftHF Accel Right

NASA/TM—2013-216617 12
than that of the right side due to impacts made closer to this accelerometer. The coherence for the leftaccelerometer seems better than in the right one across the entire frequency range, which seemsreasonable since the location of the impact is closer to the left accelerometer. However, the rightaccelerometer did respond to this impact indicating the coupling between the right and left pinion throughthe shaft. The frequency bands from 2.6 to 4.0 kHz and the frequency after 5.4 kHz show big differencesin amplitudes between the left and right accelerometers. The resonant frequency appears to be at 3.2 kHz.This is good news because it does not correlate to frequencies used for diagnostic purposes at 100 percentoperating conditions of the test rig.
Comparison Between MDSS and MSPU Accelerometers
Both the HF and Dytran accelerometers will be used during test rig failure progression tests. Dytranaccelerometers used to monitor the helicopter NGB have an integral mounting bracket. To compare bothtypes of sensors, impacts were made at the left pinion at 104 percent load and measured with the HF andDytran accelerometers installed on the left side of the test rig gearbox. Figure 11 shows plots of FRF,Coherence and CDF at 104 percent load measured with both accelerometers. A KS similarity value of0.94 was calculated for the 0 to 6400 Hz frequency range and 0.85 for the 1800 to 3000 Hz frequencyrange. This indicates both types of accelerometers respond within the frequency of interest.
Figure 11.—FRF, Coherence and CDF at 104 percent load measured with HF and Dytran accels.
0 1 2 3 4 5 6 710
-5
100
Frequency (kHz)
HF and Dytran Accel Left, vert. imp. on left pin at 8283 lb-in preload
HF Accel LeftDytran Accel Left
0 1 2 3 4 5 6 70
0.5
1
Frequency (kHz)
HF and Dytran Accel Left Coherence, vert. imp. on left pin at 8283 lb-in preload
HF Accel LeftDytran Accel Left
-0.01 0 0.01 0.02 0.03 0.04 0.05 0.06 0.070
0.2
0.4
0.6
0.8
1
FRF Amplitude (g/lbf)
HF and Dytran Accel Left CDF, vert. imp. on left pin at 8283 lb-in preload
HF Accel LeftDytran Accel Left
1.8 2 2.2 2.4 2.6 2.8 310
-3
10-2
10-1
Frequency (kHz)
HF and Dytran Accel Left, vert. imp. on left pin at 8283 lb-in preload
HF Accel LeftDytran Accel Left
1.8 2 2.2 2.4 2.6 2.8 30
0.5
1
Frequency (kHz)
HF and Dytran Accel Left Coherence, vert. imp. on left pin at 8283 lb-in preload
HF Accel LeftDytran Accel Left
0 0.005 0.01 0.015 0.02 0.025 0.03 0.0350
0.2
0.4
0.6
0.8
1
FRF Amplitude (g/lbf)
HF and Dytran Accel Left CDF, vert. imp. on left pin at 8283 lb-in preload
HF Accel LeftDytran Accel Left

NASA/TM—2013-216617 13
Dynamic ResponseOne underlying objective of the FRF measurements was to determine if measuring the behavior of the
structure under static conditions can provide any insight into CI performance under dynamic conditions.Dynamic data were collected on two different gear sets (pinion/gear), referred to as L3030R5050 andL1515R5050, installed on the left side of the test rig. The right gear set was not changed during the tests.Comparable oil temperatures and oil jet pressures were maintained for each test. Table 4 lists theoperating speeds and loads during the dynamic tests.
The first gear set, referred to as L3030R505, completed 100 hours of operation before measurementswere taken in support of this research. Damage occurred during the previous 100 hours of testing prior toperforming these dynamic tests. Figure 12 is a photograph of the damage observed on the gear and pinionteeth. Figure 13 shows plots of the gear speed, gear mesh frequency and torque during the test. The gearspeed in rpm and gear mesh frequency in Hz is plotted on the left y-axis. The torque is plotted on the righty-axis.
TABLE 4.—DYNAMIC TEST CONDITIONSL3030R5050 L1515R5050 L1515R5050-2
RPM Hz GM(Hz) Torque RPM Hz GM(Hz) Torque RPM Hz GM(Hz) Torque2000 33 1367 100% 2000 33 1367 100%2500 42 1708 100% 2500 42 1708 100% 2500 42 1708 100%3500 58 2392 100% 3500 58 2392 100% 3500 58 2392 100%3000 50 2050 100% 3000 50 2050 100%
2000 33 1367 29%2500 42 1708 29%3000 50 2050 29%3500 58 2392 29%
Figure 12.—Damage to gear and pinion teeth.

NASA/TM—2013-216617 14
A snapshot of the TSA data and the corresponding spectrum data was plotted for each test condition.The yellow triangles on the x-axis of Figure 13 indicate points where the TSA data were plotted. TheTSA time domain data were converted into the frequency domain using FFT. An example of plots of theTSA and the spectrum data for a point on the left pinion is also shown in Figure 13. The interpolated TSAdata were averaged to one shaft revolution. The x-axis is the interpolated points of 1 revolution. They-axis is in volts. The spectrum data plotted is the spectrum of the TSA. The x-axis is in shaft orders. Forexample, since the gear has 41 teeth, the gear mesh frequency (teeth x rpm) shows up at 41 shaft orders.The pinion shows up at 19 shaft orders due to 19 pinion teeth. The y-axis is in G-scale.
The second gear set, referred to as L1515R5050, was installed new on the test rig. An anomaly, dueto the manufacturing process, was present at the root of the gear teeth at the start of the testing. Figure 14shows a photograph of the anomaly observed on the gear teeth.
Figure 13.—Gear speed, gear mesh frequency and torque during L3030R5050 test.
Figure 14.—Gear teeth anomaly on the second gear set.

NASA/TM—2013-216617 15
Figure 15 shows plots of the gear speed, gear mesh frequency and torque during the test. The gearspeed in rpm and gear mesh frequency in Hz is plotted on the left y-axis. The Torque is plotted on theright y-axis. A snapshot of the TSA data and the corresponding spectrum data was plotted for each testcondition. The yellow triangles on the x-axis of Figure 15 indicate the point where the TSA data werecollected. Note that the data used for this analysis were limited to points indicated by triangles 1, 3, 7 onthe x-axis. The TSA time domain data were converted into the frequency domain using FFT.
The second gear set, referred to as L1515R5050, rotated for another 12 hr at 8000 in.-lb. Damage wasobserved on one pinion tooth at test completion. Figure 16 shows a photograph of the damage observedon the pinion teeth.
Figure 15.—Gear speed, gear mesh frequency and torque during L1515R5050 test.
Figure 16.—Damage to one pinion tooth.

NASA/TM—2013-216617 16
Figure 17 shows plots of the gear speed, gear mesh frequency and torque during the test. The gearspeed in rpm and gear mesh frequency in Hz is plotted on the left y-axis. The torque is plotted on the righty-axis. A snapshot of the TSA data and the corresponding spectrum data was plotted for each testcondition. The yellow triangles on the x-axis of Figure 17 indicate the point where the TSA data werecollected. The TSA time domain data were converted into the frequency domain by performing FFT.
The objective of this analysis was to compare the dynamic response of two different left gear sets(L3030R5050 and L1515R5050) at comparable torques and speeds. The vibration data presented werecollected with the MDSS HF accelerometers mounted on the right and left side of the rig gearbox. Theaverage amplitude of the TSA data and amplitudes of the gear mesh frequencies and their harmonics wereused to compare the differences in dynamic response. In the gear mesh amplitude tables, 1H indicates thefirst, 2H the second and 3H the third harmonic of the gear mesh. Note that only the left gear set waschanged. The right set remained the same for all test conditions.
Tables 5 and 6 summarize the frequency domain response of the right and left gearbox accelerometerswhile Tables 7 and 8 summarize the time domain response of the accelerometers. The torque wasmaintained and speed varied. For the test condition noted by an asterisk in Tables 5 and 6, the test rig wasshut down, inspected, and then data was taken again at the same condition. Tables 9 and 10 summarizetime domain and frequency domain response of the left side of the gearbox at varying speeds and lowtorque on gear set (L1515R5050-2) with damage on one tooth.
Figure 17.—Gear speed, gear mesh frequency and torque during L1515R5050-2 test with damage.

NASA/TM—2013-216617 17
TABLE 5.—LEFT GEAR MESH AMPLITUDES AT HIGH TORQUE AND VARYING SPEED
TABLE 6.—RIGHT GEAR MESH AMPLITUDES AT HIGH TORQUE AND VARYING SPEED
TABLE 7.—LEFT TSA AMPLITUDES AT HIGH TORQUE AND VARYING SPEED
TABLE 8.—RIGHT TSA AMPLITUDES AT HIGH TORQUE, VARYING SPEED
TABLE 9.—LEFT GEAR MESH AMPLITUDES ATLOW TORQUE AND VARYING SPEED
TABLE 10.—LEFT TSA AMPLITUDES AT LOW TORQUE AND VARYING SPEED
RPM Torque L3030 Left L1515 Left L1515 Left L1515 2 Left2000 8000 1H=2.75 1H=1.5
2500 8000 1H=2H=1.7 1H=1, 2H=3 1H=4
3500 8000 1H=3 1H=1.5, 2H=1 *1H=1.5 1H=3, 2H=1.5
3000 8000 1H=5 1H=3
Gear Mesh Amplitude
RPM Torque L3030 Right L1515 Right L1515 Right L1515 2 Right2000 8000 1H=2H=1.2 1H=5.5, 2H=1.75, 4H=3
2500 8000 1H=2.5, 2H=3.5 1H=.7, 2H=4.5 1H=8
3500 8000 1H=.5 1H=5, 2H=1.5, 3H=2.5 *1H=6, 2H=2, 3H=3 1H=2.5, 2H=1
3000 8000 1H=6 1H=2H=3
Gear Mesh Amplitude
Gear Pinion Gear Pinion Gear Pinion Gear PinionRPM Torque L3030 Left L3030 Left L1515 Left L1515 Left L1515 Left L1515 Left L1515 2 Left L1515 2 Left
2000 8000 + 0.04 + 0.05 + 0.04 + 0.03
2500 8000 +0.04 0.05 +0.05 0.07 + 0.05 + 0.04 +0.05 0.06 +0.04 0.06
3500 8000 + 0.09 + 0.09 + 0.04 + 0.03 +0.03 0.04 + 0.03 +0.05 0.04 +0.04 0.03
3000 8000 + 0.08 +0.1 0.08 + 0.06 + 0.04
TSA Amplitude Left
Gear Pinion Gear Pinion Gear Pinion Gear PinionRPM Torque L3030 L3030 L1515 L1515 L1515 L1515 L1515 2 L1515 2
2000 8000 +0.04 0.02 +0.04 0.02 + 0.1 + 0.1
2500 8000 + 0.07 +0.06 0.07 +0.06 0.07 + 0.06 + 0.1 + 0.1
3500 8000 + 0.09 + 0.09 + 0.1 + 0.07 +0.12 0.1 +0.12 0.1 + 0.04 + 0.04
3000 8000 +0.09 0.1 + 0.08 +0.08 0.06 +0.07 0.04
TSA Amplitude Right
GearMesh AmplitudeRPM Torque L1515 2 Left L1515 2Right
2000 2740 1H=0.5 1H=0.5
2500 2812 1H=1 1H=1
3000 2890 1H=1.5 1H=5
3500 2974 1H=1.2 1H=1.7
TSA Amplitude Gear Pinion Gear PinionRPM Torque L1515 2 Left L1515 2 Left L1515 2 Right L1515 2 Right
2000 2740 + 0.01 + 0.01 + 0.01 + 0.01
2500 2812 + 0.02 + 0.02 + 0.02 + 0.02
3000 2890 + 0.02 + 0.02 + 0.06 + 0.06
3500 2974 + 0.02 + 0.02 + 0.04 + 0.02

NASA/TM—2013-216617 18
After review of the data, the following observations were made per the left side datasets:
1. For speeds 2000, 3000, and 3500 rpm, the first harmonic was the dominant frequency measuredby the left accelerometer for both gear sets for all conditions.
2. For the speed of 2500 rpm (1708 Hz GM), the 2nd and 3rd harmonics were almost equal for gearset 30, and the 2nd harmonic was greater than the 1st for gear set 15. Due to the unusual dynamicsat this speed, this speed should be avoided during testing.
3. The gear set 30, with the most damage during testing, had the highest amplitude in the timedomain.
After reviewing the data, the following observations were made per the right side datasets:
1. For the speed of 3500 rpm, the first harmonic was the dominant frequency measured by the rightaccelerometer for both gear sets for all conditions.
2. For the speed of 2500 rpm, the 2nd harmonic was greater than the 1st harmonic for both gear sets.However, this changed for gear set 15 once damage occurred. Due to the unusual dynamics at thisspeed, this speed should be avoided during testing.
3. For speeds of 2000 and 3000 rpm, the dynamics changed for different operating conditions,where in two cases the 1st and 2nd harmonics were equal.
4. The highest TSA amplitude and gear mesh amplitude occurred on the right side at 3000 rpm.
Comparing torques to varying speeds, for gear set L1515R5050-2, the amplitudes of the gear meshincreased with higher torques for all speeds. The TSA increased with higher torques for all speeds exceptat 3500 rpm on the right gear. Further investigation is warranted to determine the cause of this response.
Accelerometer response changed with varying loads, speeds, gear sets and damage levels. Overall, theright side was more sensitive to changes in speed and load. Due to the environmental conditions affectingvibration response, isolating a relationship between structural FRF response and dynamic conditions waschallenging for these datasets. The FRFs and coherence from Figure 10 are plotted in Figures 18 and 19 at104 and 29 percent load with expanded scales of 0 to 1000 Hz and 1000 to 2000 Hz. The purpose was todetermine if the FRFs at the frequencies tested would indicate the observed responses while the rig wasrotating. Higher amplitude resonances were observed under low load conditions at lower frequenciespossibly indicating the varying response at the lower speeds and loads. However, no unusual responsenear 2500 rpm (42 Hz) that corresponds to 1708 Hz GM was noted. But according to Figure 10, theresonant frequency appears to be at 3.2 kHz with a larger rise in amplitude between 3.4 and 3.8 kHz whencompared to the response at other frequencies. The 2nd harmonic of gear mesh at 2500 rpm is equal to3.4 kHz. The 2nd harmonic of the gear mesh for this speed was equal to or larger than the 1st for two of thegears tested.

NASA/TM—2013-216617 19
Figure 18.—FRF, Coherence and CDF at 104 percent load measured on right and left.
0 0.1 0.2 0.3 0.4 0.5 0.6 0.7 0.8 0.9 110
-5
10-4
10-3
10-2
10-1
Frequency (kHz)
HF Accel Left and Right, vert. imp. on left pin at 8283 lb-in preload
HF Accel LeftHF Accel Right
0 0.1 0.2 0.3 0.4 0.5 0.6 0.7 0.8 0.9 10
0.1
0.2
0.3
0.4
0.5
0.6
0.7
0.8
0.9
1
Frequency (kHz)
HF Accel Left and Right Coherence, vert. imp. on left pin at 8283 lb-in preload
HF Accel LeftHF Accel Right
1 1.1 1.2 1.3 1.4 1.5 1.6 1.7 1.8 1.9 210
-5
10-4
10-3
10-2
10-1
Frequency (kHz)
HF Accel Left and Right, vert. imp. on left pin at 8283 lb-in preload
HF Accel LeftHF Accel Right
1 1.1 1.2 1.3 1.4 1.5 1.6 1.7 1.8 1.9 20.4
0.5
0.6
0.7
0.8
0.9
1
Frequency (kHz)
HF Accel Left and Right Coherence, vert. imp. on left pin at 8283 lb-in preload
HF Accel LeftHF Accel Right

NASA/TM—2013-216617 20
Figure 19.—FRF, Coherence and CDF at 29 percent load measured on right and left.
0 0.1 0.2 0.3 0.4 0.5 0.6 0.7 0.8 0.9 110
-4
10-3
10-2
10-1
Frequency (kHz)
HF Accel Left and Right FRF for vertical impact on left pinion
HF Accel LeftHF Accel Right
0 0.1 0.2 0.3 0.4 0.5 0.6 0.7 0.8 0.9 10.2
0.4
0.6
0.8
1
Frequency (kHz)
HF Accel Left and Right Coherence for vertical impact on left pinion
HF Accel LeftHF Accel Right
1 1.1 1.2 1.3 1.4 1.5 1.6 1.7 1.8 1.9 210-4
10-3
10-2
10-1
Frequency (kHz)
HF Accel Left and Right FRF for vertical impact on left pinion
HF Accel LeftHF Accel Right
1 1.1 1.2 1.3 1.4 1.5 1.6 1.7 1.8 1.9 20.85
0.9
0.95
1
Frequency (kHz)
HF Accel Left and Right Coherence for vertical impact on left pinion
HF Accel LeftHF Accel Right

NASA/TM—2013-216617 21
Comparison of the Spiral Bevel Geared SystemsOne objective of making FRF measurements on the test rig was to compare them to the NGB fixture
and the helicopter NGB to determine if measuring the behavior of the structure under static conditions canprovide any insight into CI performance between the helicopter and test rig. Measurements were made inthe NGB fixture with the actuator on the ring gear and compared to measurements made with the actuatorinstalled on the ring gear within the test rig banded around each system’s gear mesh frequencies atspecific torques.
FRFs and coherence were measured with the Dytran accelerometer with the shaker on the ring gear,at a frequency band that contains 3 sidebands around the gear mesh. These measurements were taken at20 and 107 percent load conditions. These plots and the corrresponding CDF plots are shown inFigure 20. The KS Similarity factor within this narrow frequency band between these two loads was equalto 0.68. The coherence improved at the higher load. The shape of the FRF signature changed at the higherload illustrating the importance of assessing the similarities of frequency response within frequencies ofinterest.
NASA/TM—2013-216617 22
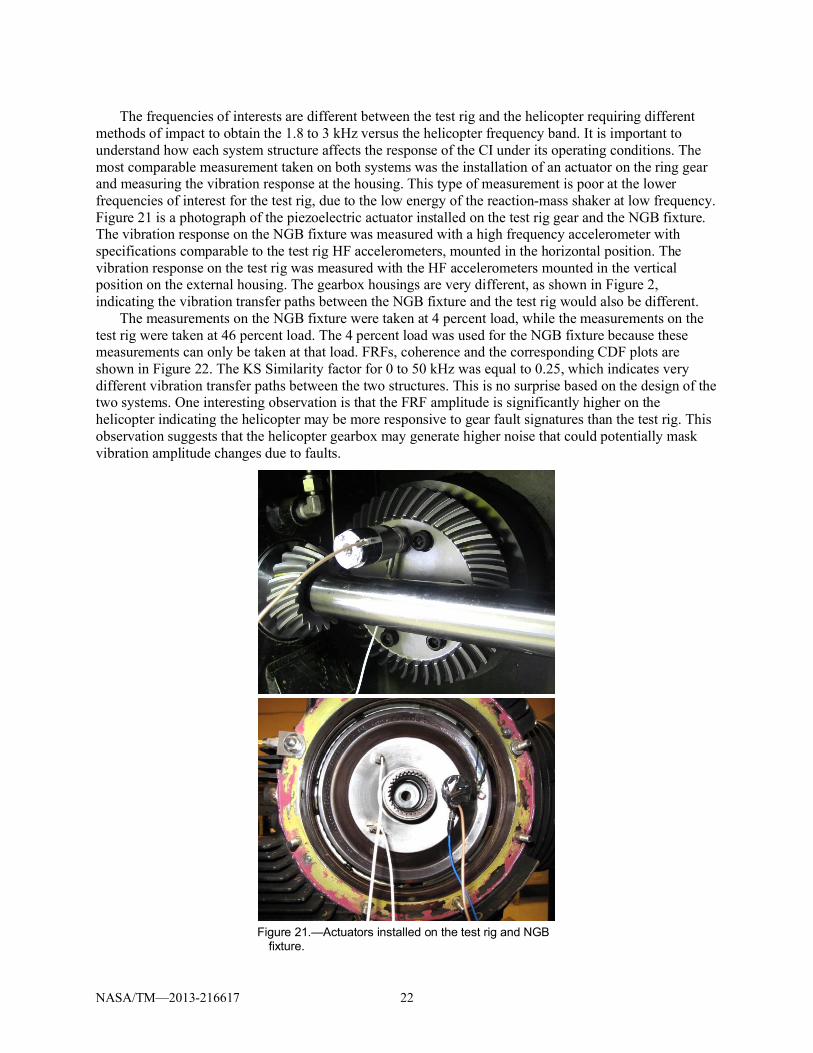
The frequencies of interests are different between the test rig and the helicopter requiring differentmethods of impact to obtain the 1.8 to 3 kHz versus the helicopter frequency band. It is important tounderstand how each system structure affects the response of the CI under its operating conditions. Themost comparable measurement taken on both systems was the installation of an actuator on the ring gearand measuring the vibration response at the housing. This type of measurement is poor at the lowerfrequencies of interest for the test rig, due to the low energy of the reaction-mass shaker at low frequency.Figure 21 is a photograph of the piezoelectric actuator installed on the test rig gear and the NGB fixture.The vibration response on the NGB fixture was measured with a high frequency accelerometer withspecifications comparable to the test rig HF accelerometers, mounted in the horizontal position. Thevibration response on the test rig was measured with the HF accelerometers mounted in the verticalposition on the external housing. The gearbox housings are very different, as shown in Figure 2,indicating the vibration transfer paths between the NGB fixture and the test rig would also be different.
The measurements on the NGB fixture were taken at 4 percent load, while the measurements on thetest rig were taken at 46 percent load. The 4 percent load was used for the NGB fixture because thesemeasurements can only be taken at that load. FRFs, coherence and the corresponding CDF plots areshown in Figure 22. The KS Similarity factor for 0 to 50 kHz was equal to 0.25, which indicates verydifferent vibration transfer paths between the two structures. This is no surprise based on the design of thetwo systems. One interesting observation is that the FRF amplitude is significantly higher on thehelicopter indicating the helicopter may be more responsive to gear fault signatures than the test rig. Thisobservation suggests that the helicopter gearbox may generate higher noise that could potentially maskvibration amplitude changes due to faults.
Figure 21.—Actuators installed on the test rig and NGBfixture.

NASA/TM—2013-216617 23

NASA/TM—2013-216617 24
SummaryTransfer path measurements taken on the test rig to assess the utility of static vibration transfer paths
in assessing dynamic gear CI performance provided some insight into gear condition indicatorperformance. Varying load affected the transfer paths within specific frequency bands used for gearcondition indicators. The unique design of the test rig caused a coupling between the right and leftgearbox through the shaft indicating difficulties in isolating pinion tooth damage on one side of thegearbox. Both the high frequency and the helicopter accelerometers responded similarly to the sameimpact indicating both can be used for CI development. Measuring the dynamic behavior of the structurein specific frequency bands under static conditions using frequency response functions (FRF) providedlimited insight into spiral bevel gear CI performance under dynamic conditions. The amplitude of the gearmesh and TSA values increased with higher torques. A resonance near gear mesh under static conditionscaused unusual dynamic response when operated at this frequency. The comparison of the FRFs betweenthe helicopter NGB and the test rig was challenging since the frequencies of interest are different for bothsystems and measurements were not taken under comparable loads. However, one interesting observationwas that the FRF amplitude measured on the helicopter NGB was significantly higher than that measuredon the test rig indicating the helicopter may be more responsive to gear faults. Based on these analyses,although some useful information can be gleaned and perceived from static transfer path measurements,the system structure, such as test rig, helicopter NGB, NGB fixture does not significantly affect thevibration response of an accelerometer to the dynamic gear mesh signatures. It is more important tounderstand the dynamic characteristics unique to each system to be used for CI development that affectindividual gear CI response for a healthy and damaged tooth.
References1. Dempsey, P.J., Brandon, E.B., “Validation of Helicopter Gear Condition Indicators Using Seeded
Fault Tests,” NASA/TM—2013-217872, April 2013.2. Antolick, L.J., Branning, J.S., Wade, D.R., and Dempsey, P.J., “Evaluation of Gear Condition
Indicator Performance on Rotorcraft Fleet,” American Helicopter Society 66th Annual ForumProceedings, Phoenix, Arizona, May 11-13, 2010.
3. Delgado, I.R., Dempsey, P.J., Antolick, L.J., and Wade, D.R., “Continued Evaluation of GearCondition Indicator Performance on Rotorcraft Fleet,” American Helicopter Society ConditionBased Maintenance Specialist Meeting, February 2013.
4. Islam, A., Demspey, P., Feldman, J. and Larsen, C., “Characterization and Comparison of VibrationTransfer Paths in a Helicopter Gearbox and a Fixture Mounted Gearbox.” NASA TM-216586,September 2013.
5. Handschuh, R.F.: Thermal Behavior of Spiral Bevel Gears. NASA TM-106518, 1995.6. Handschuh, R.F.: Testing of Face-Milled Spiral Bevel Gears at High-Speed and Load.
NASA/TM—2001-210743, 2001.7. Stewart, R.M. 1977. Some useful data analysis techniques for gearbox diagnostics. Machine Health
Monitoring Group, Institute of Sound and Vibration Research, University of Southhampton, ReportMHM/R/10/77, July 1977.
8. Zakrajsek, J.J. 1989. An investigation of gear mesh failure prediction techniques.NASA TM–102340, AVSCOM TM 89–C-005.
9. Massey, F.J. “The Kolmogorov-Smirnov Test for Goodness of Fit.” Journal of the AmericanStatistical Association. vol. 46, no. 253, 1951, pp. 68–78.

