investigation of hydraulic-mechanical properties of paste
TRANSCRIPT
University of Wollongong University of Wollongong
Research Online Research Online
Faculty of Engineering and Information Sciences - Papers: Part B
Faculty of Engineering and Information Sciences
2017
Investigation of hydraulic-mechanical properties of paste backfill Investigation of hydraulic-mechanical properties of paste backfill
containing coal gangue-fly ash and its application in an containing coal gangue-fly ash and its application in an
underground coal mine underground coal mine
Xinguo Zhang Shandong University of Science And Technology, [email protected]
Jia Lin University of Wollongong, [email protected]
Jinxiao Liu Shandong University of Science And Technology, [email protected]
Fei Li Shandong University of Science And Technology, [email protected]
Zhenzhong Pang Shandong University of Science And Technology, [email protected]
Follow this and additional works at: https://ro.uow.edu.au/eispapers1
Part of the Engineering Commons, and the Science and Technology Studies Commons
Recommended Citation Recommended Citation Zhang, Xinguo; Lin, Jia; Liu, Jinxiao; Li, Fei; and Pang, Zhenzhong, "Investigation of hydraulic-mechanical properties of paste backfill containing coal gangue-fly ash and its application in an underground coal mine" (2017). Faculty of Engineering and Information Sciences - Papers: Part B. 685. https://ro.uow.edu.au/eispapers1/685
Research Online is the open access institutional repository for the University of Wollongong. For further information contact the UOW Library: [email protected]
Investigation of hydraulic-mechanical properties of paste backfill containing coal Investigation of hydraulic-mechanical properties of paste backfill containing coal gangue-fly ash and its application in an underground coal mine gangue-fly ash and its application in an underground coal mine
Abstract Abstract Backfilling is widely used to control surface subsidence and stope stability to improve pillar recovery. Furthermore, it is also an effective way to process and dispose of mining waste such as coal gangue and tailings. In this study, the hydraulic-mechanical properties of cemented paste backfill materials (CPB) were investigated. Twenty-eight cemented coal gangue-fly ash backfill mixtures were prepared with different water, cement, fly ash and coal gangue content and the slump, segregation and water bleeding ratio tests were conducted. Increasing fly ash content increased the slump value and decreased the segregation value of the slurry. The uniaxial compressive strength (UCS) of the cemented coal gangue-fly ash backfill samples were tested at different curing times. Based on the test results, an optimized recipe was used for the field trial. Longwall cut and backfilling mining method was used in the 2300 mining district to recycle the coal pillar between longwall 2301 and 2302. Both stress and displacement meters were installed in the goaf and their performance was monitored continuously. An increase in stress and displacement values were observed to occur with the working face advanced (up to 325 m and 375 m, respectively); thereafter, a trend of stabilization was observed. The monitoring results suggest that the backfills can efficiently control the roof movement and surface subsidence as well as improve pillar recovery.
Disciplines Disciplines Engineering | Science and Technology Studies
Publication Details Publication Details Zhang, X., Lin, J., Liu, J., Li, F. & Pang, Z. (2017). Investigation of hydraulic-mechanical properties of paste backfill containing coal gangue-fly ash and its application in an underground coal mine. Energies, 10 (9), 1309-1-1309-19.
This journal article is available at Research Online: https://ro.uow.edu.au/eispapers1/685
energies
Article
Investigation of Hydraulic-Mechanical Properties ofPaste Backfill Containing Coal Gangue-Fly Ash andIts Application in an Underground Coal Mine
Xinguo Zhang 1, Jia Lin 2,* ID , Jinxiao Liu 1,3, Fei Li 3 and Zhenzhong Pang 3
1 State Key Laboratory of Mining Disaster Prevention and Control Co-Founded by Shandong Province andthe Ministry of Science and Technology, Shandong University of Science and Technology, Qingdao 266590,China; [email protected] (X.Z.); [email protected] (J.L.)
2 School of Civil, Mining and Environmental Engineering, University of Wollongong, Wollongong,NSW 2500, Australia
3 College of Mining and Safety Engineering, Shandong University of Science and Technology, Qingdao 266590,China; [email protected] (F.L.); [email protected] (Z.P.)
* Correspondence: [email protected]; Tel.: +61-404-303-654
Received: 6 July 2017; Accepted: 28 August 2017; Published: 1 September 2017
Abstract: Backfilling is widely used to control surface subsidence and stope stability to improve pillarrecovery. Furthermore, it is also an effective way to process and dispose of mining waste such as coalgangue and tailings. In this study, the hydraulic-mechanical properties of cemented paste backfillmaterials (CPB) were investigated. Twenty-eight cemented coal gangue-fly ash backfill mixtures wereprepared with different water, cement, fly ash and coal gangue content and the slump, segregationand water bleeding ratio tests were conducted. Increasing fly ash content increased the slump valueand decreased the segregation value of the slurry. The uniaxial compressive strength (UCS) ofthe cemented coal gangue-fly ash backfill samples were tested at different curing times. Based onthe test results, an optimized recipe was used for the field trial. Longwall cut and backfilling miningmethod was used in the 2300 mining district to recycle the coal pillar between longwall 2301 and 2302.Both stress and displacement meters were installed in the goaf and their performance was monitoredcontinuously. An increase in stress and displacement values were observed to occur with the workingface advanced (up to 325 m and 375 m, respectively); thereafter, a trend of stabilization was observed.The monitoring results suggest that the backfills can efficiently control the roof movement and surfacesubsidence as well as improve pillar recovery.
Keywords: cemented coal gangue-fly ash backfill; coal gangue; fly ash; uniaxial compressive strength;stress and displacement monitoring; subsidence
1. Introduction
Backfilling is an effective way to control surface subsidence introduced by underground miningactivities [1–3]. Surface subsidence is especially obvious when coal mines are operated at a relativelyshallow depth. Another attractive aspect is that the materials usually used in backfill mining aretailings or coal gangue, which are generated during ore or coal processing in plants. The disposaland treatment of these mining waste products can be a serious problem in many countries as theseproducts can cause environmental issues [4–9]. Cemented paste backfill (CPB) is a widely usedbackfilling method that can significantly improve mining stopes stability in underground hard rockmines, or reduce surface subsidence in underground coal mines [10–14]. Typically CPB materials areproduced with three ingredients: mining tailings (in underground hard rock mines) or coal gangue(in underground coal mines); hydraulic binders, e.g., ordinary Portland cement (OPC), slag, fly ash,etc.; and water [15–18].
Energies 2017, 10, 1309; doi:10.3390/en10091309 www.mdpi.com/journal/energies
Energies 2017, 10, 1309 2 of 19
The strength of CPB (which is determined by its composition) is usually used to evaluatethe backfilling results and many researchers have investigated the effect of different parameterson short- or long-term strength and durability [6,19–25]. Generally a binder content of less than10 wt % is used to generate CPB and its uniaxial compressive strength (UCS) can reach up to 5 MPaafter a curing time of three months [26]. Fly ash is also used to produce CPB material for undergroundcoal mines especially when large amounts of CPB materials are needed. On one hand, fly ash canpartially replace cement to reduce the cost of the binder. Fly ash reacts with calcium hydroxide duringthe hydration process and increases the strength of CPB. On the other hand, the grain size of coalgangue used in the CPB generation process is much larger than that of the tailings generated duringhard rock ore processing. For example, the grain size of a tailings sample can be 78.7% under 75 µmand the fine content can reach 83 wt %. Approximately 95% of the tailings sample were under the sizeof 300 µm [5]. For the coal gangue, which is usually a kind of large rock, its maximum size can reach50 mm, depending how fine the crusher is.
Aside from fly ash, other industrial waste products are also used in the CPB production process.Ercikdi et al. [22] conducted a series of experiments to investigate the strength of CPB materialswith different additives including waste glass, fly ash, granulated blast furnace slag, and fumedsilica. It was observed that these pozzolanic additives for the partial replacement of OPC decreasedthe strength of CPB in short-term and long-term except for fumed silica. Benzaazoua et al. [27]investigated the physical, chemical, and mineralogical characteristics of the CPB materials and showedthat the sulfides in the tailings caused chemical reactions promoting deterioration of the CPB. The useof fly ash in CPB materials can reduce the strength deterioration. Besides investigations into differentadditives, other studies have also been conducted on the chemical, mineralogical, and physicalcharacterization of CPB with different tailings or coal gangue, cement and water [15,20,23,28–33].
The microstructure of CPB can explain its physical and mechanical performance. Usuallythe porosity, specific interval surface, and pore diameter are the primary parameters requiring carefulstudy. Mercury intrusion porosity (MIP) analysis, scanning electron microscopy (SEM) analysis andcomputed tomography (CT) scan are widely used methods to analyze the CPB microstructures [5,28,34].Many factors contribute to the microstructure of CPB, including particle size, chemical content(e.g., sulfates), surrounding environment during the CPB’s hardening process, etc. [15]. Additionally,temperature and solid humidity have effects on the microstructure of the CPB. A numerical modelwas developed by Nasir and Fall [35] to predict the strength of CPB where the binder hydration,temperature, and compressive strength were coupled to evaluate CPB. The relationship betweenmicrostructure and UCS was also studied by Yilmaz et al. [36]. MIP total porosity was dependent onthe water to cement (w/c) ratio, cure time, and consolidation conditions. An exponential decrease ofUCS was observed with increasing porosity, and a linear model was used to describe UCS and specificsurface area.
From previous studies, it could be seen that most of research focused on the properties of CPB andless on its field application. Especially in underground coal mines, coal gangue as the primary materialwas even less studied. The mechanical properties (e.g., Young’s modulus and passion ratio) havebeen investigated by many researchers; however, the hydraulic characteristics (workability/slumptest, bleeding and segregation) of CPB less so. In this paper, coal gangue was used to producethe CPB materials and fly ash was added to partially replace the OPC. Hydraulic-mechanical tests,including the UCS test, slump, bleeding and segregation test, were conducted. An orthogonal designmethod [37–39] was adopted to optimize the materials (coal gangue, fly ash, cement) dosage. Finally,the chosen CPB materials were used in an underground coal mine in Shandong Province, China, tomonitor the performance of backfilling.
Energies 2017, 10, 1309 3 of 19
2. Materials and Methods
2.1. Characterization of Components
2.1.1. Coal Gangue
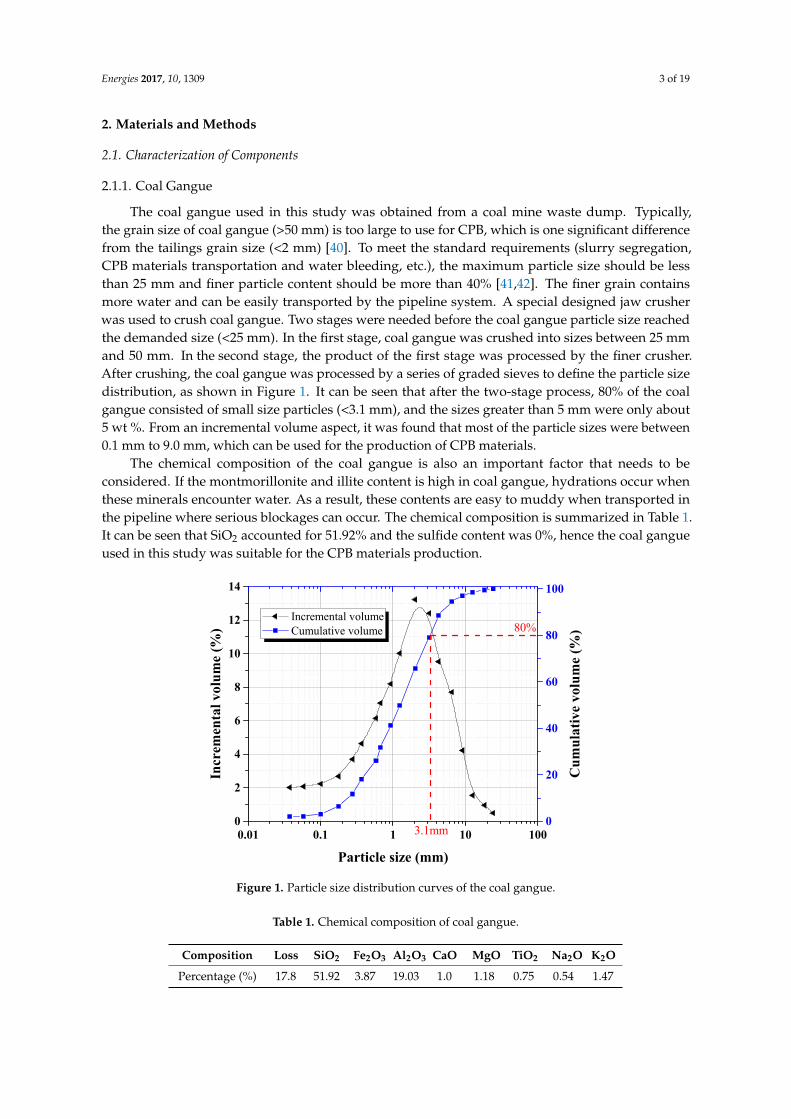
The coal gangue used in this study was obtained from a coal mine waste dump. Typically,the grain size of coal gangue (>50 mm) is too large to use for CPB, which is one significant differencefrom the tailings grain size (<2 mm) [40]. To meet the standard requirements (slurry segregation,CPB materials transportation and water bleeding, etc.), the maximum particle size should be lessthan 25 mm and finer particle content should be more than 40% [41,42]. The finer grain containsmore water and can be easily transported by the pipeline system. A special designed jaw crusherwas used to crush coal gangue. Two stages were needed before the coal gangue particle size reachedthe demanded size (<25 mm). In the first stage, coal gangue was crushed into sizes between 25 mmand 50 mm. In the second stage, the product of the first stage was processed by the finer crusher.After crushing, the coal gangue was processed by a series of graded sieves to define the particle sizedistribution, as shown in Figure 1. It can be seen that after the two-stage process, 80% of the coalgangue consisted of small size particles (<3.1 mm), and the sizes greater than 5 mm were only about5 wt %. From an incremental volume aspect, it was found that most of the particle sizes were between0.1 mm to 9.0 mm, which can be used for the production of CPB materials.
The chemical composition of the coal gangue is also an important factor that needs to beconsidered. If the montmorillonite and illite content is high in coal gangue, hydrations occur whenthese minerals encounter water. As a result, these contents are easy to muddy when transported inthe pipeline where serious blockages can occur. The chemical composition is summarized in Table 1.It can be seen that SiO2 accounted for 51.92% and the sulfide content was 0%, hence the coal gangueused in this study was suitable for the CPB materials production.
Energies 2017, 10, 1309 3 of 19
2.1.1. Coal Gangue
The coal gangue used in this study was obtained from a coal mine waste dump. Typically, the grain size of coal gangue (>50 mm) is too large to use for CPB, which is one significant difference from the tailings grain size (<2 mm) [40]. To meet the standard requirements (slurry segregation, CPB materials transportation and water bleeding, etc.), the maximum particle size should be less than 25 mm and finer particle content should be more than 40% [41,42]. The finer grain contains more water and can be easily transported by the pipeline system. A special designed jaw crusher was used to crush coal gangue. Two stages were needed before the coal gangue particle size reached the demanded size (<25 mm). In the first stage, coal gangue was crushed into sizes between 25 mm and 50 mm. In the second stage, the product of the first stage was processed by the finer crusher. After crushing, the coal gangue was processed by a series of graded sieves to define the particle size distribution, as shown in Figure 1. It can be seen that after the two-stage process, 80% of the coal gangue consisted of small size particles (<3.1 mm), and the sizes greater than 5 mm were only about 5 wt %. From an incremental volume aspect, it was found that most of the particle sizes were between 0.1 mm to 9.0 mm, which can be used for the production of CPB materials.
The chemical composition of the coal gangue is also an important factor that needs to be considered. If the montmorillonite and illite content is high in coal gangue, hydrations occur when these minerals encounter water. As a result, these contents are easy to muddy when transported in the pipeline where serious blockages can occur. The chemical composition is summarized in Table 1. It can be seen that SiO2 accounted for 51.92% and the sulfide content was 0%, hence the coal gangue used in this study was suitable for the CPB materials production.
0.01 0.1 1 10 1000
2
4
6
8
10
12
14
Incremental volume Cumulative volume
Particle size (mm)
Incr
emen
tal v
olu
me
(%) 80%
3.1mm0
20
40
60
80
100C
um
ula
tive
vol
um
e (%
)
Figure 1. Particle size distribution curves of the coal gangue.
Table 1. Chemical composition of coal gangue.
Composition Loss SiO2 Fe2O3 Al2O3 CaO MgO TiO2 Na2O K2O Percentage (%) 17.8 51.92 3.87 19.03 1.0 1.18 0.75 0.54 1.47
2.1.2. Hydraulic Binder
In this study, OPC was used as the binder and fly ash (type C) was used as the additive in the cement. From the above analysis, it was found the average size was larger than tailings. The addition of fly ash, on one hand, can reduce the total average particle size to avoid a blockage of CPB materials in the transport pipeline. On the other hand, fly ash can reduce the binder cost. The fly ash used in this study was collected from a coal burning power plant near the underground coal mine. Laser particle analyzer (DVM5000HD) (Leica, Wetzlar, Germany) and SEM imaging technology
Figure 1. Particle size distribution curves of the coal gangue.
Table 1. Chemical composition of coal gangue.
Composition Loss SiO2 Fe2O3 Al2O3 CaO MgO TiO2 Na2O K2O
Percentage (%) 17.8 51.92 3.87 19.03 1.0 1.18 0.75 0.54 1.47
Energies 2017, 10, 1309 4 of 19
2.1.2. Hydraulic Binder
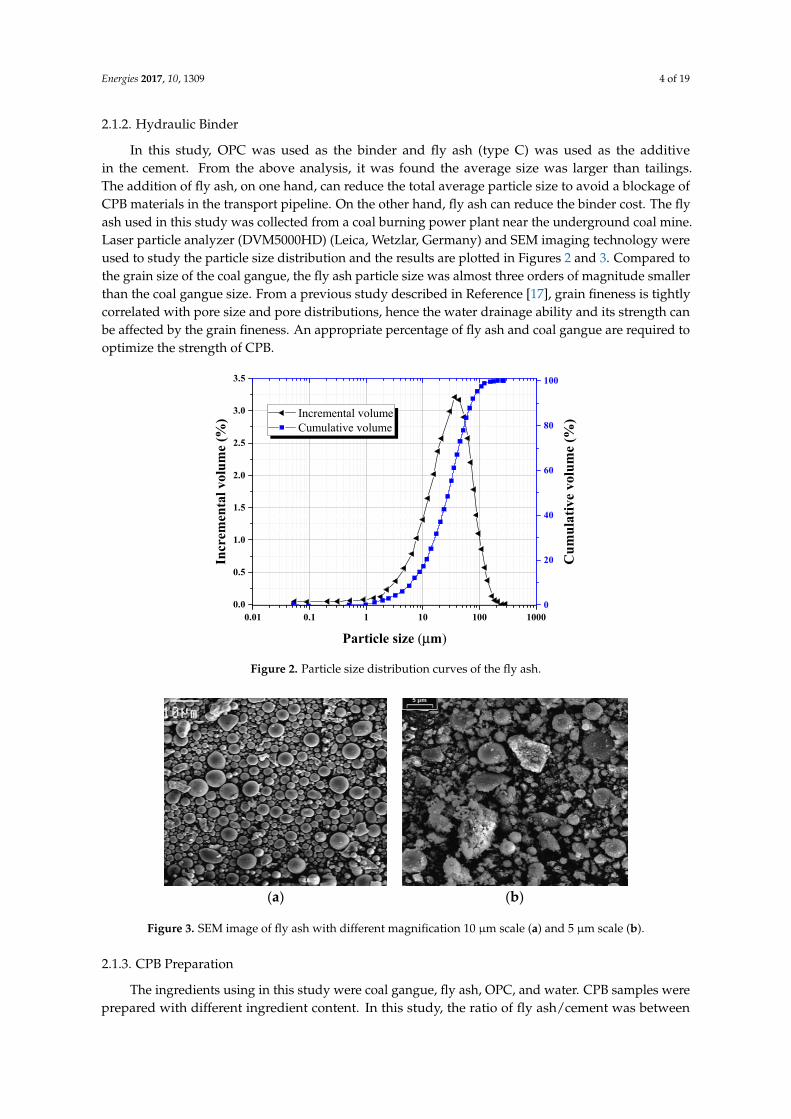
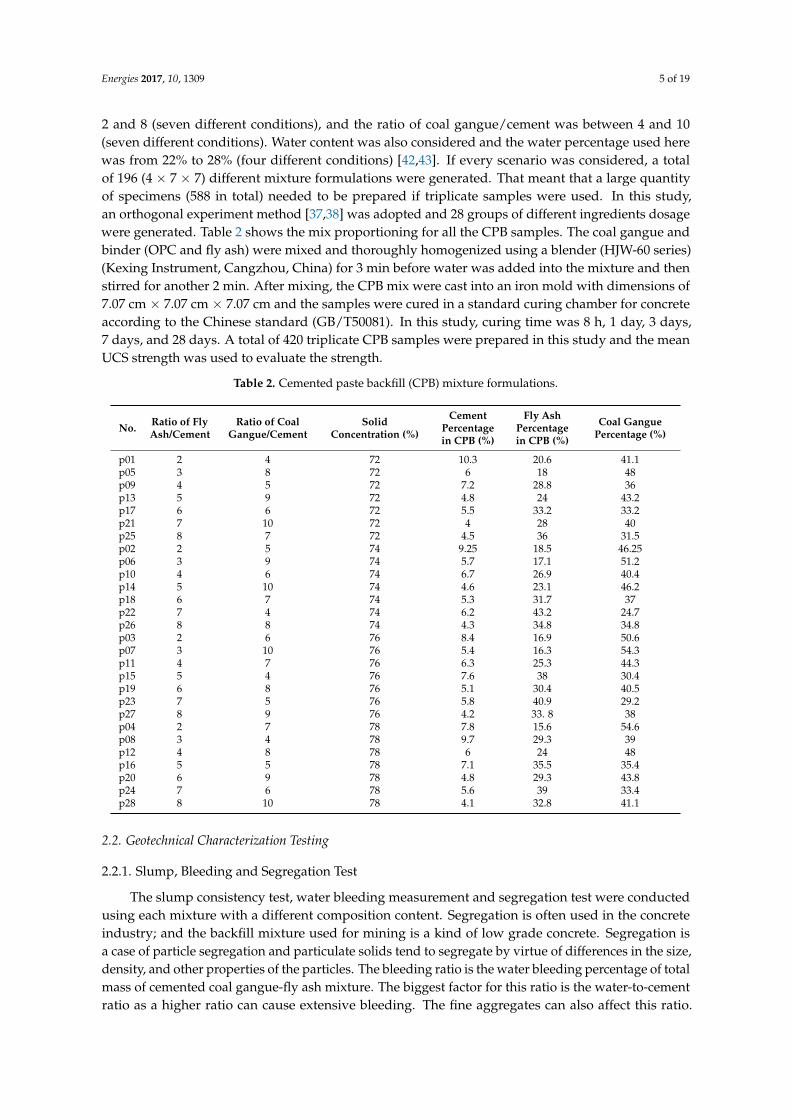
In this study, OPC was used as the binder and fly ash (type C) was used as the additivein the cement. From the above analysis, it was found the average size was larger than tailings.The addition of fly ash, on one hand, can reduce the total average particle size to avoid a blockage ofCPB materials in the transport pipeline. On the other hand, fly ash can reduce the binder cost. The flyash used in this study was collected from a coal burning power plant near the underground coal mine.Laser particle analyzer (DVM5000HD) (Leica, Wetzlar, Germany) and SEM imaging technology wereused to study the particle size distribution and the results are plotted in Figures 2 and 3. Compared tothe grain size of the coal gangue, the fly ash particle size was almost three orders of magnitude smallerthan the coal gangue size. From a previous study described in Reference [17], grain fineness is tightlycorrelated with pore size and pore distributions, hence the water drainage ability and its strength canbe affected by the grain fineness. An appropriate percentage of fly ash and coal gangue are required tooptimize the strength of CPB.
Energies 2017, 10, 1309 4 of 19
were used to study the particle size distribution and the results are plotted in Figures 2 and 3. Compared to the grain size of the coal gangue, the fly ash particle size was almost three orders of magnitude smaller than the coal gangue size. From a previous study described in Reference [17], grain fineness is tightly correlated with pore size and pore distributions, hence the water drainage ability and its strength can be affected by the grain fineness. An appropriate percentage of fly ash and coal gangue are required to optimize the strength of CPB.
0.01 0.1 1 10 100 10000.0
0.5
1.0
1.5
2.0
2.5
3.0
3.5
Incremental volume Cumulative volume
Particle size (μm)
Incr
emen
tal v
olu
me
(%)
0
20
40
60
80
100
Cu
mu
lati
ve v
olum
e (%
)
Figure 2. Particle size distribution curves of the fly ash.
(a)
(b)
Figure 3. SEM image of fly ash with different magnification 10 μm scale (a) and 5 μm scale (b).
2.1.3. CPB Preparation
The ingredients using in this study were coal gangue, fly ash, OPC, and water. CPB samples were prepared with different ingredient content. In this study, the ratio of fly ash/cement was between 2 and 8 (seven different conditions), and the ratio of coal gangue/cement was between 4 and 10 (seven different conditions). Water content was also considered and the water percentage used here was from 22% to 28% (four different conditions) [42,43]. If every scenario was considered, a total of 196 (4 × 7 × 7) different mixture formulations were generated. That meant that a large quantity of specimens (588 in total) needed to be prepared if triplicate samples were used. In this study, an orthogonal experiment method [37,38] was adopted and 28 groups of different ingredients dosage were generated. Table 2 shows the mix proportioning for all the CPB samples. The coal gangue and binder (OPC and fly ash) were mixed and thoroughly homogenized using a blender (HJW-60 series) (Kexing Instrument, Cangzhou, China) for 3 min before water was added into the mixture and then stirred for another 2 min. After mixing, the CPB mix were cast into an iron mold
Figure 2. Particle size distribution curves of the fly ash.
Energies 2017, 10, 1309 4 of 19
were used to study the particle size distribution and the results are plotted in Figures 2 and 3. Compared to the grain size of the coal gangue, the fly ash particle size was almost three orders of magnitude smaller than the coal gangue size. From a previous study described in Reference [17], grain fineness is tightly correlated with pore size and pore distributions, hence the water drainage ability and its strength can be affected by the grain fineness. An appropriate percentage of fly ash and coal gangue are required to optimize the strength of CPB.
0.01 0.1 1 10 100 10000.0
0.5
1.0
1.5
2.0
2.5
3.0
3.5
Incremental volume Cumulative volume
Particle size (μm)
Incr
emen
tal v
olu
me
(%)
0
20
40
60
80
100
Cu
mu
lati
ve v
olum
e (%
)
Figure 2. Particle size distribution curves of the fly ash.
(a)
(b)
Figure 3. SEM image of fly ash with different magnification 10 μm scale (a) and 5 μm scale (b).
2.1.3. CPB Preparation
The ingredients using in this study were coal gangue, fly ash, OPC, and water. CPB samples were prepared with different ingredient content. In this study, the ratio of fly ash/cement was between 2 and 8 (seven different conditions), and the ratio of coal gangue/cement was between 4 and 10 (seven different conditions). Water content was also considered and the water percentage used here was from 22% to 28% (four different conditions) [42,43]. If every scenario was considered, a total of 196 (4 × 7 × 7) different mixture formulations were generated. That meant that a large quantity of specimens (588 in total) needed to be prepared if triplicate samples were used. In this study, an orthogonal experiment method [37,38] was adopted and 28 groups of different ingredients dosage were generated. Table 2 shows the mix proportioning for all the CPB samples. The coal gangue and binder (OPC and fly ash) were mixed and thoroughly homogenized using a blender (HJW-60 series) (Kexing Instrument, Cangzhou, China) for 3 min before water was added into the mixture and then stirred for another 2 min. After mixing, the CPB mix were cast into an iron mold
Figure 3. SEM image of fly ash with different magnification 10 µm scale (a) and 5 µm scale (b).
2.1.3. CPB Preparation
The ingredients using in this study were coal gangue, fly ash, OPC, and water. CPB samples wereprepared with different ingredient content. In this study, the ratio of fly ash/cement was between
Energies 2017, 10, 1309 5 of 19
2 and 8 (seven different conditions), and the ratio of coal gangue/cement was between 4 and 10(seven different conditions). Water content was also considered and the water percentage used herewas from 22% to 28% (four different conditions) [42,43]. If every scenario was considered, a totalof 196 (4 × 7 × 7) different mixture formulations were generated. That meant that a large quantityof specimens (588 in total) needed to be prepared if triplicate samples were used. In this study,an orthogonal experiment method [37,38] was adopted and 28 groups of different ingredients dosagewere generated. Table 2 shows the mix proportioning for all the CPB samples. The coal gangue andbinder (OPC and fly ash) were mixed and thoroughly homogenized using a blender (HJW-60 series)(Kexing Instrument, Cangzhou, China) for 3 min before water was added into the mixture and thenstirred for another 2 min. After mixing, the CPB mix were cast into an iron mold with dimensions of7.07 cm × 7.07 cm × 7.07 cm and the samples were cured in a standard curing chamber for concreteaccording to the Chinese standard (GB/T50081). In this study, curing time was 8 h, 1 day, 3 days,7 days, and 28 days. A total of 420 triplicate CPB samples were prepared in this study and the meanUCS strength was used to evaluate the strength.
Table 2. Cemented paste backfill (CPB) mixture formulations.
No. Ratio of FlyAsh/Cement
Ratio of CoalGangue/Cement
SolidConcentration (%)
CementPercentagein CPB (%)
Fly AshPercentagein CPB (%)
Coal GanguePercentage (%)
p01 2 4 72 10.3 20.6 41.1p05 3 8 72 6 18 48p09 4 5 72 7.2 28.8 36p13 5 9 72 4.8 24 43.2p17 6 6 72 5.5 33.2 33.2p21 7 10 72 4 28 40p25 8 7 72 4.5 36 31.5p02 2 5 74 9.25 18.5 46.25p06 3 9 74 5.7 17.1 51.2p10 4 6 74 6.7 26.9 40.4p14 5 10 74 4.6 23.1 46.2p18 6 7 74 5.3 31.7 37p22 7 4 74 6.2 43.2 24.7p26 8 8 74 4.3 34.8 34.8p03 2 6 76 8.4 16.9 50.6p07 3 10 76 5.4 16.3 54.3p11 4 7 76 6.3 25.3 44.3p15 5 4 76 7.6 38 30.4p19 6 8 76 5.1 30.4 40.5p23 7 5 76 5.8 40.9 29.2p27 8 9 76 4.2 33. 8 38p04 2 7 78 7.8 15.6 54.6p08 3 4 78 9.7 29.3 39p12 4 8 78 6 24 48p16 5 5 78 7.1 35.5 35.4p20 6 9 78 4.8 29.3 43.8p24 7 6 78 5.6 39 33.4p28 8 10 78 4.1 32.8 41.1
2.2. Geotechnical Characterization Testing
2.2.1. Slump, Bleeding and Segregation Test
The slump consistency test, water bleeding measurement and segregation test were conductedusing each mixture with a different composition content. Segregation is often used in the concreteindustry; and the backfill mixture used for mining is a kind of low grade concrete. Segregation isa case of particle segregation and particulate solids tend to segregate by virtue of differences in the size,density, and other properties of the particles. The bleeding ratio is the water bleeding percentage of totalmass of cemented coal gangue-fly ash mixture. The biggest factor for this ratio is the water-to-cementratio as a higher ratio can cause extensive bleeding. The fine aggregates can also affect this ratio.
Energies 2017, 10, 1309 6 of 19
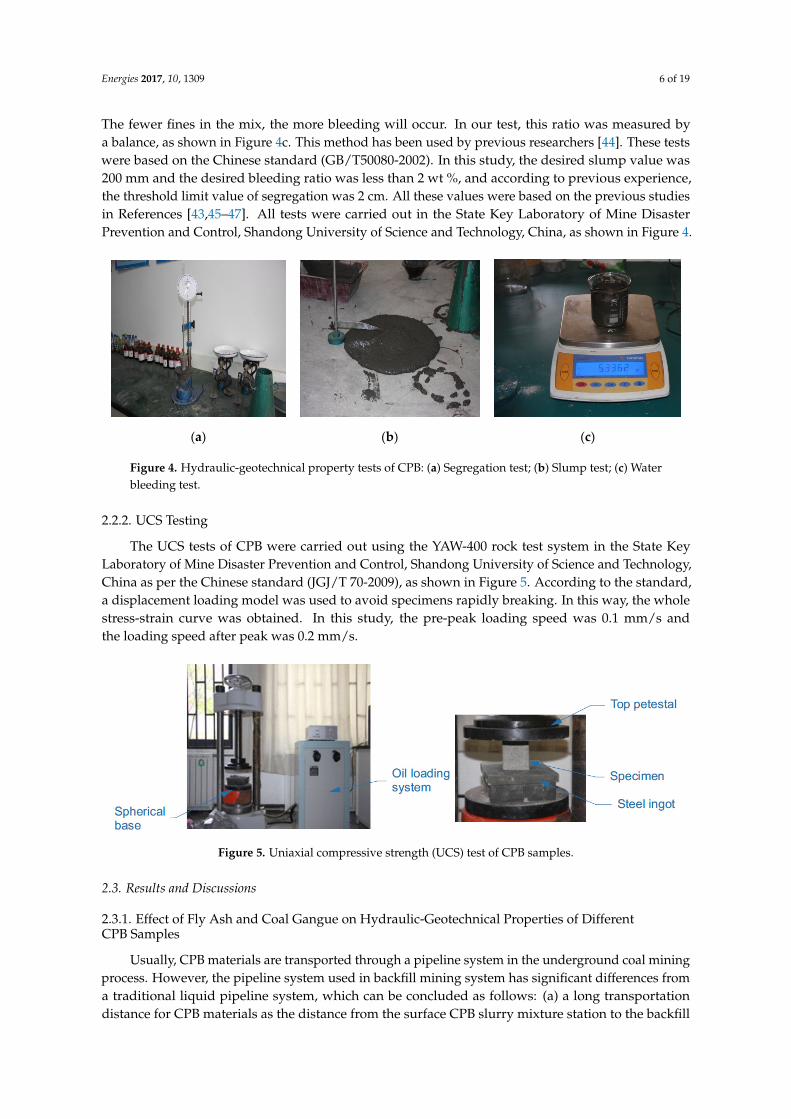
The fewer fines in the mix, the more bleeding will occur. In our test, this ratio was measured bya balance, as shown in Figure 4c. This method has been used by previous researchers [44]. These testswere based on the Chinese standard (GB/T50080-2002). In this study, the desired slump value was200 mm and the desired bleeding ratio was less than 2 wt %, and according to previous experience,the threshold limit value of segregation was 2 cm. All these values were based on the previous studiesin References [43,45–47]. All tests were carried out in the State Key Laboratory of Mine DisasterPrevention and Control, Shandong University of Science and Technology, China, as shown in Figure 4.Energies 2017, 10, 1309 6 of 19
(a) (b) (c)
Figure 4. Hydraulic-geotechnical property tests of CPB: (a) Segregation test; (b) Slump test; (c) Water bleeding test.
2.2.2. UCS Testing
The UCS tests of CPB were carried out using the YAW-400 rock test system in the State Key Laboratory of Mine Disaster Prevention and Control, Shandong University of Science and Technology, China as per the Chinese standard (JGJ/T 70-2009), as shown in Figure 5. According to the standard, a displacement loading model was used to avoid specimens rapidly breaking. In this way, the whole stress-strain curve was obtained. In this study, the pre-peak loading speed was 0.1 mm/s and the loading speed after peak was 0.2 mm/s.
Figure 5. Uniaxial compressive strength (UCS) test of CPB samples.
2.3. Results and Discussions
2.3.1. Effect of Fly Ash and Coal Gangue on Hydraulic-Geotechnical Properties of Different CPB Samples
Usually, CPB materials are transported through a pipeline system in the underground coal mining process. However, the pipeline system used in backfill mining system has significant differences from a traditional liquid pipeline system, which can be concluded as follows: (a) a long transportation distance for CPB materials as the distance from the surface CPB slurry mixture station to the backfill mining stopes may be more than 3 km; and (b) two-phase flow in the pipeline system. At a certain hydraulic-pressure condition, the slurry needs to overcome the frictional resistance induced by collapse between the slurry and pipeline or the internal friction resistance between water and solid materials. Hydraulic-geotechnical properties of CPB materials can significantly affect reliability when used in the underground coal mining production process.
Figure 6 shows the slump property of CPB slurry against fly ash content. From the curves, it was observed that two factors control the slump value: fly ash content, and solid concentration of the CPB slurry. Specifically, the slump value had a positive correlation with the fly ash content increase. For example, with a fly ash content increase from 15% to 45%, the slump value approximately
Figure 4. Hydraulic-geotechnical property tests of CPB: (a) Segregation test; (b) Slump test; (c) Waterbleeding test.
2.2.2. UCS Testing
The UCS tests of CPB were carried out using the YAW-400 rock test system in the State KeyLaboratory of Mine Disaster Prevention and Control, Shandong University of Science and Technology,China as per the Chinese standard (JGJ/T 70-2009), as shown in Figure 5. According to the standard,a displacement loading model was used to avoid specimens rapidly breaking. In this way, the wholestress-strain curve was obtained. In this study, the pre-peak loading speed was 0.1 mm/s andthe loading speed after peak was 0.2 mm/s.
Energies 2017, 10, 1309 6 of 19
(a) (b) (c)
Figure 4. Hydraulic-geotechnical property tests of CPB: (a) Segregation test; (b) Slump test; (c) Water bleeding test.
2.2.2. UCS Testing
The UCS tests of CPB were carried out using the YAW-400 rock test system in the State Key Laboratory of Mine Disaster Prevention and Control, Shandong University of Science and Technology, China as per the Chinese standard (JGJ/T 70-2009), as shown in Figure 5. According to the standard, a displacement loading model was used to avoid specimens rapidly breaking. In this way, the whole stress-strain curve was obtained. In this study, the pre-peak loading speed was 0.1 mm/s and the loading speed after peak was 0.2 mm/s.
Figure 5. Uniaxial compressive strength (UCS) test of CPB samples.
2.3. Results and Discussions
2.3.1. Effect of Fly Ash and Coal Gangue on Hydraulic-Geotechnical Properties of Different CPB Samples
Usually, CPB materials are transported through a pipeline system in the underground coal mining process. However, the pipeline system used in backfill mining system has significant differences from a traditional liquid pipeline system, which can be concluded as follows: (a) a long transportation distance for CPB materials as the distance from the surface CPB slurry mixture station to the backfill mining stopes may be more than 3 km; and (b) two-phase flow in the pipeline system. At a certain hydraulic-pressure condition, the slurry needs to overcome the frictional resistance induced by collapse between the slurry and pipeline or the internal friction resistance between water and solid materials. Hydraulic-geotechnical properties of CPB materials can significantly affect reliability when used in the underground coal mining production process.
Figure 6 shows the slump property of CPB slurry against fly ash content. From the curves, it was observed that two factors control the slump value: fly ash content, and solid concentration of the CPB slurry. Specifically, the slump value had a positive correlation with the fly ash content increase. For example, with a fly ash content increase from 15% to 45%, the slump value approximately
Figure 5. Uniaxial compressive strength (UCS) test of CPB samples.
2.3. Results and Discussions
2.3.1. Effect of Fly Ash and Coal Gangue on Hydraulic-Geotechnical Properties of DifferentCPB Samples
Usually, CPB materials are transported through a pipeline system in the underground coal miningprocess. However, the pipeline system used in backfill mining system has significant differences froma traditional liquid pipeline system, which can be concluded as follows: (a) a long transportationdistance for CPB materials as the distance from the surface CPB slurry mixture station to the backfill
Energies 2017, 10, 1309 7 of 19
mining stopes may be more than 3 km; and (b) two-phase flow in the pipeline system. At a certainhydraulic-pressure condition, the slurry needs to overcome the frictional resistance induced by collapsebetween the slurry and pipeline or the internal friction resistance between water and solid materials.Hydraulic-geotechnical properties of CPB materials can significantly affect reliability when used inthe underground coal mining production process.
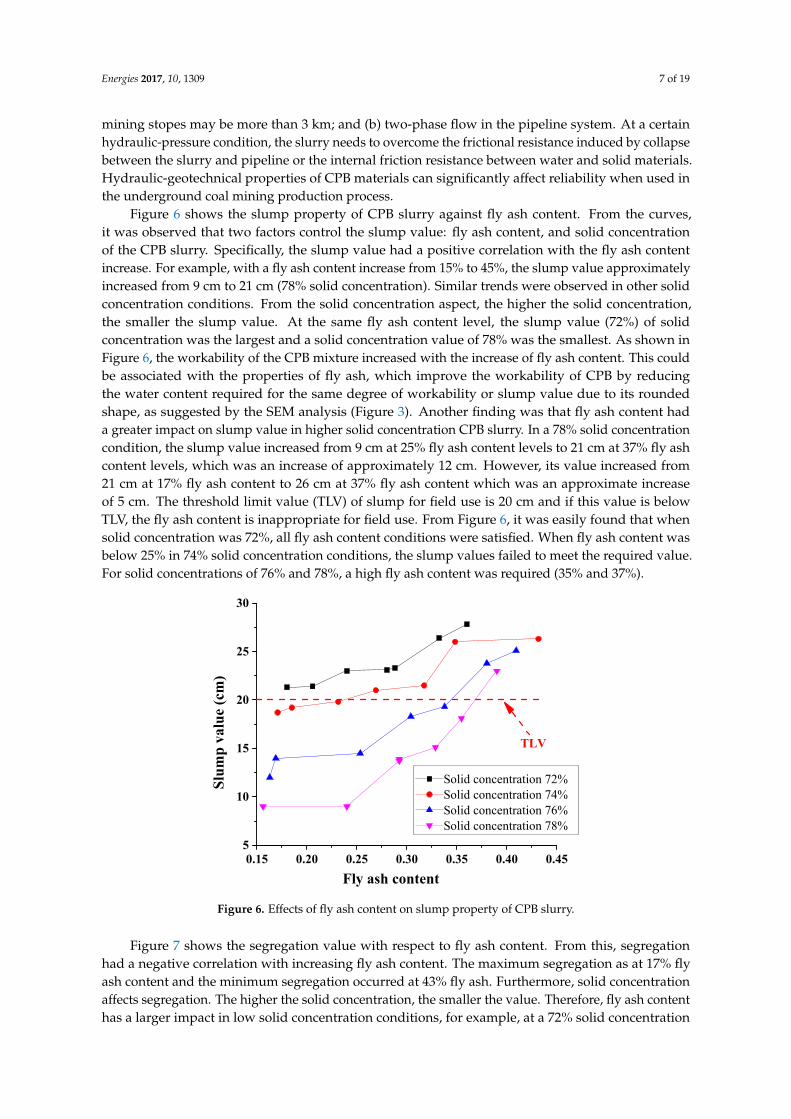
Figure 6 shows the slump property of CPB slurry against fly ash content. From the curves,it was observed that two factors control the slump value: fly ash content, and solid concentrationof the CPB slurry. Specifically, the slump value had a positive correlation with the fly ash contentincrease. For example, with a fly ash content increase from 15% to 45%, the slump value approximatelyincreased from 9 cm to 21 cm (78% solid concentration). Similar trends were observed in other solidconcentration conditions. From the solid concentration aspect, the higher the solid concentration,the smaller the slump value. At the same fly ash content level, the slump value (72%) of solidconcentration was the largest and a solid concentration value of 78% was the smallest. As shown inFigure 6, the workability of the CPB mixture increased with the increase of fly ash content. This couldbe associated with the properties of fly ash, which improve the workability of CPB by reducingthe water content required for the same degree of workability or slump value due to its roundedshape, as suggested by the SEM analysis (Figure 3). Another finding was that fly ash content hada greater impact on slump value in higher solid concentration CPB slurry. In a 78% solid concentrationcondition, the slump value increased from 9 cm at 25% fly ash content levels to 21 cm at 37% fly ashcontent levels, which was an increase of approximately 12 cm. However, its value increased from21 cm at 17% fly ash content to 26 cm at 37% fly ash content which was an approximate increaseof 5 cm. The threshold limit value (TLV) of slump for field use is 20 cm and if this value is belowTLV, the fly ash content is inappropriate for field use. From Figure 6, it was easily found that whensolid concentration was 72%, all fly ash content conditions were satisfied. When fly ash content wasbelow 25% in 74% solid concentration conditions, the slump values failed to meet the required value.For solid concentrations of 76% and 78%, a high fly ash content was required (35% and 37%).
Energies 2017, 10, 1309 7 of 19
increased from 9 cm to 21 cm (78% solid concentration). Similar trends were observed in other solid concentration conditions. From the solid concentration aspect, the higher the solid concentration, the smaller the slump value. At the same fly ash content level, the slump value (72%) of solid concentration was the largest and a solid concentration value of 78% was the smallest. As shown in Figure 6, the workability of the CPB mixture increased with the increase of fly ash content. This could be associated with the properties of fly ash, which improve the workability of CPB by reducing the water content required for the same degree of workability or slump value due to its rounded shape, as suggested by the SEM analysis (Figure 3). Another finding was that fly ash content had a greater impact on slump value in higher solid concentration CPB slurry. In a 78% solid concentration condition, the slump value increased from 9 cm at 25% fly ash content levels to 21 cm at 37% fly ash content levels, which was an increase of approximately 12 cm. However, its value increased from 21 cm at 17% fly ash content to 26 cm at 37% fly ash content which was an approximate increase of 5 cm. The threshold limit value (TLV) of slump for field use is 20 cm and if this value is below TLV, the fly ash content is inappropriate for field use. From Figure 6, it was easily found that when solid concentration was 72%, all fly ash content conditions were satisfied. When fly ash content was below 25% in 74% solid concentration conditions, the slump values failed to meet the required value. For solid concentrations of 76% and 78%, a high fly ash content was required (35% and 37%).
0.15 0.20 0.25 0.30 0.35 0.40 0.455
10
15
20
25
30
Solid concentration 72%Solid concentration 74%Solid concentration 76%Solid concentration 78%
Slu
mp
val
ue
(cm
)
Fly ash content
TLV
Figure 6. Effects of fly ash content on slump property of CPB slurry.
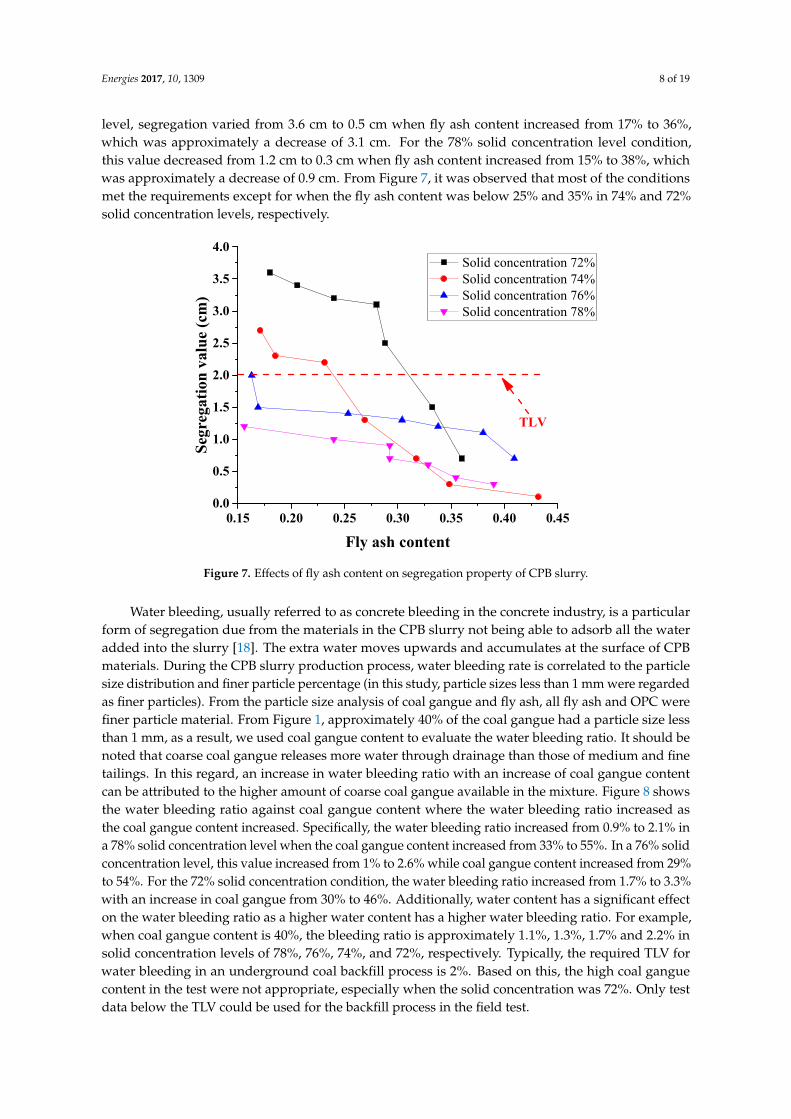
Figure 7 shows the segregation value with respect to fly ash content. From this, segregation had a negative correlation with increasing fly ash content. The maximum segregation as at 17% fly ash content and the minimum segregation occurred at 43% fly ash. Furthermore, solid concentration affects segregation. The higher the solid concentration, the smaller the value. Therefore, fly ash content has a larger impact in low solid concentration conditions, for example, at a 72% solid concentration level, segregation varied from 3.6 cm to 0.5 cm when fly ash content increased from 17% to 36%, which was approximately a decrease of 3.1 cm. For the 78% solid concentration level condition, this value decreased from 1.2 cm to 0.3 cm when fly ash content increased from 15% to 38%, which was approximately a decrease of 0.9 cm. From Figure 7, it was observed that most of the conditions met the requirements except for when the fly ash content was below 25% and 35% in 74% and 72% solid concentration levels, respectively.
Figure 6. Effects of fly ash content on slump property of CPB slurry.
Figure 7 shows the segregation value with respect to fly ash content. From this, segregationhad a negative correlation with increasing fly ash content. The maximum segregation as at 17% flyash content and the minimum segregation occurred at 43% fly ash. Furthermore, solid concentrationaffects segregation. The higher the solid concentration, the smaller the value. Therefore, fly ash contenthas a larger impact in low solid concentration conditions, for example, at a 72% solid concentration
Energies 2017, 10, 1309 8 of 19
level, segregation varied from 3.6 cm to 0.5 cm when fly ash content increased from 17% to 36%,which was approximately a decrease of 3.1 cm. For the 78% solid concentration level condition,this value decreased from 1.2 cm to 0.3 cm when fly ash content increased from 15% to 38%, whichwas approximately a decrease of 0.9 cm. From Figure 7, it was observed that most of the conditionsmet the requirements except for when the fly ash content was below 25% and 35% in 74% and 72%solid concentration levels, respectively.
Energies 2017, 10, 1309 8 of 19
0.15 0.20 0.25 0.30 0.35 0.40 0.450.0
0.5
1.0
1.5
2.0
2.5
3.0
3.5
4.0
Seg
rega
tion
val
ue
(cm
)
Fly ash content
Solid concentration 72% Solid concentration 74% Solid concentration 76% Solid concentration 78%
TLV
Figure 7. Effects of fly ash content on segregation property of CPB slurry.
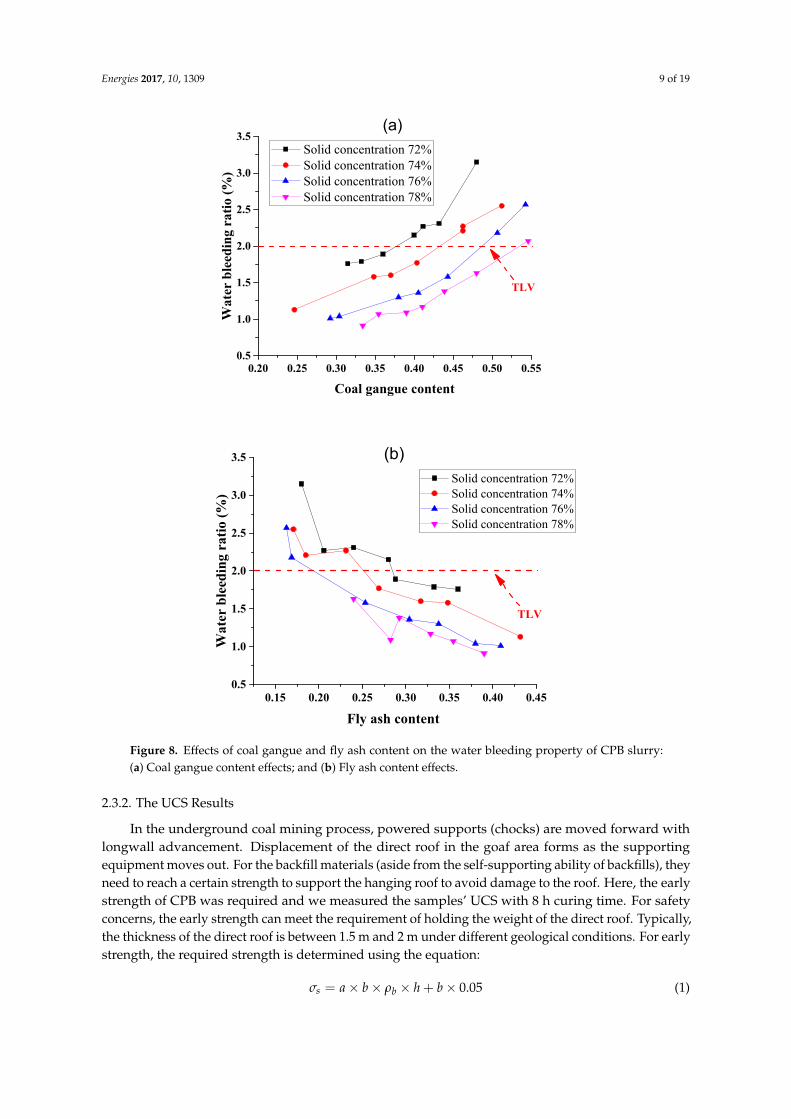
Water bleeding, usually referred to as concrete bleeding in the concrete industry, is a particular form of segregation due from the materials in the CPB slurry not being able to adsorb all the water added into the slurry [18]. The extra water moves upwards and accumulates at the surface of CPB materials. During the CPB slurry production process, water bleeding rate is correlated to the particle size distribution and finer particle percentage (in this study, particle sizes less than 1 mm were regarded as finer particles). From the particle size analysis of coal gangue and fly ash, all fly ash and OPC were finer particle material. From Figure 1, approximately 40% of the coal gangue had a particle size less than 1 mm, as a result, we used coal gangue content to evaluate the water bleeding ratio. It should be noted that coarse coal gangue releases more water through drainage than those of medium and fine tailings. In this regard, an increase in water bleeding ratio with an increase of coal gangue content can be attributed to the higher amount of coarse coal gangue available in the mixture. Figure 8 shows the water bleeding ratio against coal gangue content where the water bleeding ratio increased as the coal gangue content increased. Specifically, the water bleeding ratio increased from 0.9% to 2.1% in a 78% solid concentration level when the coal gangue content increased from 33% to 55%. In a 76% solid concentration level, this value increased from 1% to 2.6% while coal gangue content increased from 29% to 54%. For the 72% solid concentration condition, the water bleeding ratio increased from 1.7% to 3.3% with an increase in coal gangue from 30% to 46%. Additionally, water content has a significant effect on the water bleeding ratio as a higher water content has a higher water bleeding ratio. For example, when coal gangue content is 40%, the bleeding ratio is approximately 1.1%, 1.3%, 1.7% and 2.2% in solid concentration levels of 78%, 76%, 74%, and 72%, respectively. Typically, the required TLV for water bleeding in an underground coal backfill process is 2%. Based on this, the high coal gangue content in the test were not appropriate, especially when the solid concentration was 72%. Only test data below the TLV could be used for the backfill process in the field test.
Figure 7. Effects of fly ash content on segregation property of CPB slurry.
Water bleeding, usually referred to as concrete bleeding in the concrete industry, is a particularform of segregation due from the materials in the CPB slurry not being able to adsorb all the wateradded into the slurry [18]. The extra water moves upwards and accumulates at the surface of CPBmaterials. During the CPB slurry production process, water bleeding rate is correlated to the particlesize distribution and finer particle percentage (in this study, particle sizes less than 1 mm were regardedas finer particles). From the particle size analysis of coal gangue and fly ash, all fly ash and OPC werefiner particle material. From Figure 1, approximately 40% of the coal gangue had a particle size lessthan 1 mm, as a result, we used coal gangue content to evaluate the water bleeding ratio. It should benoted that coarse coal gangue releases more water through drainage than those of medium and finetailings. In this regard, an increase in water bleeding ratio with an increase of coal gangue contentcan be attributed to the higher amount of coarse coal gangue available in the mixture. Figure 8 showsthe water bleeding ratio against coal gangue content where the water bleeding ratio increased asthe coal gangue content increased. Specifically, the water bleeding ratio increased from 0.9% to 2.1% ina 78% solid concentration level when the coal gangue content increased from 33% to 55%. In a 76% solidconcentration level, this value increased from 1% to 2.6% while coal gangue content increased from 29%to 54%. For the 72% solid concentration condition, the water bleeding ratio increased from 1.7% to 3.3%with an increase in coal gangue from 30% to 46%. Additionally, water content has a significant effecton the water bleeding ratio as a higher water content has a higher water bleeding ratio. For example,when coal gangue content is 40%, the bleeding ratio is approximately 1.1%, 1.3%, 1.7% and 2.2% insolid concentration levels of 78%, 76%, 74%, and 72%, respectively. Typically, the required TLV forwater bleeding in an underground coal backfill process is 2%. Based on this, the high coal ganguecontent in the test were not appropriate, especially when the solid concentration was 72%. Only testdata below the TLV could be used for the backfill process in the field test.
Energies 2017, 10, 1309 9 of 19Energies 2017, 10, 1309 9 of 19
0.20 0.25 0.30 0.35 0.40 0.45 0.50 0.550.5
1.0
1.5
2.0
2.5
3.0
3.5
Wat
er b
leed
ing
rati
o (%
)
Coal gangue content
Solid concentration 72% Solid concentration 74% Solid concentration 76% Solid concentration 78%
TLV
(a)
0.15 0.20 0.25 0.30 0.35 0.40 0.450.5
1.0
1.5
2.0
2.5
3.0
3.5
Wat
er b
leed
ing
rati
o (%
)
Fly ash content
Solid concentration 72% Solid concentration 74% Solid concentration 76% Solid concentration 78%
(b)
TLV
Figure 8. Effects of coal gangue and fly ash content on the water bleeding property of CPB slurry: (a) Coal gangue content effects; and (b) Fly ash content effects.
2.3.2. The UCS Results
In the underground coal mining process, powered supports (chocks) are moved forward with longwall advancement. Displacement of the direct roof in the goaf area forms as the supporting equipment moves out. For the backfill materials (aside from the self-supporting ability of backfills), they need to reach a certain strength to support the hanging roof to avoid damage to the roof. Here, the early strength of CPB was required and we measured the samples’ UCS with 8 h curing time. For safety concerns, the early strength can meet the requirement of holding the weight of the direct roof. Typically, the thickness of the direct roof is between 1.5 m and 2 m under different geological conditions. For early strength, the required strength is determined using the equation: = × × × ℎ + × 0.05 (1)
Figure 8. Effects of coal gangue and fly ash content on the water bleeding property of CPB slurry:(a) Coal gangue content effects; and (b) Fly ash content effects.
2.3.2. The UCS Results
In the underground coal mining process, powered supports (chocks) are moved forward withlongwall advancement. Displacement of the direct roof in the goaf area forms as the supportingequipment moves out. For the backfill materials (aside from the self-supporting ability of backfills), theyneed to reach a certain strength to support the hanging roof to avoid damage to the roof. Here, the earlystrength of CPB was required and we measured the samples’ UCS with 8 h curing time. For safetyconcerns, the early strength can meet the requirement of holding the weight of the direct roof. Typically,the thickness of the direct roof is between 1.5 m and 2 m under different geological conditions. For earlystrength, the required strength is determined using the equation:
σs = a × b × ρb × h + b × 0.05 (1)
Energies 2017, 10, 1309 10 of 19
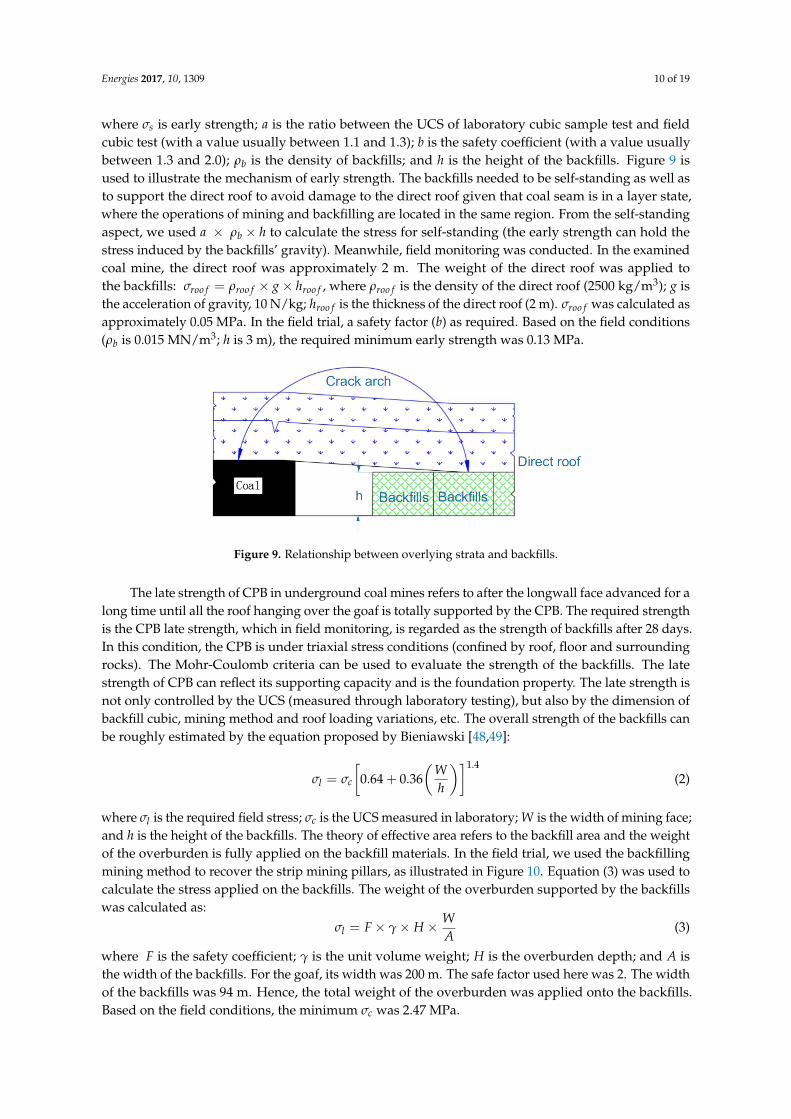
where σs is early strength; a is the ratio between the UCS of laboratory cubic sample test and fieldcubic test (with a value usually between 1.1 and 1.3); b is the safety coefficient (with a value usuallybetween 1.3 and 2.0); ρb is the density of backfills; and h is the height of the backfills. Figure 9 isused to illustrate the mechanism of early strength. The backfills needed to be self-standing as well asto support the direct roof to avoid damage to the direct roof given that coal seam is in a layer state,where the operations of mining and backfilling are located in the same region. From the self-standingaspect, we used a × ρb × h to calculate the stress for self-standing (the early strength can hold thestress induced by the backfills’ gravity). Meanwhile, field monitoring was conducted. In the examinedcoal mine, the direct roof was approximately 2 m. The weight of the direct roof was applied tothe backfills: σroo f = ρroo f × g × hroo f , where ρroo f is the density of the direct roof (2500 kg/m3); g isthe acceleration of gravity, 10 N/kg; hroo f is the thickness of the direct roof (2 m). σroo f was calculated asapproximately 0.05 MPa. In the field trial, a safety factor (b) as required. Based on the field conditions(ρb is 0.015 MN/m3; h is 3 m), the required minimum early strength was 0.13 MPa.
Energies 2017, 10, 1309 10 of 19
where is early strength; is the ratio between the UCS of laboratory cubic sample test and field cubic test (with a value usually between 1.1 and 1.3); is the safety coefficient (with a value usually between 1.3 and 2.0); is the density of backfills; and ℎ is the height of the backfills. Figure 9 is used to illustrate the mechanism of early strength. The backfills needed to be self-standing as well as to support the direct roof to avoid damage to the direct roof given that coal seam is in a layer state, where the operations of mining and backfilling are located in the same region. From the self-standing aspect, we used × × ℎ to calculate the stress for self-standing (the early strength can hold the stress induced by the backfills’ gravity). Meanwhile, field monitoring was conducted. In the examined coal mine, the direct roof was approximately 2 m. The weight of the direct roof was applied to the backfills: = × × ℎ , where is the density of the direct roof (2500 kg/m3); is the acceleration of gravity, 10 N/kg; ℎ is the thickness of the direct roof (2 m). was calculated as approximately 0.05 MPa. In the field trial, a safety factor ( ) as required. Based on the field conditions ( is 0.015 MN/m3; ℎ is 3 m), the required minimum early strength was 0.13 MPa.
Figure 9. Relationship between overlying strata and backfills.
The late strength of CPB in underground coal mines refers to after the longwall face advanced for a long time until all the roof hanging over the goaf is totally supported by the CPB. The required strength is the CPB late strength, which in field monitoring, is regarded as the strength of backfills after 28 days. In this condition, the CPB is under triaxial stress conditions (confined by roof, floor and surrounding rocks). The Mohr-Coulomb criteria can be used to evaluate the strength of the backfills. The late strength of CPB can reflect its supporting capacity and is the foundation property. The late strength is not only controlled by the UCS (measured through laboratory testing), but also by the dimension of backfill cubic, mining method and roof loading variations, etc. The overall strength of the backfills can be roughly estimated by the equation proposed by Bieniawski [48,49]:
= 0.64 + 0.36 ℎ . (2)
where is the required field stress; is the UCS measured in laboratory; is the width of mining face; and ℎ is the height of the backfills. The theory of effective area refers to the backfill area and the weight of the overburden is fully applied on the backfill materials. In the field trial, we used the backfilling mining method to recover the strip mining pillars, as illustrated in Figure 10. Equation (3) was used to calculate the stress applied on the backfills. The weight of the overburden supported by the backfills was calculated as:
= × × × (3)
where is the safety coefficient; is the unit volume weight; is the overburden depth; and is the width of the backfills. For the goaf, its width was 200 m. The safe factor used here was 2. The width of the backfills was 94 m. Hence, the total weight of the overburden was applied onto the backfills. Based on the field conditions, the minimum was 2.47 MPa.
Figure 9. Relationship between overlying strata and backfills.
The late strength of CPB in underground coal mines refers to after the longwall face advanced for along time until all the roof hanging over the goaf is totally supported by the CPB. The required strengthis the CPB late strength, which in field monitoring, is regarded as the strength of backfills after 28 days.In this condition, the CPB is under triaxial stress conditions (confined by roof, floor and surroundingrocks). The Mohr-Coulomb criteria can be used to evaluate the strength of the backfills. The latestrength of CPB can reflect its supporting capacity and is the foundation property. The late strength isnot only controlled by the UCS (measured through laboratory testing), but also by the dimension ofbackfill cubic, mining method and roof loading variations, etc. The overall strength of the backfills canbe roughly estimated by the equation proposed by Bieniawski [48,49]:
σl = σc
[0.64 + 0.36
(Wh
)]1.4(2)
where σl is the required field stress; σc is the UCS measured in laboratory; W is the width of mining face;and h is the height of the backfills. The theory of effective area refers to the backfill area and the weightof the overburden is fully applied on the backfill materials. In the field trial, we used the backfillingmining method to recover the strip mining pillars, as illustrated in Figure 10. Equation (3) was used tocalculate the stress applied on the backfills. The weight of the overburden supported by the backfillswas calculated as:
σl = F × γ × H × WA
(3)
where F is the safety coefficient; γ is the unit volume weight; H is the overburden depth; and A isthe width of the backfills. For the goaf, its width was 200 m. The safe factor used here was 2. The widthof the backfills was 94 m. Hence, the total weight of the overburden was applied onto the backfills.Based on the field conditions, the minimum σc was 2.47 MPa.
Energies 2017, 10, 1309 11 of 19Energies 2017, 10, 1309 11 of 19
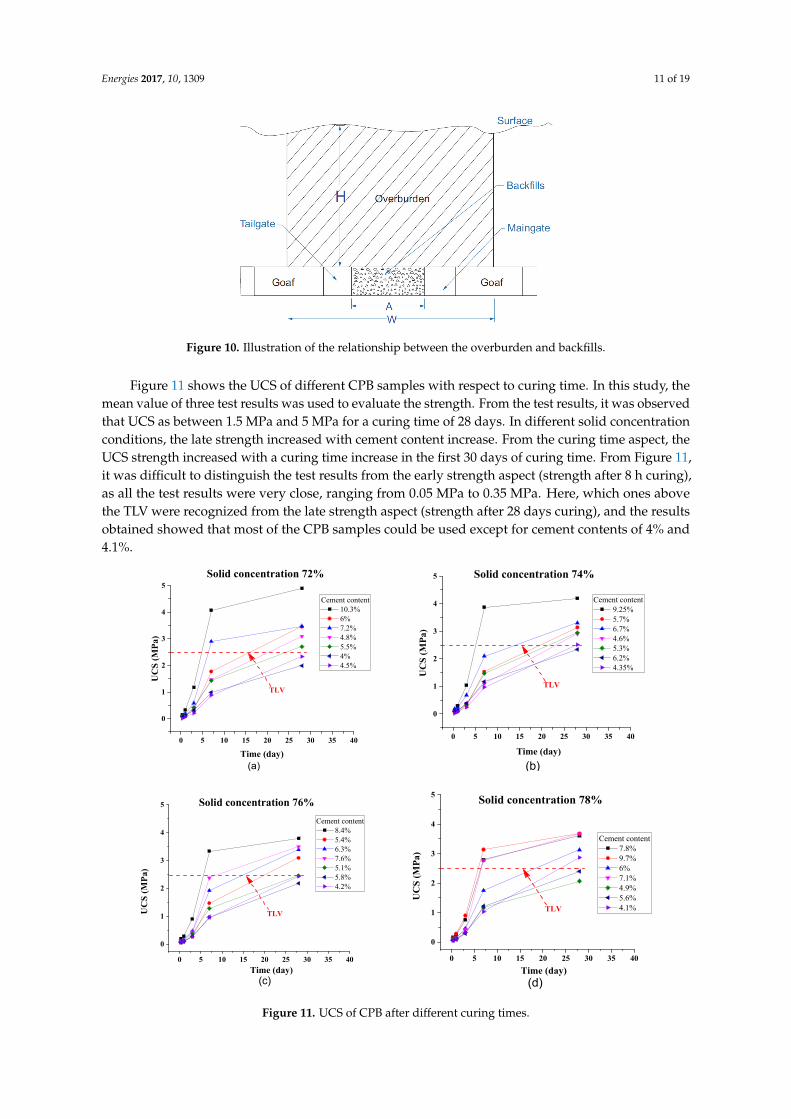
Figure 10. Illustration of the relationship between the overburden and backfills.
Figure 11 shows the UCS of different CPB samples with respect to curing time. In this study, the mean value of three test results was used to evaluate the strength. From the test results, it was observed that UCS as between 1.5 MPa and 5 MPa for a curing time of 28 days. In different solid concentration conditions, the late strength increased with cement content increase. From the curing time aspect, the UCS strength increased with a curing time increase in the first 30 days of curing time. From Figure 11, it was difficult to distinguish the test results from the early strength aspect (strength after 8 h curing), as all the test results were very close, ranging from 0.05 MPa to 0.35 MPa. Here, which ones above the TLV were recognized from the late strength aspect (strength after 28 days curing), and the results obtained showed that most of the CPB samples could be used except for cement contents of 4% and 4.1%.
0 5 10 15 20 25 30 35 40
0
1
2
3
4
5
UC
S (
MP
a)
Time (day)
Cement content 10.3% 6% 7.2% 4.8% 5.5% 4% 4.5%
Solid concentration 72%
(a)
TLV
0 5 10 15 20 25 30 35 40
0
1
2
3
4
5 Solid concentration 74%
UC
S (
MP
a)
Time (day)
Cement content 9.25% 5.7% 6.7% 4.6% 5.3% 6.2% 4.35%
(b)
TLV
0 5 10 15 20 25 30 35 40
0
1
2
3
4
5 Solid concentration 76%
UC
S (
MP
a)
Time (day)
Cement content 8.4% 5.4% 6.3% 7.6% 5.1% 5.8% 4.2%
(c)
TLV
0 5 10 15 20 25 30 35 40
0
1
2
3
4
5
UC
S (
MP
a)
Time (day)
Solid concentration 78%
Cement content 7.8% 9.7% 6% 7.1% 4.9% 5.6% 4.1%
(d)
TLV
Figure 11. UCS of CPB after different curing times.
Figure 10. Illustration of the relationship between the overburden and backfills.
Figure 11 shows the UCS of different CPB samples with respect to curing time. In this study, themean value of three test results was used to evaluate the strength. From the test results, it was observedthat UCS as between 1.5 MPa and 5 MPa for a curing time of 28 days. In different solid concentrationconditions, the late strength increased with cement content increase. From the curing time aspect, theUCS strength increased with a curing time increase in the first 30 days of curing time. From Figure 11,it was difficult to distinguish the test results from the early strength aspect (strength after 8 h curing),as all the test results were very close, ranging from 0.05 MPa to 0.35 MPa. Here, which ones abovethe TLV were recognized from the late strength aspect (strength after 28 days curing), and the resultsobtained showed that most of the CPB samples could be used except for cement contents of 4% and4.1%.
Energies 2017, 10, 1309 11 of 19
Figure 10. Illustration of the relationship between the overburden and backfills.
Figure 11 shows the UCS of different CPB samples with respect to curing time. In this study, the mean value of three test results was used to evaluate the strength. From the test results, it was observed that UCS as between 1.5 MPa and 5 MPa for a curing time of 28 days. In different solid concentration conditions, the late strength increased with cement content increase. From the curing time aspect, the UCS strength increased with a curing time increase in the first 30 days of curing time. From Figure 11, it was difficult to distinguish the test results from the early strength aspect (strength after 8 h curing), as all the test results were very close, ranging from 0.05 MPa to 0.35 MPa. Here, which ones above the TLV were recognized from the late strength aspect (strength after 28 days curing), and the results obtained showed that most of the CPB samples could be used except for cement contents of 4% and 4.1%.
0 5 10 15 20 25 30 35 40
0
1
2
3
4
5
UC
S (
MP
a)
Time (day)
Cement content 10.3% 6% 7.2% 4.8% 5.5% 4% 4.5%
Solid concentration 72%
(a)
TLV
0 5 10 15 20 25 30 35 40
0
1
2
3
4
5 Solid concentration 74%
UC
S (
MP
a)
Time (day)
Cement content 9.25% 5.7% 6.7% 4.6% 5.3% 6.2% 4.35%
(b)
TLV
0 5 10 15 20 25 30 35 40
0
1
2
3
4
5 Solid concentration 76%
UC
S (
MP
a)
Time (day)
Cement content 8.4% 5.4% 6.3% 7.6% 5.1% 5.8% 4.2%
(c)
TLV
0 5 10 15 20 25 30 35 40
0
1
2
3
4
5
UC
S (
MP
a)
Time (day)
Solid concentration 78%
Cement content 7.8% 9.7% 6% 7.1% 4.9% 5.6% 4.1%
(d)
TLV
Figure 11. UCS of CPB after different curing times. Figure 11. UCS of CPB after different curing times.

Energies 2017, 10, 1309 12 of 19
3. Field Application
Both mechanical and hydraulic properties affect the backfilling efficiency in underground coalmines. In the field production process, we needed to consider the CPB materials from transportationand backfilling performance aspects. The higher solid content can however provide a higher supportingstrength despite it being difficult to transport as pipeline blockages may occur. An appropriate recipe isrequired for CPB materials that can be easily transported underground and also provide a satisfactorysupporting strength. From the previous analysis, only the p10 sample (the ratio of cement:fly ash:coalgangue was 1:4:6; solid concentration was 74%) met all requirements.
3.1. Geological Conditions
The field trial was carried out in the Daizhuang coal mine, located in Jining, Shandong Province.In this coal mine, approximately 80% of the coal seams are buried under villages. The thickness ofthe coal seam is 2.7 m and the overburden depth is about 500 m. Hence, these coal seams cannot bemined using the traditional longwall mining methods as they can introduce severe surface subsidence,so a longwall strip mining method was adopted. Currently, a total of 49 residual strip coal pillarsexist underground with total coal reserves of up to 10 million tons. The area of the field trial selectedwas the 2300 mining district and the coal pillar between longwall 2302 and 2303 was the targetedobject. The dimension of the pillar is 110 m × 960 m (width × length). With the recovery of the pillar,CPB was filled into the goaf. From the above-mentioned laboratory test, coal gangue, fly ash, and OPCwere the raw materials for the production of CPB. CPB was produced at a ratio of cement:fly ash:coalgangue (1:4:6) and the solid concentration was 74%. The required materials were easy to obtain asa coal gangue dump with the annual production capacity of 2 million tons is located not far fromthe coal mine. Fly ash was obtained from a thermal power plant with a fly ash production capacityof 200 thousand tons. The OPC was obtained from the cement plant. The cement paste backfillingmethod was adopted here to recycle the residual coal pillars.
3.2. Mining and Backfilling Process
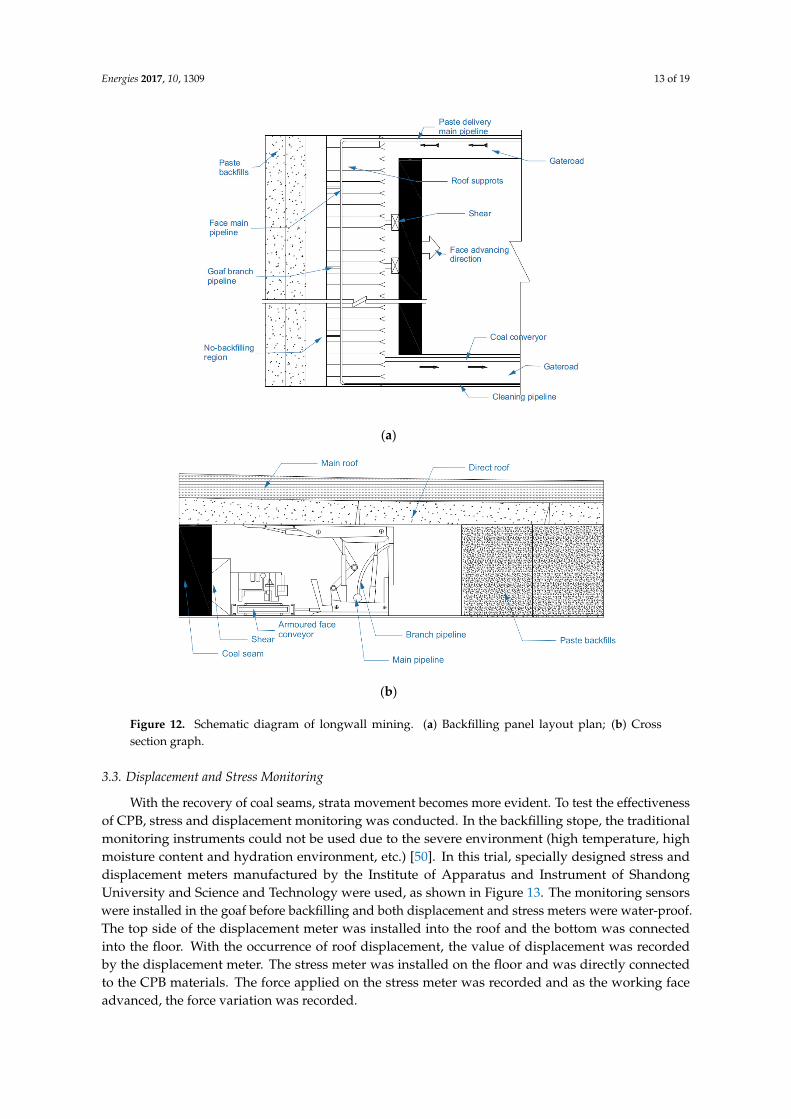
Due to the difference in mining method between hard rock mining and coal mining, the backfillingsystems are different. For the backfilling process in underground coal mines, a serious interferencebetween mining and backfilling exists. Before the consolidation of the CPB materials, an artificialwall is needed for the paste slurry hardening. Due to the roof displacement as the longwall faceadvances, a certain strength is required for backfills (here referring to the early strength). In this trial,the longwall cut and backfilling mining method was used. As coal was recovered, CPB was graduallyfilled into the goaf area. Figure 12 shows the mining and backfilling process where the CPB materialsare transported through the main pipeline and fill the goaf behind the roof supports. This pipelinesystem comes across the working face and is connected to the goaf branch pipeline. After the CPBmaterials are filled in the goaf area, the pipeline system is cleaned by the cleaning pipeline to avoidresidual CPB materials consolidation in the pipeline. With the working face advancing, the direct roofwill deform, and the CPB materials will support the direct roof. When the working face advanced4–5 m, separation work was conducted to divide the working face and the goaf. The filling process wascarried out to fill all the goaf, as illustrated in Figure 12. From the previous monitoring, the roof fallsdown will fall down when the working face advances 15 m. Hence in the backfill process, the fillingwidth is almost 40% of the roof falling distance. In this circumstance during the backfilling process,the direct roof does not fall down. If the roof is very brittle, we can decrease the backfilling width canbe decreased, or simple support to the roof can be applied.
Energies 2017, 10, 1309 13 of 19Energies 2017, 10, 1309 13 of 19
(a)
(b)
Figure 12. Schematic diagram of longwall mining. (a) Backfilling panel layout plan; (b) Cross section graph.
3.3. Displacement and Stress Monitoring
With the recovery of coal seams, strata movement becomes more evident. To test the effectiveness of CPB, stress and displacement monitoring was conducted. In the backfilling stope, the traditional monitoring instruments could not be used due to the severe environment (high temperature, high moisture content and hydration environment, etc.) [50]. In this trial, specially designed stress and displacement meters manufactured by the Institute of Apparatus and Instrument of Shandong University and Science and Technology were used, as shown in Figure 13. The monitoring sensors were installed in the goaf before backfilling and both displacement and stress meters were water-proof. The top side of the displacement meter was installed into the roof and the bottom was connected into the floor. With the occurrence of roof displacement, the value of displacement was recorded by the displacement meter. The stress meter was installed on the floor and was directly connected to the CPB materials. The force applied on the stress meter was recorded and as the working face advanced, the force variation was recorded.
Figure 12. Schematic diagram of longwall mining. (a) Backfilling panel layout plan; (b) Crosssection graph.
3.3. Displacement and Stress Monitoring
With the recovery of coal seams, strata movement becomes more evident. To test the effectivenessof CPB, stress and displacement monitoring was conducted. In the backfilling stope, the traditionalmonitoring instruments could not be used due to the severe environment (high temperature, highmoisture content and hydration environment, etc.) [50]. In this trial, specially designed stress anddisplacement meters manufactured by the Institute of Apparatus and Instrument of ShandongUniversity and Science and Technology were used, as shown in Figure 13. The monitoring sensorswere installed in the goaf before backfilling and both displacement and stress meters were water-proof.The top side of the displacement meter was installed into the roof and the bottom was connectedinto the floor. With the occurrence of roof displacement, the value of displacement was recordedby the displacement meter. The stress meter was installed on the floor and was directly connectedto the CPB materials. The force applied on the stress meter was recorded and as the working faceadvanced, the force variation was recorded.
Energies 2017, 10, 1309 14 of 19Energies 2017, 10, 1309 14 of 19
(a) (b)
(c) (d)
Figure 13. Roof displacement and stress meters. (a) Schematic diagram of the stress meter; (b) Schematic diagram of the displacement meter; (c) Installation of the stress meter; (d) Installation of displacement meter.
In the field trial, sensors were installed at different locations as the working face advanced. As shown in Figure 14, four monitoring lines were selected. For each line, three sets of sensors were installed; however, in the second monitoring line, one sensor was broken and the data subsequently was missing. Displacement and stress meters were installed at each location. The working face was 100 m wide and the distance between sensors in each monitoring line was 15–30 m.
Figure 14. Locations of the monitoring sensors.
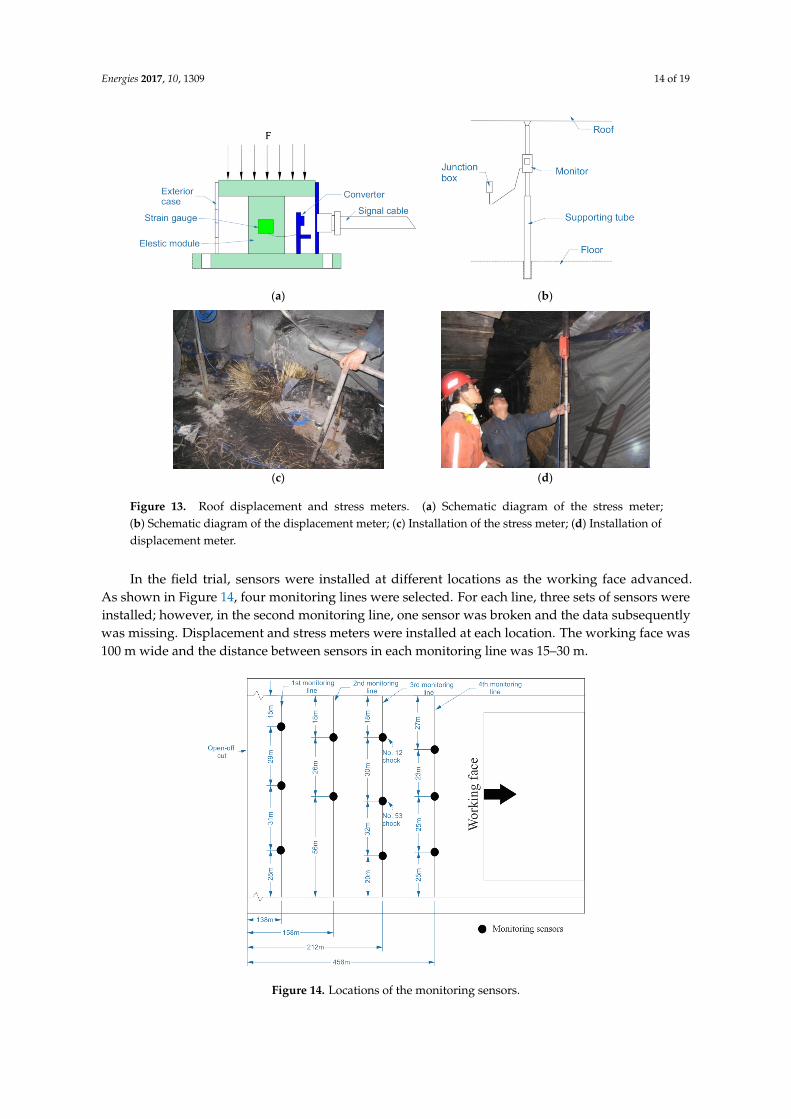
Figure 13. Roof displacement and stress meters. (a) Schematic diagram of the stress meter;(b) Schematic diagram of the displacement meter; (c) Installation of the stress meter; (d) Installation ofdisplacement meter.
In the field trial, sensors were installed at different locations as the working face advanced.As shown in Figure 14, four monitoring lines were selected. For each line, three sets of sensors wereinstalled; however, in the second monitoring line, one sensor was broken and the data subsequentlywas missing. Displacement and stress meters were installed at each location. The working face was100 m wide and the distance between sensors in each monitoring line was 15–30 m.
Energies 2017, 10, 1309 14 of 19
(a) (b)
(c) (d)
Figure 13. Roof displacement and stress meters. (a) Schematic diagram of the stress meter; (b) Schematic diagram of the displacement meter; (c) Installation of the stress meter; (d) Installation of displacement meter.
In the field trial, sensors were installed at different locations as the working face advanced. As shown in Figure 14, four monitoring lines were selected. For each line, three sets of sensors were installed; however, in the second monitoring line, one sensor was broken and the data subsequently was missing. Displacement and stress meters were installed at each location. The working face was 100 m wide and the distance between sensors in each monitoring line was 15–30 m.
Figure 14. Locations of the monitoring sensors. Figure 14. Locations of the monitoring sensors.
Energies 2017, 10, 1309 15 of 19
3.4. Monitoring Results and Discussion
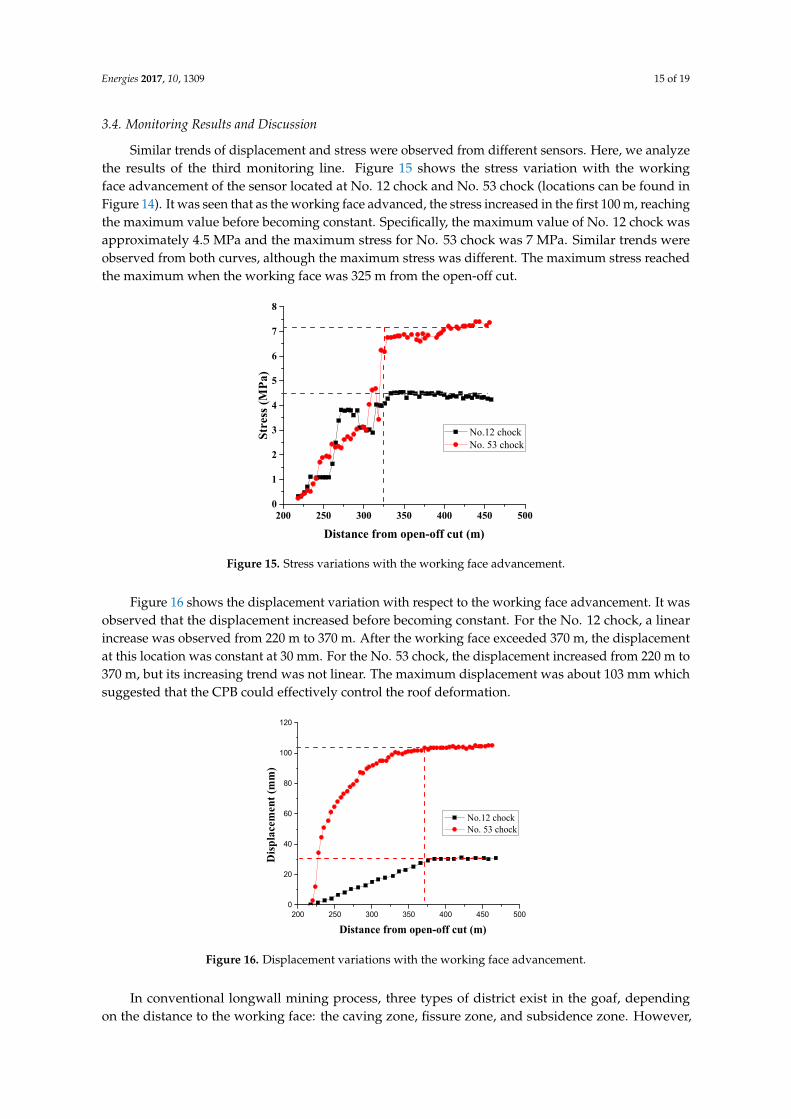
Similar trends of displacement and stress were observed from different sensors. Here, we analyzethe results of the third monitoring line. Figure 15 shows the stress variation with the workingface advancement of the sensor located at No. 12 chock and No. 53 chock (locations can be found inFigure 14). It was seen that as the working face advanced, the stress increased in the first 100 m, reachingthe maximum value before becoming constant. Specifically, the maximum value of No. 12 chock wasapproximately 4.5 MPa and the maximum stress for No. 53 chock was 7 MPa. Similar trends wereobserved from both curves, although the maximum stress was different. The maximum stress reachedthe maximum when the working face was 325 m from the open-off cut.
Energies 2017, 10, 1309 15 of 19
3.4. Monitoring Results and Discussion
Similar trends of displacement and stress were observed from different sensors. Here, we analyze the results of the third monitoring line. Figure 15 shows the stress variation with the working face advancement of the sensor located at No. 12 chock and No. 53 chock (locations can be found in Figure 14). It was seen that as the working face advanced, the stress increased in the first 100 m, reaching the maximum value before becoming constant. Specifically, the maximum value of No. 12 chock was approximately 4.5 MPa and the maximum stress for No.53 chock was 7 MPa. Similar trends were observed from both curves, although the maximum stress was different. The maximum stress reached the maximum when the working face was 325 m from the open-off cut.
200 250 300 350 400 450 5000
1
2
3
4
5
6
7
8
Stre
ss (
MP
a)
Distance from open-off cut (m)
No.12 chock No. 53 chock
Figure 15. Stress variations with the working face advancement.
Figure 16 shows the displacement variation with respect to the working face advancement. It was observed that the displacement increased before becoming constant. For the No. 12 chock, a linear increase was observed from 220 m to 370 m. After the working face exceeded 370 m, the displacement at this location was constant at 30 mm. For the No. 53 chock, the displacement increased from 220 m to 370 m, but its increasing trend was not linear. The maximum displacement was about 103 mm which suggested that the CPB could effectively control the roof deformation.
200 250 300 350 400 450 5000
20
40
60
80
100
120
No.12 chock No. 53 chock
Dis
pla
cem
ent
(mm
)
Distance from open-off cut (m)
Figure 16. Displacement variations with the working face advancement.
Figure 15. Stress variations with the working face advancement.
Figure 16 shows the displacement variation with respect to the working face advancement. It wasobserved that the displacement increased before becoming constant. For the No. 12 chock, a linearincrease was observed from 220 m to 370 m. After the working face exceeded 370 m, the displacementat this location was constant at 30 mm. For the No. 53 chock, the displacement increased from 220 m to370 m, but its increasing trend was not linear. The maximum displacement was about 103 mm whichsuggested that the CPB could effectively control the roof deformation.
Energies 2017, 10, 1309 15 of 19
3.4. Monitoring Results and Discussion
Similar trends of displacement and stress were observed from different sensors. Here, we analyze the results of the third monitoring line. Figure 15 shows the stress variation with the working face advancement of the sensor located at No. 12 chock and No. 53 chock (locations can be found in Figure 14). It was seen that as the working face advanced, the stress increased in the first 100 m, reaching the maximum value before becoming constant. Specifically, the maximum value of No. 12 chock was approximately 4.5 MPa and the maximum stress for No.53 chock was 7 MPa. Similar trends were observed from both curves, although the maximum stress was different. The maximum stress reached the maximum when the working face was 325 m from the open-off cut.
200 250 300 350 400 450 5000
1
2
3
4
5
6
7
8
Stre
ss (
MP
a)
Distance from open-off cut (m)
No.12 chock No. 53 chock
Figure 15. Stress variations with the working face advancement.
Figure 16 shows the displacement variation with respect to the working face advancement. It was observed that the displacement increased before becoming constant. For the No. 12 chock, a linear increase was observed from 220 m to 370 m. After the working face exceeded 370 m, the displacement at this location was constant at 30 mm. For the No. 53 chock, the displacement increased from 220 m to 370 m, but its increasing trend was not linear. The maximum displacement was about 103 mm which suggested that the CPB could effectively control the roof deformation.
200 250 300 350 400 450 5000
20
40
60
80
100
120
No.12 chock No. 53 chock
Dis
pla
cem
ent
(mm
)
Distance from open-off cut (m)
Figure 16. Displacement variations with the working face advancement. Figure 16. Displacement variations with the working face advancement.
In conventional longwall mining process, three types of district exist in the goaf, dependingon the distance to the working face: the caving zone, fissure zone, and subsidence zone. However,
Energies 2017, 10, 1309 16 of 19
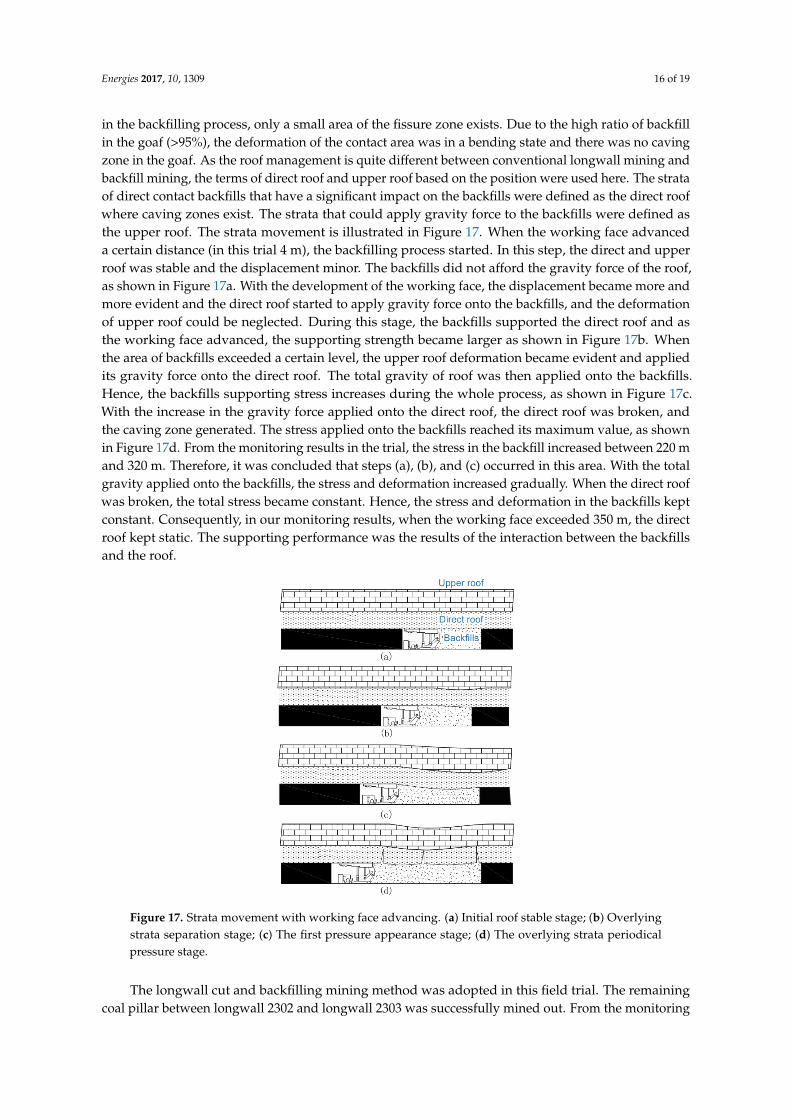
in the backfilling process, only a small area of the fissure zone exists. Due to the high ratio of backfillin the goaf (>95%), the deformation of the contact area was in a bending state and there was no cavingzone in the goaf. As the roof management is quite different between conventional longwall mining andbackfill mining, the terms of direct roof and upper roof based on the position were used here. The strataof direct contact backfills that have a significant impact on the backfills were defined as the direct roofwhere caving zones exist. The strata that could apply gravity force to the backfills were defined asthe upper roof. The strata movement is illustrated in Figure 17. When the working face advanceda certain distance (in this trial 4 m), the backfilling process started. In this step, the direct and upperroof was stable and the displacement minor. The backfills did not afford the gravity force of the roof,as shown in Figure 17a. With the development of the working face, the displacement became more andmore evident and the direct roof started to apply gravity force onto the backfills, and the deformationof upper roof could be neglected. During this stage, the backfills supported the direct roof and asthe working face advanced, the supporting strength became larger as shown in Figure 17b. Whenthe area of backfills exceeded a certain level, the upper roof deformation became evident and appliedits gravity force onto the direct roof. The total gravity of roof was then applied onto the backfills.Hence, the backfills supporting stress increases during the whole process, as shown in Figure 17c.With the increase in the gravity force applied onto the direct roof, the direct roof was broken, andthe caving zone generated. The stress applied onto the backfills reached its maximum value, as shownin Figure 17d. From the monitoring results in the trial, the stress in the backfill increased between 220 mand 320 m. Therefore, it was concluded that steps (a), (b), and (c) occurred in this area. With the totalgravity applied onto the backfills, the stress and deformation increased gradually. When the direct roofwas broken, the total stress became constant. Hence, the stress and deformation in the backfills keptconstant. Consequently, in our monitoring results, when the working face exceeded 350 m, the directroof kept static. The supporting performance was the results of the interaction between the backfillsand the roof.
Energies 2017, 10, 1309 16 of 19
In conventional longwall mining process, three types of district exist in the goaf, depending on the distance to the working face: the caving zone, fissure zone, and subsidence zone. However, in the backfilling process, only a small area of the fissure zone exists. Due to the high ratio of backfill in the goaf (>95%), the deformation of the contact area was in a bending state and there was no caving zone in the goaf. As the roof management is quite different between conventional longwall mining and backfill mining, the terms of direct roof and upper roof based on the position were used here. The strata of direct contact backfills that have a significant impact on the backfills were defined as the direct roof where caving zones exist. The strata that could apply gravity force to the backfills were defined as the upper roof. The strata movement is illustrated in Figure 17. When the working face advanced a certain distance (in this trial 4 m), the backfilling process started. In this step, the direct and upper roof was stable and the displacement minor. The backfills did not afford the gravity force of the roof, as shown in Figure 17a. With the development of the working face, the displacement became more and more evident and the direct roof started to apply gravity force onto the backfills, and the deformation of upper roof could be neglected. During this stage, the backfills supported the direct roof and as the working face advanced, the supporting strength became larger as shown in Figure 17b. When the area of backfills exceeded a certain level, the upper roof deformation became evident and applied its gravity force onto the direct roof. The total gravity of roof was then applied onto the backfills. Hence, the backfills supporting stress increases during the whole process, as shown in Figure 17c. With the increase in the gravity force applied onto the direct roof, the direct roof was broken, and the caving zone generated. The stress applied onto the backfills reached its maximum value, as shown in Figure 17d. From the monitoring results in the trial, the stress in the backfill increased between 220 m and 320 m. Therefore, it was concluded that steps (a), (b), and (c) occurred in this area. With the total gravity applied onto the backfills, the stress and deformation increased gradually. When the direct roof was broken, the total stress became constant. Hence, the stress and deformation in the backfills kept constant. Consequently, in our monitoring results, when the working face exceeded 350 m, the direct roof kept static. The supporting performance was the results of the interaction between the backfills and the roof.
Figure 17. Strata movement with working face advancing. (a) Initial roof stable stage; (b) Overlying strata separation stage; (c) The first pressure appearance stage; (d) The overlying strata periodical pressure stage.
Figure 17. Strata movement with working face advancing. (a) Initial roof stable stage; (b) Overlyingstrata separation stage; (c) The first pressure appearance stage; (d) The overlying strata periodicalpressure stage.
The longwall cut and backfilling mining method was adopted in this field trial. The remainingcoal pillar between longwall 2302 and longwall 2303 was successfully mined out. From the monitoring
Energies 2017, 10, 1309 17 of 19
results, the displacement of the above strata was between 30 mm and 100 mm. Thus, it was concludedthat the backfills could significantly control the roof movement and the surface subsidence could becontrolled. This field trial proved that the cemented coal gangue fly ash backfills can be used to recyclethe remaining pillars generated in the strip mining method. However, detailed preparation work isrequired from both economic and technical aspects. Specifically, the materials used for the backfillsneed to be considered. In this field trial, the coal gangue and fly ash was easily obtained from the plantnearby so the transportation costs were lower. Due to the large amount of backfills, the transportationcost will increase if the coal mine is very far away from the coal gangue and fly ash plants. Froma technical aspect, the mining conditions need to be considered including the geological conditionsand the installation of the mining backfilling system. Hence, detailed research is required if this miningmethod is to be applied in other mines. Moreover, backfilling in coal mines is different from metalmines. The mining and backfilling processes are on the same level, hence the interference betweenthese two processes need to be optimized.
4. Conclusions
In this study, 28 CPB samples were produced using different water, cement, fly ash, andcoal gangue content and the hydraulic-mechanical properties of CPB samples were investigated.The optimized recipe was used in an underground coal mine. The backfill performance was monitoredfrom backfills deformation and stress aspects. The following conclusions were drawn:
(1) Fly ash had a significant impact on the slump and segregation properties of CPB. As the flyash content increased, the slump of the mixture increased and segregation decreased. Coalgangue content also affected the water bleeding ratio, which was due to the large size particlepercentage. The higher content of coal gangue could produce a higher water bleeding ratio slurry.Solid concentration (water content) was a key parameter that affected both the hydraulic andmechanical properties of the CPB samples.
(2) Cement content was the primary factor that affected the strength of CPB samples from an earlystrength (eight hours curing time) and late strength aspect (28 days curing time). Based onthe field conditions, the required early strength was 0.13 MPa and the late strength was 2.47 MPa.
(3) Based on the experiment results, the p10 sample was optimized with the ratio of cement:flyash:coal gangue (1:4:6) and solid concentration was 74%. This recipe was used in the field trial.
(4) The longwall cut and fill mining method was used in the field trial. The displacement andstress of the CPB was monitored. The maximum stress in the third monitoring line was 4.5 MPa(No. 12 chock) and 7 MPa (No. 53 chock), and the maximum displacement was 100 mm and30 mm, respectively. These monitoring results suggest that backfills can effectively controlthe roof deformation.
Acknowledgments: This study was supported by the National Natural Science Foundation of China(No. 51574159), Shandong Province Natural Science Foundation (No. ZR2014EEM001), and the Postdoctoral Fund(No. 2015M572068, No. 2016T90662).
Author Contributions: Xinguo Zhang and Jinxiao Liu proposed the idea and performed the laboratory hydraulicand UCS tests of the samples. Fei Li and Zhenzhong Pang contributed to the field trial monitoring. Jia Lin andXinguo Zhang analyzed the data and contributed to drafting the manuscript.
Conflicts of Interest: The authors declare no conflict of interest.
References
1. Brackebusch, F.W. Basics of paste backfill systems. Int. J. Rock Mech. Min. Sci. Geomech. Abstr. 1995, 3, 122A.2. Deng, X.; Zhang, J.; Kang, T.; Han, X. Strata behavior in extra-thick coal seam mining with upward slicing
backfilling technology. Int. J. Min. Sci. Technol. 2016, 26, 587–592. [CrossRef]3. Wu, D.; Sun, G.; Liu, Y. Modeling the thermo-hydro-chemical behavior of cemented coal gangue-fly ash
backfill. Constr. Build. Mater. 2016, 111, 522–528. [CrossRef]
Energies 2017, 10, 1309 18 of 19
4. Yilmaz, E. Advances in reducing large volumes of environmentally harmful mine waste rocks and tailings.Gospod. Surow. Miner. 2011, 27, 89–112.
5. Yilmaz, E.; Belem, T.; Benzaazoua, M. Effects of curing and stress conditions on hydromechanical,geotechnical and geochemical properties of cemented paste backfill. Eng. Geol. 2014, 168, 23–37. [CrossRef]
6. Wu, D.; Hou, Y.; Deng, T.; Chen, Y.; Zhao, X. Thermal, hydraulic and mechanical performances of cementedcoal gangue-fly ash backfill. Int. J. Miner. Process. 2017, 162, 12–18. [CrossRef]
7. Deng, D.; Liu, L.; Yao, Z.; Song, K.-I.; Lao, D. A practice of ultra-fine tailings disposal as filling material ina gold mine. J. Environ. Manag. 2017, 196, 100–109. [CrossRef] [PubMed]
8. Amaratunga, L.M.; Yaschyshyn, D.N. Development of a high modulus paste fill using fine gold mill tailings.Geotech. Geol. Eng. 1997, 15, 205–219. [CrossRef]
9. Bernier, R.; Li, M.G.; Moerman, A. Effects of tailings and binder geochemistry on the physical strength ofpaste backfill. Proc. Sudburry 1999, 99, 1113–1122.
10. Belem, T.; Benzaazoua, M.; Bussière, B. Mechanical behaviour of cemented paste backfill. In Proceedings ofthe 53rd Candadian Geotechnical Conference, Montreal, QC, Canada, 15–18 October 2000; pp. 373–380.
11. Yılmaz, T.; Ercikdi, B. Predicting the uniaxial compressive strength of cemented paste backfill from ultrasonicpulse velocity test. Nondestruct. Test. Eval. 2016, 31, 247–266. [CrossRef]
12. Yilmaz, E.; Belem, T.; Benzaazoua, M.; Kesimal, A.; Ercikdi, B.; Cihangir, F. Use of high-density paste bacfillfor safe disposal of copper/zinc mine tailings. Gospod. Surow. Miner. 2011, 27, 81–94.
13. Cihangir, F.; Ercikdi, B.; Kesimal, A.; Deveci, H.; Erdemir, F. Paste backfill of high-sulphide mill tailings usingalkali-activated blast furnace slag: Effect of activator nature, concentration and slag properties. Miner. Eng.2015, 83, 117–127. [CrossRef]
14. Ercikdi, B.; Külekci, G.; Yılmaz, T. Utilization of granulated marble wastes and waste bricks as mineraladmixture in cemented paste backfill of sulphide-rich tailings. Constr. Build. Mater. 2015, 93, 573–583.[CrossRef]
15. Rong, H.; Zhou, M.; Hou, H. Pore Structure Evolution and Its Effect on Strength Development ofSulfate-Containing Cemented Paste Backfill. Minerals. 2017, 7, 8. [CrossRef]
16. Benzaazoua, M.; Bussière, B.; Demers, I.; Aubertin, M.; Fried, É.; Blier, A. Integrated mine tailingsmanagement by combining environmental desulphurization and cemented paste backfill: Applicationto mine Doyon, Quebec, Canada. Miner. Eng. 2008, 21, 330–340. [CrossRef]
17. Fall, M.; Benzaazoua, M.; Ouellet, S. Experimental characterization of the influence of tailings fineness anddensity on the quality of cemented paste backfill. Miner. Eng. 2005, 18, 41–44. [CrossRef]
18. Zheng, J.; Zhu, Y.; Zhao, Z. Utilization of limestone powder and water-reducing admixture in cementedpaste backfill of coarse copper mine tailings. Constr. Build. Mater. 2016, 124, 31–36. [CrossRef]
19. Benzaazoua, M.; Belem, T.; Bussiere, B. Chemical factors that influence the performance of mine sulphidicpaste backfill. Cem. Concr. Res. 2002, 32, 1133–1144. [CrossRef]
20. Kesimal, A.; Ercikdi, B.; Yilmaz, E. The effect of desliming by sedimentation on paste backfill performance.Miner. Eng. 2003, 16, 1009–1011. [CrossRef]
21. Fall, M.; Benzaazoua, M. Modeling the effect of sulphate on strength development of paste backfill andbinder mixture optimization. Cem. Concr. Res. 2005, 35, 301–314. [CrossRef]
22. Ercikdi, B.; Cihangir, F.; Kesimal, A.; Deveci, H.; Alp, I. Utilization of industrial waste products as pozzolanicmaterial in cemented paste backfill of high sulphide mill tailings. J. Hazard. Mater. 2009, 168, 848–856.[CrossRef] [PubMed]
23. Liu, G.; Li, L.; Yao, M.; Landry, D.; Malek, F.; Yang, X.; Guo, L. An investigation of the uniaxial compressivestrength of a cemented hydraulic backfill made of alluvial sand. Minerals 2017, 7, 4. [CrossRef]
24. Feldman, R.F.; Carette, G.G.; Malhotra, V.M. Studies on mechanics of development of physical andmechanical properties of high-volume fly ash-cement pastes. Cem. Concr. Compos. 1990, 12, 245–251.[CrossRef]
25. Zhou, N.; Zhang, J.; Yan, H.; Li, M. Deformation Behavior of Hard Roofs in Solid Backfill Coal Mining UsingPhysical Models. Energies 2017, 10, 557. [CrossRef]
26. Belem, T.; Benzaazoua, M. Design and application of underground mine paste backfill technology. Geotech.Geol. Eng. 2008, 26, 147–174. [CrossRef]
27. Benzaazoua, M.; Ouellet, J.; Servant, S.; Newman, P.; Verburg, R. Cementitious backfill with high sulfurcontent Physical, chemical, and mineralogical characterization. Cem. Concr. Res. 1999, 29, 719–725. [CrossRef]
Energies 2017, 10, 1309 19 of 19
28. Koohestani, B.; Koubaa, A.; Belem, T.; Bussière, B.; Bouzahzah, H. Experimental investigation of mechanicaland microstructural properties of cemented paste backfill containing maple-wood filler. Constr. Build. Mater.2016, 121, 222–228. [CrossRef]
29. Qiu, J.; Yang, L.; Sun, X.; Xing, J.; Li, S. Strength Characteristics and Failure Mechanism of CementedSuper-Fine Unclassified Tailings Backfill. Minerals 2017, 7, 58. [CrossRef]
30. Kesimal, A.; Yilmaz, E.; Ercikdi, B. Evaluation of paste backfill mixtures consisting of sulphide-rich milltailings and varying cement contents. Cem. Concr. Res. 2004, 34, 1817–1822. [CrossRef]
31. Ouellet, S.; Bussière, B.; Aubertin, M.; Benzaazoua, M. Microstructural evolution of cemented paste backfill:Mercury intrusion porosimetry test results. Cem. Concr. Res. 2007, 37, 1654–1665. [CrossRef]
32. Huang, Y.; Li, J.; Song, T.; Kong, G.; Li, M. Analysis on filling ratio and shield supporting pressure foroverburden movement control in coal mining with compacted backfilling. Energies 2016, 10, 31. [CrossRef]
33. Ghirian, A.; Fall, M. Strength evolution and deformation behaviour of cemented paste backfill at early ages:Effect of curing stress, filling strategy and drainage. Int. J. Min. Sci. Technol. 2016, 26, 809–817. [CrossRef]
34. Fall, M.; Samb, S.S. Effect of high temperature on strength and microstructural properties of cemented pastebackfill. Fire Saf. J. 2009, 44, 642–651. [CrossRef]
35. Nasir, O.; Fall, M. Coupling binder hydration, temperature and compressive strength development ofunderground cemented paste backfill at early ages. Tunn. Undergr. Space Technol. 2010, 25, 9–20. [CrossRef]
36. Yilmaz, E.; Belem, T.; Bussière, B.; Benzaazoua, M. Relationships between microstructural properties andcompressive strength of consolidated and unconsolidated cemented paste backfills. Cem. Concr. Compos.2011, 33, 702–715. [CrossRef]
37. Ge, Z.; Gao, Z.; Sun, R.; Zheng, L. Mix design of concrete with recycled clay-brick-powder usingthe orthogonal design method. Constr. Build. Mater. 2012, 31, 289–293. [CrossRef]
38. Lin, Y.-H.; Tyan, Y.-Y.; Chang, T.-P.; Chang, C.-Y. An assessment of optimal mixture for concrete made withrecycled concrete aggregates. Cem. Concr. Res. 2004, 34, 1373–1380. [CrossRef]
39. Zurovac, J.; Brown, R. Orthogonal Design: A Powerful Method for Comparative Effectiveness Research with MultipleInterventions; Center on Health Care Effectiveness (CHCE); Mathematica Policy Research: Princeton, NJ,USA, 2012.
40. Yilmaz, E.; Belem, T.; Benzaazoua, M. Specimen size effect on strength behavior of cemented paste backfillssubjected to different placement conditions. Eng. Geol. 2015, 185, 52–62. [CrossRef]
41. Zhang, Q.-L.; Xie, S.-Q.; Zheng, J.-J.; Wang, X.-M. Sedimentation law research and transportation feasibilitystudy of backfilling slurry. J. Chongqing Univ. 2011, 1, 019.
42. Wang, X.-M.; Zhao, B.; Zhang, C.-S.; Zhang, Q.-L. Paste-like self-flowing transportation backfilling technologybased on coal gangue. Min. Sci. Technol. (China) 2009, 19, 137–143. [CrossRef]
43. Zhang, Q.-L.; Wang, X.-M. Performance of cemented coal gangue backfill. J. Cent. South Univ. Technol. 2007,14, 216–219. [CrossRef]
44. Josserand, L.; de Larrard, F. A method for concrete bleeding measurement. Mater. Struct. 2004, 37, 666.[CrossRef]
45. Chen, Q.; Zhang, Q.; Wang, X.; Xiao, C.; Hu, Q. A hydraulic gradient model of paste-like crude tailingsbackfill slurry transported by a pipeline system. Environ. Earth Sci. 2016, 75, 1099. [CrossRef]
46. Baogui, Y.; Yuantao, L.; Yukai, W. Admixture Ratio of High Concentration Cementation Backfilling Materialsin Coal Mine. Electron. J. Geotech. Eng. 2015, 20, 10091–10101.
47. Wu, D.; Yang, B.; Liu, Y. Transportability and pressure drop of fresh cemented coal gangue-fly ash backfill(CGFB) slurry in pipe loop. Powder Technol. 2015, 284, 218–224. [CrossRef]
48. Bieniawski, Z.T. The effect of specimen size on compressive strength of coal. Int. J. Rock Mech. Min. Sci.Geomech. Abstr. 1968, 5, 325–335. [CrossRef]
49. Bieniawski, Z.T.; Van Heerden, W.L. The significance of in situ tests on large rock specimens. Int. J. RockMech. Min. Sci. Geomech. Abstr. 1975, 12, 101–113. [CrossRef]
50. Zhao, T.; Zhang, Y.; Zhang, Z.; Li, Z.; Ma, S. Deformation Monitoring of Waste-Rock-Backfilled Mining Gobfor Ground Control. Sensors 2017, 17, 1044. [CrossRef] [PubMed]
© 2017 by the authors. Licensee MDPI, Basel, Switzerland. This article is an open accessarticle distributed under the terms and conditions of the Creative Commons Attribution(CC BY) license (http://creativecommons.org/licenses/by/4.0/).