investigation of the role of the ... - uni-giessen.de
TRANSCRIPT

Investigation of the role of the endofungal
bacterium Rhizobium radiobacter in the
tripartite Sebacinalean symbiosis
Dissertation zur Erlangung des Doktorgrades
(Doktor der Agrarwissenschaften)
Agrarwissenschaften, Ökotrophologie und Umweltmanagement
Der Justus-Liebig-Universität Gießen
durchgeführt am
Institut für Phytopathologie
vorgelegt von
M.Sc. Huijuan Guo
aus China
Gießen, March 2016
Dekan: Prof. Dr. Klaus Eder
1. Gutachter: Prof. Dr. rer. nat. Karl-Heinz Kogel
2. Gutachter: Prof. Dr. Dr.-Ing. Peter Kämpfer
Parts of this work have already been published:
Stefanie P. Glaeser1§
*, Jafargholi Imani2*, Ibrahim Alabid
2*, Huijuan Guo
2*, Peter
Kämpfer1, Martin Hardt
3, Jochen Blom
4, Alexander Goesmann
4, Michael Rothballer
5,
Anton Hartmann5§#
, Karl-Heinz Kogel2§#
, Non-pathogenic Rhizobium radiobacter F4
deploys plant beneficial activity independent of its host Piriformospora indica. The
ISME Journal (2015), 1-14.
(*First shared author)
Guo, H. J., Alabid, I., Imani J., Glaeser S. P., Kogel, K.-H. (2013) Investigatoin of
endobacterium that is associated with beneficial fungus in agroecosystems. Poster
presentation in 6th
Annual conference of International Giessen Graduate Centre for the
Life Sciences (GGL), 11-12 September, Giessen, Germany.
H. J. Guo, J. Imani, Martin Hardt, K. H. Kogel, S. P. Glaeser (2015) Investigation of
the endobacterium Rhizobium radiobacter F4 beneficial fungus Piriformospora indica.
Poster presentation in annual conference of the association for general and applied
microbiology (VAAM), 1-4 march, Marburg, Germany.
H. J. Guo, J. Imani, Martin Hardt, K. H. Kogel, S. P. Glaeser (2015) Investigation of
the endobacterium Rhizobium radiobacter F4 beneficial fungus Piriformospora indica.
XVIII. International Plant Protection Congress, 24th
-27th
August, Berlin, Germany.
H. J. Guo, S. P. Glaeser, I. Arabid, N. Haghighi, M. Hardt, J. Imani, P. Kaempfer, K.
H. Kogel (2016) The mutualistic endofungal bacterium Rhizobium radiobacter has a
critical role in the tripartite Sebacinalean symbiosis. Oral presentation in annual
meeting for German phytomedical society (DPG) Arbeitskreise “Mykologie” und
“Wirt-Parasit-Beziehungen”, 17-18 March, Giessen, Germany.
In preparation
Huijuan Guo, Ibrahim Alabid, Nima Haghighi, Jafargholi Imani, Stefanie P. Glaeser,
Karl-Heinz Kogel. Investigation the role of endofungal bacterium Rhizobium
radiobacter in the tripartite symbiosis. Manuscript in preparation
I
Table of contents
1 Introduction ..............................................................................................................1
1.1 Plant-microbe interactions ....................................................................................1
1.1.1 Plant innate immunity ......................................................................................3
1.1.2 Plant systemic immunity ..................................................................................5
1.2 Beneficial soil-borne microorganisms ..................................................................7
1.2.1 Plant growth-promoting rhizobacteria (PGPR) ...............................................8
1.2.2 Rhizobium-Legume symbiosis .......................................................................10
1.2.3 Plant growth promoting mycorrhizal fungi.................................................... 11
1.3 Rhizobium radiobacter F4 ..................................................................................13
1.3.1 The genus Agrobacterium ..............................................................................13
1.3.2 Endofungal bacteria .......................................................................................14
1.3.3 Endofungal Rhizobium radiobacter F4 ..........................................................16
1.4 Mutualistic fungus Piriformospora indica..........................................................17
1.4.1 Biological beneficial activity mediated by P. indica......................................17
1.4.2 Colonization pattern of P. indica ...................................................................18
1.4.3 Genome and transcriptome analyses of P. indica ..........................................20
1.4.4 Comparison of Arbuscular mycorrhiza and P. indica ....................................20
1.5 Tripartite bacteria-fungi-plant interactions .........................................................21
1.6 Objectives ...........................................................................................................24
2 Materials and Methods ..........................................................................................25
2.1 Bacterial and fungal materials ............................................................................25
2.1.1 Piriformospora indica ....................................................................................25
2.1.2 Rhizobium radiobacter F4 .............................................................................26
2.1.3 Generation of β-glucuronidase (GUS) - and GFP-RrF4 ................................26
2.1.3.1 Generation of electro-competent RrF4 cells .........................................26
2.1.3.2 Electroporation ......................................................................................27
2.2 Plant materials and growth conditions ................................................................28
2.2.1 Germination of seeds .....................................................................................28
2.2.2 Root inoculation .............................................................................................28
2.2.3 Seedling growth conditions............................................................................29
2.3 Basic molecular biological methods ...................................................................30
2.3.1 Genomic DNA extraction ..............................................................................30
II
2.3.2 Polymerase chain reaction (PCR) ..................................................................30
2.3.3 Total RNA extraction .....................................................................................31
2.3.4 Reverse transcriptional polymerase chain reaction (RT-PCR) ......................32
2.3.5 Quantitative Real-Time PCR (qPCR) ............................................................32
2.3.6 Agarose gel electrophoresis ...........................................................................34
2.3.7 Denaturing gradient gel electrophoresis (DGGE) ..........................................35
2.4 In situ detection of bacteria and fungi.................................................................37
2.4.1 Fluorescence in situ hybridization (FISH) .....................................................37
2.4.2 Sybr green I (SG-1) staining ..........................................................................40
2.4.3 GUS-staining..................................................................................................40
2.4.4 WGA-staining and Congo red staining ..........................................................41
2.5 Microscopy analysis............................................................................................41
2.5.1 Confocal laser scanning microscopy (CLSM) ...............................................42
2.5.2 Transmission electron microscopy (TEM) ....................................................43
2.5.3 Scanning electron microscope (SEM) ...........................................................43
2.6 Re-isolation of P. indica ......................................................................................43
2.7 Curing P. indica from endobacterium .................................................................44
2.7.1 Fungal protoplast formation ...........................................................................44
2.7.2 Treatment with antibiotics .............................................................................45
2.8 Infection of P. indica with GFP-/GUS-RrF4 ......................................................45
2.8.1 Protoplasts formation from P. indica and RrF4 .............................................45
2.8.2 Fusion .............................................................................................................46
2.8.3 Co-cultivation of GFP-RrF4 and P. indica ....................................................47
2.9 Biological activity of P. indica and RrF4 assays ................................................47
3 Results .....................................................................................................................48
3.1 Detection of the endobacterium R. raiobacter in P. indica .................................48
3.2 Growth of RrF4 stain in pure culture ..................................................................49
3.3 Multiplication of RrF4 on the barley root surface ..............................................51
3.3.1 Colonization of RrF4 on primary barley roots ...............................................51
3.3.2 Colonization at root junctions and lateral barley roots ..................................54
3.3.3 RrF4 cell aggregates and single cells on root surface ....................................56
3.4 Localization of RrF4 in the inner barley root tissue ...........................................57
3.5 Colonization of Arabidopsis roots by RrF4 ........................................................61

III
3.6 The impact of cell death regulator BAX inhibitor-1on the colonization of RrF4 ..
.............................................................................................................................64
3.7 Quantification of endobacterium R. radiobacter in P. indica .............................66
3.7.1 Limited detection of bacteria R. radiobacter .................................................66
3.7.2 Quantification of endobacteria R. radiobacter in P. indica colonized barley
roots................................................................................................................67
3.7.3 Quantification of endobacteria R. radiobacter in P. indica supplied with root
extracts ...........................................................................................................69
3.8 Re-isolation of P. indica ......................................................................................70
3.9 Invasion of free living RrF4 into P. indica was not observed .............................72
3.10 Curing P. indica through antibiotics treatments and single protoplast cultivation
.............................................................................................................................73
3.11 Biological activity conferred by SP-Piri, LL-Piri and RE-Piri ...........................76
3.11.1 Root colonization patterns from SP-Piri, LL-Piri and RE-Piri ......................76
3.11.2 Quantification of endobacteria R. radiobacter in root colonized by SP-Piri,
LL-Piri and RE-Piri........................................................................................77
3.11.3 Fresh weight measurement and pathogen resistance assessment ..................78
4 Discussion ................................................................................................................82
4.1 Colonization pattern of RrF4 on the root surface ...............................................82
4.2 Intercellular localization of RrF4 in the root cortex and central cylinder ...........85
4.3 Single root cell colonization strategies of RrF4 ..................................................85
4.4 Endobacteria in stationary phase-VBNC ............................................................87
4.5 Secretion system .................................................................................................88
4.6 Removing endobacterium from P. indica ...........................................................88
4.7 Amount variation of endobacteria R. radiobacter in P. indica ...........................90
4.8 Characteristics of SP-Piri and RE-Piri ................................................................92
4.9 Conclusions .........................................................................................................93
5 Summary/Zusammenfassung................................................................................95
5.1 Summary .............................................................................................................95
5.2 Zusammenfassung...............................................................................................97
6 Reference .................................................................................................................97
7 Supplement ...........................................................................................................132
8 Erklärung..............................................................................................................134
9 Acknowledgements ..............................................................................................135
List of abbreviations
IV
List of Abbreviations
ABA Abscisic acid
BSA Bovine Serum Albumin
BI-1 BAX inhibitor-1
cDNA Complementary DNA
CLSM Confocal laser scanning microscopy
DEPC Diethylpyrocarbonate
DAPI 4', 6-diamidino-2-phenylindole
DNA Deoxyribonucleic acid
DNase Deoxyribonuclease
dNTP Deoxyribonucleosidtrophosphate
dpi days post inoculation
EDTA Ethylenediaminetetraacetic acid
EF-Tu Elongation factor TU receptor
ETI Effector-triggered immunity
FISH Fluorescence in situ hybridization
flg22 A 22-amino-acid-long peptie derived from flagellin
GFP Green Fluorescent Protein
ISR Induced systemic resistance
ITS Internal transcribed spacer
JA Jasmonic acid
LB Lysogeny Broth
LL-Piri Long-term laboratory cultured P. indica
MAMP Microbe-associaed molecular pettern
MOPS 3-(N-morpholino) propanesulfonic acid
MQ H2O Milli-Q water
mRNA Messenger RNA
MS Murashige Skoog
MTI MAMP-triggered immunity
List of abbreviations
V
OD Optical density
PAMP Pathogen associated molecular patterns
PBS Phosphate-buffered saline
PCR Polymerase chain reacctoin
PI Propidium Iodide
P. indica Piriformospora indica
PRR Pattern recognition receptor
PTI PAMP-trigged immunity
q-PCR Quantitative real-time PCR
RNA Ribonucleic acid
Re-Piri-1 re-isolated P. indica subculture-1
Re-Piri-2 re-isolated P. indica subculture-2
RE-Piri re-isolated P. indica
rpm Rounds per minute
RrF4 Rhizobium radiobactor F4
RT Room Temperature
SA Salicylic acid
SAR Systemic aquired resistance
SDS Sodium dodecyl sulfate
SEM Scanning electron microscopy
SOC Super Optimize Broth
SP-Piri Single-protoplast-derived P. indica
T3SS Type III secretion system
T4SS Type IV secretion system
Tef Translation elongation factor
TEM Transmission electron microscopy
Ubi Ubiquitin
VBNC Viable but nonculturable
WT Wild-type

List of abbreviations
VI
X-Gluc 5-bromo-4-chloro-3-indolyl-beta-D-glucuronic acid
Introduction
1
1 Introduction
1.1 Plant-microbe interactions
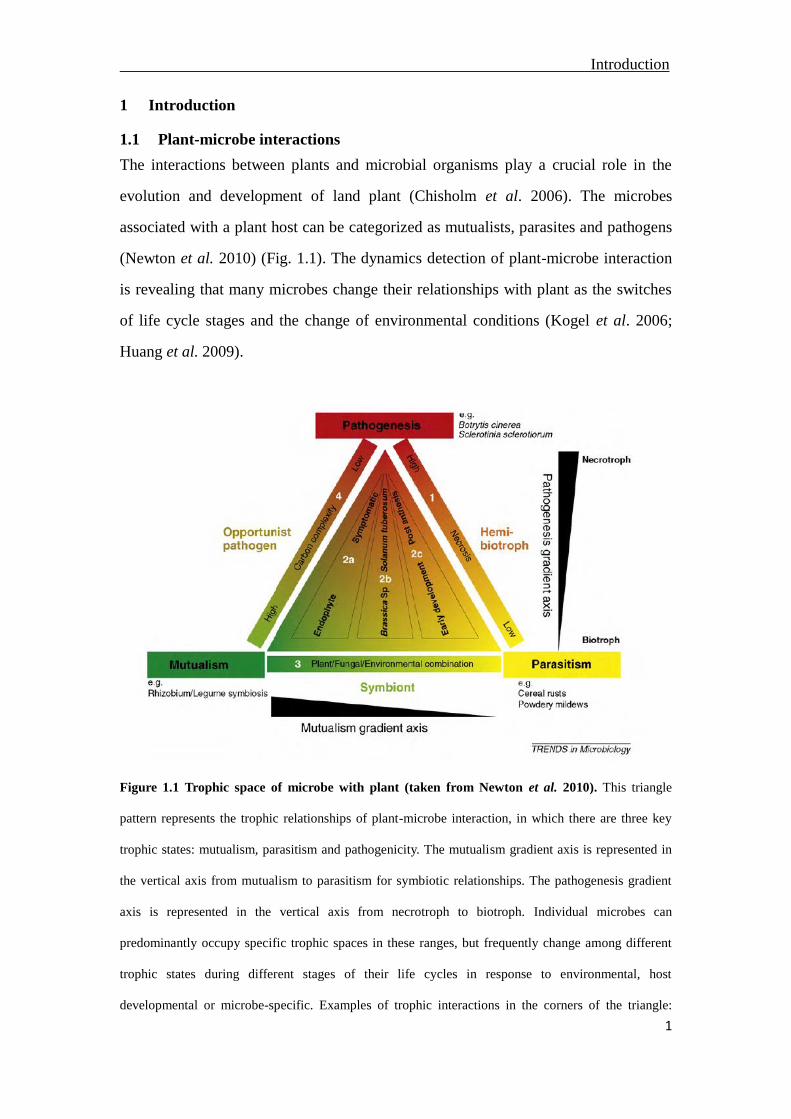
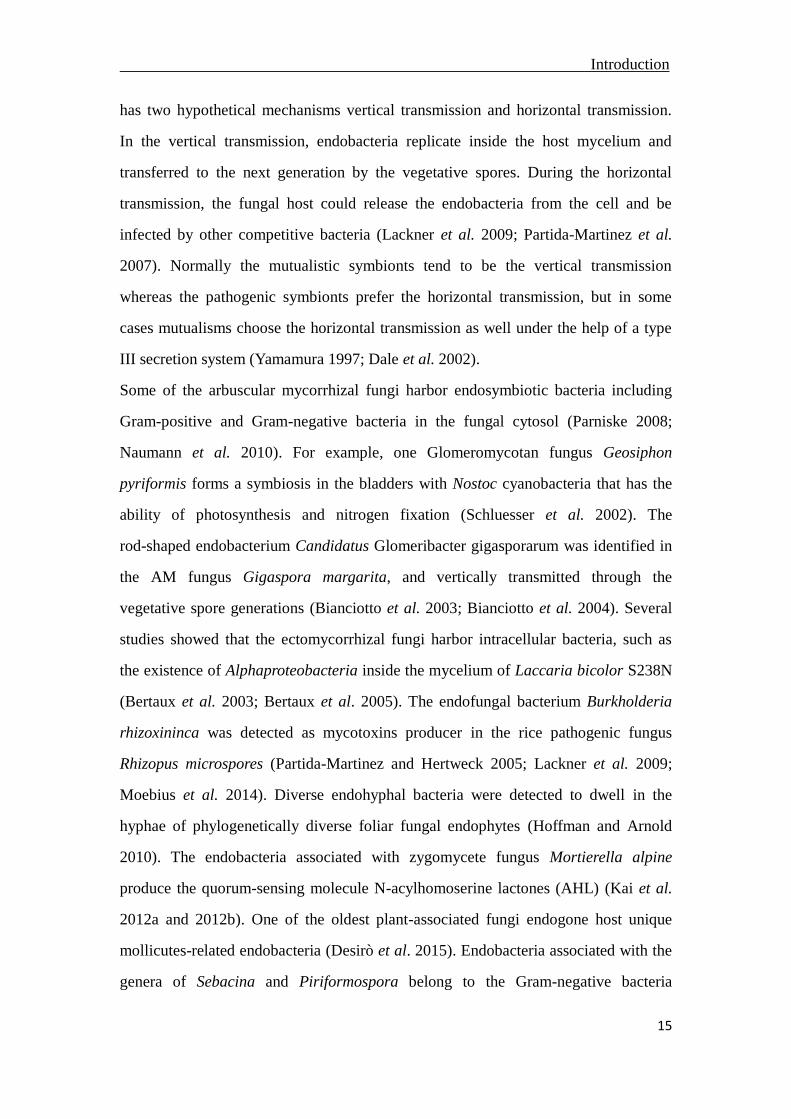
The interactions between plants and microbial organisms play a crucial role in the
evolution and development of land plant (Chisholm et al. 2006). The microbes
associated with a plant host can be categorized as mutualists, parasites and pathogens
(Newton et al. 2010) (Fig. 1.1). The dynamics detection of plant-microbe interaction
is revealing that many microbes change their relationships with plant as the switches
of life cycle stages and the change of environmental conditions (Kogel et al. 2006;
Huang et al. 2009).
Figure 1.1 Trophic space of microbe with plant (taken from Newton et al. 2010). This triangle
pattern represents the trophic relationships of plant-microbe interaction, in which there are three key
trophic states: mutualism, parasitism and pathogenicity. The mutualism gradient axis is represented in
the vertical axis from mutualism to parasitism for symbiotic relationships. The pathogenesis gradient
axis is represented in the vertical axis from necrotroph to biotroph. Individual microbes can
predominantly occupy specific trophic spaces in these ranges, but frequently change among different
trophic states during different stages of their life cycles in response to environmental, host
developmental or microbe-specific. Examples of trophic interactions in the corners of the triangle:

Introduction
2
Botrytis cinerea Sclerotinia sclerotiorum (pathogenesis); Rhizobium, Legume symbiosis (Mutualism);
Cereal rusts Powery mildews (Parasitism).
Microbes behave as pathogens on plant in different mechanisms with various
symptoms and damages at certain stages of the life cycle and environmental condition.
At one extreme, necrotrophic pathogens such as fungi Botrytis cinerea (grey mould),
Monilinia fructicola and Sclerotinia sclerotiorum (stem rot) or the bacterium Ercinia
carotovora penetrate plant, kill host cells and decompose the plant tissue to provide
themselves with enough food (Jan et al. 2006; Rojo et al. 2003). Necrotrophs
normally secrete lytic enzymes and toxins resulting in the death of tissue,
subsequently decompose the tissue and use the nutrition released from the dead tissue.
Biotrophic pathogens are relying on living plant tissue for their own propagation, they
feed on host resources without casing necrotic lesions or other damage, such as
powdery mildew (Blumeria graminis f. sp. hordei) and rust (Puccinia triticina)
(Panstruga 2003). Hemi-biotrophic pathogens, such as barley ramularia leaf spot
(Ramularia collo-cygni) and potato late-blight (Phytophthora infestans), are
symptomless pathogens between necrotrophic and biotrophic pathogens. At the
initially biotrophic infection phase, hemibiotrophy cause no or very less symptom
while there are necrotic lesions formed by the haustoria in the later growth phase
(Sowley et al. 2010).
In the symbiotic plant-microbe association, the plant host obtains advantages from the
microbial colonization instead of suffering from any “pain”. The benefits here are
based on a well-balanced status between both partners (Kogel et al. 2006). In the
mutualism relationship, promoted growth of the host normally induced by mineral
nutrients support, abiotic stress tolerance and increased resistance against pathogens
(Redman et al. 2002; Colditz et al. 2005; Arnold et al. 2003). The microbes in this
relationship get nutrient supply without disturbing the development of the host.
Mycorrhizal fungi and endophytes are typical examples who are involved as
mutualistic microbes. Basidiomycete Piriformospora indica is the representative

Introduction
3
mutualistic fungus in the microbe-plant root interaction, it provides various benefits to
the host plants, such as barley, Arobidopsis, tomato and wheat (Waller F. et al. 2006;
Deshmukh et al. 2006; Sharma et al. 2008; Qiang et al. 2012).
1.1.1 Plant innate immunity
In order to ensure plant development and proliferation, plants built a series of defense
strategies, which is related to the innate immune system of animals (Ausubel 2005), to
against most of the microbial attackers. During the evolution, there are two branches
of innate immune system of plant developed to resistant against the majority of the
microbes (Chisholm et al. 2006; Jones and Dangl 2006). Microbes enter the inner part
of plant through the wounds on the stem, stomata on the leaves or other natural
openings. After penetrating plant cell walls, the plasma is exposed in front of the
microbes, where the microbes meet with the transmembrane pattern recognition
receptors (PRRs), which recognize the pathogen- or microbial-associated molecular
patterns (PAMPs or MAMPs), such as bacterial flagellin, EF-Tu (elongation factor Tu)
and fungal chitin (Chisholm et al. 2006; Zipfel and Felix 2005; Zipfel et al. 2006).
The perception of a microorganism on the plasma membrane triggers primary
immune response pattern-triggered immunity (PTI). This first layer immune system
halts the microbial colonization by inducing oxidative burst (ROS), mitogen-activated
protein kinase signaling cascade (MAP3K) or callose deposition (Schwessinger and
Zipfel 2008).
Once microbes acquired the capacity to restrain the primary immune defense,
effector-triggered immunity (ETI) as the second layer immune system is motivated in
plant and functioned in a more specialized mechanism (Dodds and Rathijen 2010;
Pieterse et al. 2009). Microbial pathogens secret effector protein into the cytosol of
plant host cell and interfere with PTI in the intracellular space.The effectors from
diverse kingdoms can be recognized directly or indirectly by NB-LRR (nucleotide
binding and leucine rich repeat) protein encoded by R-genes (Dangl and Jones 2001),
thereby trigger the ETI, which results in the disease resistance and hypersensitive cell
Introduction
4
death response (HR) in plant host (Fig. 1.2). PTI is weak, while ETI is stronger, faster
and can be triggered again and again. A ‘zigzag’ model containing four phases
illustrates the immune system in plant host (Jones and Dangl 2006).
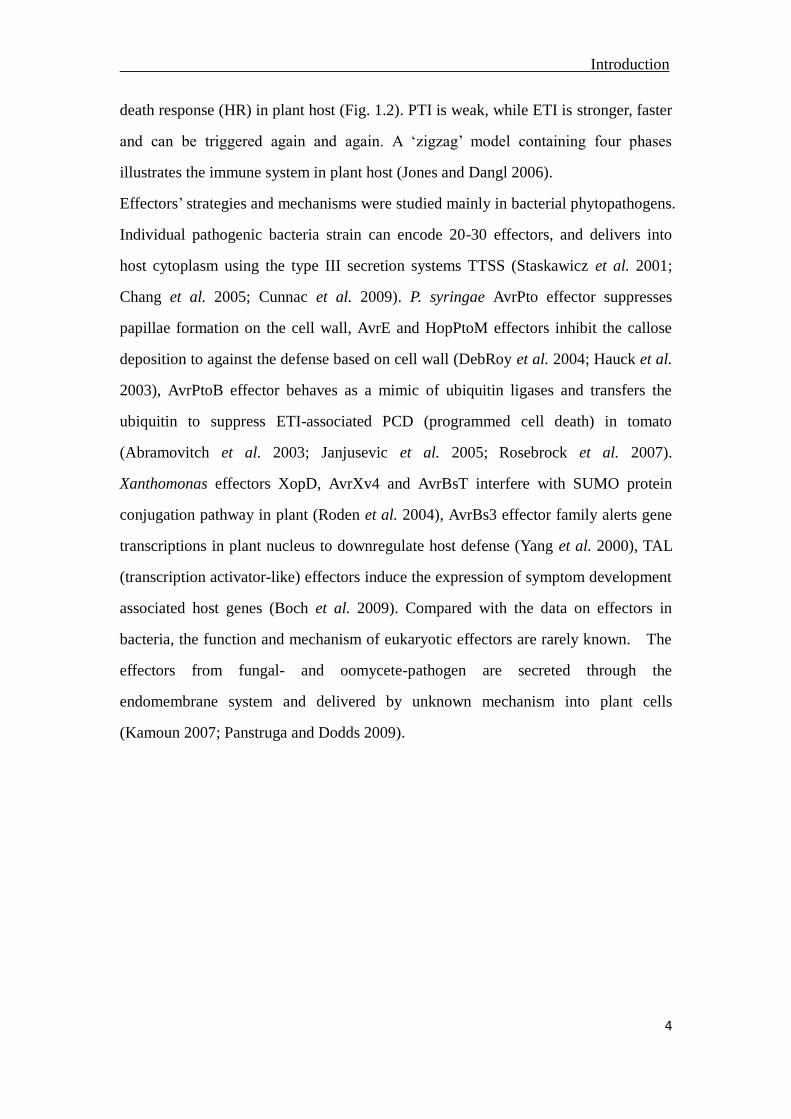
Effectors’ strategies and mechanisms were studied mainly in bacterial phytopathogens.
Individual pathogenic bacteria strain can encode 20-30 effectors, and delivers into
host cytoplasm using the type III secretion systems TTSS (Staskawicz et al. 2001;
Chang et al. 2005; Cunnac et al. 2009). P. syringae AvrPto effector suppresses
papillae formation on the cell wall, AvrE and HopPtoM effectors inhibit the callose
deposition to against the defense based on cell wall (DebRoy et al. 2004; Hauck et al.
2003), AvrPtoB effector behaves as a mimic of ubiquitin ligases and transfers the
ubiquitin to suppress ETI-associated PCD (programmed cell death) in tomato
(Abramovitch et al. 2003; Janjusevic et al. 2005; Rosebrock et al. 2007).
Xanthomonas effectors XopD, AvrXv4 and AvrBsT interfere with SUMO protein
conjugation pathway in plant (Roden et al. 2004), AvrBs3 effector family alerts gene
transcriptions in plant nucleus to downregulate host defense (Yang et al. 2000), TAL
(transcription activator-like) effectors induce the expression of symptom development
associated host genes (Boch et al. 2009). Compared with the data on effectors in
bacteria, the function and mechanism of eukaryotic effectors are rarely known. The
effectors from fungal- and oomycete-pathogen are secreted through the
endomembrane system and delivered by unknown mechanism into plant cells
(Kamoun 2007; Panstruga and Dodds 2009).
Introduction
5
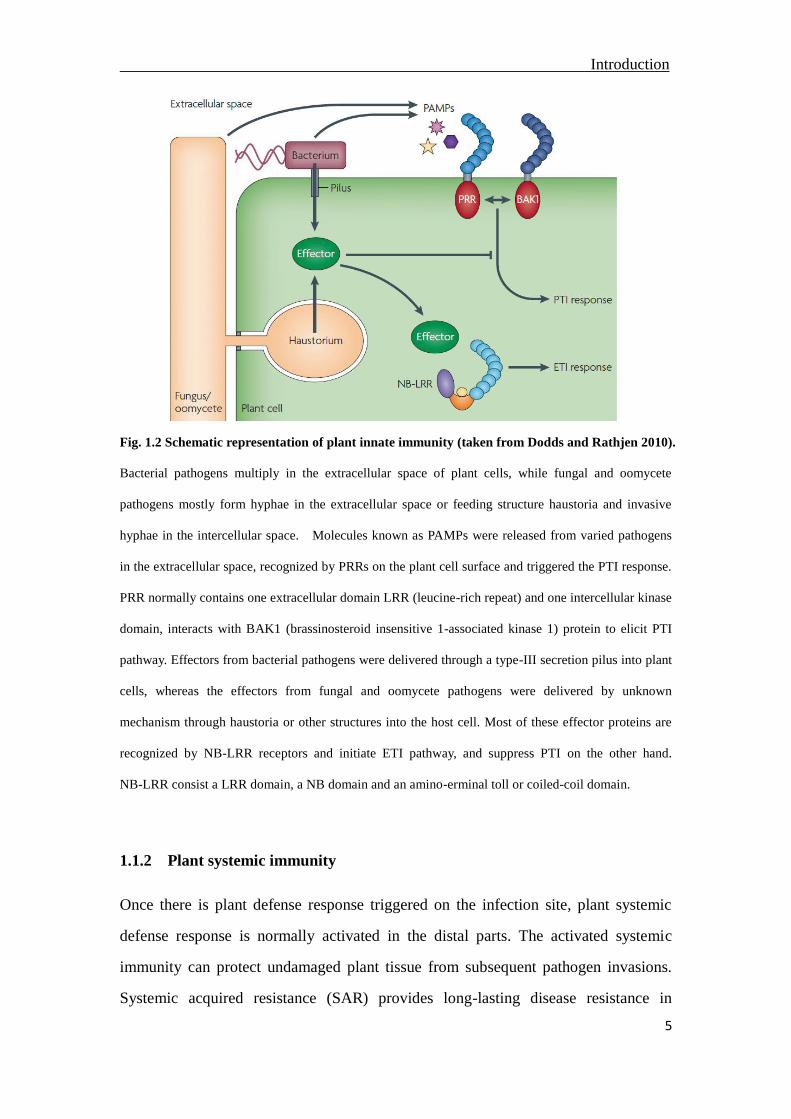
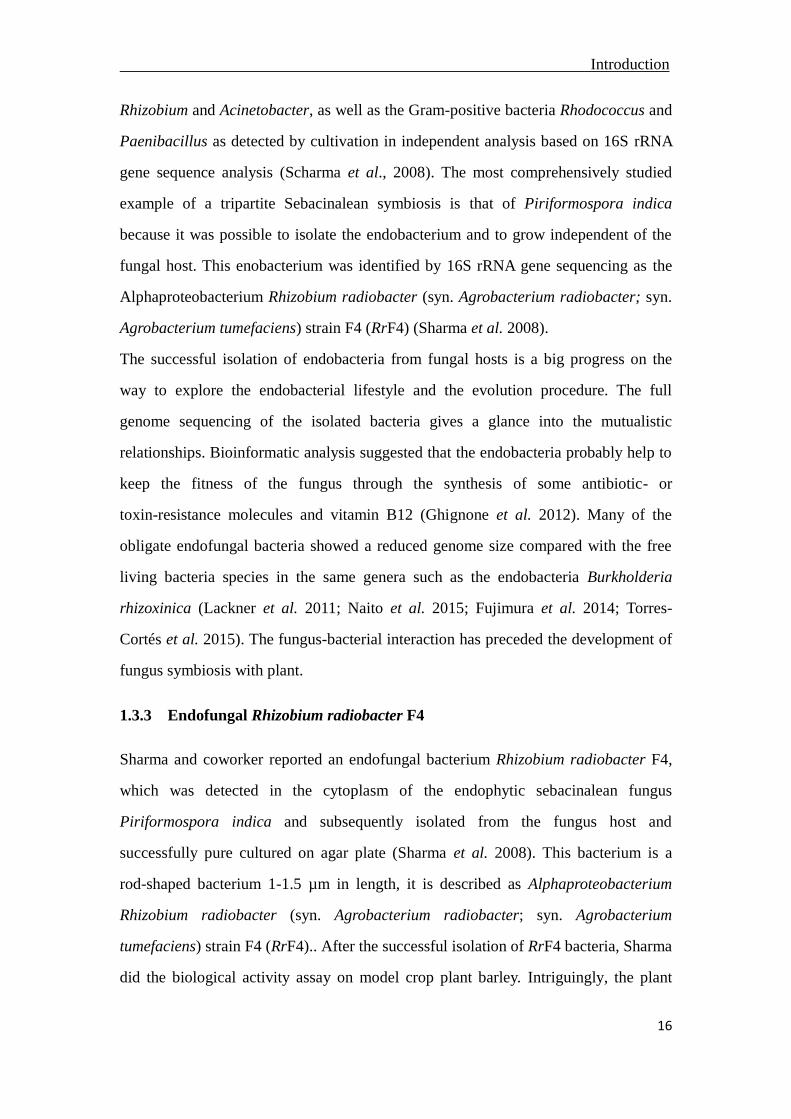
Fig. 1.2 Schematic representation of plant innate immunity (taken from Dodds and Rathjen 2010).
Bacterial pathogens multiply in the extracellular space of plant cells, while fungal and oomycete
pathogens mostly form hyphae in the extracellular space or feeding structure haustoria and invasive
hyphae in the intercellular space. Molecules known as PAMPs were released from varied pathogens
in the extracellular space, recognized by PRRs on the plant cell surface and triggered the PTI response.
PRR normally contains one extracellular domain LRR (leucine-rich repeat) and one intercellular kinase
domain, interacts with BAK1 (brassinosteroid insensitive 1-associated kinase 1) protein to elicit PTI
pathway. Effectors from bacterial pathogens were delivered through a type-III secretion pilus into plant
cells, whereas the effectors from fungal and oomycete pathogens were delivered by unknown
mechanism through haustoria or other structures into the host cell. Most of these effector proteins are
recognized by NB-LRR receptors and initiate ETI pathway, and suppress PTI on the other hand.
NB-LRR consist a LRR domain, a NB domain and an amino-erminal toll or coiled-coil domain.
1.1.2 Plant systemic immunity
Once there is plant defense response triggered on the infection site, plant systemic
defense response is normally activated in the distal parts. The activated systemic
immunity can protect undamaged plant tissue from subsequent pathogen invasions.
Systemic acquired resistance (SAR) provides long-lasting disease resistance in
Introduction
6
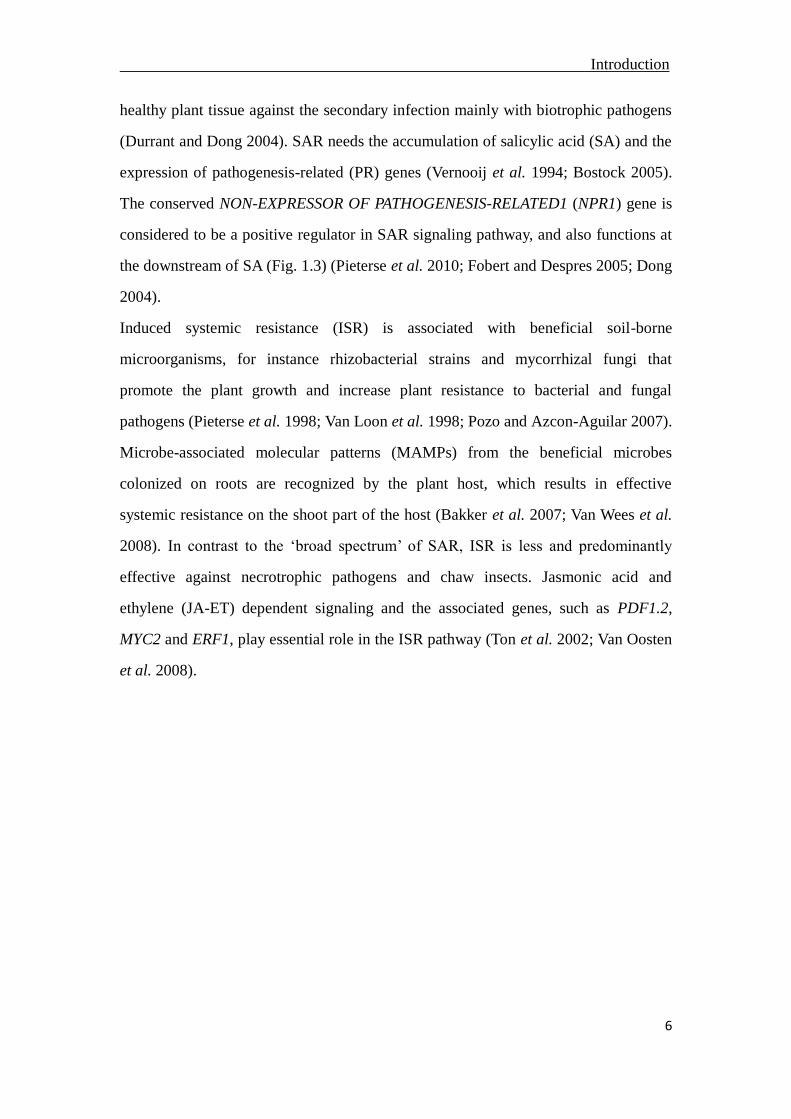
healthy plant tissue against the secondary infection mainly with biotrophic pathogens
(Durrant and Dong 2004). SAR needs the accumulation of salicylic acid (SA) and the
expression of pathogenesis-related (PR) genes (Vernooij et al. 1994; Bostock 2005).
The conserved NON-EXPRESSOR OF PATHOGENESIS-RELATED1 (NPR1) gene is
considered to be a positive regulator in SAR signaling pathway, and also functions at
the downstream of SA (Fig. 1.3) (Pieterse et al. 2010; Fobert and Despres 2005; Dong
2004).
Induced systemic resistance (ISR) is associated with beneficial soil-borne
microorganisms, for instance rhizobacterial strains and mycorrhizal fungi that
promote the plant growth and increase plant resistance to bacterial and fungal
pathogens (Pieterse et al. 1998; Van Loon et al. 1998; Pozo and Azcon-Aguilar 2007).
Microbe-associated molecular patterns (MAMPs) from the beneficial microbes
colonized on roots are recognized by the plant host, which results in effective
systemic resistance on the shoot part of the host (Bakker et al. 2007; Van Wees et al.
2008). In contrast to the ‘broad spectrum’ of SAR, ISR is less and predominantly
effective against necrotrophic pathogens and chaw insects. Jasmonic acid and
ethylene (JA-ET) dependent signaling and the associated genes, such as PDF1.2,
MYC2 and ERF1, play essential role in the ISR pathway (Ton et al. 2002; Van Oosten
et al. 2008).
Introduction
7
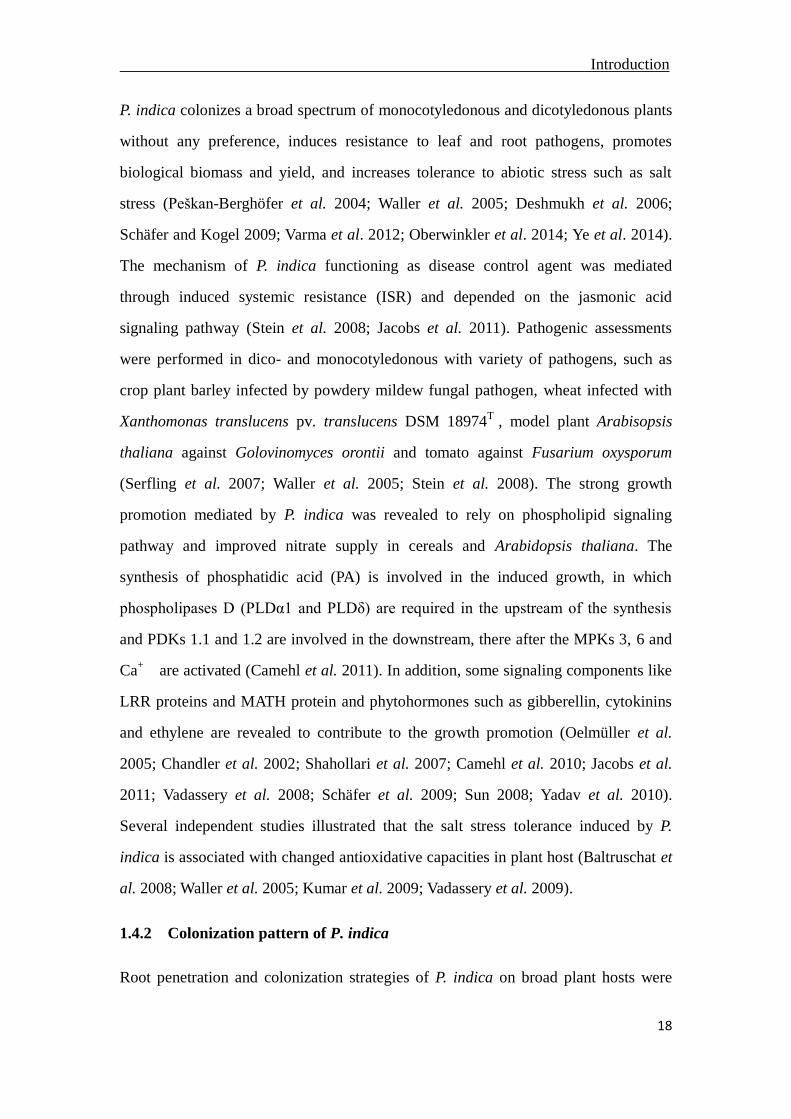
Fig. 1.3 A model of systemic immune responses in plant (taken from Pieterse et al. 2010). Systemic
acquired resistance (SAR) is induced by a mobile signal from locally pathogen infected tissue, the
signal is transported through plant vascular system to distal tissues and actives the defense responses in
healthy systemic tissues in the plant host. Salicylic acid (SA) plays a crucial role in the SAR pathway,
since it can regulate the expression of genes encoded pathogenesis-related proteins (PRs). Induced
systemic resistance (ISR) is activated by the beneficial microorganisms colonized on plant roots. The
mobile signals created from plant root travel to the above-ground plant parts, activate systemic
immunity against pathogen attack in shoot part. JA-ET (jasmonic acid-ethylene) signaling pathways are
essential in ISR. The expression of JA- and ET-associated genes is evident after pathogen attack in
ISR-expressing plant.
1.2 Beneficial soil-borne microorganisms
Some soil-borne microorganisms can improve plant nutrition and assistant plant host
to deal with the biotic and abiotic stresses. Such beneficial belowground microbes are
known as plant growth-promoting rhizobacteria (PGPR) and plant growth-promoting
fungi (PGPF) (Van Wees et al. 2008). The beneficial effects on plant not only results
in a higher yield, but also have a high relevance in natural and agricultural ecosystems
because of the reduced industrial fertilizer pollution in agricultural soils and water
(Yang et al. 2009; Weyens et al. 2009).

Introduction
8
1.2.1 Plant growth-promoting rhizobacteria (PGPR)
Plant growth-promoting rhizobacteria (PGPR) are a small portion of rhizosphere
microbes (2-5%) that promote plant growth directly or protect plant from soil-borne
diseases indirectly (Lugtenberg and Kamilova 2009). Rhizosphere, one layer of soil
influenced by plant root, is a hot spot for microbes in the underground. Plant roots
secrete metabolite via root exudate that can be utilized by the PGPR as nutrients. The
root exudates released by plant include many organic compounds, such as amino
acids, organic acids, sugars, vitamins, nucleotides, phenolics, putresccine and carbon
(Uren 2007). PGPR promotes plant growth through increasing the supply of nutrients
to the host plant. For instance, the biological N2 fixer rhizobia is a well studied PGPR
for the ability to fix N2 in the legume family through nitrogenase activity. The
increased nutrients in plant rhizosphere also involve the solubilized phosphates and
facilitated absorption of iron (Nautiyal et al. 2000; Kim et al. 1998; Von Wiren et al.
2000). The positive effects on root growth and morphology change increase root
surface area, which can help the plant host to take up more nutrients from the
surrounding environment (Bashan and Dubrovsky 1996; Vessey and Buss 2002;
Galleguillos et al. 2000; German et al. 2000; Holguin and Glick 2001). Plant growth
promotion can be measured by the yield or the weight and length of shoots and roots.
Endophytic bacteria represent a small subgroup of PGPR, they attach on the root
surface and subsequently enter the root interior and colonize in the intercellular spaces
(Hallmann and Berg 2007; Gray and Smith 2005; Hardoim et al. 2008; Rosenblueth
and Martinez-romero 2006). The colonization of PGPR on root is changing as plant
changes the chemical and physical composition at rhizosphere via exudations, water
potential, soil pH and O2 pressure (Griffiths et al. 1999; Tavaria and Zuberer 1998; Xu
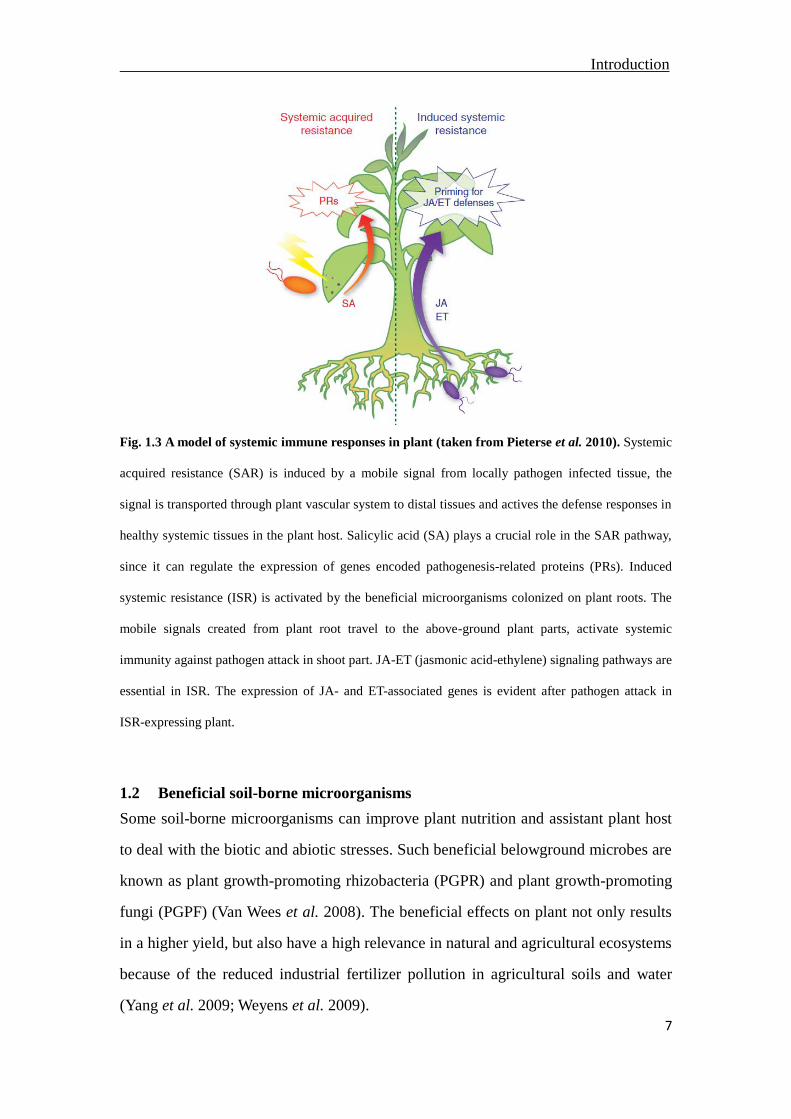
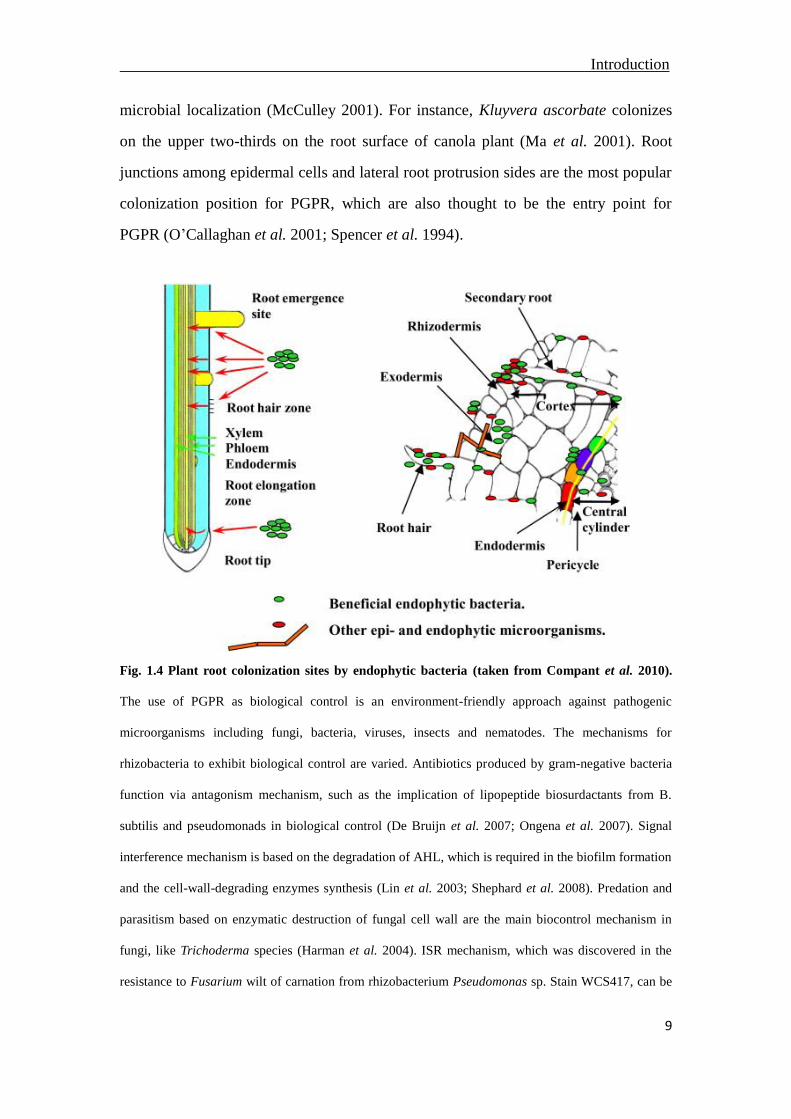
2000). The penetration mostly rake place at the cracks on root, for instance the lateral
root base, root hairs and root tips (Fig. 1.4). In addition, the cell-wall degrading
enzyme (CWDE) secreted by bacteria plays crucial role in the invasion process
(Compant et al. 2010; Lodewycks et al. 2002). The relationships between PGPR and
plant hosts can be categorized into rhizospheric and endophytic relying on the
Introduction
9
microbial localization (McCulley 2001). For instance, Kluyvera ascorbate colonizes
on the upper two-thirds on the root surface of canola plant (Ma et al. 2001). Root
junctions among epidermal cells and lateral root protrusion sides are the most popular
colonization position for PGPR, which are also thought to be the entry point for
PGPR (O’Callaghan et al. 2001; Spencer et al. 1994).
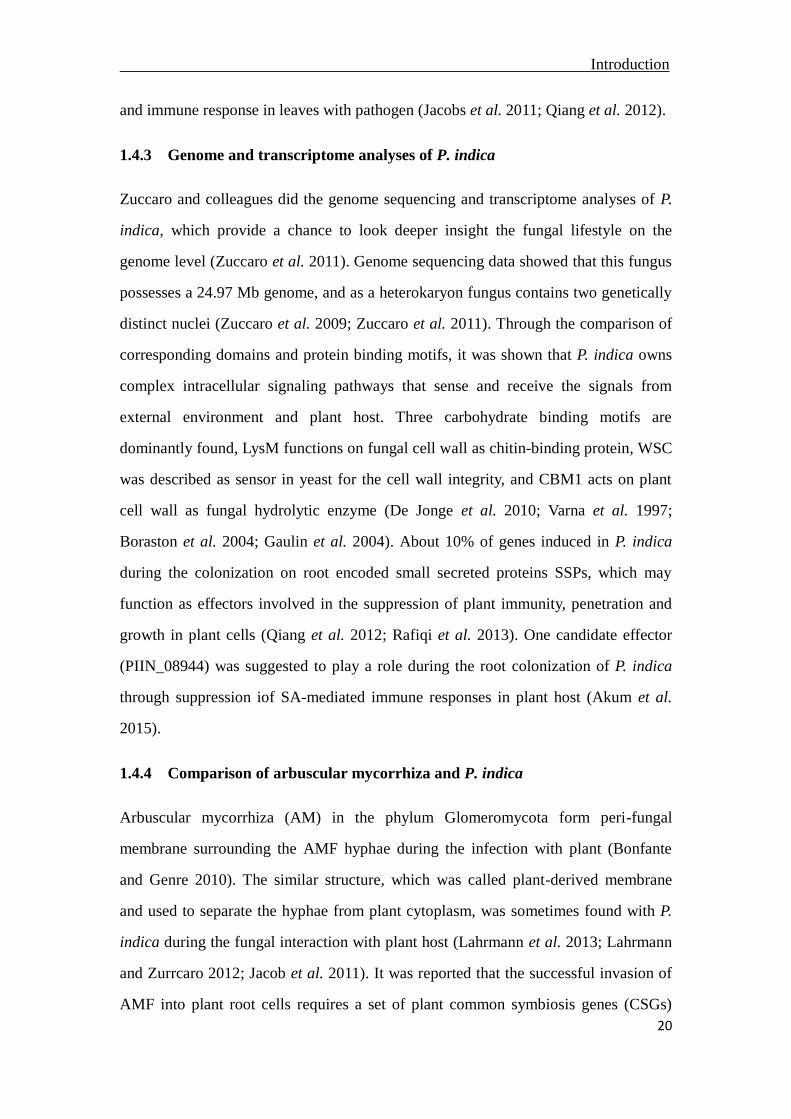
Fig. 1.4 Plant root colonization sites by endophytic bacteria (taken from Compant et al. 2010).
The use of PGPR as biological control is an environment-friendly approach against pathogenic
microorganisms including fungi, bacteria, viruses, insects and nematodes. The mechanisms for
rhizobacteria to exhibit biological control are varied. Antibiotics produced by gram-negative bacteria
function via antagonism mechanism, such as the implication of lipopeptide biosurdactants from B.
subtilis and pseudomonads in biological control (De Bruijn et al. 2007; Ongena et al. 2007). Signal
interference mechanism is based on the degradation of AHL, which is required in the biofilm formation
and the cell-wall-degrading enzymes synthesis (Lin et al. 2003; Shephard et al. 2008). Predation and
parasitism based on enzymatic destruction of fungal cell wall are the main biocontrol mechanism in
fungi, like Trichoderma species (Harman et al. 2004). ISR mechanism, which was discovered in the
resistance to Fusarium wilt of carnation from rhizobacterium Pseudomonas sp. Stain WCS417, can be
Introduction
10
triggered by variety of beneficial microbes (Van Peer et al. 1991; Van Wees et al. 2008; Van der Ent et
al. 2009; Segarra et al. 2009). The successful biocontrol bacterium need also compete on nutrients and
niches on the root with other organisms (Chin-A-Woeng et al. 2000).
1.2.2 Rhizobium-Legume symbiosis
Rhizobium spp. is Gram-negative bacteria that fix N2 for the leguminous family, such
as soybean, peanut, pea and alfalfa. Rhizobium spp. forms nodules on the roots,
differentiates into nitrogen-fixing bacteriods, and converts stable nitrogen gas in the
soil into biologically useful form ammonia, which can be used as nitrogen source and
taken up by the plant host (Van Rhijin et al. 1995; Spaink et al. 1998;). The
establishment of this symbiosis between these two partners is based on a complicated
molecular dialogue, starting even when rhizobia getting closer to root hairs in the soil
(Kijne et al. 1992). The association stimulates the deformation and curling of root hair,
and the secretion of flavonoids from plant roots activates the expression of nodD
genes in rhizobia (Long et al. 1989; Long et al. 1996). Bacteria are released from the
infection threads, which are originated from root hair and controlled by the Nod
factors, into the developing nodule cells coming from the reprogramming of the root
cortical cells (Oldroyd et al. 2011). During the release of bacteria, an un-walled
infection droplet is formed from the invagination of infection thread membrane
(Brewin 2004; Rae et al. 1992). Bacteria are surrounded by the symbiosome
membrane through the symbiotic interface - infection droplet (Parniske 2000; Roth
and Stacey 1989). Thereafter bacteria differentiate into bacteroids with the expression
of enzyme nitrogenase and are able to fix the nitrogen (Vasse et al. 1990). The
symbiosome membrane makes the exchange of carbohydrates and fixed nitrogen
happened between plant host and bacteria (Oldroyd et al. 2011). In addition to
Rhizobium, Azospirillum is also a N2-fixer for wheat, sorghum and maize (Okon et al.
1998).
Introduction
11
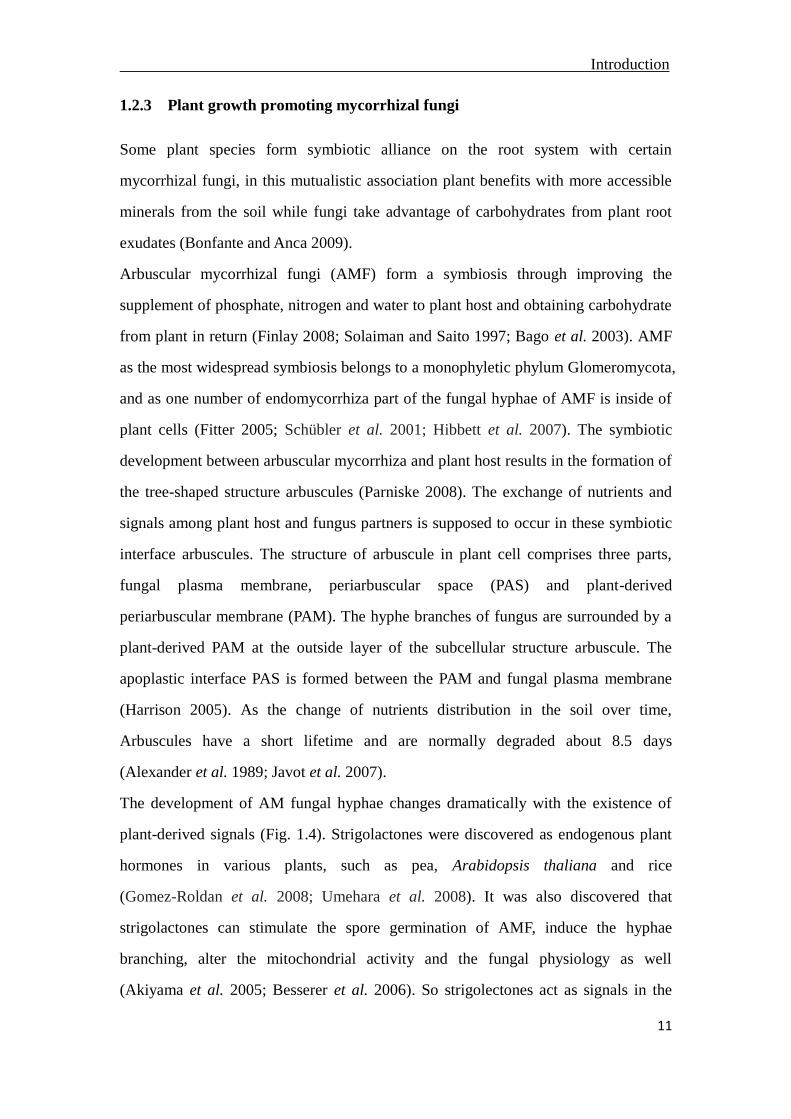
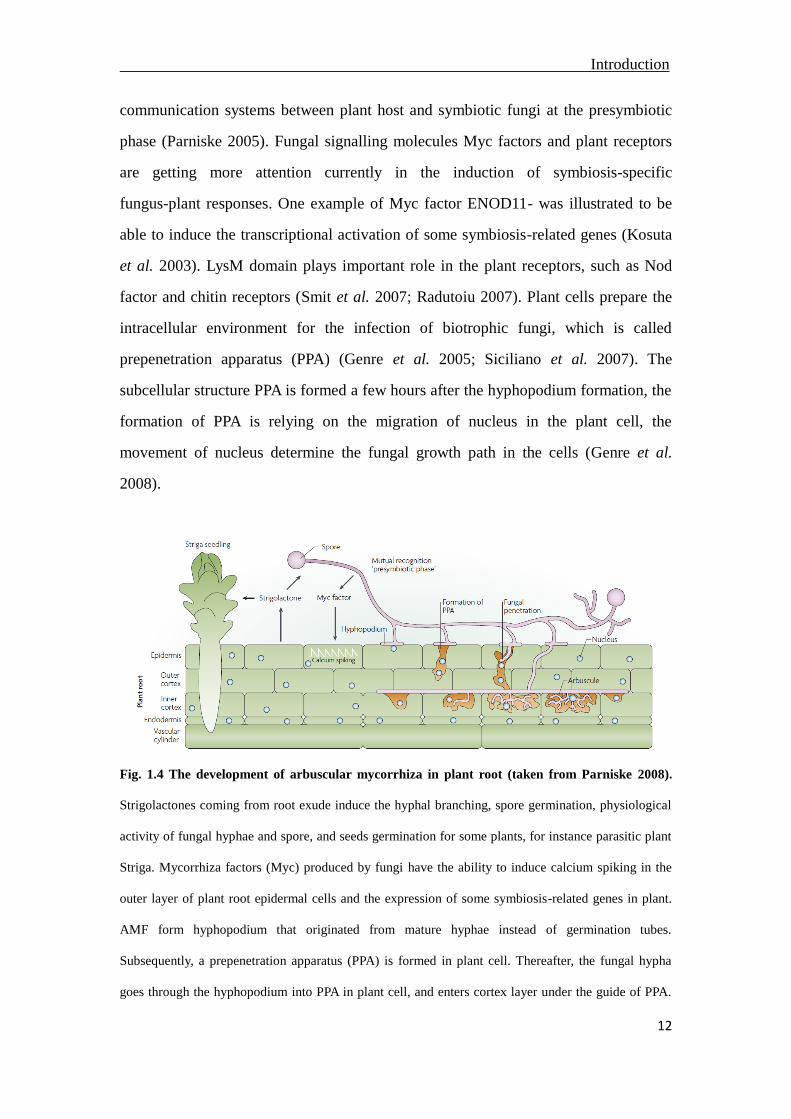
1.2.3 Plant growth promoting mycorrhizal fungi
Some plant species form symbiotic alliance on the root system with certain
mycorrhizal fungi, in this mutualistic association plant benefits with more accessible
minerals from the soil while fungi take advantage of carbohydrates from plant root
exudates (Bonfante and Anca 2009).
Arbuscular mycorrhizal fungi (AMF) form a symbiosis through improving the
supplement of phosphate, nitrogen and water to plant host and obtaining carbohydrate
from plant in return (Finlay 2008; Solaiman and Saito 1997; Bago et al. 2003). AMF
as the most widespread symbiosis belongs to a monophyletic phylum Glomeromycota,
and as one number of endomycorrhiza part of the fungal hyphae of AMF is inside of
plant cells (Fitter 2005; Schübler et al. 2001; Hibbett et al. 2007). The symbiotic
development between arbuscular mycorrhiza and plant host results in the formation of
the tree-shaped structure arbuscules (Parniske 2008). The exchange of nutrients and
signals among plant host and fungus partners is supposed to occur in these symbiotic
interface arbuscules. The structure of arbuscule in plant cell comprises three parts,
fungal plasma membrane, periarbuscular space (PAS) and plant-derived
periarbuscular membrane (PAM). The hyphe branches of fungus are surrounded by a
plant-derived PAM at the outside layer of the subcellular structure arbuscule. The
apoplastic interface PAS is formed between the PAM and fungal plasma membrane
(Harrison 2005). As the change of nutrients distribution in the soil over time,
Arbuscules have a short lifetime and are normally degraded about 8.5 days
(Alexander et al. 1989; Javot et al. 2007).
The development of AM fungal hyphae changes dramatically with the existence of
plant-derived signals (Fig. 1.4). Strigolactones were discovered as endogenous plant
hormones in various plants, such as pea, Arabidopsis thaliana and rice
(Gomez-Roldan et al. 2008; Umehara et al. 2008). It was also discovered that
strigolactones can stimulate the spore germination of AMF, induce the hyphae
branching, alter the mitochondrial activity and the fungal physiology as well
(Akiyama et al. 2005; Besserer et al. 2006). So strigolectones act as signals in the
Introduction
12
communication systems between plant host and symbiotic fungi at the presymbiotic
phase (Parniske 2005). Fungal signalling molecules Myc factors and plant receptors
are getting more attention currently in the induction of symbiosis-specific
fungus-plant responses. One example of Myc factor ENOD11- was illustrated to be
able to induce the transcriptional activation of some symbiosis-related genes (Kosuta
et al. 2003). LysM domain plays important role in the plant receptors, such as Nod
factor and chitin receptors (Smit et al. 2007; Radutoiu 2007). Plant cells prepare the
intracellular environment for the infection of biotrophic fungi, which is called
prepenetration apparatus (PPA) (Genre et al. 2005; Siciliano et al. 2007). The
subcellular structure PPA is formed a few hours after the hyphopodium formation, the
formation of PPA is relying on the migration of nucleus in the plant cell, the
movement of nucleus determine the fungal growth path in the cells (Genre et al.
2008).
Fig. 1.4 The development of arbuscular mycorrhiza in plant root (taken from Parniske 2008).
Strigolactones coming from root exude induce the hyphal branching, spore germination, physiological
activity of fungal hyphae and spore, and seeds germination for some plants, for instance parasitic plant
Striga. Mycorrhiza factors (Myc) produced by fungi have the ability to induce calcium spiking in the
outer layer of plant root epidermal cells and the expression of some symbiosis-related genes in plant.
AMF form hyphopodium that originated from mature hyphae instead of germination tubes.
Subsequently, a prepenetration apparatus (PPA) is formed in plant cell. Thereafter, the fungal hypha
goes through the hyphopodium into PPA in plant cell, and enters cortex layer under the guide of PPA.
Introduction
13
There, fungi leave plant cell, branch laterally along root axis in apoplast. These hyphae induce the
PPA-like structure in cortical cells, then branch and form arbuscules in these cells. Fresh spores are
synthesized normally at the tip of individual hyphae outside of plant root.
Seven genes in plant are identified to be required in the AM symbiosis and rhizobia
symbiosis (Kistner et al. 2005). These genes are involved in signal transduction
network, which plays an important role in the intracellular accommodation for AMF
symbiosis and rhizobia symbiosis in plant host cells. SYMRK gene encodes a
receptor-like kinase that is portrayed as a key to open the symbiotic signalling
pathway, this receptor-like kinase can perceive the extracellular signal coming from
microbial symbiosis and transduce the signal through its intracellular kinase domain
(Markmann et al. 2008; Gherbi et al. 2008). Proteins encoded by CASTOR gene and
POLLUX gene have similar domain structures and identified sequence similarity,
those proteins are seen as counter-ion channels, such as potassium-permeable cation
channel, induce calcium spiking, but is not calcium release channel (Peiter et al. 2007;
Oldroyd and Downie 2008; Imanizumi-Anraku et al. 2005). NUP85 and NUP133
genes encode nucleoporins proteins these are required in the temperature-dependent
initiation of symbiosis and act in the upstream of the calcium spiking (Kanamori et al.
2006; Saito et al. 2007; Alber et al. 2007; Lusk et al. 2007). CCaMK gene encodes a
calcium-calmodulin-dependent protein kinase, which can perceive the calcium
induced by AMF in plant host cell (Mitra et al. 2004; Kistner et al. 2005). The protein
encoded by CYCLOPS contains a functional signal from nuclear localization, induces
the arbuscule development during the symbiosis, and was illustrated to interact with
CCaMK in both planta and yeast (Lévy et al. 2004). The analysis of these genes in
infected plant starts uncovering the signalling networks in symbiotic AMF.
1.3 Rhizobium radiobacter F4
1.3.1 The genus Agrobacterium
The genus Agrobacterium was originally established by Conn in 1942 (Approve Lists
Introduction
14
1980) in tumor-inducing Agrobacterium tumefaciens, hairy root organism
Agrobacterium rhizogenes and the nonphytopathogenic strains Agrobacterium
radiobacter, later this genus was supplemented with biovar I, biovar II and biovar II
(Sawada et al. 1993). The genus Rhizobium is well-known nitrogen-fixing bacteria
that form nodule on legumes. Agrobacterium tumefaciens is one of the serious plant
pathogens in the world with a broad plant host in dicotyledon. The crown gall disease
is caused by A. tumefaciens and results in a severe agronomic loss. The genome of A.
tumefaciens C58 is about 5.67 megabase, contains one circular chromosome, one
linear chromosome, one tumor-inducing plasmid pTiC58, and another plasmid
pAtC58 (Wood et al. 2001; Goodner et al. 2001; Slater et al. 2013). The gall tumor is
caused by the discrete T-DNA gene on the tumor-inducing (Ti) plasmid. The T-DNA
is transferred into plant cell and integrated randomly into the plant genome. The
expression of T-DNA gene alters the synthesis of plant hormones leading the cell
proliferation into tumor, and the synthesis of enzyme leading to the bacterial nutrient
source opines (Zupan et al. 2000; Binns and Thomashow 1998). Tumor-inducing
genes can be replaced by exogenous DNA fragment, the reconstructed Ti-plasmid is
introduced back into A. tumefaciens and transfers the desired gene into plant host.
Because of this characteristics, A. tumefaciens as an ideal tool for gene transfer plays
essential role in transgenic plant research (Topping et al. 1995; Newell 2000). The
similar transport, metabolic and regulatory systems between A. tumefaciens and
nitrogen-fixing Rhizobiaceae indicate a close evolutionary relationship in the
divergence of pathogenic and symbiotic lifestyles (Young et al. 2001; Oke and Long
1999).
1.3.2 Endofungal bacteria
Endofungal bacterial are symbionts of fungi residing within the fungal mycelium and
spores, were original defined as bacterium-like objects (BLOs) in endomycorrhizal
fungi in 1970 (Mosse 1970; Macdonald and Chandler 1981; Scannerini and Bonfante
1991; Bonfante and Anca 2009). The lifecycle of those endobacteria in the fungal host
Introduction
15
has two hypothetical mechanisms vertical transmission and horizontal transmission.
In the vertical transmission, endobacteria replicate inside the host mycelium and
transferred to the next generation by the vegetative spores. During the horizontal
transmission, the fungal host could release the endobacteria from the cell and be
infected by other competitive bacteria (Lackner et al. 2009; Partida-Martinez et al.
2007). Normally the mutualistic symbionts tend to be the vertical transmission
whereas the pathogenic symbionts prefer the horizontal transmission, but in some
cases mutualisms choose the horizontal transmission as well under the help of a type
III secretion system (Yamamura 1997; Dale et al. 2002).
Some of the arbuscular mycorrhizal fungi harbor endosymbiotic bacteria including
Gram-positive and Gram-negative bacteria in the fungal cytosol (Parniske 2008;
Naumann et al. 2010). For example, one Glomeromycotan fungus Geosiphon
pyriformis forms a symbiosis in the bladders with Nostoc cyanobacteria that has the
ability of photosynthesis and nitrogen fixation (Schluesser et al. 2002). The
rod-shaped endobacterium Candidatus Glomeribacter gigasporarum was identified in
the AM fungus Gigaspora margarita, and vertically transmitted through the
vegetative spore generations (Bianciotto et al. 2003; Bianciotto et al. 2004). Several
studies showed that the ectomycorrhizal fungi harbor intracellular bacteria, such as
the existence of Alphaproteobacteria inside the mycelium of Laccaria bicolor S238N
(Bertaux et al. 2003; Bertaux et al. 2005). The endofungal bacterium Burkholderia
rhizoxininca was detected as mycotoxins producer in the rice pathogenic fungus
Rhizopus microspores (Partida-Martinez and Hertweck 2005; Lackner et al. 2009;
Moebius et al. 2014). Diverse endohyphal bacteria were detected to dwell in the
hyphae of phylogenetically diverse foliar fungal endophytes (Hoffman and Arnold
2010). The endobacteria associated with zygomycete fungus Mortierella alpine
produce the quorum-sensing molecule N-acylhomoserine lactones (AHL) (Kai et al.
2012a and 2012b). One of the oldest plant-associated fungi endogone host unique
mollicutes-related endobacteria (Desirò et al. 2015). Endobacteria associated with the
genera of Sebacina and Piriformospora belong to the Gram-negative bacteria
Introduction
16
Rhizobium and Acinetobacter, as well as the Gram-positive bacteria Rhodococcus and
Paenibacillus as detected by cultivation in independent analysis based on 16S rRNA
gene sequence analysis (Scharma et al., 2008). The most comprehensively studied
example of a tripartite Sebacinalean symbiosis is that of Piriformospora indica
because it was possible to isolate the endobacterium and to grow independent of the
fungal host. This enobacterium was identified by 16S rRNA gene sequencing as the
Alphaproteobacterium Rhizobium radiobacter (syn. Agrobacterium radiobacter; syn.
Agrobacterium tumefaciens) strain F4 (RrF4) (Sharma et al. 2008).
The successful isolation of endobacteria from fungal hosts is a big progress on the
way to explore the endobacterial lifestyle and the evolution procedure. The full
genome sequencing of the isolated bacteria gives a glance into the mutualistic
relationships. Bioinformatic analysis suggested that the endobacteria probably help to
keep the fitness of the fungus through the synthesis of some antibiotic- or
toxin-resistance molecules and vitamin B12 (Ghignone et al. 2012). Many of the
obligate endofungal bacteria showed a reduced genome size compared with the free
living bacteria species in the same genera such as the endobacteria Burkholderia
rhizoxinica (Lackner et al. 2011; Naito et al. 2015; Fujimura et al. 2014; Torres-
Cortés et al. 2015). The fungus-bacterial interaction has preceded the development of
fungus symbiosis with plant.
1.3.3 Endofungal Rhizobium radiobacter F4
Sharma and coworker reported an endofungal bacterium Rhizobium radiobacter F4,
which was detected in the cytoplasm of the endophytic sebacinalean fungus
Piriformospora indica and subsequently isolated from the fungus host and
successfully pure cultured on agar plate (Sharma et al. 2008). This bacterium is a
rod-shaped bacterium 1-1.5 µm in length, it is described as Alphaproteobacterium
Rhizobium radiobacter (syn. Agrobacterium radiobacter; syn. Agrobacterium
tumefaciens) strain F4 (RrF4).. After the successful isolation of RrF4 bacteria, Sharma
did the biological activity assay on model crop plant barley. Intriguingly, the plant

Introduction
17
infected by bacteria RrF4 showed certain growth promotion and pathogen resistance
against barley powdery mildew, which are quite similar to the biological activity
induced by fungus P. indica.
These endobacteria were detected by Fluorescence in situ hybridization (FISH) with a
16S rRNA targeting universal bacterial probe and a respective Rhizobium-specific
probe, amplified by PCR with universal 16S rRNA primers and specific RrF4’s ITS
primers. All these results showed the existence of one specific endobacteria
endobacterium, Rhizobium radiobacter in the fungus P. indica, however the very few
hybridization dots in FISH indicate the very few number of endobacteria exciting in
the fungus host. The genomic DNA ratio between the endofungal R. radiobacter and P.
indica was 0.035: 100, which further confirmed the low number of endobacteria in P.
indica (Sharma et al. 2008). The same case was found in the mycelium of
ectomycorrhizal Laccaria bicolor, which was reported by Bertaux that there were
1-20 bacteria per fungal cell (Bertaux et al. 2003; Bertaux et al. 2005).
1.4 The mutualistic fungus Piriformospora indica
The root endophytic fungus Piriformospora indica belongs to the order Sebacinales in
the phylum Basidomycota, and was originally isolated from two shrubs’ rhizosphere
in 1996 in Indian Thar Desert, north-western Rajasthan (Weiß et al. 2004; Verma et al.
1998; Varma et al. 1999). P. indica produces pear-shaped chlamydospores with 8-25
nuclei in each spore, establishes biotrophic relationship with its plant host through the
mycorrhizal hyphae (Verma et al. 1998; Waller et al. 2005). Molecular phylogenetic
analyses revealed that P. indica has a close relationship with the species in the
heterogeneous Sebacina vermifera complex, which shows similar biological benefits
to plant host (Weiß et al. 2004; Deshmukh et al. 2006; Sharma and Kogel 2009). As a
mutualistic endophyte, P. indica is the most studied model fungus in Sebacinales. The
discovery of endofungal bacteria harbored by P. indica constitutes an intricate
tripartite relationship among plant, fungus and bacteria.
1.4.1 Biological beneficial activity mediated by P. indica
Introduction
18
P. indica colonizes a broad spectrum of monocotyledonous and dicotyledonous plants
without any preference, induces resistance to leaf and root pathogens, promotes
biological biomass and yield, and increases tolerance to abiotic stress such as salt
stress (Peškan-Berghöfer et al. 2004; Waller et al. 2005; Deshmukh et al. 2006;
Schäfer and Kogel 2009; Varma et al. 2012; Oberwinkler et al. 2014; Ye et al. 2014).
The mechanism of P. indica functioning as disease control agent was mediated
through induced systemic resistance (ISR) and depended on the jasmonic acid
signaling pathway (Stein et al. 2008; Jacobs et al. 2011). Pathogenic assessments
were performed in dico- and monocotyledonous with variety of pathogens, such as
crop plant barley infected by powdery mildew fungal pathogen, wheat infected with
Xanthomonas translucens pv. translucens DSM 18974T
, model plant Arabisopsis
thaliana against Golovinomyces orontii and tomato against Fusarium oxysporum
(Serfling et al. 2007; Waller et al. 2005; Stein et al. 2008). The strong growth
promotion mediated by P. indica was revealed to rely on phospholipid signaling
pathway and improved nitrate supply in cereals and Arabidopsis thaliana. The
synthesis of phosphatidic acid (PA) is involved in the induced growth, in which
phospholipases D (PLDα1 and PLDδ) are required in the upstream of the synthesis
and PDKs 1.1 and 1.2 are involved in the downstream, there after the MPKs 3, 6 and
Ca+ are activated (Camehl et al. 2011). In addition, some signaling components like
LRR proteins and MATH protein and phytohormones such as gibberellin, cytokinins
and ethylene are revealed to contribute to the growth promotion (Oelmüller et al.
2005; Chandler et al. 2002; Shahollari et al. 2007; Camehl et al. 2010; Jacobs et al.
2011; Vadassery et al. 2008; Schäfer et al. 2009; Sun 2008; Yadav et al. 2010).
Several independent studies illustrated that the salt stress tolerance induced by P.
indica is associated with changed antioxidative capacities in plant host (Baltruschat et
al. 2008; Waller et al. 2005; Kumar et al. 2009; Vadassery et al. 2009).
1.4.2 Colonization pattern of P. indica
Root penetration and colonization strategies of P. indica on broad plant hosts were

Introduction
19
revealed by cell biological studies and cytological analysis. The effective colonization
starts from the germination of chlamydospores, fungal hyphae forms extracellular
network in one day on the root surface (Deshmukh et al. 2006; Schäfer et al. 2009).
Subsequently, biotrophic colonization phase starts, hyphae enter into the epidermal
layer and branch through the intercellular space, intercellular hyphae in signal
rhizodermal and cortical cells were visible at three days. Cell death-dependent
colonization phase following after the biotrophic colonization was occurred after three
days, cell death was proved by the disintegration of cytoplasm and endomembrane,
and the incomplete endoplasmic reticulum (ER) and nucleus in the cell (Jacobs et al.
2011; Qiang et al. 2012). Fungus penetrates and colonizes adjacent cells after the
completely filling in single cells, and there are necks formed on hyphae at the traverse
site through cell walls (Deshmukh et al. 2006). Gradual increase of P. indica
proliferation was detected on the maturation zone, abundant mycelium colonization
on root surface and net-like inter- and intra-cellular hyphae were observed in the
rhizodermal and cortical layers at seven days. Sporulation was mostly occurred at 14
days, single spores developed at the hyphal tips and a stack of spores were formed in
root hair cells starting from the basal parts of root hair. The continuous research on
barley, Arabisopsis and tomato has revealed that the maturation zone is the hot spot
for P. indica while the elongation and meristematic zones are normal free from
colonization (Deshmukh et al. 2006; Schäfer et al. 2009; Jacobs et al. 2011; Zuccaro
et al. 2011; Qiang et al. 2012).
Phytohormones are involved in the innate immune suppression that is prerequisite for
the successful colonization and the board host rang of P. indica. Plant host recognizes
the mutualist P. indica through its MAMPs, which trigger the MTI in plant root and
restrict the colonization and penetration of P. indica through different interaction
stages (Jacobs et al. 2011). P. indica recruits JA to achieve the suppression of MTI
through the oxidative burst in the early stage, SA- and indole glucosinolate-mediated
defense play the dominant role through manipulating gene expression in the later
stages. The root response to mutualistic P. indica is similar to the perception system
Introduction
20
and immune response in leaves with pathogen (Jacobs et al. 2011; Qiang et al. 2012).
1.4.3 Genome and transcriptome analyses of P. indica
Zuccaro and colleagues did the genome sequencing and transcriptome analyses of P.
indica, which provide a chance to look deeper insight the fungal lifestyle on the
genome level (Zuccaro et al. 2011). Genome sequencing data showed that this fungus
possesses a 24.97 Mb genome, and as a heterokaryon fungus contains two genetically
distinct nuclei (Zuccaro et al. 2009; Zuccaro et al. 2011). Through the comparison of
corresponding domains and protein binding motifs, it was shown that P. indica owns
complex intracellular signaling pathways that sense and receive the signals from
external environment and plant host. Three carbohydrate binding motifs are
dominantly found, LysM functions on fungal cell wall as chitin-binding protein, WSC
was described as sensor in yeast for the cell wall integrity, and CBM1 acts on plant
cell wall as fungal hydrolytic enzyme (De Jonge et al. 2010; Varna et al. 1997;
Boraston et al. 2004; Gaulin et al. 2004). About 10% of genes induced in P. indica
during the colonization on root encoded small secreted proteins SSPs, which may
function as effectors involved in the suppression of plant immunity, penetration and
growth in plant cells (Qiang et al. 2012; Rafiqi et al. 2013). One candidate effector
(PIIN_08944) was suggested to play a role during the root colonization of P. indica
through suppression iof SA-mediated immune responses in plant host (Akum et al.
2015).
1.4.4 Comparison of arbuscular mycorrhiza and P. indica
Arbuscular mycorrhiza (AM) in the phylum Glomeromycota form peri-fungal
membrane surrounding the AMF hyphae during the infection with plant (Bonfante
and Genre 2010). The similar structure, which was called plant-derived membrane
and used to separate the hyphae from plant cytoplasm, was sometimes found with P.
indica during the fungal interaction with plant host (Lahrmann et al. 2013; Lahrmann
and Zurrcaro 2012; Jacob et al. 2011). It was reported that the successful invasion of
AMF into plant root cells requires a set of plant common symbiosis genes (CSGs)
Introduction
21
involving in the signal transduction pathway, such as synthesis of SYMRK, CCaMK
and CYCLOPS (Singh et al. 2014; Antolin-Llovera et al. 2014; Singh and Parniske
2012). However, the colonization and growth promotion mediated by P. indica in
plant are independent from the classical CSGs, since there were intracellular hyphae
and spores of P. indica formed in CSG mutants of L. japonicus (Banhara et al. 2015).
A. thaliana as a number in the Brassicaceae family does not have one specific set of
CSGs which results in the failure to interact with AMF. These research illustrated
different pathways are exploited by P. indica and AMF during the infection with plant
host.
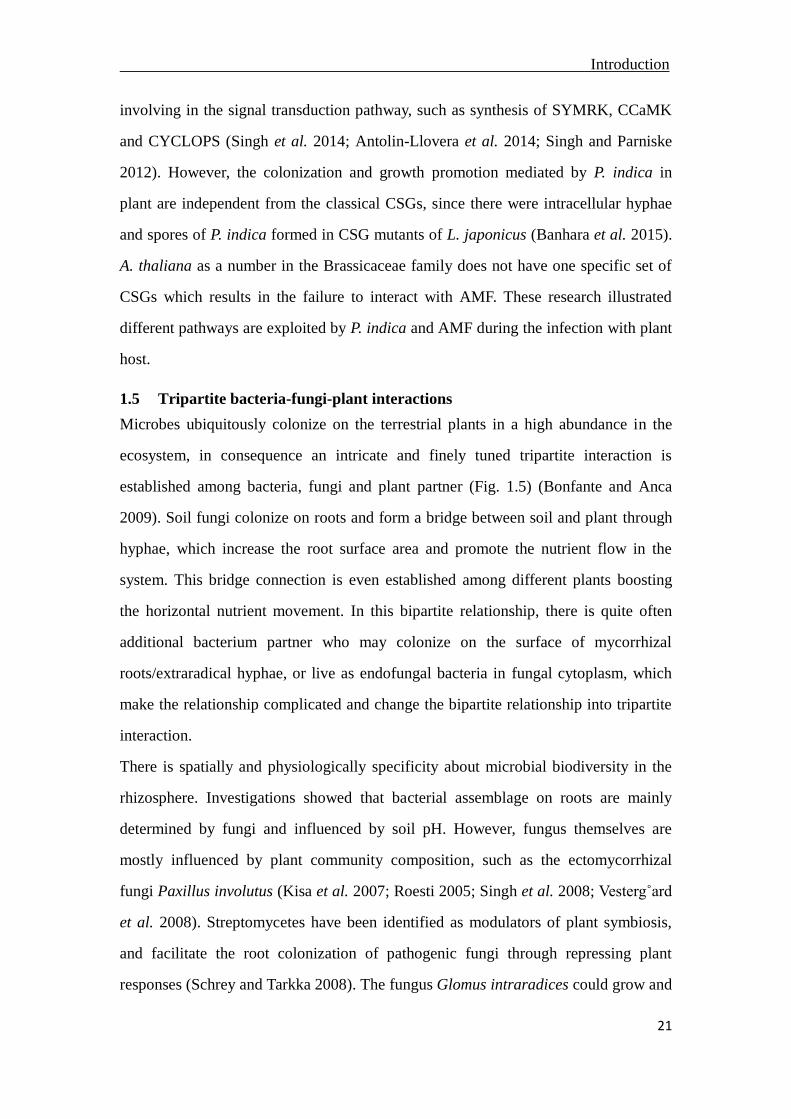
1.5 Tripartite bacteria-fungi-plant interactions
Microbes ubiquitously colonize on the terrestrial plants in a high abundance in the
ecosystem, in consequence an intricate and finely tuned tripartite interaction is
established among bacteria, fungi and plant partner (Fig. 1.5) (Bonfante and Anca
2009). Soil fungi colonize on roots and form a bridge between soil and plant through
hyphae, which increase the root surface area and promote the nutrient flow in the
system. This bridge connection is even established among different plants boosting
the horizontal nutrient movement. In this bipartite relationship, there is quite often
additional bacterium partner who may colonize on the surface of mycorrhizal
roots/extraradical hyphae, or live as endofungal bacteria in fungal cytoplasm, which
make the relationship complicated and change the bipartite relationship into tripartite
interaction.
There is spatially and physiologically specificity about microbial biodiversity in the
rhizosphere. Investigations showed that bacterial assemblage on roots are mainly
determined by fungi and influenced by soil pH. However, fungus themselves are
mostly influenced by plant community composition, such as the ectomycorrhizal
fungi Paxillus involutus (Kisa et al. 2007; Roesti 2005; Singh et al. 2008; Vesterg˚ard
et al. 2008). Streptomycetes have been identified as modulators of plant symbiosis,
and facilitate the root colonization of pathogenic fungi through repressing plant
responses (Schrey and Tarkka 2008). The fungus Glomus intraradices could grow and
Introduction
22
sporulate independently of its plant host in the presence of bacterium Paenibacillus
validus that might release raffinose, which indicate an interesting argument that
bacteria may give out some compounds mimicking plant molecules (Bouwmeester et
al. 2007; Hildebrandt et al. 2002; Hildebrandt et al. 2006). The effect of bacteria on
plant-fungus microhabitat is multifaceted, ranging through the production of
phytohormones to alleviating pathogens or other abiotic stress (Artursson et al. 2006;
Bonfante and Anca 2009). Bacteria produce extracellular polymers assisting the
attachment to ensure a physical contract with fungi, excrete organic acids as carbon
source for associated fungi (Bianciotto et al. 2001; Frey-Klett et al. 2007). Bharadwaj
et al. found that high number of spore-associated bacteria could inhibit the plant
pathogen Rhizoctonia solani (Bharadwaj et al. 2008).
Fig. 1.5 Illustration of interactions established among plants, micorrhizal fungi and bacteria in
the root rhizosphere (taken from Bonfante and Anca 2009). Ectomycorrhiza and arbuscular
mycrorrhiza were illustrated on the left side and right side of plant root respectively. Endobacteria
(white color) are presenting in spores and intraradical mycelium of AM fungi; Rhizosphere bacteria
(red color) are beneficial or detrimental to other partners through the release of some diffusible factors;
Other bacteria (green color) may play positive effects through physical contact with fungus-root
surface. Arrows illustrate the release of some diffusible factors, for instance strigolactones, auxin-like
molecules volatiles and some Myc factors, that are further perceived by reciprocal partners.
Introduction
23
From loosely or tightly associated bacteria to endobacteria resided in the fungal
cytosol, a more intriguing tripartite relationship is exemplified in the context of
toxinogenic Burhholderia-Rhizopus symbiosis. Rhizopus microspores is a zygomycete
fungus and causes rice seedling blight disease, which results in severe loss in
agriculture for famers (Iwasaki et al. 1984; Iwasaki et al. 1986). The endosymbionts
Burkholderia rhizoxinica living in Rhizopus microspores act as a producer of rhizoxin,
which is further processed by the fungal host into phytotoxin rhizoxin. This
phytotoxin rhizoxin blocks mitosis in the plant cells by binding to the β-tublin, kills
the rice plant and causes rice seedling blight (Partida-Martinez and Hertweck 2005;
Partida-Martinez et al. 2007a; Scherlach et al. 2006; Lackner et al. 2009). During this
process, the endofungal bacteria help host fungi producing phytotoxin to kill rice
plant, while the host fungi provides a protective shelter for its bacteria partner, then
both of them benefit from the nutrients released from dead rice plant (Scherlach et al.
2012). Fungal self-resistance to the antimitotic toxin was correlated with the rhizoxin
sensitivity to β-tublin sequences (Schmitt et al. 2008). Burkholderia rhizoxinica is
vertically transmitted in the fungal vegetative reproduction, controls fungal
sporulation since the cured fungi doesn’t have spores anymore, has the capability to
infect the fungus host again (Partida-Martinez et al. 2007b; Nadine et al. 2014).
Genome sequencing of this culturable microbe gave detailed insight into the evolution
and metabolic connection of this symbiont relationship (Lackner et al. 2011a and
2011b).
Introduction
24
1.6 Objectives
The root endophyte Piriformospora indica establishes a biotrophic relationship with a
broad spectrum plants, promotes biomass and crop yield, induces resistance to leaf
and root pathogens, and increases tolerance to abiotic stress. The discovery of the
endofungal bacterium Rhizobium radiobacter F4 living in P. indica’s cytoplasm
suggested that P. indica forms an intricate tripartite-relationship with the plant host
and the bacterium.
In my thesis, I addressed the question who is the partner responsible for growth
promotion and biotic/abiotic resistance induced in the plant host, the endophyte P.
indica, the endobacterium Rr, or both the fungus and the bacterium when functioning
together? For this aim, I explored the colonization pattern of GUS/GFP-labeled RrF4
on barley and Arabidopsis roots with fluorescence/light microscope, confocal laser
scanning microscopy, scanning and transmission electron microscopy. In order to
reveal what is happening to the bacteria during the colonization of P. indica with the
plant, the number and release situation of the endobacteria was analyzed. To compare
the biological activity mediated by P. indica with and without endobacteria, I
developed several strategies to cure P. indica from its endobacterium.
Materials and Methods
25
2 Materials and Methods
2.1 Bacterial and fungal materials
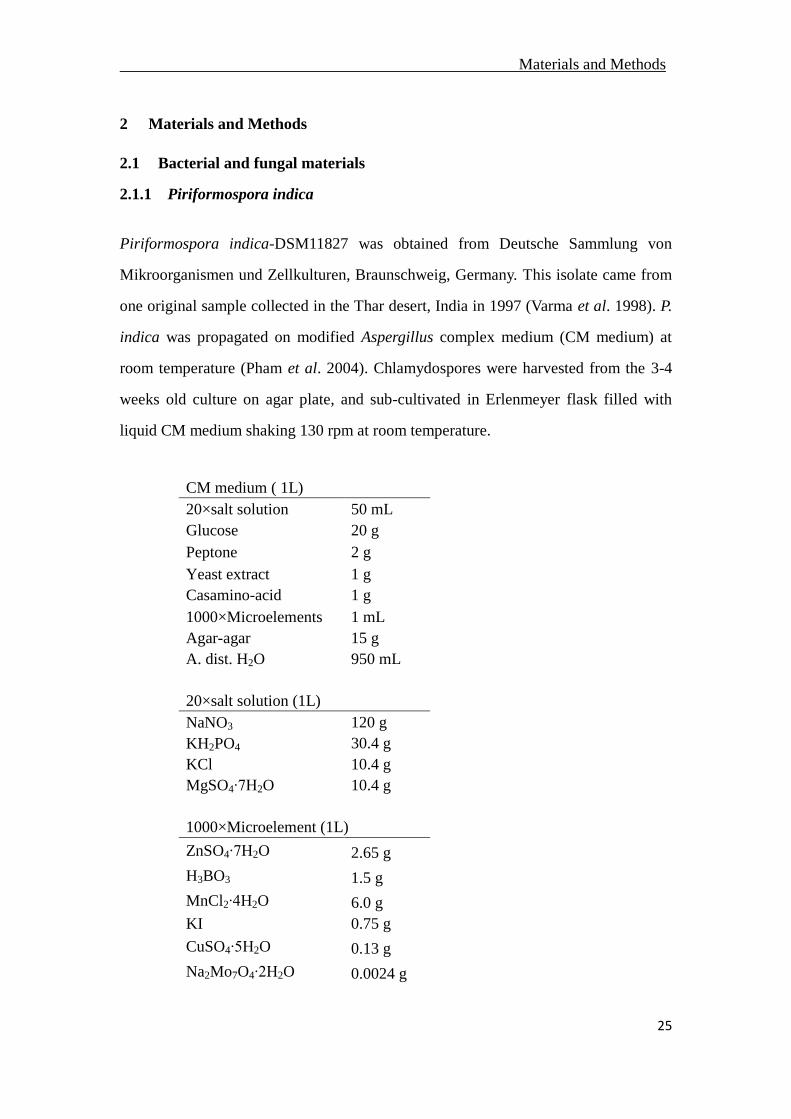
2.1.1 Piriformospora indica
Piriformospora indica-DSM11827 was obtained from Deutsche Sammlung von
Mikroorganismen und Zellkulturen, Braunschweig, Germany. This isolate came from
one original sample collected in the Thar desert, India in 1997 (Varma et al. 1998). P.
indica was propagated on modified Aspergillus complex medium (CM medium) at
room temperature (Pham et al. 2004). Chlamydospores were harvested from the 3-4
weeks old culture on agar plate, and sub-cultivated in Erlenmeyer flask filled with
liquid CM medium shaking 130 rpm at room temperature.
CM medium ( 1L)
20×salt solution 50 mL
Glucose 20 g
Peptone 2 g
Yeast extract 1 g
Casamino-acid 1 g
1000×Microelements 1 mL
Agar-agar 15 g
A. dist. H2O 950 mL
20×salt solution (1L)
NaNO3 120 g
KH2PO4 30.4 g
KCl 10.4 g
MgSO4∙7H2O 10.4 g
1000×Microelement (1L)
ZnSO4∙7H2O 2.65 g
H3BO3 1.5 g
MnCl2∙4H2O 6.0 g
KI 0.75 g
CuSO4∙5H2O 0.13 g
Na2Mo7O4∙2H2O 0.0024 g
Materials and Methods
26
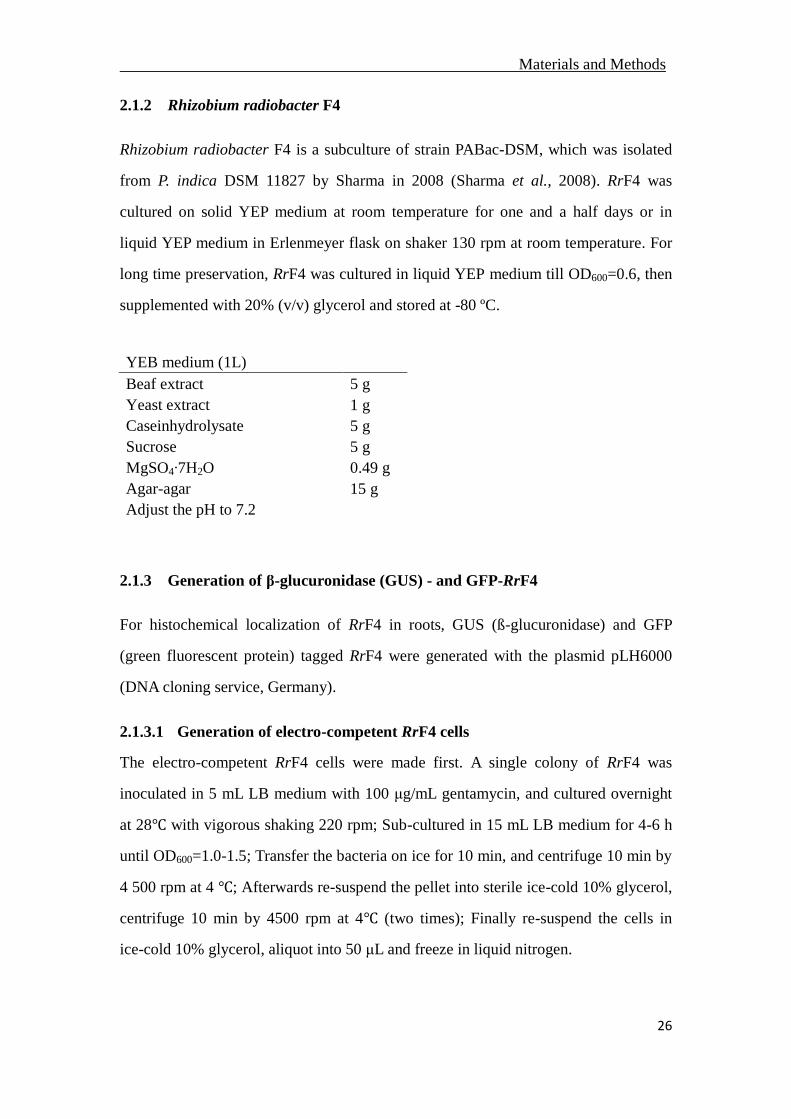
2.1.2 Rhizobium radiobacter F4
Rhizobium radiobacter F4 is a subculture of strain PABac-DSM, which was isolated
from P. indica DSM 11827 by Sharma in 2008 (Sharma et al., 2008). RrF4 was
cultured on solid YEP medium at room temperature for one and a half days or in
liquid YEP medium in Erlenmeyer flask on shaker 130 rpm at room temperature. For
long time preservation, RrF4 was cultured in liquid YEP medium till OD600=0.6, then
supplemented with 20% (v/v) glycerol and stored at -80 ºC.
YEB medium (1L)
Beaf extract 5 g
Yeast extract 1 g
Caseinhydrolysate 5 g
Sucrose 5 g
MgSO4∙7H2O 0.49 g
Agar-agar 15 g
Adjust the pH to 7.2
2.1.3 Generation of β-glucuronidase (GUS) - and GFP-RrF4
For histochemical localization of RrF4 in roots, GUS (ß-glucuronidase) and GFP
(green fluorescent protein) tagged RrF4 were generated with the plasmid pLH6000
(DNA cloning service, Germany).
2.1.3.1 Generation of electro-competent RrF4 cells
The electro-competent RrF4 cells were made first. A single colony of RrF4 was
inoculated in 5 mL LB medium with 100 μg/mL gentamycin, and cultured overnight
at 28℃ with vigorous shaking 220 rpm; Sub-cultured in 15 mL LB medium for 4-6 h
until OD600=1.0-1.5; Transfer the bacteria on ice for 10 min, and centrifuge 10 min by
4 500 rpm at 4 ℃; Afterwards re-suspend the pellet into sterile ice-cold 10% glycerol,
centrifuge 10 min by 4500 rpm at 4℃ (two times); Finally re-suspend the cells in
ice-cold 10% glycerol, aliquot into 50 μL and freeze in liquid nitrogen.
Materials and Methods
27
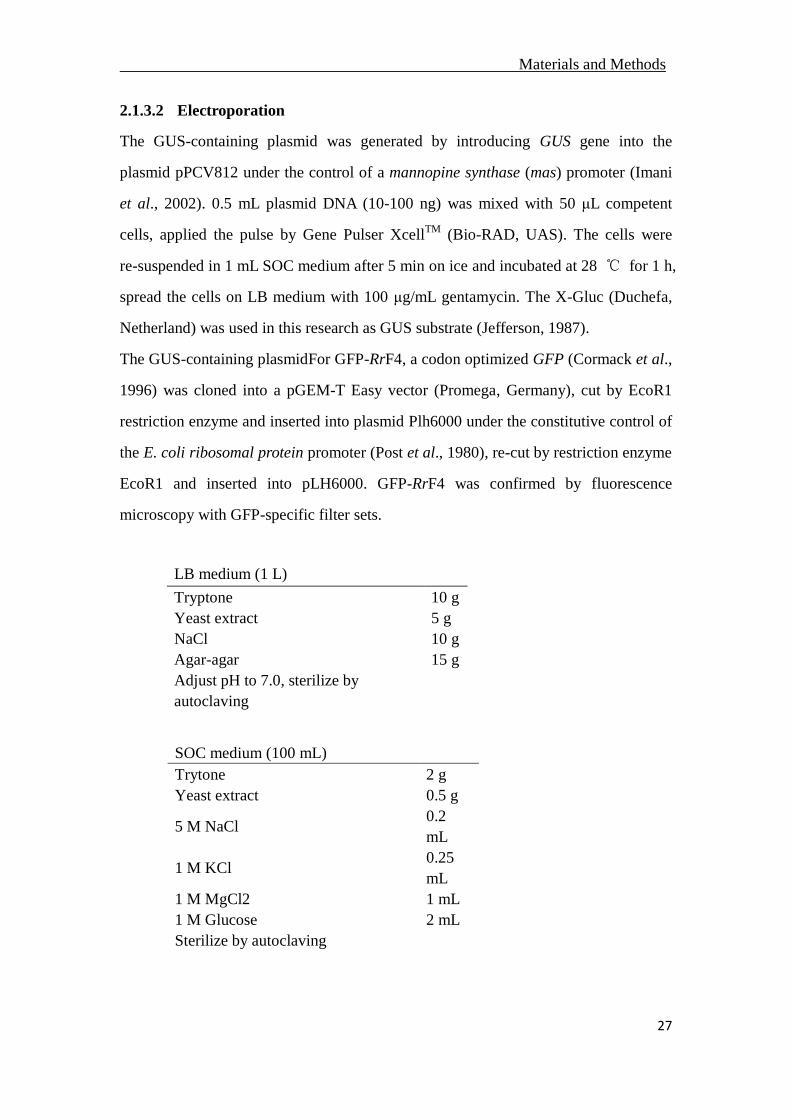
2.1.3.2 Electroporation
The GUS-containing plasmid was generated by introducing GUS gene into the
plasmid pPCV812 under the control of a mannopine synthase (mas) promoter (Imani
et al., 2002). 0.5 mL plasmid DNA (10-100 ng) was mixed with 50 μL competent
cells, applied the pulse by Gene Pulser XcellTM
(Bio-RAD, UAS). The cells were
re-suspended in 1 mL SOC medium after 5 min on ice and incubated at 28 ℃ for 1 h,
spread the cells on LB medium with 100 μg/mL gentamycin. The X-Gluc (Duchefa,
Netherland) was used in this research as GUS substrate (Jefferson, 1987).
The GUS-containing plasmidFor GFP-RrF4, a codon optimized GFP (Cormack et al.,
1996) was cloned into a pGEM-T Easy vector (Promega, Germany), cut by EcoR1
restriction enzyme and inserted into plasmid Plh6000 under the constitutive control of
the E. coli ribosomal protein promoter (Post et al., 1980), re-cut by restriction enzyme
EcoR1 and inserted into pLH6000. GFP-RrF4 was confirmed by fluorescence
microscopy with GFP-specific filter sets.
LB medium (1 L)
Tryptone 10 g
Yeast extract 5 g
NaCl 10 g
Agar-agar 15 g
Adjust pH to 7.0, sterilize by
autoclaving
SOC medium (100 mL)
Trytone 2 g
Yeast extract 0.5 g
5 M NaCl 0.2
mL
1 M KCl 0.25
mL
1 M MgCl2 1 mL
1 M Glucose 2 mL
Sterilize by autoclaving
Materials and Methods
28
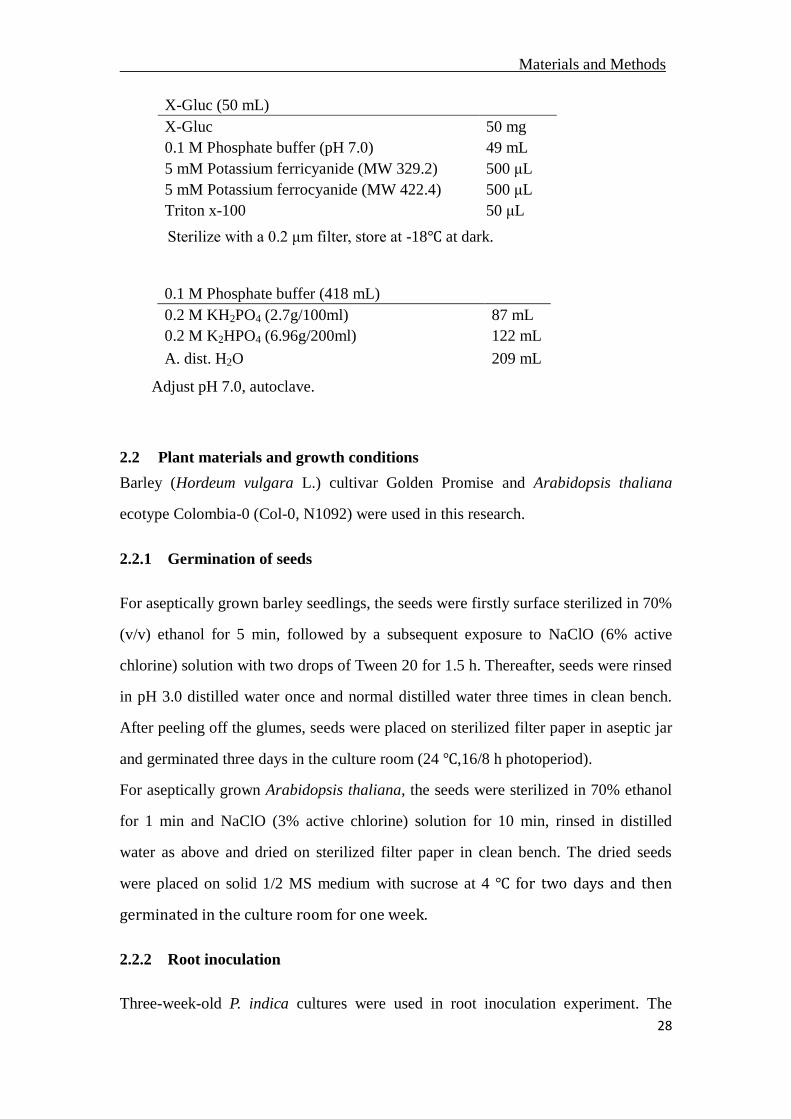
X-Gluc (50 mL)
X-Gluc 50 mg
0.1 M Phosphate buffer (pH 7.0) 49 mL
5 mM Potassium ferricyanide (MW 329.2) 500 μL
5 mM Potassium ferrocyanide (MW 422.4) 500 μL
Triton x-100 50 μL
Sterilize with a 0.2 μm filter, store at -18℃ at dark.
0.1 M Phosphate buffer (418 mL)
0.2 M KH2PO4 (2.7g/100ml) 87 mL
0.2 M K2HPO4 (6.96g/200ml) 122 mL
A. dist. H2O 209 mL
Adjust pH 7.0, autoclave.
2.2 Plant materials and growth conditions
Barley (Hordeum vulgara L.) cultivar Golden Promise and Arabidopsis thaliana
ecotype Colombia-0 (Col-0, N1092) were used in this research.
2.2.1 Germination of seeds
For aseptically grown barley seedlings, the seeds were firstly surface sterilized in 70%
(v/v) ethanol for 5 min, followed by a subsequent exposure to NaClO (6% active
chlorine) solution with two drops of Tween 20 for 1.5 h. Thereafter, seeds were rinsed
in pH 3.0 distilled water once and normal distilled water three times in clean bench.
After peeling off the glumes, seeds were placed on sterilized filter paper in aseptic jar
and germinated three days in the culture room (24 ℃,16/8 h photoperiod).
For aseptically grown Arabidopsis thaliana, the seeds were sterilized in 70% ethanol
for 1 min and NaClO (3% active chlorine) solution for 10 min, rinsed in distilled
water as above and dried on sterilized filter paper in clean bench. The dried seeds
were placed on solid 1/2 MS medium with sucrose at 4 ℃ for two days and then
germinated in the culture room for one week.
2.2.2 Root inoculation
Three-week-old P. indica cultures were used in root inoculation experiment. The
Materials and Methods
29
chlamydospores were collected with autoclaved 0.002% tween-20 water by gently
scratching the surface of P. indica culture on petri dishes with spatula. The spores
were filtered with miracloth to remove the mycelium and centrifuged at 3500 rpm for
7 min to pellet the spores. Subsequently, the pellet was suspended in tween-20 water
after washing three times. The spore concentration was detected with microscopy and
adjusted to 100000 spores per mL. Three days old barley seedlings were
dip-inoculated in P. indica spores solution for 2 h, while the tween-20 water was used
as mock.
GUS/GFP-RrF4 and wild type RrF4 were cultured in YEB medium at 28 ℃ overnight,
centrifuged and re-suspended in 10 mM MgSO4.7H2O solution with OD600=1.4.
Subsequently, three days old barley seedlings or one week old Arabidopsis thaliana
seedlings were dip-inoculated in the bacteria solution for 30 min, while 10 mM
MgSO4.7H2O solution was used as mock.
2.2.3 Seedling growth conditions
After root inoculation, barley seedlings were grown on 1/2 MS medium in culture
room or in pot in a climate chamber. The pot was containing 3:1 mixture of expanded
clay (Seramis®, Masterfoods) and Oil Dri® (Damolin). The growth condition in the
climate chamber was 16 h photoperiod, 22/18 ℃ day/night and a photon flux density
of 160 µmol m-2
s-1
. The seedlings in per pot were fertilized once every week with 30
mL Wuxal N solution (Schering, N/P/K: 12/4/6).
Arabidopsis thaliana seedlings were grown vertically on 1/2 MS medium in squared
petri dishes (Greiner Bio-One). The controlled growth condition for Arabidopsis
thaliana was 8/16 h light/dark, 22/18 ℃ and 60% rel. humidity. The roots were
harvested at 0 day post-inoculation (dpi), 5, 7, 14 and 21dpi, used for q-RT-PCR or
staining.
Materials and Methods
30
1/2 Murashige-Skoog (MS) medium
(1L)
MS 2.20 g
Sucrose 5 g
Adjust PH 5.8
Gelrite 4 g
2.3 Basic molecular biological methods
2.3.1 Genomic DNA extraction
The genomic DNA from bacteria, fungi and plant were extracted with different
approaches during this study.
The DNA of pure RrF4 was extracted with the Freeze-thaw method: the overnight
cultured RrF4 was centrifuge at 8000 rpm for 5 min, the pellet was washed with 500
µL 1×PBS and stored at -20 ºC. For freeze-thaw DNA extraction, 500 µL distilled
water was added to re-suspend the sample, then the sample was heated for 1 min at
110 ºC and frozen at -20 ºC (repeated for three times), finally the genomic DNA from
RrF4 was ready to use.
The biomass of fungal mycelium was collected from liquid culture or agar-plate, then
immediately frozen in liquid nitrogen and ground into fine powder with mortar and
pestle. The plant root was harvested from jar, pot or square petri dish, then frozen and
ground into fine powder as above. 100-200 mg powder was used for DNA extraction
by Plant DNeasy kit (QIAGEN, GmbH, Hilden, Germany), or 400-500 mg power
used for DNA isolation with the NucleoSpin® Soil Kit (Macherey-Nagel, Germany)
with lysis buffer SL1 according to manufactures’ instructions. DNA was eluted in 30
µL Milli-Q water, the concentration was measured using NanoDrop ND-1000 (Peqlab
Biotechnology GmbH, Erlangen, Germany). DNA samples with concentration 200
ng/μL were used for PCR or stored at -20 ºC.
2.3.2 Polymerase chain reaction (PCR)
The conventional amplification was performed in a PCR Thermo cycler (Biometra,
Materials and Methods
31
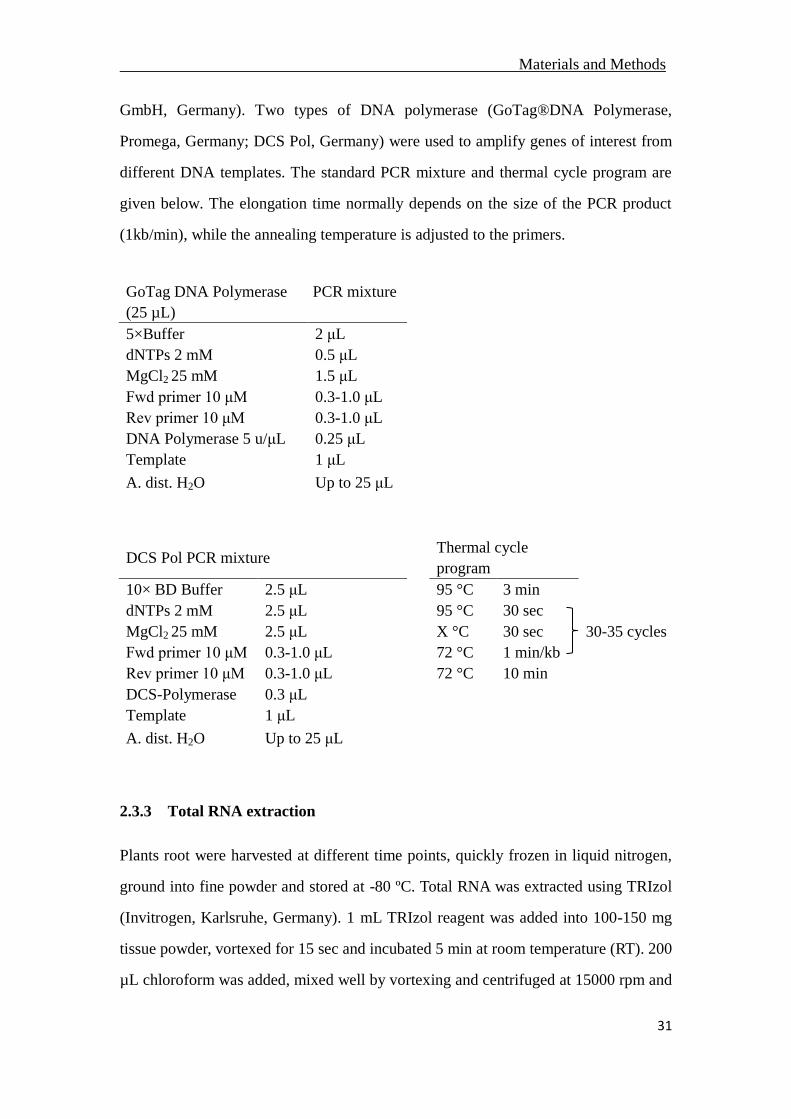
GmbH, Germany). Two types of DNA polymerase (GoTag®DNA Polymerase,
Promega, Germany; DCS Pol, Germany) were used to amplify genes of interest from
different DNA templates. The standard PCR mixture and thermal cycle program are
given below. The elongation time normally depends on the size of the PCR product
(1kb/min), while the annealing temperature is adjusted to the primers.
GoTag DNA Polymerase PCR mixture
(25 µL)
5×Buffer 2 μL
dNTPs 2 mM 0.5 μL
MgCl2 25 mM 1.5 μL
Fwd primer 10 μΜ 0.3-1.0 μL
Rev primer 10 μΜ 0.3-1.0 μL
DNA Polymerase 5 u/μL 0.25 μL
Template 1 μL
A. dist. H2O Up to 25 μL
DCS Pol PCR mixture
Thermal cycle
program
10× BD Buffer 2.5 μL
95 °C 3 min
dNTPs 2 mM 2.5 μL
95 °C 30 sec
MgCl2 25 mM 2.5 μL
X °C 30 sec 30-35 cycles
Fwd primer 10 μΜ 0.3-1.0 μL
72 °C 1 min/kb
Rev primer 10 μΜ 0.3-1.0 μL
72 °C 10 min
DCS-Polymerase 0.3 μL
Template 1 μL
A. dist. H2O Up to 25 μL
2.3.3 Total RNA extraction
Plants root were harvested at different time points, quickly frozen in liquid nitrogen,
ground into fine powder and stored at -80 ºC. Total RNA was extracted using TRIzol
(Invitrogen, Karlsruhe, Germany). 1 mL TRIzol reagent was added into 100-150 mg
tissue powder, vortexed for 15 sec and incubated 5 min at room temperature (RT). 200
µL chloroform was added, mixed well by vortexing and centrifuged at 15000 rpm and
Materials and Methods
32
4 ºC for 20 min after 3 min of incubation at RT. Subsequently, the supernatant was
transferred to a 1.5 mL eppendorf tube containing 500 µL isopropanol and incubated
for 10 min at RT. Then the sample was centrifuged at 15000 rpm and 4 ºC for 30 min
for RNA precipitation. The pellet was washed with 1 mL 75% (v/v) ethanol
(centrifugation 13 000 rpm at 4 ºC for 5 min) and dried in a clean bench for 10-15 min.
The RNA was resuspendend in 30 µL DEPC by incubatation at 65 ºC for 5 min. The
concentration of total RNA was measured using a NanoDrop ND-1000 (Peqlab
Biotechnology GmbH, Erlangen, Germany) with wavelength of 260 nm and 280 nm.
RNA extracts were stored at -80 ºC.
2.3.4 Reverse transcriptional polymerase chain reaction (RT-PCR)
The total RNA was transcribed into cDNA using the Quantitect® Reverse
Transcription kit (QIAGEN, GmbH, Hilden, Germany). According to the protocol,
1000 ng RNA was mixed with 2 µL 7×gDNA Wipeout buffer with DEPC water to the
volume of 17 µL, and incubated at 42 ºC for 2 min. Then 1 µL RT-primer mix, 4 µL
5×Quantiscript RT buffer and 1 μL Quantiscript reverse transscriptase were added to
the final volume of 23 µL. Subsequently, the reaction was performed in a Thermo
cycler (Biometra, GmbH, Germany) with the program below. The cDNA was diluted
to 10 ng/µL with DEPC water, used for quantitative Real-Time PCR analysis
immediately or stored at -80 ºC for later analysis.
Reverse transcription program
22 ºC 3 min
42 ºC 30 min
85 ºC 3 min
4 ºC 10 min
2.3.5 Quantitative Real-Time PCR (qPCR)
The quantitative real-time PCR was performed on a 7500 Fast Real-Time PCR
System (Applied Biosystems, CA, USA) to quantify the relative/absolute amount of
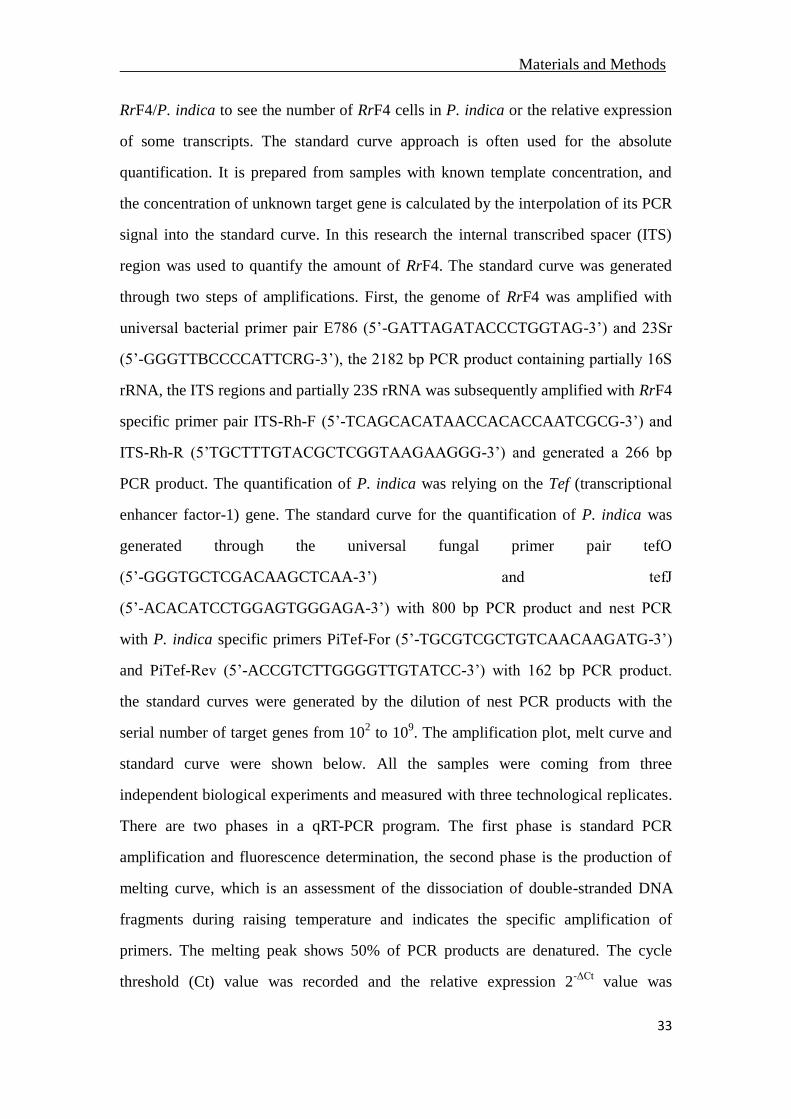
Materials and Methods
33
RrF4/P. indica to see the number of RrF4 cells in P. indica or the relative expression
of some transcripts. The standard curve approach is often used for the absolute
quantification. It is prepared from samples with known template concentration, and
the concentration of unknown target gene is calculated by the interpolation of its PCR
signal into the standard curve. In this research the internal transcribed spacer (ITS)
region was used to quantify the amount of RrF4. The standard curve was generated
through two steps of amplifications. First, the genome of RrF4 was amplified with
universal bacterial primer pair E786 (5’-GATTAGATACCCTGGTAG-3’) and 23Sr
(5’-GGGTTBCCCCATTCRG-3’), the 2182 bp PCR product containing partially 16S
rRNA, the ITS regions and partially 23S rRNA was subsequently amplified with RrF4
specific primer pair ITS-Rh-F (5’-TCAGCACATAACCACACCAATCGCG-3’) and
ITS-Rh-R (5’TGCTTTGTACGCTCGGTAAGAAGGG-3’) and generated a 266 bp
PCR product. The quantification of P. indica was relying on the Tef (transcriptional
enhancer factor-1) gene. The standard curve for the quantification of P. indica was
generated through the universal fungal primer pair tefO
(5’-GGGTGCTCGACAAGCTCAA-3’) and tefJ
(5’-ACACATCCTGGAGTGGGAGA-3’) with 800 bp PCR product and nest PCR
with P. indica specific primers PiTef-For (5’-TGCGTCGCTGTCAACAAGATG-3’)
and PiTef-Rev (5’-ACCGTCTTGGGGTTGTATCC-3’) with 162 bp PCR product.
the standard curves were generated by the dilution of nest PCR products with the
serial number of target genes from 102 to 10
9. The amplification plot, melt curve and
standard curve were shown below. All the samples were coming from three
independent biological experiments and measured with three technological replicates.
There are two phases in a qRT-PCR program. The first phase is standard PCR
amplification and fluorescence determination, the second phase is the production of
melting curve, which is an assessment of the dissociation of double-stranded DNA
fragments during raising temperature and indicates the specific amplification of
primers. The melting peak shows 50% of PCR products are denatured. The cycle
threshold (Ct) value was recorded and the relative expression 2-ΔCt
value was
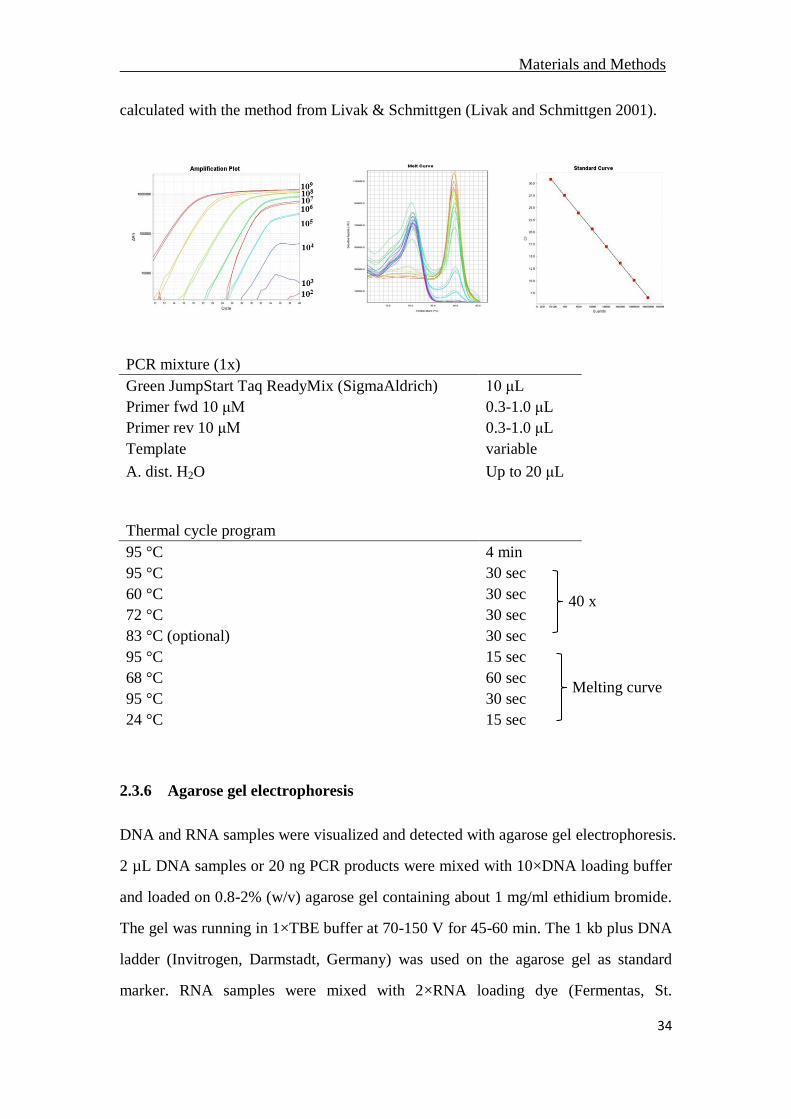
Materials and Methods
34
calculated with the method from Livak & Schmittgen (Livak and Schmittgen 2001).
PCR mixture (1x)
Green JumpStart Taq ReadyMix (SigmaAldrich) 10 μL
Primer fwd 10 μM 0.3-1.0 μL
Primer rev 10 μM 0.3-1.0 μL
Template variable
A. dist. H2O Up to 20 μL
Thermal cycle program
95 °C 4 min
95 °C 30 sec
60 °C 30 sec
72 °C 30 sec
83 °C (optional) 30 sec
95 °C 15 sec
68 °C 60 sec
95 °C 30 sec
24 °C 15 sec
2.3.6 Agarose gel electrophoresis
DNA and RNA samples were visualized and detected with agarose gel electrophoresis.
2 µL DNA samples or 20 ng PCR products were mixed with 10×DNA loading buffer
and loaded on 0.8-2% (w/v) agarose gel containing about 1 mg/ml ethidium bromide.
The gel was running in 1×TBE buffer at 70-150 V for 45-60 min. The 1 kb plus DNA
ladder (Invitrogen, Darmstadt, Germany) was used on the agarose gel as standard
marker. RNA samples were mixed with 2×RNA loading dye (Fermentas, St.
40 x
Melting curve
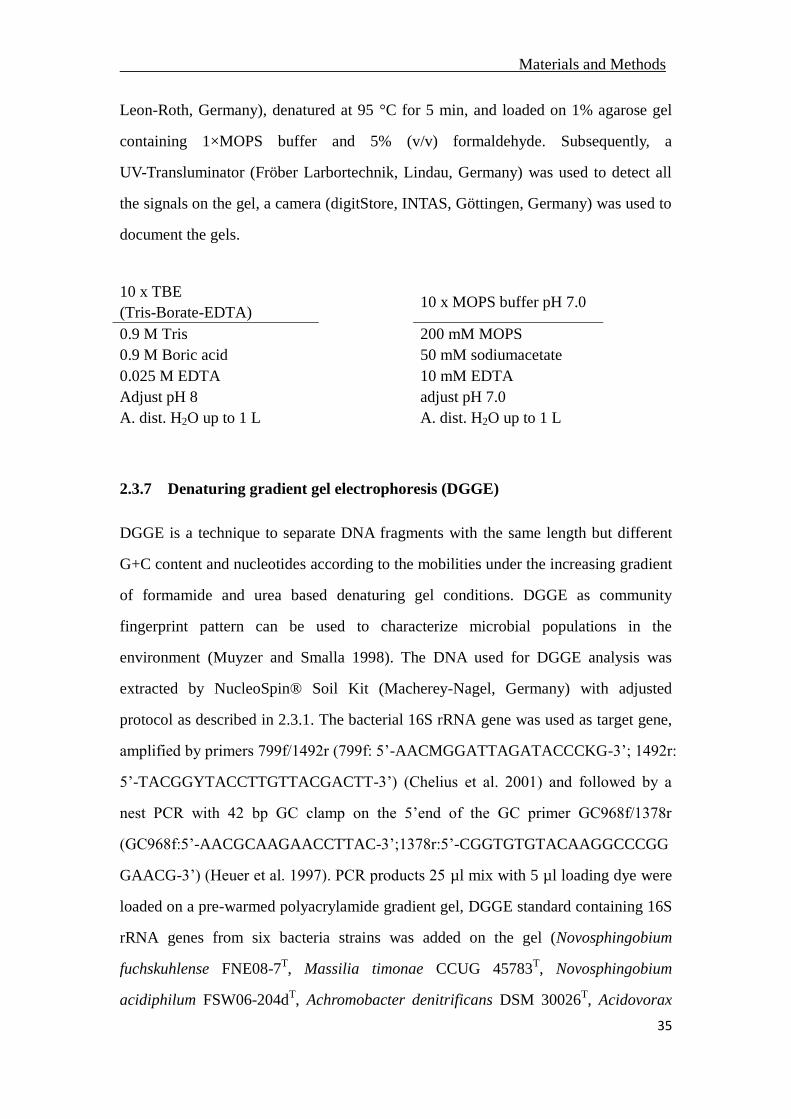
Materials and Methods
35
Leon-Roth, Germany), denatured at 95 °C for 5 min, and loaded on 1% agarose gel
containing 1×MOPS buffer and 5% (v/v) formaldehyde. Subsequently, a
UV-Transluminator (Fröber Larbortechnik, Lindau, Germany) was used to detect all
the signals on the gel, a camera (digitStore, INTAS, Göttingen, Germany) was used to
document the gels.
2.3.7 Denaturing gradient gel electrophoresis (DGGE)
DGGE is a technique to separate DNA fragments with the same length but different
G+C content and nucleotides according to the mobilities under the increasing gradient
of formamide and urea based denaturing gel conditions. DGGE as community
fingerprint pattern can be used to characterize microbial populations in the
environment (Muyzer and Smalla 1998). The DNA used for DGGE analysis was
extracted by NucleoSpin® Soil Kit (Macherey-Nagel, Germany) with adjusted
protocol as described in 2.3.1. The bacterial 16S rRNA gene was used as target gene,
amplified by primers 799f/1492r (799f: 5’-AACMGGATTAGATACCCKG-3’; 1492r:
5’-TACGGYTACCTTGTTACGACTT-3’) (Chelius et al. 2001) and followed by a
nest PCR with 42 bp GC clamp on the 5’end of the GC primer GC968f/1378r
(GC968f:5’-AACGCAAGAACCTTAC-3’;1378r:5’-CGGTGTGTACAAGGCCCGG
GAACG-3’) (Heuer et al. 1997). PCR products 25 µl mix with 5 µl loading dye were
loaded on a pre-warmed polyacrylamide gradient gel, DGGE standard containing 16S
rRNA genes from six bacteria strains was added on the gel (Novosphingobium
fuchskuhlense FNE08-7T, Massilia timonae CCUG 45783
T, Novosphingobium
acidiphilum FSW06-204dT, Achromobacter denitrificans DSM 30026
T, Acidovorax
10 x TBE
(Tris-Borate-EDTA) 10 x MOPS buffer pH 7.0
0.9 M Tris
200 mM MOPS
0.9 M Boric acid
50 mM sodiumacetate
0.025 M EDTA
10 mM EDTA
Adjust pH 8
adjust pH 7.0
A. dist. H2O up to 1 L A. dist. H2O up to 1 L
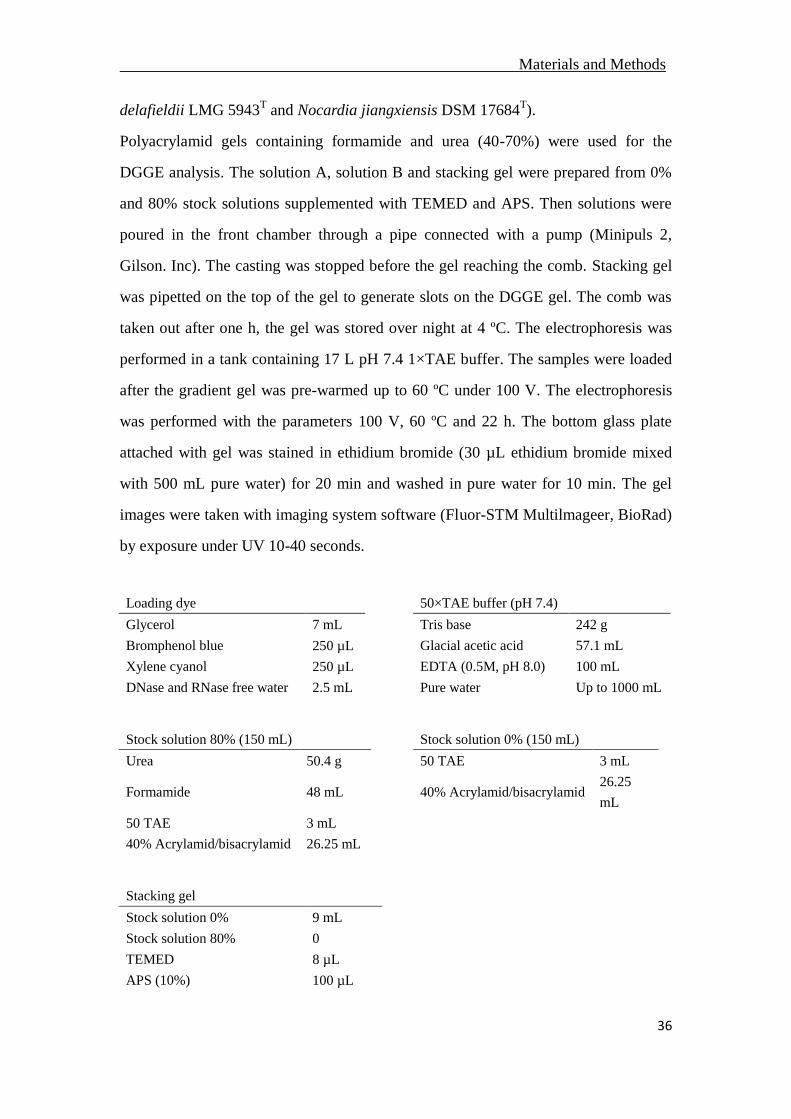
Materials and Methods
36
delafieldii LMG 5943T and Nocardia jiangxiensis DSM 17684
T).
Polyacrylamid gels containing formamide and urea (40-70%) were used for the
DGGE analysis. The solution A, solution B and stacking gel were prepared from 0%
and 80% stock solutions supplemented with TEMED and APS. Then solutions were
poured in the front chamber through a pipe connected with a pump (Minipuls 2,
Gilson. Inc). The casting was stopped before the gel reaching the comb. Stacking gel
was pipetted on the top of the gel to generate slots on the DGGE gel. The comb was
taken out after one h, the gel was stored over night at 4 ºC. The electrophoresis was
performed in a tank containing 17 L pH 7.4 1×TAE buffer. The samples were loaded
after the gradient gel was pre-warmed up to 60 ºC under 100 V. The electrophoresis
was performed with the parameters 100 V, 60 ºC and 22 h. The bottom glass plate
attached with gel was stained in ethidium bromide (30 µL ethidium bromide mixed
with 500 mL pure water) for 20 min and washed in pure water for 10 min. The gel
images were taken with imaging system software (Fluor-STM Multilmageer, BioRad)
by exposure under UV 10-40 seconds.
Loading dye
50×TAE buffer (pH 7.4)
Glycerol 7 mL
Tris base 242 g
Bromphenol blue 250 µL
Glacial acetic acid 57.1 mL
Xylene cyanol 250 µL
EDTA (0.5M, pH 8.0) 100 mL
DNase and RNase free water 2.5 mL
Pure water Up to 1000 mL
Stock solution 80% (150 mL)
Stock solution 0% (150 mL)
Urea 50.4 g
50 TAE 3 mL
Formamide 48 mL
40% Acrylamid/bisacrylamid 26.25
mL
50 TAE 3 mL
40% Acrylamid/bisacrylamid 26.25 mL
Stacking gel
Stock solution 0% 9 mL
Stock solution 80% 0
TEMED 8 µL
APS (10%) 100 µL

Materials and Methods
37
Solution A (40%)
Solution B (70%)
Stock solution 0% 12 mL
Stock solution 0% 3 mL
Stock solution 80% 12 mL
Stock solution 80% 21 mL
TEMED 17 µL
TEMED 17 µL
APS (10%) 86 µL
APS (10%) 86 µL
2.4 In situ detection of bacteria and fungi
2.4.1 Fluorescence in situ hybridization (FISH)
FISH is a widely used technique for the in situ analysis of microbial communities.
The fluorescently labelled oligonucleotide probes are targeted to the ribosomal RNA
(rRNA) and give out fluorescence signals under the fluorescence microscopy (Amann
and Fuchs 2008). In this research FISH method was used to detect the endobacterium
in the fungal materials. The applied FISH protocol used in this research was based on
the description from Manz et al. (1996) with some modifications. The procedure was
carried out as the flowing:
Fixation: All the samples were fixed to stabilize the cells and permeabilize the cell
membranes. Overnight culture of bacteria or three weeks old fungal culture from agar
plates were fixed in 50% ethanol (NaCl : ethanol 1 : 1) for 3-4 h at 4 °C or 4%
ice-cold 1×PFA for 3-12 h at 4 °C. The solution was removed by centrifuge at 6000
rpm and 5 min at 4 °C. Thereafter, the samples were washed in 1×PBS for three times.
Finally they were re-suspended in 1×PBS : 99.9% ethonal 1 : 1 and stored at -20 °C.
Lysozyme treatment: The fixed samples were pre-treated with lysozyme to enhance
the permeabilization before hybridization step. Samples were pipetted and dried on
the 6 recesses-microscope slide coated with gelatin (0.1% gelatin and 0.01%
chromium potassium sulfate). 20 µL 1 mg/mL lysozyme was added to each samples
on the slide and incubated in root temperature for 20 min. Remove the lysozyme from
the slide carefully with 1 mL ice-cold 1×PBS, subsequently dip the slide into ice-cold
1×PBS for 15 sec and dry the slide at 46 °C.
10 µg/mL Proteinase K was used to treat the samples at 37 °C for 30 min, then
inactive the proteinase K by incubating in 0.01 M HCl at room temperature for 10 min.
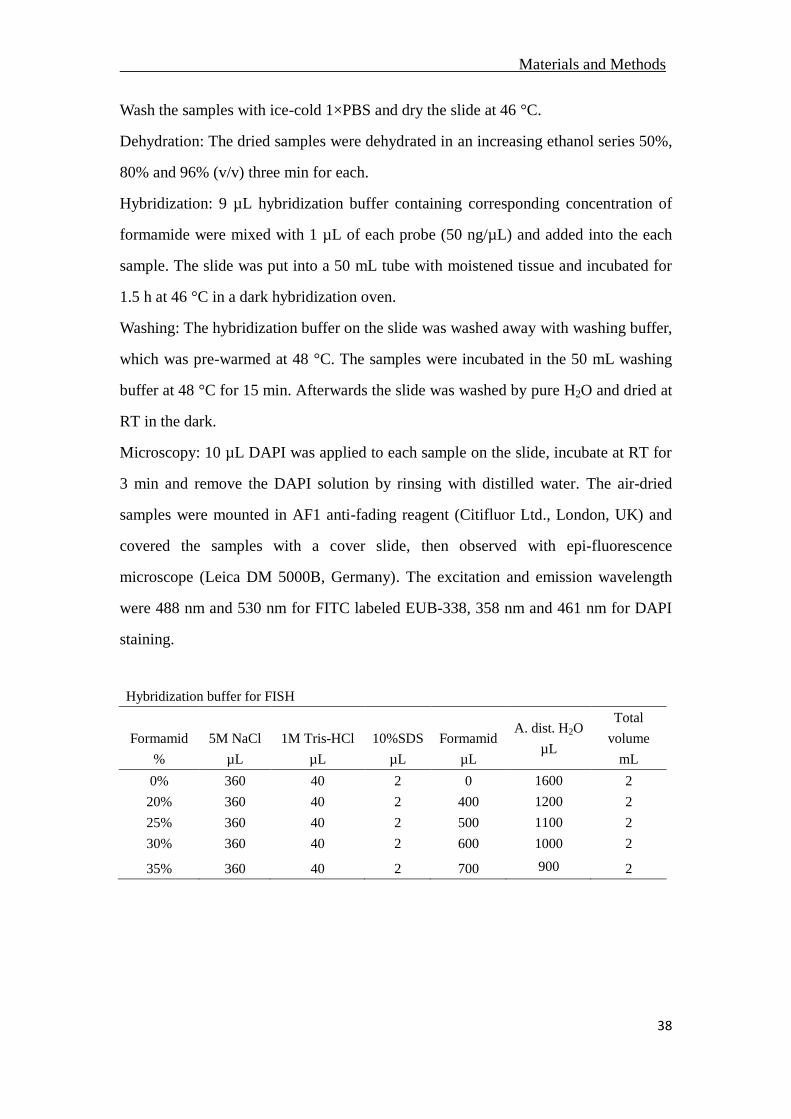
Materials and Methods
38
Wash the samples with ice-cold 1×PBS and dry the slide at 46 °C.
Dehydration: The dried samples were dehydrated in an increasing ethanol series 50%,
80% and 96% (v/v) three min for each.
Hybridization: 9 µL hybridization buffer containing corresponding concentration of
formamide were mixed with 1 µL of each probe (50 ng/µL) and added into the each
sample. The slide was put into a 50 mL tube with moistened tissue and incubated for
1.5 h at 46 °C in a dark hybridization oven.
Washing: The hybridization buffer on the slide was washed away with washing buffer,
which was pre-warmed at 48 °C. The samples were incubated in the 50 mL washing
buffer at 48 °C for 15 min. Afterwards the slide was washed by pure H2O and dried at
RT in the dark.
Microscopy: 10 µL DAPI was applied to each sample on the slide, incubate at RT for
3 min and remove the DAPI solution by rinsing with distilled water. The air-dried
samples were mounted in AF1 anti-fading reagent (Citifluor Ltd., London, UK) and
covered the samples with a cover slide, then observed with epi-fluorescence
microscope (Leica DM 5000B, Germany). The excitation and emission wavelength
were 488 nm and 530 nm for FITC labeled EUB-338, 358 nm and 461 nm for DAPI
staining.
Hybridization buffer for FISH
Formamid
%
5M NaCl
µL
1M Tris-HCl
µL
10%SDS
µL
Formamid
µL
A. dist. H2O
µL
Total
volume
mL
0% 360 40 2 0 1600 2
20% 360 40 2 400 1200 2
25% 360 40 2 500 1100 2
30% 360 40 2 600 1000 2
35% 360 40 2 700 900 2
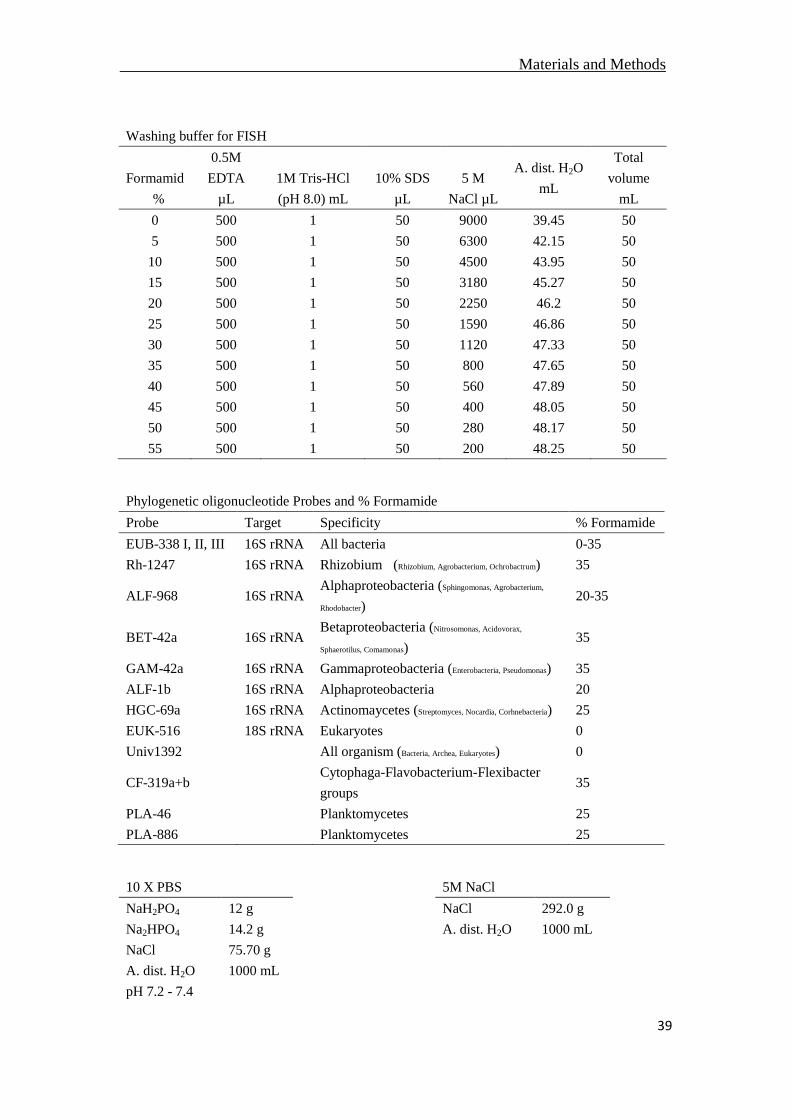
Materials and Methods
39
Washing buffer for FISH
Formamid
%
0.5M
EDTA
µL
1M Tris-HCl
(pH 8.0) mL
10% SDS
µL
5 M
NaCl µL
A. dist. H2O
mL
Total
volume
mL
0 500 1 50 9000 39.45 50
5 500 1 50 6300 42.15 50
10 500 1 50 4500 43.95 50
15 500 1 50 3180 45.27 50
20 500 1 50 2250 46.2 50
25 500 1 50 1590 46.86 50
30 500 1 50 1120 47.33 50
35 500 1 50 800 47.65 50
40 500 1 50 560 47.89 50
45 500 1 50 400 48.05 50
50 500 1 50 280 48.17 50
55 500 1 50 200 48.25 50
Phylogenetic oligonucleotide Probes and % Formamide
Probe Target Specificity % Formamide
EUB-338 I, II, III 16S rRNA All bacteria 0-35
Rh-1247 16S rRNA Rhizobium (Rhizobium, Agrobacterium, Ochrobactrum) 35
ALF-968 16S rRNA Alphaproteobacteria (Sphingomonas, Agrobacterium,
Rhodobacter) 20-35
BET-42a 16S rRNA Betaproteobacteria (Nitrosomonas, Acidovorax,
Sphaerotilus, Comamonas) 35
GAM-42a 16S rRNA Gammaproteobacteria (Enterobacteria, Pseudomonas) 35
ALF-1b 16S rRNA Alphaproteobacteria 20
HGC-69a 16S rRNA Actinomaycetes (Streptomyces, Nocardia, Corhnebacteria) 25
EUK-516 18S rRNA Eukaryotes 0
Univ1392
All organism (Bacteria, Archea, Eukaryotes) 0
CF-319a+b
Cytophaga-Flavobacterium-Flexibacter
groups 35
PLA-46
Planktomycetes 25
PLA-886 Planktomycetes 25
10 X PBS
5M NaCl
NaH2PO4 12 g
NaCl 292.0 g
Na2HPO4 14.2 g
A. dist. H2O 1000 mL
NaCl 75.70 g
A. dist. H2O 1000 mL
pH 7.2 - 7.4
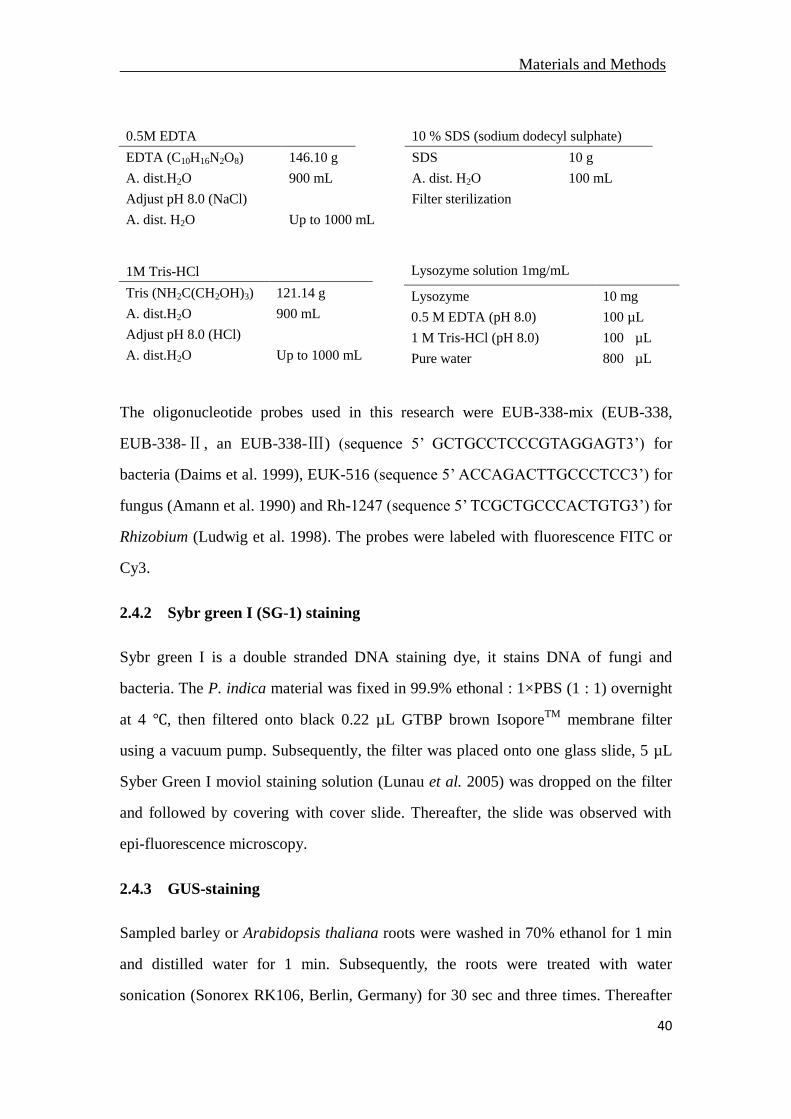
Materials and Methods
40
0.5M EDTA
10 % SDS (sodium dodecyl sulphate)
EDTA (C10H16N2O8) 146.10 g
SDS 10 g
A. dist.H2O 900 mL
A. dist. H2O 100 mL
Adjust pH 8.0 (NaCl)
Filter sterilization
A. dist. H2O Up to 1000 mL
1M Tris-HCl
Tris (NH2C(CH2OH)3) 121.14 g
A. dist.H2O 900 mL
Adjust pH 8.0 (HCl)
A. dist.H2O Up to 1000 mL
The oligonucleotide probes used in this research were EUB-338-mix (EUB-338,
EUB-338-Ⅱ, an EUB-338-Ⅲ) (sequence 5’ GCTGCCTCCCGTAGGAGT3’) for
bacteria (Daims et al. 1999), EUK-516 (sequence 5’ ACCAGACTTGCCCTCC3’) for
fungus (Amann et al. 1990) and Rh-1247 (sequence 5’ TCGCTGCCCACTGTG3’) for
Rhizobium (Ludwig et al. 1998). The probes were labeled with fluorescence FITC or
Cy3.
2.4.2 Sybr green I (SG-1) staining
Sybr green I is a double stranded DNA staining dye, it stains DNA of fungi and
bacteria. The P. indica material was fixed in 99.9% ethonal : 1×PBS (1 : 1) overnight
at 4 ℃, then filtered onto black 0.22 µL GTBP brown IsoporeTM
membrane filter
using a vacuum pump. Subsequently, the filter was placed onto one glass slide, 5 µL
Syber Green I moviol staining solution (Lunau et al. 2005) was dropped on the filter
and followed by covering with cover slide. Thereafter, the slide was observed with
epi-fluorescence microscopy.
2.4.3 GUS-staining
Sampled barley or Arabidopsis thaliana roots were washed in 70% ethanol for 1 min
and distilled water for 1 min. Subsequently, the roots were treated with water
sonication (Sonorex RK106, Berlin, Germany) for 30 sec and three times. Thereafter
Lysozyme solution 1mg/mL
Lysozyme 10 mg
0.5 M EDTA (pH 8.0) 100 µL
1 M Tris-HCl (pH 8.0) 100 µL
Pure water 800 µL
Materials and Methods
41
X-Gluc was added and inoculated with the samples in 15 mL tube at 37 ℃ for
overnight. X-Gluc was converted into a blue colored product by the β-glucuronidase
expressed by the transformed tissue cells (GUS assay; Jefferson, 1987).
2.4.4 WGA-staining and Congo red staining
Root samples were washed in distilled water three times and then fixed in fixation
solution for 24 h. The fixation solution contained chloroform: ethanol : trichloroacetic
aci (20% : 80% : 0.15%). Subsequently, the materials were treated with 10% KOH
solution for 30 sec and washed in 1×PBS buffer (pH 7.4) for three times (5 min for
each time). Thereafter, the root materials were embedded in staining solution
containing 10 μg/mL WGA Alexa Fluor® 488 (Molecular Probes, Karlsruhe,
Germany) and 0.02% Silwet L-77 in 1×PBS buffer. Root material was stained for 10
min in the staining solution. During this time, the vacuum infiltration was applied to
the root staining for three times (each time 25 mm Hg for 1 min). Finally, the roots
were put on a glass slide for microscopy after washing in 1×PBS buffer. The
florescence from WGA-AF 488 was detected with epi-fluorescence microscopy
(Axioplan 2, Zeiss, Oberkochen, Germany). The emission and absorption wave length
were 470/20 nm and 505-530 nm, respectively. The same method was used for Congo
red (Merck, Darmstadt, Germany) staining, which was detected by microscopy with
emission at 546/12 nm and absorption at 590 nm.
2.5 Microscopy analysis
Different kinds of microscope were used in this research for different samples and
purposes. FISH samples were detected with epi-fluorescence microscope and confocal
laser scanning microscopy (CLAM). GUS-RrF4 bacteria and related root samples
were observed with light microscope, transmission electron microscopy (TEM) and
scanning electron microscopy (SEM). GFP-RrF4 and related root samples were
analyzed with epi-fluorescence microscope and CLSM.
Light microscopically analysis of cross section with GUS-stained barley roots
GUS-stained root samples were fixed for cross section analysis (Grieb 1992). The
Materials and Methods
42
roots were fixed in ethanol : eisessig : formaldehyde 9 : 0.5 : 0.5 solution for 48 h,
dehydrated in 70% (v/v) ethanol for 4 h, and H2O : ethanol : tert-butanol 15 : 50 : 35
for 2 h. Afterwards, treated with ethanol : tert-butanol 25 : 75 for 2 h, sopropand :
tert-butanol 25 : 25 for 2 h, and tert-butanol for 12 h. Thereafter, embedded in
tert-butanol : paraffin 1 : 1 for 48 h at 60 ℃. Then the samples were cut by microtome
(Reichert, Vienna, Austria) into 30 µm thick sections and mounted on the
microscopical slide.
Partial function of paraffin here is making the sample cutting easier, but there will be
negative impact from the paraffin when observe the sample under microscopy. So the
de-parafinization step was followed to remove paraffin from the slide. The slides were
imbedded in xylol solution twice with each time 5 min. Subsequently, the slides were
dehydrated in graded ethanol series (96-, 70-, 50%; 5 min each step), and again in the
ethanol series (50-, 70-, 96%, 5 min each step). Thereafter, the slides were imbedded
in xylol solution for 15 min, covered the sample with a cover slide when the cross
section samples were dry. Finally, the slides were investigated by a Leica DM IL
microscope (Leica, Wetzlar, Germany).
2.5.1 Confocal laser scanning microscopy (CLSM)
The confocal laser scanning microscopy (CLSM) was used to analyze the
colonization pattern of GFP-tagged RrF4 on barley and Arabidopsis seedlings. The
seedlings were carefully separated from the ½ MS medium and washed in water.
Roots were imaged directly with CLSM for the intact image or cross sectioned in a
cryo-microtome after fixation in 3% formaldehyde with 0.05 M cacodylat buffer,
freezed protection with sucrose, embedding in Tissue-Tek and freezing in
isopropanol. Sections (30 µm thick) were embedded in Mowiol or RotiMount
FluorCare (Carl Roth, Germany). Specimens were placed on glass slides and covered
with cover slides (no.: 1.5; thickness: 0.17 µm) and imaged using a Leica TCS SP5
VIS confocal laser scanning microscope and a 63 x 1.30 GLYC objective providing
an increased working distance. The 488 nm excitation laser line and 496-550 nm

Materials and Methods
43
emission filter were used to detect the GFP fluorescence. Images were scanned at 400
Hz using 512x512 or 1024x1024 pixel resolutions. The pinhole was set to max 1 airy
unit providing a min voxel depth of 504 nm. Z-stacks were recorded using a step size
below the calculated thickness of the optical sections. Fluorescence and bright field
images were processed using the LAS-AF package (Leica, Germany).
2.5.2 Transmission electron microscopy (TEM)
Selected root areas were subsequently dissected, embedded in gelatine (Fluka,
Germany), post fixed in 1% osmium tetroxide, washed and incubated in 1% aqueous
uranyl acetate (Polysciences) overnight at 4 °C. Specimens were dehydrated in an
ethanol series and embedded in LR White (Agar Scientific, UK). From the blocks
cured by heat ultrathin sections were cut and finally contrasted in uranyl acetate and
lead citrate. Ultrathin sections were inspected in the TEM (EM912a/b – ZEISS,
Germany) at 120kV under zero-loss conditions and images were recorded at slight
under focus using a 1k x 1k slow-scan proscan ccd camera.
2.5.3 Scanning electron microscope (SEM)
The colonization pattern of RrF4 on root surface was analyzed with SEM. Roots with
branches were fixed in 1% osmium tetroxide, washed in buffer and dehydrated in an
ethanol series. Finally they were critical point dried, mounted on SEM-holders and
gold sputtered. Samples were observed in a FEG scanning electron microscope
(DSM982 and MERLIN, ZEISS Germany) at 3-5kV. Images were recorded using a
secondary electron (SE)-detector with the voltage of the collector grid biased to + 300
V to improve the signal-to-noise ratio and reveal optimal topographical contrast.
2.6 Re-isolation of P. indica
Barley seedlings were inoculated with the spores of P. indica as described in 2.2, and
cultured with ½ MS medium under axenic condition in the culture room. After two
weeks of incubation, roots were harvested under sterile conditions (clean bench) and
cut into small segments. The root fragments were washed with 70% (v/v) ethanol for
1 min, followed by 3% (x/v) NaClO for 1, 3, 5 and 10 min. The root fragments of
Materials and Methods
44
different treatments were put on CM agar plates or liquid CM flaskes and cultured at
RT. P. indica formed colonies around the root segments after 5 days, then sub-cultured
on new CM agar plates for further analysis such as the endobacteria quantification
and detection.
2.7 Curing P. indica from endobacterium
In order to cure P. indica from the endobacterium, P. indica protoplasts were treated
with antibiotics.
2.7.1 Fungal protoplast formation
The chlamydospores of P. indica were collected from three weeks old culture with
0.002% tween 20-water, cultured in 200 mL liquid CM medium shaking with 130 rpm
at 28 ℃. After 7 days of incubation, the culture was filtered through miracloth and
washed with 0.9% NaCl solution. Subsequently, the mycelium was crashed in liquid
CM medium in blender with 7 sec at high level and 7 sec at low level. The crashed
mycelium was cultured in liquid CM medium for 3 days before using for protoplast
isolation.
0.2 g lysing enzymes from Trichoerma harzianum (Sigma-Aldrich, USA) was
dissolved in 10 mL SMC buffer (1.33 M sorbitol, 50 mM CaCl2, 20 mM MES buffer
pH 5.8), sterilized with 0.2 μm filter and kept in 4 ℃ before using. Three days old P.
indica culture was filtered through miracloth. In order to have mycelium, 50 mL 0.9%
NaCl solution was used to wash away the spores or other contaminants from the
miracloth. Thereafter the mycelium was dissolved in lysing enzyme solution and
incubated in 37 ℃ hybridization oven for 1 h by slightly shaking. The protoplast
formation was checked with microscope. To stop the enzymes activity, 10 mL ice cold
STC buffer (1.33 M sorbitol, 50 mM CaCl2, 10 mM TrisHCl; pH 7.5) was added to
each 10 mL protoplasts sample through miracloth filter. Protoplasts were collected by
centrifuge at 4 000 rpm 4℃ for 10 min, and gently suspended in 1 mL STC buffer in
a 1.5 mL eppendorf tube by pipetting. Finally, the protoplasts were dissolved in 100

Materials and Methods
45
μL cold STC buffer after washing with STC buffer for two times (the best
concentration is 107-10
9 protoplasts per mL).
2.7.2 Treatment with antibiotics
The fungal protoplasts were plated on CM medium plates containing 300
μg/mLspectinomycin and 300 μg/mL ciprofloxacin, while protoplasts plated on CM
medium without antibiotics as control. This was termed as protoplast generation 1
(G1). The germination of single protoplast was clearly viewed on the plate after one
week, ten colonies formed from ten protoplasts were picked up and transferred to ten
fresh CM medium plates containing both spectinomycin and ciprofloxacin as above.
After culturing for three weeks, fungal samples were taken from each plates and
endobacteria were detected by real-time PCR with specific ITS primer. The
chlamydospores were collected from the plates depending on the endobacteria
detection result, protoplast formation was performed as before and cultured on CM
medium with spectinomycin and ciprofloxacin, which was termed as protoplast G2.
Ten colonies were picked up from each plate and transferred to fresh plates again. The
endobacteria were detected in the same way. Protoplasts treatment with antibiotics
went till G3 generation.
2.8 Infection of P. indica with GFP-/GUS-RrF4
In order to see if RrF4 can infect P. indica and go back to its fungal host again, the
GFP- and GUS- tagged RrF4 were used here.
2.8.1 Protoplasts formation from P. indica and RrF4
GFP-/GUS-RrF4 were cultured in 10 mL LB medium with 50 µg/mL spectionomycin
at 37 °C, 190 rpm overnight. 250 µL overnight culture was transferred and cultured in
25 mL same medium until OD600=0.7. The bacteria were pelleted by centrifugation at
5 000 rpm for 10 min, washed with 25 mL distilled water for three times, and
re-suspended in 2.5 mL 1×SMMP buffer. Subsequently, lysozyme was added into the
bacteria suspension with the concentration 10 mg/mL and incubated at 37 °C for
12-16 h without shaking. The bacteria protoplasts were pelleted by centrifugation 5
Materials and Methods
46
000 rpm for 6 min after observing with microscope, washed with 1×SMMP twice and
dissolved into 2.5 mL 1×SMMP buffer by pipetting up and down to mix well. Small
aliquots were generated with 300 µL volume, used it directly or stored at -80 °C
(maximum 6 months). The protoplasts of P. indica were formed as above, while the
protoplasts from RrF4 were isolated as flowing.
2.8.2 Fusion
300 µL protoplasts of P. indica were mixed with 300 µL protoplast of bacteria in 2 mL
fusogen. The mixture was vortexed gently for 30 sec followed by standing for 30 sec,
then added 7 mL 1×SMMP immediately and centrifuged at 5 000 rpm for 20 min at
RT. The pellet was dissolved into 1 mL 1×SMMP and incubated for 3-4 h at 30-37 °C.
Finally, 200 µL mixtures were plated evenly on each LB plate and cultured at 30 °C.
1×SMMP (25 mL)
2×SMM 13.8 mL
4×PAB 10 mL
5%BSA 1.25 mL
It can stay at 4 °C for 2 days.
2×SMM (200 mL)
1.0 M Sucrose 68.4 g
0.02 M Tris 0.49 g
0.01 M MgCl2 0.41 g
0.04 M Maleic acid 0.93 g
Adjust pH 6.8 with 10N NaOH, then autoclave for 12 min
4×PAB (Bacto Perrasam Broth) (500 mL)
Nutrient Broth (Gibro) 8 g
Bactopepton (Difco) 7 g
Yeast Extract 6.2 g
Adjust pH 6.8, then autoclave
Fusogen (100 mL)
PEG 6000 40 g
2×SMM (without autoclaving) 50 mL
Add water up to 100 mL, adjust pH 6.8, then autoclave for 12 min
Materials and Methods
47
2.8.3 Co-cultivation of GFP-RrF4 and P. indica
GFP-RrF4 suspension with OD600=0.1 was added to three days old germinated P.
indica spores solution in liquid CM medium. Thereafter the mycelium of P. indica
was daily investigated by epi-fluorescence microscopy. The protoplasts of P. indica
were inoculated with GFP-RrF4 suspension with OD600=0.1 in Eppendorf tube for 40
min, thereafter cultured on CM medium with 300 μg/mL spectinomycin. The material
was analysed by microscopy after one week.
2.9 Biological activity of P. indica and RrF4 assays
Barley Golden Promise were inoculated with P. indica or RrF4, and cultured in
climate chamber for three weeks as describes in 2.2.3. Plants cultured in pots
containing 3:1 expanded clay (Seramis®, Masterfoods) and Oil Dri® (Damolin) were
used for the growth promotion assay. The shoot and root weights were measured in
each treatments. Plants cultured in pots containing soil were used for the pathogenic
assay. The third leaves from three-week old plants were used for a detached
leaf-segment test to see the plant systemic resistance. Barley powdery mildew
Blumeria graminis f. sp. hordei was used as pathogen in the assessment. The leaf
segments were inoculated with 15 conidia mm-2 spores of B. graminis f. sp. hordei
for 10 min, and kept on water agar plates (1.5% agar) with 5% benzimidazole under
darkness for 6 days. Then the pustules on the leaves segments were counted under
microscope.

Results
48
3 Results
3.1 Detection of the endobacterium R. radiobacter in P. indica
The endofungal bacterium associated with the fungus P. indica was detected in the
fungal tissue by FISH using the fluorescently labeled universal bacterial 16S rRNA
binding probe EUB-338. The FISH results showed the presence of few endobacteria
in both mycelium (Fig. 3.1 A) and chlamydospores (Fig. 3.1 B) of P. indica which
was cultured in liquid CM medium. Since the cell wall of fungi could be a barrier for
the entrance of the FISH probe into the fungal cells to bind to the ribosomal RNA of
endobacteria, crushed hyphae and protoplasts from P. indica were analyzed by FISH
in parallel. The low abundance of endobacteria in P. indica was also illustrated with
crushed P. indica material (Fig. 3.1 C). The nucleic acid staining dye
4',6-diamidino-2-phenylindole (DAPI) was used together with the FISH probe
EUB-338-FITC (green fluorescent signal) to exclude unspecific fluorescence signals.
While probe EUB-338-FITC stained only bacterial cells (Fig. 3.1 D), DAPI stained
bacterial cells and nuclei of fungi and thereby confirmed the presence of endobacteria
(Fig. 3.1 E) in the fungal tissue (Fig, 3.1 F) In this experiment, pure RrF4 cells were
used as positive control to control the efficiency of the probe binding (Fig. 3.1 G, H,
I). Compared with the rod-shaped pure RrF4, the endobacterial cells of the Rhizobium
were smaller in size and had a coccoid-shape in P. indica. Probe EUB-338-Cy3 (red
fluorescence signal) was used for confocal laser scanning microscopy to further
confirm the existence of the endobacteria within fungal tissue (Supplement Fig. 7.1).
Probe Rh-1247, which is specific for bacteria in the Rhizobium group, was also used
to detect the endobacteria in P. indica (data not shown).

Results
49
Fig. 3.1 FISH detection of endobacteria in P. indica lab cultures by fluorescence microscopy. P.
indica was cultured in liquid CM medium for three weeks, fixed and analysed with FISH using a
univseral bacterial probe (A, B). A: endobacterial cells detected in hyphae; B: endobacterial cells
detected in chlamydospores; Three-week-old P. indica was crashed with blender and fixed for FISH
(C). P. indica cultured in petri dish with solid CM medium was used for endobacteria detection, the
same field showed in different channels (D, E, F); D: stained with FISH (green signal); E: DAPI
staining (blue signal); F: light microscopical image. Pure RrF4 was cultured overnight in modified
YEB medium and fixed for FISH detection as positive control (G, H); G: pure RrF4 stained by FISH;
H: light microscopic image. The probe used in FISH detection was the bacteria probe EUB-338-FITC
(green fluorescence). White arrows point to the detected endobacterium. All microscopic analyses were
done at 1,000 fold magnification; all bars indicated 10 µm.
3.2 Growth of RrF4 stain in pure culture
The endofungal bacterium was isolated from P. indica and named as strain Rhizobium
radiobacter F4 (RrF4, Glaeser et al. 2015). The size of RrF4 cells was 1.2-2.0 µm in
length and 0.7-0.9 µm in width. To get an indication of the growth stage of cultures
applied for different kind of experiments, the growth behavior of RrF4 in liquid
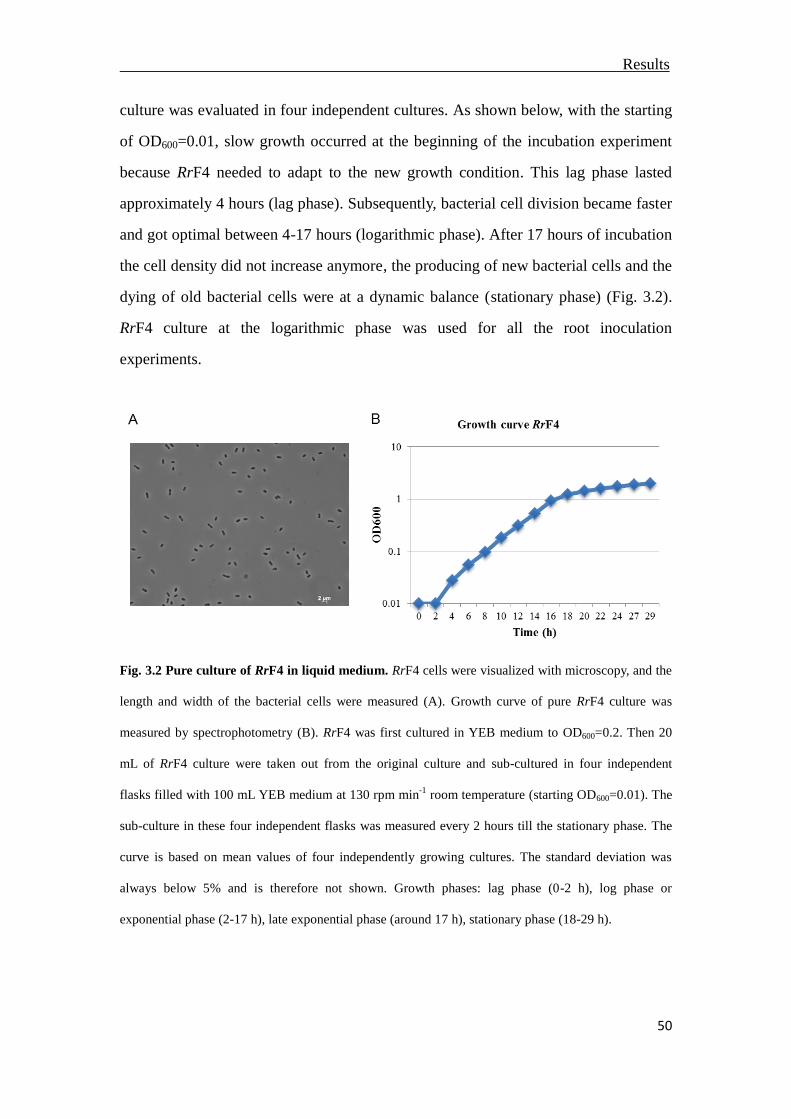
Results
50
culture was evaluated in four independent cultures. As shown below, with the starting
of OD600=0.01, slow growth occurred at the beginning of the incubation experiment
because RrF4 needed to adapt to the new growth condition. This lag phase lasted
approximately 4 hours (lag phase). Subsequently, bacterial cell division became faster
and got optimal between 4-17 hours (logarithmic phase). After 17 hours of incubation
the cell density did not increase anymore, the producing of new bacterial cells and the
dying of old bacterial cells were at a dynamic balance (stationary phase) (Fig. 3.2).
RrF4 culture at the logarithmic phase was used for all the root inoculation
experiments.
Fig. 3.2 Pure culture of RrF4 in liquid medium. RrF4 cells were visualized with microscopy, and the
length and width of the bacterial cells were measured (A). Growth curve of pure RrF4 culture was
measured by spectrophotometry (B). RrF4 was first cultured in YEB medium to OD600=0.2. Then 20
mL of RrF4 culture were taken out from the original culture and sub-cultured in four independent
flasks filled with 100 mL YEB medium at 130 rpm min-1
room temperature (starting OD600=0.01). The
sub-culture in these four independent flasks was measured every 2 hours till the stationary phase. The
curve is based on mean values of four independently growing cultures. The standard deviation was
always below 5% and is therefore not shown. Growth phases: lag phase (0-2 h), log phase or
exponential phase (2-17 h), late exponential phase (around 17 h), stationary phase (18-29 h).
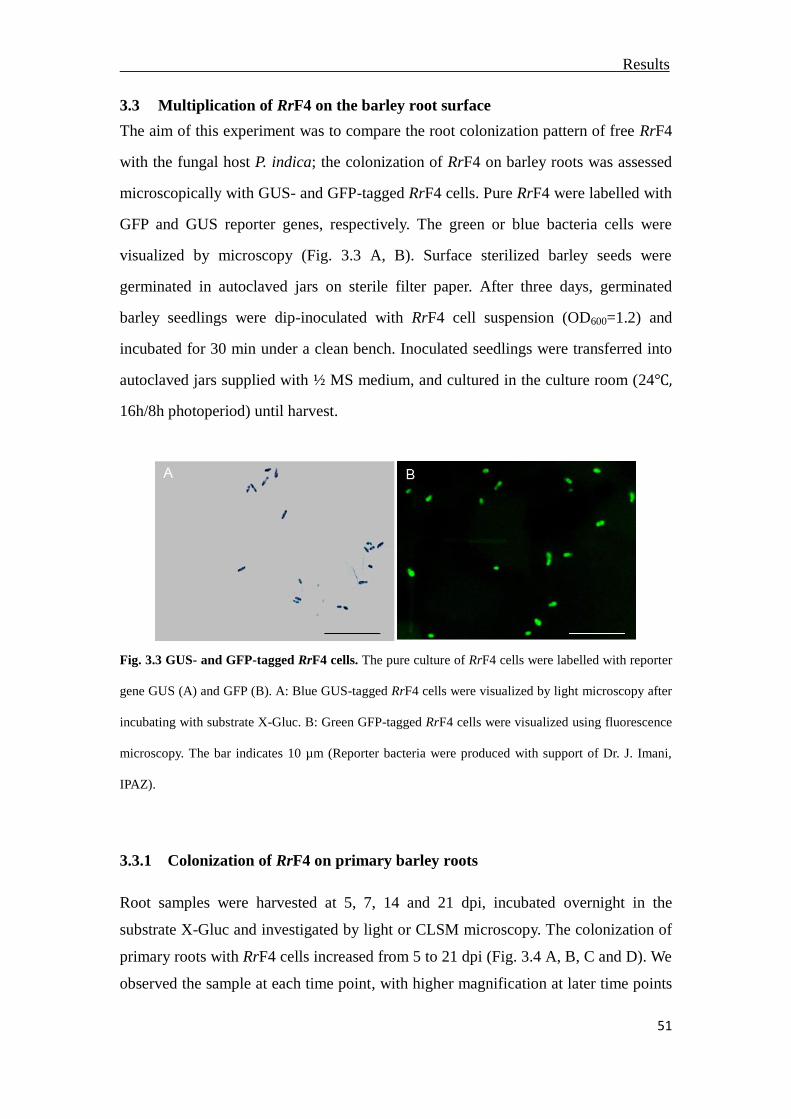
Results
51
3.3 Multiplication of RrF4 on the barley root surface
The aim of this experiment was to compare the root colonization pattern of free RrF4
with the fungal host P. indica; the colonization of RrF4 on barley roots was assessed
microscopically with GUS- and GFP-tagged RrF4 cells. Pure RrF4 were labelled with
GFP and GUS reporter genes, respectively. The green or blue bacteria cells were
visualized by microscopy (Fig. 3.3 A, B). Surface sterilized barley seeds were
germinated in autoclaved jars on sterile filter paper. After three days, germinated
barley seedlings were dip-inoculated with RrF4 cell suspension (OD600=1.2) and
incubated for 30 min under a clean bench. Inoculated seedlings were transferred into
autoclaved jars supplied with ½ MS medium, and cultured in the culture room (24℃,
16h/8h photoperiod) until harvest.
Fig. 3.3 GUS- and GFP-tagged RrF4 cells. The pure culture of RrF4 cells were labelled with reporter
gene GUS (A) and GFP (B). A: Blue GUS-tagged RrF4 cells were visualized by light microscopy after
incubating with substrate X-Gluc. B: Green GFP-tagged RrF4 cells were visualized using fluorescence
microscopy. The bar indicates 10 µm (Reporter bacteria were produced with support of Dr. J. Imani,
IPAZ).
3.3.1 Colonization of RrF4 on primary barley roots
Root samples were harvested at 5, 7, 14 and 21 dpi, incubated overnight in the
substrate X-Gluc and investigated by light or CLSM microscopy. The colonization of
primary roots with RrF4 cells increased from 5 to 21 dpi (Fig. 3.4 A, B, C and D). We
observed the sample at each time point, with higher magnification at later time points
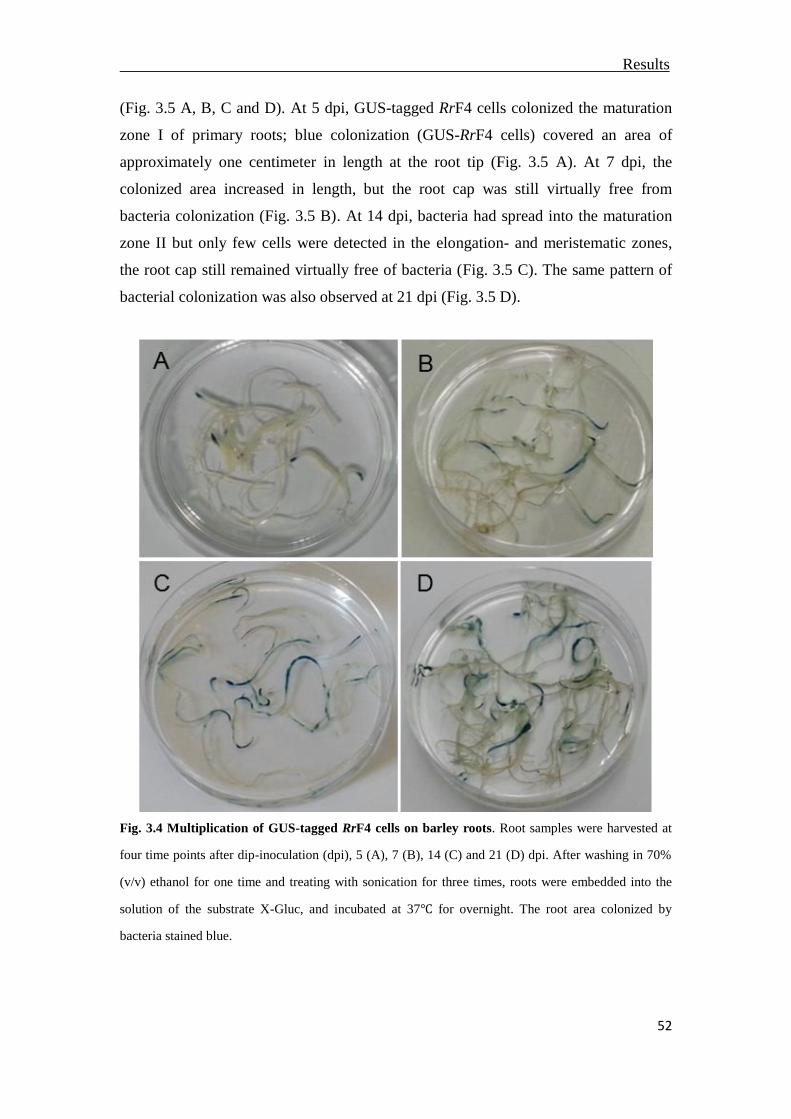
Results
52
(Fig. 3.5 A, B, C and D). At 5 dpi, GUS-tagged RrF4 cells colonized the maturation
zone I of primary roots; blue colonization (GUS-RrF4 cells) covered an area of
approximately one centimeter in length at the root tip (Fig. 3.5 A). At 7 dpi, the
colonized area increased in length, but the root cap was still virtually free from
bacteria colonization (Fig. 3.5 B). At 14 dpi, bacteria had spread into the maturation
zone II but only few cells were detected in the elongation- and meristematic zones,
the root cap still remained virtually free of bacteria (Fig. 3.5 C). The same pattern of
bacterial colonization was also observed at 21 dpi (Fig. 3.5 D).
Fig. 3.4 Multiplication of GUS-tagged RrF4 cells on barley roots. Root samples were harvested at
four time points after dip-inoculation (dpi), 5 (A), 7 (B), 14 (C) and 21 (D) dpi. After washing in 70%
(v/v) ethanol for one time and treating with sonication for three times, roots were embedded into the
solution of the substrate X-Gluc, and incubated at 37℃ for overnight. The root area colonized by
bacteria stained blue.
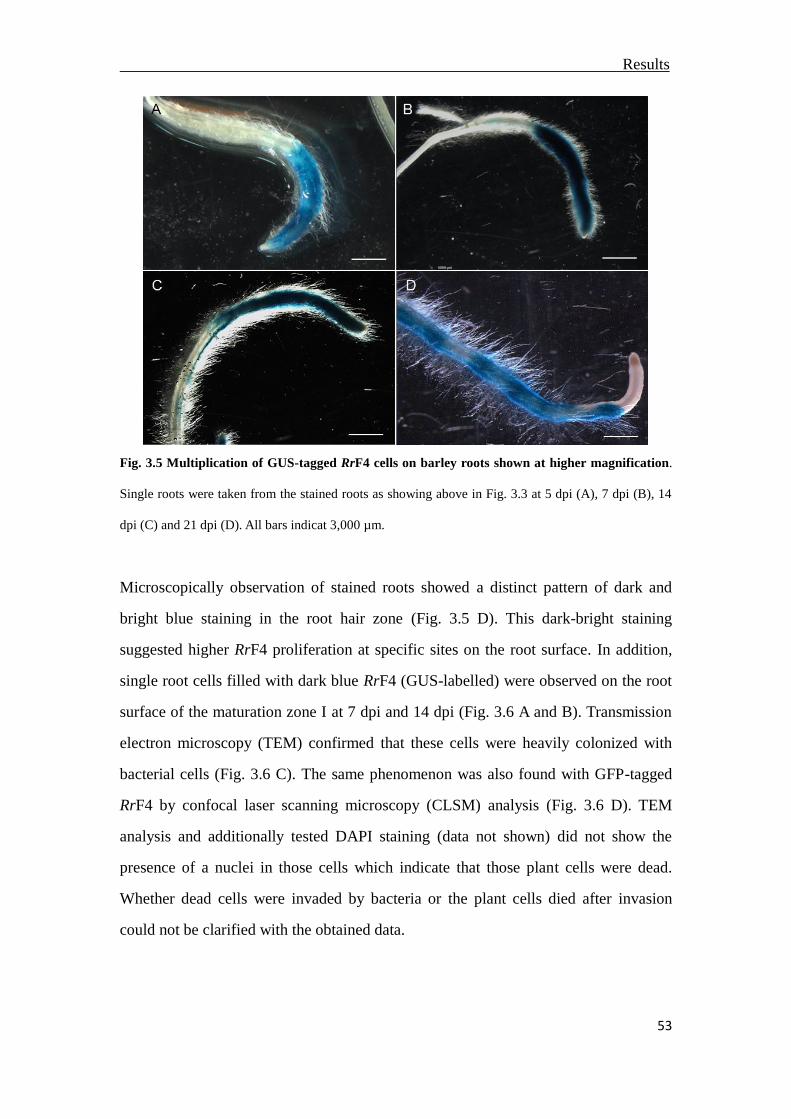
Results
53
Fig. 3.5 Multiplication of GUS-tagged RrF4 cells on barley roots shown at higher magnification.
Single roots were taken from the stained roots as showing above in Fig. 3.3 at 5 dpi (A), 7 dpi (B), 14
dpi (C) and 21 dpi (D). All bars indicat 3,000 µm.
Microscopically observation of stained roots showed a distinct pattern of dark and
bright blue staining in the root hair zone (Fig. 3.5 D). This dark-bright staining
suggested higher RrF4 proliferation at specific sites on the root surface. In addition,
single root cells filled with dark blue RrF4 (GUS-labelled) were observed on the root
surface of the maturation zone I at 7 dpi and 14 dpi (Fig. 3.6 A and B). Transmission
electron microscopy (TEM) confirmed that these cells were heavily colonized with
bacterial cells (Fig. 3.6 C). The same phenomenon was also found with GFP-tagged
RrF4 by confocal laser scanning microscopy (CLSM) analysis (Fig. 3.6 D). TEM
analysis and additionally tested DAPI staining (data not shown) did not show the
presence of a nuclei in those cells which indicate that those plant cells were dead.
Whether dead cells were invaded by bacteria or the plant cells died after invasion
could not be clarified with the obtained data.

Results
54
Fig. 3.6 Colonization of single root surface cells by RrF4. Dark blue cells on the root surface were
observed under the light microscope at 7 (A) and 14 dpi (B). Transmission electron microscopy (TEM)
scanned single root cells filled with bacteria (C). Confocal laser scanning microscopy (CLSM) showed
single root cells filled with GFP-tagged RrF4 bacterial cells (D). Arrows show the presence of bacterial
cells. (B and C were published in Glaeser et al. 2015)
3.3.2 Colonization at root junctions and lateral barley roots
Beside the colonization of primary barley roots, RrF4 cells were also found to form
conglomerates at root junctions and lateral roots at 14 and 21 dpi. Epifluorescence
microscopy using a GFP-filter showed the colonization of GFP-tagged RrF4 on the
lateral root protrusion site at 14 dpi (Fig. 3.7 A) and proliferated at the base of fresh
lateral roots at 21 dpi (Fig. 3.7 B), in a similar manner as primary roots. Root samples
colonized by GUS-tagged RrF4 cells were investigated by light microscopy, blue
bacterial cells were constantly detected at root junctions as the growth of lateral root
both at 14 and 21 dpi (Fig.3.7 C and D). At 21 dpi, the root hair zones of lateral roots
were colonized with the same pattern as in primary roots (Fig. 3.8 A and B). The
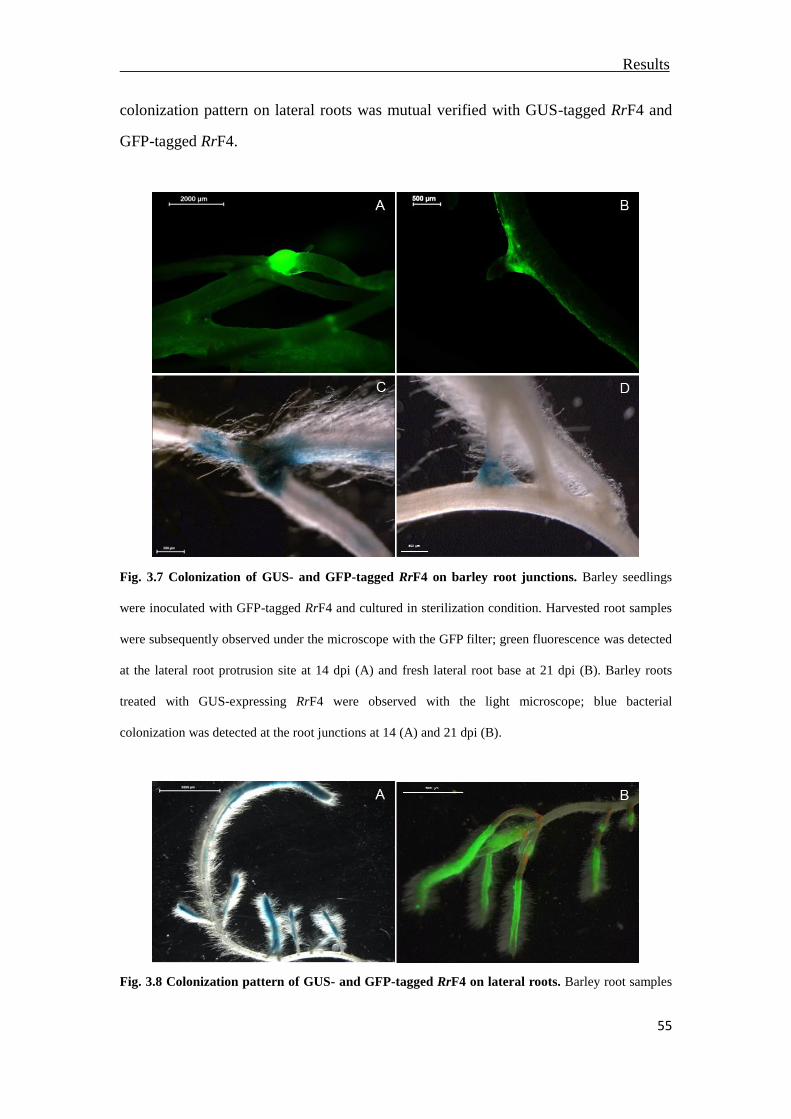
Results
55
colonization pattern on lateral roots was mutual verified with GUS-tagged RrF4 and
GFP-tagged RrF4.
Fig. 3.7 Colonization of GUS- and GFP-tagged RrF4 on barley root junctions. Barley seedlings
were inoculated with GFP-tagged RrF4 and cultured in sterilization condition. Harvested root samples
were subsequently observed under the microscope with the GFP filter; green fluorescence was detected
at the lateral root protrusion site at 14 dpi (A) and fresh lateral root base at 21 dpi (B). Barley roots
treated with GUS-expressing RrF4 were observed with the light microscope; blue bacterial
colonization was detected at the root junctions at 14 (A) and 21 dpi (B).
Fig. 3.8 Colonization pattern of GUS- and GFP-tagged RrF4 on lateral roots. Barley root samples
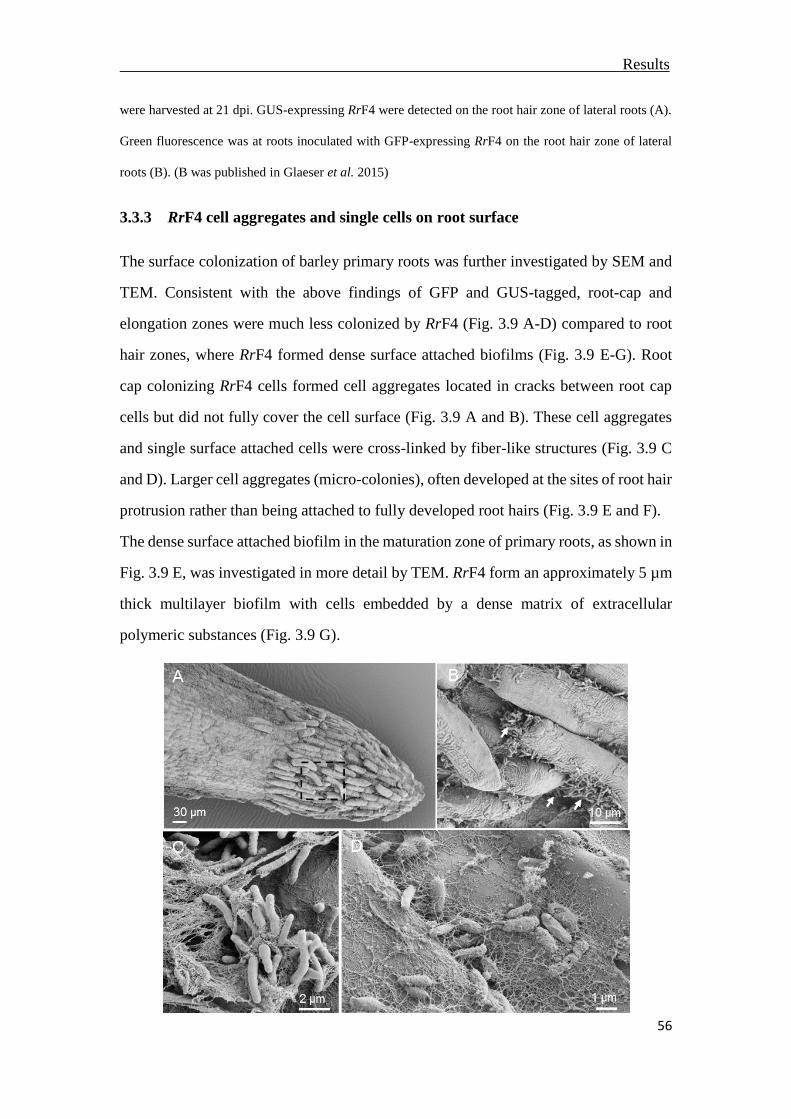
Results
56
were harvested at 21 dpi. GUS-expressing RrF4 were detected on the root hair zone of lateral roots (A).
Green fluorescence was at roots inoculated with GFP-expressing RrF4 on the root hair zone of lateral
roots (B). (B was published in Glaeser et al. 2015)
3.3.3 RrF4 cell aggregates and single cells on root surface
The surface colonization of barley primary roots was further investigated by SEM and
TEM. Consistent with the above findings of GFP and GUS-tagged, root-cap and
elongation zones were much less colonized by RrF4 (Fig. 3.9 A-D) compared to root
hair zones, where RrF4 formed dense surface attached biofilms (Fig. 3.9 E-G). Root
cap colonizing RrF4 cells formed cell aggregates located in cracks between root cap
cells but did not fully cover the cell surface (Fig. 3.9 A and B). These cell aggregates
and single surface attached cells were cross-linked by fiber-like structures (Fig. 3.9 C
and D). Larger cell aggregates (micro-colonies), often developed at the sites of root hair
protrusion rather than being attached to fully developed root hairs (Fig. 3.9 E and F).
The dense surface attached biofilm in the maturation zone of primary roots, as shown in
Fig. 3.9 E, was investigated in more detail by TEM. RrF4 form an approximately 5 µm
thick multilayer biofilm with cells embedded by a dense matrix of extracellular
polymeric substances (Fig. 3.9 G).
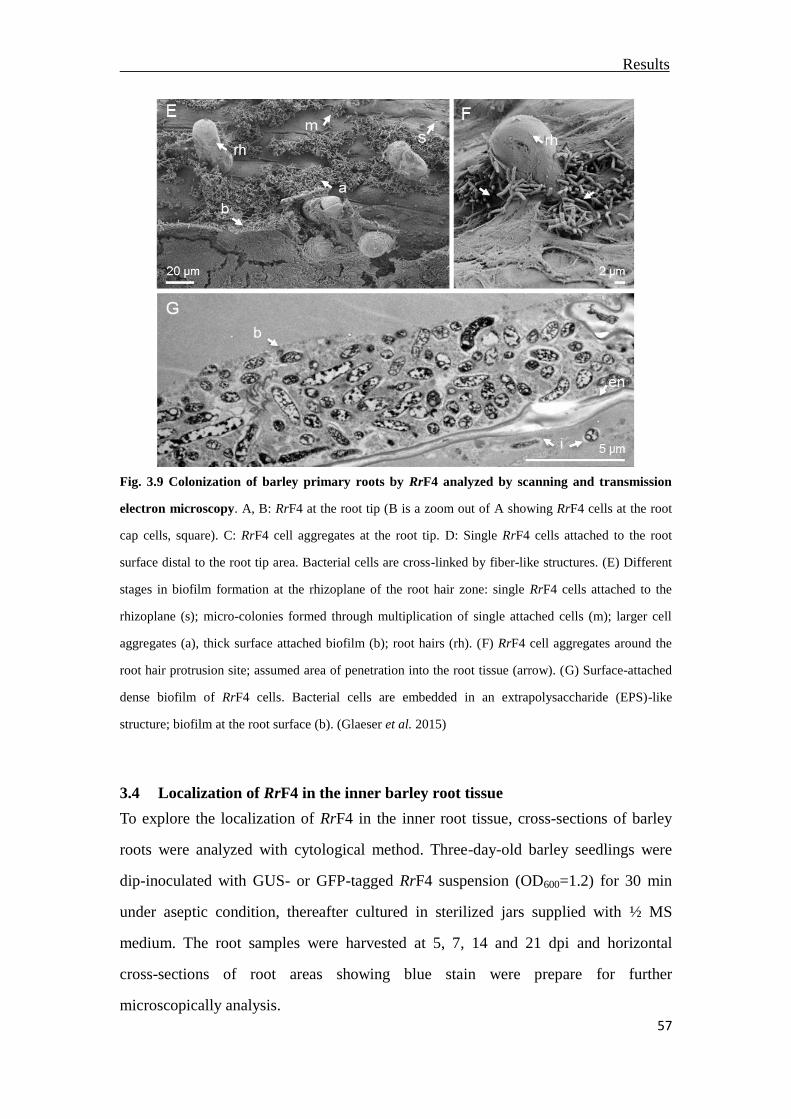
Results
57
Fig. 3.9 Colonization of barley primary roots by RrF4 analyzed by scanning and transmission
electron microscopy. A, B: RrF4 at the root tip (B is a zoom out of A showing RrF4 cells at the root
cap cells, square). C: RrF4 cell aggregates at the root tip. D: Single RrF4 cells attached to the root
surface distal to the root tip area. Bacterial cells are cross-linked by fiber-like structures. (E) Different
stages in biofilm formation at the rhizoplane of the root hair zone: single RrF4 cells attached to the
rhizoplane (s); micro-colonies formed through multiplication of single attached cells (m); larger cell
aggregates (a), thick surface attached biofilm (b); root hairs (rh). (F) RrF4 cell aggregates around the
root hair protrusion site; assumed area of penetration into the root tissue (arrow). (G) Surface-attached
dense biofilm of RrF4 cells. Bacterial cells are embedded in an extrapolysaccharide (EPS)-like
structure; biofilm at the root surface (b). (Glaeser et al. 2015)
3.4 Localization of RrF4 in the inner barley root tissue
To explore the localization of RrF4 in the inner root tissue, cross-sections of barley
roots were analyzed with cytological method. Three-day-old barley seedlings were
dip-inoculated with GUS- or GFP-tagged RrF4 suspension (OD600=1.2) for 30 min
under aseptic condition, thereafter cultured in sterilized jars supplied with ½ MS
medium. The root samples were harvested at 5, 7, 14 and 21 dpi and horizontal
cross-sections of root areas showing blue stain were prepare for further
microscopically analysis.
Results
58
Cross-section of barley roots colonized by GUS-tagged RrF4 was analyzed by
microscopy (Fig. 3.10 A). At 5 dpi, blue GUS staining was showing on the root
surface, around the root hairs and the rhizodermis (Fig. 3.10 B). At 7 dpi, the blue
staining extended to the rhizodermis, exodermis and cortical tissues, which indicated
the invasion of GUS-tagged RrF4 cells into the root cortex (Fig. 3.10 C). Later (21 dpi)
blue staining also was seen in the endodermis (Fig. 3.10 D). At higher magnification
(1,000 fold), it was clearly shown that the endodermal cells were surrounded by blue
bacteria (Fig. 3.10 E). To test whether the bacteria moved to upper plant parts the
shoots of the barely seedlings were examined by microscopy after incubation with
substrate X-Gluc. No blue stained bacterial cells were detected in the stem, leaf or leaf
sheath (Supplement Fig. 7.2). Consistent with this, PCR amplification of RrF4
specific ITS targets with DNA extracted from the shoot part of barley was also
negative. Re-isolation of RrF4 from leave tissue was also not successful.
The colonization pattern of RrF4 in the inner barley root tissue was confirmed with
GFP-tagged RrF4 (Fig. 3.11). Green fluorescence RrF4 cells were consistently
detected on the root hair and in the rhizodermis, exodermis and cortex layers. At 21
dpi, RrF4 cells were detected in cell junctions of endodermal cells and in the central
cylinder. Inside the central cylinder, bacteria were also seen in the intercellular spaces
while intracellular colonization was not detectable.

Results
59
Fig. 3.10 Light microscopy of barley primary root cross-sections. The localization of RrF4 in the
root hair zone and inner root tissue was analyzed after inoculation with GUS-tagged RrF4. A: overview
of root cross-section at 5 dpi (root hairs were destroyed during the sonication and fixation steps in
sample preparation). B: zoom out of Fig. A showing blue RrF4 cells on the root surface and root hair. C:
blue strained bacteria in the different layers of the root tissue at 7 dpi (rhizodermis, exodermis and
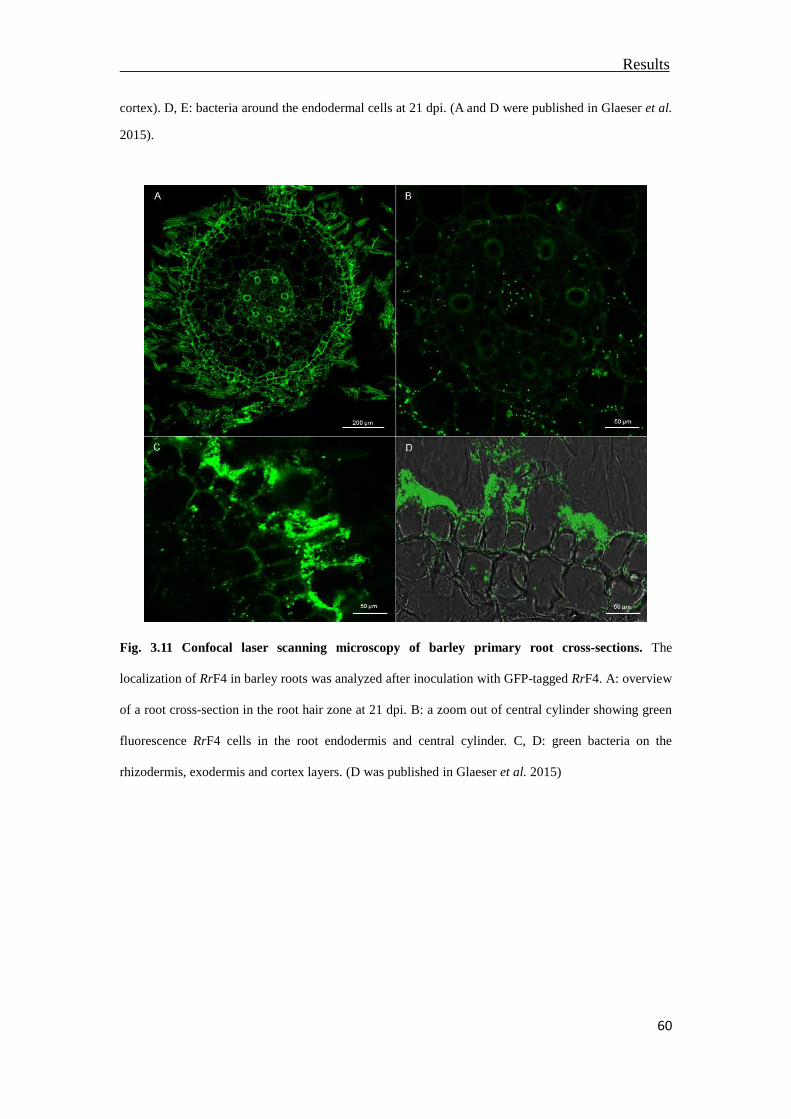
Results
60
cortex). D, E: bacteria around the endodermal cells at 21 dpi. (A and D were published in Glaeser et al.
2015).
Fig. 3.11 Confocal laser scanning microscopy of barley primary root cross-sections. The
localization of RrF4 in barley roots was analyzed after inoculation with GFP-tagged RrF4. A: overview
of a root cross-section in the root hair zone at 21 dpi. B: a zoom out of central cylinder showing green
fluorescence RrF4 cells in the root endodermis and central cylinder. C, D: green bacteria on the
rhizodermis, exodermis and cortex layers. (D was published in Glaeser et al. 2015)
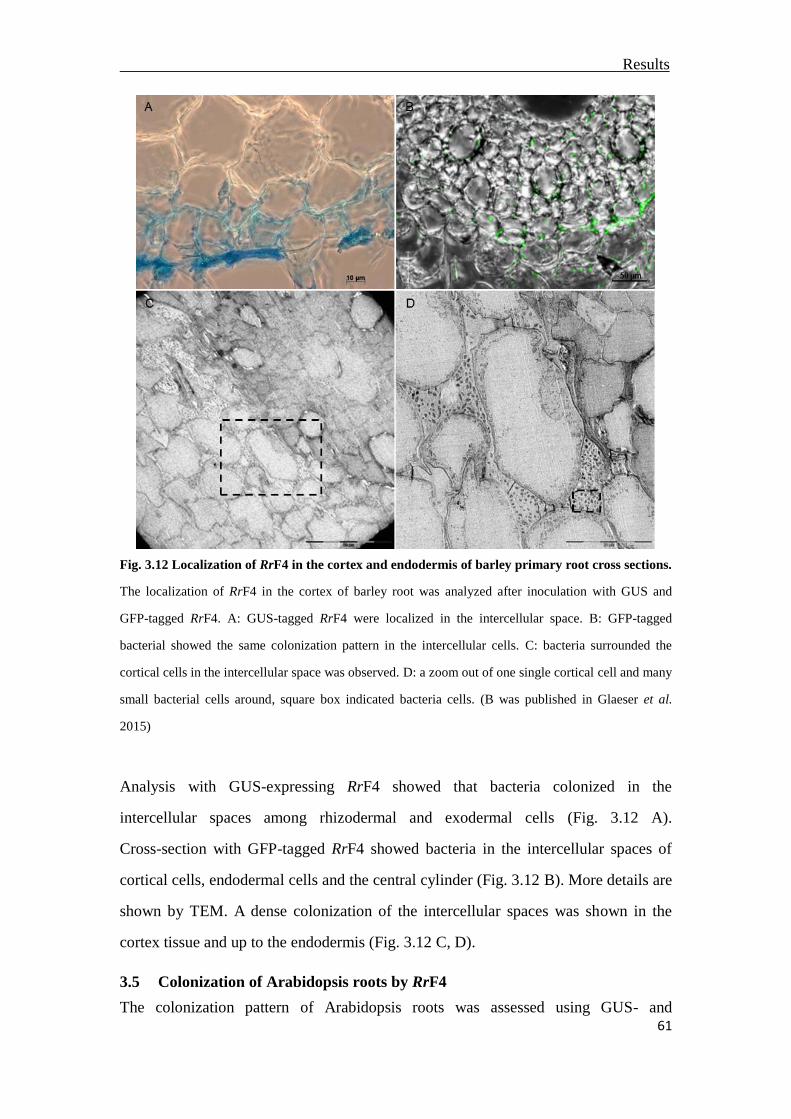
Results
61
Fig. 3.12 Localization of RrF4 in the cortex and endodermis of barley primary root cross sections.
The localization of RrF4 in the cortex of barley root was analyzed after inoculation with GUS and
GFP-tagged RrF4. A: GUS-tagged RrF4 were localized in the intercellular space. B: GFP-tagged
bacterial showed the same colonization pattern in the intercellular cells. C: bacteria surrounded the
cortical cells in the intercellular space was observed. D: a zoom out of one single cortical cell and many
small bacterial cells around, square box indicated bacteria cells. (B was published in Glaeser et al.
2015)
Analysis with GUS-expressing RrF4 showed that bacteria colonized in the
intercellular spaces among rhizodermal and exodermal cells (Fig. 3.12 A).
Cross-section with GFP-tagged RrF4 showed bacteria in the intercellular spaces of
cortical cells, endodermal cells and the central cylinder (Fig. 3.12 B). More details are
shown by TEM. A dense colonization of the intercellular spaces was shown in the
cortex tissue and up to the endodermis (Fig. 3.12 C, D).
3.5 Colonization of Arabidopsis roots by RrF4
The colonization pattern of Arabidopsis roots was assessed using GUS- and
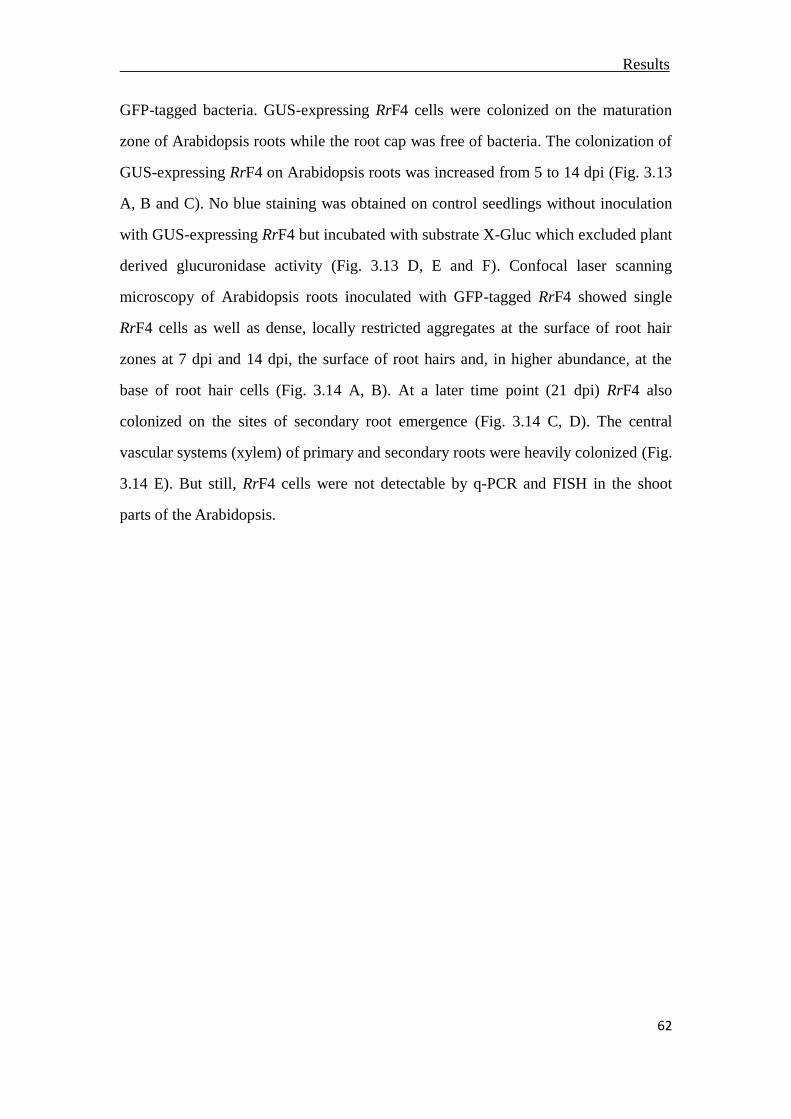
Results
62
GFP-tagged bacteria. GUS-expressing RrF4 cells were colonized on the maturation
zone of Arabidopsis roots while the root cap was free of bacteria. The colonization of
GUS-expressing RrF4 on Arabidopsis roots was increased from 5 to 14 dpi (Fig. 3.13
A, B and C). No blue staining was obtained on control seedlings without inoculation
with GUS-expressing RrF4 but incubated with substrate X-Gluc which excluded plant
derived glucuronidase activity (Fig. 3.13 D, E and F). Confocal laser scanning
microscopy of Arabidopsis roots inoculated with GFP-tagged RrF4 showed single
RrF4 cells as well as dense, locally restricted aggregates at the surface of root hair
zones at 7 dpi and 14 dpi, the surface of root hairs and, in higher abundance, at the
base of root hair cells (Fig. 3.14 A, B). At a later time point (21 dpi) RrF4 also
colonized on the sites of secondary root emergence (Fig. 3.14 C, D). The central
vascular systems (xylem) of primary and secondary roots were heavily colonized (Fig.
3.14 E). But still, RrF4 cells were not detectable by q-PCR and FISH in the shoot
parts of the Arabidopsis.
Results
63
Fig. 3.13 The colonization pattern of GUS-tagged RrF4 on Arabidopsis thaliana. A, B, C: the root
hair zone of Arabidopsis inoculated with GUS-tagged RrF4 became blue after incubated with the
substrate X-Gluc at 5, 7 and 14 dpi, while the Arabidopsis seedlings control (D, E, F) without
GUS-tagged RrF4 treatment, showed no blue coloration after incubation with X-Gluc. (A, B and C
were published in Glaeser et al. 2015)
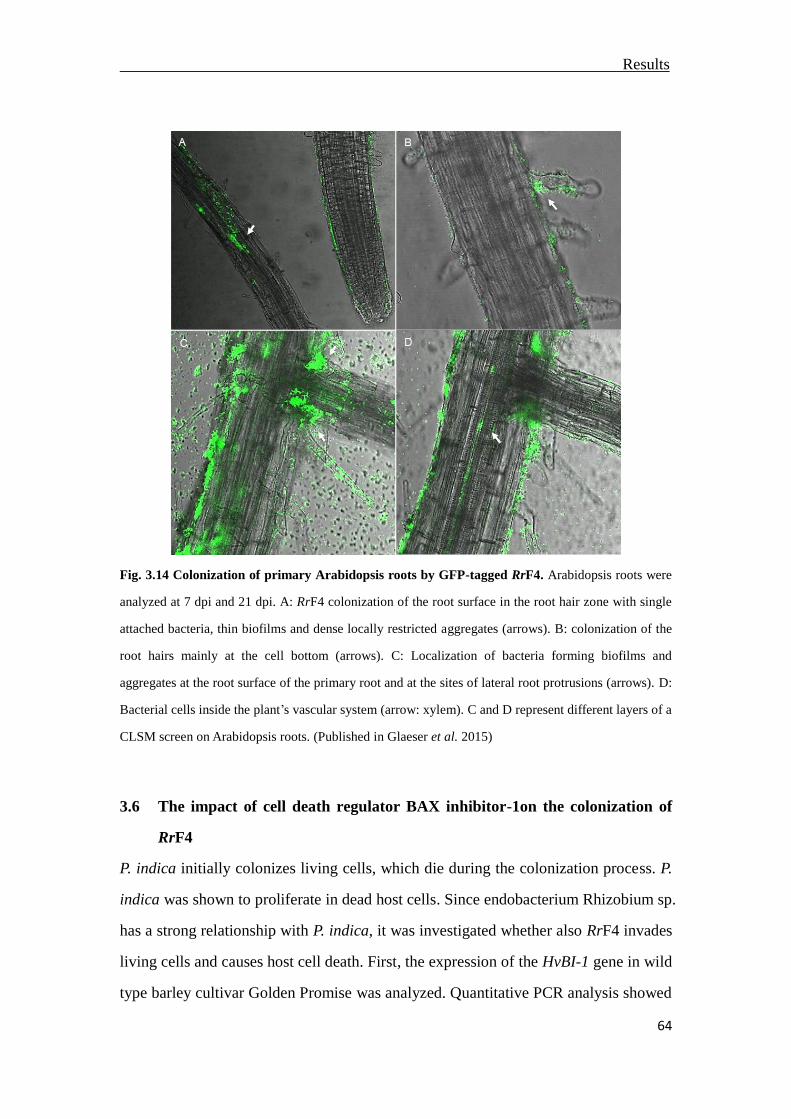
Results
64
Fig. 3.14 Colonization of primary Arabidopsis roots by GFP-tagged RrF4. Arabidopsis roots were
analyzed at 7 dpi and 21 dpi. A: RrF4 colonization of the root surface in the root hair zone with single
attached bacteria, thin biofilms and dense locally restricted aggregates (arrows). B: colonization of the
root hairs mainly at the cell bottom (arrows). C: Localization of bacteria forming biofilms and
aggregates at the root surface of the primary root and at the sites of lateral root protrusions (arrows). D:
Bacterial cells inside the plant’s vascular system (arrow: xylem). C and D represent different layers of a
CLSM screen on Arabidopsis roots. (Published in Glaeser et al. 2015)
3.6 The impact of cell death regulator BAX inhibitor-1on the colonization of
RrF4
P. indica initially colonizes living cells, which die during the colonization process. P.
indica was shown to proliferate in dead host cells. Since endobacterium Rhizobium sp.
has a strong relationship with P. indica, it was investigated whether also RrF4 invades
living cells and causes host cell death. First, the expression of the HvBI-1 gene in wild
type barley cultivar Golden Promise was analyzed. Quantitative PCR analysis showed
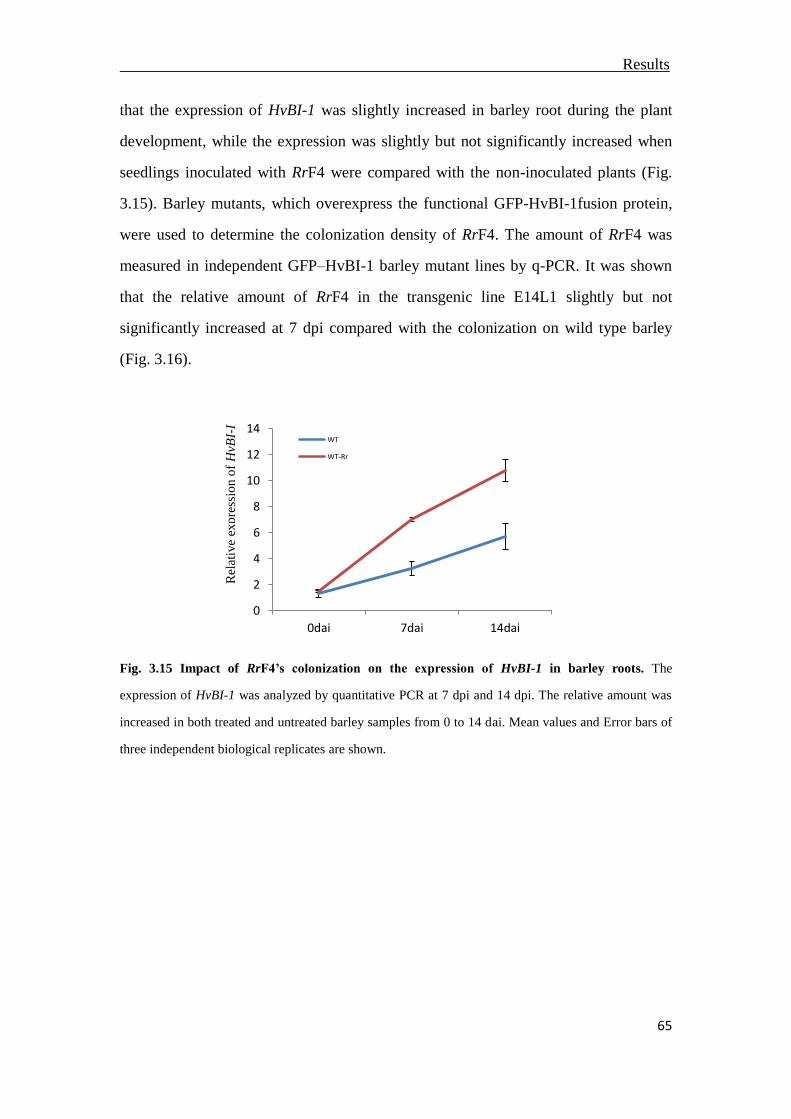
Results
65
that the expression of HvBI-1 was slightly increased in barley root during the plant
development, while the expression was slightly but not significantly increased when
seedlings inoculated with RrF4 were compared with the non-inoculated plants (Fig.
3.15). Barley mutants, which overexpress the functional GFP-HvBI-1fusion protein,
were used to determine the colonization density of RrF4. The amount of RrF4 was
measured in independent GFP–HvBI-1 barley mutant lines by q-PCR. It was shown
that the relative amount of RrF4 in the transgenic line E14L1 slightly but not
significantly increased at 7 dpi compared with the colonization on wild type barley
(Fig. 3.16).
Fig. 3.15 Impact of RrF4’s colonization on the expression of HvBI-1 in barley roots. The
expression of HvBI-1 was analyzed by quantitative PCR at 7 dpi and 14 dpi. The relative amount was
increased in both treated and untreated barley samples from 0 to 14 dai. Mean values and Error bars of
three independent biological replicates are shown.
0
2
4
6
8
10
12
14
0dai 7dai 14dai
WT
WT-Rr
Rel
ativ
e ex
pre
ssio
n o
f H
vBI-
I
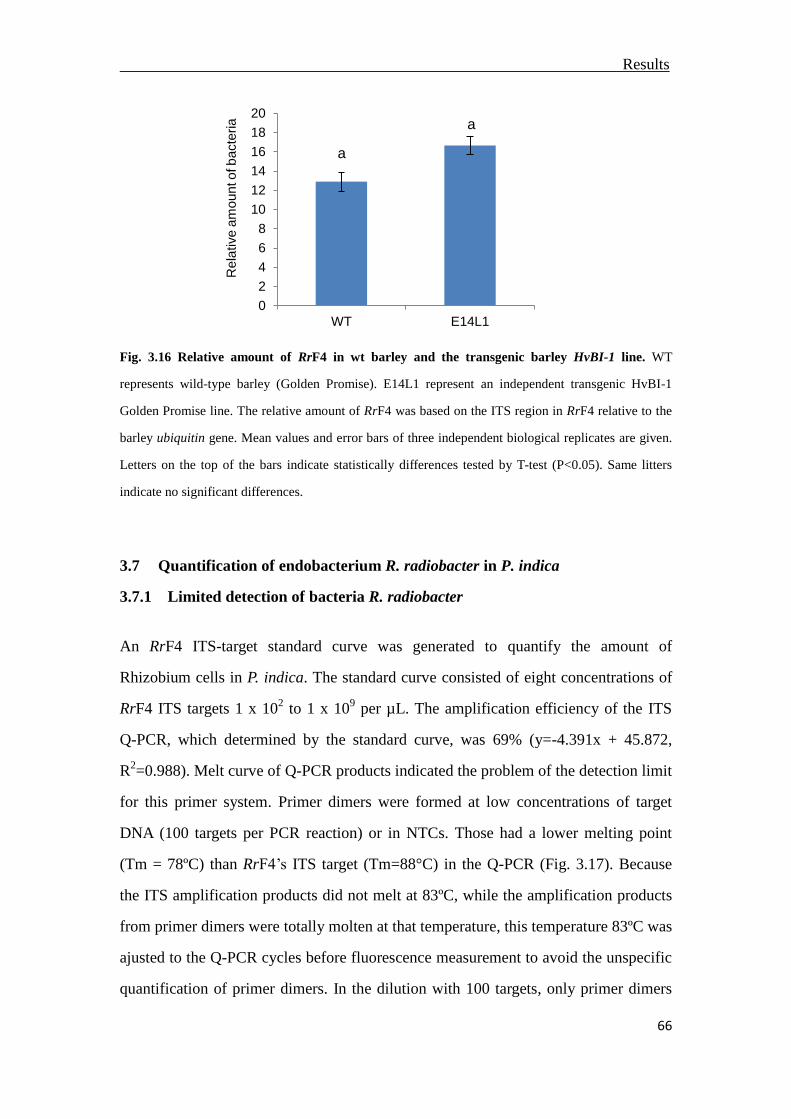
Results
66
Fig. 3.16 Relative amount of RrF4 in wt barley and the transgenic barley HvBI-1 line. WT
represents wild-type barley (Golden Promise). E14L1 represent an independent transgenic HvBI-1
Golden Promise line. The relative amount of RrF4 was based on the ITS region in RrF4 relative to the
barley ubiquitin gene. Mean values and error bars of three independent biological replicates are given.
Letters on the top of the bars indicate statistically differences tested by T-test (P<0.05). Same litters
indicate no significant differences.
3.7 Quantification of endobacterium R. radiobacter in P. indica
3.7.1 Limited detection of bacteria R. radiobacter
An RrF4 ITS-target standard curve was generated to quantify the amount of
Rhizobium cells in P. indica. The standard curve consisted of eight concentrations of
RrF4 ITS targets 1 x 10² to 1 x 10
9 per µL. The amplification efficiency of the ITS
Q-PCR, which determined by the standard curve, was 69% (y=-4.391x + 45.872,
R2=0.988). Melt curve of Q-PCR products indicated the problem of the detection limit
for this primer system. Primer dimers were formed at low concentrations of target
DNA (100 targets per PCR reaction) or in NTCs. Those had a lower melting point
(Tm = 78ºC) than RrF4’s ITS target (Tm=88°C) in the Q-PCR (Fig. 3.17). Because
the ITS amplification products did not melt at 83ºC, while the amplification products
from primer dimers were totally molten at that temperature, this temperature 83ºC was
ajusted to the Q-PCR cycles before fluorescence measurement to avoid the unspecific
quantification of primer dimers. In the dilution with 100 targets, only primer dimers
0
2
4
6
8
10
12
14
16
18
20
WT E14L1
a
a
Rela
tive
am
ount of b
acte
ria
DN
A
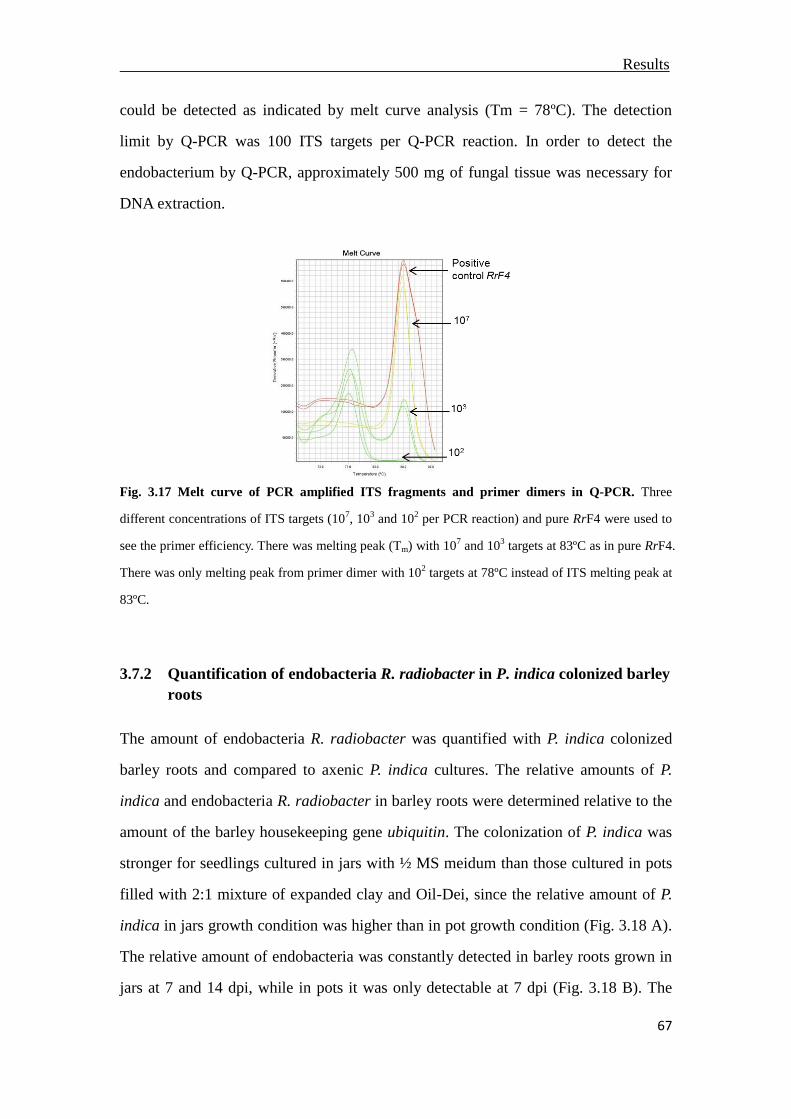
Results
67
could be detected as indicated by melt curve analysis (Tm = 78ºC). The detection
limit by Q-PCR was 100 ITS targets per Q-PCR reaction. In order to detect the
endobacterium by Q-PCR, approximately 500 mg of fungal tissue was necessary for
DNA extraction.
Fig. 3.17 Melt curve of PCR amplified ITS fragments and primer dimers in Q-PCR. Three
different concentrations of ITS targets (107, 10
3 and 10
2 per PCR reaction) and pure RrF4 were used to
see the primer efficiency. There was melting peak (Tm) with 107 and 10
3 targets at 83ºC as in pure RrF4.
There was only melting peak from primer dimer with 102 targets at 78ºC instead of ITS melting peak at
83ºC.
3.7.2 Quantification of endobacteria R. radiobacter in P. indica colonized barley
roots
The amount of endobacteria R. radiobacter was quantified with P. indica colonized
barley roots and compared to axenic P. indica cultures. The relative amounts of P.
indica and endobacteria R. radiobacter in barley roots were determined relative to the
amount of the barley housekeeping gene ubiquitin. The colonization of P. indica was
stronger for seedlings cultured in jars with ½ MS meidum than those cultured in pots
filled with 2:1 mixture of expanded clay and Oil-Dei, since the relative amount of P.
indica in jars growth condition was higher than in pot growth condition (Fig. 3.18 A).
The relative amount of endobacteria was constantly detected in barley roots grown in
jars at 7 and 14 dpi, while in pots it was only detectable at 7 dpi (Fig. 3.18 B). The
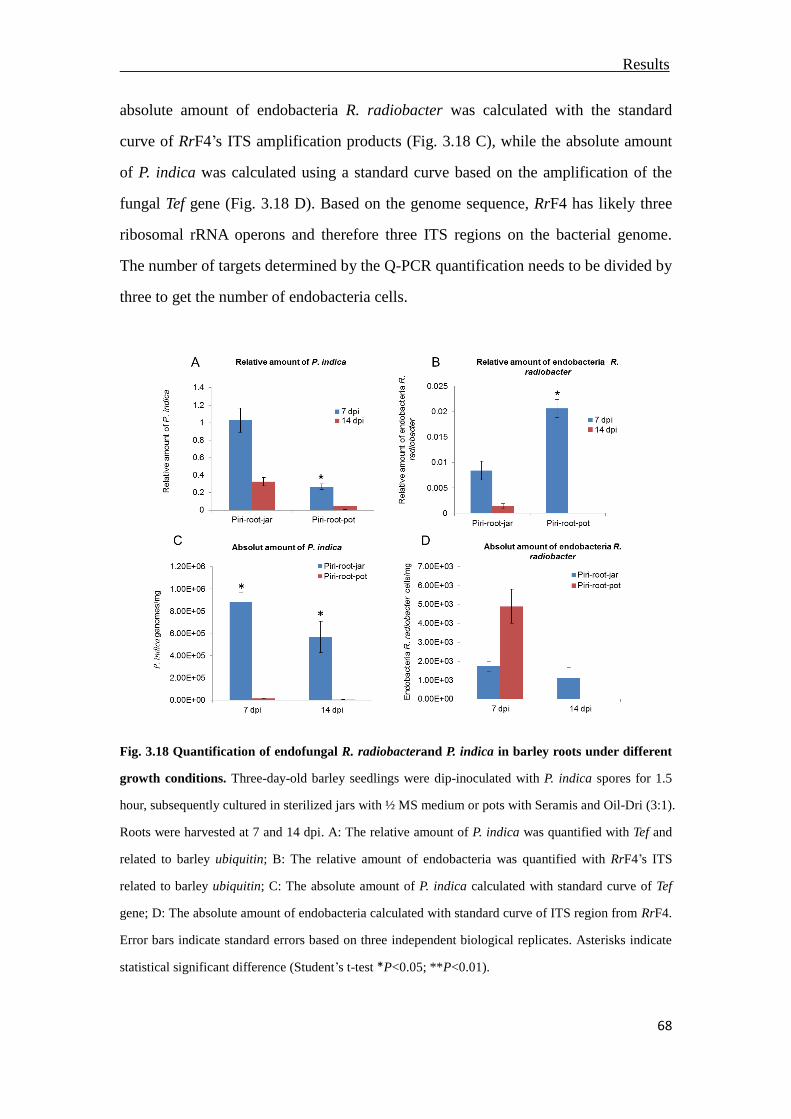
Results
68
absolute amount of endobacteria R. radiobacter was calculated with the standard
curve of RrF4’s ITS amplification products (Fig. 3.18 C), while the absolute amount
of P. indica was calculated using a standard curve based on the amplification of the
fungal Tef gene (Fig. 3.18 D). Based on the genome sequence, RrF4 has likely three
ribosomal rRNA operons and therefore three ITS regions on the bacterial genome.
The number of targets determined by the Q-PCR quantification needs to be divided by
three to get the number of endobacteria cells.
Fig. 3.18 Quantification of endofungal R. radiobacterand P. indica in barley roots under different
growth conditions. Three-day-old barley seedlings were dip-inoculated with P. indica spores for 1.5
hour, subsequently cultured in sterilized jars with ½ MS medium or pots with Seramis and Oil-Dri (3:1).
Roots were harvested at 7 and 14 dpi. A: The relative amount of P. indica was quantified with Tef and
related to barley ubiquitin; B: The relative amount of endobacteria was quantified with RrF4’s ITS
related to barley ubiquitin; C: The absolute amount of P. indica calculated with standard curve of Tef
gene; D: The absolute amount of endobacteria calculated with standard curve of ITS region from RrF4.
Error bars indicate standard errors based on three independent biological replicates. Asterisks indicate
statistical significant difference (Student’s t-test *P<0.05; **P<0.01).
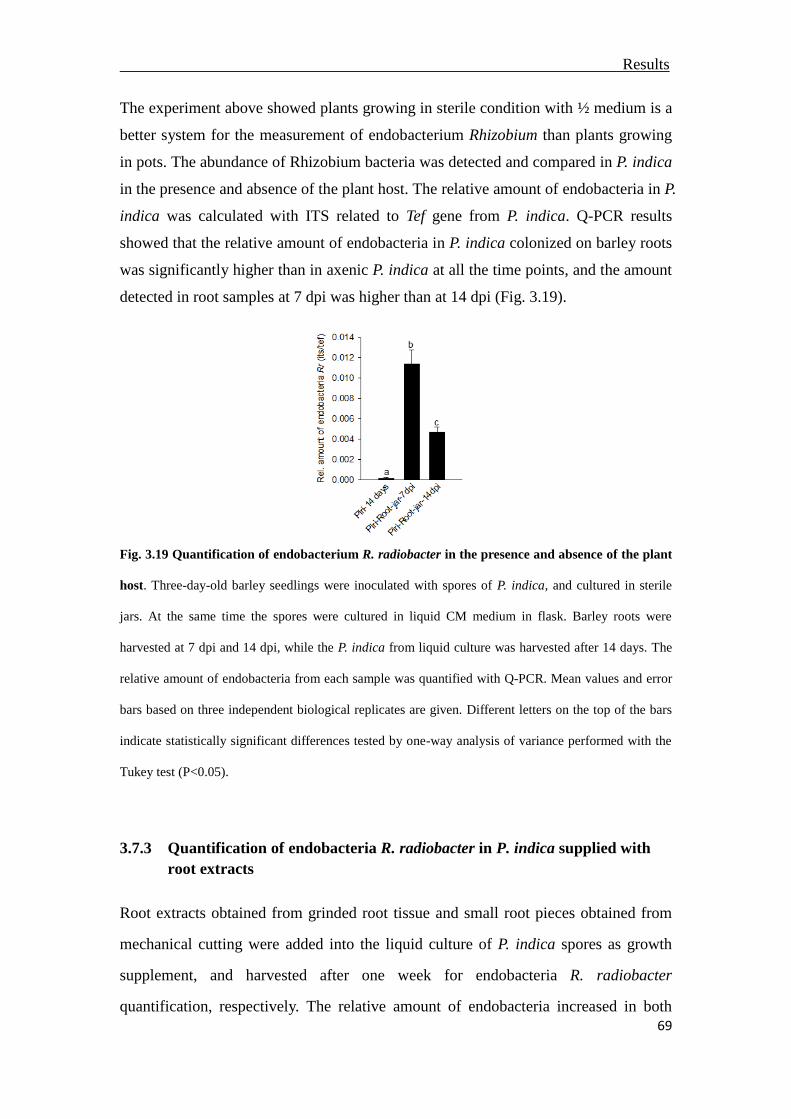
Results
69
The experiment above showed plants growing in sterile condition with ½ medium is a
better system for the measurement of endobacterium Rhizobium than plants growing
in pots. The abundance of Rhizobium bacteria was detected and compared in P. indica
in the presence and absence of the plant host. The relative amount of endobacteria in P.
indica was calculated with ITS related to Tef gene from P. indica. Q-PCR results
showed that the relative amount of endobacteria in P. indica colonized on barley roots
was significantly higher than in axenic P. indica at all the time points, and the amount
detected in root samples at 7 dpi was higher than at 14 dpi (Fig. 3.19).
Fig. 3.19 Quantification of endobacterium R. radiobacter in the presence and absence of the plant
host. Three-day-old barley seedlings were inoculated with spores of P. indica, and cultured in sterile
jars. At the same time the spores were cultured in liquid CM medium in flask. Barley roots were
harvested at 7 dpi and 14 dpi, while the P. indica from liquid culture was harvested after 14 days. The
relative amount of endobacteria from each sample was quantified with Q-PCR. Mean values and error
bars based on three independent biological replicates are given. Different letters on the top of the bars
indicate statistically significant differences tested by one-way analysis of variance performed with the
Tukey test (P<0.05).
3.7.3 Quantification of endobacteria R. radiobacter in P. indica supplied with
root extracts
Root extracts obtained from grinded root tissue and small root pieces obtained from
mechanical cutting were added into the liquid culture of P. indica spores as growth
supplement, and harvested after one week for endobacteria R. radiobacter
quantification, respectively. The relative amount of endobacteria increased in both
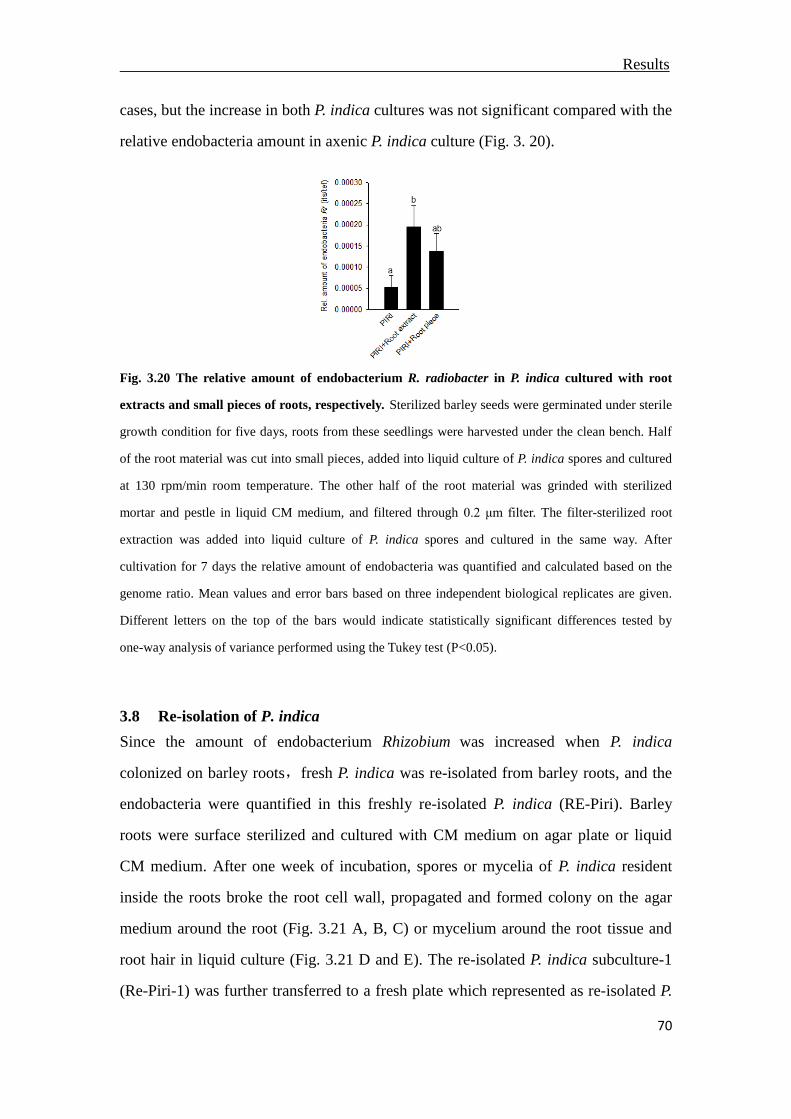
Results
70
cases, but the increase in both P. indica cultures was not significant compared with the
relative endobacteria amount in axenic P. indica culture (Fig. 3. 20).
Fig. 3.20 The relative amount of endobacterium R. radiobacter in P. indica cultured with root
extracts and small pieces of roots, respectively. Sterilized barley seeds were germinated under sterile
growth condition for five days, roots from these seedlings were harvested under the clean bench. Half
of the root material was cut into small pieces, added into liquid culture of P. indica spores and cultured
at 130 rpm/min room temperature. The other half of the root material was grinded with sterilized
mortar and pestle in liquid CM medium, and filtered through 0.2 μm filter. The filter-sterilized root
extraction was added into liquid culture of P. indica spores and cultured in the same way. After
cultivation for 7 days the relative amount of endobacteria was quantified and calculated based on the
genome ratio. Mean values and error bars based on three independent biological replicates are given.
Different letters on the top of the bars would indicate statistically significant differences tested by
one-way analysis of variance performed using the Tukey test (P<0.05).
3.8 Re-isolation of P. indica
Since the amount of endobacterium Rhizobium was increased when P. indica
colonized on barley roots,fresh P. indica was re-isolated from barley roots, and the
endobacteria were quantified in this freshly re-isolated P. indica (RE-Piri). Barley
roots were surface sterilized and cultured with CM medium on agar plate or liquid
CM medium. After one week of incubation, spores or mycelia of P. indica resident
inside the roots broke the root cell wall, propagated and formed colony on the agar
medium around the root (Fig. 3.21 A, B, C) or mycelium around the root tissue and
root hair in liquid culture (Fig. 3.21 D and E). The re-isolated P. indica subculture-1
(Re-Piri-1) was further transferred to a fresh plate which represented as re-isolated P.

Results
71
indica subculture-2 (Re-Piri-2) (Fig. 3.21 F). The biomass from Re-Piri-1 and
Re-Piri-2 were taken from the plates and used for DNA extraction with
Macherey-nagel kit. The amount of endobacteria was quantified and compared with
long-term lab cultured P. indica (LL-Piri) by Q-PCR. Higher amount of endobacteria
were detected in RE-Piri and decreased again after sub-cultivation on agar plates. As
shown in Fig. 3.22, the relative amount of endobacteria was significantly increased in
Re-Piri-1 compared to axenic LL-Piri culture. The amount of endobacteria was
significantly higher in Re-Piri-1 than in Re-Piri-2.
Fig. 3.21 Re-isolation of P. indica from barley roots. Barley seedlings were inoculated with P. indica
and cultured on ½ MS agar in sterile jars for two weeks. The inoculated roots were surface sterilized
(washed with 70% ethonal for 1 min and 3% NaClO for 5 min), cut into small pieces and cultured on
CM solid and liquid medium. After two weeks, P. indica colonies were formed around root pieces
which was recorded as re-isolated-P. indica-1 (Re-Piri-1) (A, B, C, D and E). The Re-Piri-1 was
sub-cultured on CM agar plate as re-isolated-P. indica-2 (Re-Piri-2) (F).
Fig. 3.22 Quantification of endobacterium R. radiobacter in RE-Piri (Re-Piri-1 and Re-Piri-2)

Results
72
compared to LL-Piri. The relative amount of endofungal bacteria was quantified with ITS targets of
RrF4 related to Tef gene of P. indica. Three-week-old cultures were used for quantification. The relative
amount of endobacteria was quantified in Re-Piri-1, Re-Piri-2 and compared with LL-Piri. Mean
values and standard errors based on three independent biological replicates. Different letters on the top
of the bars would indicate statistically significant differences tested by one-way analysis of variance
performed using the Tukey test (P<0.05).
3.9 Invasion of free living RrF4 into P. indica was not observed
Pure culture of GFP-tagged RrF4 cells were co-cultured with P. indica to test if RrF4
can invade the fungal host where it was originally isolated from. Spores of P. indica
were cultured in liquid CM medium and germinated for three days. Subsequently
different concentrations of GFP-tagged RrF4 cells were added to the P. indica culture.
The co-culture was observed under the fluorescence microscopy after cultivation for
one day, two days and three days. Many GFP-tagged RrF4 cells were sticking at the
surface of hyphae especially at the tips (Fig. 3.23A) and on chlamydospores (Fig.
3.23B), but green fluorescent RrF4 cells were not detected within hyphae or spores
(Fig. 3.23). In order to introduce RrF4 into the fungal host, protoplasts of P. indica
were generated to merge with protoplast of GFP-tagged RrF4, but it was still not
successful to bring RrF4 back to fungus host (data not showed).
Fig. 3.23 GFP-tagged RrF4 sticking around the hyphae (A) and chlamydospores (B) of P. indica.
Chlamydospores were collected from three-week-old P. indica cultures on agar plates, and cultured for
three-day in CM medium to germinate. Overnight cultured GFP-tagged RrF4 bacteria were collected,
re-suspended and added to the P. indica culture with final bacterial concentrations of OD600=0.1, 0.01
and 0.001. The co-culture was observed under the fluorescence microscopy after one day, two days and
Results
73
three days. Figure A and B showed the fluorescence microscopic analysis after one day co-culture. A:
The GFP-tagged RrF4 stacking around the hyphae. B: the GFP-tagged RrF4 surrounding the spores.
The square box showed GFP-tagged RrF4 around the tip of hyphae.
3.10 Curing P. indica through antibiotics treatments and single protoplast
cultivation
The biological activity and functional mechanism of RrF4 were exploited because of
the successful isolation of the endobacterium Rhizobium radiobacter. It has not been
possible to cure P. indica so far, therefore further trials were performed here to further
expose the connection among the endobacterium, the fungus P. indica and the plant
host. Treatments with antibiotics are often used to kill endofungal bacteria and to
obtain a cured fungus (Partida-Martinez and Hertweck 2005). We decided to carry out
our experiment bythis method as well. In order to avoid that the fungal cell wall
prohibits the entrance of antibiotic into the fungal cells, protoplasts of P. indica were
used for the antibiotic treatments. CM medium containing 300 μg/mL spectinomycin
and 300 μg/mL ciprofloxacin were testified to be very efficient on killing RrF4 cells
grown as pure culture. Therefore those concentrations were used in this experiment.
Five-day-old single fungal colonies that were derived from single protoplasts were
transferred to a new culture plate. No differences were obtained between antibiotic
treated and untreated P. indica cultures at the beginning of the cultivation, but after
three generations, the germination of P. indica was obviously delayed when the
protoplasts cultured on the round petri dish with medium containing antibiotics (Fig.
3.24 A, B). Light microscopical imaging showed that the fungal colonies on medium
with antibiotics were smaller than the colonies on medium without antibiotics. The
single colony was picked up and cultured on new agar media, the diameter of the
colony without antibiotic treatment was approximately 6 cm, while the diameter of
the colony on antibiotic containing medium had a size of only 3 cm (Fig. 3.24 C, D).
During the experiment, no apparent morphology change was obtained on the hyphae
of P. indica, but the number of spores formed by P. indica with antibiotic treatment
was significantly reduced (Fig. 3.24 E, F). With q-PCR analysis, endobacteria could
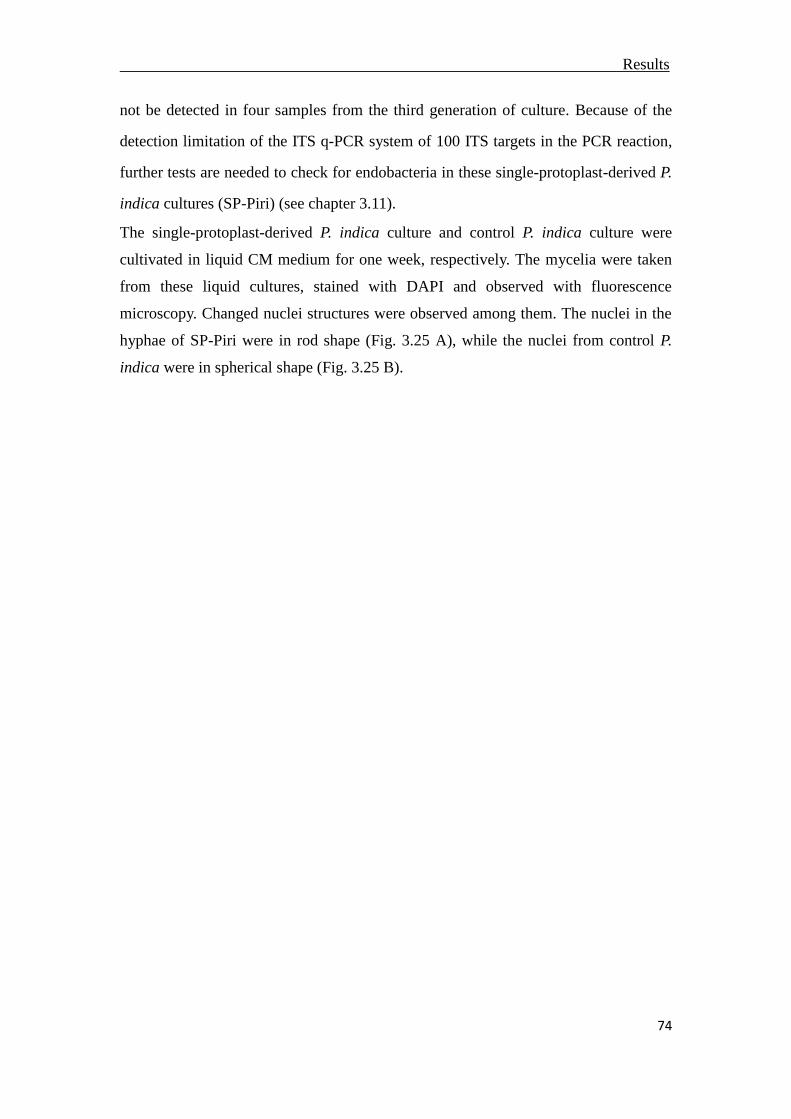
Results
74
not be detected in four samples from the third generation of culture. Because of the
detection limitation of the ITS q-PCR system of 100 ITS targets in the PCR reaction,
further tests are needed to check for endobacteria in these single-protoplast-derived P.
indica cultures (SP-Piri) (see chapter 3.11).
The single-protoplast-derived P. indica culture and control P. indica culture were
cultivated in liquid CM medium for one week, respectively. The mycelia were taken
from these liquid cultures, stained with DAPI and observed with fluorescence
microscopy. Changed nuclei structures were observed among them. The nuclei in the
hyphae of SP-Piri were in rod shape (Fig. 3.25 A), while the nuclei from control P.
indica were in spherical shape (Fig. 3.25 B).
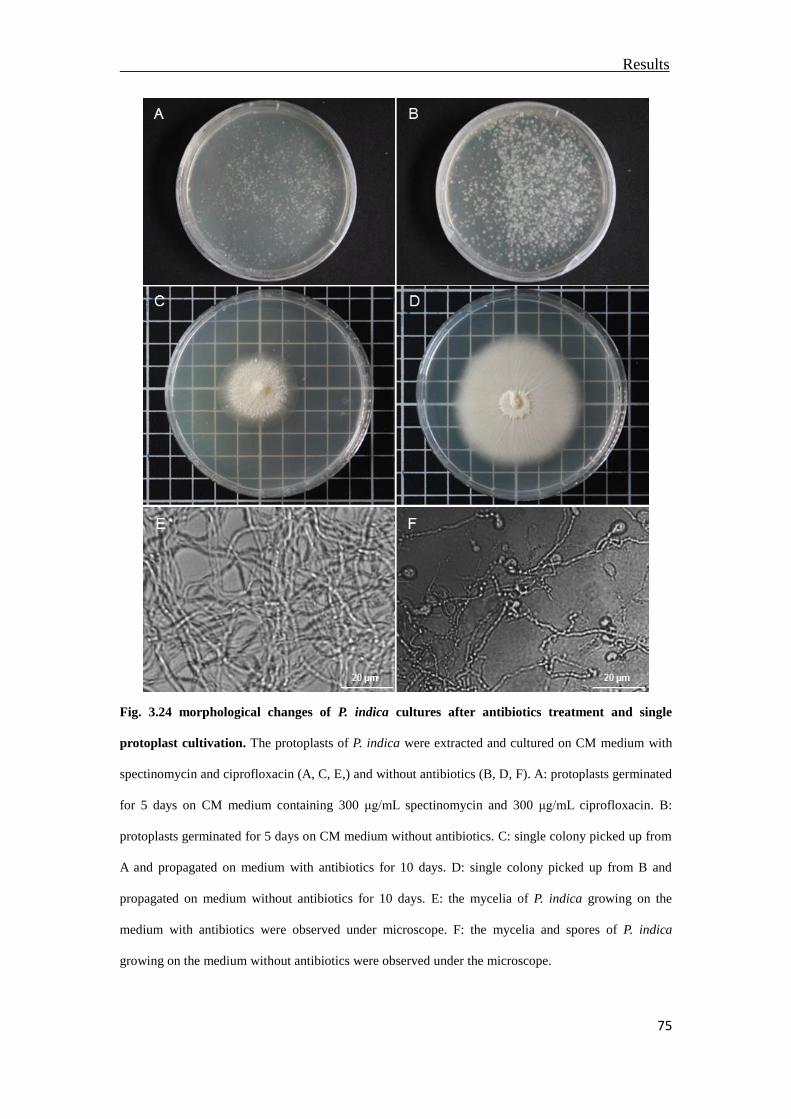
Results
75
Fig. 3.24 morphological changes of P. indica cultures after antibiotics treatment and single
protoplast cultivation. The protoplasts of P. indica were extracted and cultured on CM medium with
spectinomycin and ciprofloxacin (A, C, E,) and without antibiotics (B, D, F). A: protoplasts germinated
for 5 days on CM medium containing 300 μg/mL spectinomycin and 300 μg/mL ciprofloxacin. B:
protoplasts germinated for 5 days on CM medium without antibiotics. C: single colony picked up from
A and propagated on medium with antibiotics for 10 days. D: single colony picked up from B and
propagated on medium without antibiotics for 10 days. E: the mycelia of P. indica growing on the
medium with antibiotics were observed under microscope. F: the mycelia and spores of P. indica
growing on the medium without antibiotics were observed under the microscope.
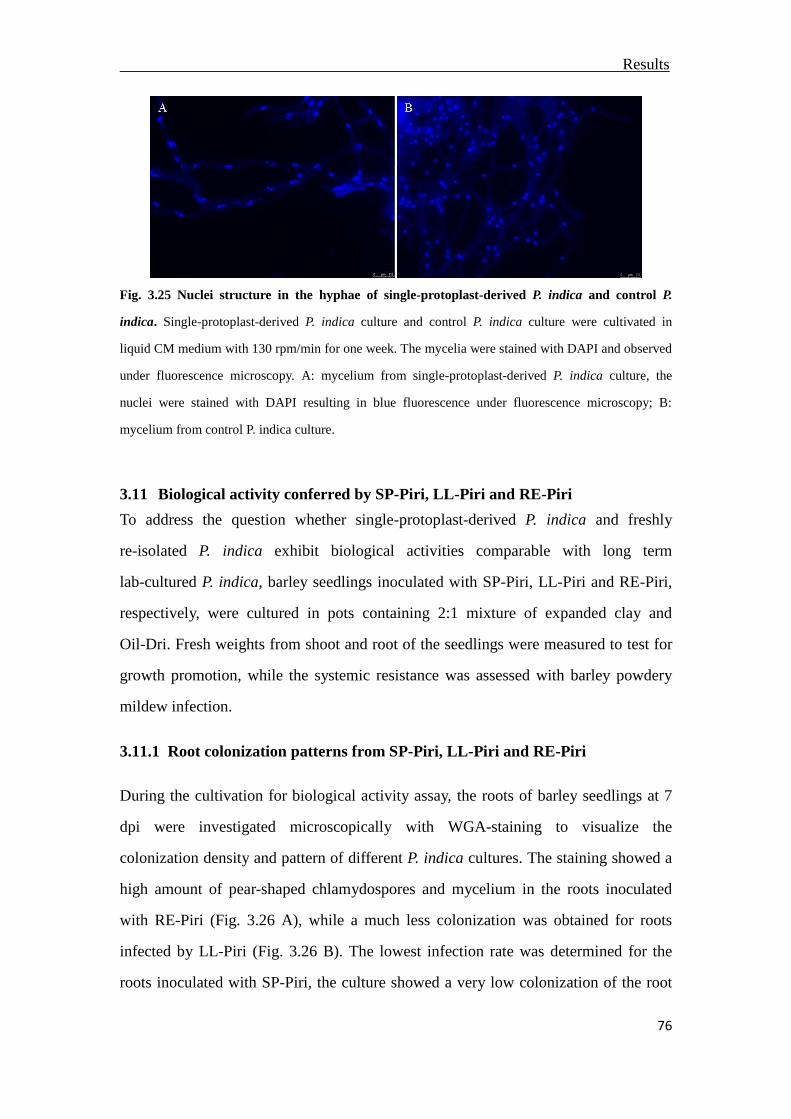
Results
76
Fig. 3.25 Nuclei structure in the hyphae of single-protoplast-derived P. indica and control P.
indica. Single-protoplast-derived P. indica culture and control P. indica culture were cultivated in
liquid CM medium with 130 rpm/min for one week. The mycelia were stained with DAPI and observed
under fluorescence microscopy. A: mycelium from single-protoplast-derived P. indica culture, the
nuclei were stained with DAPI resulting in blue fluorescence under fluorescence microscopy; B:
mycelium from control P. indica culture.
3.11 Biological activity conferred by SP-Piri, LL-Piri and RE-Piri
To address the question whether single-protoplast-derived P. indica and freshly
re-isolated P. indica exhibit biological activities comparable with long term
lab-cultured P. indica, barley seedlings inoculated with SP-Piri, LL-Piri and RE-Piri,
respectively, were cultured in pots containing 2:1 mixture of expanded clay and
Oil-Dri. Fresh weights from shoot and root of the seedlings were measured to test for
growth promotion, while the systemic resistance was assessed with barley powdery
mildew infection.
3.11.1 Root colonization patterns from SP-Piri, LL-Piri and RE-Piri
During the cultivation for biological activity assay, the roots of barley seedlings at 7
dpi were investigated microscopically with WGA-staining to visualize the
colonization density and pattern of different P. indica cultures. The staining showed a
high amount of pear-shaped chlamydospores and mycelium in the roots inoculated
with RE-Piri (Fig. 3.26 A), while a much less colonization was obtained for roots
infected by LL-Piri (Fig. 3.26 B). The lowest infection rate was determined for the
roots inoculated with SP-Piri, the culture showed a very low colonization of the root
Results
77
tissue by the SP-Piri and most of the structures obtained were mycelium (Fig. 3.26 C).
Similar results were obtained in three independent biological replicates.
Fig. 3.26 WGA-staining of barley roots colonized by P. indica at 7 dpi. Three-day-old seedlings
were dip-inoculated with mycelium of SP-Piri, LL-Piri, and RE-Piri, respectively, and cultured for 7
days in a growth chamber. Roots were harvested from one-week-old plants and stained with WGA for
fluorescence microscopy analysis. A: pear-shaped chlamydospores and mycelium in the root colonized
by RE-Piri; B: spores and mycelium in the root infected by LL-Piri; C: mycelium colonized on the
barley root inoculated with SP-Piri.
3.11.2 Quantification of endobacteria R. radiobacter in root colonized by SP-Piri,
LL-Piri and RE-Piri
Q-PCR analysis was used to determine the abundance of endobacteria in barley roots
colonized by single-protoplast-derived P. indica culture (SP-Piri), re-isolated P. indica
culture (RE-Piri) and long term lab-cultured P. indica culture (LL-Piri). Three-day-old
seedlings were dip-inoculated with mycelium from SP-Piri, fresh RE-Piri and LL-Piri,
respectively. Root samples were harvested at 7 dpi, and used to quantify the
colonization density of P. indica and the amount of endobacteria present in the root
colonized with different P. indica cultures. The Tef gene of P. indica was used for the
quantification of the fungus, while the specific ITS primer system was used for the
quantification of the endobacteria Rhizobium. The fresh RE-Piri showed a significant
highest colonization density of the roots of barley seedlings grown on 1/2 MS in jar,
no significant colonization difference were obtained between SP-Piri and LL-Piri (Fig.
3.27 A). The relative amount of endobacteria in roots colonized by RE-Piri was
significantly higher compared with LL-Piri and SP-Piri colonized roots (Fig. 3.27 B).

Results
78
There was still endobacteria detectable in roots colonized by SP-Piri, although the
amount was significantly reduced compared with LL-Piri and RE-Piri (Fig. 3.27 B).
The constantly detected endobacteria in SP-Piri indicates that single protoplast
cultivation and antibiotics treatment did not curing P. indica from its endobacteria
completely.
Fig. 3.27 Colonization of different P. indica cultures on barley roots and quantification of
endobacterium R. radiobacter inside. Three-day-old barley seedlings were dip-inoculated with
mycelium from SP-Piri, fresh RE-Piri and LL-Piri, respectively. The seedlings were cultured in a
growth chamber and harvested after one week for quantification. A: the colonization of different P.
indica cultures on barley roots. The amount of P. indica was quantified with q-PCR detection of the
fungal Tef gene. B: genome ratio of endobacteria Rhizobium and P. indica (endobacteria/Piri) on barley
roots. The amount of endobacteria was quantified with ITS of RrF4 and uniformed with Tef gene of P.
indica. SP-Piri: single-protoplast-derived P. indica cultue; LL-Piri: long term lab-cultured P. indica;
RE-Piri: fresh P. indica re-isolated from barley roots. Mean values and standard errors of three
independent biological replicates are given. Different letters on the top of the bars indicate statistically
significant differences tested by one-way analysis of variance performed with the Tukey test (P<0.05).
3.11.3 Fresh weight measurement and pathogen resistance assessment
Three-week-old plants inoculated with different P. indica cultures were harvested for
biomass measurement. Growth promotion was observed from barley plants inoculated
with LL-Piri and RE-Piri compared to the control (non-inoculated plants) before
harvest (Fig. 3.28 A). Compared with control, shoot fresh weight was increased in all
the plants treated with P. indica cultures (Fig. 3.28 B). The shoot weight was

Results
79
significantly increased in barely seedlings treated with RE-Piri (17.7%) and LL-Piri
(15.9%) compared to the control seedlings which were not inoculated with any P.
indica culture. Although slight growth promotion was obtained by the visual
observation from SP-Piri inoculated plants, the 7.5% increase induced by SP-Piri was
not significantly different from control plants. There was no significant difference
among plants infected with SP-Piri, LL-Piri and RE-Piri. The average root weights
showed increase in plants treated by SP-Piri, LL-Piri and RE-Piri compared to control
plants, but the increase was not significant (Fig. 3.28 C).
To determine the systemic resistance among different P. indica cultures, the third
leaves from three-week-old plants inoculated with P. indica cultures were used in
detached-leaves pathogen assay. Conidia from powdery mildew pathogen were blwn
to infect the detached leaf-segment, pustules were counted after 6-day infection. In
contrast to control plants, the number of pustules formed on leaves was decreased in
all the plants treated with P. indica cultures (Fig. 3.28 D). The pustules on leaves from
plants inoculated with RE-Piri and LL-Piri were significantly reduced compare with
control, nevertheless there was no significant reduction on plant infected with SP-Piri.
The maximum systemic resistance against Bgh was induced in RrF4 treated plants
(26.9%) followed by infection from RE-Piri (14.5%) and SP-Piri (14.5%). The lowest
systemic resistance was from the infection of LL-Piri (3.4%).

Results
80
Fig. 3.28 Biological activity conferred by SP-Piri, LL-Piri, RE-Piri and RrF4 on barley.
Three-day-old barley seedlings were inoculated with mycelium of SP-Piri, LL-Piri and RE-Piri,
respectively, and cultured in growth chamber. A: three-week old plants inoculated with RE-Piri,
LL-Piri, SP-Piri and control; B: the fresh weight from shoot; C: the fresh weight from root; D: number
of pustules on the detached-leaves. Bars indicate standard errors based on three independent biological
replicates. Letters on the top of the bars indicate statistically significant differences tested by one-way
analysis of variance performed with the Tukey test (P<0.05).
Discussion
82
4 Discussion
RrF4 treatment increased plant biomass and resistance to powdery mildew Blumeria
graminis f. sp. hordei in barley, the pathogenic bacterium Xanthomonas translucens
pv. Translucens (Xtt) in wheat and Pseudomonas syringae pv. tomato DC3000 (Pst) in
Arabidopsis (Scharma et al. 2008; Glaeser et al. 2015), while its fungal host P. indica
conferred promotion on biomass and yield, induction of resistance to leaf and root
pathogens, and increase in the tolerance to salt stress (Peškan-Berghöfer et al. 2004;
Waller et al. 2005; Sherameti et al. 2005; Schäfer and Kogel 2009; Jacobs et al. 2011;
Varma et al. 2012; Oberwinkler et al. 2014; Ye et al. 2014). The beneficial effects
induced by RrF4 in plants suggest a crucial role of the bacterial partner from P. indica
and raise the question whether P. indica induces pathogenic resistance and biomass
formation on the broad spectrum plant host alone.
4.1 Colonization pattern of RrF4 on the root surface
RrF4 labeled with GUS- and GFP- reporter genes were used to visualize the
colonization pattern of bacterium RrF4 on barley and Arabidopsis. It was clearly
showed in barley root that GUS-labeled RrF4 colonized on the maturation zone I at
the early inoculation period, spread to maturation zone II on the primary root later on,
and proliferated at lateral roots with the same pattern as in primary root after longer
inoculation period. During the whole growth period, root cap was virtually remained
free of bacteria colonization while elongation zone and meristematic zone were
seldom colonized (Glaeser et al. 2015). The resembled root colonization pattern was
observed from P. indica. Fungal colonization and proliferation were gradually
increased on the root maturation zone, while the elongation zone was colonized with
occasional hyphal structures, and root cap was a litter bit heavier infested by hyphae
than the elongation zone but much less than the colonization on maturation zone
(Deshmukh et al. 2006; Schäfer et al. 2009; Jacobs et al. 2011). On the basis of P.
indica’s colonization pattern on Arabidopsis, we drew a comparison draft about the
colonization pattern of RrF4 and its fungal host P. indica in the meristematic zone,
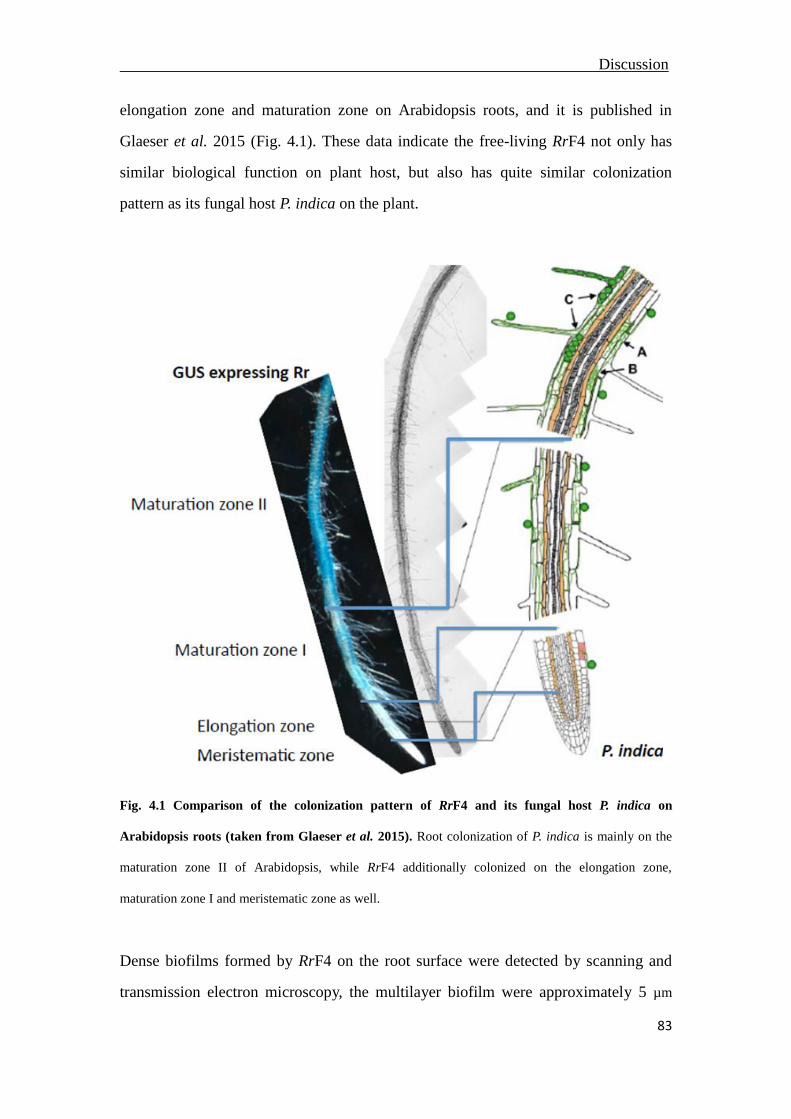
Discussion
83
elongation zone and maturation zone on Arabidopsis roots, and it is published in
Glaeser et al. 2015 (Fig. 4.1). These data indicate the free-living RrF4 not only has
similar biological function on plant host, but also has quite similar colonization
pattern as its fungal host P. indica on the plant.
Fig. 4.1 Comparison of the colonization pattern of RrF4 and its fungal host P. indica on
Arabidopsis roots (taken from Glaeser et al. 2015). Root colonization of P. indica is mainly on the
maturation zone II of Arabidopsis, while RrF4 additionally colonized on the elongation zone,
maturation zone I and meristematic zone as well.
Dense biofilms formed by RrF4 on the root surface were detected by scanning and
transmission electron microscopy, the multilayer biofilm were approximately 5 µm
Discussion
84
thick with bacterial cells embedded in a dense matrix of extracellular polymeric
substances. This matrix could be formed by extracellular polysaccharides,
extracellular DNA or (glyco) proteins (Flemming and Wingender 2010). Several
genes responsible for the synthesis of polysaccharide were found in the genome of
RrF4 (Glaeser et al. 2015). The polysaccharide can be succinoglycan, glucans and
outer membrane lipopolysaccharides, they are well known to be involved in the
formation of extracellular biofilm matrix of ‘Agrobacterium tumefaciens’ strains
(Goodner et al. 2001; Heindl et al. 2014; Matthysse 2014).
Fiber-like structures were detected to cross-link bacterial cells on root surface. It was
previously reported that the production of cellulose is necessary for the efficient root
surface attachment for Agrobacterium tumefaciens and leads to the loose aggregation
of cells on root (Heindl et al. 2014; Matthysse 2014; Matthysse 1983). Based on these
findings, we presumed the fiber-like structures could be cellulose. Through the
analysis of RrF4’s genome sequencing, we found that two gene clusters, which are
required for the cellulose production in R. radiobacter C58, celABCG and celDE,
presented on RrF4’s linear chromosome (Glaeser et al. 2015). This molecular
information got from genome analysis confirmed our presumption that fiber-like
structures among RrF4 cells are cellulose.
Many bacteria cells were preferentially proliferated at the lateral root protrusion and
root hair protrusion, formed bacterial conglomerates at primary and lateral root
junction as the growth of the lateral roots. Bacterial cell micro-colonies were also
located in the cracks among plant cells on the root cap instead of fully cover the cell
surface. The colonization of RrF4 on plant doesn’t induce more root hairs compared
with the untreated control plants. Compant and colleagues reported that the cracks on
plant root, such as lateral root bases, root hairs and root tips, are normally served as
entry sides for bacterial penetration (Compant et al. 2005; Compant et al. 2010;
Reinhold-Hurek and Hurek 1998). These evidences in combination with results
shown here indicate that RrF4 probably make use of the lateral root emergence, root
hair protrusion and cracks on the root as the passive entrance into the inner root tissue.

Discussion
85
4.2 Intercellular localization of RrF4 in the root cortex and central cylinder
Cross-section of barley roots were used to analyze the bacterial colonization in the
inner roots. GUS-tagged and GFP-tagged RrF4 bacteria were visible in the root cortex
(rhizodermis, exodermis and cortical tissues) after seven days inoculation. Light
microscopy and TEM with the ultrathin root cross-section showed that most of the
bacteria were detected among the rhizodermal cells and cortical cells in the
intercellular spaces. After 21 days inoculation, GUS-RrF4 cells were detected in the
intercellular space between the endodermal cells and the central cylinder, while
GFP-RrF4 cells were also seen in the intercellular spaces of central cylinder. The
finding of bacterial colonization in the endodermis is crucial, since the RrF4’s fungal
host P. indica was not observed in the inner part of root beyond the endodermis to
central cylinder layer (Deshmukh et al. 2006; Jacobs et al. 2011). We can not exclude
that bacteria RrF4 were able to pass the endodermis into central cylinder, it is also
possible that RrF4 cells invaded the vascular tissue via the non-maturated tissue of the
elongation zone where differentiation has not been completed yet. However, bacteria
cells were not found in the over ground part shoot tissue, since the blue or green
bacterial (GUS-RrF4 and GFP-RrF4) were neither visible under microscopes nor
culturable on medium from stem, leaf or leaf sheath, and the specific ITS target of
RrF4 could not be detected by qPCR in shoot and leaves. Those data suggested that,
RrF4 is different from other endophytic bacteria (Rothballer et al. 2008; Hardoim et
al. 2008; Van der Ent et al. 2009), it does not spread systemically into the upper plant
tissue.
RrF4 cells were assessed to colonize in the interior of Arabidopsis roots. Bacterial
cells were consistently seen on the surface of root hair zones, at the base of root hair
and emergence site of secondary root from 7 dpi to 21 dpi. The central vascular
system of primary and secondary Arabidopsis roots were heavily colonized compared
with the barley roots.
4.3 Single root cell colonization strategies of RrF4
Bax inhibitor-1 (BI-I) is a negative regulator of cell death that suppresses cell death
through Bcl-2 in mammals, and is located in the membrane of endoplasmic reticulum
Discussion
86
(Xu and Reed, 1998). There are no homologs of the cell death inducer BAX in plants,
but BI-1 in barley and other plants were shown to suppress cell death induced by
BAX (Hückelhoven, 2004; Eichmann et al. 2006; Watanabe and Lam 2009).
Although the relative expression of HvBI-1 was increased during barley root
development, RrF4-treated barley plants showed an additional increase in expression
compared with non-treated plants from 0 dai to 14 dai, while P. indica colonized
plants showed a reduced expression of HvBI-1 compared with non-colonized plants
(Deshmukh et al. 2006). Quantification of RrF4 in transgenic HvBI-1 line showed no
significant difference compared with the amount in wt barley, while the quantification
of P. indica in those lines showed significant reduction (Deshmukh et al. 2006). These
experimental data and the comparison with the data from P. indica indicates that the
colonization of RrF4 doesn’t induce cell death in plant host.
Our previous study showed that RrF4 multiplies at the maturation zone on the primary
and secondary roots, enters the inner roots through the lateral root protrusions and
root hair protrusion sides, propagates at the rhizodermal, cortical and endodermal
layers and spreads into the central cylinder (Gleaser et al. 2015). During the
experiment, we observed that there were single root cells heavily colonized by
GUS-tagged RrF4 on root hair zone. Confocal laser scanning microscopy analysis
showed cells within several GFP-tagged RrF4 on the root surface at early time pints,
single cell was filled by GFP-tagged RrF4 except the nucleus at the later time points.
Root cross-section analysis illustrated RrF4 colonized in the epidermis and went into
the root cortex through the intercellular space. These data reveal RrF4’s cell
colonization strategies that RrF4 multiplies in the intercellular space firstly,
afterwards some RrF4 invade the barrier of cell wall and successfully infect the dead
root cells in the maturation zone, after some time from that, RrF4 proliferates quickly
in the dead cells till the dead cell is full of bacteria except the nucleus. The dead cells
here could be caused by programmed cell death (PCD), which was carried out in a
self-regulated process in the plant host.
Discussion
87
4.4 Endobacteria in stationary phase-VBNC
Some gram-negative bacteria have extraordinary ability to survive under
nutrient-shortage or harsh environment. They enter into a stationary phase like state
that involves morphological and physiological adaptations, when the environment is
not sufficient enough to keep the steady growth (Llorens et al. 2010). In this
stationary phase like state, bacterial cells become smaller as the result of reductive
division and dwarfing, more resistant against different assaults since the formation of
cell envelopes, and non-proliferative because of the starving (Nystrom 2004; Llorens
et al. 2010). We adventurously assume that RrF4 is at a stationary phase-like viable
but nonculturable (VBNC) in fungal host P. indica in axenic culture, which could
explain the very low numbers of endobacteria RrF4 in the fungal hyphae and spores
and the smaller spherical shape of endobacteria compared with the free-living axenic
RrF4 culture in liquid or solid medium. In this stationary phase, bacterial cells are
more resistant to antibiotics, which could be one reason for the insufficient antibiotics
treatment to cure endobacteria RrF4 from its fungal host. Bacteria resuscitate from the
stationary phase to growth phase when there is third partner plant supplying with
enough nutrition and better propagation conditions, which could explain the increased
amount of RrF4 when P. indica colonized on plant root. A clinical strain of Vibrio
parahaemolyticus Vp5 was explored to be recoveried from VBNC after upshift
temperature from 4 ºC to 20 ºC and 37 ºC (Coutard et al. 2007).
FtsZ is the primary cytoskeletal protein responsible for cell division in almost all the
bacteria. In the bacterial cell, the ftsZ protein assembles into a protofilament that will
further form into a cytokinetic Z ring at the center of the cell. This Z ring is tethering
to the bacterial membrane through the binding of C-terminal peptide with FtsA
protein, and supplying the bacterial cell division with cytoskeletal framework (Osawa
et al. 2008; Peters et al. 2007; Pichoff and Lutkenhaus 2005). FtsZ as a marker gene
for cell division, the expression of FtsZ in one endocellular bacterium Candidatus
Glomeribacter gigasporarum was analyzed and showed to be at the highest value
when the fungal host Gigaspora margarita colonized on plant (Anca et al. 2009). It
will be interesting in the following work to measure the expression of FtsZ in

Discussion
88
endobacteria Rhizobium during the tripartite interaction.
4.5 Secretion system
The co-culture of GFP-tagged RrF4 and P. indica showed GFP-RrF4 cells sticking on
the hyphae and chlamydospores instead of entry into hyphae. Moebius and coleagues
found that the type 2 secretion system (T2SS) of endosymbiotic Burkholderia is
central for the active invasion into hyphe of the living fungus Rhizopus (Moebius et al.
2014). They said that during the invasion T2SS releases chitinase, chitosanase and
chitin-binding proteins to soften the cell wall of fungus and allow the bacterial entry
into fungal hyphae (Moebius et al. 2014). Based on this information, we checked the
genome information of RrF4. Not surprisingly, the whole gene cluster that is
responsible for the encoding of T2SS components is missing in the genome of RrF4
compared with the endosymbiont bacterium Burkholderia. Instead, RrF4 has a Type
IV secretion system, which mediates the transfer and conjugation of plasmid DNA
fragment from bacteria in to the genome of plant, fungi and human cells. T4SS is a
remarkable characteristic of Agrobacterium tumefaciens, which plays a crucial role in
the transgenic technology and shows very close relationship to stain RrF4 in
phylogenetic tree (Fronzes et al. 2009; Sharma et al. 2008). The missing T2SS in
RrF4 could be the reason for the un-successful invasion of RrF4 into fungal host P.
indica.
Our co-culture experiment showed that RrF4 sticking around the fungus especially the
tip of hyphae and spores, which are the active part from P. indica. Those hyphae tips
and germinating spores can be potential entry sides in the long term evolution
between fungus P. indica and bacteria RrF4. In natural environments there are many
microbes in the soil, there are nutrition competition and limit, under a certain
circumstance with a fine microbe balance, P. indica could be able to uptake RrF4
from the soil in the long evolution from the active hyphae tips and germinating
spores.
4.6 Removing endobacterium from P. indica
In general, there are two possibilities to explore the critical role of the endobacteria R.
Discussion
89
radiobacter in the tripartite relationship. One way is the function analysis of pure
bacteria RrF4 on plant host without the influence from fungus host P. indica, which
has been achieved as the successful insolation of endobacteria from fungus (Sharma et
al. 2008; Glaeser et al. 2015). The other one is the functional exploration of cured P.
indica on plant host without the impact coming from the endosymbiont. So it is an
urgent target to remove the endobacteria from P. indica and obtain the cured P. indica.
Partide-Martinez and Hertweck obtained cured fungus Rhizopus microspores from
endosymbiont Burkholderia rhizoxinica through the antibiotics treatment
(Partide-Martinez and Hertweck 2005). Alternatively, repeated passages through
single-spore inoculation with plant host was used to dilute the initial Candidatus
Glomeribacter gigasporarum (CaGg) bacterial population eventually leading to cured
AM Gigaspora margarita spores (Lumini et al. 2007). In order to generate
endobacteria-free fungus P. indica, we combined single-protoplast propagation and
antibiotics treatment. In this experiment, single protoplast was used instead of single
chlamydospore because of the consideration that fungal cell wall could protect
endofungal bacteria being killed by applied antibiotics. P. indica cultures showed no
endobacterial detection were further inoculated with barley seedlings, unfortunately,
RrF4 bacteria were again detected in the plant root samples. However, the relative
amount of RrF4 is significantly reduced compared with root samples colonized by wt
P. indica. Sharma reported similar result that endobacteria were coming up after
culture in medium without antibiotics (Sharma et al. 2008). From these data, we
concluded that single-protoplast-derived P. indica cultures were partially cured fungus
with reduced amount of endobacteria and therefore termed as partially cured P. indica
(pcPIRI).
During the experiment, we observed that the germination of chlamydospores derived
from single clones were delayed and single colonies were approximately 50% smaller
in size and produced less spores compared to colonies grown without antibiotics.
Although we cannot exclude the effect coming from antibiotics treatment, those
morphological changes could be induced by the reduced number of endobacteria.
Discussion
90
There are some research showed endobacteria mediated the fitness of its fungal host,
for instance, the cured Rhizopus microspores showed no sporulation (Partida-Martinez
et al. 2007; Partide-Martinez and Hertweck 2005). The cured fungus Gigaspora
margarita showed limited changes in spore morphology, while the symbiosis with this
endobacterium CaGg increases the environmental fitness and bioenergetics potential
of the AM fungal host (Lumini et al. 2007; Salvioli et al. 2015).
4.7 Amount variation of endobacteria R. radibacter in P. indica
It is proofed by specific FISH detection, PCR amplification and successful bacteria
isolation that the endobacterium R. radiobacter is presenting in P. indica in a very low
amount, sometimes even under the detection of Q-PCR. This low amount and limited
detection are the bottlenecks to analysis the function of endobacterium in P. indica
and eventually in the tripartite relationship with plant. From our experiment, we found
that the amount of the endobacterium significantly increased in plant roots treated
with P. indica than the axenic P. indica culture from agar plate. Higher amount of
endobacterial R. raiobacter were was also detected in grinded root extract and small
root pieces. This new finding about significantly increased amount of R. radiobacter
in the root sample colonized by P. indica shed new light on the further study.
Subsequently, fresh P. indica culture was re-isolated from the surface sterilized root.
Single colonies growing out from barley root were sub-cultured on new agar plate.
Quantification results showed that the relative amount of endobacterium in re-isolated
P. indica (RE-Piri) were significantly higher than the endobacterium amount in
long-term laboratory cultured P. indica (LL-Piri), while the relative bacterial amount
in fresh P. indica was significantly higher than that in sub-cultured P. indica. The
higher amount of endobacteria in fresh P. indica isolated from infected barley roots,
and the significantly decrease in the subculture on axenic agar plate further indicate
that plant host promotes the propagation of endobacterium.
N-acyl homoserine lactones (AHLs) are one kind of signaling molecules produced in
many Gram-negative bacteria, and mediate the bacterial behavior through a
density-dependent communication quorum sensing (QS) (Schenk and Schikora 2015;

Discussion
91
Dong et al. 2011; Teplitski et al. 2000). The short chain AHLs induce growth
promotion effect on a plant due to an impact to the phytohormone auxin, while long
chain AHLs have positive impact on plant defense mechanisms (von Rad et al. 2008;
Bai et al. 2012; Liu et al. 2012; Schikora et al. 2011; Schenk et al. 2012, 2014).
AHL-induced resistance in plant is called AHL-priming (Schenk and Schikora 2015).
Variety of oxo- and hydroxyle-C8- to C12-HSL compounds were detected in the
concentrated RrF4 extracts through Fourier transform ion cyclotron resonance mass
spectrometry (FT-ICR-MS) analysis (Dan Li 2010). QS signal molecules
p-coumaroyl-HSL, methylated p-coumaroyl-HSL and ethylated p-coumaroyl-HSL
were produced by RrF4, when p-coumaric acid was supplied in the culture medium
(Dan Li 2010). P-coumaric acid is a natural compound produced by plant on the
rhizosphere as precursor compound for plant polymer lignin (Whetten and Sederoff
1995). They reached the possibility that RrF4 requires p-coumaric acid secreted from
plant to produce AHL signaling molecular p-coumaroyl-HSL (Dan Li 2010). My
colleague generated RrF4 mutant that is impaired in AHL production. The
colonization of this mutant RrF4 on plant roots is significantly reduced compared with
wt RrF4, and the growth promotion and disease resistance on plant host induced by
the mutant were also low than wt RrF4 (data not published yet). Based on this
previous research, our results on the variable cell numbers of endobacteria
with/without the plant host suggest that the proliferation of endobacterium in P. indica
needs the chemical p-coumaric acid from the plant host to synthesis long chain
p-coumaroyl-HSL, methylated p-coumaroyl-HSL and ethylated p-coumaroyl-HSL,
which act as homoserine lactone quorum-sensing signals to increase plant resistance
to pathogens in turn.
The increased amount of endobacteria R. radiobacter in plant root, and in the
presence of root extractions, root pieces infected by P. indica, and the significant
reduced amount in the sub-cultured P. indica isolated from the plant indicate that the
endobacterium getsmore benefit from the tripartite relationship with both fungal and
plant hosts than in the bipartite relation with only the fungus. Meanwhile, this result

Discussion
92
also leads to more complicate questions on whether the endobacteria are released
from the fungus during fungal colonization of plants, and whether the increased
amount of endobacteria is inside the fungus or endobacteria released from fungus host
into root tissue and propagated in a large number in roots.
4.8 Characteristics of SP-Piri and RE-Piri
Colonization and induced biological activity were compared among three kinds of P.
indica cultures. Single-protoplast-derived P. indica (SP-Piri) has very low amount of
endobacteria, long term laboratory P. indica (LL-Piri) has normal amount, while
re-isolated P. indica (RE-Piri) has highest endobacterial amount compared with the
other two cultures. The quantification with inoculated plants confirmed the difference
among these three cultures in bacteria. The genome ratio RrF4/Piri was significantly
low in barley root colonized by SP-Piri than by LL-Piri, while the genome ratio from
RE-Piri colonizing plants was significantly higher than from LL-Piri plants.
Compared with control plants, RE-Piri treated plants and LL-Piri treated plants had
significantly increased shoot weighs, which is identical to the results in many
publications that P. indica promoted the growth of plant host (Waller et al. 2005;
Sharma et al. 2008; Qiang et al. 2012). But there was neither significant difference
between SP-Piri plants and control nor SP-Piri plants and LL-Piri plants, the
biological promotion induced by SP-Piri was between control plants and LL-Piri
plants. These results indicate that with low amount of endobacterium, the fungus host,
as SP-Piri, mediates reduced plant growth promotion compared with normal P. indica;
with high amount of endobacterium, the fungus host, as RE-Piri, induces increased
plant host promotion. Taken together, we reach the conclusion that endobacterium
mediates growth promotion of plant host, contributes to the biological activity
induced by fungus host P. indica.
The colonization of SP-Piri, LL-Piri and RE-Piri on barley seedlings were quantified
by Tef gene with standard curve. The quantification results showed that RE-Piri had
the best colonization on barley roots, while there was no significant difference
between LL-Piri and SP-Piri. WGA-staining with treated barley roots showed strong
Discussion
93
mycelium and spores colonization from RE-Piri inoculated seedlings, whereas less
colonization in LL-Piri roots and few mycelium colonization in SP-Piri roots. Those
results suggested that the amount of endobacterium has an influence on the fungus
sporulation and the fungal colonization on plant host.
4.9 Conclusions
The aim of this study was to investigate the role of endobacterium R. radiobacter in
the tripartite symbiosis with fungal and plant hosts. Plant growth promotion and
pathogen resistance induced by the isolated enobacterium R. radiobacter stain F4 has
been showed in previous research (Sharma et al. 2008). In the present work, the focus
was on the colonization pattern of RrF4 on the plant host, the variation of the
endofungal R. radiobacter with and without plant host under different growth
conditions, the morphology change of P. indica with decreased endobacteria, and the
biological activity on plant mediated by P. indica with different amount of
endobacterial R. radiobacter cells.
GUS- and GFP- tagged RrF4 were used to explore the colonization pattern on barley
and Arabidopsis thaliana roots. RrF4 were detected on the root maturation zone I at
early inoculation period, spread into maturation zone II and proliferate on the lateral
roots with the same pattern later on, root caps were virtually free of bacteria while
meristematic and elongation zones were rarely colonized by RrF4 through the whole
period of study. Bacterial cells were cross-linked by fiber-like structures and formed
multilayer biofilms on the root surface.
RrF4 not only colonized the root surface but also entered into the inner root. Bacterial
cells were mostly detected on the root hairs, in the intercellular space in rhizodermis,
exodermis, endodermis and central cylinder, but not in the upper parts like stem and
leaf. Occasionally, some single root cells in root hair zone were heavily colonized by
RrF4 cells. Bacterial cell colonies were formed in the root hair and lateral root
protrusions, root junctions between primary and lateral roots, and cracks among cells
on the root cap. Nonetheless, the colonization of RrF4 on plant roots did not induce
more root hairs or lateral roots.
Discussion
94
Quantification results showed that the low relative amount of endobacteria R.
radiobacter in axenic P. indica was increased in plant root samples inoculated with P.
indca. Subsequently, fresh P. indica was re-isolated from barley roots. Re-isolated P.
indica harbored higher amount of endobacteria R. radiobacter than long-term
laboratory cultured P. indica, and the relative amount was significantly reduced in
subcultures. RrF4 could not go back to the fungal host P. indica under laboratory
condition.
Single-protoplast-derived P. indica cultures produced less chlamydospores, showed
delayed germination of protoplast, slowly growth of the fungus, and reduced amount
of endobacteria. There was no significant plant growth promotion induced by
single-protoplast-derived P. indica, while there was significant promotion mediated
by long-term laboratory cultured P. indica and re-isolated fresh P. indica. RI-Piri had
the best colonization on barley roots, while there was no significant difference
between LL-Piri and PC-Piri. RI-Piri had high activity on plant and produced lots of
mycelium and spores on roots, whereas less colonization from LL-Piri and only very
few mycelium colonization from PC-Piri colonized roots.
Summary/Zusammenfasung
95
5 Summary/Zusammenfassung
5.1 Summary
Endofungal bacteria as symbionts residing in the fungal mycelium and spores were
first describes as Bacteria-Like Organisms (BLOs) in 1970’s (Mosse 1970). The
bipartite relationship between fungi and terrestrial plants on the rhizosphere becomes
complicated tripartite interaction as the discovery of endobacteria. In the last decade,
research focussed on the endobacteria in arbuscular mycorrhizal fungi (Bonfante and
Anca 2009; Naumann et al. 2010; Salvioli et al. 2015), in ectomycorrhizal
basidiomycete fungus (Bertaux et al. 2005), and in rice pathogenic fungus Rhizopus
microsporus (Partida-Martinez and Hartweck 2005; Moebius et al. 2014). We
extended the former work to explore and establish a model tripartite symbiosis system
among the Sebacinalean fungus Piriformospora indica, the Alphaproteobacterium
Rhizobium radiobacter and a broad spectrum of plants.
The free-living bacterial strain R. radiobacter F4 (RrF4) showed similar colonization
pattern as its fungal host P. indica in plant roots. RrF4 cells heavily colonizedthe root
maturation zone, embedded in dense polysaccharides biofilms and were interwoven in
cellulose fiber-like structures on the root surface. Thereafter, RrF4 cells entered into
inner tissue through lateral root emergence, root hair protrusion and cracks on the root,
proliferated in the intercellular space in the rhizodermal and cortical layers into the
central vascular system. Nevertheless, RrF4 only invaded and colonized the dead root
cells instead of inducing plant host cell death. The systemic resistance mediated by
RrF4 is based on the jasmonate-based ISR pathway, and defense gene expression
resembles that observed with P. indica (Gleaser et al. 2015).
The increased amount of endobacteria R. radiobacter in plant roots inoculated with P.
indica, and the significantly reduced amount of endobateria in the sub-cultured P.
indica that was isolated from plant roots indicate endobacteria R. radiobacter obtain
more benefit from the tripartite relationship with both fungal and plant hosts than in
the bipartite relation with only the fungus. It is an open question whether the
endobacteria R. radiobacter released from P. indica into root tissue during the fungal
Summary/Zusammenfasung
96
colonization on plant.
It was not successful to cure P. indica from the endobacteria through antibiotics
treatment and single protoplast cultivation. However, we obtained a P. indica culture
with reduced amount of endobacteria R. radiobacter, and partially cured P. indica
showed low beneficial activity on plants. We presume the endobacteria R.
radidobacter inside P. indica are at a stationary phase, which is the reason for the low
number, small size and resistance to antibiotics in axenic culture. The endobacteria R.
radiobacter resuscitate from stationary phase to growth phase when there is third
partner plant supplying with enough nutrition and better propagation conditions,
which results in the increased amount of endobacteria R. radiobacter when P. indica
colonized on plant root.
Taken together, this study underlines the crucial role of endofungal bacteria in the
tripartite symbiosis. Further studies are needed to better understand the mechanism of
R. radiobacter in the tripartite interaction, such as the regulation of mRNA on
transcriptome level.
Summary/Zusammenfasung
97
5.2 Zusammenfassung
Endofungale Bakterien wurden als Symbionten, die im pilzlichen Myzel residieren,
zuerst in den 1970ern als Bakterien-ähnliche „Bacteria-Like Organisms“ (BLOs)
beschrieben (Mosse 1970). Mit der Entdeckung von Endobakterien ist aus der
zweiteilige Symbiose von Pilzen und terrestrischen Pflanzen eine komplizierten
dreiteiligen Symbiose geworden. Im letzten Jahrzehnt konzentrierte sich die
Forschung auf Endobakterien in Arbuskulären Mykorrhizapilze (Bonfante and Anca
2009; Naumann et al. 2010; Salvioli et al. 2015), in ektomykorrhizalen
Basidiomyceten (Bertaux et al. 2005) und in den Reispflanzen befallenden Rhizopus
microspores (Partida-Martinez and Hartweck 2005; Moebius et al. 2014). Bei Sharma
et al. (2008) wurde erstemals gezeigt, dass auch der endophytische Sebacinaleen Pilz
Piriformospora indica Wirt eines Endobakteriums ist. Dieses wurde als Rhizobium
radiobacter (syn. Agrobacterium tumefaciens) identifiziert und konnte in Reinkultur
kultiviert werden (Stamm R. radiobacter F4, RrF4). In der vorliegenden Studie wurde
die bisherige Arbeit zu dieser dreiteiligen Symbiose zwischen P. indica, dem
Alphaproteobakterium Rhizobium radiobacter und einem breitem Spektrum von
Pflanzen näher untersucht.
Das freilebende Bakterium RrF4 zeigte ein dem Wirtspilz ähnliches
Kolonisierungsmuster von Pflanzenwurzeln. RrF4 Zellen kolonisieren die
Wurzeloberfläche der Reifungszone der Wurzel in erheblichem Maße, die Zellen sind
mit faserartigen Zellulose-ähnlichen Strukturen auf der Wurzeloberfläche angehaftet
und bilden Biofilme an der Wurzeloberfläche in denen die Zellen in eine dichte
Polysaccharid Schicht eingebettete sind. Durch Ausbuchtungen der Wurzelhaarzellen
und die Austrittsstellen der Seitenwurzeln scheinen RrF4 Zellen ins innere Gewebe
der Wurzel einzutreten; dort vermehren sie sich im Interzellularraum der
rhizodermalen und kortikalen Wurzelschichten. Entgegen dem Wirtspilz dringen RrF4
Zellen auch in die zentralen Leitungsbahn vor. Mikroskopisch wurden einzelne
Wurzelhaarzellen an der Wurzeloberfläche nachgewiesen die gefüllt waren mit RrF4
Zellen. Da keine Zelltod-Induktion durch RrF4 in den Wurzeln nachgewiesen werden
Summary/Zusammenfasung
98
konnte ist anzunehmen das RrF4 nur in tote Wurzelzellen eindringt und sich dort
vermehrt. Die durch RrF4 vermittelte systemische Resistenz basiert auf den
Jasmonsäure-abhängigen Signalweg der induzierten systemischen Resistenz. Die
Expression von Abwehr-Genen bei der Pflanze entspricht größtenteils der
beobachteten Expression bei P. indica (Glaeser et al. 2015).
Im Rahmen der Arbeit konnte gezeigt werden das die Anzahl an Bakterienzellen in
der Tripartiden Symbiose im Vergleich zu einer Laborkultur von P. indica signifikant
zunehmen. Wurde der Pilz von der Wurzel re-isoliert konnte gezeigt werden das die
Konzentration an Bakterienzellen mit jeder weiteren Subkultivierung des Pilzes auf
Agarplatten wieder abnahm.
Dies zeigt, dass die Abundanz der Endobakterien vielmerh abhängig ist von der
dreiseitigen Symbiose mit P. indica und der Wirtpflanzen als von der zweiteiligen
Symbiose mit P. indica. Es ist immer noch eine offene Frage, ob während der
Kolonisierung durch den Pilz Endobakterien aus P. indica im Wurzelgewebe
ausgesscheidet werden.
Während RrF4 in Reinkultur wächst war es auch in dieser Arbeit nicht möglich, P.
indica, durch Antibiotikabehandlung kombiniert mit der Kultivierung einzelner
Protoplasten, Bakterien-frei zu bekommen. Es war jedoch möglich eine P. indica
Kultur zu selektieren, die mit einer geringeren Anzahl von Endobakterien besiedelt ist.
Diese P. indica Kultur zeigte eine reduzierte Aktivität hinsichtlich der
Pflanzenwachstumsförderung. Diese Ergebnisse lassen vermuten das das
Endobakterium in der dipartiden Symbiose in einen sogenannten „viable but not
culturable“ VBNC Status übertreten indem die Bakterienzelle ähnlich zu Zellen in der
stationären Phase sind. Die Zellen haben eine reduzierte metabolische Aktivität, sind
kleiner und unempfindlich gegen Antibiotika. Bei Kontakt mit der Wirtspflanze treten
die Bakterienzellen vermutlich wieder in einen normalen aktivwachsende Zellform
über, was bei einer Kolonisierung von Pflanzwurzeln durch P. indica zu einer
erhöhten Anzahl von Endobakterien führt.
Zusammenfassend betont diese Studie die entscheidende Rolle der endofungalen

Summary/Zusammenfasung
99
Bakterien in der dreiteiligen Symbiose von P. indica, dem Endobakterium und den
entsprechenden Wirtspflanzen. Weitere Untersuchungen sind erforderlich, um ein
tieferes Verständnis der Rolle von RrF4 in der dreiteiligen Beziehung zu erhalten, wie
zum Beispiel die Regulierung der Gen Expression auf Transkriptionsebene.
References
97a
6 Reference
Abramovitch R. B., Kim Y. J., Chen S., Dickman M. B., Martin G. B. (2003)
Pseudomonas type III effector AvrPtoB induces plant disease susceptibility by
inhibition of host programmed cell death. EMBO J. 22: 60–69
Akiyama K., Matsuzaki K., Hayashi H. (2005) Plant sesquiterpenes induce hyphal
branching in arbuscular mycorrhizal fungi. Nature 435: 824–827
Akum F. N., Steinbrenner J., Biedenkopf D., Imani J., Kogel K. H. (2015) The
Piriformospora indica effector PIIN_08944 promotes the mutualistic Sebacinalean
symbiosis. Front. Plant Sci. 6: 906
Alber F., Dokudovskaya S., Veenhoff L. M., Zhan W., Kipper J., Devos D.,
Suprapto A., Karni-Schmidt O., Williams R., Chait B. T., Sali A., Rout M. P.
(2007) The molecular architecture of the nuclear pore complex. Nature 450: 695–701
Alexander T., Toth R., Meier R., Weber H. C. (1989) Dynamics of arbuscule
development and degeneration in onion, bean and tomato with reference to
vesiculararbuscular mycorrhizae in grasses. Can. J. Bot. 67: 2505–2513
Amann R. I., Binder B. J., Olson R. J., Chisholm S. W., Devereux R. and Stahl D.
A. (1990) Combination of 16S rRNA-targeted oligonucleotide probes with flow
cytometry for analyzing mixed microbial populations. App. Environ. Microbiol. 56:
1919-1925
Amann R., Fuchs B. M. (2008) Single-cell identification in microbial communities
by improved fluorescence in situ hyridization techniques. Nat. Rev. Microbiol. 6:
339-348
References
Antolín-Llovera M., Ried M. K., Parniske M. (2014) Cleavage of the SYMBIOSIS
RECEPTOR-LIKE KINASE ectodomain promotes complex formation with Nod
factor receptor 5. Curr.Biol. 24: 422–427
Arnold A.E., Mejia L.C., Kyllo D., Rojas E.I., Maynard Z., Robbins N., Herre
E.A. (2003) Fungal endophytes limit pathogen damage in a tropical tree. Proc. Natl.
Acad. Sci. U.S.A. 100: 15649–15654
Artursson V., Finlay R. D., Jansson J. K. (2006) Interactions between arbuscular
mycorrhizal fungi and bacteria and their potential for stimulating plant growth.
Environ. Microbiol. 8:1–10
Ausubel, F. M. (2005) Are innate immune signaling pathways in plants and animals
conserved. Nat. Immunol. 6: 973–979
Bago B., Pfeffer P. E., Abubaker J., Jun J., Allen J. W., Brouillette J., Douds D.
D., Lammers P. J., Shachar-Hill Y. (2003) Carbon export from arbuscular
mycorrhizal roots involves the translocation of carbohydrate as well as lipid. Plant
Physiol. 131: 1496–1507
Bakker P. A. H. M., Pieterse C. M. J., Van Loon L. C. (2007) Induced systemic
resistance by fluorescent Pseudomonas spp. Phyto. 97: 239–243
Baltruschat H., Fodor J., Harrach B. D., Niemczyk E., Barna B., Gullner G.,
Janeczko A., Kogel K. H., Schäfer P., Schwarczinger I., Zuccaro A., Skoczowski
A. (2008) Salt tolerance of barley induced by the root endophyte Piriformospora
indica is associated with a strong increase in antioxidants. New Phytol. 180: 501–510
Banhara A., Ding Y., Kuehner R., Zuccaro A., Parniske M. (2015) Colonization of
98a
References
99a
root cells and plant growth promotion by Piriformospora indica occurs independently
of plant common symbiosis genes. Front. Plant Sci. 6: 667
Bashan Y., Dubrovsky J. G. (1996) Azospirillum spp. Participation in dry matter
partitioning in grasses at the whole plant level. Biol. Fertil. Soils. 23: 435–440
Bäerbel G. (1992) Untersuchungen zur Induktion der Kompetenz zur somatischen
Embryogenese in Karotten-Petiolenexplantaten (Daucus carota L.) Histologie und
Proteinsynthesemuster. Book, Published by Wissenschafts-Verlag Dr. W. Maraun in
Frankfurt, Germany
Bertaux J., Schmid M., Hutzler P., Hartmann A., Garbaye J., Frey-Klett P. (2005)
Occurrence and distribution of endobacteria in the plant-associated mycelium of the
ectomycorrhizal fungus Laccaria bicolor S238N. Environ. Microbiol. 7: 1786–1795
Bertaux J., Schmid M., Prévost-Bourre N. C., Churin J. L., Hartmann A.,
Garbaye J. (2003) In situ identification of intracellular bacteria related to
Paenibacillus spp. in the mycelium of the ectomycorrhizal fungus Laccaria bicolor
S238N. App. Environ. Microbiol. 69: 4243–4248
Besserer A., Puech-Pagès V., Kiefer P., Gomez-Roldan V., Jauneau A., Roy S.,
Portais J. Bianciotto V., Lumini E., Bonfante P., Vandamme P. (2003) ‘Candidatus
Glomeribacter gigasporarum’ gen. nov., sp nov., an endosymbiont of arbuscular
mycorrhizal fungi. Int. J. Syst. Evol. Microbiol. 53: 121–124
Bharadwaj D. P., Lundquist P. O., Persson P., Alström S. (2008) Evidence for
specificity of cultivable bacteria associated with arbuscular mycorrhizal fungal spores.
FEMS Microbiol. Ecol. 65: 310–22
References
100
Bianciotto V., Andreotti S., Balestrini R., Bonfante P., Perotto S. (2001)
Extracellular polysaccharides are involved in the attachment of Azospirillum
brasilense and Rhizobium leguminosarum to arbuscular mycorrhizal structures. Eur. J.
Histochem. 45:39–49
Bianciotto V., Genre A., Jargeat P., Lumini E., Becard G., Bonfante P. (2004)
Vertical transmission of endobacteria in the arbuscular mycorrhizal fungus Gigaspora
margarita through generation of vegetative spores. App. Environ. Microbiol. 70:
3600-3608
Bianciotto V, Lumini E, Bonfante P, Vandamme P. 2003. ‘Candidatus
Glomeribacter gigasporarum’ gen. nov., sp. nov., an endosymbiont of arbuscular
mycorrhizal fungi. Int. J. Syst. Evol. Microbiol. 53:121–24
Binns A. N., Thomashow M. F. (1998) Cell biology of agrobacterium infection and
transformation of plants. Annu. Rev. Microbiol. 42: 575
Boch J., Scholze H., Schornack S., Landgraf A., Hahn S., Kay S., Lahaye T.,
Nickstadt A., Bonas U. (2009) Breaking the code of DNA binding specificity of
TAL-type III effectors. Science (New York, NY), 326 (5959):1509-1512
Bonfante P., Anca I. (2009) Plant, mycorrhizal fungi, and bacteria: a network of
interactions. Annu. Rev. Microbiol. 63: 363-83
Boraston A. B., Bolam D. N., Gilbert H. J., Davies G. J. (2004)
Carbohydrate-binding modules: fine-tuning polysaccharide recognition. Biochem J
382: 769–781
Bostock R. M. (2005) Signal crosstalk and induced resistance: straddling the line
References
101
between cost and benefit. Annu. Rev. Phytopathol. 43: 545-580
Bouwmeester H. J., Roux C., Lopez-Raez J. A., B´ecard G. (2007) Rhizosphere
communication of plants, parasitic plants and AM fungi. Trends Plant Sci. 12:224–30
Brewin N. J. (2004) Plant cell wall remodelling in the Rhizobium-legume symbiosis.
Crit. Rev. Plant Sci. 23: 293–316
Camehl I., Drzewiecki C., Vadassery J., Shahollari B., Sherameti I., Forzani C.,
Munnik T., Hirt H., Oelmüller R. (2011) The OXI1 kinase pathway mediates
Piriformospora indica-induced growth promotion in Arabidopsis. PLoS Pathog. 7:
e1002051
Camehl I., Sherameti I., Venus Y., Bethke G., Varma A., Lee J., Oelmüller R.
(2010) Ethylene signalling and ethylene-targeted transcription factors are required to
balance beneficial and nonbeneficial traits in the symbiosis between the endophytic
fungus Piriformospora indica and Arabidopsis thaliana. New Phytol. 185: 1062–1073
Chandler P. M., Marion-Poll A., Ellis M., Gubler F. (2002) Mutants at the Slender1
locus of barley cv Himalaya. Molecular and physiological characterization. Plant
Physiol. 129: 181–190
Chang J. H., Urbach J. M., Law T. F., Arnold L. M., Hu A., Gombar S., Grant S.
R., Ausubel F. M., Dangl J. L. (2005) A high-throughput near-saturating screen for
type III effector genes from Pseudomonas syringae. Proc. Natl. Acad. Sci. U.S.A 102:
2549-2554
Chelius M. K., Triplett E. W. (2001) The diversity of archaea and bacteria in
association with roots of zea mays L. Micro. Ecol. 41: 252-263
References
102
Chin-A-Woeng T. F. C., Bloemberg G. V., Mulders I. H. M., Dekkers L. C.,
Lugtenberg B. J. J. (2000) Root colonization is essential for biocontrol of tomato
foot and root rot by the phenazine-1-carboxamide-producing bacterium Pseudomonas
chlororaphis PCL1391. Mol. Plant-Microbe Interact. 13: 1340–45
Chisholm, S. T., Coaker, G., Day, B. and Staskawicz, B. J. (2006) Host–microbe
interactions: shaping the evolution of the plant immune response. Cell 124:803–814.
Colditz F., Braun H.P., Jacquet C., Niehaus K., Krajinski F. (2005) Proteomic
profiling unravels insights into the molecular background underlying increased
Aphanomyces euteiches-tolerance of Medicago truncatula. Plant Mol. Biol. 59: 387–
406
Compant S., Clement C., Sessitsch A. (2010) Plant growth-promoting bacteria in the
rhizo- and endosphere of plants: Their role, colonization, mechanisms involved and
prospects for utilization. Soil Biol. Biochem. 42: 669-678
Cormack B. P., Valdivia R. H., Falkow S. (1996) FACS-optimized mutants of the
green fluorescent protein (GFP). Gene. 173: 33–38
Coutard F., Crassous P., Droguet M., Gobin E., Colwell R. R., Pommepuy M.,
Hervio-Heath D. (2007) Recovery in culture of viable but nonculturable Vibrio
parahaemolyticus: regrowth or resuscitation? The ISME Journal 1: 111-120
doi:10.1038/ismej.2007.1
Cunnac S., Lindeberg M., Collmer A. (2009) Pseudomonas syringae type III
secretion system effectors: repertoires in search of functions. Curr. Opin. Microbiol.
12: 53-60
References
103
Daims H., Breuhl A., Amann R., Schleifer K.H., Wagner M. (1999). Probe
EUB338 is insufficient for the detection of all bacteria: development and evaluation
of a more comprehensive probe set. Syst. Appl. Microbiol. 22: 438-448.
Dale C., Plague G. R., Wang B., Ochman H., Moran N. A. (2002) Type III
secretion systems and the evolution of mutualistic endosymbiosis. Proc. Natl. Acad.
Sci. U.S.A. 99: 12397-12402
Dan Li (2010) Phenotypic variation and molecular signalling in the interaction of the
rhizosphere bacteria Acidovorax sp. N35 and Rhizobium radiobacter F4 with roots.
Ph.D thesis, Ludwig-Maximilians-Universität München
Dangl, J. L. & Jones, J. D. G. (2001) Plant pathogens and integrated defence
responses to infection. Nature 411: 826-833
DebRoy S., Thilmony R., Kwack Y.B., Nomura K., and He S.Y. (2004). A family
of conserved bacterial effectors inhibits salicylic acid-mediated basal immunity and
promotes disease necrosis in plants. Proc. Natl. Acad. Sci. U.S.A. 101: 9927–9932.
De Bruijn I., De Kock M. J. D., Yang M., De Waard P., Van Beek T. A.,
Raaijmakers J. M. (2007) Genome-based discovery, structure prediction and
functional analysis of cyclic lipopeptide antibiotics in Pseudomonas species. Mol.
Microbiol. 63: 417–28
De Jonge R., Van Esse H. P., Kombrink A., Shinya T., Desaki Y., Bours R., Van
der Krol S., Shibuya N., Joosten M. H. A. J., Thomma B. P. H. J. (2010)
Conserved fungal LysM effector Ecp6 prevents chitin-triggered immunity in plants.
Science. 329: 953–955

References
104
Deshmukh S., Hückelhoven R., Schäfer P., Imani J., Sharma M., Weiß M.,
Waller F., Kogel K. H. (2006) The root endophytic fungus Piriformospora indica
requires host cell death for proliferation during mutualistic symbiosis with barley.
Proc. Natl. Acad. Sci. U.S.A. 103: 18 450–18 457
Deshmukh Sachin, Hückelhoven Ralph, Schäfer Patrick, Imani Jafargholi,
Sharma Monica, Weiss Michael, Waller Frank, Kogel Karl-Heinz (2006) The root
endophytic fungus Piriformospora indica requires host cell death for proliferation
during mutualistic symbiosis with barley. Proc Natl Acad Sci U.S.A. 103 (49): 18450–
18457
Desirò A. Faccio A., Kaech A., Bidartondo M. I., Bonfante P. (2015) Endogone,
one of the oldest plant-associated fungi, host unique Mollicutes-relared endobacteria.
New Phyto. 205: 1464-1472
Dodds P. N. and Rathjen J. P. (2010) Plant immunity: towards an integrated view of
plant-pathogen interactions. Nat. Rev. Genet. 11: 539-548
Dong X. (2004) NPR1, all things considered. Curr. Opin. Plant Biol. 7: 547-552.
Durrant W.E., Dong X. (2004) Systemic acquired resistance. Annu. Rev. Phytopathol.
42: 185–209
Finlay R. D. (2008) Ecological aspects of mycorrhizalsymbiosis: with special
emphasis on the functional diversity of interactions involving the extraradical
mycelium. J. Exp. Bot. 59: 1115–1126
Fitter A. H. (2005) Darkness visible: reflections on underground ecology. J. Ecol. 93:

References
105
231–243
Fobert P. R., Despres C. (2005) Redox control of systemic acquired resistance. Curr.
Opin Plant Biol. 8: 378-382.
Frey-Klett P., Garbaye J., Tarkka M. (2007) Themycorrhiza helper bacteria
revisited. New Phytol. 176:22–36
Fujimura R., Nishimura A., Ohshima S., Sato Y., Nishizawa T., Oshima K.,
Hattori M., Narisawa K., Ohta H. (2014). Draft genome sequence of the
betaproteobacterial endosymbiont associated with the fungus Mortierella elongata
FMR23-6. Genome Announc. 2. pii: e01272-14.
Galleguillos C., Aguirre C., Barea J. M., Azcon R. (2000) Growth promoting effect
of two Sinorhizobium meliloti strains (a wild type and its genetically modified
derivative) on a non-legume plant species in specific interaction with two arbuscular
mycorrhizal fungi. Plant Sci. 159: 57–63
Garbaye, J., and Frey-Klett, P. (2003) In situ identification of intracellular bacteria
related to Paenibacillus spp. in the mycelium of the ectomycorrhizal fungus Laccaria
bicolor S238N. Appl. Envir. Microbiol. 69: 4243–4248
Gaulin E., Drame N., Lafitte C., Torto-Alalibo T., Martinez Y.,
Ameline-Torregrosa C., Khatib M., Mazarguil H., Villalba-Mateos F., Kamoun S.,
Mazars C., Dumas B., Bottin A., Esquerré-Tugayé M., Rickauer M. (2006)
Cellulose binding domains of a Phytophthora cell wall protein are novel
pathogen-associated molecular patterns. Plant Cell 18: 1766–1777
Genre A., Chabaud M., Faccio A., Barker D. G., Bonfante P. (2008) Prepenetration
References
106
apparatus assembly precedes and predicts the colonization patterns of arbuscular
mycorrhizal fungi within the root cortex of both Medicago truncatula and Daucus
carota. Plant Cell 20: 1407–1420
Genre A., Chabaud M., Timmers T., Bonfante P., Barker D. G. (2005) Arbuscular
mycorrhizal fungi elicit a novel intracellular apparatus in Medicago truncatula root
epidermal cells before infection. Plant Cell 17: 3489–3499
German M. A., Burdman S., Okon Y. Kigel J. (2000) Effects of Azospirillum
brasilense on root morphology of common bean (Phaseolus vulgaris L.) under
different water regimes. Biol. Fertil. Soils. 32: 259–264
Gherbi H. et al. (2008) SymRK defines a common genetic basis for plant root
endosymbioses with arbuscular mycorrhiza fungi, rhizobia, and Frankiabacteria. Proc.
Natl Acad. Sci. U.S.A. 105: 4928–4932
Ghignone S., Salvioli A., Anca I., Lumini E., Ortu G., Petiti L., Cruveiller S.,
Bianciotto V., Piffanelli P. Lanfranco L., Bonfante P. (2012) The genome of the
obligate endobacterium of an AM fungus reveals an interphylum network of
nutritional interactions. ISME J. 6:136–45
Gomez-Roldan V., Fermans S., Brewer P. B., Puech-Pagès V., Dun E. A, Pillot J.
P., Letisse F., Matusova R., Danoun S., Portais J. C., Bouwmeester H., Bécard G.,
Beveridge C. A., Rameau C., Rochange S. F. (2008) Strigolactone inhibition of
shoot branching. Nature 455: 189-194
Goodner B., Hinkle G., Gattung S., Miller N., Blanchard M., Qurollo B.,
Goldman B. S., Cao Y., Askenazi M., Halling C., Mullin L., Houmiel K.,
Gordon J., Vaudin M., Iartchouk O., Epp A., Liu F., Wollam C., Allinger M.,

References
107
Doughty D., Scott C., Lappas C., Markelz B., Flanagan C., Chris Crowell C.,
Gurson J., Lomo C., Sear C., Strub G., Cielo C., Slater S. (2001) Genome
sequence of the plant pathogen and biotechnology agent Agrobacterium tumefaciens
C58. Science 294: 2323-2328
Gray E. J., Smith D. L. (2005) Intracellular and extracellular PGPR: commonalities
and distinctions in the plant-bacterium signaling processes. Soil Biol. Biochem. 37:
395-412
Griffiths B. S., Ritz K., Ebblewhite N., Dobson G. (1999) Soil microbial
community structure: effects of substrate loading rates. Soil Biol. Biochem. 31: 145–
153
Hallmann J., Berg B. (2007) Spectrum and population dynamics of bacterial root
endophytes. In: Schulz, B. J. E., Boyle C. J. C., Sieber T. N. (Eds.), Microbial Root
Endophytes. Springer, Berlin Heidelberg, pp. 15-31
Hardoim P. R., Van Overbeek L. S., Elsas J. D. (2008) Properties of bacterial
endophytes and their proposed role in plant growth. Trends Microbiol. 16: 463-471
Harman G. E., Howel C. H., Viterbo A., Chet I., Lorito M. (2004) Trichoderma
species–opportunistic, avirulent plant symbionts. Nat. Rev. Microbiol. 2: 43–56
Harrison M. J. (2005) Signaling in the arbuscular mycorrhizal symbiosis. Annu. Rev.
Microbiol. 59: 19–42
Hauck P., Thilmony R., and He S.Y. (2003) A Pseudomonas syringae type III
effector suppresses cell wall-based extracellular defense in susceptible Arabidopsis
plants. Proc. Natl. Acad. Sci. U.S.A. 100: 8577–8582

References
108
Heuer H., Krsek M., Baker P., Smalla K. (1997) Analysis of Actinomycete
communities by specific amplification of genes encoding 16S rRNA and
gel-electrophoretic separation in denaturing gradients. Appl. Environ. Microbiol. 63:
3233–3241
Hibbett D. S., Binder M., Bischoff J. F., Blackwell M., Cannon P. F., Eriksson O.
E., Huhndorf S., James T., Kirk P. M., Lücking R., Thorsten Lumbsch H.,
Lutzoni F., Matheny P. B., McLaughlin D. J., Powell M. J., Redhead S., Schoch C.
L., Spatafora J. W., Stalpers J. A., Vilgalys R., Aime M. C., Aptroot A., Bauer R.,
Begerow D., Benny G. L., Castlebury L. A., Crous P. W., Dai Y. C., Gams W.,
Geiser D. M., Griffith G. W., Gueidan C., Hawksworth D. L., Hestmark G.,
Hosaka K., Humber R. A., Hyde K. D., Ironside J. E., Kõljalg U., Kurtzman C. P.,
Larsson K. H., Lichtwardt R., Longcore J., Miadlikowska J., Miller A.,
Moncalvo J. M., Mozley-Standridge S., Oberwinkler F., Parmasto E., Reeb V.,
Rogers J. D., Roux C., Ryvarden L., Sampaio J. P., Schüssler A., Sugiyama J.,
Thorn R. G., Tibell L., Untereiner W. A., Walker C., Wang Z., Weir A., Weiss M.,
White M. M., Winka K., Yao Y. J., Zhang N. (2007) A higher-level phylogenetic
classification of the Fungi. Mycol. Res. 111: 509–547
Hildebrandt U., Janetta K., Bothe H. (2002) Towards growth of arbuscular
mycorrhizal fungi independent of a plant host. Appl. Environ. Microbiol. 68:1919–24
Hildebrandt U., Ouziad F., Marner F. J., Bothe H. (2006) The bacterium
Paenibacillus validus stimulates growth of the arbuscular mycorrhizal fungus Glomus
intraradices up to the formation of fertile spores. FEMS Microbiol. Lett. 254:258–67
Hoffman M. T., Arnold A. E. (2010) Diverse bacteria inhabit living hyphae of
phylogenetically diverse fungal endophytes. Appl. Environ. Microbiol. 76: 4063-4075
References
109
Holguin G., Glick B. R. (2001) Expression of the ACC deaminase gene from
Enterobacter cloacae UW4 in Azospirillum brasilense. Microbial. Ecol. 41: 281–288
Huang, Y. J., Pirie E. J., Evans N., Delourme R., King G. J., Fitt B. D. L. (2009)
Quantitative resistance to symptomless growth of Leptosphaeria maculans (phoma
stem canker) in Brassica napus (oilseed rape). Plant Pathol. 58: 314–323
Imaizumi-Anraku H., Takeda N., Charpentier M, Perry J, Miwa H, Umehara Y,
Kouchi H, Murakami Y, Mulder L., Vickers K., Pike J, Downie J. A., Wang T.,
Sato S., Asamizu E., Tabata S., Yoshikawa M., Murooka Y., Wu G. J., Kawaguchi
M., Kawasaki S., Parniske M., Hayashi M. (2005) Plastid proteins crucial for
symbiotic fungal and bacterial entry into plant roots. Nature 433: 527–531
Imani J., Berting A., Nitsche S., Schäfer S., Gerlich W. H., Neumann K.-H. (2002):
The integration of a major hepatitis B virus gene into cell-cycle synchronized carrot
cell suspension cultures and its expression in regenerated carrot plants. Plant Cell
Tissue Organ Cult. 71: 157-164
Iwasaki S., Kobayashi H., Furukawa J., Namikoshi M., Okuda S., Sato Z.,
Matsuda I., Noda T. (1984) Studies on macrocyclic lactone antibiotics.VII. Structure
of a phytotoxin “rhizoxin” produced by Rhizopus chinensis. J. Antibiot. 37:354–62
Iwasaki S., Namikoshi M., Kobayashi H., Furukawa J., Okuda S. (1986) Studies
on macrocyclic lactone antibiotics. VIII. Absolute structures of rhizoxin and a related
compound. J. Antibiot. 39: 424–29
Jacobs S., Zechmann B., Molitor A., Trujillo M., Petutschnig E., Lipka V., Kogel
K. H., Schäfer P. (2011) Broad-spectrum suppression of innate immunity is required

References
110
for colonization of Arabidopsis roots by the fungus Piriformospora indica. Plant
Physiol. 156: 726–740
Jan A. L. van Kan (2006) Licensed to kill: the lifestyle of a necrotrophic plant
pathogen. Trends Plant Sci. 11: 247-253
Janjusevic R., Abramovitch R. B., Martin G. B., Strebbins C. E. (2005) A
bacterial inhibitor of host programmed cell death defences is an E3 ubiquitin ligase.
Science 311: 222–226.
Javot H., Penmetsa R. V., Terzaghi N., Cook D. R., Harrison M. J. (2007) A
Medicago truncatula phosphate transporter indispensable for the arbuscular
mycorrhizal symbiosis. Proc. Natl Acad. Sci. U.S.A. 104: 1720–1725
Jefferson R. A. (1987) Assaying chimeric genes in plants: the GUS gene fusion
system. Plant Mol. Biol. Rep. 5: 387–405
Jones Jonathan D. G. and Dangl Jeffery L. (2006) The plant immune system.
Nature 444: 323-329
Kai K., Kasamatsu K., Hayashi H. (2012) (Z)-N-(4-Decenoyl) homoserine lactone,
a new quorum-sensing molecule, produced by endobacteria associated with
Mortierella alpina A-178. Tetrahedron Letters 53: 5441-5444
Kai K., Furuyabu K., Tani A., Hayashi H. (2012) Production of the quorum-sensing
molecules N-acylhomoserine lactones by endobacteria associated with Mortierella
alpine A-178. ChemBioChem 13: 1776-1784
Kamoun S. (2007) Groovy times: filamentous pathogen effectors revealed. Curr.
Opin. Plant Biol. 10: 358–365
References
111
Kanamori N. Madsen L. H., Radutoiu S., Frantescu M., Quistgaard E. M. H.,
Miwa H., Downie J. A., James E. K., Felle H. H., Haaning L. L., Jensen T. H.,
Sato S., Nakamura Y., Tabata S., Sandal N., Stougaard J. (2006) A nucleoporin is
required for induction of Ca2+ spiking in legume nodule development and essential
for rhizobial and fungal symbiosis. Proc. Natl Acad. Sci. U.S.A. 103: 359–364
Kijne, J. W. (1992) The Rhizobium infection process. In Biological Nitrogen
Fixation (Stacey, G. Burris, R.H. & Evans, H.J., eds), pp. 293–398. Chapman, New
York, USA
Kim K. Y., Jordan D., McDonald G. A. (1998) Effect of phosphatesolubilizing
bacteria and vesicular–arbuscular mycorrhizae on tomato growth and soil microbial
activity. Biol. Fertil. Soils 26: 79–87
Kisa M., Sanon A., Thioulouse J., Assigbetse K., Sylla S., Spichiger R., Dieng L.,
Berthelin J., Prin Y., Galiana A., Lepage M. (2007) Arbuscular mycorrhizal
symbiosis can counterbalance the negative influence of the exotic tree species
Eucalyptus camaldulensis on the structure and functioning of soil microbial
communities in a sahelian soil. FEMS Microbiol. Ecol. 62:32–44
Kistner, C., Winzer T., Pitzschke A., Mulder L., Sato S., Kaneko T., Tabata S.,
Sandal N., Stougaard J., Webb K. J., Szczyglowski K., Parniske M. (2005) Seven
Lotus japonicus genes required for transcriptional reprogramming of the root during
fungal and bacterial symbiosis. Plant Cell 17: 2217–2229
Kogel, K. H., Franken, P., Hueckelhoven R. (2006) Endophyte or parasite – what
decides? Curr Opin in Plant Biol. 9: 358-363
References
112
Kosuta, S., Chabaud M., Lougnon G., Gough C., Dénarié J., Barker D. G.,
Bécard G. (2003) A diffusible factor from arbuscular mycorrhizal fungi induces
symbiosis-specific MtENOD11 expression in roots of Medicago truncatula. Plant
Physiol. 131: 952–962
Kumar M., Yadav V., Tuteja N., Johri A. K. (2009) Antioxidant enzyme activities in
maize plants colonized with Piriformospora indica. Microbiol. 155: 780–790
Lackner G., Moebius N., Partida-Martinez L. P., Boland S., Hertweck C. (2011a)
Evolution of an endofungal lifestyle: deductions from the Burkholderia rhizoxinica
genome. BMC Genomics 12: 210
Lackner G., Moebius N., Partida-Martinez L. P., Hertweck C. (2011b) Complete
genome sequence of Burkholderia rhizoxinica, an endosymbiont of Rhizopus
microsporus. J. Bacteriol. 193: 783–84
Lackner G., Möbius N., Scherlach K., Partida-Martinez L. P., Winkler R.,
Schmitt I., Hertweck C. (2009) Global distribution and evolution of a toxinogenic
Burkholderia-Rhizopus symbiosis. Appl. Environ. Microbiol. 75: 2982–86
Lackner G., Partida-Martinez L. P., Hertweck C. (2009) Endofungal bacteria as
producers of mycotoxins. Trends Micorbiol. 17: 570-576
Lahrmann U., Ding Y., Banhara A., Rath M., Hajirezaei M. R., Döhlemann S.,
Von Wiren N., Parniske M., Zuccaro A. (2013) Host-related metabolic cues affect
colonization strategies of a root endophyte. Proc. Natl. Acad. Sci. U.S.A. 110: 13965–
13970
Lahrmann U., Zuccaro A. (2012) Opprimo ergo sum–evasion and suppression in the
References
113
root endophytic fungus Piriformospora indica. Mol. Plant Microbe Interact. 25: 727–
737
Lévy J., Bres C., Geurts R., Chalhoub B., Kulikova O., Duc G., Journet E., Ané
J., Lauber E., Bisseling T., Dénarié, J., Rosenberg C., Debellé F. (2004) A
putative Ca2+ and calmodulindependent protein kinase required for bacterial and
fungal symbioses. Science 303: 1361–1364
Lin Y. H., Xu J. L., Hu J. Y., Wang L. H., Ong S. L., Leadbetter J. R., Zhang L.
H. (2003) Acyl-homoserine lactone acylase from Ralstonia strain XJ12B represents a
novel and potent class of quorum-quenching enzymes. Mol. Microbiol. 47: 849–60
Livak K. J, Schmittgen T .D (2001) Analysis of relative gene expression data using
real-time quantitative PCR and the 2(-Delta Delta C(T)) Method. Methods (San Diego,
Calif) 25 (4):402-408
Lodewyckx C., Vangronsveld J., Porteous F., Moore E. R. B., Taghavi S.,
Mezgeay M., Van der Lelie D. (2002) Endophytic bacteria and their potential
applications. Crit. Rev. Plant Sci. 21: 583-606
Long, S. R. (1989) Rhizobium-legume nodulation: Life together in the underground.
Cell 56: 203–214
Long, S. R. (1996) Rhizobium symbioses: nod factors in perspective. Plant Cell 8:
1885–1898
Ludwig W., Amann R., Martines-Romero E., Schoenhuber A., Bauer S., Neef A.,
Schleifer K. H. (1998) rRNA based identification systems for rhizobia and other
bacteria. PI Soil 204: 1-9
References
114
Lugtenberg B., Kamilova F. (2009) Plant-Growth-Promoting Rhizobacteria. Annu.
Rev. Micorbiol. 63: 541-56
Lunau M., Lemke A., Walther K., Martens-Habbena W., Simon M. (2005) An
improved method for counting bacteria from sediments and turbid environments by
epifluorescence microscopy. Environ Microbiol 7: 961–968
Lusk C. P., Blobel G., King M. C. (2007) Highway to the inner nuclear membrane:
rules for the road. Nature Rev. Mol. Cell Biol. 8: 414–420
Ma W., Zalec K., Glick B. R. (2001) Biological activity and colonization pattern of
the bioluminesence-labeled plant growthpromoting bacterium Kluyvera ascorbata
SUD165/26. FEMS Microbiol. Ecol. 35: 137–144
Macdonald R. M., Chandler M. R. (1981) Bacterium-like organelles in the
vesicular-arbuscular mycorrhizal fungus Glomus caledonius. New Phytol. 89: 241-246
Manz W., Aman, R., Ludwig W., Vancanneyt M. Schleifer K. H. (1996).
Application of a suite of 16S rRNA-specific oligonucleotide probes designed to
investigate bacteria of the phylum Cytophaga-Flavobacter-Bacteroides in the natural
environment. Microbiol. 142: 1097-1106
Markmann K., Giczey G., Parniske M. (2008) Functional adaptation of a plant
receptor-kinase paved the way for the evolution of intracellular root symbioses with
bacteria. PLoS Biol. 6: e68
McCully M. E. (2001) Niches for bacterial endophytes in crop plants: a plant
biologist’s view. Aust. J. Plant Physiol. 28: 983–990
References
115
Mitra R. M., Gleason C. A., Anne Edwards A., Hadfield J., Downie J. A., Giles E.
D. Oldroyd G. E. D., Long S. R. (2004) A Ca2+/calmodulin-dependent protein
kinase required for symbiotic nodule development: gene identification by
transcript-based cloning. Proc. Natl Acad. Sci. U.S.A. 101: 4701–4705
Moebius N., Üzüm Z., Dijksterhuis J., Lackner G., Hertweck C. (2014) Active
invasion of bacteria into living fungal cells. eLife 3: e03007
Mosse B. (1970) Honey-coloured sessile Endogone spores: II. Changes in fine
structure during spore development. Arch. Mikrob. 74:129–45
Muyzer G., Smalla K. (1998) Application of denaturing gradient gel electrophoresis
(DGGE) and temperature gradient gel electrophoresis (TGGE) in microbial ecology.
Antonie van Leeuwenhoek 73: 127–141
Naito M., Morton J. B., Pawlowska T. E. (2015). Minimal genomes of
mycoplasma-related endobacteria are plastic and contain host-derived genes for
sustained life within Glomeromycota. Proc. Natl. Acad. Sci. U.S.A. 112: 7791–7796
Naumann M., Schuessler A., Bonfante P. (2010) The obligate endobacteria of
arbuscular mycorrhizal fungi are ancient heritable components related to the
Mollicutes. ISME J. 4: 860-871
Nautiyal C. S., Bhadauria S., Kumar P., Lal H., Mondal R. Verma D. (2000)
Stress induced phosphate solubilization in bacteria isolated from alkaline soils. FEMS
Microbiol. Lett. 182: 291–296
Newell C. A. (2000) Plant transformation technology. Mol. Biotechnol. 16: 53
References
116
Newton, A. C., Fitt, B. D. L., Atkins S. D., Walters D. R., Daniell T. J. (2010)
Pathogenesis, parasitism and mutualism in the trophic space of microbe–plant
interactions. Trends Microbiol. 18: 365-373
Oberwinkler F, Riess K, Bauer R, Garnica S. (2014). Morphology and molecules:
the Sebacinales, a case study. Mycol. Prog. 13: 445–470.
O’Callaghan K. J., Dixon R. A., Cocking E. C. (2001) Arabidopsis thaliana: a
model for studies of colonization by non-pathogenic and plant-growth-promoting
rhizobacteria. Aust. J. Plant Physiol. 28: 975–982
Oelmüller, R., Peškan-Berghöfer, T., Shahollaria, B., Trebicka, A., Sherameti, I.,
Varma, A. (2005) MATH domain proteins represent a novel protein family in
Arabidopsis thaliana, and at least one member is modified in roots during the course
of a plant–microbe interaction. Physiol. Plant 124: 152–166
Oke V., Long S. R. (1999) Bacteroid formation in the Rhizobium-legume symbiosis.
Curr. Opin. Microbiol. 2: 641
Okon Y., Bloemberg G. V., Lugtenberg B. J. J. (1998) Biotechnology of
biofertilization and phytostimulation. In Agricultural Biotechnology, ed. A Altman, pp.
327–49. New York: Marcel Dekker
Oldroyd G. E. D., Downie J. A. (2008) Coordinating nodule morphogenesis with
rhizobial infection in legumes. Annu. Rev. Plant Biol. 59: 519–546
Oldroyd G. E., Murray J. D., Poole P. S., Downie J. A. (2011) The rules of
engagement in the legume-rhizobial symbiosis. Annu. Rev. Genet. 45: 119–144

References
117
Ongena M., Jourdan E., Adam A., Paquot M., Brans A. (2007) Surfactin and
fengycin lipopeptides of Bacillus subtilis as elicitors of induced systemic resistance in
plants. Environ. Microbiol. 9: 1084–90
Panstruga R., Dodds P. N. (2009) Terrific protein traffic: the mystery of effector
protein delivery by filamentous plant pathogens. Science 324: 748–750
Parniske M. (2000) Intracellular accommodation of microbes by plants: A common
developmental program for symbiosis and disease? Curr. Opin. Plant Biol. 3: 320–
328
Parniske M. (2008) Arbuscular mycorrhiza: the mother of plant root endosymbioses.
Nat. Rev. Microbiol. 6: 763-775
Parniske M. (2005) Plant-fungal association: Cue for the branching connection.
Nature 435: 750–751
Partida-Martinez L. P., Groth I., Schmitt I., Richter W., Roth M., Hertweck C.
(2007a) Burkholderia rhizoxinica sp. nov. and Burkholderia endofungorum sp. nov.,
bacterial endosymbionts of the plant-pathogenic fungus Rhizopus microsporus. Int. J.
Syst. Evol. Microbiol. 57: 2583–90
Partida-Martinez L. P., Hertweck C. (2005) Pathogenic fungus harbours
endosymbiotic bacteria for toxin production. Nature 437: 884–88
Partida-Martinez L. P., Monajembashi S., Greulich K. O., Hertweck C. (2007b)
Endosymbiont-dependent host reproduction maintains bacterial-fungal mutualism.
Curr. Biol. 17: 773–77

References
118
Peiter E., Sun J., Heckmann A. B., Venkateshwaran M., Riely B. K., Otegui M. S.,
Edwards A., Freshour G., Hahn M. G., Cook D. R., Sanders D., Oldroyd G. E. D.,
Downie J. A., Ané J. M. (2007) The Medicago truncatula DMI1 protein modulates
cytosolic calcium signaling. Plant Physiol. 145: 192–203
Peškan-Berghöfer T., Shahollari B., Giong P. H., Hehl S., Markert C., Blanke V.,
Varma A. K., Oelmüller R. (2004) Association of Piriformospora indica with
Arabidopsis thaliana roots represents a novel system to study beneficial plant–
microbe interactions and involves early plant protein modifications in the
endoplasmatic reticulum and at the plasma membrane. Physiol. Plant. 122: 465–477
Pham G. H., Kumari R., Singh A., Mall, R., Prasad R., Sachdev M., Kaldorf M.,
Buscot F., Oelmuller R., Hampp R., et. al. (2004). Axenic culture of symbiotic
fungus Piriformospora indica. In Plant Surface Microbiol (Varma, A., Abbott, L,
Werner, D. and Hampp, R. (ed.) Berlin: Springer-Verlag, pp. 593–611
Pieterse C. MJ, Leon-Reyes A., Van der Ent S., Van Wees S. CM (2009)
Networking by small-molecule hormones in plant immunity. Nat. Chem.Biol. 5(5):
308-316
Pieterse C. M., Van Wees S. C., Van Pelt J .A., Knoester M., Laan R., Gerrits H.,
Weisbeek P .J., Van Loon L. C. (1998) A novel signaling pathway controlling
induced systemic resistance in Arabidopsis. Plant Cell 10: 1571-1580
Post L. E., Arfsten A. E., Davis G. R., Nomura M. (1980) DNA sequence of the
promoter region for the alpha ribosomal protein operon in Escherichia coli. J. Biol.
Chem. 255: 4653-4659
References
119
Pozo M. J., Azcon-Aguilar C. (2007) Unraveling mycorrhiza-induced resistance.
Curr. Opin. Plant Biol. 10: 393–398
Qiang X. Y., Weiss M., Kogel K. H., Schäfer P. (2012) Piriformospora indica—a
mutualistic basidiomycete with an exceptionally large plant host range. Mol. Plant
Pathol. 13(5): 508-518
Qiang X. Y., Zechmann B., Reitz M. U., Kogel K. H., Schäfer P. (2012) The
Mutualistic Fungus Piriformospora indica Colonizes Arabidopsis Roots by Inducing
an Endoplasmic Reticulum Stress–Triggered Caspase-Dependent Cell Death. Plant
Cell 24: 794–809
Radutoiu S., Madsen L. H., Madsen E. B., Jurkiewicz A., Fukai E., Quistgaard E.
M., Albrektsen A. S., James E. K., Thirup S., Stougaard J. (2007) LysM domains
mediate lipochitin–oligosaccharide recognition and Nfr genes extend the symbiotic
host range. EMBO J. 26: 3923–3935
Rae A. L., Bonfante-Fasolo P., Brewin N. J. (1992) Structure and growth of
infection threads in the legume symbiosis with Rhizobium leguminosarum. Plant J. 2:
385–395
Rafiqi M., Jelonek L., Akum F. N., Zhang F., Kogel K. H. (2013) Effector
candidates in the secretome of Piriformospora indica, a ubiquitous plant-associated
fungus. Front. Plant Sci. 4: 228
Ralph Panstruga (2003) Establishing compatibility between plants and obligate
biotrophic pathogens. Curr. Opin in Plant Biol. 6: 320-326
Redman R.S., Sheehan K.B., Stout R.G., Rodriguez R.J., Henson J.M. (2002)
Thermotolerance generated by plant/fungal symbiosis. Science 298: 1581
References
120
Roden J., Eardley L., Hotson A., Cao Y., Mudgett M. B. (2004) Characterization of
the Xanthomonas AvrXv4 effector, a SUMO protease translocated into plant cells.
Mol. Plant Microbe Interact. 17: 633–643.
Roesti D., Ineichen K., Braissant O., Redecker D.,Wiemken A., Araqno M. (2005)
Bacteria associated with spores of the arbuscular mycorrhizal fungi Glomus
geosporum and Glomus constrictum. Appl. Environ. Microbiol.71:6673–79
Rojo, E., R. Solano and J. J. Sanchez-Serrano (2003) Interactions between
signaling compounds involved in plant defense. J. Plant Growth Regul. 22: 82-98
Rosebrock T. R., Zeng L., Brady J. J., Abramovitch R. B., Xiao F., Martin G. B.
(2007) A bacterial E3 ubiquitin ligase targets a host protein kinase to disrupt plant
immunity. Nature 448 (7151):370-374
Rosenblueth M., Martinez-Romero E. (2006) Bacterial endophytes and their
interaction with hosts. Mol. Plant Microbe Interact. 19: 827-837
Roth L. E., Stacey G. (1989) Bacterium release into host cells of nitrogen-fixing
soybean nodules: The symbiosome membrane comes from three sources. Eur. J. Cell
Biol. 49: 13–23
Roux C., Bécard G., Séjalon-Delmas N. (2006) Strigolactones stimulate arbuscular
mycorrhizal fungi by activating mitochondria. PloS Biol. 4: 1239–1247
Rovira A. D. (1956) A study of the development of the root surface microflora during
the initial stages of plant growth. J. Appl. Bacteriol. 19: 72–79
Saito K., Makoto Yoshikawa M., Koji Yano K., Miwa H., Uchida H., Asamizu E.,
References
121
Shusei Sato S., Tabata S., Haruko Imaizumi-Anraku H., Umehara Y., Hiroshi
Kouchi H., Yoshikatsu Murooka Y., Szczyglowski K., Downie J. A., Martin
Parniske M., Makoto Hayashi M., Kawaguch M. (2007) NUCLEOPORIN85 is
required for calcium spiking, fungal and bacterial symbioses, and seed production in
Lotus japonicus. Plant Cell 19: 610–624
Sawada H., Ieki H., Oyaiizu H., Matsumoto S. (1993) Proposal for rejection of
Agrobacterium tumefaciens and revised description for the genus Agrobacterium and
for Agrobacterium radiobacter and Agrobacterium rhizogenes. Int. J. Syst. Bacteriol.
43: 694-702
Scannerini S, Bonfante P. (1991) Bacteria and bacteria like objects in
endomycorrhizal fungi (Glomaceae). In Symbiosis as Source of Evolutionary
Innovation: Speciation and Morphogenesis, ed. L Margulis, R Fester, pp. 273–87.
Scherlach K., Busch B., Lackner G., Paszkowski U., Hertweck C. (2012)
Symbiotic cooperation in the biosynthesis of a phytotoxin. Angew. Chem. Int. Ed. 51:
9615–18
Scherlach K., Partida-Martinez L. P., Dahse H. M., Hertweck C. (2006)
Antimitotic rhizoxin derivatives from a cultured bacterial endosymbiont of the rice
pathogenic fungus Rhizopus microsporus. J. Am. Chem. Soc. 128: 11529–36
Schmitt I., Partida-Martinez L. P., Winkler R., Voigt K., Einax E., Dölz F., Telle
S., Wöstemeyer J., Hertweck C. (2008) Evolution of host resistance in a
toxin-producing bacterial-fungal alliance. ISME J. 2: 632–41
Schrey S. D., Tarkka M. T. (2008) Friends and foes: streptomycetes as modulators of
plant disease and symbiosis. Antonie van Leeuwenhoek 94:11–19
References
122
Schäfer P., Kogel, K. H. (2009) The sebacinoid fungus Piriformospora indica: an
orchid mycorrhiza which may increase host plant reproduction and fitness. In: The
Mycota, Vol. 5, Plant Relationships (Deising, H.B. and Esser, K., eds), pp. 99–112.
Heidelberg: Springer-Verla
Schäfer P., Pfiffi S., Voll L. M., Zajic D., Chandler P. M., Waller F., Scholz U.,
Pons-kühneann J., Sonnewald S., Sonnewald U., Kogel K. H. (2009) Manipulation
of plant innate immunity and gibberellin as factor of compatibility in the mutualistic
association of barley roots with Piriformospora indica. Plant J. 59: 461–474
Schübler A., Schwarzott D., Walker C. (2001) A new fungal phylum, the
Glomeromycota: phylogeny and evolution. Mycol. Res. 105: 1413–1421
Schueßler A. (2002) Molecular phylogeny, taxonomy, and evolution of arbuscular
mycorrhiza fungi and Geosiphon pyriformis. Plant Soil 244:75–83
Schwessinger B, Zipfel C (2008) News from the frontline: recent insights into
PAMP-triggered immunity in plants. Curr. Opin. Plant Biol. 11 (4):389-395
Segarra, G., Van der Ent S., Trillas I., Pieterse C. M. J. (2009) MYB72, a node of
convergence in induced systemic resistance triggered by a fungal and a bacterial
beneficial microbe. Plant Biol. 11: 90–96
Serfling A., Wirsel S. G., Lind V., Deising H. B. (2007) Performance of the
biocontrol fungus Piriformospora indica on wheat under greenhouse and field
conditions. Phytopathology 4: 523–531
References
123
Shahollari, B., Vadassery, J., Varma, A. and Oelmüller, R. (2007) A leucine-rich
repeat protein is required for growth promotion and enhanced seed production
mediated by the endophytic fungus Piriformospora indica in Arabidopsis thaliana.
Plant J. 50: 1–13
Sharma M., Kogel K. H. (2009) Fungal isolates of the order Sebacinales provide
growth promotion and systemic disease resistance to barley. In: Biological control of
fungal and bacterial plant pathogens. IOBC/WPRS Bull. 43: 211–215
Sharma M., Schmid M., Rothballer M., Hause G., Zuccaro A., Imani J.,
Kämpfer P., Domann E., Schäfer P., Hartmann A., Kogel K. H. (2008) Detection
and identification of bacteria intimately associated with fungi of the order Sebacinales.
Cell Microbio.l 11: 2235-2246
Shephard R. W., Lindow S. (2008) Two dissimilarN-acyl-homoserine lactone
acylases of Pseudomonas syringae ninfluence colony and biofilm morphology. Appl.
Environ. Microbiol. 74: 6663–71
Siciliano V., Genre A., Balestrini R., Cappellazzo G., Dewit P. J. G. M., Bonfante
P. (2007) Transcriptome analysis of arbuscular mycorrhizal roots during development
of the prepenetration apparatus. Plant Physiol. 144: 1455–1466
Singh B. K., Nunan N., Ridgway K. P., McNicol J., Young J. P., Daniell T. J.,
Prosser J. I., Millard P. (2008) Relationship between assemblages of mycorrhizal
fungi and bacteria on grass roots. Environ. Microbiol. 10:534–41
Singh S., Katzer K., Lambert J., Cerri M., Parniske M. (2014) CYCLOPS, a
DNA-binding transcriptional activator, orchestrates symbiotic root nodule

References
124
development. Cell Host Microbe 15: 139–152
Singh S., Parniske M. (2012) Activation of calcium- and calmodulin- dependent
protein kinase (CCaMK), the central regulator of plant root endosymbiosis. Curr.
Opin. Plant Biol. 15: 444–453
Slater S., Setubal J. S., Goodner B., Houmiel K., Jian Sun J., Kaul R., Goldman
B. S., Farrand S. K., Jr. N. A., Burr T., Nester E., Rhoads D. M., Kadoi R.,
Ostheimer T., Pride N., Sabo A., Henry E., Telepak E., Cromes L., Harkleroad A.,
Oliphant L., Pratt-Szegila P., Welch R., Woodf D. (2013) Reconciliation of
sequence data and updated annotation of the genome of Agrobacterium tumefaciens
C58, and distribution of a linear chromosome in the genus Agrobacterium. Appl.
Environ. Microbiol. 79: 1414-1417
Smit P., Limpens E., Geurts R., Fedorova E., Dolgikh E., Gough C., Bisseling T.
(2007) Medicago LYK3, an entry receptor in rhizobial nodulation factor signaling.
Plant Physiol. 145: 183–191
Solaiman M. D. Z., Saito M. (1997) Use of sugars by intraradical hyphae of
arbuscular mycorrhizal fungi revealed by radiorespirometry. New Phytol. 136: 533–
538
Sowley E. N. K., Dewey F. M., Shaw M. W. (2010) Persistent, symptomless,
systemic, and seed-borne infection of lettuce by Botrytis cinerea. Eur. J. Plant Pathol.
126: 61-71
Spaink H. P., Kondorosi A., Hooykaas P. J. J. (1998) The Rhizobiaeceae. Dordrecht,
The Netherlands: Kluwer Acad
References
125
Spencer D., James E. K., Ellis G. J., Shaw J. E., Sprent J. I. (1994) Interaction
between rhizobia and potato tissues. J. Exp. Bot. 45: 1475–1482
Staskawicz B. J., Mudgett M. B., Dangl J. L., Galan J. E. (2001) Common and
contrasting themes of plant and animal diseases. Science 292: 2285-2289
Stein E., Molitor A., Kogel K. H., Waller F. (2008) Systemic resistance in
Arabidopsis conferred by the mycorrhizal fungus Piriformospora indica requires
jasmonic acid signaling and the cytoplasmic function of NPR1. Plant Cell Physiol. 11:
1747–1751
Sun, T.P. (2008) Gibberellin metabolism, perception and signaling pathways in
Arabidopsis. In: The Arabidopsis Book. Rockville, MD: American Society of Plant
Biologists. DOI/10.1199/tab.0103
Tavaria F. K., Zuberer D. A. (1998) Effect of low pO2 on colonization of maize
roots by a genetically altered Pseudomonas putida [PH6(L1019)]. Biol. Fert. Soils. 26:
43–49
Ton J., Van Pelt J. A., Van Loon L. C., Pieterse C. M. J. (2002) Differential
effectiveness of salicylate-dependent and jasmonate/ethylene-dependent induced
resistance in Arabidopsis. Mol. Plant Microbe Interact. 15: 27–34
Topping J. F., Wei W., Clarke M. C., Muskett P., Lindsey K. (1995)
Agrobacterium-mediated transformation of Arabidopsis thaliana. Methods Mol. Biol.
49: 63
Torres-Cortés G., Ghignone S., Bonfante P., Schüßler A. (2015). Mosaic genome
of endobacteria in arbuscular mycorrhizal fungi: Transkingdom gene transfer in an
References
126
ancient mycoplasma-fungus association. Proc. Natl. Acad. Sci. U.S.A. 112: 7785–
7790
Varma S., Varma A., Rexe, K. H., Hassel A., Kost G., Sarabhoy A., Bisen P.,
Beutehorn B., Franken P. (1998). Piriformospora indica, gen. et sp. nov., a new
root-colonizing fungus. Mycologia. 90: 896-903
Verna J., Lodder A., Lee K., Vagts A., Ballester R. (1997) A family of genes
required for maintenance of cell wall integrity and for the stress response in
Saccharomyces cerevisiae. Proc. Natl. Acad. Sci. U.S.A. 94: 13804–13809
Vesterg˚ard M., Henry F., Rangel-Castro J. I., Michelsen A., Prosser J. I.,
Christensen S. (2008) Rhizosphere bacterial community composition responds to
arbuscular mycorrhiza, but not to reductions in microbial activity induced by foliar
cutting. FEMS Microbiol. Ecol. 64:78–89
_
Umehara M., Hanada A., Yoshida S., Akiyama K., Arite T., Takeda-Kamiya N.,
Magome H., Kamiya Y., Shirasu K., Yoneyama K., Kyozuka J., Yamaguchi S.
(2008) Inhibition of shoot branching by new terpenoid plant hormones. Nature 455:
195-200
Uren N. C. (2007) Types, amounts, and possible functions of compounds released
into the rhizosphere by soil-grown plants. In The Rhizosphere. Biochemistry and
Organic Substances at the Soil-Plant Interface, ed. R Pinton, Z Varanini, P Nannipieri,
pp. 1–21. Boca Raton, FL: CRC Press/Taylor & Francis Group. 2nd ed.
Vadassery, J., Tripathi, S., Prasad, R., Varma, A. and Oelmüller, R. (2009a)
Monodehydroascorbate reductase 2 and dehydroascorbate reductase 5 are crucial for a
mutualistic interaction between Piriformospora indica and Arabidopsis. J. Plant

References
127
Physiol. 166: 1263–1274
Vadassery, J., Ranf, S., Drzewiecki, C., Mithöfer, A., Mazars, C., Scheel, D., Lee,
J., Oelmüller, R. (2009b) A cell wall extract from the endophytic fungus
Piriformospora indica promotes growth of Arabidopsis seedlings and induces
intracellular calcium elevation in roots. Plant J. 59: 193–206
Vadassery, J., Ritter, C., Venus, Y., Camehl, I., Varma, A., Shahollari, B., Novák,
O., Strnad, M., Ludwig-Müller, J. and Oelmüller, R. (2008) The role of auxins and
cytokinins in the mutualistic interaction between Arabidopsis and Piriformospora
indica. Mol. Plant–Microbe Interact. 21: 1371–1383
Van der Ent, S., Van Wees S. C. M., Pieterse C. M. J. (2009) Jasmonate signaling
in plant interactions with resistance-inducing beneficial microbes. Phytochemistry 70:
1581–1588
Van Loon L. C., Bakker P. A. H. M., Pieterse C. M. J. (1998) Systemic resistance
induced by rhizosphere bacteria. Annu. Rev. Phytopathol. 36: 453–483
Van Oosten V. R., Bodenhausen N., Reymond P., Van Pelt J. A., Van Loon L. C.,
Dicke M., Pieterse C. M. J. (2008) Differential effectiveness of microbially induced
resistance against herbivorous insects in Arabidopsis. Mol. Plant Microbe Interact. 21:
919–930
Van Peer R., Niemann G. J., Schippers B. (1991) Induced resistance and
phytoalexin accumulation in biological control of Fusarium wilt of carnation by
Pseudomonas sp. strain WCS417r. Phytopathology 81: 728–34
Van Rhijn P., Vanderleyden J. (1995) The Rhizobium-plant symbiosis. Microbiol.
References
128
Rev. 59: 124–42
Van Wees S. C. M., Van der Ent S., Pieterse C. M. J. (2008) Plant immune
responses triggered by beneficial microbes. Curr. Opin. Plant Biol. 11: 443–448
Varma A, Bakshi M, Lou B, Hartmann A, Oelmueller R. (2012). Piriformospora
indica: A novel plant growth promoting mycorrhizal fungus. Agric. Res. 1: 117–131
Varma A., Verma S., Sudha, Sahay N., Bütehorn B., Franken P. (1999)
Piriformospora indica, a cultivable plant-growth-promoting root endophyte. Appl.
Environ. Microbiol. 65: 2741–2744
Vasse J., De Billy F., Camut S., Truchet G. (1990) Correlation between
ultrastructural differentiation of bacteroids and nitrogen fixation in alfalfa nodules. J
Bacteriol. 172: 4295–4306
Verma, S., Varma, A., Rexer, K.-H., Hassel, A., Kost, G., Sarbhoy, A., Bisen, P.,
Bütehorn, B. and Franken, P. (1998) Piriformospora indica, gen. et sp. nov., a new
root-colonizing fungus. Mycologia. 90: 896–903
Vernooij B., Friedrich L., Morse A., Reist R., Kolditz-Jawhar R., Ward E., Uknes
S., Kessmann H., Ryals J. (1994) Salicylic acid is not the translocated signal
responsible for inducing systemic acquired resistance but is required in signal
transduction. Plant Cell 6: 959-965
Vessey J. K., Buss T. J. (2002) Bacillus cereus UW85 inoculation effects on growth,
nodulation, and N accumulation in grain legumes: Controlled-environment studies.
Can. J. Plant Sci. 82: 282–290
References
129
Von Wiren N., Khodr H., Hider R. C. (2000) Hydroxylated phytosiderophore
species possess an enhanced chelate stability and affinity for iron(III). Plant Physiol.
124: 1149–1157
Waller F., Achatz B., Baltruschat H., Fodor J., Becker K., Fischer M., Heier T.,
Hückelhoven R., Neumann C., Von Wettstein D., Franken P., Kogel K. H. (2005)
The endophytic fungus Piriformospora indica reprograms barley to salt-stress
tolerance, disease resistance, and higher yield. Proc. Natl. Acad. Sci. U.S.A. 102:
13386–13391
Walters, D. R., McRoberts N., Fitt B. D. L. (2008) Are green islands red herrings?
Significance of green islands in plant interactions with pathogens and pests. Biol. Rev.
83: 79–102
Weiß M., Selosse M. A., Rexer K. H., Urban A., Oberwinkler F. (2004)
Sebacinales-a hitherto overlooked cosm of heterobasidiomycetes with a broad
mycorrhizal potential. Mycol. Res. 108: 1003–1010
Weyens N., Van der Lelie D., Taghavi S., Newman L., Vangronsveld J. (2009)
Exploiting plant-microbe partnerships to improve biomass production and
remediation. Trends Biotechnol. 27: 591–598
Wood D. W., Setubal J. S., Kaul R., Monks D. E., Kitajima J. P., Okura V. K.,
Zhou Y., Chen L., Wood G. E., Jr. N. F. A., Woo L., Chen Y., Paulsen I. T., Eisen J.
A., Karp P. D., Sr. D. B., Chapman P., Clendenning J., Deatherage G., Gillet W.,
Grant C., Kutyavin T., Levy R., Li M. J., McClelland E., Palmieri A., Raymond
C., Rouse G., Saenphimmachak C., Wu Z., Romero P., Gordon D., Shiping
Zhang S., Heayun Yoo H., Tao Y., Biddle P., Mark Jung M., Krespan W., Perry
M., Gordon-Kamm B., Liao L., Kim S., Hendrick C., Zhao Z. Y., Dolan M.,
References
130
Chumley F., Tingey S. V., Tomb J. F., Gordon M. P., Olson M. V., Nester E. W.
(2001) The genome of the natural genetic engineer Agrobacterium tumefaciens C58.
Science 294: 2317-2323
Xu H. L. (2000) Soil–root interface water potential in sweet corn as affected by
organic fertilizer and a microbial inoculant. J. Crop Prod. 3: 139–156
Yadav V., Kumar M., Deep D. K., Kumar H., Sharma R., Tripathi T., Tuteja N.,
Saxena A.K., Johri, A.K. (2010) A phosphate transporter from the root endophytic
fungus Piriformospora indica plays a role in phosphate transport to the host plant. J.
Biol. Chem. 285: 26 532–26 544
Yamamura N. (1997) Diversity and evolution of symbiotic interactions, p. 75-82. In
T. Abe, S. A. Levin and M. Higashi (ed), Biodiversity: an ecological perspective.
Springer, New York, N.Y.
Yang B., Zhu W., Johnson L. B., White F. F. (2000) The virulence factor AvrXa7 of
Xanthomonas oryzae pv. oryzae is a type III secretion pathway-dependent
nuclear-localized double-stranded DNA-binding protein. Proc. Natl. Acad. Sci. U.S.A.
97: 9807–9812
Yang, J., Kloepper J. W., Ryu C. M. (2009) Rhizosphere bacteria help plants
tolerate abiotic stress. Trends Plant Sci. 14: 1–4
Ye W, Shen CH, Lin Y, Chen PJ, Xu X, Oelmüller R., Yeh K. W., Lai Z. (2014).
Growth promotion-related miRNAs in Oncidium orchid roots colonized by the
endophytic fungus Piriformospora indica. PLoS One 9: e84920
Young J. M., Kuykendall L. D., Martinez-Romero E., Kerr A., Sawada H. (2001)
References
131
A revision of Rhizobium Frank 1889, with an emended description of the genus, and
the inclusion of all species of Agrobacterium Conn 1942 and Allorhizobium undicola
de Lajudie et al. 1998 as new combinations: Rhizobium radiobacter, R. rhizogenes, R.
rubi, R. undicola and R. vitis. Int. J. Syst. Evol. Microbiol. 51: 89
Zipfel C., Felix G. (2005) Plants and animals: a different taste for microbes? Curr.
Opin. Plant Biol. 8: 353-360
Zipfel C, Kunze G, Chinchilla D, Caniard A, Jones JD, Boller T, Felix G (2006)
Perception of the bacterial PAMP EF-Tu by the receptor EFR restricts
Agrobacterium-mediated transformation. Cell 125 (4):749-760
Zuccaro A., Basiewicz M., Zurawska M., Biedenkopf D., Kogel K. H. (2009)
Karyotype analysis, genome organization, and stable genetic transformation of the
root colonizing fungus Piriformospora indica. Fungal Genet. Biol. 46: 543-550
Zuccarol A., Lahrmann1 U., Güldener U., Langen G:, Pfiffi1 S., Biedenkopf D.,
Wong P., Samans B., Grimm C., Basiewicz M., Murat C., Martin F., Kogel K. H.
(2011) Endophytic Life Strategies Decoded by Genome and Transcriptome Analyses
of the Mutualistic Root Symbiont Piriformospora indica. 7: e1002290
Zupan J., Muth T. R., Draper O., Zambryski P. (2000) The transfer of DNA from
Agrobacterium tumefaciens into plants: a feast of fundamental insights. Plant J. 23:
11

Supplement
132
7 Supplement
Fig. 7.1. FISH analysis of endobacteria in P. indica by confocal laser scanning microscopy
(CLSM). P. indica material was fixed and hybridized with probe EUB-338-Cy3. Endobacteria in
fungal mycelium were detected under UV (A and D), and under light microscope (B and E). The
fluorescence pictures overlaid with light pictures showed in figure C and F. CLSM was at 5000-fold
magnification.
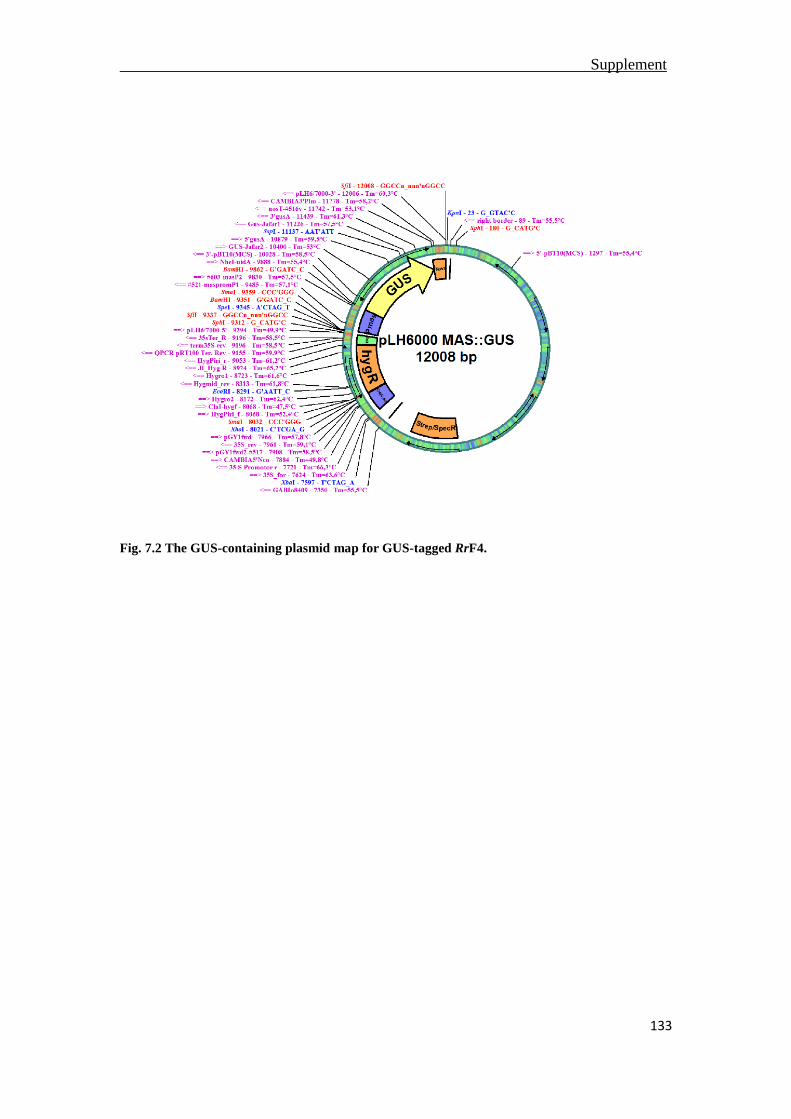
Supplement
133
Fig. 7.2 The GUS-containing plasmid map for GUS-tagged RrF4.
Erklärung
134
8 Erklärung
Ich erkläre:Ich habe die vorgelegte Dissertation selbständig und ohne unerlaubte
fremde Hilfe und nur mit den Hilfen angefertigt, die ich in der Dissertation angegeben
habe. Alle Textstellen, die wörtlich oder sinngemäß aus veröffentlichten Schriften
entnommen sind, und alle Angaben, die auf mündlichen Auskünften beruhen, sind als
solche kenntlich gemacht. Bei den von mir durchgeführten und in der Dissertation
erwähnten Untersuchungen habe ich die Grundsätze guter wissenschaftlicher Praxis,
wie sie in der „Satzung der Justus-Liebig-Universität Gießen zur Sicherung guter
wissenschaftlicher Praxis“ niedergelegt sind, eingehalten.“
Gießen, Feb 2016
Huijuan Guo

Acknowledgements
135
9 Acknowledgements
Here I would like to acknowledge all of the people who have given me help directly
or indirectly during my whole PhD study in Germany. I could not have reached so far
without your support, guidance and encouragement.
Please allow me to express my deepest appreciation to Prof. Dr. Karl-Heinz Kogel. It
is you who give me a chance to study in such a beautiful land and access to different
cultures and nice people. Your outstanding supervision and endless support on
academic throughout the past three and half years are the motivation for me to step
further. Your meticulous suggestions and sustained patients allow me to grow as a
young research scientist. You are and will always be the scholarly mentor in my life.
I am very grateful to my second supervisor Prof. Dr. Dr.-Ing. Peter Kämpfer in the
institute of applied microbiology. You kindly allow me to work in your laboratory
from time to time and provide me all the stuff that I need for the experiment there.
My gratitude to Dr. Stefanie P. Glaeser. Without your professional guidance, creative
ideas and scientific enthusiasm, the dissertation would not have been possible. You
teach me how to think logically and express myself properly facing with scientific
questions. I really appreciate your immeasurable help and persistent support to me.
Many thanks also go to Dr. Jafargholi Imani, you have guided me into this research
project and helped me a lot at the beginning of my study. You keep on giving me
unconditional assist in the research and personal life all the time. My thanks go to Dr.
Martin Hardt for your professional support on microscopy analysis.
It is my pleasure to thank Ute Micknass, Christina Birkenstock, Eugen Swidtschenko,
Cornelia Dechert, Christina Neumann, Dagmar Biedenkopf, Martina Claar and Elke
Stein for providing me the excellent technical supports.
Gratitude to my dear coleagures and friends in phytopathology institute, Dr. Ibrahim
Alabid, Neelendra Kumar, Meysam Taghinasab-Darziand, Fei Zhang and so on.
Gratitude to the coleagures in the institute of applied microbiology, Hossein Haghighi,
Ebru Cevik, Olga Budich and Anna Baum. Thank you all for your kind help and

Acknowledgements
136
support in my study and daily life.
I sincerely thank to all of my friends, Isabelle Damm, Aysel Ashir, Onur Rakan,
Xiaodan Zhou, Feng Zhang and many others whose name I can not list here, your
company and friendship are the treasure for me. Thank you all for giving me such a
memorable experience in Giesen.
Most importantly, I would like to express my gratitude to my famiy in China. All of
my achievements are not possible without the love, patient, encouragement and
support from you. My sweet and cute nephew, you are the sunshine in my life. I wish
you grow up happily and healthily in our harmonious family with full of love.
Special thanks to my fiance Kristaps Blums, your unconditional love are the power of
source for me to move on all the time. I could not approach my doctoral degree
without your endless patient and encourangement.