investigation of the time-dependent longitudinal flexural
TRANSCRIPT

Investigation of the Time-Dependent Longitudinal
Flexural Behavior of the Varina-Enon Bridge
Seth Michael Lindley
Thesis submitted to the faculty of the Virginia Polytechnic Institute and State University in
partial fulfillment of the requirements for the degree of
Master of Science
In
Civil Engineering
Carin L. Roberts-Wollmann (Chair)
Ioannis Koutromanos
Matthew H. Hebdon
June 6th, 2019
Blacksburg, VA
Keywords: Prestressed concrete, Prestress loss, Creep, Shrinkage, Varina-Enon,

Investigation of the Time-Dependent Longitudinal
Flexural Behavior of the Varina-Enon Bridge
Seth M. Lindley
ACADEMIC ABSTRACT
Prestress loss due to creep, shrinkage, and relaxation can cause serviceability issues, and in the case
of externally post-tensioned structures, can reduce the flexural capacity. The accurate estimation of these
prestress losses is vital for making good decisions about the remaining life of a structure.
The Varina-Enon Bridge is a post-tensioned concrete box-girder bridge in Richmond Virginia.
Flexural cracks in the bridge prompted an investigation into the magnitude of prestress loss experienced by
the structure. Long-term prestress losses are estimated using two methods. First, a finite element model is
created, and multiple code expressions for creep and shrinkage are applied to a time-step analysis of the
structure. The code expressions investigated in this thesis are taken from the CEB-FIP 1978, CEB-FIB
1990, and AASHTO codes. The second method utilizes data from sensors previously installed on the bridge
to back-calculate the effective prestressing force.
The analysis utilizing the CEB-FIP 78 code expression for creep and shrinkage estimated prestress
loss of 41.9 ksi. This represents the model code used in the original design of the Varina-Enon Bridge. The
analyses utilizing the CEB-FIP ’90 and AASHTO code expressions estimated prestress losses of 43.3 ksi
and 38.1 ksi respectively. Lastly the average prestress loss calculated from the field data was found to be
47.3 ksi. It can be seen that all three finite element analyses underestimated prestress loss compared to the
results of field data estimations, but given the level of uncertainty in each estimation method, the results
are considered to match well. Flexural capacity using the prestress loss estimated by the field measurement
system meets AASHTO Strength I Load Combination demands, with demand-to-capacity ratios of 0.95
and 0.147, for positive and negative critical sections respectively.
Investigation of the Time-Dependent Longitudinal
Flexural Behavior of the Varina-Enon Bridge
Seth M. Lindley
GENERAL ABSTRACT
Post-tensioned concrete is a building technology which provides a compressive force to concrete
via steel tendons. This combination of steel and concrete allows for the construction of lighter and stiffer
structures. Post-tensioned concrete is widely utilized throughout the United States highway system and
bridge construction. Over time, the force in the prestressing strands is reduced by delayed strains in the
concrete. The accurate estimation of this prestress loss is vital for making good decisions about the
remaining capacity of a structure and the infrastructure system at large.
The Varina-Enon Bridge is a post-tensioned concrete box-girder bridge in Richmond Virginia.
Cracks in the bridge prompted an investigation into the magnitude of prestress loss experienced by the
structure. To estimate prestress loss, a computer model of the structure was created. In addition, data from
sensors previously installed on the bridge were used to back calculate prestress loss.
It was found that the estimation of losses from the field closely matched those estimated at the
construction of the bridge. Additionally, more updated loss models estimated similar, or slightly smaller
values for prestress loss.

iv
ACKNOWLEDGEMENTS
I would like to thank the Virginia Department of Transportation for their support on this project,
providing documentation on the design and construction of the Varina-Enon Bridge. I would also like to
thank Nishant Tamakuwala who’s work and report on the Varina-Enon Bridge, though unpublished,
provided preliminary information for this thesis. Thank you also to Drs. Roberts-Wollmann and
Koutromanos for your guidance and support throughout this process. I learned a great deal from both of
your expertise.
Lastly, I would like to thank Leah. Your support brings completeness to my life in the most difficult
of times.
v
TABLE OF CONTENTS
TABLE OF CONTENTS ................................................................................................................ v
LIST OF FIGURES ..................................................................................................................... viii
LIST OF TABLES ......................................................................................................................... ix
Introduction ............................................................................................................... 1
1.1 Motivation ........................................................................................................................ 1
1.1.1 Prestress Loss ................................................................................................................ 1
1.2 Varina-Enon Bridge ......................................................................................................... 2
1.3 Purpose, and Scope .......................................................................................................... 5
Literature Review...................................................................................................... 6
2.1 Creep and Shrinkage ........................................................................................................ 6
2.1.1 Review of Creep and Shrinkage Models ....................................................................... 7
2.1.2 Comparison of Creep Compliance Functions ............................................................... 8
2.2 Prestress Losses ................................................................................................................ 9
2.3 Measuring Effective Prestress Force .............................................................................. 10
2.3.1 Embedded Vibrating Wire Gage Measurement .......................................................... 10
2.3.2 Method Utilizing Crack Re-opening ........................................................................... 11
2.3.3 Research Employing Crack Re-opening Tests ............................................................ 12
2.4 Creep in Long-Span Structures ...................................................................................... 14
2.5 Thermal Gradients .......................................................................................................... 15
2.6 The Varina-Enon Bridge ................................................................................................ 17
Methodology ........................................................................................................... 19
3.1 Long-Term Monitoring System ..................................................................................... 19
3.1.1 LVDTs ........................................................................................................................ 20
3.1.2 Thermocouples ............................................................................................................ 20
vi
3.1.3 Strain Transducers ....................................................................................................... 21
3.1.4 Data Collection ........................................................................................................... 22
3.1.5 Data Processing ........................................................................................................... 22
3.2 Finite Element Model ..................................................................................................... 24
3.2.1 Finite Element Model Overview ................................................................................. 24
3.2.2 Staged Construction Analysis ..................................................................................... 25
3.2.3 Short-Term Prestress Losses ....................................................................................... 27
3.2.4 Long-Term Prestress Loss........................................................................................... 28
3.3 Effective Prestress from Field Data ............................................................................... 28
3.3.1 Overview ..................................................................................................................... 28
3.3.2 Section Properties ....................................................................................................... 29
3.3.3 Self-Weight Moment ................................................................................................... 29
3.3.4 Live Load Moment ...................................................................................................... 30
3.3.5 Self-Equilibrating Stresses .......................................................................................... 30
3.3.6 Thermal Continuity Forces ......................................................................................... 32
3.3.7 Secondary Prestress, creep, and shrinkage effects ...................................................... 33
3.4 Re-Installation of the Long-Term System ...................................................................... 34
Results and Discussion ........................................................................................... 35
4.1 Validation of the Finite Element Model ......................................................................... 35
4.2 Finite Element Results ................................................................................................... 36
4.3 Field Measurement Results ............................................................................................ 38
4.3.1 Comparison of Prestress Values Calculated from 2013 and 2019 Data Sets .............. 41
4.4 Finite Element and Field Data Comparison ................................................................... 43
4.5 Flexural strength ............................................................................................................. 43
Summary, Conclusions, and Recommendations for Future Work ........................ 44
5.1 Summary ........................................................................................................................ 44

vii
5.2 Conclusions .................................................................................................................... 44
5.2.1 Expected and measured prestress ................................................................................ 44
5.2.2 Future bridge performance. ......................................................................................... 45
5.3 Recommendations for Future Work ............................................................................... 46
BIBLIOGRAPHY ......................................................................................................................... 47
Appendix A. Creep and Shrinkage Models .............................................................................. 49
Appendix B. Finite Element Model Report .............................................................................. 62
Appendix C. Original Drawings of Sections and Tendon Profiles ........................................... 94
Appendix D. Sample Calculation of Effective Prestress ........................................................ 100
Appendix E. Sample Calculation of Flexural Capacity.......................................................... 104
viii
LIST OF FIGURES
Figure 1.1. (Left) Koror-Babeldaob Bridge prior to collapse. (right) Koror-Babeldaob Bridge after collapse.
(OPAC 2000) ................................................................................................................................................ 2
Figure 1.2. Aerial view of the Varina-Enon Bridge over the James River. .................................................. 2
Figure 1.3. Elevation of the southernmost approach unit. ............................................................................ 3
Figure 1.4. Construction of approach spans (F&M Engineers 1993). .......................................................... 3
Figure 1.5. Typical approach-unit, precast section. ...................................................................................... 4
Figure 1.6. Section view of Span 6, (tendons shown by the dashed line). .................................................... 4
Figure 2.1. Creep and shrinkage response with respect to time (Bažant and Jirasek 2018). ........................ 6
Figure 2.2. Comparison of compliance functions. ........................................................................................ 8
Figure 2.3. Testing configuration employed by Pessiki et al. (1996). ........................................................ 11
Figure 2.4. Prestress loss estimations on the Koror-Babeldaob Bridge. ..................................................... 15
Figure 2.5. Factors which affect thermal gradients. .................................................................................... 16
Figure 3.1. Span 6 longitudinal sensor layout. ............................................................................................ 20
Figure 3.2. Section A-A sensor layout. ....................................................................................................... 20
Figure 3.3. Example of data for a typical load event. ................................................................................. 23
Figure 3.4. Example of data which was filtered out. .................................................................................. 23
Figure 3.5. Overview of the FE model. ....................................................................................................... 24
Figure 3.6. Tendon S6-T9L stress profile. .................................................................................................. 27
Figure 3.7. Cracked section used in the analysis. ....................................................................................... 29
Figure 3.8. Dead-load moment in Span 6. .................................................................................................. 30
Figure 3.9. Span 6, max moment envelope. ................................................................................................ 30
Figure 3.10. Strain difference that results in self-equilibrating stress. ........................................................ 31
Figure 3.11. Thermal continuity moments normalized by the applied thermal moment. ........................... 33
Figure 3.12. Sensors re-installed on to the Span-6, long-term monitoring system. .................................... 34
Figure 4.1. Span 6 tendon-stress profiles taken at 9,500 days. ................................................................... 36
Figure 4.2. Progression of prestress loss with time, at Section A-A of Span 6. ......................................... 37
Figure 4.3. Progression of mid-span deflections in Span 6......................................................................... 37
Figure 4.4. Effective prestress vs. crack opening for all 2013 events. ........................................................ 38
Figure 4.5. Histogram of prestress values for all 2013 events. ................................................................... 39
Figure 4.6. Frequency of crack displacement widths for all 2013 events. .................................................. 40
Figure 4.7. Histogram of effective prestress for 2013 events with corresponding crack openings of 0.002
in. or greater. ............................................................................................................................................... 40
ix
Figure 4.8. Effective prestress vs. crack opening for 2013 events with corresponding crack openings of
0.002 in. or greater. ..................................................................................................................................... 41
Figure 4.9. Effective prestress vs. crack opening for 2013 and 2019. ........................................................ 42
Figure 4.10. Box plots of effective-prestress estimates from April to May of 2013 and 2019. .................. 42
Figure A-1: Development with time of the delayed elastic strain…………………………………….…..50
Figure A-2: Influence of notional thickness on creep…………………………….…………………….....50
Figure A-3: Development with time of the delayed plastic strain………………………………………...50
Figure A-4: Influence of the notional thickness on shrinkage.....................................................................52
Figure A-5: Influence of the notional thickness on shrinkage…………………………………………….52

x
LIST OF TABLES
Table 2.1. Summary of research employing crack re-opening tests. .......................................................... 12
Table 2.2. Summary of temperature induced thermal stresses. ................................................................... 17
Table 3.1. Location and tributary areas of thermocouples. ......................................................................... 21
Table 3.2. Staged construction analysis for Spans 1 and 2. ........................................................................ 26
Table 4.1. Comparison of vertical deflections at mid-span of Span 5. ...................................................... 35
Table 4.2. Comparison of prestress-loss estimations from field data and FE analysis. ............................. 43
Table 4.3. Flexural strength resulting from various effective-prestress estimations. ................................ 43
Table A-1. Basic coefficients of creep and shrinkage…………………………………………….……....51
Table A-2. Coefficient s, which depends on cement type………………………………………………...54
Table A-3. Coefficient αE, Effect of aggregate type on modulus of elasticity…………………………...54
Table A-4. Coefficient βsc, which depends on cement type…………………………………… ………...55
Table A-5. Values of the constants a and b…………………………………………………………….....57
Table A-6. Values for humidity dependent, kh…………………………………………………… ……...61
Table A-7. Values for α1 as a function of cement type…………………………………………………...61
Table A-8. Values of α2 as a function of cement type…………………………………………………....61
Table A-9. Values of ks as a function of cross section shape……………………………… ………….....61
1
Introduction
In this chapter, the major concepts, motivation, and project purpose are introduced. In the first
section, the concepts of prestressed concrete, and prestress losses are introduced, and the motivation for
this research project is presented. In the second section, the Varina-Enon Bridge is described. And in the
third section, the project goals and scope are outlined.
1.1 Motivation
Prestressed concrete is a composite material which utilizes steel strands to provide a pre-compression
to concrete elements. This technique produces lighter and stiffer concrete structures. Patents for prestressed
technology were filed as early as 1886, but wide use of prestressed concrete was limited throughout the
early 20th century because prestress losses were significant in relation to the ultimate strength of the steel
strands. With the advent of high-strength steels, however, the use of prestressed concrete became
widespread in Europe and America starting in the 1940s. (Naaman 2012).
Since its inception, prestressed concrete has been adopted in every major building sector. It has been
exceptionally effective in the Federal Highway System, where it is a predominant method for constructing
short to mid-length bridge spans. As this infrastructure ages, however, it is important that professionals are
able to accurately assess the remaining service life of prestressed bridges. One key aspect of the structural
evaluation of prestressed bridges is the accurate prediction of prestress losses. Significant prestress losses
can affect the serviceability of structures by causing cracking and excessive deflections, while, in post-
tensioned structures with un-bonded tendons, prestress losses can also reduce the structures’ ultimate
strength.
1.1.1 Prestress Loss
Prestress losses in concrete structures come from multiple sources, but the long-term losses caused
by creep and shrinkage are the most difficult to predict. Creep is a volumetric change which occurs,
primarily, due to loading applied over an extended period of time. Shrinkage is a volumetric change which
occurs due to the loss of water in the pore structure of the concrete. These phenomena result in a shortening
of the prestressed member causing long-term losses in the prestressing strands. These long-term losses are
estimated using analytical models which describe the development of creep and shrinkage with time.
The most striking example of the consequences of long-term losses is the collapse of the Koror
Babeldaob Bridge, seen in Figure 1.1. After 18 years in service, the bridge had a mid-span deflection of 5.3

2
ft caused, in large part, by creep and shrinkage. This deflection did not constitute a structural concern, but
the remedial prestressing carried out to reduce the mid-span sag ultimately compromised the integrity of
the structure. On September 26th, 1996 the bridge collapsed catastrophically, killing two people.
Figure 1.1. (Left) Koror-Babeldaob Bridge prior to collapse. (right) Koror-Babeldaob Bridge after collapse. (OPAC 2000)
1.2 Varina-Enon Bridge
The Varina-Enon Bridge (VEB) is a cable-stayed, segmentally-constructed, post-tensioned
box-girder bridge. The VEB spans the James River, connecting Chester and Henrico Virginia at mile
marker 18 along Interstate 295. Figure 1.2 shows an aerial view of VEB which carries six lanes of
traffic via two parallel box girders. The VEB was designed by Figg and Muller Engineers beginning
in 1985 and was opened to traffic on July 18, 1990.
Figure 1.2. Aerial view of the Varina-Enon Bridge over the James River.

3
The total length of the bridge is 4,680 ft, and it is composed of 28 spans. Seven of these spans make
up the cable-stayed, main span of the structure. The remaining 21 spans make up the approach units of the
bridge. On the South end of the bridge, two six-span-continuous approach units make up the southernmost
12 spans of the bridge. The focus of this study is on the Eastern box-girder in the southernmost approach
unit, as shown in Figure 1.3. This approach unit is made up of six 150-ft spans, resulting in a total length
of 900 ft. Piers and spans are numbered sequentially, beginning with the southernmost elements, as seen in
Figure 1.3.
The approach unit of the VEB is composed of seven 20-ft precast segments. These segments were
match-cast in a long-run configuration and placed using steel launch trusses (seen in Figure 1.4). Segments
were epoxied at the joints as each was placed, then the span was post-tensioned. Typical precast segments
are shown in Figure 1.4 and Figure 1.5 and are located between piers. Pier segments, which are located
atop each pier, have the same outer dimensions as the typical segments but contain diaphragms on the
interior which act as anchorages for the longitudinal post-tensioning.
Figure 1.4. Construction of approach spans (F&M Engineers 1993).
Figure 1.3. Elevation of the southernmost approach unit.

4
Figure 1.5. Typical approach-unit, precast section.
Longitudinal post-tensioning of the VEB consists of eight external tendons in each span. Each tendon
contains (19) 0.6 in. diameter strands. Tendons are located in the interior of the box girder cell and are
deviated via blocks at the bottom of the section as seen in Figure 1.5. Figure 1.6 shows the configuration
of tendons in Span 6, as well as the longitudinal locations of deviator blocks. Figure 1.6 also illustrates how
the tendons provide continuity to the structure over pier supports. At the location of Pier 6, the tendons in
Span 5 and Span 6 overlap in the diaphragm of the pier segment. As each span was constructed, this overlap
provided continuity to the structure. As-built drawings of the two sections in the approach structure and the
three unique tendon layouts can be found in Appendix C.
Figure 1.6. Section view of Span 6, (tendons shown by the dashed line).
Tension cracks on the bottom flange of the VEB were identified by the Virginia Department of
Transportation in 2012. Though these cracks were partially attributed to large thermal gradients, the
literature suggests that large segmentally-constructed box girders are known to experience larger-than-
expected creep deflections (Bažant et al. 2011). With this in mind, it is vital that the remaining service life
of the VEB be assessed. At 27 years old, the VEB should remain in service for decades to come. Left
unchecked, however, excessive prestress loss can shorten the life of the bridge and cause safety risks.

5
1.3 Purpose, and Scope
The purpose of this research is to investigate the time-dependent longitudinal flexural behavior of
the Varina-Enon Bridge. The final goal of which is to estimate the longitudinal prestress loss using existing
flexural cracks, and to compare these losses to those estimated by a finite element model of the six-span
approach unit. The scope of this research includes the following:
Estimating longitudinal prestress losses using data gathered from field measurements.
Developing a finite element model, and evaluating prestress loss using multiple code expressions
for creep and shrinkage.
Evaluating, reinstalling and expanding instrumentation on the VEB.
Providing recommendations for continued research on the VEB.

6
Literature Review
The literature surrounding prestressed concrete and long-term prestress losses is extensive. This
chapter provides a review of this literature, as well as several other areas which inform this research project.
First, the topics of creep, shrinkage and prestress loss are covered. Second, the experimental methods of
prestress loss measurement are reviewed. Third, the relevant literature on stresses induced by thermal
gradients is summarized. Last, the previous research on the VEB is outlined.
2.1 Creep and Shrinkage
Creep and shrinkage cause delayed strains in concrete which result in deflections and prestress losses
in bridge structures. These strains progress at a decreasing rate over time, as seen in Figure 2.1. A number
of analytical models have been developed over the years to describe this process, all of which take into
account material properties and environmental conditions. Each model, however, considers slightly
different aspects of the material and uses different functions to describe the progression of creep and
shrinkage with time.
Figure 2.1. Creep and shrinkage response with respect to time (Bažant and Jirasek 2018).
Creep is described analytically by a stress-independent term called the compliance function, J(t,to).
This function describes creep strain for unit stress and thus can be used to model creep strains for any given
stress. A generalized version of the compliance function is shown in Equation (2.1), where ϕ(t,to) represents
the creep coefficient, and Ex represents some variation of the elastic modulus. Additionally, the term, t
represents the time of interest, and to represents the time when the structure was loaded, both in units of

7
days. The compliance function for each model code varies, depending on what value of elastic modulus is
used, and how the creep coefficient is calculated.
1 ( , )
( , ) oo
x
t tJ t t
E
(2.1)
Because shrinkage does not depend on the stress in the concrete, strains due to shrinkage are simply
a function of the time of drying and the material properties. Total shrinkage strains, ( , )sh ot t , are defined
in all models by a bounded function which approaches some ultimate value.
2.1.1 Review of Creep and Shrinkage Models
For the purposes of this thesis, CEB-FIP ’78, CEB-FIP ’90, ACI 209, AASHTO and B3 creep and
shrinkage models are reviewed and compared. CEB-FIP ’78 is the model code used for the design of the
VEB, while the remaining four represent the most widely used models in current use.
CEB-FIP ‘78 model code was published by the Comité Euro-International Du Béton in 1978. The
CEB-FIP ’78 code expression for creep and shrinkage was adopted in the commentary of the AASHTO
Guide Specifications for Design and Construction of Segmental Concrete Bridges, 1st edition. This model
was widely used in the United States throughout the 1980s. The creep coefficient, in this model code,
depends on ambient relative humidity, volume-to-surface ratio of the section, and concrete strength
development. The time development of creep is defined graphically by a bounded asymptotic function
which approaches an ultimate value and is defined for an age up to 10,000 days (CEB-FIP 1978).
The CEB-FIP ’90 is an updated version of the 1978 code expression for creep and shrinkage which
includes provisions for high-strength concretes. Again, the time-development of both creep and shrinkage
are defined by a bounded function which approaches an ultimate value. The graphical depictions of these
functions, however, are replaced with the functions themselves. The ultimate value of the creep coefficient
depends on the ambient relative humidity, volume-to-surface ratio of the section, concrete strength
development, cement type, and aggregate type (ACI 209 2008).
The ACI 209R-92 model was developed by Branson and Christianson (1971) and was adopted by
the American Concrete Institute in 1992. Like both CEB-FIP models, the ACI time-development of creep
and shrinkage is defined by an asymptotic function. The ultimate value of this function depends on ambient
relative humidity, volume-to-surface ratio of the section, type of curing process, fine-aggregate content,
and air content (ACI 209 2008).
The AASHTO 2012 code expression for creep and shrinkage is based on the ACI model with
modification suggested by more recent research on the subject (AASHTO 2012). This model only takes

8
into account ambient relative humidity, volume-to-surface ratio of the section, and concrete strength. Like
all previous models, the time-development of creep and shrinkage are defined by asymptotic functions.
The B3 model was proposed by Bažant and Baweja (1995). This model is the most detailed of the
five models, and breaks creep compliance into basic and drying creep functions. A large number of material
properties are considered in the B3 model including cement content, water-to-cement ratio, and aggregate-
to-cement ratio. In addition to these values the cement type, curing conditions, and ambient relative
humidity are also considered. The B3 model differs from the previous models by its use of the asymptotic
elastic modulus in the formulation of the compliance function, and by its use of a logarithmic function for
the time-development of creep. The B3 model defines the asymptotic modulus as Ecm28/0.6. This variable
represents the modulus for an instantaneously applied stress.
2.1.2 Comparison of Creep Compliance Functions
In order to convey the relative behavior of the creep described in these models, the compliance
function of each has been graphed in Figure 2.2. These compliance functions have been computed for the
typical section of the VEB which is pictured in Figure 1.5. A theoretical concrete mix which consisted of
type III cement, limestone aggregate, and a water-to-cement ratio of 0.45 was assumed.
Several important notes can be made in Figure 2.2 which, it should be noted, is plotted on a semi-log
scale. First, the slope of the compliance functions at 10,000 days can be seen to vary widely. With that said,
CEB-FIP, ACI, and AASHTO models appear to be relatively flat, while the B3 model has a constant
positive slope. This difference is due to the different time-development functions which describe creep.
Second, the compliance from the B3 model is significantly higher than that of the other models. A more
detailed description of each creep and shrinkage model can be found in Appendix A.
Figure 2.2. Comparison of compliance functions.
0.00
0.10
0.20
0.30
0.40
0.50
0.60
0.70
0.80
1 10 100 1,000 10,000
Com
plia
nce,
10-6
/psi
Time from Loading (t-to), days
B3
CEB-FIP 90
CEB-FIP 78
ACI 209
AASHTO

9
2.2 Prestress Losses
Total prestress loss for a post-tensioned concrete structure is categorized, generally, into
Instantaneous losses and long-term losses, as seen in Equation (2.2). Instantaneous losses occur during the
construction process, or shortly thereafter, and include friction and seating losses (ΔfpFS), and elastic
shortening losses (ΔfpES). The mechanics of these losses are well known and will not, therefore, be explained
at length in this thesis. Long-term losses, which are the focus of this study, begin at the moment of stressing,
and continue throughout the life of the structure. These Long-term losses are made up of creep losses
(ΔfpCR), shrinkage losses (ΔfpSH), and relaxation losses (ΔfpRE). The seminal document which outlines the
methods for calculating prestress loss is ACI 423.10R Guide to Estimating Prestress Losses (ACI 423
2016).
pT pFS pES pCR pSH pREf f f f f f
(2.2)
Several methods for calculating long-term prestress losses have been developed over the years. At
the beginning of code development, long-term losses were calculated as a lump-sum value which depended
only on the level of stress in the steel and concrete. These calculations were first outlined by the Bureau of
Public Roads in 1954 and can be seen in Equation (2.3). This method, however, does not take into account
any of the properties of the concrete itself and is only used today for preliminary design.
3000 11 0.04pT cps pif f f (psi)
Where:
fcps is the concrete stress at the center of gravity of the prestressing force due to all loads.
fpi is the initial stress in the prestressing steel.
(2.3)
A simplified method for estimating long-term losses is allowed for structures under normal design
conditions. This method is more accurate than the lump-sum method and is accepted in modern design but
makes many simplifying assumptions about material properties. This method intends to “reasonably
estimate” the losses due to creep, shrinkage, and relaxation individually. Losses depend primarily on K
factors for creep, shrinkage, and relaxation which are taken from tables and depend on the type of concrete,
the age at load application, and the type of prestressing steel.
The most accurate methods of estimating prestress loss directly consider the creep, shrinkage, and
relaxation models for the materials being used. These methods can generally be categorized into time-step
Short-term losses Long-term losses

10
methods and age-adjusted effective modulus methods. The age-adjusted effective modulus method
modifies the modulus of elasticity using the creep coefficient and a term called the aging coefficient (χ) to
calculate the total long-term strains due to a load. This age-adjusted modulus can be seen in Equation (2.4).
0
'' = 1 ,
cc
EE
t t
(2.4)
The time-step method, like the age-adjusted effective modulus method, directly utilizes creep and
shrinkage models as described in Chapter 2.1. This method is unique in that it breaks the life of the structure
down into discrete periods of time and calculates the creep and shrinkage strains at each discrete time step.
The time-dependent strains are then added to the mechanical strains to determine the total change in length
and curvature of the structure. The prestress losses are then used to update the stresses for use in the next
time-step calculation. This incremental process accounts for the fact that the rate of prestress loss due to
one effect such as creep, is altered by losses due to the other two effects, relaxation and shrinkage (Naaman
2012).
2.3 Measuring Effective Prestress Force
Effective prestress force is defined as the remaining prestress force at some specific time of interest
in the life of a structure. Measuring effective prestress force is an integral part of assessing a bridge’s
remaining service life. Many methods of measuring effective prestress have been studied throughout the
years. The most relevant of these studies are summarized in the ACI committee 423 Guide to Estimating
Prestress Losses (2016). The two most well-established methods of measuring effective prestress force in
the literature are the use of embedded vibrating wire gages (VWGs) and the use of crack-reopening load
tests.
2.3.1 Embedded Vibrating Wire Gage Measurement
The measurement of effective prestress by the use of embedded VWGs involves tracking the forces
in the prestressing strands from the time of initial stressing. These forces are calculated from strains
measured via VWGs adhered directly to the prestressing strands or to other bars in the structure. These
gages are then cast into the members, and track the loss of prestressing over time. This method requires the
involvement of researchers from the time of casting and has been historically used to validate prestress loss
estimation formulas. Since most structures are not cast with embedded VWGs, this is not a viable method
of measuring effective prestress force for the majority of bridges.
11
Garber et al. (2015) instrumented 30 precast specimens with VWGs to investigate prestress losses
over a period of 3 years. The goals of this research were to investigate the effect of various parameters on
prestressed loss and to compare service load methods of loss calculations to VWG methods. Specimens
were either 40 in. standard AASHTO I-girders, or 46 in. bulb-T cross-sections. All beams were 45 ft long.
VWGs were embedded into the cross sections of the specimens at the time of casting and set in storage for
up to 3 years. After this period of time, the specimens were tested to cracking loads. The effective prestress
was then calculated using these crack reopening test, and the results were compared to the effective prestress
measured from VWGs. Researchers determined from this study that effective prestress can be measured
accurately using service-load tests as well as the embedded VWG method (Garber et al. 2015).
2.3.2 Method Utilizing Crack Re-opening
The most well-established method for measuring effective prestress is by means of loading and re-
loading the beam to the point of cracking and re-cracking. The load and the geometry of the beam at the
instant of crack re-opening are then used to calculate effective prestressing force by assuming zero stress at
the extreme tension fiber. Prestress loss can then easily be calculated from the effective prestress force if
initial jacking force is known.
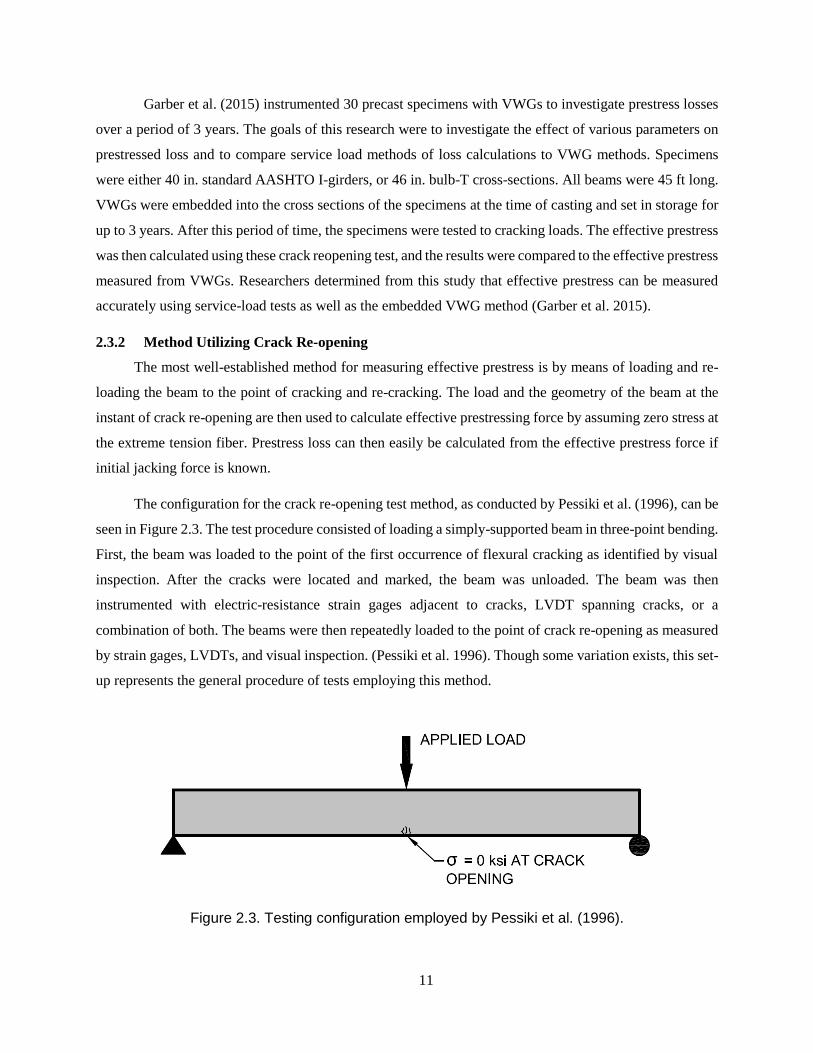
The configuration for the crack re-opening test method, as conducted by Pessiki et al. (1996), can be
seen in Figure 2.3. The test procedure consisted of loading a simply-supported beam in three-point bending.
First, the beam was loaded to the point of the first occurrence of flexural cracking as identified by visual
inspection. After the cracks were located and marked, the beam was unloaded. The beam was then
instrumented with electric-resistance strain gages adjacent to cracks, LVDT spanning cracks, or a
combination of both. The beams were then repeatedly loaded to the point of crack re-opening as measured
by strain gages, LVDTs, and visual inspection. (Pessiki et al. 1996). Though some variation exists, this set-
up represents the general procedure of tests employing this method.
Figure 2.3. Testing configuration employed by Pessiki et al. (1996).

12
The applied load measured at the occurrence of crack re-opening is then used in Equation (2.5). At
the instant of crack re-opening, the stress in the extreme tension fiber is zero. This fact is used to simplify
and rearrange Equation (2.5), to solve for the prestress force at mid-span of the beam, as seen in Equation
(2.6).
appliede e swM yP P ey M y
A I I I
Where P is the effective prestress force
A is the cross-sectional area
e is the prestressing eccentricity
y is the distance from the neutral axis to the depth in question
I is the beam moment of inertia
Msw is the moment due to self-weight
Mapplied is the moment due to the applied load
(2.5)
( )sw applied
e
M M y IP A
I ey
(2.6)
2.3.3 Research Employing Crack Re-opening Tests
A number of studies which utilize equation (2.6) have been conducted. This research is summarized
by ACI committee 423 in the 2016 document 423.10R Guide to Estimating Prestress Losses. This summary
includes studies which employed a variety of measurement methods, beam ages, and span lengths. Table
2.1 summarizes the relevant research conducted using methods similar to Pessiki et al.
Table 2.1. Summary of research employing crack re-opening tests.
Researchers Number of
beams tested Age of
beams, yr Length of beams, ft
Shenoy and Frantz 1991 2 27 54
Tabatabai and Dickson 1993 1 34 43
Pessiki et al. 1996 2 28 89
Halsey and Miller 1996 2 40 29
Azizinamini et al. 1996 1 25 55
Labia et al. 1997 2 20 70
Greuel et al. 2000 1 0.5 115.5
Eder et al. 2005 2 45 50
Kukay et al. 2010 8 40 34.5
Attanayake and Aktan 2011 1 49 48
Osborn et al. 2012 7 42 24
Garber et al. 2015 30 3 45.5

13
The majority of the tests summarized in Table 2.1 were conducted on pre-tensioned I-girders and
box girders. All of the tests were conducted in simple span configurations in lab settings. To-date, no studies
have employed crack re-opening tests on continuous-span structures or on in-service bridge girders. The
following is a detailed summary of the relevant studies which have been conducted using crack re-opening
tests.
The test setup employed by Pessiki et al. (1996) is described above. Researchers found that strain
gages adjacent to flexural cracks typically measured decompression at lower loads than LVDTs, and
likewise, that LVDTs measured decompression at lower loads than did visual observations. It was also
found that the gage length of strain gages had no effect on the determination of decompression load (Pessiki
et al. 1996). In total, it was found that the AASHTO Bridge Specifications (1992) as well as the PennDOT
design manual, overestimated prestress losses by as much as 60%. (Pessiki et al. 1996)
Tabatabai and Dickson (1993) conducted load testing on a 34-year-old, 43 ft. long, post-tensioned I-
girder. The purpose of this study was to evaluate the remaining prestressing force in the tendons as well as
to measure the cracking and ultimate flexural strengths of the beams. The girder was loaded in a four-point
bending, simple-span configuration. The first cracking event was measured by an accelerometer. The girder
was then unloaded and instrumented with a crack gage to measure decompression at the mid-span crack.
Data resulting from these tests indicated actual prestress loss of 29 ksi. Prestress loss calculations at the
time of design estimated a loss of 25 ksi, which translates to a 14% underestimation. Calculations conducted
using Section 9.16 of the fifteenth edition of the AASHTO Specifications resulted in losses of 33.2 ksi,
which translates to a 14% over-estimation. (Tabatabai and Dickson 1993)
Shenoy and Frantz (1991) conducted structural testing on two 27-year-old prestressed concrete box
girders. Among other things, the tests were conducted to measure the remaining prestress force in the
girders. The beams were 36 in. wide by 27 in. deep and measured a length of 54 ft. The girders were tested
in a simple-span configuration and were loaded at third points. Results from these tests were used to
calculate effective prestress. This study indicated that the calculations from code expressions for creep and
shrinkage generated a conservative estimation of losses, and that the actual prestress losses were as low as
50% of what was expected (Shenoy and Frantz 1991).
Halsey and Miller (1996) conducted load testing on two 40-year-old pre-tensioned inverted T-beam
specimens. The beams were loaded in three-point bending to the cracking moment, after which clip gages
were mounted across cracks. The beams were then loaded until the first crack was identified, unloaded, and
reloaded to failure. Prestress loss calculated from these tests was measured to be 29.3 ksi (20%) and 34.5

14
ksi (23%) for beams 1 and 2 respectively. Loss calculations which were conducted using the 1989 AASHTO
specifications, were found to be 40 ksi (27%). This is a conservative estimation compared to the measured
loss values from the crack re-opening method. (Halsey and Miller 1996)
Osborn et al. (2012) conducted load testing on a total of seven pre-tensioned AASHTO Type II I-
beams. Cracking-moment tests were conducted on the first five beams which consisted of loading the beams
until the first visual cracks were identified. The cracks were then marked and the beams were unloaded.
Next, foil gages were mounted across the marked crack locations and load was re-applied to each beam
twice to induce crack re-opening. Decompression of the crack was identified by a deviation of the strain
gage strain-load graph from a straight line. The effective prestress force in the girders was then calculated,
taking into account the small amount of composite action due to the cast in place deck. These measured
values of effective prestress force were then compared to values calculated using the AASHTO
approximate, and refined methods, as well as the original bridge span values. All loss-estimation methods
yielded conservative results, compared to the measured values. The AASHTO approximate method yielded
effective prestress force of 188.4 kips (15% higher than measured), while AASHTO refined method yielded
179.8 kips (10% higher than measured. Lastly, the effective prestress force calculated in bridge plan
specifications was 176 kips (8% higher than measured). (Osborn et al. 2012)
Labia et al. (1997) conducted structural testing of two 20-year-old box girders. The box girders were
70 ft. long with width and depth dimensions of 48 in and 33 in. respectively. The girders were loaded to
cracking, then unloaded, instrumented with LVDTs across flexural cracks, and reloaded to crack opening.
The average measured prestress loss was found to be 62 ksi. Original shop drawings estimated a lump-sum
loss of 35 ksi, while the more detailed methods of estimation found in ACI 318R-89, AASHTO
specification 15th edition, and the PCI manual calculated losses of 50 ksi, 46 ksi, and 43 ksi respectively.
Losses were also calculated using Naaman’s time-step method. Assuming a moist cured condition, the
upper bound of loss for this time-step analysis was 54 ksi. Researchers attributed the larger measured losses
to the use of high-strength concrete as well as the large temperature and humidity fluctuations in Reno,
Nevada. (Labia et al. 1997)
2.4 Creep in Long-Span Structures
The CEB-FIP, ACI and AASHTO code expressions for creep and shrinkage, described above, have
been utilized in a wide range of structures over the years. In 2008 however, several researchers began
investigating whether these models were appropriate for use in large-span bridge structures which are
highly sensitive to creep and shrinkage. Motivated by the release of litigated data from the collapse of the

15
Koror-Babeldaob Bridge, Bažant et al. (2010) created a finite element model of the bridge and evaluated
deflections and prestress losses using the most common code expressions for creep and shrinkage.
Researchers found that the current code expressions did an insufficient job of estimating long-term mid-
span deflections and long-term prestress losses. Measurements taken shortly before the collapse indicated
a 50% loss of prestressing force in the Koror-Babeldaob Bridge. This greatly exceeded the design value of
22%, and the value from the finite element analysis utilizing the CEB-FIP ’90 code expression for creep
and shrinkage (24%). Figure 2.4 shows the prestress loss predictions utilizing each model along with the
actual measured values (Bažant et al. 2010).
Figure 2.4. Prestress loss estimations on the Koror-Babeldaob Bridge.
The following year, Bažant et al. (2011) published data on a total of 56 large box-girder bridge spans
which were experiencing excessive deflections. Most of the spans were balanced cantilevers with midspan
hinges and were experiencing very similar behavior to the collapsed Koror-Babeldaob Bridge. Namely, the
progression of deflections was significantly greater than those predicted by ACI and CEB models after
multiple decades. Researchers concluded that these excessive deflections were far more prevalent than
originally suspected and that the blame likely rests, not on poor construction, but on design
recommendations.
2.5 Thermal Gradients
Thermal gradients play an important role in understanding the flexural behavior of large, box-girder
bridges. Furthermore, in the VEB specifically, the stresses induced by non-linear thermal gradients have
been shown to be significant (Maguire et al. 2015).
16
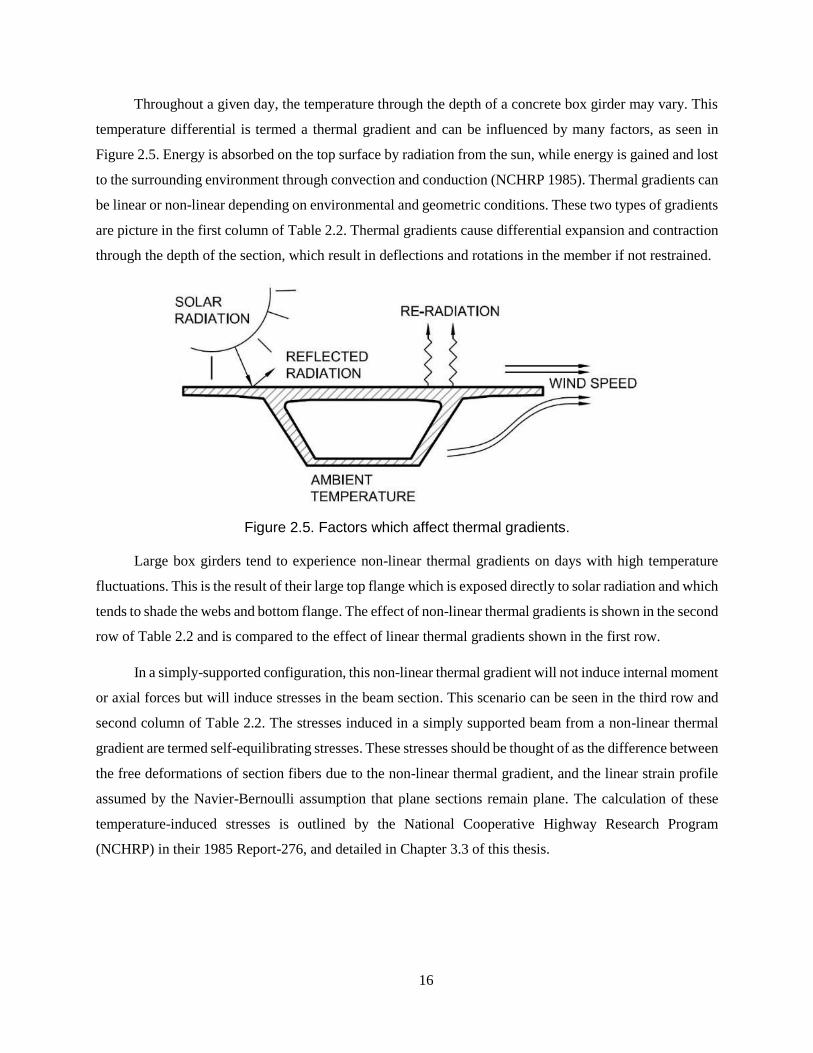
Throughout a given day, the temperature through the depth of a concrete box girder may vary. This
temperature differential is termed a thermal gradient and can be influenced by many factors, as seen in
Figure 2.5. Energy is absorbed on the top surface by radiation from the sun, while energy is gained and lost
to the surrounding environment through convection and conduction (NCHRP 1985). Thermal gradients can
be linear or non-linear depending on environmental and geometric conditions. These two types of gradients
are picture in the first column of Table 2.2. Thermal gradients cause differential expansion and contraction
through the depth of the section, which result in deflections and rotations in the member if not restrained.
Figure 2.5. Factors which affect thermal gradients.
Large box girders tend to experience non-linear thermal gradients on days with high temperature
fluctuations. This is the result of their large top flange which is exposed directly to solar radiation and which
tends to shade the webs and bottom flange. The effect of non-linear thermal gradients is shown in the second
row of Table 2.2 and is compared to the effect of linear thermal gradients shown in the first row.
In a simply-supported configuration, this non-linear thermal gradient will not induce internal moment
or axial forces but will induce stresses in the beam section. This scenario can be seen in the third row and
second column of Table 2.2. The stresses induced in a simply supported beam from a non-linear thermal
gradient are termed self-equilibrating stresses. These stresses should be thought of as the difference between
the free deformations of section fibers due to the non-linear thermal gradient, and the linear strain profile
assumed by the Navier-Bernoulli assumption that plane sections remain plane. The calculation of these
temperature-induced stresses is outlined by the National Cooperative Highway Research Program
(NCHRP) in their 1985 Report-276, and detailed in Chapter 3.3 of this thesis.

17
Table 2.2. Summary of temperature induced thermal stresses.
Additionally, when redundancies are added into the structure, continuity stresses will be induced in
addition to self-equilibrating stresses. This scenario can be seen in the third row and third column of Table
2.2. The state of stress, therefore, in an indeterminate beam from non-linear thermal gradients can be
calculated by superimposing the self-equilibrating stresses and continuity stresses (NCHRP 1985).
2.6 The Varina-Enon Bridge
Maguire et al. (2014) investigated the longitudinal behavior of the VEB under live-load testing. This
study was funded by the Virginia Department of Transportation beginning in 2012 after a 1/16-in. crack
was identified in the bottom flange of one of the southern-most approach units of the VEB.
In addition to live-load testing, a long-term monitoring system was set up on the VEB. The purpose
of the long-term monitoring system was to log crack opening events, and the thermal gradients associated
with these events. The long-term monitoring system consisted of 27 thermocouples spread throughout the
top flange, web, and bottom flange of the box girder, two strain transducers, and two LVDTs. Researchers
concluded from this study that crack openings were generally correlated with large non-linear thermal
gradients in the bridge (Maguire et al. 2018).
In addition to thermal gradients, the issue of crack openings could also be the result of larger-than-
expected prestress force losses in the longitudinal post-tensioning strands. In 2017, the long-term
monitoring data was re-evaluated in an effort to calculate the effective prestress force. This study resulted
in a preliminary report but was never published.
Determinate Indeterminate
Linear Thermal
Gradient
Stresses @ A-A Stresses @ B-B
Non-Linear
Thermal Gradient
Stresses @ A-A Stresses @ B-B

18
2.7 Summary of the Literature
Properly estimating long-term prestress loss in prestressed concrete requires the accurate assessment
of creep and shrinkage strains. For this purpose, multiple analytical models to describe the time-
development of creep and shrinkage have been developed. Most of these models describe creep by an
asymptotic function which approaches an ultimate value, but recent research has shown that creep does not
behave in this manner. As a result, more recent models describe the progression of creep by a logarithmic
function.
The measurement of long-term prestress loss has been accomplished through several experimental
testing protocols. The purpose of measuring prestress loss has generally been to validate analytical models
for long-term loss, but another purposes has been to assess the remaining service life of beams similar to
those being tested. Crack reopening tests have generally been accepted as the most reliable method of
measuring prestress loss, but all of these tests have been conducted on simply supported beams under
laboratory conditions.
The evaluation of prestress loss on the VEB has become important to researchers because of cracks
identified on the bridge’s bottom flange. Data gathered from the monitoring system installed on the VEB
allows researchers to measure prestress loss by evaluating the state of stress in the section at the time of
crack opening. This method is complicated by the presence of thermal gradients and redundant supports in
the structure.
19
Methodology
The performance of the Varina-Enon Bridge (VEB) came into question after the discovery of
cracking in Span 6 of the northbound approach unit. Sensors were installed at the crack location by Maguire
et al. (2014) to monitor thermal gradients and crack openings. Data from this monitoring system is used in
this study to calculate the effective prestress force in Span 6. This is done by modifying Equation (2.6) at
events when the crack in the bottom flange opens. Alongside this back-calculation of the effective prestress
force, a finite element (FE) model is created to evaluate effective prestress using multiple code expressions
for creep and shrinkage.
The purpose of this chapter is to describe the methods used and activities performed in completing
these tasks. First, the long-term monitoring system is described, and the method of data processing is briefly
outlined. Second, the FE model and associated time-step analysis is described. Last, the method of
calculating effective prestress from field data is detailed.
3.1 Long-Term Monitoring System
The long-term monitoring system was deployed by Maguire et al. (2014) for the purpose of
measuring the number and magnitude of crack-opening events in Span 6. These sensors measured crack
displacement, temperature, and live-load strains throughout Span 6. Data from this long-term monitoring
system was used to correlate thermal gradients, and live-load strains to crack opening events in order to
calculate effective prestress.
An elevation view of the sensors which make up the long-term monitoring system can be seen in
Figure 3.1. Section A-A represents the location of the transverse crack being monitored, while Section B-
B represents the location of live-load strain measurements. Thermocouples and linear variable differential
transformers (LVDTs) measured temperatures and crack opening widths at Section A-A respectively. Two
strain transducers measured live-load strains at Section B-B and crack decompression at Section A-A.

20
Figure 3.1. Span 6 longitudinal sensor layout.
3.1.1 LVDTs
Two LVDTs were installed at Section A-A of Span 6. These LVDTs were oriented longitudinally
and measured crack displacement. These LVDTs were located on the top face of the bottom flange of the
box-girder section, as seen in Figure 3.2.
Figure 3.2. Section A-A sensor layout.
3.1.2 Thermocouples
Thermocouples were installed throughout the depth of the box-girder section, as seen in Figure 3.2.
Each cluster of thermocouples represents several sensors installed through the thickness of the flange or
web. Each thermocouple was assigned a tributary area over which the temperature of the section was taken
to be constant. Table 3.1 shows the location of each thermocouple from the top of the wearing surface, the
tributary area, and the location of the centroid of that area from the bottom of the section. Each of the values
in Table 3.1 is used in the calculation of the thermal moment and axial force in Chapter 3.3.
Several thermocouples were located at approximately the same depth in the section. Because of this,
these temperature measurements were averaged and treated as one measurement for subsequent
calculations. Thermocouples averaged because of proximity include 4/5, 6/7, and 8/9 in the web and
thermocouples 16/21, 17/22, and 18/23 in the top flange. Thermocouple 99 represents an estimated

21
temperature at 3/4 in. from the top of the wearing surface. This temperature was interpolated from the
existing temperature measurements using the fifth-order curve approximation presented by Priestley
(1978).
Table 3.1. Location and tributary areas of thermocouples.
TC Elev. from top
of wearing surface, in.
CG from the bottom, in.
Tot area, in.2
Area*cg, in.3
1 140.0 8.1 1,086.8 8,838.8
2 142.3 3.2 496.5 1,602.6
3 144.5 1.1 457.5 481.4
4,5 108.8
35.8 754.9 27,043.1 110.8
6,7 78.0
66.2 848.4 56,156.3 80.6
8,9 48.5
97.5 1,030.0 100,394.8 51.1
10 15.8 122.9 667.5 82,040.1
11 13.8 131.8 317.2 41,810.9
12 11.8 133.9 673.2 90,158.4
13 9.8 135.3 713.9 96,594.5
19 9.5 136.2 692.9 94,363.8
14 7.8 137.6 1,041.0 143,241.6
15 6.5 138.9 798.1 110,876.0
16,21 5.5
140.0 694.0 97,160.0 5.5
17,22 4.5
141.0 694.0 97,854.0 4.5
18,23 3.5
142.0 694.0 98,548.0 3.5
24 2.5 143.7 957.7 137,614.8
99 0.8 145.6 1,131.2 164,666.0
3.1.3 Strain Transducers
In addition to LVDTs and thermocouples, two strain transducers were installed to measure stain in
the bottom flange of the section. ST01 was located at the top of the bottom flange at Section B-B which is
60 ft from the center of Pier 7 and represents the location of the maximum moment in Span. ST01 was used
to trigger the data acquisition system and was also used to measure strain due to live loads. The second
strain transducer, ST02, was located at the top of the bottom flange adjacent to Section A-A, as seen in

22
Figure 3.2. This sensor was used to measure decompression of the bottom flange during crack opening
events.
More detailed information regarding the types and locations of sensors installed on the VEB can be
found in the Final Contract Report to the Virginia Department of Transportation (Maguire et al. 2015).
3.1.4 Data Collection
Data was collected using two Campbell Scientific CR1000 data loggers. One data logger collected
strain and displacement data at a rate of 33 Hz. However, data was only stored on this data logger each time
ST01 measured a strain of 12 με or more. The 3.6 seconds of data which was stored is termed a load event
for the remainder of this paper. The second data logger collected temperature data via an analog multiplexer
which sampled every 2 minutes. All of the temperature data was stored continuously in a file separate from
the strain data.
3.1.5 Data Processing
Data files were collected from the two data loggers at one-month intervals. Data was then separated
into discrete events by comparing the timestamp on adjacent samples. A new event was defined when the
timestamp increased by a value greater than 3/100ths of a second. A thermal gradient was then matched to
each event by comparing the timestamp of that event to the timestamps of the temperature data. Finally,
descriptive values were extracted from the event and used to characterize it. These values included the
timestamp, maximum and minimum values of ST01, the maximum value of ST02, and the maximum values
of both LVDTs,
In some cases, events were recorded which did not represent a load passing over the crack. This may
have been due to drift in ST01, or malfunction of one of the sensors. Figure 3.3 shows an example of a
load event which represents a single load passing over the crack location, while Figure 3.4 shows an
example of a registered event which represents drift in ST01. It was necessary to review the data and filter
out events which did not represent a load event. A small percentage of events were visually inspected as
seen in Figure 3.3 and Figure 3.4. From this inspection, exclusionary criteria were calibrated and applied
to all the data to filter out events which did not constitute a true load event.

23
Figure 3.3. Example of data for a typical load event.
Figure 3.4. Example of data which was filtered out.

24
3.2 Finite Element Model
In addition to the data collected in the field, an FE model of the approach unit was developed. LARSA
4D was used to create this FE model, which can be seen in Figure 3.5. There are two purposes for developing
this model. First, it is used to calculate prestress losses in the bridge, utilizing multiple creep and shrinkage
models. Second, it is used to calculate dead-load moment, prestressing moment, and general moment
distributions necessary to calculate effective prestress from the field data. All salient features of the FE
model are reported in Appendix B.
Figure 3.5. Overview of the FE model.
3.2.1 Finite Element Model Overview
The bridge superstructure is modeled as a six-span-continuous beam. Each pre-cast segment is
modeled as an individual beam element which ensures that information at each joint is available. The mean,
elastic modulus of concrete at 9,500 days is taken as 5,000 ksi. This value was validated by live-load tests
conducted by Maguire (2013). The mean, 28-day ultimate strength, f`cm28 is assumed to be 6,600psi. Cross-
section dimensions of the superstructure are shown in Figure 1.5. The depth of the top slab varies from
wing tip to center-line between 9 1/2 in. and 11 1/2 in., and includes a 1 1/2-in. concrete wearing surface.
Rigid links are used at pier locations to connect joints on the reference line to joints located at the
bottom of the superstructure section. Springs are used to model the neoprene bearing pads at the joint
between these rigid links and the substructure. These springs have translational stiffness in the Z and X-
axes, and rotational stiffness about the Y-axis as referenced by Figure 3.5. For the remaining three degrees

25
of freedom, the superstructure is rigidly connected to the substructure. Bearing pad stiffnesses for the VEB
were characterized by Maguire (2013) and are recorded in Appendix B.
Prestressing tendons are modeled from dimensions found in the as-built drawings. Tendon material
is A416 steel which has an ultimate tensile strength of 270 ksi, and an apparent modulus of elasticity of
27,400 ksi. The apparent modulus was calculated using benchmark elongation tests during the construction
of the VEB (F&M Engineers 1993). Actual jacking forces varied slightly for each tendon and can be found
in as-built drawings which are recorded in Appendix C.
Self-weight loads are included in the FE model and applied as each span is activated. In addition to
the gross cross section of the box girder, tendon deviation blocks and barrier rails are incorporated into the
model as point and distributed loads respectively. The stiffness due to barrier rails is not considered in the
overall stiffness of the section.
3.2.2 Staged Construction Analysis
Segmental construction of the VEB is modeled using a time-dependent construction stage analysis.
This analysis method accounts for the placement and stressing of each span during construction, as well as
the long-term behavior of the structure due to creep, shrinkage, and relaxation. Several definitions are key
to understanding this staged construction analysis. First, construction activities are defined as events which
may include placement of an element, addition of a support, or stressing of a tendon. Second, construction
steps are defined as an individual analysis and may include several construction activities. Last,
construction stages are each defined as a group of construction steps and represent one day of construction
for purposes of calculating time-dependent behavior.
The construction of the approach unit is modeled in six stages, each consisting of the construction of
one span. Construction of each span consists of nine construction steps. In the first step, the substructure
and superstructure of each span are activated, and the self-weight is applied. In Steps, 2 through 9, each of
the eight tendons in the span are stressed. It is necessary to analyze the structure after stressing each tendon
to account for elastic shortening losses. The deflected shape for Steps 1 and 9 in Stages 1 and 2 are pictured
in Table 3.2.

26
Table 3.2. Staged construction analysis for Spans 1 and 2.
Stage1, Step 1: Span 1 is activated Stage 1, Step 1: Span 1 self-weight is applied
Stage 1, Step 9: Span 1 is prestressed Stage 2, Step 1: Span 2 is activated
Stage 2, Step 1: Span 2 self-weight is applied Stage 3, Step 9: Span 2 is prestressed
A day-of-casting is assigned to each beam element in the staged construction analysis. This casting
day is used to define the age of the element at loading and each subsequent construction stage. Casting
dates for each element are obtained from erection logs recorded in the VEB Inspection and Maintenance
Manual (F&M Engineers 1993). Day zero is defined as the day that the first segment of the approach
structure was cast which occurred on August 8th, 1987.
The first six construction stages take place from day 88 to 184. After the construction of the approach
unit, empty construction stages are placed at 100-day increments up to day 500, then at 1,000-day
increments up to day 9,500. These construction stages do not represent any construction activity but are
placed as time steps for the time-step analysis. The final construction stage represents the structure in the
year 2013 and is used to generate FE model results which can be compared to field data of that year.

27
3.2.3 Short-Term Prestress Losses
Short-term prestress losses are incorporated into the FE model prior to the construction stage
analysis. These losses are calculated as the sum of friction, seating, and elastic shortening losses. These
losses depend on the stressing operation as well as the modulus of elasticity of the concrete at the time of
stressing.
Curvature friction losses are caused by friction between prestressing strands and the inside of the
tendon duct at any location that the strand changes direction. The curvature friction coefficient, μ was
measured to be 0.25 during construction (F&M Engineers 1993). No wobble friction is present in the
structure Since the tendons are external to the cross section. An example of a tendon force profile after
curvature friction losses is shown by the solid line in Figure 3.6.
Seating losses result from slippage that occurs when the strand is released from the stressing jack. In
the case of the VEB, this slippage is given in as-built documents as 3/8 in. (F&M Engineers 1993). The
amount of curvature friction influences how far seating losses extend through the length of the tendon. The
dashed line in Figure 3.6 illustrates the loss in force due to seating.
Figure 3.6. Tendon S6-T9L stress profile.
Lastly, losses due to elastic shortening of concrete occur in post-tensioned structures when tendons
are stressed sequentially. As the first tendon in a span is stressed, the surrounding concrete is put into
compression. When the second tendon is stressed, the first tendon experiences elastic shortening loss as the
concrete is put into further compression. When the third tendon is stressed, the first and second tendons
160
170
180
190
200
210
220
0 20 40 60 80 100 120 140
Tendon S
tress, ksi
Horizontal Distance, ft
Stress at Jacking Stress after Seating Stress at 9,500 days

28
experience elastic shortening loss, and so on. Elastic shortening loss in each tendon is assumed to be
uniform through the length of the span.
3.2.4 Long-Term Prestress Loss
Long-term prestress losses are accounted for in the FE model through the time-step analysis
conducted as part of the time-dependent construction stage analysis. This time-step analysis is conducted
using code expressions for creep and shrinkage from the CEB-FIP ’79, CEB-FIP ’90, and AASHTO 2012
model codes. Creep losses depend on the change in creep strain over each time step. Change in creep strains
vary through the depth of the section depending on the distribution of stress, but prestress losses due to
creep are calculated from the average change in creep strain over the depth of the cross-section. Shrinkage
strains are computed and prestress losses are simply calculated from these strain. Long-term prestress losses
can be seen by the dotted line in Figure 3.6.
3.3 Effective Prestress from Field Data
3.3.1 Overview
The method which evaluates the stress at crack re-opening is used to calculate the effective prestress
force in Span 6 of the VEB. A pre-existing crack, which had been observed to open under service live loads,
was used as the location of crack monitoring. The long-term monitoring system was used to gather data.
Employing this method in a continuous structure, under service conditions presents several
challenges to the calculation of prestressing force. First, non-linear thermal gradients cause continuity and
self-equilibrating stresses in the structure. Second, the redundancies in the structure cause secondary
prestressing moments and moments due to creep and shrinkage deformations. Third, the bridge is subject
to service live loads that need to be accounted for. All of these aspects are incorporated into the effective
prestress force calculation in Equation (3.1). The terms in this equation are outlined below and an example
of the calculation procedure is presented in Appendix D.
sw live other sw other cr
e SE con cr
cr cr cr cr
M M M y P P IP A
I A e y
Where:
Pe is the effective prestress force.
σSE is the self-equilibrating stress at the bottom flange due to thermal gradients.
σcon is the continuity stress associated with thermal moments.
Msw is the self-weight moment.
Mlive is the live-load moment.
Mother is the moment due to secondary effects from prestressing, creep and shrinkage.
(3.1)

29
Icr is the cracked transformed moment of inertia of the box girder.
Psw is the axial force due to the self-weight of the structure.
Pother is the axial force due to secondary effects from prestressing, creep, and shrinkage.
Acr is the cracked transformed area of the box girder.
ecr is the tendon eccentricity from the cracked centroid.
ycr is the distance from the cracked centroid to the top of the bottom flange of the section.
3.3.2 Section Properties
Transformed, partially-cracked section properties are used in the calculation of effective prestress
force. Mild steel is not considered in the transformed section because it does not extend through epoxy
joints. A partially-cracked section was considered because of the location of ST01, and the crack-
monitoring LVDTs on the top of the bottom flange. All live-load strain and crack-opening data is recorded
at the point at which the bottom flange is entirely decompressed, as seen in Figure 3.7.
Figure 3.7. Cracked section used in the analysis.
3.3.3 Self-Weight Moment
The self-weight moment is calculated through the staged construction analysis of the FE model. The
self-weight of the superstructure consists of the section of the box girder as shown in Figure 1.5, and also
includes deviator blocks, and concrete guardrails. Deviator blocks are applied as point loads to the structure
at their respective locations while the rest of the self-weight is incorporated as a distributed load totaling
15.86 klf. Figure 3.8 shows the moment in Span 6 due to self-weight and displays the moment calculated
at Section A-A.

30
Figure 3.8. Dead-load moment in Span 6.
3.3.4 Live Load Moment
The live-load moment at Section A-A is calculated from the strain measured by the ST01 strain
transducer at Section B-B. This is accomplished by calculating the moment at Section B-B associated with
the strain in the bottom flange, then correlating the maximum moment at Section B-B to a maximum
moment at Section A-A. This correlation is made by conducting an influence line analysis on Span 6 of the
VEB. The maximum moment envelope from this analysis is shown in Figure 3.9 as a fraction of the moment
at Section B-B. The ratio used to correlate moment at A-A to moment at B-B is 0.689.
Figure 3.9. Span 6, max moment envelope.
3.3.5 Self-Equilibrating Stresses
Stresses, resulting from non-linear thermal gradients are divided into self-equilibrating (SE) stresses
and continuity stresses as outlined in Report 276 (NCHRP 1985). Once these values are calculated, the
20,690
-30000
-20000
-10000
0
10000
20000
30000
40000
0 10 20 30 40 50 60 70 80 90 100 110 120 130 140 150
Mo
me
nt,
kip
-ft
Distance from Pier 6, ft
0.689
1.00
0.0
0.2
0.4
0.6
0.8
1.0
1.2
0 10 20 30 40 50 60 70 80 90 100 110 120 130 140 150
Mo
me
nt,
as a
Fra
ction
of
Mo
me
nt
at S
ection
B-B
Distance from Pier 6, ft.

31
principle of superposition is used to sum them together to get the total stress distribution due to the thermal
gradient. First, the method of calculating SE stresses is described, then the method of calculating continuity
stresses is outlined.
SE stresses arise from the difference between thermal strains which would result from a free
expansion of the section fibers, and the strains in the resultant plane section (NCHRP 1985). This concept
of strain difference is illustrated in Figure 3.10.
Figure 3.10. Strain difference that results in self-equilibrating stress.
SE stresses can also be conceptualized as the stresses due to the thermal gradient in an artificially
restrained structure plus the stresses resulting from the axial load and moment that would be required to
remove the artificial restraints (NCHRP 1985). By this method, calculating SE stresses at the top of the
bottom flange begins by removing all of the interior supports and then artificially restraining the approach
structure at Piers 1 and 7. The thermally-induced stress at the bottom flange is then calculated using
Equation (3.2).
11 - t E T
20BWhere:
E is the modulus of elasticity
α is the coefficient of thermal expansion
∆T1 is the difference in temperature between the coolest location, and TC1.
(3.2)
Next, the restraining axial force and moment are calculated using Equations (3.3) and (3.4). Equal
and opposite forces and moments are then applied to the structure to restore deflections and rotations.
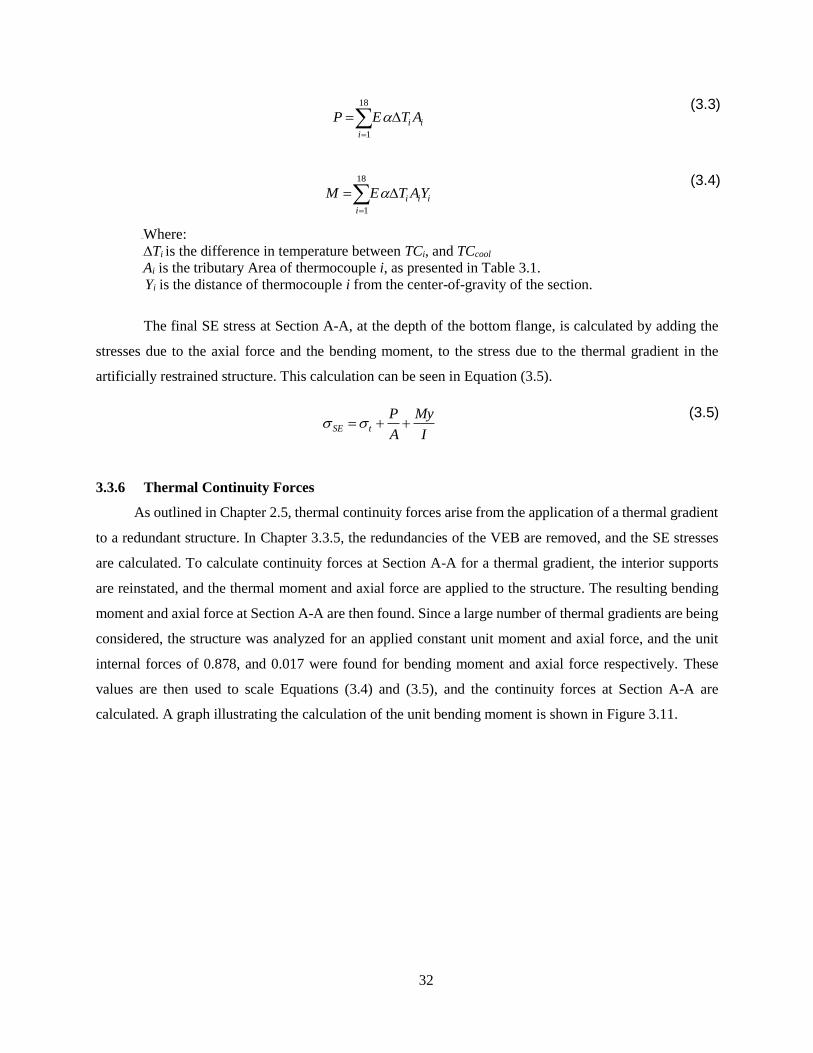
32
18
1
i i
i
P E T A
(3.3)
18
1
i i i
i
M E T AY
24BWhere:
25B∆Ti is the difference in temperature between TCi, and TCcool
26BAi is the tributary Area of thermocouple i, as presented in Table 3.1.
Yi is the distance of thermocouple i from the center-of-gravity of the section.
(3.4)
The final SE stress at Section A-A, at the depth of the bottom flange, is calculated by adding the
stresses due to the axial force and the bending moment, to the stress due to the thermal gradient in the
artificially restrained structure. This calculation can be seen in Equation (3.5).
SE t
P My
A I
(3.5)
3.3.6 Thermal Continuity Forces
As outlined in Chapter 2.5, thermal continuity forces arise from the application of a thermal gradient
to a redundant structure. In Chapter 3.3.5, the redundancies of the VEB are removed, and the SE stresses
are calculated. To calculate continuity forces at Section A-A for a thermal gradient, the interior supports
are reinstated, and the thermal moment and axial force are applied to the structure. The resulting bending
moment and axial force at Section A-A are then found. Since a large number of thermal gradients are being
considered, the structure was analyzed for an applied constant unit moment and axial force, and the unit
internal forces of 0.878, and 0.017 were found for bending moment and axial force respectively. These
values are then used to scale Equations (3.4) and (3.5), and the continuity forces at Section A-A are
calculated. A graph illustrating the calculation of the unit bending moment is shown in Figure 3.11.

33
Figure 3.11. Thermal continuity moments normalized by the applied thermal moment.
3.3.7 Secondary Prestress, creep, and shrinkage effects
Prestressing, creep and shrinkage are all applied deformations to the structure. These deformations
result in forces due to the redundancies within the approach unit which are termed secondary prestress,
creep and shrinkage forces respectively. Both moments and axial forces are caused by these three applied
deformations.
Secondary prestress effects are caused when the structure is stressed. In the simply supported case,
the superstructure would tend to shorten and camber upward. When redundancies are present, however,
these deformations are restrained by the superstructure’s own self-weight, and the stiffness of the bearing
supports. At Section A-A, the secondary prestressing moment, M2 is 14,456 kip-ft while the secondary
prestressing axial force, P2 is 14.5 kip (T).
Creep and shrinkage effects are caused by the restrained deformation over the life of the structure.
The axial forces and moments due to these imposed deformations are tabulated in the FE model separately
from other forces. Creep causes axial shortening and bending in both the superstructure and the
substructure. At Section A-A, the bending moment due to creep, Mcr is taken to be 1,483 kip-ft while the
axial force, Pcr is -133 kip (C). The compressive nature of the creep axial force is a result of the restrained
bending of the substructure. Shrinkage only causes shortening of the superstructure and substructure
without any bending. This results in an axial force at Section A-A, Psh is calculated as 197 kip (T) and a
bending moment, Msh is 148 kip-ft. The small amount of bending moment due to shrinkage results from
differential shortening of the substructure.
0.878
0.00
0.20
0.40
0.60
0.80
1.00
1.20
1.40
0 100 200 300 400 500 600 700 800 900 1,000
No
rma
lize
d B
end
ing
Mo
me
nt
Distance from Abutment 1, ft
Se
ction
A-A

34
3.4 Re-Installation of the Long-Term System
In March of 2019, the long-term monitoring system was re-installed in Span 6 of the VEB. This
purpose of this system is to gather more up-to-date data on effective prestress force and to gather data in
adjacent spans. The sensor layout in the new installation is the same as described in Chapter 3.1 with the
addition of several sensors described below. Thermocouples were left installed in the superstructure when
the original long-term monitoring system was decommissioned in 2014. These thermocouples were re-
connected to the data logger and found to be operational.
In addition to the strain gages and LVDTs described in Chapter 3.1, several sensors were installed
to gather more data in Span 6 as well as Span 5. An additional strain transducer was installed at Section B-
B on the bottom of the top flange to record localized strains due to individual axles. This information will
be used to better estimate the distribution of loads for the calculation of the live-load moment. Also, an
LVDT was installed at the mid-span of Span 5, on the top of the bottom flange to investigate crack opening
at that location. Last, two additional LVDTs are to be installed at Section A-A on the bottom of the bottom
flange to measure first crack opening at the extreme fiber in tension. These LVDTs were not installed along
with the rest of the sensors due to the difficulty of access to this location. The locations of these additional
sensors, as well as the sensors re-installed in Span 6, are pictured in Figure 3.12.
Figure 3.12. Sensors re-installed on to the Span-6, long-term monitoring system.

35
Results and Discussion
This Chapter presents analysis results, aimed to estimate the effective prestress force using field
monitoring data and to comparatively evaluate, by means of finite element (FE) analyses, the effective
prestress force obtained with different code expressions for long-term losses. First, the FE model presented
in the previous chapter is validated, by comparing the analytically calculated deflections to corresponding
live-load test data obtained in 2012. After that, the effective-prestress estimates obtained from the model
are presented, followed by an estimate of the same value using field data. The chapter is completed with a
calculation of the flexural capacity of the bridge girder.
4.1 Validation of the Finite Element Model
The FE model is validated, by verifying its capability to reproduce deflections obtained during live-
load testing on the Varina-Enon Bridge (VEB), conducted by Maguire (2013) in August of 2012. During
these tests, two load trucks crossed the approach unit at highway speeds in three different load
configurations. The first load configuration consisted of one truck driving in the center lane, the second
consisted of the same truck driving in the left lane, and the third consisted of both load trucks side-by-side.
Vertical deflections were measured at the mid-span of Span 5 by a deflectometer mounted on the bottom
flange of the section.
The axle loads were applied to the FE model as static loads, without any dynamic amplification
factors. The analytically-obtained and field-recorded maximum mid-span deflections for Span 5 are
compared in Table 4.1. The FE model satisfactorily reproduces the live-load test values of deflection, with
the normalized difference ranging from 0.2% for load configuration 2, to 21.1% for load configuration 3.
Table 4.1. Comparison of vertical deflections at mid-span of Span 5.
Load Configuration
Span 5, Mid-Span Deflection, in. Normalized Difference
Live-Load Test Results
FE Model Results
LC1 -0.03 -0.035 16.9%
LC2 -0.035 -0.035 0.2%
LC3 -0.062 -0.075 21.1%

36
4.2 Finite Element Results
Three time-dependent, staged-construction analyses were conducted on the FE model. Results are
obtained from these analyses over the life-span of the structure. For each analysis, one of three code
expressions for creep and shrinkage were used to estimate long-term prestress losses. For the purposes of
this project, CEB-FIP ’78, CEB-FIP’90, and AASHTO codes were used. The average tendon-stress profiles
for these three analyses are shown in Figure 4.1 along with the average tendon profile before any long-term
losses occur. The average jacking force in Span 6 was 879 kips resulting in average jacking stress of 213.1
ksi.
Figure 4.1. Span 6 tendon-stress profiles taken at 9,500 days.
The original design of the VEB utilized the CEB-FIP ’78 model code expression for creep and
shrinkage to estimate long-term prestress losses. The average total prestress loss at Section A-A using this
code expression is 41.9 ksi. This represents what designers would have expected of the bridge’s long-term
performance in 1986. The prestress loss estimation from the analysis utilizing the CEB-FIP ’90 code
expression is 43.3 ksi at Section A-A. This is the largest loss estimate of the FE analyses. The lowest
estimate is calculated from the analysis utilizing the AASHTO specification expression for creep and
shrinkage, at 38.1 ksi.
The FE model was also used to estimate the projected prestress loss at the age of 50 and 100 years.
This progression of prestress loss over time can be seen in Figure 4.2 for ages up to 20,000 and 36,000 days
160
165
170
175
180
185
190
195
200
205
0 20 40 60 80 100 120 140
Eff
ective
Pre
str
ess, ksi
Distance from Pier 6, ft
No long-termlosses
CEB-FIP 78
CEB-FIP 90
AASHTO

37
(approximately 50 and 100 years respectively). In addition, the prestress loss is estimated for the time frame
from 2013 to 2019. The estimated average prestress loss over this 6-year period is 0.7 ksi, 0.9 ksi, and 0.7
ksi, for the analysis utilizing the CEB-FIP ’78, ’90 and AASHTO code expressions, respectively.
Figure 4.2. Progression of prestress loss with time, at Section A-A of Span 6.
In addition to prestress loss, the progression of deflection is calculated by the FE analyses. These
deflections give a good picture of the serviceability performance of the structure. Significant long-term
deflections may cause future serviceability concerns. The deflections at mid-span of Span 6 were calculated
using the FE model, and are shown in Figure 4.3. The analysis utilizing the CEB-FIP ’90 creep and
shrinkage code expressions calculates the largest deflection at 9,500 days of -0.297 in., while the analysis
utilizing AASHTO creep and shrinkage code expressions calculates the smallest deflection of -0.12 in.
Figure 4.3. Progression of mid-span deflections in Span 6.
165
170
175
180
185
190
195
200
0 10,000 20,000 30,000 40,000
Effe
ctiv
e P
rest
ress
, ks
i
Time, days
CEB-FIP '78
CEB-FIP '90
AASHTO
-0.40
-0.35
-0.30
-0.25
-0.20
-0.15
-0.10
-0.05
0.00
0.05
0.10
0 10,000 20,000 30,000 40,000
Sp
an
6, M
id-S
pan
De
fle
ction
, in
.
Time, days
CEB-FIP '78
CEB-FIP '90
AASHTO

38
4.3 Field Measurement Results
In addition to FE model results, data from the long-term monitoring system was used to calculate
values of effective prestress for each crack-opening event. A total of 6,697 events were recorded over a
one-year period in 2013. The average effective-prestress value of these events is 153.9 ksi and the standard
deviation is 6.7 ksi. The maximum crack width recorded was 0.0274 in., but the large majority of crack
openings were significantly smaller than this maximum value. Effective-prestress values are plotted against
their corresponding crack displacements in Figure 4.4. The distribution of prestress values can be seen by
the histogram in Figure 4.5.
Figure 4.4. Effective prestress vs. crack opening for all 2013 events.
100
110
120
130
140
150
160
170
180
0.000 0.005 0.010 0.015 0.020 0.025 0.030
Eff
ective
Pre
str
ess, ksi
Crack Displacement, in.
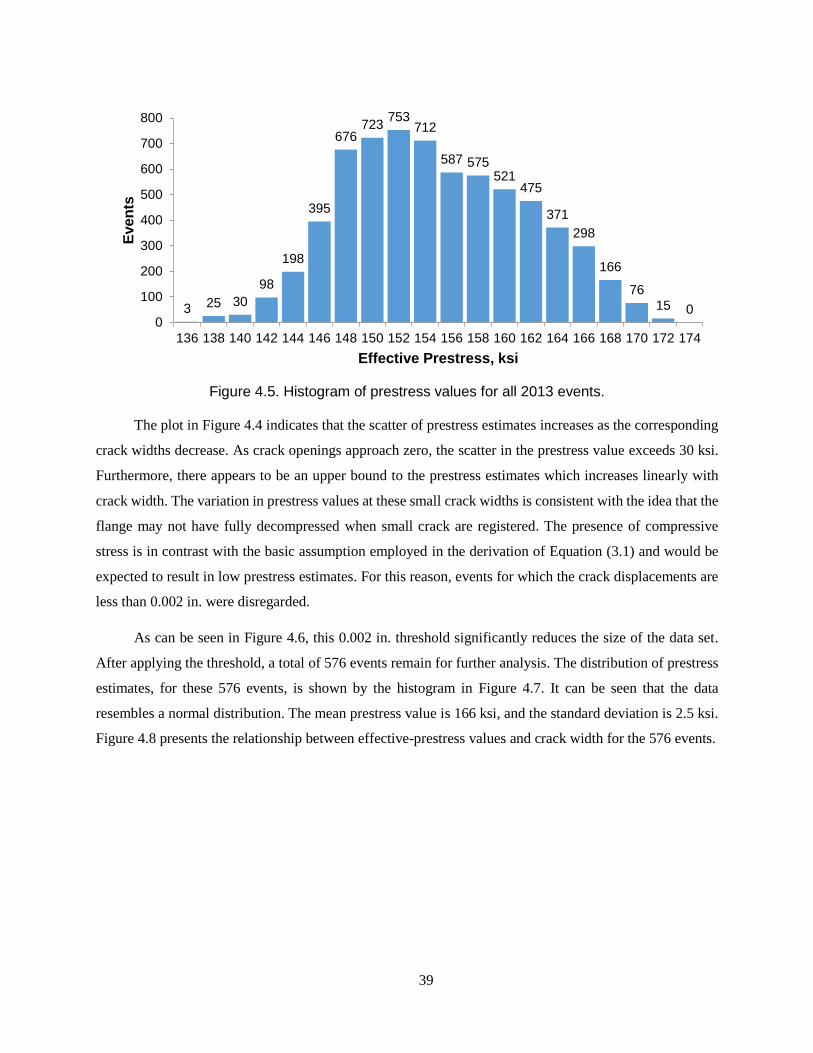
39
Figure 4.5. Histogram of prestress values for all 2013 events.
The plot in Figure 4.4 indicates that the scatter of prestress estimates increases as the corresponding
crack widths decrease. As crack openings approach zero, the scatter in the prestress value exceeds 30 ksi.
Furthermore, there appears to be an upper bound to the prestress estimates which increases linearly with
crack width. The variation in prestress values at these small crack widths is consistent with the idea that the
flange may not have fully decompressed when small crack are registered. The presence of compressive
stress is in contrast with the basic assumption employed in the derivation of Equation (3.1) and would be
expected to result in low prestress estimates. For this reason, events for which the crack displacements are
less than 0.002 in. were disregarded.
As can be seen in Figure 4.6, this 0.002 in. threshold significantly reduces the size of the data set.
After applying the threshold, a total of 576 events remain for further analysis. The distribution of prestress
estimates, for these 576 events, is shown by the histogram in Figure 4.7. It can be seen that the data
resembles a normal distribution. The mean prestress value is 166 ksi, and the standard deviation is 2.5 ksi.
Figure 4.8 presents the relationship between effective-prestress values and crack width for the 576 events.
3 25 30
98
198
395
676723
753712
587 575521
475
371
298
166
76
15 00
100
200
300
400
500
600
700
800
136 138 140 142 144 146 148 150 152 154 156 158 160 162 164 166 168 170 172 174
Eve
nts
Effective Prestress, ksi

40
Figure 4.6. Frequency of crack displacement widths for all 2013 events.
Figure 4.7. Histogram of effective prestress for 2013 events with corresponding crack openings of 0.002 in. or greater.
5,887
234 139 91 74 67 47 35 30 28 650
1,000
2,000
3,000
4,000
5,000
6,000
7,000
0.001 0.002 0.003 0.004 0.005 0.006 0.007 0.008 0.009 0.01 More
Eve
nts
Crack Displacement, in.
07
127
2734
46
83
109
90
70
49
27
13
2 00
20
40
60
80
100
120
158 159 160 161 162 163 164 165 166 167 168 169 170 171 172 173
Eve
nts
Effective Prestress, ksi
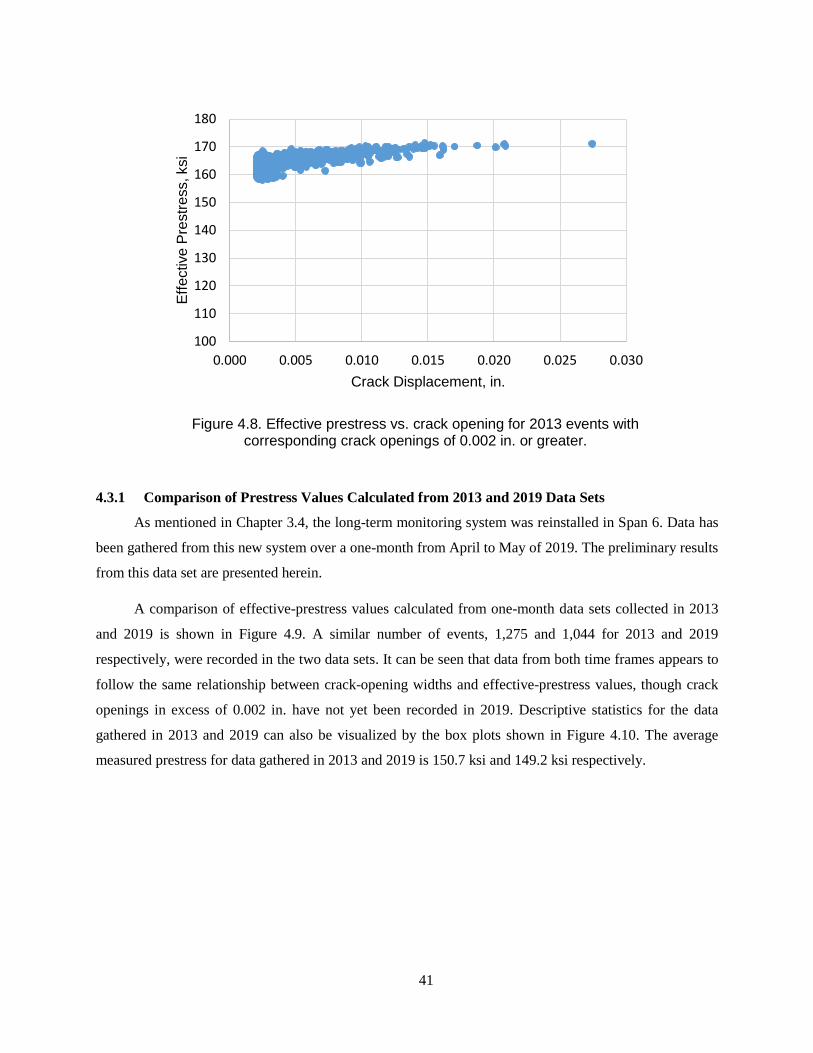
41
Figure 4.8. Effective prestress vs. crack opening for 2013 events with corresponding crack openings of 0.002 in. or greater.
4.3.1 Comparison of Prestress Values Calculated from 2013 and 2019 Data Sets
As mentioned in Chapter 3.4, the long-term monitoring system was reinstalled in Span 6. Data has
been gathered from this new system over a one-month from April to May of 2019. The preliminary results
from this data set are presented herein.
A comparison of effective-prestress values calculated from one-month data sets collected in 2013
and 2019 is shown in Figure 4.9. A similar number of events, 1,275 and 1,044 for 2013 and 2019
respectively, were recorded in the two data sets. It can be seen that data from both time frames appears to
follow the same relationship between crack-opening widths and effective-prestress values, though crack
openings in excess of 0.002 in. have not yet been recorded in 2019. Descriptive statistics for the data
gathered in 2013 and 2019 can also be visualized by the box plots shown in Figure 4.10. The average
measured prestress for data gathered in 2013 and 2019 is 150.7 ksi and 149.2 ksi respectively.
100
110
120
130
140
150
160
170
180
0.000 0.005 0.010 0.015 0.020 0.025 0.030
Eff
ective
Pre
str
ess, ksi
Crack Displacement, in.

42
Figure 4.9. Effective prestress vs. crack opening for 2013 and 2019.
Figure 4.10. Box plots of effective-prestress estimates from April to May of 2013 and
2019.
130
140
150
160
170
0.000 0.005 0.010 0.015 0.020
Eff
ective P
restr
ess, ksi
Crack Displacement, in.
Spring 2013 Spring 2019
135
140
145
150
155
160
165
170
2013 2019
Eff
ective P
restr
ess, ksi
Data Sets

43
4.4 Finite Element and Field Data Comparison
The FE model was developed to verify the accuracy of the assumptions made in calculating effective
prestress from field data. A comparison of the results from the FE analyses as well as the field-data
calculations is shown in Table 4.2. Total losses are calculated by subtracting the effective prestress from
the original jacking stress. The jacking stress was assumed to be 213 ksi for all analyses. Both short-term
and long-term losses are included in the total loss.
Table 4.2. Comparison of prestress-loss estimations from field data and FE analysis.
Average prestress loss at 9,500 days, ksi
Percent difference from field estimates
Field Measurements 47.3 n.a.
FE model - CEB-FIP '78 41.9 11.5%
FE model - CEB-FIP '90 43.3 8.4%
FE model - AASHTO 38.1 19.4%
4.5 Flexural strength
It is well-known and documented, e.g. AASHTO 2012 and Naaman 2012, that the ultimate flexural
strength of prestressed concrete members with unbonded tendons depends on the effective prestress, rather
than the ultimate strength of the prestressing strands. Table 4.3 tabulates the sectional, flexural strength at
Section B-B (Mn+) and at the inside face of Pier 6 (Mn
-). The demands from the AASHTO Strength I Load
Combination are 67,970 kip-ft, and -5,642 kip-ft for the positive and negative critical sections respectively.
Table 4.3. Flexural strength resulting from various effective-prestress estimations.
t = 9,500 days t = 50 years t = 100 years
fpe
(ksi)
φMn+
(kip-ft)
φMn-
(kip-ft)
fpe
(ksi)
φMn+
(kip-ft)
φMn-
(kip-ft)
fpe
(ksi)
φMn+
(kip-ft)
φMn-
(kip-ft)
Measured mean
(total) 154 71,880 38,270 NA NA NA NA NA NA
Measured mean
(cr > 0.002 in.) 166 75,710 40,490 NA NA NA NA NA NA
CEB-FIP '78 173 78,160 41,910 171 77,470 41,510 171 77,470 41,510
CEB-FIP '90 170 76,990 41,240 167 76,130 40,740 167 76,050 40,690
AASHTO 175 78,680 42,210 173 78,040 41,840 173 78,040 41,840

44
Summary, Conclusions, and Recommendations
for Future Work
5.1 Summary
The Virginia Department of Transportation identified flexural cracking in the bottom flange of the
Varina-Enon Bridge (VEB) in the summer of 2012. This cracking may be the result of several factors,
including inadequate effective prestress force. The purpose of this thesis was to investigate the time-
dependent, longitudinal flexural behavior of the VEB and estimate the effective prestress. Data from a
previous project on the VEB was utilized along with a finite element (FE) model to evaluate the structure.
The field data was used to calculate prestress force by assuming that the concrete stress at the time of crack
opening was zero. The FE model was used to verify the field-data results by conducting time-step analyses
which utilized multiple code expressions for creep and shrinkage.
Field-data results were refined to exclude crack opening events of less than 0.002 in., to ensure the
validity of the assumptions employed to estimate the effective prestress. The average prestress calculated
from the remaining 576 events is 166 ksi. The FE model utilizes code expressions for creep and shrinkage
from the CEB-FIP 1978 and 1990 model codes, as well as the AASHTO LRFD Design Specification. The
average effective prestress from these analyses were 173.3, 169.7, and 174.9 ksi respectively.
This Chapter summarizes the main conclusions of the present study and presents recommendations
for future research on the VEB.
5.2 Conclusions
5.2.1 Expected and measured prestress
Estimates resulting from raw, field data suggests significantly larger prestress losses than predicted
by the FE analyses. Results more closely align with estimates from the FE analyses, however, when events
with crack openings less than 0.002 in. are excluded. Even after this threshold is applied, field-data
estimates still differ from the FE analysis results, but to a less significant degree.
The analysis using the CEB-FIP ’78 cod expressions results in underestimation of prestress losses
by 11.5% as compared to field-data estimates. This is considered to be within a reasonable margin of error
considering the complexity of the structure and the uncertainty inherent in creep and shrinkage calculations.
The analysis using the CEB-FIP ’90 code expressions most closely matches field-data estimates, only
45
underestimating losses by 8.4%. This is considered to be a very good agreement, and well within the margin
of error. Lastly, the analysis using the AASHTO code expressions underestimates losses by the largest
margin at 19.4%. Though this error is considerably larger than the previous two, This may be attributed to
relative simplicity of the AASHTO code expressions which take no consideration of the of material
properties beyond concrete strength.
In summary, the results from the FE analyses are found to be in good agreement with the results from
the field data. Thus, the FE model successfully verifies the assumptions and methods used to calculate
effective prestress via crack opening observations on in-service structures. Furthermore, the VEB does not
appear to be experiencing significantly larger prestress losses than would have been originally considered
at the design of the structure.
5.2.2 Future bridge performance.
Future prestress loss in the VEB may be of concern, but results from the FE model and the field data
conflict. Finite element analysis results indicate that the vast majority of prestress loss had already occurred
by 2013. The largest additional losses (beyond 2013) are estimated when using the CEB-FIP ’90 code
expression for creep and shrinkage. In this analysis the losses in 2013 represent 93.7% of the total 100-year
losses. Further research is needed, however, to validate this claim for two reasons. First, the literature
suggests that our current code expressions for creep and shrinkage do not adequately represent the
progression of these phenomena at old ages. All of the code expressions used in this study assumed a
bounded time-development of creep, but Research by Bazant et al. has shown that this is not the case.
Second, preliminary results from the long-term monitoring system indicate that the change in average
prestress from 2013 to 2019 is nearly twice that which was expected by the analysis utilizing the CEB-FIP
’90 code expressions.
When considering prestress loss, two major serviceability concerns arise. The first concern is that
cracking of the structure will cause accelerated deterioration due to moisture infiltration. In the case of the
VEB this is of little concern because the tendons are fully grouted and encapsulated in PVC ducts. The
second concern is that of deflections. In this regard also, there are not concerns with the VEB itself. In the
worst case FE analysis, deflection results indicate that the VEB has experience less than 1/2 in. of deflection
from its original camber.
Flexural strength is a concern when considering the effective prestress force in a prestressed concrete
member with unbonded tendons. In considering the worst-case estimate of flexural strength in the VEB,
the lowest estimate of effective prestress is taken. This estimate is calculated from the raw field data without
correction for small crack openings. The flexural strength is adequate for this effective-prestress value when

46
considering the AASHTO Strength I Load Combination. The demand-to-capacity ratios for this prestress
value are and 0.147 the positive and negative moments respectively.
5.3 Recommendations for Future Work
This research has investigated the estimation of effective prestress in Span 6 of the VEB. To better
assess the condition of the VEB as a whole, the following recommendations are made for continued work.
1. The literature suggests that current code expressions for creep and shrinkage underestimate
prestress losses as structures age beyond 10,000 days. The prestress loss in Span 6 should continue
to be monitored in order to assess, the rate at which prestress loss progresses. This progression
should then be compared to current model codes.
2. The literature also indicates that the Model B4 provides a more accurate estimation of prestress
loss at ages beyond 10,000 days. This analytical model should be incorporated into the FE model,
and the results should be compared to the CEB-FIP and AASHTO model codes.
3. LVDTs were originally installed on the top of the bottom flange to measure first crack opening
because of access constraints. For the purpose of this thesis, it was assumed, at the time of registered
crack opening, that the entire bottom flange had decompressed, and cracked section properties were
used as such. To investigate the validity of this assumption, LVDTs should be installed on the
bottom of the bottom flange in addition to the top of the bottom flange and results should be
compared.
4. Though an estimate of prestress loss has been made in Span 6, similar cracking has been identified
at other locations throughout the bridge. These crack locations should be monitored in a similar
fashion, to Span 6, to determine if larger than expected losses are found at these additional
locations.
5. A more detailed analysis should be conducted to determine how the progression of prestress loss
affects the future load rating of the VEB.

47
BIBLIOGRAPHY
AASHTO (2012). "AASHTO LRFD Bridge Design Specifications." American Association of State
Highway and Transportation Officials, Washington, DC.
ACI 209 (2008). "Buide for Modeling and Calculating Shrinkage and Creep in Hardened Concree."
American Concrete Institute, Farmington Hills, MI.
ACI 423 (2016). "ACI 423.10R-16 Guide to Estimating Prestress Losses." American Concrete Institute.
Bažant, Ž. P., and Baweja, S. (1995). "Creep and Shrinkage Prediction Model for Analysis and Design of
Concrete Structures: Model B3."Farmington Hills, MI.
Bažant, Ž. P., Hubler, M. H., and Yu, Q. (2011). "Pervasiveness of excessive segmental bridge deflections:
Wake-up call for creep." ACI Structural Journal, 108(6), 766-774.
Bažant, Ž. P., and Jirasek, M. (2018). Creep and Hygrothermal Effects in Concrete Structures, Springer
Science+Business Media B.V., Dordrecht, The Netherlands.
Bažant, Ž. P., Yu, Q., Li, G.-H., Klein, G. J., and Křístek, V. (2010). "Excessive Deflection of Record-Span
Prestressed Box Girder." Concrete International, 32(6), 8.
CEB-FIP (1978). Model Code for Concrete Structures.
F&M Engineers, I. (1993). "Owner's Manual for Inspection and Maintenance of Segmental Concrete
Approach and Main Span." Varina Enon BridgePrepared for: Virginia Department of
Transportation.
Garber, D. B., Gallardo, J. M., Deschenes, D. J., and Bayrak, O. (2015). "Experimental investigation of
prestress losses in full-Scale bridge girders." ACI Structural Journal, 112(5), 553-564.
Halsey, J. T., and Miller, R. (1996). "Destructive testing of two forty-year-old prestressed concrete bridge
beam." PCI Journal, 41(5), 84-93.
Labia, Y., Saiidi, M. S., and Douglas, B. (1997). "Full-scale testing and analysis of 20-year-old pretensioned
concrete box girders." ACI Structural Journal, 94(5), 471-482.
Maguire, M. (2013). "Transverse and Longitudinal Bending of Segmental Concrete Box Girder Bridges."
Doctor of Philosophy, Virginia Tech, Blacksburg, VA.
Maguire, M., Moen, C. D., Roberts-Wollmann, C., and Cousins, T. (2015). "Field Verification of Simplified
Analysis Procedures for Segmental Concrete Bridges." Journal of Structural Engineering, 141(1),
D4014007 (4014011 pp.).
Maguire, M., Roberts-Wollmann, C., and Cousins, T. (2018). "Live-Load Testing and Long-Term
Monitoring of the Varina-Enon Bridge: Investigating Thermal Distress." Journal of Bridge
Engineering, 23(3).

48
Maguire, M., Roberts-Wollmann, C. L., and Cousins, T. (2014). "Live Load Test and Long Term
Monitoring of the Varina-Enon Bridge." Virginia Tech, Blacksburg, VA.
Naaman, A. E. (2012). Prestressed Concrete Analysis and Design, Techno Press 3000, Ann Arbor, MI.
NCHRP (1985). "Thermal Effects in Concrete Bridge Superstructures." T. R. Board, ed., National Research
Council, Washington, D.C.
OPAC (2000). "Koror-Babeldoab Bridge." <https://www.opacengineers.com/projects/Koror>.
Osborn, G. P., Barr, P. J., Petty, D. A., Halling, M. W., and Brackus, T. R. (2012). "Residual prestress
forces and shear capacity of salvaged prestressed concrete bridge girders." Journal of Bridge
Engineering, 17(2), 302-309.
Pessiki, S., Kaczinski, M., and Wescott, H. H. (1996). "Evaluation of effective prestress force in 28-year-
old prestressed concrete bridge beams." PCI Journal, 41(6), 78-89.
Priestley, M. J. N. (1978). "Design of Concrete Bridges for Temperature Gradients." Journal Proceedings,
75(5).
Shenoy, C., V., and Frantz, G. C. (1991). "Structural Tests of 27-Year-Old Prestressed Concrete Bridge
Beams." PCI Journal, 36(5), 11.
Tabatabai, H., and Dickson, T. J. (1993). "Structural Evaluation of a 34-Year-Old Precast Post-Tensioned
Concrete Girder." PCI Journal, 38(5), 14.
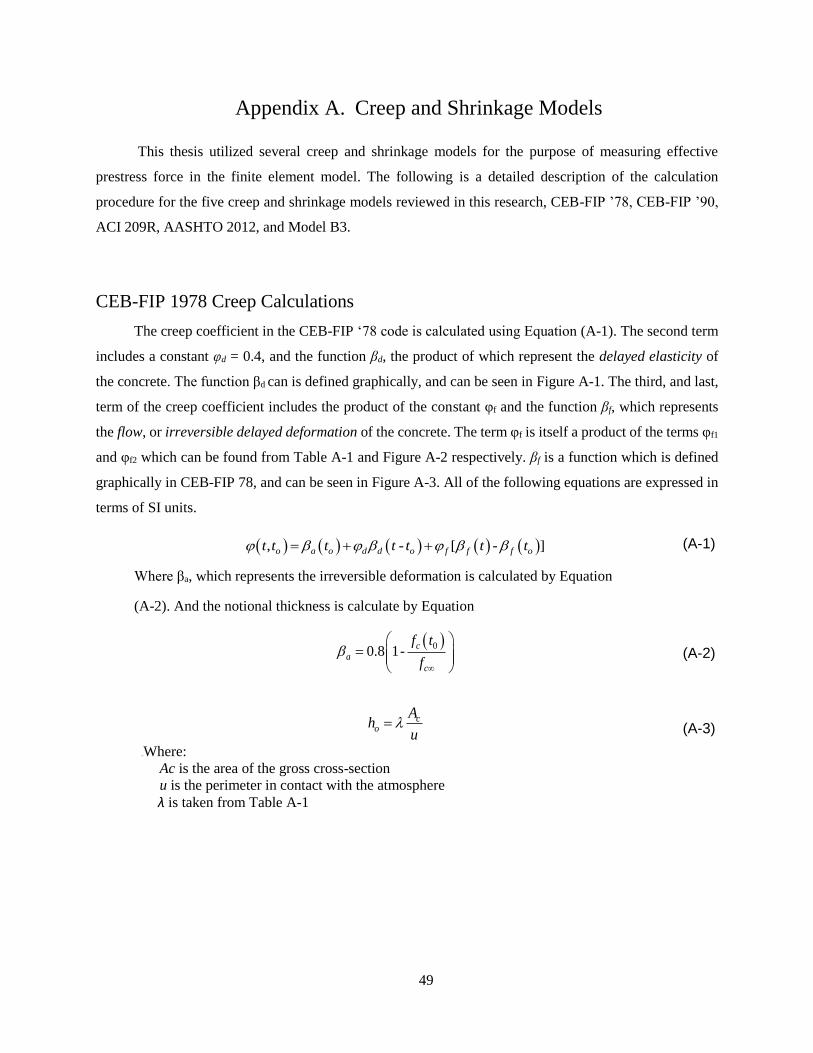
49
Appendix A. Creep and Shrinkage Models
This thesis utilized several creep and shrinkage models for the purpose of measuring effective
prestress force in the finite element model. The following is a detailed description of the calculation
procedure for the five creep and shrinkage models reviewed in this research, CEB-FIP ’78, CEB-FIP ’90,
ACI 209R, AASHTO 2012, and Model B3.
CEB-FIP 1978 Creep Calculations
The creep coefficient in the CEB-FIP ‘78 code is calculated using Equation (A-1). The second term
includes a constant φd = 0.4, and the function βd, the product of which represent the delayed elasticity of
the concrete. The function βd can is defined graphically, and can be seen in Figure A-1. The third, and last,
term of the creep coefficient includes the product of the constant φf and the function βf, which represents
the flow, or irreversible delayed deformation of the concrete. The term φf is itself a product of the terms φf1
and φf2 which can be found from Table A-1 and Figure A-2 respectively. βf is a function which is defined
graphically in CEB-FIP 78, and can be seen in Figure A-3. All of the following equations are expressed in
terms of SI units.
, - [ - ]o a o d d o f f f ot t t t t t t (A-1)
Where βa, which represents the irreversible deformation is calculated by Equation
(A-2). And the notional thickness is calculate by Equation
00.8 1-
c
a
c
f t
f
(A-2)
co
Ah
u
28BWhere:
Ac is the area of the gross cross-section
u is the perimeter in contact with the atmosphere
λ is taken from Table A-1
(A-3)
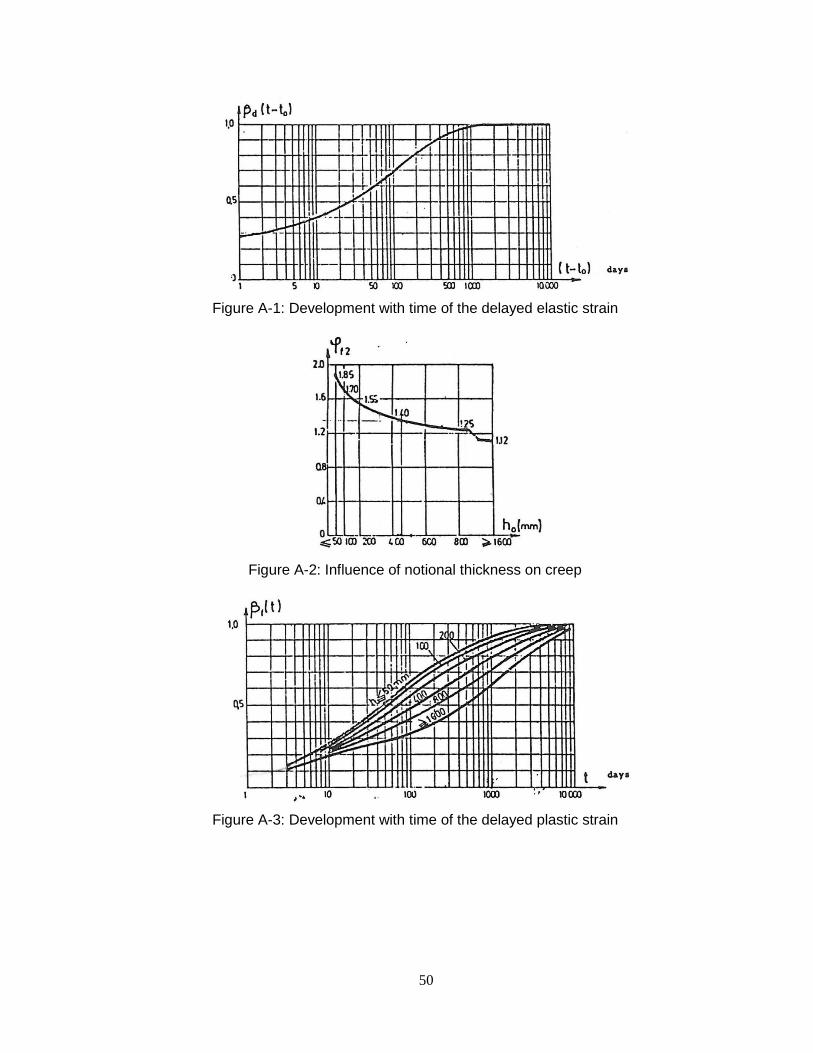
50
Figure A-1: Development with time of the delayed elastic strain
Figure A-2: Influence of notional thickness on creep
Figure A-3: Development with time of the delayed plastic strain

51
Table A-1: Basic coefficients of creep and shrinkage.
CEB-FIP 1978 Shrinkage Calculations
Shrinkage strain, as formulated in the CEB-FIP 78 code, depends primarily on ambient
environment and notional thickness. Equation (A-4) shows the calculation of shrinkage strain, which is
added to the elastic and creep strains to calculate the total long-term strain in the concrete. The term, βd is
a function which is defined graphically in CEB-FIP 78, and is shown in Figure A-4.
( , ) -s o so s s ot t t t
32BWhere the basic shrinkage coefficient, εso is calculated by Equation (A-5)
(A-4)
1 2so s s
Where:
εs1 is found in Table A-1
εs2 is taken from Figure A-5
(A-5)

52
Figure A-4: Influence of the notional thickness on shrinkage
Figure A-5: Influence of the notional thickness on shrinkage

53
CEB-FIP 1990 Creep Calculations
In the CEB-FIP ’90 formulation of creep and shrinkage models, the creep compliance function
which describes the stress dependent strain, per unit stress is calculated using Equation (A-10). All of the
following calculations are in terms of lb. and in.
28
28
,1( , )
o
o
cmto cm
t tJ t t
E E
(A-6)
1
281
2 /
28=
s
t t
cmt cmE E e
Where t is the age of concrete at the time of interest, and t1 = 1 day. And the
coefficient, s is taken from Table A-2.
(A-7)
28328 3,118310 cm
cm E
cmo
fE
f
Where fcmo = 1450 psi. and αE is taken from Table A-3
(A-8)
28 ` 1160psicm cf f
Where f`c is the specified compressive cylinder strength defined as the strength below
which 5% of all possible strength measurements for the specified concrete may be expected
to fall.
(A-9)
28 , ( - )o o c ot t t t
33BWhere
(A-10)
28( ) ( )o RH cm oh f t (A-11)
1 23
1- /( ) 1
0.1[( / ) / ( / ) ]
oRH
o
h hh
V S V S
Where (V/S) is the volume to surface ratio of the section, and h is the relative humidity
as a decimal. (V/S)o = 2 in. and ho = 1.
(A-12)
28
28
5.3( )=
/cm
cm cmo
ff f
(A-13)
0.2
1
1( )=
0.1 /o
o
tt t
0.7
1
28
3.5= cmo
cm
f
f
(A-14)

54
0.2
2
28
3.5= cmo
cm
f
f
(A-15)
And
0.3
1
c
1
/(t- )=
/
o
o
H o
t t tt
t t t
(A-16)
18
H 3 3=150 1 1.2 / 250 1500h V S
(A-17)
0.5
3
28
3.5= cmo
cm
f
f
(A-18)
Table A-2: Coefficient s, which depends on cement type.
Table A-3: Coefficient αE, Effect of aggregate type on modulus of elasticity..
CEB-FIP 1990 Shrinkage Calculations
Shrinkage strains in CEB-FIP model code ‘90 are calculated very similarly to shrinkage strains in
the ‘78 model code. Total shrinkage strains are the product of a notional shrinkage coefficient and a function
of shrinkage development with time, as shown in Equation (A-19).
( , ) ( – )sh c cso s ct t t t
Where tc is the age that drying ends (day).
(A-19)
28cso s cm RHf h (A-20)
–628 28 0160 10 9 – / 10s cm sc cm cmf f f
Where βsc is found in Table A-4.
(A-21)
3–1.55 1– /[ ( ) ] RH oh h h for 0.4 ≤ h < 0.99 (A-22)

55
0.25 RH h for h ≥ 0.99
0.5
1
21
- /( - )
350[( / ) / ( / ) ] - /
c
s c
o c
t t tt t
V S V S t t t
(A-23)
Table A-4: Coefficient βsc, which depends on cement type.
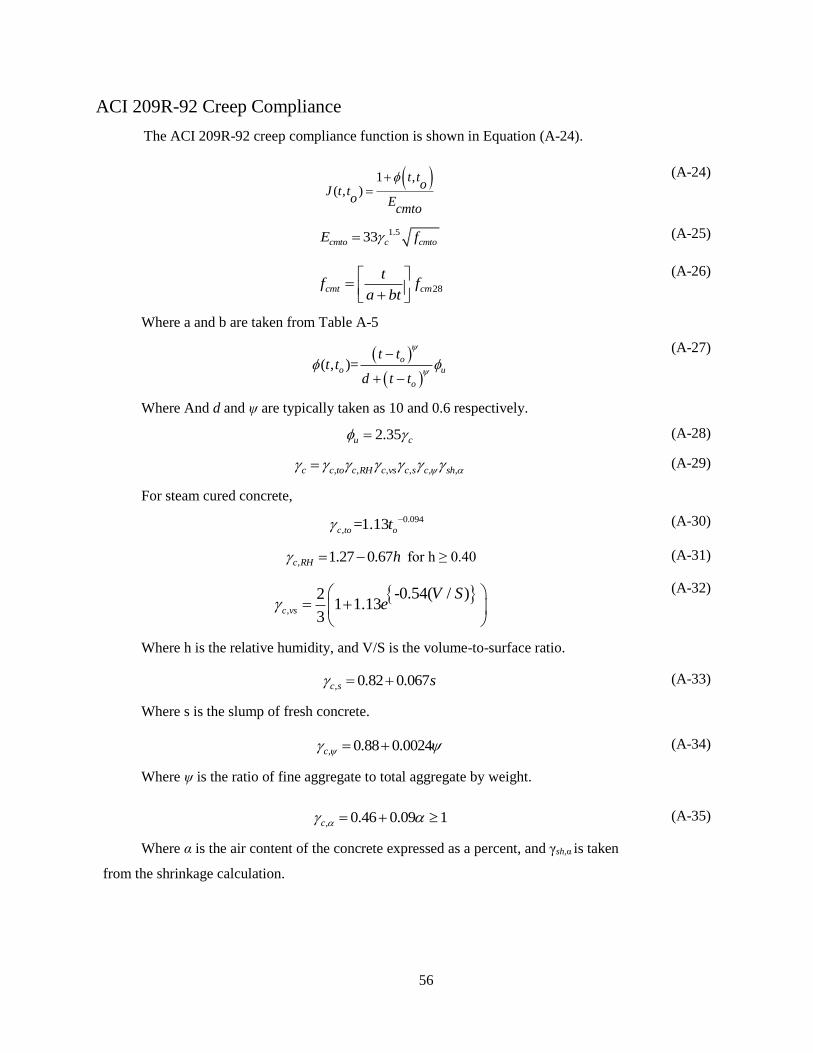
56
ACI 209R-92 Creep Compliance
The ACI 209R-92 creep compliance function is shown in Equation (A-24).
1 ,( , )
t to
J t to E
cmto
(A-24)
1.533cmto c cmtoE f (A-25)
28cmt cm
tf f
a bt
Where a and b are taken from Table A-5
(A-26)
( , )=
o
o u
o
t tt t
d t t
Where And d and ψ are typically taken as 10 and 0.6 respectively.
(A-27)
2.35u c (A-28)
, , , , , ,c c to c RH c vs c s c sh
For steam cured concrete,
(A-29)
0.094
, =1.13c to ot (A-30)
, 1.27 0.67c RH h for h ≥ 0.40 (A-31)
,
-0.54( / )21 1.13
3c vs
V Se
Where h is the relative humidity, and V/S is the volume-to-surface ratio.
(A-32)
, 0.82 0.067c s s
Where s is the slump of fresh concrete.
(A-33)
, 0.88 0.0024c
Where ψ is the ratio of fine aggregate to total aggregate by weight.
(A-34)
, 0.46 0.09 1c
Where α is the air content of the concrete expressed as a percent, and γsh,α is taken
from the shrinkage calculation.
(A-35)

57
Table A-5: Values of the constants a and b
ACI 209R-92 Shrinkage Calculation
The total shrinkage strain calculated by ACI 209R-92 is shown in Equation (A-36).
6780 10shu sh (in./in.) (A-36)
, , , , , , , sh sh tc sh RH sh vs sh s sh sh c sh (A-37)
, 1.0sh tc for steam cured concrete (A-38)
, 140 1.02sh RH h for 0.40 ≤ h ≤ 0.80 (A-39)
-0.12(V/S)
sh,vsγ =1.2e (A-40)
, 0.89 0.0161sh s s (A-41)
, 0.30 0.014sh for ψ ≤ 50%
, 0.90 0.002sh for ψ > 50%
(A-42)
, 0.75 0.00036sh c c
Where c is the cement content in lb/yd3
(A-43)
, 0.95 0.008sh ≥ 1 (A-44)

58
AASHTO 2012 Creep Calculation
Creep calculations are given in the AASHTO LRFD design specifications 6th edition, in section
5.4.2.3.2. No equation for creep compliance is given in the AASHTO specification. Rather, the creep
coefficient is simply calculated, as seen in Equation (A-45).
0.118( , )=1.9i s hc f td it t k k k k t
Where ti is the age of concrete at the time of load application (day)
(A-45)
1.45 0.13 / 1.0sk V S (A-46)
1.56 0.008 1.0hck H
Where H is the ambient relative humidity. The time-development of both creep
and shrinkage are:
(A-47)
61 4 `
tc
ci
tk
f t
(A-48)
AASHTO 2012 Shrinkage Calculation
Shrinkage strains in the AASHTO specification are calculated directly by Equation (A-49). If the
concrete is exposed to drying before 5 days of curing have elapsed, the shrinkage strain should be increased
by 20 percent.
3= 0.48 10sh s hs f tdk k k k
Where the humidity factor for shrinkage is:
(A-49)
2.00 0.014hsk H (A-50)

59
Model B3 Creep Calculation
The creep compliance function for the Model B3 consists of three parts which can be seen in
Equation (A-51). q1 represents the instantaneous strain due to the unit stress, Co(t,to) is the compliance
function for basic creep, and Cd(t,to) is the compliance function for drying creep.
1( , ) , , ,o o o d o cJ t t q C t t C t t t
Where q1 is taken as the instantaneous strain due to a unit stress, and is calculated by
Equation (A-52)
(A-51)
1
28
0.6
cm
qE
and
(A-52)
28 2857,000cm cmE f .
The compliance function for basic creep is composed of an aging viscoelstic
term, a non-aging viscoelastic term, and an aging flow term, as seen in Equation (A-54)
(A-53)
2 3 4, ( , ) ln[1 ] ln( / )
n
o o o o oC t t q Q t t q t t q t t
Where to is the age of concrete when the load is applied (days).
(A-54)
6 0.5 0.92 2886.814 10 cmq c f
Where c is the cement content of the concrete (lb/yd3)
(A-55)
1/
( , ) ( ) 1,
oo
r tr t
f o
o f o
o
Q tQ t t Q t
Z t t
(A-56)
1
2/9 4/90.086 1.21f o o oQ t t t
(A-57)
, ln 1m n
o o oZ t t t t t
Where m and n are empirical parameters who’s values can be taken as 0.5 and 0.1
respectively for all normal weight concretes.
(A-58)
0.12
1.7 8o or t t (A-59)
4
3 20.29 /q w c q (A-60)
0.76
4 0.14 10 /q a c
Where w/c and a/c are the water-to-cement and aggregate-to-cement ratios
respectively. The compliance function for drying creep is shown in Equation (A-62), and
can be seen to include drying from before loading begins.
(A-61)

60
1/2
5, , exp 8 exp 8 (d o c oC t t t q H t H t
Where tc is the age that drying commences (days).
(A-62)
6
1 65 280.757 10cm shq f
Where εshꚙ is the ultimate shrinkage strain as calculated in Equation (A-68).
(A-63)
1 1 cH t h S t t (A-64)
1 1o o cH t h S t t
Where S(t-tc) represents the time function for shrinkage as seen in Equation
(A-66).
(A-65)
1/2
( ) tanh cc
sh
t tS t t
(A-66)
Model B3 Shrinkage Calculation
The mean shrinkage strain in the cross section at a concrete age of t (days) is calculated using
Equation (A-67).
,sh c sh h ct t k S t t
Where kh is taken from Table A-6.
(A-67)
607
c sh
cmsh s
cm t
E
E
(A-68)
2.1 0.28 6
1 2 280.02565 270 10s cmw f
Where α1 and α2 are taken from Table A-7 and Table A-8 respectively.
(A-69)
0.5
284 0.85
cmt cm
tE E
t
(A-70)
20.08 0.25
28190.8 2sh c cm st f k V S
Where ks is taken from Table A-9.
(A-71)

61
Table A-6: Values for humidity dependent, kh
Table A-7: Values for α1 as a function of cement type
Table A-8: Values of α2 as a function of cement type
Table A-9: Values of ks as a function of cross section shape

62
Appendix B. Finite Element Model Report
INPUT PROPERTIES Count INPUT GEOMETRY Count Load Cases Count Universal Restraints NONE Joints 101 Load Cases 24
Materials 3 Members 91 Combination Cases NONE
Sections 7 Plates NONE Construction Stages 16
User Coordinate System NONE Springs 21 Linked Databases 2
Spring Curves NONE Isolaters NONE
Isolater Property NONE Mass Elements NONE
Creep Definitions 1 Slave / Masters NONE
Tendons 48
INPUT : Material Properties
Name Modulus of
Elasticity (lb/in²) Poisson Ratio
Shear Modulus (lb/in²)
Unit Weight (lb/in³) Thermal Expansion (1/ °F
*10^-6) Assigned
Fc_5500 5,000,000.00 0.1704 2,135,946.42 0.0897 5.500000 Yes Rigid Material 400,000.00 0.0000 200,000.00 0.0000 0.000000 Yes
A416 2.74e7 0.2946 1.06e7 0.2836 6.500000 Yes
INPUT : Joints
ID X
(ft) Y
(ft) Z
(ft) Translation DOF Rotation DOF Displacement UCS Assignment
1 0.0000 0.0000 100.9000 all free all free Global Yes
2 4.0000 0.0000 101.0200 all free all free Global Yes 3 5.0000 0.0000 101.0500 all free all free Global Yes
4 25.0000 0.0000 101.6498 all free all free Global Yes
5 45.0000 0.0000 102.2496 all free all free Global Yes
6 65.0000 0.0000 102.8494 all free all free Global Yes 7 85.0000 0.0000 103.4492 all free all free Global Yes
8 105.0000 0.0000 104.0490 all free all free Global Yes
9 125.0000 0.0000 104.6488 all free all free Global Yes
10 145.0000 0.0000 105.2486 all free all free Global Yes 11 146.0000 0.0000 105.2785 all free all free Global Yes
12 150.0000 0.0000 105.3985 all free all free Global Yes
13 154.0000 0.0000 105.5185 all free all free Global Yes
14 155.0000 0.0000 105.5485 all free all free Global Yes 15 175.0000 0.0000 106.1483 all free all free Global Yes
16 195.0000 0.0000 106.7481 all free all free Global Yes
17 215.0000 0.0000 107.3479 all free all free Global Yes
18 235.0000 0.0000 107.9477 all free all free Global Yes 19 255.0000 0.0000 108.5475 all free all free Global Yes
20 275.0000 0.0000 109.1473 all free all free Global Yes
21 295.0000 0.0000 109.7471 all free all free Global Yes
22 296.0000 0.0000 109.7770 all free all free Global Yes 23 300.0000 0.0000 109.8970 all free all free Global Yes
24 304.0000 0.0000 110.0170 all free all free Global Yes
25 305.0000 0.0000 110.0470 all free all free Global Yes
26 325.0000 0.0000 110.6468 all free all free Global Yes 27 345.0000 0.0000 111.2466 all free all free Global Yes
28 365.0000 0.0000 111.8464 all free all free Global Yes
29 385.0000 0.0000 112.4462 all free all free Global Yes
30 405.0000 0.0000 113.0460 all free all free Global Yes 31 425.0000 0.0000 113.6458 all free all free Global Yes
32 445.0000 0.0000 114.2456 all free all free Global Yes
33 446.0000 0.0000 114.2755 all free all free Global Yes
34 450.0000 0.0000 114.3955 all free all free Global Yes 35 454.0000 0.0000 114.5155 all free all free Global Yes
36 455.0000 0.0000 114.5455 all free all free Global Yes
37 475.0000 0.0000 115.1453 all free all free Global Yes
38 495.0000 0.0000 115.7451 all free all free Global Yes 39 515.0000 0.0000 116.3449 all free all free Global Yes
40 535.0000 0.0000 116.9447 all free all free Global Yes
41 555.0000 0.0000 117.5445 all free all free Global Yes
42 575.0000 0.0000 118.1443 all free all free Global Yes 43 595.0000 0.0000 118.7441 all free all free Global Yes
44 596.0000 0.0000 118.7740 all free all free Global Yes
45 600.0000 0.0000 118.8940 all free all free Global Yes
46 604.0000 0.0000 119.0140 all free all free Global Yes 47 605.0000 0.0000 119.0440 all free all free Global Yes
48 625.0000 0.0000 119.6438 all free all free Global Yes
49 645.0000 0.0000 120.2436 all free all free Global Yes
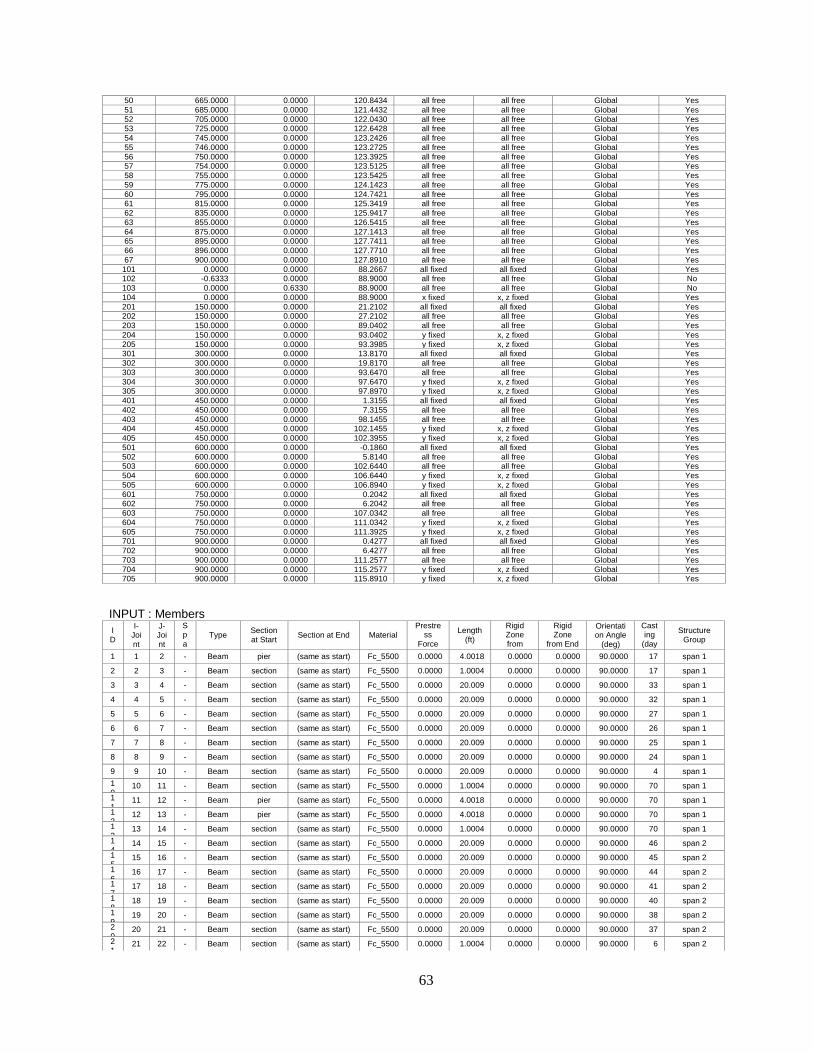
63
50 665.0000 0.0000 120.8434 all free all free Global Yes
51 685.0000 0.0000 121.4432 all free all free Global Yes
52 705.0000 0.0000 122.0430 all free all free Global Yes 53 725.0000 0.0000 122.6428 all free all free Global Yes
54 745.0000 0.0000 123.2426 all free all free Global Yes
55 746.0000 0.0000 123.2725 all free all free Global Yes
56 750.0000 0.0000 123.3925 all free all free Global Yes 57 754.0000 0.0000 123.5125 all free all free Global Yes
58 755.0000 0.0000 123.5425 all free all free Global Yes
59 775.0000 0.0000 124.1423 all free all free Global Yes
60 795.0000 0.0000 124.7421 all free all free Global Yes 61 815.0000 0.0000 125.3419 all free all free Global Yes
62 835.0000 0.0000 125.9417 all free all free Global Yes
63 855.0000 0.0000 126.5415 all free all free Global Yes
64 875.0000 0.0000 127.1413 all free all free Global Yes 65 895.0000 0.0000 127.7411 all free all free Global Yes
66 896.0000 0.0000 127.7710 all free all free Global Yes
67 900.0000 0.0000 127.8910 all free all free Global Yes
101 0.0000 0.0000 88.2667 all fixed all fixed Global Yes 102 -0.6333 0.0000 88.9000 all free all free Global No
103 0.0000 0.6330 88.9000 all free all free Global No
104 0.0000 0.0000 88.9000 x fixed x, z fixed Global Yes
201 150.0000 0.0000 21.2102 all fixed all fixed Global Yes 202 150.0000 0.0000 27.2102 all free all free Global Yes
203 150.0000 0.0000 89.0402 all free all free Global Yes
204 150.0000 0.0000 93.0402 y fixed x, z fixed Global Yes
205 150.0000 0.0000 93.3985 y fixed x, z fixed Global Yes 301 300.0000 0.0000 13.8170 all fixed all fixed Global Yes
302 300.0000 0.0000 19.8170 all free all free Global Yes
303 300.0000 0.0000 93.6470 all free all free Global Yes
304 300.0000 0.0000 97.6470 y fixed x, z fixed Global Yes 305 300.0000 0.0000 97.8970 y fixed x, z fixed Global Yes
401 450.0000 0.0000 1.3155 all fixed all fixed Global Yes
402 450.0000 0.0000 7.3155 all free all free Global Yes
403 450.0000 0.0000 98.1455 all free all free Global Yes 404 450.0000 0.0000 102.1455 y fixed x, z fixed Global Yes
405 450.0000 0.0000 102.3955 y fixed x, z fixed Global Yes
501 600.0000 0.0000 -0.1860 all fixed all fixed Global Yes
502 600.0000 0.0000 5.8140 all free all free Global Yes 503 600.0000 0.0000 102.6440 all free all free Global Yes
504 600.0000 0.0000 106.6440 y fixed x, z fixed Global Yes
505 600.0000 0.0000 106.8940 y fixed x, z fixed Global Yes
601 750.0000 0.0000 0.2042 all fixed all fixed Global Yes 602 750.0000 0.0000 6.2042 all free all free Global Yes
603 750.0000 0.0000 107.0342 all free all free Global Yes
604 750.0000 0.0000 111.0342 y fixed x, z fixed Global Yes
605 750.0000 0.0000 111.3925 y fixed x, z fixed Global Yes 701 900.0000 0.0000 0.4277 all fixed all fixed Global Yes
702 900.0000 0.0000 6.4277 all free all free Global Yes
703 900.0000 0.0000 111.2577 all free all free Global Yes
704 900.0000 0.0000 115.2577 y fixed x, z fixed Global Yes 705 900.0000 0.0000 115.8910 y fixed x, z fixed Global Yes
INPUT : Members
ID
I-Joint
J-Joint
Span
Type Section at Start
Section at End Material
Prestress
Force (kips)
Length (ft)
Rigid Zone from Start (x/L)
Rigid Zone
from End (x/L)
Orientation Angle
(deg)
Casting
(day)
Structure Group
1 1 2 - Beam pier (same as start) Fc_5500 0.0000 4.0018 0.0000 0.0000 90.0000 17 span 1
2 2 3 - Beam section (same as start) Fc_5500 0.0000 1.0004 0.0000 0.0000 90.0000 17 span 1
3 3 4 - Beam section (same as start) Fc_5500 0.0000 20.009 0.0000 0.0000 90.0000 33 span 1
4 4 5 - Beam section (same as start) Fc_5500 0.0000 20.009 0.0000 0.0000 90.0000 32 span 1
5 5 6 - Beam section (same as start) Fc_5500 0.0000 20.009 0.0000 0.0000 90.0000 27 span 1
6 6 7 - Beam section (same as start) Fc_5500 0.0000 20.009 0.0000 0.0000 90.0000 26 span 1
7 7 8 - Beam section (same as start) Fc_5500 0.0000 20.009 0.0000 0.0000 90.0000 25 span 1
8 8 9 - Beam section (same as start) Fc_5500 0.0000 20.009 0.0000 0.0000 90.0000 24 span 1
9 9 10 - Beam section (same as start) Fc_5500 0.0000 20.009 0.0000 0.0000 90.0000 4 span 1
10
10 11 - Beam section (same as start) Fc_5500 0.0000 1.0004 0.0000 0.0000 90.0000 70 span 1
11
11 12 - Beam pier (same as start) Fc_5500 0.0000 4.0018 0.0000 0.0000 90.0000 70 span 1
12
12 13 - Beam pier (same as start) Fc_5500 0.0000 4.0018 0.0000 0.0000 90.0000 70 span 1
13
13 14 - Beam section (same as start) Fc_5500 0.0000 1.0004 0.0000 0.0000 90.0000 70 span 1
14
14 15 - Beam section (same as start) Fc_5500 0.0000 20.009 0.0000 0.0000 90.0000 46 span 2
15
15 16 - Beam section (same as start) Fc_5500 0.0000 20.009 0.0000 0.0000 90.0000 45 span 2
16
16 17 - Beam section (same as start) Fc_5500 0.0000 20.009 0.0000 0.0000 90.0000 44 span 2
17
17 18 - Beam section (same as start) Fc_5500 0.0000 20.009 0.0000 0.0000 90.0000 41 span 2
18
18 19 - Beam section (same as start) Fc_5500 0.0000 20.009 0.0000 0.0000 90.0000 40 span 2
19
19 20 - Beam section (same as start) Fc_5500 0.0000 20.009 0.0000 0.0000 90.0000 38 span 2
20
20 21 - Beam section (same as start) Fc_5500 0.0000 20.009 0.0000 0.0000 90.0000 37 span 2
21
21 22 - Beam section (same as start) Fc_5500 0.0000 1.0004 0.0000 0.0000 90.0000 6 span 2

64
22
22 23 - Beam pier (same as start) Fc_5500 0.0000 4.0018 0.0000 0.0000 90.0000 6 span 2
23
23 24 - Beam pier (same as start) Fc_5500 0.0000 4.0018 0.0000 0.0000 90.0000 6 span 2
2
4
24 25 - Beam section (same as start) Fc_5500 0.0000 1.0004 0.0000 0.0000 90.0000 6 span 2
2
5
25 26 - Beam section (same as start) Fc_5500 0.0000 20.009 0.0000 0.0000 90.0000 62 span 3
2
6
26 27 - Beam section (same as start) Fc_5500 0.0000 20.009 0.0000 0.0000 90.0000 60 span 3
2
7
27 28 - Beam section (same as start) Fc_5500 0.0000 20.009 0.0000 0.0000 90.0000 55 span 3
2
8
28 29 - Beam section (same as start) Fc_5500 0.0000 20.009 0.0000 0.0000 90.0000 54 span 3
2
9
29 30 - Beam section (same as start) Fc_5500 0.0000 20.009 0.0000 0.0000 90.0000 52 span 3
3
0
30 31 - Beam section (same as start) Fc_5500 0.0000 20.009 0.0000 0.0000 90.0000 51 span 3
3
1
31 32 - Beam section (same as start) Fc_5500 0.0000 20.009 0.0000 0.0000 90.0000 47 span 3
3
2
32 33 - Beam section (same as start) Fc_5500 0.0000 1.0004 0.0000 0.0000 90.0000 76 span 3
3
3
33 34 - Beam pier (same as start) Fc_5500 0.0000 4.0018 0.0000 0.0000 90.0000 76 span 3
3
4
34 35 - Beam pier (same as start) Fc_5500 0.0000 4.0018 0.0000 0.0000 90.0000 76 span 3
3
5
35 36 - Beam section (same as start) Fc_5500 0.0000 1.0004 0.0000 0.0000 90.0000 76 span 3
3
6
36 37 - Beam section (same as start) Fc_5500 0.0000 20.009 0.0000 0.0000 90.0000 76 span 4
3
7
37 38 - Beam section (same as start) Fc_5500 0.0000 20.009 0.0000 0.0000 90.0000 75 span 4
3
8
38 39 - Beam section (same as start) Fc_5500 0.0000 20.009 0.0000 0.0000 90.0000 74 span 4
3
9
39 40 - Beam section (same as start) Fc_5500 0.0000 20.009 0.0000 0.0000 90.0000 73 span 4
4
0
40 41 - Beam section (same as start) Fc_5500 0.0000 20.009 0.0000 0.0000 90.0000 72 span 4
4
1
41 42 - Beam section (same as start) Fc_5500 0.0000 20.009 0.0000 0.0000 90.0000 68 span 4
4
2
42 43 - Beam section (same as start) Fc_5500 0.0000 20.009 0.0000 0.0000 90.0000 66 span 4
4
3
43 44 - Beam section (same as start) Fc_5500 0.0000 1.0004 0.0000 0.0000 90.0000 86 span 4
4
4
44 45 - Beam pier (same as start) Fc_5500 0.0000 4.0018 0.0000 0.0000 90.0000 86 span 4
4
5
45 46 - Beam pier (same as start) Fc_5500 0.0000 4.0018 0.0000 0.0000 90.0000 86 span 4
4
6
46 47 - Beam section (same as start) Fc_5500 0.0000 1.0004 0.0000 0.0000 90.0000 86 span 4
4
7
47 48 - Beam section (same as start) Fc_5500 0.0000 20.009 0.0000 0.0000 90.0000 97 span 5
4
8
48 49 - Beam section (same as start) Fc_5500 0.0000 20.009 0.0000 0.0000 90.0000 96 span 5
4
9
49 50 - Beam section (same as start) Fc_5500 0.0000 20.009 0.0000 0.0000 90.0000 93 span 5
5
0
50 51 - Beam section (same as start) Fc_5500 0.0000 20.009 0.0000 0.0000 90.0000 90 span 5
5
1
51 52 - Beam section (same as start) Fc_5500 0.0000 20.009 0.0000 0.0000 90.0000 88 span 5
5
2
52 53 - Beam section (same as start) Fc_5500 0.0000 20.009 0.0000 0.0000 90.0000 87 span 5
5
3
53 54 - Beam section (same as start) Fc_5500 0.0000 20.009 0.0000 0.0000 90.0000 82 span 5
5
4
54 55 - Beam section (same as start) Fc_5500 0.0000 1.0004 0.0000 0.0000 90.0000 0 span 5
5
5
55 56 - Beam pier (same as start) Fc_5500 0.0000 4.0018 0.0000 0.0000 90.0000 0 span 5
5
6
56 57 - Beam pier (same as start) Fc_5500 0.0000 4.0018 0.0000 0.0000 90.0000 0 span 5
5
7
57 58 - Beam section (same as start) Fc_5500 0.0000 1.0004 0.0000 0.0000 90.0000 0 span 5
5
8
58 59 - Beam section (same as start) Fc_5500 0.0000 20.009 0.0000 0.0000 90.0000 117 span 6
5
9
59 60 - Beam section (same as start) Fc_5500 0.0000 20.009 0.0000 0.0000 90.0000 115 span 6
6
0
60 61 - Beam section (same as start) Fc_5500 0.0000 20.009 0.0000 0.0000 90.0000 108 span 6
6
1
61 62 - Beam section (same as start) Fc_5500 0.0000 20.009 0.0000 0.0000 90.0000 107 span 6
6
2
62 63 - Beam section (same as start) Fc_5500 0.0000 20.009 0.0000 0.0000 90.0000 103 span 6
6
3
63 64 - Beam section (same as start) Fc_5500 0.0000 20.009 0.0000 0.0000 90.0000 102 span 6
6
4
64 65 - Beam section (same as start) Fc_5500 0.0000 20.009 0.0000 0.0000 90.0000 100 span 6
6
5
65 66 - Beam section (same as start) Fc_5500 0.0000 1.0004 0.0000 0.0000 90.0000 44 span 6
6
6
66 67 - Beam pier (same as start) Fc_5500 0.0000 4.0018 0.0000 0.0000 90.0000 44 span 6
1
0
2
1 10
4
- Beam Rigid
Section
(same as start) Rigid
Material
0.0000 12 0.0000 0.0000 90.0000 0 span 1
2
0
1
201 20
2
- Beam Footing (same as start) Fc_5500 0.0000 6. 0.0000 0.0000 90.0000 0 span 1
2
0
2
202 20
3
- Beam Substructu
re
(same as start) Fc_5500 0.0000 61.83 0.0000 0.0000 90.0000 0 span 1
2
0
3
203 20
4
- Beam Pier Cap (same as start) Fc_5500 0.0000 4. 0.0000 0.0000 90.0000 0 span 1
2
0
4
12 20
5
- Beam Rigid
Section
(same as start) Rigid
Material
0.0000 12 0.0000 0.0000 90.0000 0 span 1
3
0
1
301 30
2
- Beam Footing (same as start) Fc_5500 0.0000 6 0.0000 0.0000 90.0000 0 span 2
3
0
2
302 30
3
- Beam Substructu
re
(same as start) Fc_5500 0.0000 73.83 0.0000 0.0000 90.0000 0 span 2
3
0
3
303 30
4
- Beam Pier Cap (same as start) Fc_5500 0.0000 4 0.0000 0.0000 90.0000 0 span 2
3
0
4
23 30
5
- Beam Rigid
Section
(same as start) Rigid
Material
0.0000 12 0.0000 0.0000 90.0000 0 span 2
4
0
1
401 40
2
- Beam Footing (same as start) Fc_5500 0.0000 6 0.0000 0.0000 90.0000 0 span 3
4
0
2
402 40
3
- Beam Substructu
re
(same as start) Fc_5500 0.0000 90.83 0.0000 0.0000 90.0000 0 span 3
4
0
3
403 40
4
- Beam Pier Cap (same as start) Fc_5500 0.0000 4 0.0000 0.0000 90.0000 0 span 3
4
0
4
34 40
5
- Beam Rigid
Section
(same as start) Rigid
Material
0.0000 12 0.0000 0.0000 90.0000 0 span 3
5
0
1
501 50
2
- Beam Footing (same as start) Fc_5500 0.0000 6. 0.0000 0.0000 90.0000 0 span 4

65
5
0
2
502 50
3
- Beam Substructu
re
(same as start) Fc_5500 0.0000 96.83 0.0000 0.0000 90.0000 0 span 4
5
0
3
503 50
4
- Beam Pier Cap (same as start) Fc_5500 0.0000 4 0.0000 0.0000 90.0000 0 span 4
5
0
4
45 50
5
- Beam Rigid
Section
(same as start) Rigid
Material
0.0000 12 0.0000 0.0000 90.0000 0 span 4
6
0
1
601 60
2
- Beam Footing (same as start) Fc_5500 0.0000 6 0.0000 0.0000 90.0000 0 span 5
6
0
2
602 60
3
- Beam Substructu
re
(same as start) Fc_5500 0.0000 100.83 0.0000 0.0000 90.0000 0 span 5
6
0
3
603 60
4
- Beam Pier Cap (same as start) Fc_5500 0.0000 4. 0.0000 0.0000 90.0000 0 span 5
6
0
4
56 60
5
- Beam Rigid
Section
(same as start) Rigid
Material
0.0000 12 0.0000 0.0000 90.0000 0 span 5
7
0
1
701 70
2
- Beam Footing (same as start) Fc_5500 0.0000 6 0.0000 0.0000 90.0000 0 span 6
7
0
2
702 70
3
- Beam Substructu
re
(same as start) Fc_5500 0.0000 104.83 0.0000 0.0000 90.0000 0 span 6
7
0
3
703 70
4
- Beam Pier Cap (same as start) Fc_5500 0.0000 4. 0.0000 0.0000 90.0000 0 span 6
7
0
4
67 70
5
- Beam Rigid
Section
(same as start) Rigid
Material
0.0000 12 0.0000 0.0000 90.0000 0 span 6
INPUT : Springs
ID I-
Joint
J-
Joint Type Direction
K Tension
(kips/ft)
K
Compressio
n (kips/ft)
Maximum
Tension
(kips or
kips-ft)
Maximum
Compress
ion (kips
or kips-ft)
Hook (ft) Gap (ft) Properties
Definition
Structure /
Construction
Group
101 101 104 Linear Trans. Z 3.1200e5 3.1200e5 (none) span 1
102 101 104 Linear Trans. X 2,880.0000 2,880.0000 (none) span 1
103 101 104 Linear Rot. Y 1,700.0000 1,700.0000 (none) span 1
201 204 205 Linear Trans. Z 4.6200e5 4.6200e5 (none) span 1
202 204 205 Linear Trans. X 5,880.0000 5,880.0000 (none) span 1
203 204 205 Linear Rot. Y 2,500.0000 2,500.0000 (none) span 1
301 304 305 Linear Trans. Z 8.8320e5 8.8320e5 (none) span 2
302 304 305 Linear Trans. X 7,560.0000 7,560.0000 (none) span 2
303 304 305 Linear Rot. Y 4,900.0000 4,900.0000 (none) span 2
401 404 405 Linear Trans. Z 8.8320e5 8.8320e5 (none) span 3
402 404 405 Linear Trans. X 7,560.0000 7,560.0000 (none) span 3
403 404 405 Linear Rot. Y 4,900.0000 4,900.0000 (none) span 3
501 504 505 Linear Trans. Z 8.8320e5 8.8320e5 (none) span 4
502 504 505 Linear Trans. X 7,560.0000 7,560.0000 (none) span 4
503 504 505 Linear Rot. Y 4,900.0000 4,900.0000 (none) span 4
601 604 605 Linear Trans. Z 4.6200e5 4.6200e5 (none) span 5
602 604 605 Linear Trans. X 5,880.0000 5,880.0000 (none) span 5
603 604 605 Linear Rot. Y 2,500.0000 2,500.0000 (none) span 5
701 704 705 Linear Trans. Z 3.1200e5 3.1200e5 (none) span 6
702 704 705 Linear Trans. X 2,880.0000 2,880.0000 (none) span 6
703 704 705 Linear Rot. Y 1,700.0000 1,700.0000 (none) span 6
INPUT : Tendons Tendo
n
Name
Desig
n
Group
Material Exposure
Stran
d
Area
(per
stran
d)
(in²)
#
of
St
ra
n
ds
Jacking
Force
@ Start
(kips)
Jacking
Force
@ End
(kips)
Jacki
ng
End
Anchor
Set
(in)
Wob
ble
Coef
ficie
nt
(per
ft)
Cur
vat
ure
Fri
ctio
n
Co
effi
cie
nt
Peak
Stress
Ratio -
Ends
Peak
Stres
s
Ratio
-
Interi
or
Elo
nga
tion
Aft
er
Pul
l 1
Elo
nga
tion
Aft
er
Pul
l 2
Elo
nga
tion
@
Lef
t of
Stat
ion
ary
Elo
nga
tion
@
Rig
ht
of
Stat
ion
ary
Ad
d.
For
ce
Re
q.
@
En
d
(ki
ps)
S1-
T1L (none) A416 Post-Tension
(External)
0.21
70
1
9 0 861.00
00 End 0.3750 0.2
500 0.9000 0.90
00 0 0 0 0 0
S1-
T2L (none) A416
Post-Tension
(External)
0.21
70
1
9 0
865.00
00 End 0.3750
0.2
500 0.9000
0.90
00 0 0 0 0 0
S1-
T3L (none) A416 Post-Tension
(External)
0.21
70
1
9 0 871.00
00 End 0.3750 0.2
500 0.9000 0.90
00 0 0 0 0 0
S1-
T4L (none) A416 Post-Tension
(External)
0.21
70
1
9 0 861.00
00 End 0.3750 0.2
500 0.9000 0.90
00 0 0 0 0 0
S1-
T1R (none) A416
Post-Tension
(External)
0.21
70
1
9 0
861.00
00 End 0.3750
0.2
500 0.9000
0.90
00 0 0 0 0 0
S1-
T2R (none) A416 Post-Tension
(External)
0.21
70
1
9 0 865.00
00 End 0.3750 0.2
500 0.9000 0.90
00 0 0 0 0 0

66
S1-
T3R (none) A416 Post-Tension
(External)
0.21
70
1
9 0 871.00
00 End 0.3750 0.2
500 0.9000 0.90
00 0 0 0 0 0
S1-
T4R (none) A416 Post-Tension
(External)
0.21
70
1
9 0 861.00
00 End 0.3750 0.2
500 0.9000 0.90
00 0 0 0 0 0
S2-
T5L (none) A416
Post-Tension
(External)
0.21
70
1
9 0
879.00
00 End 0.3750
0.2
500 0.9000
0.90
00 0 0 0 0 0
S2-
T6L (none) A416 Post-Tension
(External)
0.21
70
1
9 0 871.00
00 End 0.3750 0.2
500 0.9000 0.90
00 0 0 0 0 0
S2-
T7L (none) A416 Post-Tension
(External)
0.21
70
1
9 0 865.00
00 End 0.3750 0.2
500 0.9000 0.90
00 0 0 0 0 0
S2-
T8L (none) A416
Post-Tension
(External)
0.21
70
1
9 0
854.00
00 End 0.3750
0.2
500 0.9000
0.90
00 0 0 0 0 0
S2-
T5R (none) A416 Post-Tension
(External)
0.21
70
1
9 0 879.00
00 End 0.3750 0.2
500 0.9000 0.90
00 0 0 0 0 0
S2-
T6R (none) A416 Post-Tension
(External)
0.21
70
1
9 0 871.00
00 End 0.3750 0.2
500 0.9000 0.90
00 0 0 0 0 0
S2-
T7R (none) A416
Post-Tension
(External)
0.21
70
1
9 0
865.00
00 End 0.3750
0.2
500 0.9000
0.90
00 0 0 0 0 0
S2-
T8R (none) A416 Post-Tension
(External)
0.21
70
1
9 0 854.00
00 End 0.3750 0.2
500 0.9000 0.90
00 0 0 0 0 0
S3-
T5L (none) A416 Post-Tension
(External)
0.21
70
1
9 0 879.00
00 End 0.3750 0.2
500 0.9000 0.90
00 0 0 0 0 0
S3-
T6L (none) A416
Post-Tension
(External)
0.21
70
1
9 0
871.00
00 End 0.3750
0.2
500 0.9000
0.90
00 0 0 0 0 0
S3-
T7L (none) A416 Post-Tension
(External)
0.21
70
1
9 0 865.00
00 End 0.3750 0.2
500 0.9000 0.90
00 0 0 0 0 0
S3-
T8L (none) A416 Post-Tension
(External)
0.21
70
1
9 0 854.00
00 End 0.3750 0.2
500 0.9000 0.90
00 0 0 0 0 0
S3-
T5R (none) A416
Post-Tension
(External)
0.21
70
1
9 0
879.00
00 End 0.3750
0.2
500 0.9000
0.90
00 0 0 0 0 0
S3-
T6R (none) A416 Post-Tension
(External)
0.21
70
1
9 0 871.00
00 End 0.3750 0.2
500 0.9000 0.90
00 0 0 0 0 0
S3-
T7R (none) A416 Post-Tension
(External)
0.21
70
1
9 0 865.00
00 End 0.3750 0.2
500 0.9000 0.90
00 0 0 0 0 0
S3-
T8R (none) A416
Post-Tension
(External)
0.21
70
1
9 0
854.00
00 End 0.3750
0.2
500 0.9000
0.90
00 0 0 0 0 0
S4-
T5L (none) A416 Post-Tension
(External)
0.21
70
1
9 0 879.00
00 End 0.3750 0.2
500 0.9000 0.90
00 0 0 0 0 0
S4-
T6L (none) A416 Post-Tension
(External)
0.21
70
1
9 0 871.00
00 End 0.3750 0.2
500 0.9000 0.90
00 0 0 0 0 0
S4-
T7L (none) A416
Post-Tension
(External)
0.21
70
1
9 0
865.00
00 End 0.3750
0.2
500 0.9000
0.90
00 0 0 0 0 0
S4-
T8L (none) A416 Post-Tension
(External)
0.21
70
1
9 0 854.00
00 End 0.3750 0.2
500 0.9000 0.90
00 0 0 0 0 0
S4-
T5R (none) A416 Post-Tension
(External)
0.21
70
1
9 0 879.00
00 End 0.3750 0.2
500 0.9000 0.90
00 0 0 0 0 0
S4-
T6R (none) A416
Post-Tension
(External)
0.21
70
1
9 0
871.00
00 End 0.3750
0.2
500 0.9000
0.90
00 0 0 0 0 0
S4-
T7R (none) A416 Post-Tension
(External)
0.21
70
1
9 0 865.00
00 End 0.3750 0.2
500 0.9000 0.90
00 0 0 0 0 0
S4-
T8R (none) A416 Post-Tension
(External)
0.21
70
1
9 0 854.00
00 End 0.3750 0.2
500 0.9000 0.90
00 0 0 0 0 0
S5-
T5L (none) A416
Post-Tension
(External)
0.21
70
1
9 0
879.00
00 End 0.3750
0.2
500 0.9000
0.90
00 0 0 0 0 0
S5-
T6L (none) A416 Post-Tension
(External)
0.21
70
1
9 0 871.00
00 End 0.3750 0.2
500 0.9000 0.90
00 0 0 0 0 0
S5-
T7L (none) A416 Post-Tension
(External)
0.21
70
1
9 0 865.00
00 End 0.3750 0.2
500 0.9000 0.90
00 0 0 0 0 0
S5-
T8L (none) A416
Post-Tension
(External)
0.21
70
1
9 0
854.00
00 End 0.3750
0.2
500 0.9000
0.90
00 0 0 0 0 0

67
S5-
T5R (none) A416 Post-Tension
(External)
0.21
70
1
9 0 879.00
00 End 0.3750 0.2
500 0.9000 0.90
00 0 0 0 0 0
S5-
T6R (none) A416 Post-Tension
(External)
0.21
70
1
9 0 871.00
00 End 0.3750 0.2
500 0.9000 0.90
00 0 0 0 0 0
S5-
T7R (none) A416
Post-Tension
(External)
0.21
70
1
9 0
865.00
00 End 0.3750
0.2
500 0.9000
0.90
00 0 0 0 0 0
S5-
T8R (none) A416 Post-Tension
(External)
0.21
70
1
9 0 854.00
00 End 0.3750 0.2
500 0.9000 0.90
00 0 0 0 0 0
S6-
T9L (none) A416 Post-Tension
(External)
0.21
70
1
9 0 889.00
00 End 0.3750 0.2
500 0.9000 0.90
00 0 0 0 0 0
S6-
T10L (none) A416
Post-Tension
(External)
0.21
70
1
9 0
883.00
00 End 0.3750
0.2
500 0.9000
0.90
00 0 0 0 0 0
S6-
T11L (none) A416 Post-Tension
(External)
0.21
70
1
9 0 874.00
00 End 0.3750 0.2
500 0.9000 0.90
00 0 0 0 0 0
S6-
T12L (none) A416 Post-Tension
(External)
0.21
70
1
9 0 868.00
00 End 0.3750 0.2
500 0.9000 0.90
00 0 0 0 0 0
S6-
T9R (none) A416
Post-Tension
(External)
0.21
70
1
9 0
889.00
00 End 0.3750
0.2
500 0.9000
0.90
00 0 0 0 0 0
S6-
T10R (none) A416 Post-Tension
(External)
0.21
70
1
9 0 883.00
00 End 0.3750 0.2
500 0.9000 0.90
00 0 0 0 0 0
S6-
T11R (none) A416 Post-Tension
(External)
0.21
70
1
9 0 874.00
00 End 0.3750 0.2
500 0.9000 0.90
00 0 0 0 0 0
S6-
T12R (none) A416
Post-Tension
(External)
0.21
70
1
9 0
868.00
00 End 0.3750
0.2
500 0.9000
0.90
00 0 0 0 0 0
INPUT : CEB-FIP 78
Name
Notional
Thickness
Coefficient
Creep
Coefficient
(Environme
nt)
Creep
Coefficient
(Notional
Thickness)
Shrinkage
Coef
(Environment
)
Shrinkage Coef
(Notional
Thickness)
Delayed
Modulus
of
Elasticity
Coef
Creep Factor Shrinkage
Factor
Relaxation
Factor
Assign
ed
User defined
C&S
1.5000 2.0000 1.5000 -0.0003 0.9000 0.4000 1.0000 1.0000 1.0000 Yes
INPUT : More Material Properties
Name Yield Stress
(lb/in²)
Post-yield to
Initial Slope
Ratio
Concrete
Strength
Specimen
Concrete fc28
or Steel Fu
(lb/in²)
Concrete Cement
Hardening Type
Tendon
GUTS (lb/in²) Material Time-Effect Assigned
Fc_5500 0.00 0.020 Cylinder 6,600.00 Normal 0.00 User defined C&S Yes
Rigid Material 0.00 0.020 Cylinder 0.00 Not Concrete 0.00 (NONE) Yes
A416 50,000.00 0.020 Cylinder 70,300.00 Not Concrete 270,000.00 User defined C&S Yes
INPUT : CEB-FIP 78
Name Creep Factor Shrinkage
Factor
Relaxation
Factor
Exponent of Creep
Development Eqn.
Constant in
Shrinkage
Development
Eqn.
Temp.
Adjusted
Concrete Age
Steel Relaxation
Type
Assigne
d
User defined C&S 1.0000 1.0000 1.0000 0.3000 350.0000 No Improved(Class 2) Yes
TENDON S1-T1L Point
Type
Reference
Object
Type
Referenc
e Object
or Range
Offset X
(ft)
Offset Y
(in)
Offset Z
(in)
X Reference Y Reference Z Reference Curvature Type Width
geometry member 1 0.0000 60.0000 -128.6900 Start -Y3 Local Edge Reference Line No Curve
path only member 2
path only member 3
geometry member 4 5.0000 11.0000 -98.5000 Start -Y3 Local Edge Reference Line No Curve
geometry member 4 15.0000 11.0000 -90.5000 Start -Y3 Local Edge Reference Line No Curve
geometry member 5 5.0000 11.0000 -82.5000 Start -Y3 Local Edge Reference Line No Curve
geometry member 6 15.0000 11.0000 -82.5000 Start -Y3 Local Edge Reference Line No Curve
geometry member 7 5.0000 11.0000 -90.5000 Start -Y3 Local Edge Reference Line No Curve
geometry member 7 15.0000 11.0000 -98.5000 Start -Y3 Local Edge Reference Line No Curve
path only member 8
path only member 9
path only member 10

68
path only member 11
geometry member 12 0.0000 123.000
0
-152.0000 End -Y3 Local Edge Reference Line No Curve
TENDON S1-T2L Point
Type
Reference
Object Type
Referenc
e Object
or Range
Offset X
(ft)
Offset Y
(in)
Offset Z
(in)
X Reference Y Reference Z Reference Curvature
Type Width
geometr
y member 1 0.0000 84.0000 -142.9400 Start -Y3 Local Edge Reference Line No Curve
path
only
member 2
path
only
member 3
geometr
y
member 4 15.0000 11.0000 -98.5000 Start -Y3 Local Edge Reference Line No Curve
geometr
y
member 5 5.0000 11.0000 -90.5000 Start -Y3 Local Edge Reference Line No Curve
geometr
y
member 6 15.0000 11.0000 -90.5000 Start -Y3 Local Edge Reference Line No Curve
geometr
y
member 7 5.0000 11.0000 -98.5000 Start -Y3 Local Edge Reference Line No Curve
path
only
member 8
path
only
member 9
path
only
member 10
path
only
member 11
geometr
y member 12 0.0000 123.000
0 -134.0000 End -Y3 Local Edge Reference Line No Curve
TENDON S1-T3L
Point Type Reference
Object
Type
Referenc
e Object
or Range
Offset X
(ft) Offset Y (in)
Offset Z
(in)
X
Reference Y Reference Z Reference
Curvature
Type Width
geometry member 1 0.0000 108.0000 -157.1250 Start -Y3 Local
Edge
Reference
Line No Curve
path only member 2
path only member 3
path only member 4
geometry member 5 5.0000 11.0000 -98.5000 Start -Y3 Local
Edge
Reference
Line
No Curve
geometry member 6 15.0000 11.0000 -98.5000 Start -Y3 Local
Edge
Reference
Line
No Curve
path only member 7
path only member 8
path only member 9
path only member 10
path only member 11
geometry member 12 0.0000 123.0000 -116.0000 End -Y3 Local
Edge
Reference
Line No Curve
TENDON S1-T4L Point
Type
Reference
Object
Type
Referenc
e Object
or Range
Offset X
(ft)
Offset Y
(in)
Offset Z
(in)
X Reference Y Reference Z Reference Curvature Type Width
geometry member 1 0.0000 24.0000 -107.3800 Start -Y3 Local Edge Reference Line No Curve
path only member 2
geometry member 3 5.0000 11.0000 -98.5000 Start -Y3 Local Edge Reference Line No Curve
geometry member 3 15.0000 11.0000 -90.5000 Start -Y3 Local Edge Reference Line No Curve
geometry member 4 5.0000 11.0000 -82.5000 Start -Y3 Local Edge Reference Line No Curve
geometry member 4 15.0000 11.0000 -74.5000 Start -Y3 Local Edge Reference Line No Curve
geometry member 5 5.0000 11.0000 -74.5000 Start -Y3 Local Edge Reference Line No Curve
geometry member 6 15.0000 11.0000 -74.5000 Start -Y3 Local Edge Reference Line No Curve
geometry member 7 5.0000 11.0000 -74.5000 Start -Y3 Local Edge Reference Line No Curve
geometry member 7 15.0000 11.0000 -74.5000 Start -Y3 Local Edge Reference Line No Curve
geometry member 8 15.0000 11.0000 -90.5000 Start -Y3 Local Edge Reference Line No Curve
path only member 9
path only member 10
geometry member 11 2.0000 11.0000 -90.5000 Start -Y3 Local Edge Reference Line No Curve
path only member 12
geometry member 12 0.0000 21.0000 -90.5000 End -Y3 Local Edge Reference Line No Curve
TENDON S1-T1R
Point Type Reference
Object Type
Reference
Object or
Range
Offset X
(ft)
Offset Y
(in)
Offset Z
(in)
X Reference Y Reference Z Reference Curvature Type Width
geometry member 1 0.0000 60.0000 128.6900 Start -Y3 Local Edge Reference Line No Curve
path only member 2

69
path only member 3
geometry member 4 5.0000 11.0000 98.5000 Start -Y3 Local Edge Reference Line No Curve
geometry member 4 15.0000 11.0000 90.5000 Start -Y3 Local Edge Reference Line No Curve
geometry member 5 5.0000 11.0000 82.5000 Start -Y3 Local Edge Reference Line No Curve
geometry member 6 15.0000 11.0000 82.5000 Start -Y3 Local Edge Reference Line No Curve
geometry member 7 5.0000 11.0000 90.5000 Start -Y3 Local Edge Reference Line No Curve
geometry member 7 15.0000 11.0000 98.5000 Start -Y3 Local Edge Reference Line No Curve
path only member 8
path only member 9
path only member 10
path only member 11
geometry member 12 0.0000 123.000
0 152.0000 End -Y3 Local Edge Reference Line No Curve
TENDON S1-T2R
Point Type Reference
Object Type
Reference
Object or
Range
Offset X
(ft)
Offset Y
(in)
Offset Z
(in)
X Reference Y Reference Z Reference Curvature Type Width
geometry member 1 0.0000 84.0000 142.9400 Start -Y3 Local Edge Reference Line No Curve
path only member 2
path only member 3
geometry member 4 15.0000 11.0000 98.5000 Start -Y3 Local Edge Reference Line No Curve
geometry member 5 5.0000 11.0000 90.5000 Start -Y3 Local Edge Reference Line No Curve
geometry member 6 15.0000 11.0000 90.5000 Start -Y3 Local Edge Reference Line No Curve
geometry member 7 5.0000 11.0000 98.5000 Start -Y3 Local Edge Reference Line No Curve
path only member 8
path only member 9
path only member 10
path only member 11
geometry member 12 0.0000 123.0000 134.0000 End -Y3 Local Edge Reference Line No Curve
TENDON S1-T3R Point
Type
Reference
Object Type
Referenc
e Object
or Range
Offset X
(ft)
Offset Y
(in)
Offset Z
(in)
X
Reference Y Reference Z Reference
Curvature
Type Width
geometr
y
member 1 0.0000 108.0000 157.1250 Start -Y3 Local
Edge
Reference
Line
No Curve
path
only
member 2
path
only
member 3
path
only
member 4
geometr
y
member 5 5.0000 11.0000 98.5000 Start -Y3 Local
Edge
Reference
Line
No Curve
geometr
y
member 6 15.0000 11.0000 98.5000 Start -Y3 Local
Edge
Reference
Line
No Curve
path
only
member 7
path
only
member 8
path
only
member 9
path
only
member 10
path
only
member 11
geometr
y
member 12 0.0000 123.0000 116.0000 End -Y3 Local
Edge
Reference
Line
No Curve
TENDON S1-T4R
Point
Type
Reference
Object Type
Reference
Object or
Range
Offset X
(ft)
Offset Y
(in)
Offset Z
(in)
X Reference Y Reference Z Reference Curvature
Type Width

70
geometry member 1 0.0000 24.0000 107.380
0 Start -Y3 Local Edge Reference Line No Curve
path only member 2
geometry member 3 5.0000 11.0000 98.5000 Start -Y3 Local Edge Reference Line No Curve
geometry member 3 15.0000 11.0000 90.5000 Start -Y3 Local Edge Reference Line No Curve
geometry member 4 5.0000 11.0000 82.5000 Start -Y3 Local Edge Reference Line No Curve
geometry member 4 15.0000 11.0000 74.5000 Start -Y3 Local Edge Reference Line No Curve
geometry member 5 5.0000 11.0000 74.5000 Start -Y3 Local Edge Reference Line No Curve
geometry member 6 15.0000 11.0000 74.5000 Start -Y3 Local Edge Reference Line No Curve
geometry member 7 5.0000 11.0000 74.5000 Start -Y3 Local Edge Reference Line No Curve
geometry member 7 15.0000 11.0000 74.5000 Start -Y3 Local Edge Reference Line No Curve
geometry member 8 15.0000 11.0000 90.5000 Start -Y3 Local Edge Reference Line No Curve
path only member 9
path only member 10
geometry member 11 2.0000 11.0000 90.5000 Start -Y3 Local Edge Reference Line No Curve
path only member 12
geometry member 12 0.0000 21.0000 90.5000 End -Y3 Local Edge Reference Line No Curve
TENDON S2-T5L
Point Type Reference
Object Type
Reference
Object or
Range
Offset X
(ft)
Offset Y
(in) Offset Z (in) X Reference Y Reference Z Reference
Curvature
Type Width
geometry member 11 0.0000 123.0000 -161.0000 Start -Y3 Local Edge Reference Line No Curve
path only member 12
path only member 13
path only member 13
path only member 14
geometry member 15 15.0000 11.0000 -98.5000 Start -Y3 Local Edge Reference Line No Curve
geometry member 16 5.0000 11.0000 -90.5000 Start -Y3 Local Edge Reference Line No Curve
geometry member 16 15.0000 11.0000 -82.5000 Start -Y3 Local Edge Reference Line No Curve
path only member 17
geometry member 18 5.0000 11.0000 -82.5000 Start -Y3 Local Edge Reference Line No Curve
geometry member 18 15.0000 11.0000 -90.5000 Start -Y3 Local Edge Reference Line No Curve
geometry member 19 5.0000 11.0000 -98.5000 Start -Y3 Local Edge Reference Line No Curve
path only member 20
path only member 21
path only member 22
geometry member 23 0.0000 123.0000 -152.0000 End -Y3 Local Edge Reference Line No Curve
TENDON S2-T6L Point
Type
Reference
Object Type
Referenc
e Object
or Range
Offset X
(ft)
Offset Y
(in)
Offset Z
(in)
X Reference Y Reference Z Reference Curvature
Type Width
geometr
y member 11 0.0000 123.0000 -143.0000 Start -Y3 Local
Edge
Reference
Line No Curve
path
only
member 12
path
only
member 13
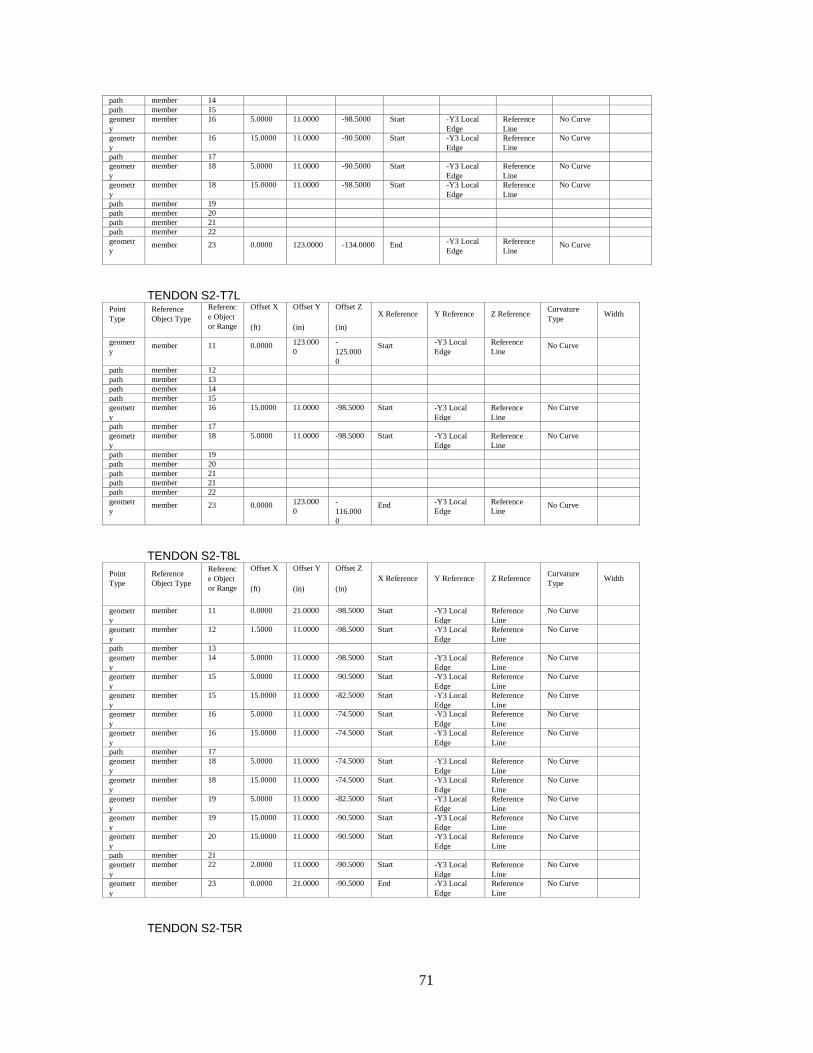
71
path
only
member 14
path
only
member 15
geometr
y
member 16 5.0000 11.0000 -98.5000 Start -Y3 Local
Edge
Reference
Line
No Curve
geometr
y
member 16 15.0000 11.0000 -90.5000 Start -Y3 Local
Edge
Reference
Line
No Curve
path
only
member 17
geometr
y
member 18 5.0000 11.0000 -90.5000 Start -Y3 Local
Edge
Reference
Line
No Curve
geometr
y
member 18 15.0000 11.0000 -98.5000 Start -Y3 Local
Edge
Reference
Line
No Curve
path
only
member 19
path
only
member 20
path
only
member 21
path
only
member 22
geometr
y member 23 0.0000 123.0000 -134.0000 End -Y3 Local
Edge
Reference
Line No Curve
TENDON S2-T7L Point
Type
Reference
Object Type
Referenc
e Object
or Range
Offset X
(ft)
Offset Y
(in)
Offset Z
(in)
X Reference Y Reference Z Reference Curvature
Type Width
geometr
y member 11 0.0000 123.000
0
-
125.000
0
Start -Y3 Local
Edge
Reference
Line No Curve
path
only
member 12
path
only
member 13
path
only
member 14
path
only
member 15
geometr
y
member 16 15.0000 11.0000 -98.5000 Start -Y3 Local
Edge
Reference
Line
No Curve
path
only
member 17
geometr
y
member 18 5.0000 11.0000 -98.5000 Start -Y3 Local
Edge
Reference
Line
No Curve
path
only
member 19
path
only
member 20
path
only
member 21
path
only
member 21
path
only
member 22
geometr
y member 23 0.0000 123.000
0
-
116.000
0
End -Y3 Local
Edge
Reference
Line No Curve
TENDON S2-T8L
Point
Type
Reference
Object Type
Referenc
e Object
or Range
Offset X
(ft)
Offset Y
(in)
Offset Z
(in)
X Reference Y Reference Z Reference Curvature
Type Width
geometr
y
member 11 0.0000 21.0000 -98.5000 Start -Y3 Local
Edge
Reference
Line
No Curve
geometr
y
member 12 1.5000 11.0000 -98.5000 Start -Y3 Local
Edge
Reference
Line
No Curve
path
only
member 13
geometr
y
member 14 5.0000 11.0000 -98.5000 Start -Y3 Local
Edge
Reference
Line
No Curve
geometr
y
member 15 5.0000 11.0000 -90.5000 Start -Y3 Local
Edge
Reference
Line
No Curve
geometr
y
member 15 15.0000 11.0000 -82.5000 Start -Y3 Local
Edge
Reference
Line
No Curve
geometr
y
member 16 5.0000 11.0000 -74.5000 Start -Y3 Local
Edge
Reference
Line
No Curve
geometr
y
member 16 15.0000 11.0000 -74.5000 Start -Y3 Local
Edge
Reference
Line
No Curve
path
only
member 17
geometr
y
member 18 5.0000 11.0000 -74.5000 Start -Y3 Local
Edge
Reference
Line
No Curve
geometr
y
member 18 15.0000 11.0000 -74.5000 Start -Y3 Local
Edge
Reference
Line
No Curve
geometr
y
member 19 5.0000 11.0000 -82.5000 Start -Y3 Local
Edge
Reference
Line
No Curve
geometr
y
member 19 15.0000 11.0000 -90.5000 Start -Y3 Local
Edge
Reference
Line
No Curve
geometr
y
member 20 15.0000 11.0000 -90.5000 Start -Y3 Local
Edge
Reference
Line
No Curve
path
only
member 21
geometr
y
member 22 2.0000 11.0000 -90.5000 Start -Y3 Local
Edge
Reference
Line
No Curve
geometr
y
member 23 0.0000 21.0000 -90.5000 End -Y3 Local
Edge
Reference
Line
No Curve
TENDON S2-T5R

72
Point
Type
Reference
Object Type
Referenc
e Object
or Range
Offset X
(ft)
Offset Y
(in)
Offset Z
(in)
X Reference Y Reference Z Reference Curvature
Type Width
geometr
y
member 11 0.0000 123.000
0
161.000
0
Start -Y3 Local
Edge
Reference
Line
No Curve
path
only
member 12
path
only
member 13
path
only
member 14
geometr
y
member 15 15.0000 11.0000 98.5000 Start -Y3 Local
Edge
Reference
Line
No Curve
geometr
y
member 16 5.0000 11.0000 90.5000 Start -Y3 Local
Edge
Reference
Line
No Curve
geometr
y
member 16 15.0000 11.0000 82.5000 Start -Y3 Local
Edge
Reference
Line
No Curve
path
only
member 17
geometr
y
member 18 5.0000 11.0000 82.5000 Start -Y3 Local
Edge
Reference
Line
No Curve
geometr
y
member 18 15.0000 11.0000 90.5000 Start -Y3 Local
Edge
Reference
Line
No Curve
geometr
y
member 19 5.0000 11.0000 98.5000 Start -Y3 Local
Edge
Reference
Line
No Curve
path
only
member 20
path
only
member 21
path
only
member 22
geometr
y
member 23 0.0000 123.000
0
152.000
0
End -Y3 Local
Edge
Reference
Line
No Curve
TENDON S2-T6R Point
Type
Reference
Object Type
Referenc
e Object
or Range
Offset X
(ft)
Offset Y
(in)
Offset Z
(in)
X Reference Y Reference Z Reference Curvature
Type Width
geometr
y
member 11 0.0000 123.000
0
143.000
0
Start -Y3 Local
Edge
Reference
Line
No Curve
path
only
member 12
path
only
member 13
path
only
member 14
path
only
member 15
geometr
y
member 16 5.0000 11.0000 98.5000 Start -Y3 Local
Edge
Reference
Line
No Curve
geometr
y
member 16 15.0000 11.0000 90.5000 Start -Y3 Local
Edge
Reference
Line
No Curve
path
only
member 17
geometr
y
member 18 5.0000 11.0000 90.5000 Start -Y3 Local
Edge
Reference
Line
No Curve
geometr
y
member 18 15.0000 11.0000 98.5000 Start -Y3 Local
Edge
Reference
Line
No Curve
path
only
member 19
path
only
member 20
path
only
member 21
path
only
member 22
geometr
y
member 23 0.0000 123.000
0
134.000
0
End -Y3 Local
Edge
Reference
Line
No Curve
TENDON S2-T7R Point
Type
Reference
Object Type
Referenc
e Object
or Range
Offset X
(ft)
Offset Y
(in)
Offset Z
(in)
X Reference Y Reference Z Reference Curvature
Type Width
geometr
y
member 11 0.0000 123.000
0
125.000
0
Start -Y3 Local
Edge
Reference
Line
No Curve
path
only
member 12
path
only
member 13
path
only
member 14
path
only
member 15
geometr
y
member 16 15.0000 11.0000 98.5000 Start -Y3 Local
Edge
Reference
Line
No Curve
path
only
member 17
geometr
y
member 18 5.0000 11.0000 98.5000 Start -Y3 Local
Edge
Reference
Line
No Curve
path
only
member 19
path
only
member 20
path
only
member 21
path
only
member 22
geometr
y
member 23 0.0000 123.000
0
116.000
0
End -Y3 Local
Edge
Reference
Line
No Curve
TENDON S2-T8R Point
Type
Reference
Object Type
Referenc
e Object
or Range
Offset X
(ft)
Offset Y
(in)
Offset Z
(in)
X Reference Y Reference Z Reference Curvature
Type
Width
geometr
y
member 11 0.0000 21.0000 98.5000 Start -Y3 Local
Edge
Reference
Line
No Curve
geometr
y
member 12 1.5000 11.0000 98.5000 Start -Y3 Local
Edge
Reference
Line
No Curve
path
only
member 13

73
geometr
y
member 14 5.0000 11.0000 98.5000 Start -Y3 Local
Edge
Reference
Line
No Curve
geometr
y
member 15 5.0000 11.0000 90.5000 Start -Y3 Local
Edge
Reference
Line
No Curve
geometr
y
member 15 15.0000 11.0000 82.5000 Start -Y3 Local
Edge
Reference
Line
No Curve
geometr
y
member 16 5.0000 11.0000 74.5000 Start -Y3 Local
Edge
Reference
Line
No Curve
geometr
y
member 16 15.0000 11.0000 74.5000 Start -Y3 Local
Edge
Reference
Line
No Curve
path
only
member 17
geometr
y
member 18 5.0000 11.0000 74.5000 Start -Y3 Local
Edge
Reference
Line
No Curve
geometr
y
member 18 15.0000 11.0000 74.5000 Start -Y3 Local
Edge
Reference
Line
No Curve
geometr
y
member 19 5.0000 11.0000 82.5000 Start -Y3 Local
Edge
Reference
Line
No Curve
geometr
y
member 19 15.0000 11.0000 90.5000 Start -Y3 Local
Edge
Reference
Line
No Curve
geometr
y
member 20 15.0000 11.0000 90.5000 Start -Y3 Local
Edge
Reference
Line
No Curve
path
only
member 21
geometr
y
member 22 2.0000 11.0000 90.5000 Start -Y3 Local
Edge
Reference
Line
No Curve
geometr
y
member 23 0.0000 21.0000 90.5000 End -Y3 Local
Edge
Reference
Line
No Curve
TENDON S3-T5L Point
Type
Reference
Object
Type
Referenc
e Object
or Range
Offset X
(ft)
Offset Y
(in)
Offset Z
(in)
X Reference Y Reference Z Reference Curvature
Type
Width
geometry member 22 0.0000 123.000
0
-
161.000
0
Start -Y3 Local
Edge Reference Line No Curve
path only member 23
path only member 24
path only member 25
geometry member 26 15.0000 11.0000 -98.5000 Start -Y3 Local
Edge
Reference Line No Curve
geometry member 27 5.0000 11.0000 -90.5000 Start -Y3 Local
Edge
Reference Line No Curve
geometry member 27 15.0000 11.0000 -82.5000 Start -Y3 Local
Edge
Reference Line No Curve
path only member 28
geometry member 29 5.0000 11.0000 -82.5000 Start -Y3 Local
Edge
Reference Line No Curve
geometry member 29 15.0000 11.0000 -90.5000 Start -Y3 Local
Edge
Reference Line No Curve
geometry member 30 5.0000 11.0000 -98.5000 Start -Y3 Local
Edge
Reference Line No Curve
path only member 31
path only member 32
path only member 33
geometry member 34 0.0000 123.000
0
-
152.000
0
End -Y3 Local
Edge Reference Line No Curve
TENDON S3-T6L Point
Type
Reference
Object Type
Referenc
e Object
or Range
Offset X
(ft)
Offset Y
(in)
Offset Z
(in)
X Reference Y Reference Z Reference Curvature
Type
Width
geometr
y member 22 0.0000
123.000
0
-
143.000
0
Start -Y3 Local
Edge
Reference
Line No Curve
path
only
member 23
path
only
member 24
path
only
member 25
path
only
member 26
geometr
y
member 27 5.0000 11.0000 -98.5000 Start -Y3 Local
Edge
Reference
Line
No Curve
geometr
y
member 27 15.0000 11.0000 -90.5000 Start -Y3 Local
Edge
Reference
Line
No Curve
path
only
member 28
geometr
y
member 29 5.0000 11.0000 -90.5000 Start -Y3 Local
Edge
Reference
Line
No Curve
geometr
y
member 29 15.0000 11.0000 -98.5000 Start -Y3 Local
Edge
Reference
Line
No Curve
path
only
member 30
path
only
member 31
path
only
member 32
path
only
member 33
geometr
y member 34 0.0000
123.000
0
-
134.000
0
End -Y3 Local
Edge
Reference
Line No Curve
TENDON S3-T7L

74
Point
Type
Reference
Object Type
Referenc
e Object
or Range
Offset X
(ft)
Offset Y
(in)
Offset Z
(in)
X Reference Y Reference Z Reference Curvature
Type
Width
geometr
y member 22 0.0000 123.000
0
-
125.000
0
Start -Y3 Local
Edge
Reference
Line No Curve
path
only
member 23
path
only
member 24
path
only
member 25
path
only
member 26
geometr
y
member 27 15.0000 11.0000 -98.5000 Start -Y3 Local
Edge
Reference
Line
No Curve
path
only
member 28
geometr
y
member 29 5.0000 11.0000 -98.5000 Start -Y3 Local
Edge
Reference
Line
No Curve
path
only
member 30
path
only
member 31
path
only
member 32
path
only
member 33
geometr
y member 34 0.0000
123.000
0
-
116.000
0
End -Y3 Local
Edge
Reference
Line No Curve
TENDON S3-T8L Point
Type
Reference
Object Type
Referenc
e Object
or Range
Offset X
(ft)
Offset Y
(in)
Offset Z
(in)
X Reference Y Reference Z Reference Curvature
Type
Width
geometr
y
member 22 0.0000 21.0000 -98.5000 Start -Y3 Local
Edge
Reference
Line
No Curve
geometr
y
member 23 1.5000 11.0000 -98.5000 Start -Y3 Local
Edge
Reference
Line
No Curve
path
only
member 24
geometr
y
member 25 5.0000 11.0000 -98.5000 Start -Y3 Local
Edge
Reference
Line
No Curve
geometr
y
member 26 5.0000 11.0000 -90.5000 Start -Y3 Local
Edge
Reference
Line
No Curve
geometr
y
member 26 15.0000 11.0000 -82.5000 Start -Y3 Local
Edge
Reference
Line
No Curve
geometr
y
member 27 5.0000 11.0000 -74.5000 Start -Y3 Local
Edge
Reference
Line
No Curve
geometr
y
member 27 15.0000 11.0000 -74.5000 Start -Y3 Local
Edge
Reference
Line
No Curve
path
only
member 28
geometr
y
member 29 5.0000 11.0000 -74.5000 Start -Y3 Local
Edge
Reference
Line
No Curve
geometr
y
member 29 15.0000 11.0000 -74.5000 Start -Y3 Local
Edge
Reference
Line
No Curve
geometr
y
member 30 5.0000 11.0000 -82.5000 Start -Y3 Local
Edge
Reference
Line
No Curve
geometr
y
member 30 15.0000 11.0000 -90.5000 Start -Y3 Local
Edge
Reference
Line
No Curve
geometr
y
member 31 15.0000 11.0000 -90.5000 Start -Y3 Local
Edge
Reference
Line
No Curve
path
only
member 32
geometr
y
member 33 2.0000 11.0000 -90.5000 Start -Y3 Local
Edge
Reference
Line
No Curve
geometr
y
member 34 0.0000 21.0000 -90.5000 End -Y3 Local
Edge
Reference
Line
No Curve
TENDON S3-T5R Point
Type
Reference
Object Type
Referenc
e Object
or Range
Offset X
(ft)
Offset Y
(in)
Offset Z
(in)
X Reference Y Reference Z Reference Curvature
Type
Width
geometr
y
member 22 0.0000 123.000
0
161.000
0
Start -Y3 Local
Edge
Reference
Line
No Curve
path
only
member 23
path
only
member 24
path
only
member 25
geometr
y
member 26 15.0000 11.0000 98.5000 Start -Y3 Local
Edge
Reference
Line
No Curve
geometr
y
member 27 5.0000 11.0000 90.5000 Start -Y3 Local
Edge
Reference
Line
No Curve
geometr
y
member 27 15.0000 11.0000 82.5000 Start -Y3 Local
Edge
Reference
Line
No Curve
path
only
member 28
geometr
y
member 29 5.0000 11.0000 82.5000 Start -Y3 Local
Edge
Reference
Line
No Curve
geometr
y
member 29 15.0000 11.0000 90.5000 Start -Y3 Local
Edge
Reference
Line
No Curve
geometr
y
member 30 5.0000 11.0000 98.5000 Start -Y3 Local
Edge
Reference
Line
No Curve
path
only
member 31
path
only
member 32
path
only
member 33
geometr
y
member 34 0.0000 123.000
0
152.000
0
End -Y3 Local
Edge
Reference
Line
No Curve
TENDON S3-T6R

75
Point
Type
Reference
Object Type
Referenc
e Object
or Range
Offset X
(ft)
Offset Y
(in)
Offset Z
(in)
X Reference Y Reference Z Reference Curvature
Type Width
geometr
y
member 22 0.0000 123.000
0
143.000
0
Start -Y3 Local
Edge
Reference
Line
No Curve
path
only
member 23
path
only
member 24
path
only
member 25
path
only
member 26
geometr
y
member 27 5.0000 11.0000 98.5000 Start -Y3 Local
Edge
Reference
Line
No Curve
geometr
y
member 27 15.0000 11.0000 90.5000 Start -Y3 Local
Edge
Reference
Line
No Curve
path
only
member 28
geometr
y
member 29 5.0000 11.0000 90.5000 Start -Y3 Local
Edge
Reference
Line
No Curve
geometr
y
member 29 15.0000 11.0000 98.5000 Start -Y3 Local
Edge
Reference
Line
No Curve
path
only
member 30
path
only
member 31
path
only
member 32
path
only
member 33
geometr
y
member 34 0.0000 123.000
0
134.000
0
End -Y3 Local
Edge
Reference
Line
No Curve
TENDON S3-T7R
Point
Type
Reference
Object Type
Referenc
e Object
or Range
Offset X
(ft)
Offset Y
(in)
Offset Z
(in)
X Reference Y Reference Z Reference Curvature
Type Width
geometr
y
member 22 0.0000 123.000
0
125.000
0
Start -Y3 Local
Edge
Reference
Line
No Curve
path
only
member 23
path
only
member 24
path
only
member 25
path
only
member 26
geometr
y
member 27 15.0000 11.0000 98.5000 Start -Y3 Local
Edge
Reference
Line
No Curve
path
only
member 28
geometr
y
member 29 5.0000 11.0000 98.5000 Start -Y3 Local
Edge
Reference
Line
No Curve
path
only
member 30
path
only
member 31
path
only
member 32
path
only
member 33
geometr
y
member 34 0.0000 123.000
0
116.000
0
End -Y3 Local
Edge
Reference
Line
No Curve
TENDON S3-T8R
Point
Type
Reference
Object Type
Referenc
e Object
or Range
Offset X
(ft)
Offset Y
(in)
Offset Z
(in)
X Reference Y Reference Z Reference Curvature
Type Width
geometr
y
member 22 0.0000 21.0000 98.5000 Start -Y3 Local
Edge
Reference
Line
No Curve
geometr
y
member 23 1.5000 11.0000 98.5000 Start -Y3 Local
Edge
Reference
Line
No Curve
path
only
member 24
geometr
y
member 25 5.0000 11.0000 98.5000 Start -Y3 Local
Edge
Reference
Line
No Curve
geometr
y
member 26 5.0000 11.0000 90.5000 Start -Y3 Local
Edge
Reference
Line
No Curve
geometr
y
member 26 15.0000 11.0000 82.5000 Start -Y3 Local
Edge
Reference
Line
No Curve
geometr
y
member 27 5.0000 11.0000 74.5000 Start -Y3 Local
Edge
Reference
Line
No Curve
geometr
y
member 27 15.0000 11.0000 74.5000 Start -Y3 Local
Edge
Reference
Line
No Curve
path
only
member 28
geometr
y
member 29 5.0000 11.0000 74.5000 Start -Y3 Local
Edge
Reference
Line
No Curve
geometr
y
member 29 15.0000 11.0000 74.5000 Start -Y3 Local
Edge
Reference
Line
No Curve
geometr
y
member 30 5.0000 11.0000 82.5000 Start -Y3 Local
Edge
Reference
Line
No Curve
geometr
y
member 30 15.0000 11.0000 90.5000 Start -Y3 Local
Edge
Reference
Line
No Curve
geometr
y
member 31 15.0000 11.0000 90.5000 Start -Y3 Local
Edge
Reference
Line
No Curve
path
only
member 32
geometr
y
member 33 2.0000 11.0000 90.5000 Start -Y3 Local
Edge
Reference
Line
No Curve
geometr
y
member 34 0.0000 21.0000 90.5000 End -Y3 Local
Edge
Reference
Line
No Curve

76
TENDON S4-T5L
Point
Type
Reference
Object Type
Referenc
e Object
or Range
Offset X
(ft)
Offset Y
(in)
Offset Z
(in)
X Reference Y Reference Z Reference Curvature
Type
Width
geometr
y member 33 0.0000 123.000
0
-
161.000
0
Start -Y3 Local
Edge
Reference
Line No Curve
path
only
member 34
path
only
member 35
path
only
member 36
geometr
y
member 37 15.0000 11.0000 -98.5000 Start -Y3 Local
Edge
Reference
Line
No Curve
geometr
y
member 38 5.0000 11.0000 -90.5000 Start -Y3 Local
Edge
Reference
Line
No Curve
geometr
y
member 38 15.0000 11.0000 -82.5000 Start -Y3 Local
Edge
Reference
Line
No Curve
path
only
member 39
geometr
y
member 40 5.0000 11.0000 -82.5000 Start -Y3 Local
Edge
Reference
Line
No Curve
geometr
y
member 40 15.0000 11.0000 -90.5000 Start -Y3 Local
Edge
Reference
Line
No Curve
geometr
y
member 41 5.0000 11.0000 -98.5000 Start -Y3 Local
Edge
Reference
Line
No Curve
path
only
member 42
path
only
member 43
path
only
member 44
geometr
y member 45 0.0000
123.000
0
-
152.000
0
End -Y3 Local
Edge
Reference
Line No Curve
TENDON S4-T6L
Point
Type
Reference
Object Type
Referenc
e Object
or Range
Offset X
(ft)
Offset Y
(in)
Offset Z
(in)
X Reference Y Reference Z Reference Curvature
Type Width
geometr
y member 33 0.0000
123.000
0
-
143.000
0
Start -Y3 Local
Edge
Reference
Line No Curve
path
only
member 34
path
only
member 35
path
only
member 36
path
only
member 37
geometr
y
member 38 5.0000 11.0000 -98.5000 Start -Y3 Local
Edge
Reference
Line
No Curve
geometr
y
member 38 15.0000 11.0000 -90.5000 Start -Y3 Local
Edge
Reference
Line
No Curve
path
only
member 39
geometr
y
member 40 5.0000 11.0000 -90.5000 Start -Y3 Local
Edge
Reference
Line
No Curve
geometr
y
member 40 15.0000 11.0000 -98.5000 Start -Y3 Local
Edge
Reference
Line
No Curve
path
only
member 41
path
only
member 42
path
only
member 43
path
only
member 44
geometr
y member 45 0.0000
123.000
0
-
134.000
0
End -Y3 Local
Edge
Reference
Line No Curve
TENDON S4-T7L
Point
Type
Reference
Object Type
Referenc
e Object
or Range
Offset X
(ft)
Offset Y
(in)
Offset Z
(in)
X Reference Y Reference Z Reference Curvature
Type Width
geometr
y member 33 0.0000 123.000
0
-
125.000
0
Start -Y3 Local
Edge
Reference
Line No Curve
path
only
member 34
path
only
member 35
path
only
member 36
path
only
member 37
geometr
y
member 38 15.0000 11.0000 -98.5000 Start -Y3 Local
Edge
Reference
Line
No Curve
path
only
member 39
geometr
y
member 40 5.0000 11.0000 -98.5000 Start -Y3 Local
Edge
Reference
Line
No Curve
path
only
member 41
path
only
member 42
path
only
member 43
path
only
member 44
geometr
y member 45 0.0000
123.000
0
-
116.000
0
End -Y3 Local
Edge
Reference
Line No Curve

77
TENDON S4-T8L
Point
Type
Reference
Object Type
Referenc
e Object
or Range
Offset X
(ft)
Offset Y
(in)
Offset Z
(in)
X Reference Y Reference Z Reference Curvature
Type Width
geometr
y
member 33 0.0000 21.0000 -98.5000 Start -Y3 Local
Edge
Reference
Line
No Curve
geometr
y
member 34 1.5000 11.0000 -98.5000 Start -Y3 Local
Edge
Reference
Line
No Curve
path
only
member 35
geometr
y
member 36 5.0000 11.0000 -98.5000 Start -Y3 Local
Edge
Reference
Line
No Curve
geometr
y
member 37 5.0000 11.0000 -90.5000 Start -Y3 Local
Edge
Reference
Line
No Curve
geometr
y
member 37 15.0000 11.0000 -82.5000 Start -Y3 Local
Edge
Reference
Line
No Curve
geometr
y
member 38 5.0000 11.0000 -74.5000 Start -Y3 Local
Edge
Reference
Line
No Curve
geometr
y
member 38 15.0000 11.0000 -74.5000 Start -Y3 Local
Edge
Reference
Line
No Curve
path
only
member 39
geometr
y
member 40 5.0000 11.0000 -74.5000 Start -Y3 Local
Edge
Reference
Line
No Curve
geometr
y
member 40 15.0000 11.0000 -74.5000 Start -Y3 Local
Edge
Reference
Line
No Curve
geometr
y
member 41 5.0000 11.0000 -82.5000 Start -Y3 Local
Edge
Reference
Line
No Curve
geometr
y
member 41 15.0000 11.0000 -90.5000 Start -Y3 Local
Edge
Reference
Line
No Curve
geometr
y
member 42 15.0000 11.0000 -90.5000 Start -Y3 Local
Edge
Reference
Line
No Curve
path
only
member 43
geometr
y
member 44 2.0000 11.0000 -90.5000 Start -Y3 Local
Edge
Reference
Line
No Curve
geometr
y
member 45 0.0000 21.0000 -90.5000 End -Y3 Local
Edge
Reference
Line
No Curve
TENDON S4-T5R
Point
Type
Reference
Object Type
Referenc
e Object
or Range
Offset X
(ft)
Offset Y
(in)
Offset Z
(in)
X Reference Y Reference Z Reference Curvature
Type Width
geometr
y
member 33 0.0000 123.000
0
161.000
0
Start -Y3 Local
Edge
Reference
Line
No Curve
path
only
member 34
path
only
member 35
path
only
member 36
geometr
y
member 37 15.0000 11.0000 98.5000 Start -Y3 Local
Edge
Reference
Line
No Curve
geometr
y
member 38 5.0000 11.0000 90.5000 Start -Y3 Local
Edge
Reference
Line
No Curve
geometr
y
member 38 15.0000 11.0000 82.5000 Start -Y3 Local
Edge
Reference
Line
No Curve
path
only
member 39
geometr
y
member 40 5.0000 11.0000 82.5000 Start -Y3 Local
Edge
Reference
Line
No Curve
geometr
y
member 40 15.0000 11.0000 90.5000 Start -Y3 Local
Edge
Reference
Line
No Curve
geometr
y
member 41 5.0000 11.0000 98.5000 Start -Y3 Local
Edge
Reference
Line
No Curve
path
only
member 42
path
only
member 43
path
only
member 44
geometr
y
member 45 0.0000 123.000
0
152.000
0
End -Y3 Local
Edge
Reference
Line
No Curve
TENDON S4-T6R
Point
Type
Reference
Object Type
Referenc
e Object
or Range
Offset X
(ft)
Offset Y
(in)
Offset Z
(in)
X Reference Y Reference Z Reference Curvature
Type Width
geometr
y
member 33 0.0000 123.000
0
143.000
0
Start -Y3 Local
Edge
Reference
Line
No Curve
path
only
member 34
path
only
member 35
path
only
member 36
path
only
member 37
geometr
y
member 38 5.0000 11.0000 98.5000 Start -Y3 Local
Edge
Reference
Line
No Curve

78
geometr
y
member 38 15.0000 11.0000 90.5000 Start -Y3 Local
Edge
Reference
Line
No Curve
path
only
member 39
geometr
y
member 40 5.0000 11.0000 90.5000 Start -Y3 Local
Edge
Reference
Line
No Curve
geometr
y
member 40 15.0000 11.0000 98.5000 Start -Y3 Local
Edge
Reference
Line
No Curve
path
only
member 41
path
only
member 42
path
only
member 43
path
only
member 44
geometr
y
member 45 0.0000 123.000
0
134.000
0
End -Y3 Local
Edge
Reference
Line
No Curve
TENDON S4-T7R
Point
Type
Reference
Object Type
Referenc
e Object
or Range
Offset X
(ft)
Offset Y
(in)
Offset Z
(in)
X Reference Y Reference Z Reference Curvature
Type Width
geometr
y
member 33 0.0000 123.000
0
125.000
0
Start -Y3 Local
Edge
Reference
Line
No Curve
path
only
member 34
path
only
member 35
path
only
member 36
path
only
member 37
geometr
y
member 38 15.0000 11.0000 98.5000 Start -Y3 Local
Edge
Reference
Line
No Curve
path
only
member 39
geometr
y
member 40 5.0000 11.0000 98.5000 Start -Y3 Local
Edge
Reference
Line
No Curve
path
only
member 41
path
only
member 42
path
only
member 43
path
only
member 44
geometr
y
member 45 0.0000 123.000
0
116.000
0
End -Y3 Local
Edge
Reference
Line
No Curve
TENDON S4-T8R
Point
Type
Reference
Object Type
Referenc
e Object
or Range
Offset X
(ft)
Offset Y
(in)
Offset Z
(in)
X Reference Y Reference Z Reference Curvature
Type Width
geometr
y
member 33 0.0000 21.0000 98.5000 Start -Y3 Local
Edge
Reference
Line
No Curve
geometr
y
member 34 1.5000 11.0000 98.5000 Start -Y3 Local
Edge
Reference
Line
No Curve
path
only
member 35
geometr
y
member 36 5.0000 11.0000 98.5000 Start -Y3 Local
Edge
Reference
Line
No Curve
geometr
y
member 37 5.0000 11.0000 90.5000 Start -Y3 Local
Edge
Reference
Line
No Curve
geometr
y
member 37 15.0000 11.0000 82.5000 Start -Y3 Local
Edge
Reference
Line
No Curve
geometr
y
member 38 5.0000 11.0000 74.5000 Start -Y3 Local
Edge
Reference
Line
No Curve
geometr
y
member 38 15.0000 11.0000 74.5000 Start -Y3 Local
Edge
Reference
Line
No Curve
path
only
member 39
geometr
y
member 40 5.0000 11.0000 74.5000 Start -Y3 Local
Edge
Reference
Line
No Curve
geometr
y
member 40 15.0000 11.0000 74.5000 Start -Y3 Local
Edge
Reference
Line
No Curve
geometr
y
member 41 5.0000 11.0000 82.5000 Start -Y3 Local
Edge
Reference
Line
No Curve
geometr
y
member 41 15.0000 11.0000 90.5000 Start -Y3 Local
Edge
Reference
Line
No Curve
geometr
y
member 42 15.0000 11.0000 90.5000 Start -Y3 Local
Edge
Reference
Line
No Curve
path
only
member 43
geometr
y
member 44 2.0000 11.0000 90.5000 Start -Y3 Local
Edge
Reference
Line
No Curve
geometr
y
member 45 0.0000 21.0000 90.5000 End -Y3 Local
Edge
Reference
Line
No Curve
TENDON S5-T5L
Point
Type
Reference
Object Type
Referenc
e Object
or Range
Offset X
(ft)
Offset Y
(in)
Offset Z
(in)
X Reference Y Reference Z Reference Curvature
Type Width
geometr
y member 44 0.0000
123.000
0
-
161.000
0
Start -Y3 Local
Edge
Reference
Line No Curve
path
only
member 45
path
only
member 46

79
path
only
member 47
geometr
y
member 48 15.0000 11.0000 -98.5000 Start -Y3 Local
Edge
Reference
Line
No Curve
geometr
y
member 49 5.0000 11.0000 -90.5000 Start -Y3 Local
Edge
Reference
Line
No Curve
geometr
y
member 49 15.0000 11.0000 -82.5000 Start -Y3 Local
Edge
Reference
Line
No Curve
path
only
member 50
geometr
y
member 51 5.0000 11.0000 -82.5000 Start -Y3 Local
Edge
Reference
Line
No Curve
geometr
y
member 51 15.0000 11.0000 -90.5000 Start -Y3 Local
Edge
Reference
Line
No Curve
geometr
y
member 52 5.0000 11.0000 -98.5000 Start -Y3 Local
Edge
Reference
Line
No Curve
path
only
member 53
path
only
member 54
path
only
member 55
geometr
y member 56 0.0000
123.000
0
-
152.000
0
End -Y3 Local
Edge
Reference
Line No Curve
TENDON S5-T6L
Point
Type
Reference
Object Type
Referenc
e Object
or Range
Offset X
(ft)
Offset Y
(in)
Offset Z
(in)
X Reference Y Reference Z Reference Curvature
Type Width
geometr
y member 44 0.0000
123.000
0
-
143.000
0
Start -Y3 Local
Edge
Reference
Line No Curve
path
only
member 45
path
only
member 46
path
only
member 47
path
only
member 48
geometr
y
member 49 5.0000 11.0000 -98.5000 Start -Y3 Local
Edge
Reference
Line
No Curve
geometr
y
member 49 15.0000 11.0000 -90.5000 Start -Y3 Local
Edge
Reference
Line
No Curve
path
only
member 50
geometr
y
member 51 5.0000 11.0000 -90.5000 Start -Y3 Local
Edge
Reference
Line
No Curve
geometr
y
member 51 15.0000 11.0000 -98.5000 Start -Y3 Local
Edge
Reference
Line
No Curve
path
only
member 52
path
only
member 53
path
only
member 54
path
only
member 55
geometr
y member 56 0.0000
123.000
0
-
134.000
0
End -Y3 Local
Edge
Reference
Line No Curve
TENDON S5-T7L
Point
Type
Reference
Object Type
Referenc
e Object
or Range
Offset X
(ft)
Offset Y
(in)
Offset Z
(in)
X Reference Y Reference Z Reference Curvature
Type Width
geometr
y member 44 0.0000 123.000
0
-
125.000
0
Start -Y3 Local
Edge
Reference
Line No Curve
path
only
member 45
path
only
member 46
path
only
member 47
path
only
member 48
geometr
y
member 49 15.0000 11.0000 -98.5000 Start -Y3 Local
Edge
Reference
Line
No Curve
path
only
member 50
geometr
y
member 51 5.0000 11.0000 -98.5000 Start -Y3 Local
Edge
Reference
Line
No Curve
path
only
member 52
path
only
member 53
path
only
member 54
path
only
member 55
geometr
y member 56 0.0000
123.000
0
-
116.000
0
End -Y3 Local
Edge
Reference
Line No Curve
TENDON S5-T8L
Point
Type
Reference
Object Type
Referenc
e Object
or Range
Offset X
(ft)
Offset Y
(in)
Offset Z
(in)
X Reference Y Reference Z Reference Curvature
Type Width
geometr
y
member 44 0.0000 21.0000 -98.5000 Start -Y3 Local
Edge
Reference
Line
No Curve
geometr
y
member 45 1.5000 11.0000 -98.5000 Start -Y3 Local
Edge
Reference
Line
No Curve

80
path
only
member 46
geometr
y
member 47 5.0000 11.0000 -98.5000 Start -Y3 Local
Edge
Reference
Line
No Curve
geometr
y
member 48 5.0000 11.0000 -90.5000 Start -Y3 Local
Edge
Reference
Line
No Curve
geometr
y
member 48 15.0000 11.0000 -82.5000 Start -Y3 Local
Edge
Reference
Line
No Curve
geometr
y
member 49 5.0000 11.0000 -74.5000 Start -Y3 Local
Edge
Reference
Line
No Curve
geometr
y
member 49 15.0000 11.0000 -74.5000 Start -Y3 Local
Edge
Reference
Line
No Curve
path
only
member 50
geometr
y
member 51 5.0000 11.0000 -74.5000 Start -Y3 Local
Edge
Reference
Line
No Curve
geometr
y
member 51 15.0000 11.0000 -74.5000 Start -Y3 Local
Edge
Reference
Line
No Curve
geometr
y
member 52 5.0000 11.0000 -82.5000 Start -Y3 Local
Edge
Reference
Line
No Curve
geometr
y
member 52 15.0000 11.0000 -90.5000 Start -Y3 Local
Edge
Reference
Line
No Curve
geometr
y
member 53 15.0000 11.0000 -90.5000 Start -Y3 Local
Edge
Reference
Line
No Curve
path
only
member 54
geometr
y
member 55 2.0000 11.0000 -90.5000 Start -Y3 Local
Edge
Reference
Line
No Curve
geometr
y
member 56 0.0000 21.0000 -90.5000 End -Y3 Local
Edge
Reference
Line
No Curve
TENDON S5-T5R
Point
Type
Reference
Object Type
Referenc
e Object
or Range
Offset X
(ft)
Offset Y
(in)
Offset Z
(in)
X Reference Y Reference Z Reference Curvature
Type Width
geometr
y
member 44 0.0000 123.000
0
161.000
0
Start -Y3 Local
Edge
Reference
Line
No Curve
path
only
member 45
path
only
member 46
path
only
member 47
geometr
y
member 48 15.0000 11.0000 98.5000 Start -Y3 Local
Edge
Reference
Line
No Curve
geometr
y
member 49 5.0000 11.0000 90.5000 Start -Y3 Local
Edge
Reference
Line
No Curve
geometr
y
member 49 15.0000 11.0000 82.5000 Start -Y3 Local
Edge
Reference
Line
No Curve
path
only
member 50
geometr
y
member 51 5.0000 11.0000 82.5000 Start -Y3 Local
Edge
Reference
Line
No Curve
geometr
y
member 51 15.0000 11.0000 90.5000 Start -Y3 Local
Edge
Reference
Line
No Curve
geometr
y
member 52 5.0000 11.0000 98.5000 Start -Y3 Local
Edge
Reference
Line
No Curve
path
only
member 53
path
only
member 54
path
only
member 55
geometr
y
member 56 0.0000 123.000
0
152.000
0
End -Y3 Local
Edge
Reference
Line
No Curve
TENDON S5-T6R
Point
Type
Reference
Object Type
Referenc
e Object
or Range
Offset X
(ft)
Offset Y
(in)
Offset Z
(in)
X Reference Y Reference Z Reference Curvature
Type
Width
geometr
y
member 44 0.0000 123.000
0
143.000
0
Start -Y3 Local
Edge
Reference
Line
No Curve
path
only
member 45
path
only
member 46
path
only
member 47
path
only
member 48
geometr
y
member 49 5.0000 11.0000 98.5000 Start -Y3 Local
Edge
Reference
Line
No Curve
geometr
y
member 49 15.0000 11.0000 90.5000 Start -Y3 Local
Edge
Reference
Line
No Curve
path
only
member 50
geometr
y
member 51 5.0000 11.0000 90.5000 Start -Y3 Local
Edge
Reference
Line
No Curve
geometr
y
member 51 15.0000 11.0000 98.5000 Start -Y3 Local
Edge
Reference
Line
No Curve
path
only
member 52
path
only
member 53
path
only
member 54
path
only
member 55
geometr
y
member 56 0.0000 123.000
0
134.000
0
End -Y3 Local
Edge
Reference
Line
No Curve

81
TENDON S5-T7R
Point
Type
Reference
Object Type
Referenc
e Object
or Range
Offset X
(ft)
Offset Y
(in)
Offset Z
(in)
X Reference Y Reference Z Reference Curvature
Type Width
geometr
y
member 44 0.0000 123.000
0
125.000
0
Start -Y3 Local
Edge
Reference
Line
No Curve
path
only
member 45
path
only
member 46
path
only
member 47
path
only
member 48
geometr
y
member 49 15.0000 11.0000 98.5000 Start -Y3 Local
Edge
Reference
Line
No Curve
path
only
member 50
geometr
y
member 51 5.0000 11.0000 98.5000 Start -Y3 Local
Edge
Reference
Line
No Curve
path
only
member 52
path
only
member 53
path
only
member 54
path
only
member 55
geometr
y
member 56 0.0000 123.000
0
116.000
0
End -Y3 Local
Edge
Reference
Line
No Curve
TENDON S5-T8R
Point
Type
Reference
Object Type
Referenc
e Object
or Range
Offset X
(ft)
Offset Y
(in)
Offset Z
(in)
X Reference Y Reference Z Reference Curvature
Type Width
geometr
y
member 44 0.0000 21.0000 98.5000 Start -Y3 Local
Edge
Reference
Line
No Curve
geometr
y
member 45 1.5000 11.0000 98.5000 Start -Y3 Local
Edge
Reference
Line
No Curve
path
only
member 46
geometr
y
member 47 5.0000 11.0000 98.5000 Start -Y3 Local
Edge
Reference
Line
No Curve
geometr
y
member 48 5.0000 11.0000 90.5000 Start -Y3 Local
Edge
Reference
Line
No Curve
geometr
y
member 48 15.0000 11.0000 82.5000 Start -Y3 Local
Edge
Reference
Line
No Curve
geometr
y
member 49 5.0000 11.0000 74.5000 Start -Y3 Local
Edge
Reference
Line
No Curve
geometr
y
member 49 15.0000 11.0000 74.5000 Start -Y3 Local
Edge
Reference
Line
No Curve
path
only
member 50
geometr
y
member 51 5.0000 11.0000 74.5000 Start -Y3 Local
Edge
Reference
Line
No Curve
geometr
y
member 51 15.0000 11.0000 74.5000 Start -Y3 Local
Edge
Reference
Line
No Curve
geometr
y
member 52 5.0000 11.0000 82.5000 Start -Y3 Local
Edge
Reference
Line
No Curve
geometr
y
member 52 15.0000 11.0000 90.5000 Start -Y3 Local
Edge
Reference
Line
No Curve
geometr
y
member 53 15.0000 11.0000 90.5000 Start -Y3 Local
Edge
Reference
Line
No Curve
path
only
member 54
geometr
y
member 55 2.0000 11.0000 90.5000 Start -Y3 Local
Edge
Reference
Line
No Curve
geometr
y
member 56 0.0000 21.0000 90.5000 End -Y3 Local
Edge
Reference
Line
No Curve
TENDON S6-T9L
Point
Type
Reference
Object Type
Referenc
e Object
or Range
Offset X
(ft)
Offset Y
(in)
Offset Z
(in)
X Reference Y Reference Z Reference Curvature
Type Width
geometr
y member 55 0.0000 123.000
0
-
161.000
0
Start -Y3 Local
Edge
Reference
Line No Curve
path
only
member 56
path
only
member 57
path
only
member 58
path
only
member 59
geometr
y
member 60 5.0000 11.0000 -98.5000 Start -Y3 Local
Edge
Reference
Line
No Curve
geometr
y
member 60 15.0000 11.0000 -90.5000 Start -Y3 Local
Edge
Reference
Line
No Curve
geometr
y
member 61 5.0000 11.0000 -82.5000 Start -Y3 Local
Edge
Reference
Line
No Curve
geometr
y
member 62 15.0000 11.0000 -82.5000 Start -Y3 Local
Edge
Reference
Line
No Curve
geometr
y
member 63 5.0000 11.0000 -90.5000 Start -Y3 Local
Edge
Reference
Line
No Curve
geometr
y
member 63 15.0000 11.0000 -98.5000 Start -Y3 Local
Edge
Reference
Line
No Curve
path
only
member 64

82
path
only
member 65
geometr
y member 66 0.0000 60.0000 -
128.690
0
End -Y3 Local
Edge
Reference
Line No Curve
TENDON S6-T10L
Point
Type
Reference
Object Type
Referenc
e Object
or Range
Offset X
(ft)
Offset Y
(in)
Offset Z
(in)
X Reference Y Reference Z Reference Curvature
Type Width
geometr
y member 55 0.0000 123.000
0
-
143.000
0
Start -Y3 Local
Edge
Reference
Line No Curve
path
only
member 56
path
only
member 57
path
only
member 58
path
only
member 59
geometr
y
member 60 15.0000 11.0000 -98.5000 Start -Y3 Local
Edge
Reference
Line
No Curve
geometr
y
member 61 5.0000 11.0000 -90.5000 Start -Y3 Local
Edge
Reference
Line
No Curve
geometr
y
member 62 15.0000 11.0000 -90.5000 Start -Y3 Local
Edge
Reference
Line
No Curve
geometr
y
member 63 5.0000 11.0000 -98.5000 Start -Y3 Local
Edge
Reference
Line
No Curve
path
only
member 64
path
only
member 65
geometr
y member 66 0.0000 84.0000 -
142.940
0
End -Y3 Local
Edge
Reference
Line No Curve
TENDON S6-T11L
Point
Type
Reference
Object Type
Referenc
e Object
or Range
Offset X
(ft)
Offset Y
(in)
Offset Z
(in)
X Reference Y Reference Z Reference Curvature
Type Width
geometr
y member 55 0.0000 123.000
0
-
125.000
0
Start -Y3 Local
Edge
Reference
Line No Curve
path
only
member 56
path
only
member 57
path
only
member 58
path
only
member 59
path
only
member 60
geometr
y
member 61 5.0000 11.0000 -98.5000 Start -Y3 Local
Edge
Reference
Line
No Curve
geometr
y
member 62 15.0000 11.0000 -98.5000 Start -Y3 Local
Edge
Reference
Line
No Curve
path
only
member 63
path
only
member 64
path
only
member 65
geometr
y member 66 0.0000 108.000
0
-
157.125
0
End -Y3 Local
Edge
Reference
Line No Curve
TENDON S6-T12L
Point
Type
Reference
Object Type
Referenc
e Object
or Range
Offset X
(ft)
Offset Y
(in)
Offset Z
(in)
X Reference Y Reference Z Reference Curvature
Type Width
geometr
y
member 55 0.0000 21.0000 -98.5000 Start -Y3 Local
Edge
Reference
Line
No Curve
geometr
y
member 56 2.0000 11.0000 -98.5000 Start -Y3 Local
Edge
Reference
Line
No Curve
path
only
member 57
geometr
y
member 58 5.0000 11.0000 -98.5000 Start -Y3 Local
Edge
Reference
Line
No Curve
geometr
y
member 59 5.0000 11.0000 -98.0000 Start -Y3 Local
Edge
Reference
Line
No Curve
geometr
y
member 59 15.0000 11.0000 -90.5000 Start -Y3 Local
Edge
Reference
Line
No Curve
geometr
y
member 60 5.0000 11.0000 -82.5000 Start -Y3 Local
Edge
Reference
Line
No Curve
geometr
y
member 60 15.0000 11.0000 -74.5000 Start -Y3 Local
Edge
Reference
Line
No Curve
geometr
y
member 61 5.0000 11.0000 -74.5000 Start -Y3 Local
Edge
Reference
Line
No Curve
geometr
y
member 62 15.0000 11.0000 -74.5000 Start -Y3 Local
Edge
Reference
Line
No Curve
geometr
y
member 63 5.0000 11.0000 -74.5000 Start -Y3 Local
Edge
Reference
Line
No Curve
geometr
y
member 63 15.0000 11.0000 -82.5000 Start -Y3 Local
Edge
Reference
Line
No Curve

83
geometr
y
member 64 5.0000 11.0000 -90.5000 Start -Y3 Local
Edge
Reference
Line
No Curve
geometr
y
member 64 15.0000 11.0000 -98.5000 Start -Y3 Local
Edge
Reference
Line
No Curve
path
only
member 65
geometr
y member 66 0.0000 24.0000 -
107.375
0
End -Y3 Local
Edge
Reference
Line No Curve
TENDON S6-T9R
Point
Type
Reference
Object Type
Referenc
e Object
or Range
Offset X
(ft)
Offset Y
(in)
Offset Z
(in)
X Reference Y Reference Z Reference Curvature
Type
Widt
h
geometr
y
member 55 0.0000 123.000
0
161.000
0
Start -Y3 Local
Edge
Reference
Line
No Curve
path
only
member 56
path
only
member 57
path
only
member 58
path
only
member 59
geometr
y
member 60 5.0000 11.0000 98.5000 Start -Y3 Local
Edge
Reference
Line
No Curve
geometr
y
member 60 15.0000 11.0000 90.5000 Start -Y3 Local
Edge
Reference
Line
No Curve
geometr
y
member 61 5.0000 11.0000 82.5000 Start -Y3 Local
Edge
Reference
Line
No Curve
geometr
y
member 62 15.0000 11.0000 82.5000 Start -Y3 Local
Edge
Reference
Line
No Curve
geometr
y
member 63 5.0000 11.0000 90.5000 Start -Y3 Local
Edge
Reference
Line
No Curve
geometr
y
member 63 15.0000 11.0000 98.5000 Start -Y3 Local
Edge
Reference
Line
No Curve
path
only
member 64
path
only
member 65
geometr
y
member 66 0.0000 60.0000 128.690
0
End -Y3 Local
Edge
Reference
Line
No Curve
TENDON S6-T10R
Point
Type
Reference
Object Type
Referenc
e Object
or Range
Offset X
(ft)
Offset Y
(in)
Offset Z
(in)
X Reference Y Reference Z Reference Curvature
Type Width
geometr
y
member 55 0.0000 123.000
0
143.000
0
Start -Y3 Local
Edge
Reference
Line
No Curve
path
only
member 56
path
only
member 57
path
only
member 58
path
only
member 59
geometr
y
member 60 15.0000 11.0000 98.5000 Start -Y3 Local
Edge
Reference
Line
No Curve
geometr
y
member 61 5.0000 11.0000 90.5000 Start -Y3 Local
Edge
Reference
Line
No Curve
geometr
y
member 62 15.0000 11.0000 90.5000 Start -Y3 Local
Edge
Reference
Line
No Curve
geometr
y
member 63 5.0000 11.0000 98.5000 Start -Y3 Local
Edge
Reference
Line
No Curve
path
only
member 64
path
only
member 65
geometr
y
member 66 0.0000 84.0000 142.940
0
End -Y3 Local
Edge
Reference
Line
No Curve
TENDON S6-T11R
Point
Type
Reference
Object Type
Referenc
e Object
or Range
Offset X
(ft)
Offset Y
(in)
Offset Z
(in)
X Reference Y Reference Z Reference Curvature
Type Width
geometr
y
member 55 0.0000 123.000
0
125.000
0
Start -Y3 Local
Edge
Reference
Line
No Curve
path
only
member 56
path
only
member 57
path
only
member 58
path
only
member 59
path
only
member 60
geometr
y
member 61 5.0000 11.0000 98.5000 Start -Y3 Local
Edge
Reference
Line
No Curve
geometr
y
member 62 15.0000 11.0000 98.5000 Start -Y3 Local
Edge
Reference
Line
No Curve
path
only
member 63
path
only
member 64
path
only
member 65
geometr
y
member 66 0.0000 108.000
0
157.125
0
End -Y3 Local
Edge
Reference
Line
No Curve
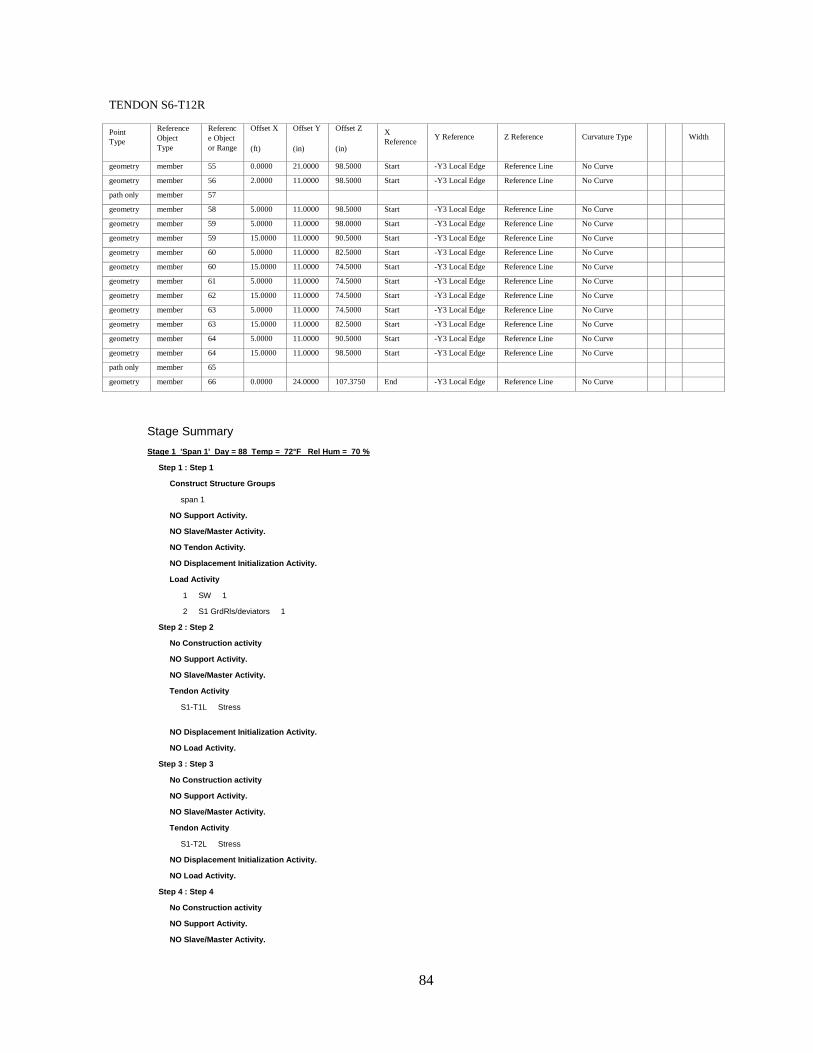
84
TENDON S6-T12R
Point
Type
Reference
Object
Type
Referenc
e Object
or Range
Offset X
(ft)
Offset Y
(in)
Offset Z
(in)
X
Reference Y Reference Z Reference Curvature Type Width
geometry member 55 0.0000 21.0000 98.5000 Start -Y3 Local Edge Reference Line No Curve
geometry member 56 2.0000 11.0000 98.5000 Start -Y3 Local Edge Reference Line No Curve
path only member 57
geometry member 58 5.0000 11.0000 98.5000 Start -Y3 Local Edge Reference Line No Curve
geometry member 59 5.0000 11.0000 98.0000 Start -Y3 Local Edge Reference Line No Curve
geometry member 59 15.0000 11.0000 90.5000 Start -Y3 Local Edge Reference Line No Curve
geometry member 60 5.0000 11.0000 82.5000 Start -Y3 Local Edge Reference Line No Curve
geometry member 60 15.0000 11.0000 74.5000 Start -Y3 Local Edge Reference Line No Curve
geometry member 61 5.0000 11.0000 74.5000 Start -Y3 Local Edge Reference Line No Curve
geometry member 62 15.0000 11.0000 74.5000 Start -Y3 Local Edge Reference Line No Curve
geometry member 63 5.0000 11.0000 74.5000 Start -Y3 Local Edge Reference Line No Curve
geometry member 63 15.0000 11.0000 82.5000 Start -Y3 Local Edge Reference Line No Curve
geometry member 64 5.0000 11.0000 90.5000 Start -Y3 Local Edge Reference Line No Curve
geometry member 64 15.0000 11.0000 98.5000 Start -Y3 Local Edge Reference Line No Curve
path only member 65
geometry member 66 0.0000 24.0000 107.3750 End -Y3 Local Edge Reference Line No Curve
Stage Summary
Stage 1 'Span 1' Day = 88 Temp = 72°F Rel Hum = 70 %
Step 1 : Step 1
Construct Structure Groups
span 1
NO Support Activity.
NO Slave/Master Activity.
NO Tendon Activity.
NO Displacement Initialization Activity.
Load Activity
1 SW 1
2 S1 GrdRls/deviators 1
Step 2 : Step 2
No Construction activity
NO Support Activity.
NO Slave/Master Activity.
Tendon Activity
S1-T1L Stress
NO Displacement Initialization Activity.
NO Load Activity.
Step 3 : Step 3
No Construction activity
NO Support Activity.
NO Slave/Master Activity.
Tendon Activity
S1-T2L Stress
NO Displacement Initialization Activity.
NO Load Activity.
Step 4 : Step 4
No Construction activity
NO Support Activity.
NO Slave/Master Activity.

85
Tendon Activity
S1-T3L Stress
NO Displacement Initialization Activity.
NO Load Activity.
Step 5 : Step 5
No Construction activity
NO Support Activity.
NO Slave/Master Activity.
Tendon Activity
S1-T4L Stress
NO Displacement Initialization Activity.
NO Load Activity.
Step 6 : Step 6
No Construction activity
NO Support Activity.
NO Slave/Master Activity.
Tendon Activity
S1-T1R Stress
NO Displacement Initialization Activity.
NO Load Activity.
Step 7 : Step 7
No Construction activity
NO Support Activity.
NO Slave/Master Activity.
Tendon Activity
S1-T2R Stress
NO Displacement Initialization Activity.
NO Load Activity.
Step 8 : Step 8
No Construction activity
NO Support Activity.
NO Slave/Master Activity.
Tendon Activity
S1-T3R Stress
NO Displacement Initialization Activity.
NO Load Activity.
Step 9 : Step 9
No Construction activity
NO Support Activity.
NO Slave/Master Activity.
Tendon Activity
S1-T4R Stress
NO Displacement Initialization Activity.
NO Load Activity.
Stage 2 'Span 2' Day = 121 Temp = 72°F Rel Hum = 70 %
Step 1 : Step 1
Construct Structure Groups
span 2
NO Support Activity.
NO Slave/Master Activity.
NO Tendon Activity.

86
NO Displacement Initialization Activity.
Load Activity
1 SW 1
7 S2 GrdRls/deviators 1
Step 2 : Step 2
No Construction activity
NO Support Activity.
NO Slave/Master Activity.
Tendon Activity
S2-T5L Stress
NO Displacement Initialization Activity.
NO Load Activity.
Step 3 : Step 3
No Construction activity
NO Support Activity.
NO Slave/Master Activity.
Tendon Activity
S2-T6L Stress
NO Displacement Initialization Activity.
NO Load Activity.
Step 4 : Step 4
No Construction activity
NO Support Activity.
NO Slave/Master Activity.
Tendon Activity
S2-T7L Stress
NO Displacement Initialization Activity.
NO Load Activity.
Step 5 : Step 5
No Construction activity
NO Support Activity.
NO Slave/Master Activity.
Tendon Activity
S2-T8L Stress
NO Displacement Initialization Activity.
NO Load Activity.
Step 6 : Step 6
No Construction activity
NO Support Activity.
NO Slave/Master Activity.
Tendon Activity
S2-T5R Stress
NO Displacement Initialization Activity.
NO Load Activity.
Step 7 : Step 7
No Construction activity
NO Support Activity.
NO Slave/Master Activity.
Tendon Activity
S2-T6R Stress
NO Displacement Initialization Activity.
NO Load Activity.
Step 8 : Step 8
No Construction activity

87
NO Support Activity.
NO Slave/Master Activity.
Tendon Activity
S2-T7R Stress
NO Displacement Initialization Activity.
NO Load Activity.
Step 9 : Step 9
No Construction activity
NO Support Activity.
NO Slave/Master Activity.
Tendon Activity
S2-T8R Stress
NO Displacement Initialization Activity.
NO Load Activity.
Stage 3 'Span 3' Day = 130 Temp = 72°F Rel Hum = 70 %
Step 1 : Step 1
Construct Structure Groups
span 3
NO Support Activity.
NO Slave/Master Activity.
NO Tendon Activity.
NO Displacement Initialization Activity.
Load Activity
1 SW 1
3 S3 GrdRls/deviators 1
Step 2 : Step 2
No Construction activity
NO Support Activity.
NO Slave/Master Activity.
Tendon Activity
S3-T5L Stress
NO Displacement Initialization Activity.
NO Load Activity.
Step 3 : Step 3
No Construction activity
NO Support Activity.
NO Slave/Master Activity.
Tendon Activity
S3-T6L Stress
NO Displacement Initialization Activity.
NO Load Activity.
Step 4 : Step 4
No Construction activity
NO Support Activity.
NO Slave/Master Activity.
Tendon Activity
S3-T7L Stress
NO Displacement Initialization Activity.
NO Load Activity.
Step 5 : Step 5
No Construction activity

88
NO Support Activity.
NO Slave/Master Activity.
Tendon Activity
S3-T8L Stress
NO Displacement Initialization Activity.
NO Load Activity.
Step 6 : Step 6
No Construction activity
NO Support Activity.
NO Slave/Master Activity.
Tendon Activity
S3-T5R Stress
NO Displacement Initialization Activity.
NO Load Activity.
Step 7 : Step 7
No Construction activity
NO Support Activity.
NO Slave/Master Activity.
Tendon Activity
S3-T6R Stress
NO Displacement Initialization Activity.
NO Load Activity.
Step 8 : Step 8
No Construction activity
NO Support Activity.
NO Slave/Master Activity.
Tendon Activity
S3-T7R Stress
NO Displacement Initialization Activity.
NO Load Activity.
Step 9 : Step 9
No Construction activity
NO Support Activity.
NO Slave/Master Activity.
Tendon Activity
S3-T8R Stress
NO Displacement Initialization Activity.
NO Load Activity.
Stage 4 'Span 4' Day = 142 Temp = 72°F Rel Hum = 70 %
Step 1 : Step 1
Construct Structure Groups
span 4
NO Support Activity.
NO Slave/Master Activity.
NO Tendon Activity.
NO Displacement Initialization Activity.
Load Activity
1 SW 1
9 S4 GrdRls/deviators 1
Step 2 : Step 2
No Construction activity
NO Support Activity.
NO Slave/Master Activity.

89
Tendon Activity
S4-T5L Stress
NO Displacement Initialization Activity.
NO Load Activity.
Step 3 : Step 3
No Construction activity
NO Support Activity.
NO Slave/Master Activity.
Tendon Activity
S4-T6L Stress
NO Displacement Initialization Activity.
NO Load Activity.
Step 4 : Step 4
No Construction activity
NO Support Activity.
NO Slave/Master Activity.
Tendon Activity
S4-T7L Stress
NO Displacement Initialization Activity.
NO Load Activity.
Step 5 : Step 5
No Construction activity
NO Support Activity.
NO Slave/Master Activity.
Tendon Activity
S4-T8L Stress
NO Displacement Initialization Activity.
NO Load Activity.
Step 6 : Step 6
No Construction activity
NO Support Activity.
NO Slave/Master Activity.
Tendon Activity
S4-T5R Stress
NO Displacement Initialization Activity.
NO Load Activity.
Step 7 : Step 7
No Construction activity
NO Support Activity.
NO Slave/Master Activity.
Tendon Activity
S4-T6R Stress
NO Displacement Initialization Activity.
NO Load Activity.
Step 8 : Step 8
No Construction activity
NO Support Activity.
NO Slave/Master Activity.
Tendon Activity
S4-T7R Stress
NO Displacement Initialization Activity.
NO Load Activity.
Step 9 : Step 9
No Construction activity

90
NO Support Activity.
NO Slave/Master Activity.
Tendon Activity
S4-T8R Stress
NO Displacement Initialization Activity.
NO Load Activity. Stage 5 'Span 5' Day = 164 Temp = 72°F Rel Hum = 70 %
Step 1 : Step 1
Construct Structure Groups
span 5
NO Support Activity.
NO Slave/Master Activity.
NO Tendon Activity.
NO Displacement Initialization Activity.
Load Activity
1 SW 1
10 S5 GrdRls/deviators 1
Step 2 : Step 2
No Construction activity
NO Support Activity.
NO Slave/Master Activity.
Tendon Activity
S5-T5L Stress
NO Displacement Initialization Activity.
NO Load Activity.
Step 3 : Step 3
No Construction activity
NO Support Activity.
NO Slave/Master Activity.
Tendon Activity
S5-T6L Stress
NO Displacement Initialization Activity.
NO Load Activity.
Step 4 : Step 4
No Construction activity
NO Support Activity.
NO Slave/Master Activity.
Tendon Activity
S5-T7L Stress
NO Displacement Initialization Activity.
NO Load Activity.
Step 5 : Step 5
No Construction activity
NO Support Activity.
NO Slave/Master Activity.
Tendon Activity
S5-T8L Stress
NO Displacement Initialization Activity.
NO Load Activity.
Step 6 : Step 6
No Construction activity
NO Support Activity.
NO Slave/Master Activity.

91
Tendon Activity
S5-T5R Stress
NO Displacement Initialization Activity.
NO Load Activity.
Step 7 : Step 7
No Construction activity
NO Support Activity.
NO Slave/Master Activity.
Tendon Activity
S5-T6R Stress
NO Displacement Initialization Activity.
NO Load Activity.
Step 8 : Step 8
No Construction activity
NO Support Activity.
NO Slave/Master Activity.
Tendon Activity
S5-T7R Stress
NO Displacement Initialization Activity.
NO Load Activity.
Step 9 : Step 9
No Construction activity
NO Support Activity.
NO Slave/Master Activity.
Tendon Activity
S5-T8R Stress
NO Displacement Initialization Activity.
NO Load Activity.
Stage 6 'Span 6' Day = 184 Temp = 72°F Rel Hum = 70 %
Step 1 : Step 1
Construct Structure Groups
span 6
NO Support Activity.
NO Slave/Master Activity.
NO Tendon Activity.
NO Displacement Initialization Activity.
Load Activity
1 SW 1
8 S6 GrdRls/deviators 1
Step 2 : Step 2
No Construction activity
NO Support Activity.
NO Slave/Master Activity.
Tendon Activity
S6-T9L Stress
NO Displacement Initialization Activity.
NO Load Activity.
Step 3 : Step 3
No Construction activity
NO Support Activity.
NO Slave/Master Activity.
Tendon Activity
S6-T10L Stress
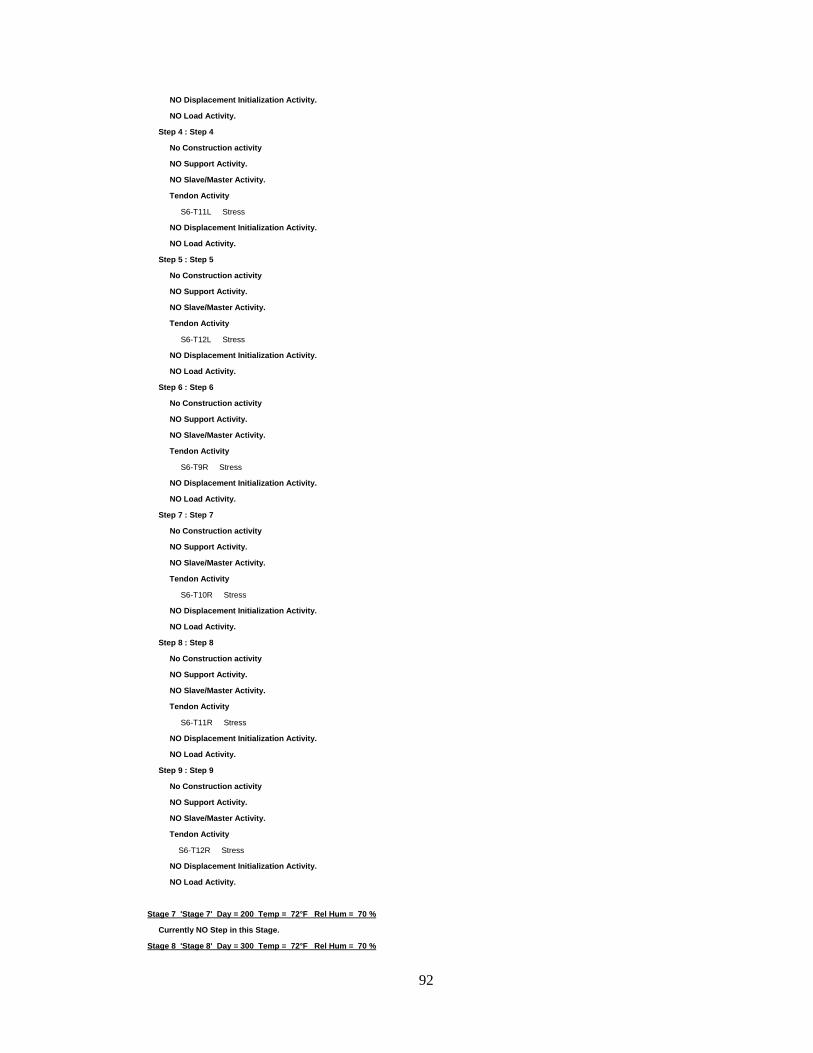
92
NO Displacement Initialization Activity.
NO Load Activity.
Step 4 : Step 4
No Construction activity
NO Support Activity.
NO Slave/Master Activity.
Tendon Activity
S6-T11L Stress
NO Displacement Initialization Activity.
NO Load Activity.
Step 5 : Step 5
No Construction activity
NO Support Activity.
NO Slave/Master Activity.
Tendon Activity
S6-T12L Stress
NO Displacement Initialization Activity.
NO Load Activity.
Step 6 : Step 6
No Construction activity
NO Support Activity.
NO Slave/Master Activity.
Tendon Activity
S6-T9R Stress
NO Displacement Initialization Activity.
NO Load Activity.
Step 7 : Step 7
No Construction activity
NO Support Activity.
NO Slave/Master Activity.
Tendon Activity
S6-T10R Stress
NO Displacement Initialization Activity.
NO Load Activity.
Step 8 : Step 8
No Construction activity
NO Support Activity.
NO Slave/Master Activity.
Tendon Activity
S6-T11R Stress
NO Displacement Initialization Activity.
NO Load Activity.
Step 9 : Step 9
No Construction activity
NO Support Activity.
NO Slave/Master Activity.
Tendon Activity
S6-T12R Stress
NO Displacement Initialization Activity.
NO Load Activity.
Stage 7 'Stage 7' Day = 200 Temp = 72°F Rel Hum = 70 %
Currently NO Step in this Stage.
Stage 8 'Stage 8' Day = 300 Temp = 72°F Rel Hum = 70 %

93
Currently NO Step in this Stage.
Stage 9 'Stage 9' Day = 400 Temp = 72°F Rel Hum = 70 %
Currently NO Step in this Stage.
Stage 10 'Stage 9.5' Day = 500 Temp = 72°F Rel Hum = 70 %
Currently NO Step in this Stage.
Stage 11 'Stage 10' Day = 1000 Temp = 72°F Rel Hum = 70 %
Currently NO Step in this Stage.
Stage 12 'Stage 11' Day = 2000 Temp = 72°F Rel Hum = 70 %
Currently NO Step in this Stage.
Stage 13 'Stage 12' Day = 3000 Temp = 72°F Rel Hum = 70 %
Currently NO Step in this Stage.
Stage 14 'Stage 13' Day = 4000 Temp = 72°F Rel Hum = 70 %
Currently NO Step in this Stage.
Stage 15 'Stage 14' Day = 5000 Temp = 72°F Rel Hum = 70 %
Currently NO Step in this Stage.
Stage 16 'Stage 15 (2013)' Day = 9500 Temp = 72°F Rel Hum = 70 %
Step 1 : Step 1
No Construction activity
NO Support Activity.
NO Slave/Master Activity.
NO Tendon Activity.
NO Displacement Initialization Activity.
Load Activity
23 Unit Load (Section F) 1
Step 2 : Step 2
No Construction activity
NO Support Activity.
NO Slave/Master Activity.
NO Tendon Activity.
NO Displacement Initialization Activity.
Load Activity
24 Unit Load (Section E) 1

94
Appendix C. Original Drawings of Sections and Tendon Profiles

95

96

97

98

99

100
Appendix D. Sample Calculation of Effective Prestress

101

102

103

104
Appendix E. Sample Calculation of Flexural Capacity

105

106
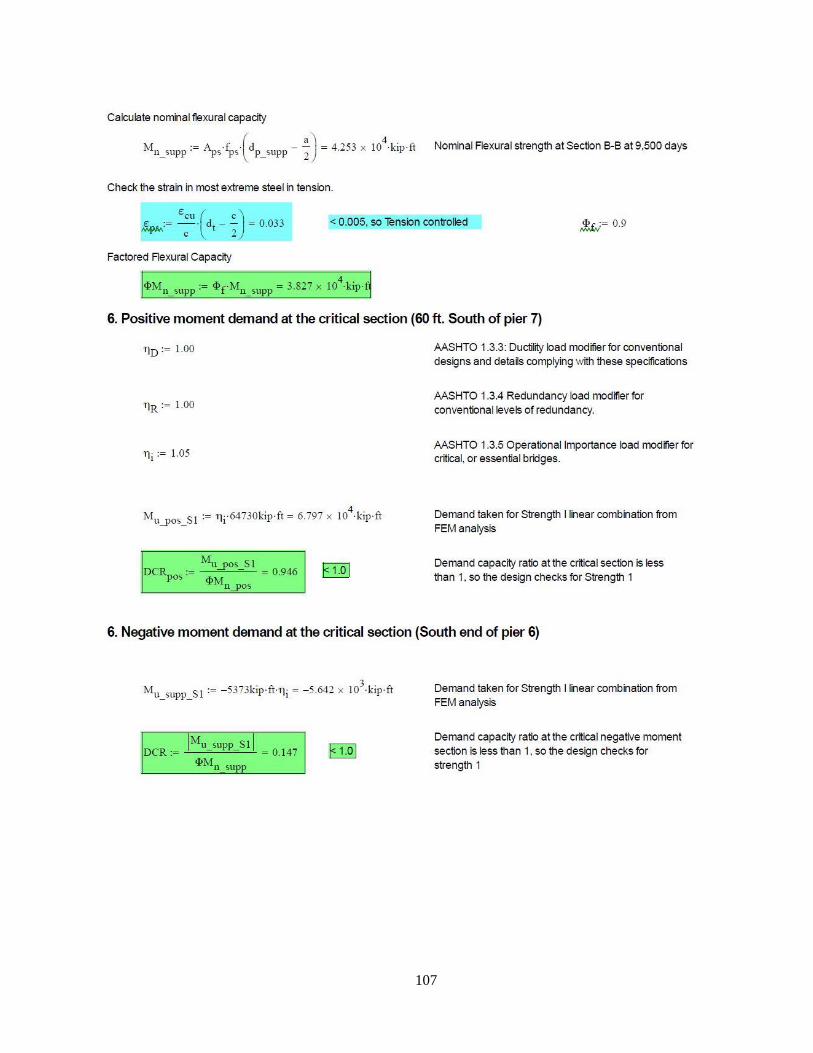
107