investigation on improving efficiency of pre-precipitation ... · investigation on improving...
TRANSCRIPT
Water and Environmental Engineering Department of Chemical Engineering
Investigation on improving efficiency of pre-precipitation process at
Sjölunda wastewater treatment plant
Master’s Thesis by
Qianqian Zhou
February 2009

Vattenförsörjnings- och Avloppsteknik Institutionen för Kemiteknik Lunds Universitet
Water and Environmental Engineering Department of Chemical Engineering Lund University, Sweden
Investigation on improving efficiency of
pre-precipitation process at Sjölunda wastewater treatment plant
Master Thesis number: 2009-02 by
Qianqian Zhou Water and Environmental Engineering Department of Chemical Engineering
February 2009
Supervisor: Professor Jes la Cour Jansen
Examiner: Associate professor Karin Jönsson
Picture on front page:
1. Performed pre-aeration test and flocculation test during the thesis work study (Pictured by: Qianqian Zhou)
Postal address: Visiting address: Telephone:
P.O Box 124 Getingevägen 60 +46 46-222 82 85
SE-221 00 Lund. +46 46-222 00 00
Sweden, Telefax:
+46 46-222 45 26
Web address:
www.vateknik.lth.se
1

iv
v
Summary
The presence of phosphorus may lead to many water quality problems in aquatic systems.
It could provide fertilizing nutrients that encourage the growth of organic matter and
lead to a high oxygen consumption in recipient water. Thus, control of phosphorous
discharge from municipal wastewater treatment plants is a key factor in preventing
eutrophication of natural waters.
Phosphorus removal is achieved by chemical treatment in the pre-precipitation process at
Sjölunda WWTP; ferrous sulfate was utilized as present dosing chemical to precipitate
phosphorus in the pre-precipitation treatment process at Sjölunda. Poor Fe-II oxidation
performance was observed in the pre-aeration process in the summer, 2008. The
expected oxidation didn’t occur in the pre-aeration tank but in the activated sludge tank
instead, which leads to reduced phosphorus and COD removals in the pre-precipitation
stage. Thus, investigation of improving oxidation efficiency in the pre-aeration process
was quite significant for achieving better performance in pre-precipitation.
Comprehension of the backgrounds of iron oxidation principles and coagulation &
flocculation processes in the chemical treatment were achieved by relevant literature
studies. Two main laboratory tests have been performed in the laboratory to simulate the
pre-precipitation process, which were (pre)-aeration test and flocculation test respectively.
The pre-aeration test was aimed to aid the investigation of Fe-II oxidation rate achieved
in wastewater and the effect of aerated time, dosed chemical quality and operational
parameter (pH, DO) on Fe-II oxidation. At the same time, operational limitations of
oxidation need to be examined during the test as well. Flocculation test was mainly
performed to analyze the iron oxidation and precipitation during the flocculation process.
Moreover, further lab tests and operational recommendations on investigation of
pre-precipitation were proceeded to achieve better performance of pre-precipitation
treatment.
The results from performed laboratory works showed that the operational conditions are
essential for the Fe-II oxidation. However, the pH level, temperature and generated
turbulence in the pre-aeration process at Sjölunda WWTP are acceptable. The delayed
low oxidation was mainly caused by the insufficient oxygen level and bad chemical quality
in the pre-aeration tank. It has been found out that achieved oxidation performance
didn’t have significant influence on the subsequent flocculation process. Fe-II oxidation
could occur during flocculation as well. The activated sludge could promote the

vi
oxidation and flocculation performances in the pre-precipitation process. Furthermore,
the investigation of new chemical strategy FeCl3 has demonstrated that ferric chloride
achieved better phosphorus removal compared with ferrous sulfate. However, ferric
chloride is much more expensive. The case study at Sjölunda indicated pre-aeration tank
functions well in the winter but poor oxidation performance has been observed in the
summer. Thus, suggestions were proposed to improve the utilized efficiencies of aerators
and chemical in the pre-aeration process during summer.
vii
Acknowledgements
I want to express my sincere gratitude and appreciation to my dear supervisor, Professor
Jes la Cour Jansen, for his professional instruction, patient guidance and support on my
thesis work. His expert suggestions always broad my horizons and motivate my thesis
work. His useful and professional guidance helped me to overcome this task. Secondly, I
want to show my respect and thanks to Associate Professor, Karin Jönsson, my examiner
for her willing to be my examiner. I am really appreciated for the expert lab guidance and
priceless support and assistances from Laboratory assistants, Ylva Persson and Gertrud
Persson.
My special thanks go to Project Engineer (VA SYD), Tobias Hey, for helping me
involving in such an exciting project and introducing me to Jes and numerous supports at
Sjölunda. I also want to express my appreciation to Max Granqvist and David
Gustavsson for helping me arrange the material for my laboratory test. At the same time,
I want to show my gratitude to the managers and staff of VA SYD for their priceless
assistance and kind cooperation on my thesis project.
I also would like to thank Associate Professor, Gerhard Barmen for his nice advice and
support during my hard times.
I give my best regards and wishes to all who gave me desired assistances and
encouragements during my thesis work period.
Finally, I would like to thank my beloved family for their unconditional love even though
there is far distance between us now.
Qianqian Zhou
周倩倩
February 2009, Lund

viii
ix
List of Abbreviations
ADP Adenosine diphosphates
AMP Adenosine monophosphates
AS Activated Sludge
AST Activated Sludge Tank
ATP Adenosine triphosphates
BOD Biochemical Oxygen Demand
COD Chemical Oxygen Demand
DO Oxygen level/concentration
DN Denitrification
DW Deionized water
HRT Hydraulic Retention Time
MBBR Moving Bed Biofilm Reactor
Orthophosphate Ortho P
Polyphosphate Poly P
SBR Sequencing Batch Reactor
SS Suspended Solids
TW Tap water
WW Wastewater
WWTP Waste Water Treatment Plant

x

xi
Contents 1. Background ..............................................................................................................................1
1.1. Introduction...................................................................................................................1
1.2. Aims ................................................................................................................................2
1.3. Methodologies ...............................................................................................................2
1.4. Overview of the thesis paper......................................................................................3
2. Overview of Sjölunda treatment plant ................................................................................5
3. Literature study..................................................................................................................... 11
3.1. Chemical treatment strategy for phosphorous removal ....................................... 11
3.2. Pre-precipitation treatment process at Sjölunda WWTP ..................................... 11
3.3. Coagulation and Flocculation................................................................................... 12
3.3.1. Coagulation.................................................................................................... 12
3.3.2. Flocculation................................................................................................... 13
3.4. Iron activation process studies ................................................................................. 16
3.5. Comparison among different chemical coagulants utilized in the
pre-precipitation treatment process......................................................................... 19
4. Lab-work strategies and preparations................................................................................ 21
4.1. Experimental Strategies............................................................................................. 21
4.2. Overview of performed laboratory tests ............................................................... 21
4.3. Laboratory test methodologies ................................................................................ 23
4.3.1. (Pre-)Aeration analysis ................................................................................. 23
4.3.2. Flocculation simulation................................................................................ 24
4.4. Material and equipment............................................................................................. 25
4.4.1. Material .......................................................................................................... 25
4.4.2. Equipment..................................................................................................... 26
5. Lab works .............................................................................................................................. 27
5.1. Investigations of required oxidation time for Fe-II in pre-aeration process .... 27
5.1.1. Investigation of Fe-II oxidation in wastewater........................................ 27
5.1.2. Investigation of Fe-II oxidation in deionized water ............................... 27
5.1.3. Investigation of Fe-II oxidation in tap water........................................... 29
5.1.4. Recheck Fe-II oxidation in wastewater with filtrated sample ................ 29
5.1.5. Summary on performed aeration tests ...................................................... 30
5.2. Study of effects of the influencing factors on Fe-II oxidation........................... 32
5.2.1. Analysis of pH effect on Fe-II oxidation in wastewater ........................ 32
5.2.2. The investigation of the effect of DO on Fe-II oxidation.................... 33
5.2.3. The analysis of turbulence effect on Fe-II oxidation ............................. 34
xii
5.2.4. The investigation on the quality of dosed Fe-II solution during Fe-II
oxidation test ................................................................................................. 35
5.2.5. The study of existing forms of iron in the wastewater .......................... 37
5.2.6. Sum-up of performed tests ........................................................................ 37
5.3. Investigating of the effect of achieved oxidation on the subsequent
flocculation performance.......................................................................................... 39
5.3.1. DO variation in the wastewater during flocculation ............................... 39
5.3.2. The effect of different aerated period on Fe-II oxidation process during
the flocculation ............................................................................................. 40
5.3.3. Investigation of Fe-II oxidation during the flocculation test ................ 42
5.3.4. The investigation of the effect of activated sludge on Fe-II oxidation
during flocculation ....................................................................................... 43
5.3.5. Sum-up on flocculation test........................................................................ 46
6. Case study at Sjölunda WWTP........................................................................................... 49
6.1. The analysis of DO level and chemical quality in the pre-aeration tank at
Sjölunda ....................................................................................................................... 49
6.2. Recheck oxidation efficiency of pre-aeration in D2 line...................................... 51
6.3. Suggested solutions for improving pre-aeration efficiency at Sjölunda............. 52
6.3.1. Solution based on the existing facilities at the plant ............................... 52
6.3.2. Solution based on the further plan at Sjölunda........................................ 52
7. New chemical dosing strategy: FeCl3................................................................................. 55
8. Discussion ............................................................................................................................. 59
9. Conclusion............................................................................................................................. 63
10. Suggestions for further thesis work................................................................................... 65
11. Reference ............................................................................................................................... 67
1
1. Background
Phosphorus in wastewater partly occurs as organically bonded phosphorus and partly exists as inorganic phosphorous. The presence of phosphorus may lead to many water quality problems, thus control of phosphorous discharge from municipal and industrial wastewater treatment plants is a key strategy in preventing eutrophication in aquatic systems. Based on the standards of phosphorous removal expressed on the new Swedish Environmental Code (Ministry of the Environment, 2000), pre-precipitation treatment process has been applied for chemical precipitations of phosphorous at Sjölunda wastewater treatment plant (WWTP). Ferrous sulfate has been utilized as present chemical coagulant and oxidized into ferric as a result of pre-aeration process. Most of phosphorus is expected to be precipitated with ferric into a low solubility metal phosphate. The precipitated phosphorous are removed by coagulation and flocculation process in primary sedimentation tank.
1.1. Introduction
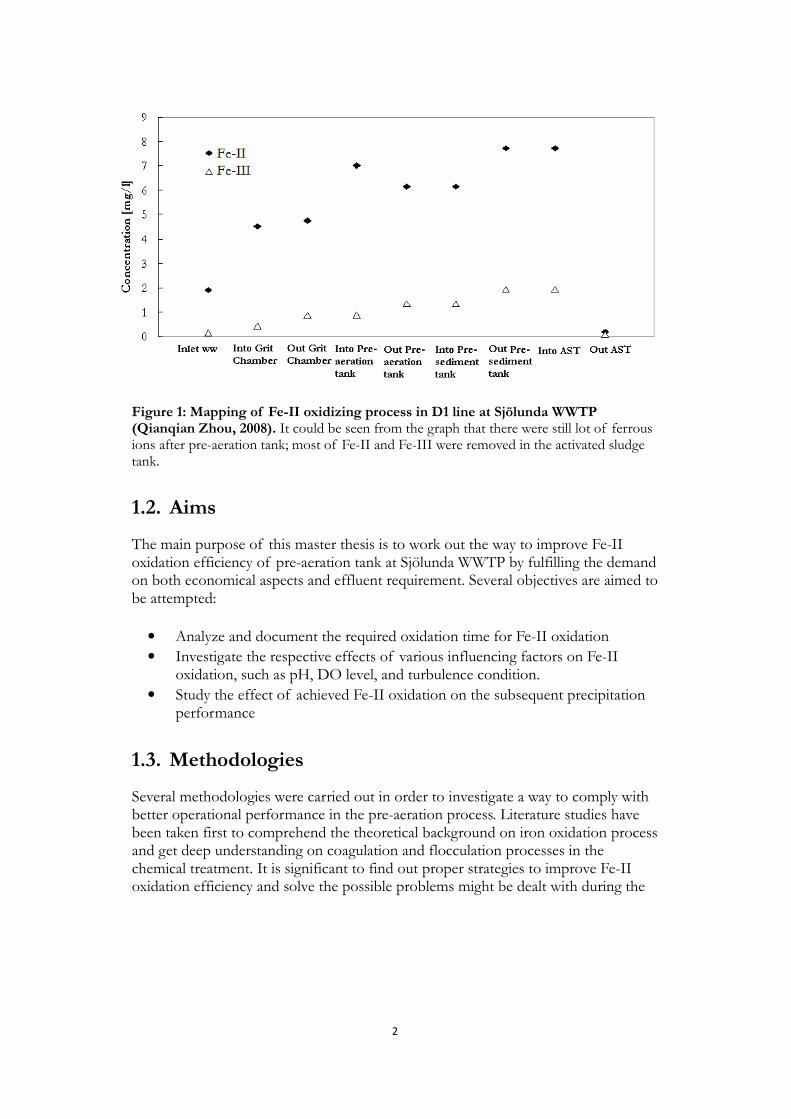
It has been documented that Fe-II oxidation performance of pre-aeration tank is an issue of the utmost importance in pre-precipitation treatment process according to the previous process investigations on iron activation in the pre-precipitation treatment at Sjölunda WWTP (Qianqian Zhou, 2008). The low oxidation efficiency of pre-aeration tank is a key problem in the primary treatment process at Sjölunda in the summer time. The expected Fe-II oxidation has not been achieved in the pre-aeration process but in the activated sludge tank. The activated sludge tank has performed as an aerobic sludge tank, where most of ferrous ions were oxidized and precipitated. Meanwhile, it has been found out that due to the variable oxidation performance of pre-aeration tank, fluctuated activation process occurs between Fe-II and Fe-III. This not only leads to a large reduction of P, COD removal in pre-precipitation process but also needs additional process and economical cost invested in the activated sludge tank (Qianqian Zhou, 2008). The mapping of iron activations in the pre-precipitation treatment process at Sjölunda WWTP is shown in Figure 1. It could be seen from Figure 1 that low Fe-II oxidation efficiency achieved in the pre-aeration process in the analyzed time frame (July, 2008), most of ferrous ions were oxidized and precipitated in the activated sludge tank.
2
Figure 1: Mapping of Fe-II oxidizing process in D1 line at Sjölunda WWTP (Qianqian Zhou, 2008). It could be seen from the graph that there were still lot of ferrous ions after pre-aeration tank; most of Fe-II and Fe-III were removed in the activated sludge tank.
1.2. Aims
The main purpose of this master thesis is to work out the way to improve Fe-II oxidation efficiency of pre-aeration tank at Sjölunda WWTP by fulfilling the demand on both economical aspects and effluent requirement. Several objectives are aimed to be attempted:
• Analyze and document the required oxidation time for Fe-II oxidation
• Investigate the respective effects of various influencing factors on Fe-II oxidation, such as pH, DO level, and turbulence condition.
• Study the effect of achieved Fe-II oxidation on the subsequent precipitation performance
1.3. Methodologies
Several methodologies were carried out in order to investigate a way to comply with better operational performance in the pre-aeration process. Literature studies have been taken first to comprehend the theoretical background on iron oxidation process and get deep understanding on coagulation and flocculation processes in the chemical treatment. It is significant to find out proper strategies to improve Fe-II oxidation efficiency and solve the possible problems might be dealt with during the
3
analysis of pre-aeration in the pre-precipitation treatment process. Investigation of influencing factors of Fe-II oxidation process and collation of effective operational strategies for pre-precipitation process were aided with laboratory works and sample tests relevant to the various aspects of iron activation process. Also a case study at Sjölunda wastewater treatment plant has been made to examine the applicable feasibility of strategies analyzed and summed up from the laboratory works. The outcomes of the case study were expected to give suggestions on the further laboratory experiments and full scale operation strategy.
1.4. Overview of the thesis paper
Brief structures of this thesis paper are present as following: Chapter 2 is an overview of Sjölunda wastewater treatment plant; Chapter 3 shows the literature study on the thesis works; the strategies and preparations of the lab works are present in Chapter 4; Chapter 5 shows the procedure information and achieved results of performed laboratory tests; the outcomes from the case study at Sjölunda are given in Chapter 6; investigation of the new chemical dosing strategy (ferric chloride) is shown in Chapter 7; Chapter 8 is a discussion based on the achieved laboratory results during the thesis study ; Chapter 9 is the conclusion of the thesis paper; Chapter 10 shows the suggested directions and topics of further thesis work.

4
5
2. Overview of Sjölunda treatment plant
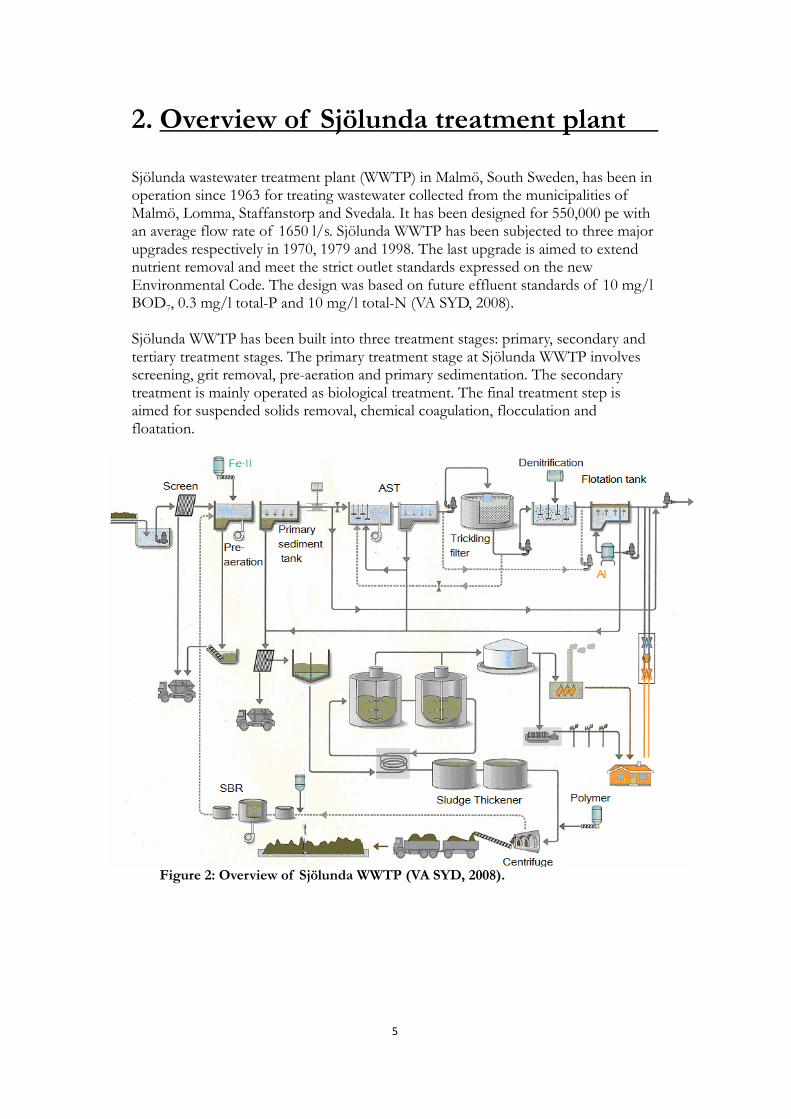
Sjölunda wastewater treatment plant (WWTP) in Malmö, South Sweden, has been in operation since 1963 for treating wastewater collected from the municipalities of Malmö, Lomma, Staffanstorp and Svedala. It has been designed for 550,000 pe with an average flow rate of 1650 l/s. Sjölunda WWTP has been subjected to three major upgrades respectively in 1970, 1979 and 1998. The last upgrade is aimed to extend nutrient removal and meet the strict outlet standards expressed on the new Environmental Code. The design was based on future effluent standards of 10 mg/l BOD7, 0.3 mg/l total-P and 10 mg/l total-N (VA SYD, 2008). Sjölunda WWTP has been built into three treatment stages: primary, secondary and tertiary treatment stages. The primary treatment stage at Sjölunda WWTP involves screening, grit removal, pre-aeration and primary sedimentation. The secondary treatment is mainly operated as biological treatment. The final treatment step is aimed for suspended solids removal, chemical coagulation, flocculation and floatation.
Figure 2: Overview of Sjölunda WWTP (VA SYD, 2008).

6
As shown in Figure 2, the screen and grit chamber are mainly aimed for removal of the coarse contaminants and suspended solids during the preliminary treatment. Pre-aeration tanks provide an aerobic condition to oxidize the dosed chemical coagulant (Fe-II). The primary sedimentation tanks are utilized for settling the sludge generated in the primary treatment stage. The subsequent biological treatment steps have been designed as the combination of activated sludge process (AST), trickling filter and a moving bed biofilm reactor (MBBR). The activated sludge tanks are mainly operated for BOD removal while the nitrification takes place in the trickling filter. Denitrification (DN) is accomplished by utilizing with MBBR with addition of external carbon source. Post-precipitation is performed by adding aluminum salts coagulant in flotation tank (shown in Figure 2). Excess sludges produced in primary sedimentation process and activated sludge process are collected and concentrated in sludge thickener. Sludge treatment is performed by mesophilic sludge digestion. A sequencing batch reactor (SBR) for the nitrification of digester supernatant is necessary to control the ammonia load to the main process. Part of organic material is decomposed under anaerobic conditions, where biogas is generated. Part of electricity consumed at Sjölunda WWTP is derived from biogas and digestion process as well. As shown in Figure 2, the digested sludge is transported to centrifuges for dewatering subsequently. Polymer is added to achieve an efficient dewatering conditioning for digested sludge. The frame of field work area of this thesis project is from the inlet of Sjölunda WWTP to the outlet of activated sludge tank. The detail process scheme of Sjölunda WWTP is shown in Figure 3.
Figure 3: Process scheme of Sjölunda treatment plant (modified from David Gustavsson, 2008).
7
It could be seen from Figure 3, there are two main lines D1 & D2 at Sjölunda WWTP. The collected wastewater is distributed into these two lines after passing through screen. Chemical coagulant (ferrous sulfate) is added into wastewater at the dosing point in pre-aeration tank of both lines, where Fe-II oxidation takes place as a result of pre-aeration. There are two parallel pre-aeration tanks (A, B lines) in each main line (D1 & D2) with total volume of 740 m3 and normal hydraulic retention time 20 minutes. Phosphorus is precipitated with the oxidized iron ions (Fe-III), the produced precipitation settles in primary sedimentation tank. There are totally four sedimentation tanks in each main line. The wastewater goes to the activated sludge tank subsequently, G1-G3 treat the wastewater from D1 line while G4 and Y deal with the wastewater from D2 line. The flows join again in the trickling filter. Meanwhile, the difference between the two main lines (D1 & D2) could be seen from Figure 3. D1 line is operated to cope with the outlet flow from the Sequencing Batch Reactor RN and treat the reject water from the sludge thickener (H and Sig), whereas D2 line only deals with the inlet wastewater. It has been documented previously that D1 line has relatively higher iron content and worse water quality in the field areas compared with D2 line in the summer (Qianqian Zhou, 2008). The excess sludges from primary sediment processes and activated sludge tanks were supposed to be thickened in H and Sig; however, a lot of undesirable bubbles were generated in the sludge thickener due to the high temperature in the summer. These bubbles diminished the settleable capability of the sludge thickener, which leads to a high load of suspended solids and concentrated contaminants returning to D1 line accompanied with the reject water. The work performance of the sludge thickener is much better in the winter since there is less digestion inside the treatment tank. Furthermore, the outlet flow from RN is much diluted and clearer compared with reject water from H and Sig. As mentioned previously, poor functions of pre-aeration tanks have been documented in a pre-project time frame. The mappings of Fe-II oxidizing along D1 and D2 lines are shown in Figure 4. It illustrates the iron activation of Fe-II into Fe-III along the two main lines. The frame of the field areas is from inlet wastewater (ww), go through grit chamber, pre-aeration tank and primary sedimentation tank to the activated sludge tank (AST).

8
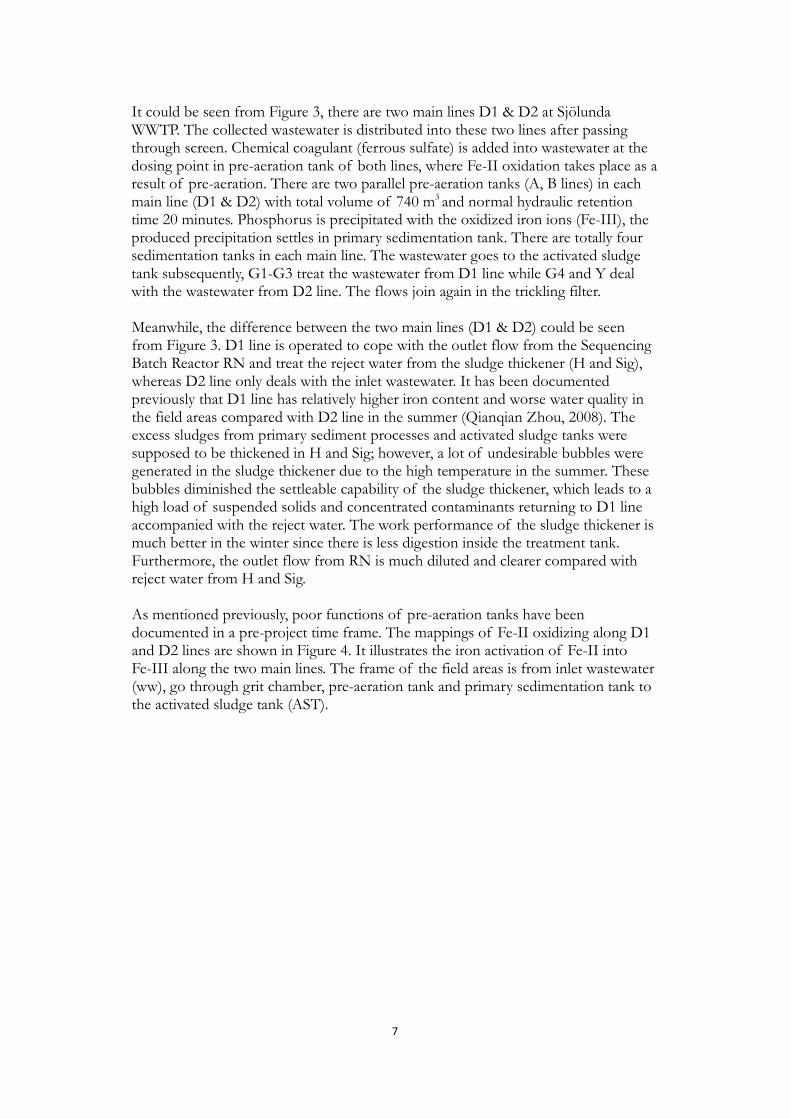
Figure 4: Mapping of Fe-II oxidizing in D1 and D2 lines. It could be seen from the graph that low Fe-II oxidation efficiencies were observed in the pre-aeration process in both lines, the achieved Fe-II oxidation percentage was only 12% in the pre-aeration tank of D1 line and 40% in D2 line (Qianqian Zhou, 2008). Table 1 presents the detail information of operational parameters in pre-aeration tanks of both lines. It is significant to check if the operational conditions in the pre-aeration processes are acceptable, such as oxygen level, pH value, temperature and available oxidation time (hydraulic retention time).
9
Table 1: Results from the previous investigations on operational conditions in the pre-aeration process at Sjölunda WWTP (Qianqian Zhou, 2008).
Pre-aeration tank Operational parameters descriptions
D1 D2
Measured oxygen concentration mg /l 1.7 1.8
Measured pH value Dimensionless 7.00 6.98
Measured Temperature ºC 20.3 20.1
Hydraulic Retention Time min 20 20
Volume of tank m3 1480 1480
Average inlet flow rate m3/s 366 490
Inlet Fe-II mg/l 7.015 5.495
Inlet Fe-III mg/l 0.874 0.275
Outlet Fe-II mg/l 6.151 3.310
Outlet Fe-III mg/l 1.324 3.575
Fe-II oxidization percentage % 12% 40%

10
11
3. Literature study
3.1. Chemical treatment strategy for phosphorous removal
Phosphorus in wastewater partly occurs as organically bonded phosphorus and partly exists as inorganic phosphorous mainly in the form of polyphosphate (polyP) and orthophosphate (orthoP: PO4
3-). Organic phosphorus is mainly bonded to solid particles and inorganic phosphorous exists mainly in dissolved form (Kemira, 2003). There are some amounts of phosphorus existed in the nucleic acids of bacteria and viruses in the wastewater. Some detergents dumped into wastewater contain rich tripolyphosphates, which may be gradually converted to orthophosphate in the wastewater. Meanwhile, wastewater contains small parts of certain phosphorus compounds, such as AMP (Adenosine monophosphates), ADP (Adenosine diphosphates), ATP (Adenosine triphosphates), free phospholipids (Kemira, 2003). The removals of phosphorous are currently achieved by application of chemical treatment process. By adding chemical coagulant, dissolved inorganic phosphorous compounds could be converted into a low solubility metal phosphate (Metcalf & Eddy, 2003) and then removed by settling or flotation (Richard I. Sedlak, 1991). At the same time, part of organically bound phosphorous is also removed accompanying with the removal of suspended material during the chemical precipitation. The unit operations typically required in chemical treatment process involves neutralization, precipitation, coagulation/ flocculation, solids/liquid separation. There are several influencing factors in a chemical precipitation process, such as operational condition (pH and temperature), used precipitant/coagulant type, the concentration of ionic metals present in the solution, and the presence of other constituents that may inhibit the precipitation reaction (WST, 2003).
3.2. Pre-precipitation treatment process at Sjölunda WWTP
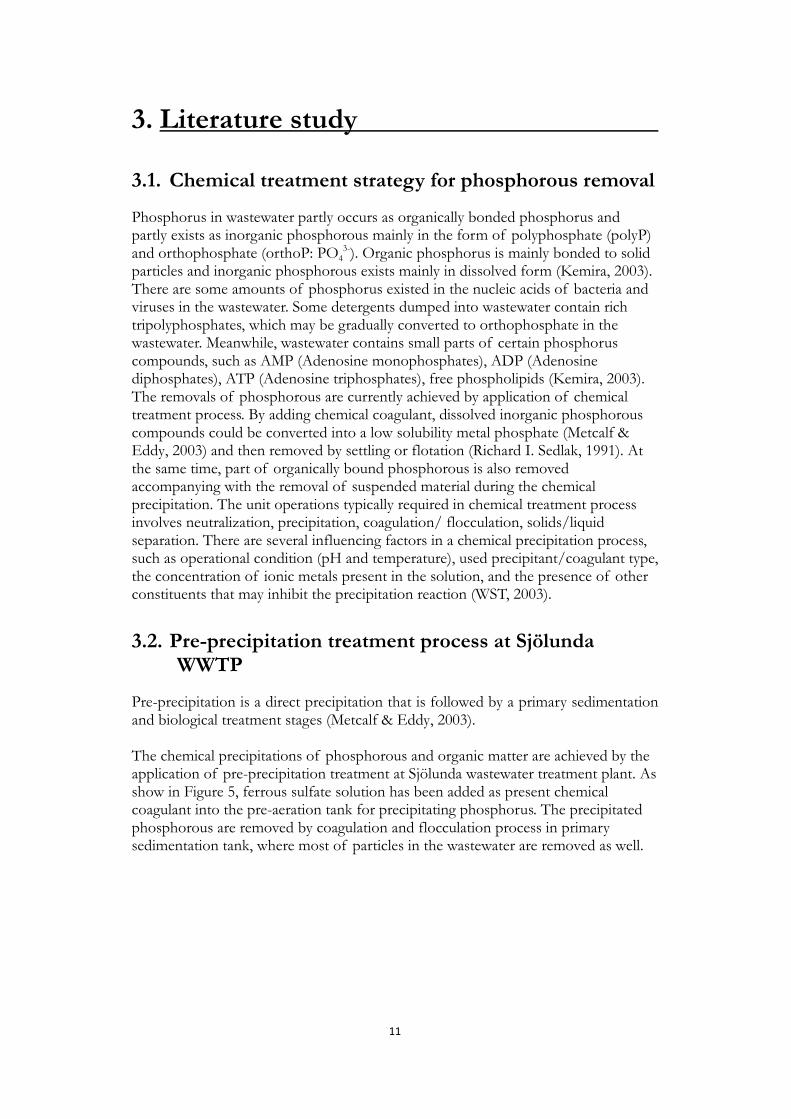
Pre-precipitation is a direct precipitation that is followed by a primary sedimentation and biological treatment stages (Metcalf & Eddy, 2003). The chemical precipitations of phosphorous and organic matter are achieved by the application of pre-precipitation treatment at Sjölunda wastewater treatment plant. As show in Figure 5, ferrous sulfate solution has been added as present chemical coagulant into the pre-aeration tank for precipitating phosphorus. The precipitated phosphorous are removed by coagulation and flocculation process in primary sedimentation tank, where most of particles in the wastewater are removed as well.
12
Figure 5: Pre-precipitation treatment process.
Pre-precipitation treatment brings about a large reduction in phosphorus as well as organic matter in primary treatment stage, which contributes less sludge production and energy consumption in the subsequent biological stages. Common products utilized for the pre-precipitation are aluminum sulfates, ferrous sulfates, ferric nitrates/sulfates, polyaluminium chlorides (Kemira, 2003).
3.3. Coagulation and Flocculation
The removal of particles and precipitated aggregations formed during chemical treatment process in the wastewater is achieved by sedimentation/coagulation or flocculation process. The particles and precipitated aggregations in the wastewater vary considerably in source, composition charge, particle size and density. Correct application of separation process and selection of coagulants depend on understanding of the interaction between these factors.
3.3.1. Coagulation
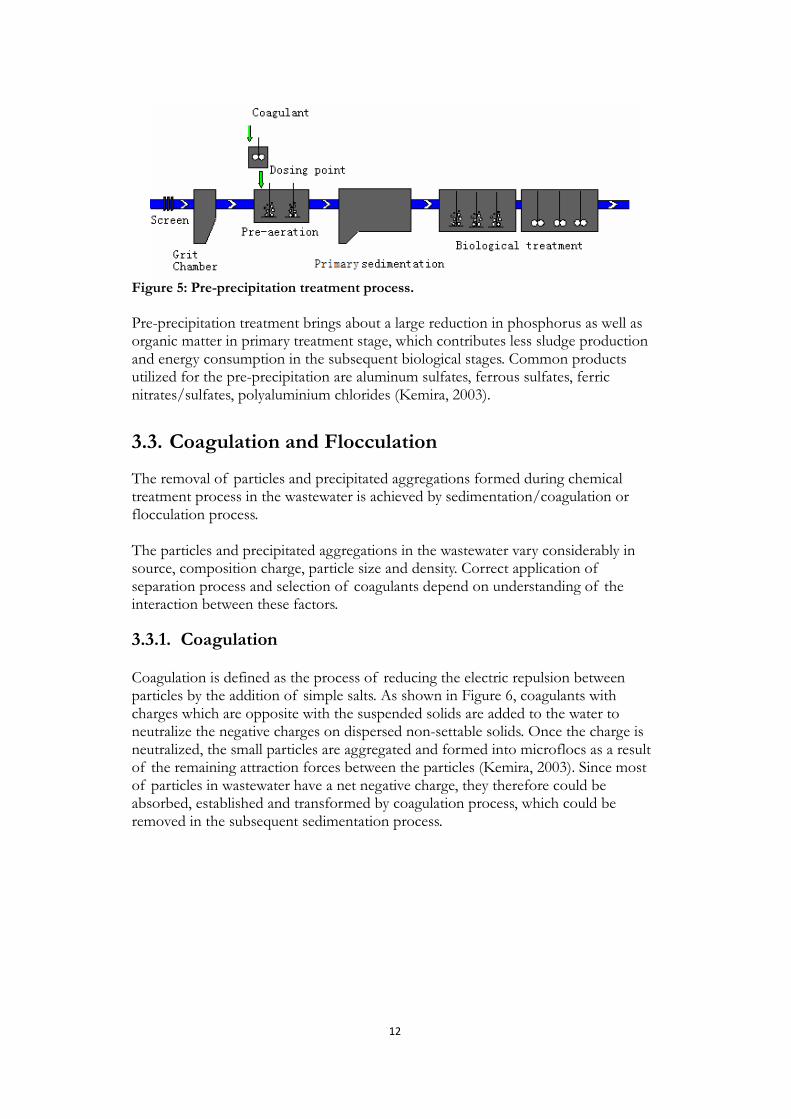
Coagulation is defined as the process of reducing the electric repulsion between particles by the addition of simple salts. As shown in Figure 6, coagulants with charges which are opposite with the suspended solids are added to the water to neutralize the negative charges on dispersed non-settable solids. Once the charge is neutralized, the small particles are aggregated and formed into microflocs as a result of the remaining attraction forces between the particles (Kemira, 2003). Since most of particles in wastewater have a net negative charge, they therefore could be absorbed, established and transformed by coagulation process, which could be removed in the subsequent sedimentation process.
13
Figure 6: Precipitation of negatively charged particles by cationic polymers (Kemira, 2003).
There are mainly three sequential stages in the coagulation process: coagulant formation, particle destabilization and particle aggregation (Jia-Qian Jiang and Nigel J D Graham, 1998). Four possible options for coagulants in wastewater could cause destabilization of particles concerning its charge and size: (1) potential-determining ions, (2) electrolytes, (3) polyelectrolyte and (4) hydrolyzed metal ions. The addition of potential-determining ions can be achieved by the addition of strong acids or bases, causing reduction in the charge of metal oxides or hydroxides to near zero. Electrolytes are added to reduce the force caused by repulsive forces between particles. Polyelectrolytes are divided into natural and synthetic types. Addition of hydrolyzed metal ions could result in coagulation by adsorption and charge neutralization, adsorption and inter-particle bridging, or enmeshment in sweep floc (MEDAWARE, 2004).
Sometimes, the optimization of coagulation is achieved by coagulant aids to have a production of a quick forming, dense, rapid-settling floc. A high-energy and rapid mix is significant for the proper disperse of coagulation and better particle collisions. Addition of alkalinity is needed where the alkalinity of the wastewater treated is insufficient for the production of a good floc. Lime is the most commonly used in the form of slaked lime (milk of lime) or hydrated lime (MEDAWARE, 2004).
3.3.2. Flocculation
Flocculation is defined as the process of aggregating particles with the aid of polymers. Polymer could form thin filaments that join different particles together (Kemira, 2003). Flocculation is a subsequent aggregation process where destabilized colloids/particles in the micron and sub-micron size range grow into larger flocs (in millimeter size). The microflocs formed in coagulation process are brought into
14
contact with each other through slow mixing process. The flocs size continues to grow through additional collisions of microfloc particles and interaction with inorganic polymers formed by the coagulant. The factors affecting the chemical to be used for phosphorus removal are (Kugelman, 1976):
• Influent phosphorus level
• Wastewater suspended solids
• Alkalinity
• Chemical cost (including transportation)
• Reliability of chemical supply
• Sludge handling facilities
• Ultimate disposal methods
• Compatibility with other treatment processes
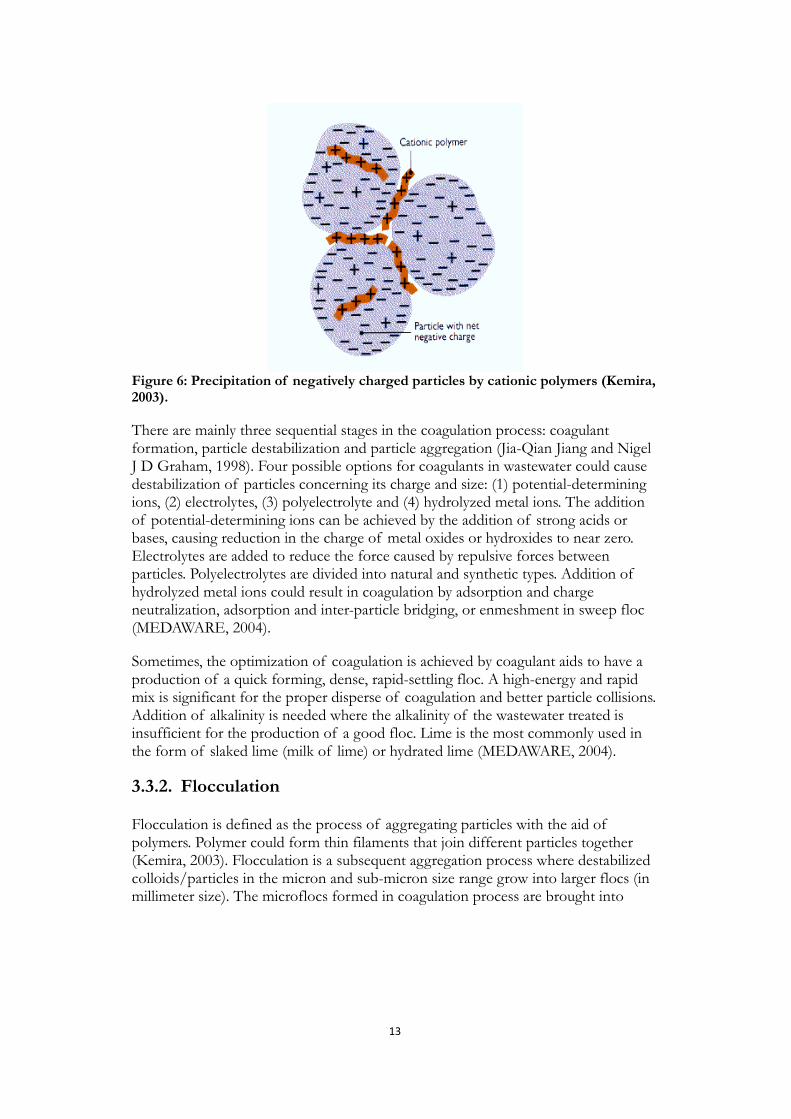
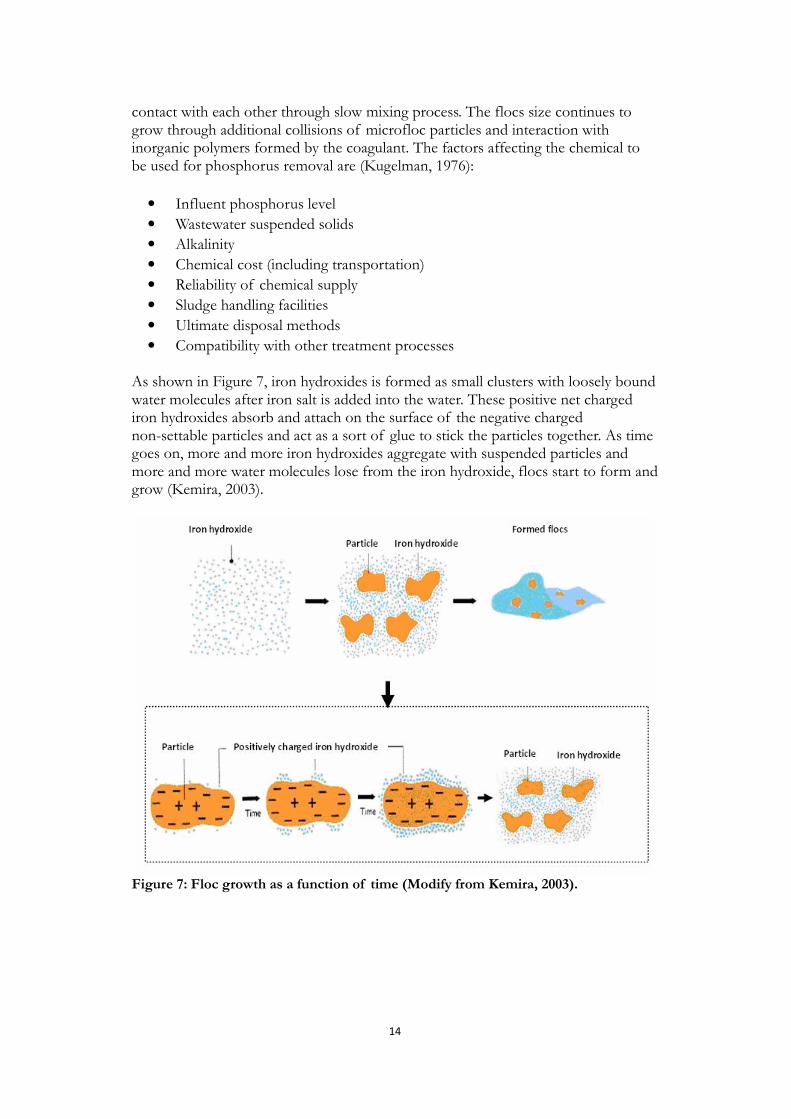
As shown in Figure 7, iron hydroxides is formed as small clusters with loosely bound water molecules after iron salt is added into the water. These positive net charged iron hydroxides absorb and attach on the surface of the negative charged non-settable particles and act as a sort of glue to stick the particles together. As time goes on, more and more iron hydroxides aggregate with suspended particles and more and more water molecules lose from the iron hydroxide, flocs start to form and grow (Kemira, 2003).
Figure 7: Floc growth as a function of time (Modify from Kemira, 2003).
15
During the chemical salts dosing process, satisfactory mixing during the first few seconds after the coagulants are added into the wastewater is significant for effective phosphorous removal. The less effective mixing, the more hydroxide will be formed, which is less effective at removing orthoP (Kemira, 2003). At Sjölunda wastewater treatment plant, ferrous sulfate has been utilized as present chemical coagulant in the precipitation of phosphorus. Since there is higher likelihood that iron ions find and react with water instead of reacting with orthophosphate ions under low turbulence condition, less orthoP are adsorbed and precipitated by iron and its hydrolysis products. Thus, a rapid mixing and high turbulence condition is essential for promotion on phosphorous removal. Meanwhile, pH value is also very important for chemical coagulation in the wastewater treatment process. Different coagulants have their respective optimum treatment efficiency at different pH levels. The pH value influences both the charges on hydroxide and particle surfaces and the type and rate at which polyiron ions are formed. When the iron salts are added in the water, pH value will always drop due to iron ions release H+ in the react with the water molecules and forms hydroxides (Kemira, 2003). The basic reactions are shown in Table 2 (Jia-Qian Jiang and Nigel J D Graham, 1998). The effect of different pH value on coagulation efficiency is shown in Figure 8. Table 2: Iron equilibrium. It could be seen from Table 2 that when the iron ions are added into the water, H+ will be released in the reaction of iron ions and water molecules.
Reactions descriptions
Fe 3+ + 3 H2O → Fe (OH) 3 + 3H+
Fe 3+ + H2O → FeOH2+ + H+
FeOH2+ + H2O→ Fe (OH)2++ H+
Fe (OH)2+ + H2O→ Fe(OH)3 + H+
Fe (OH)3 + H2O → Fe (OH)4- + H+
16
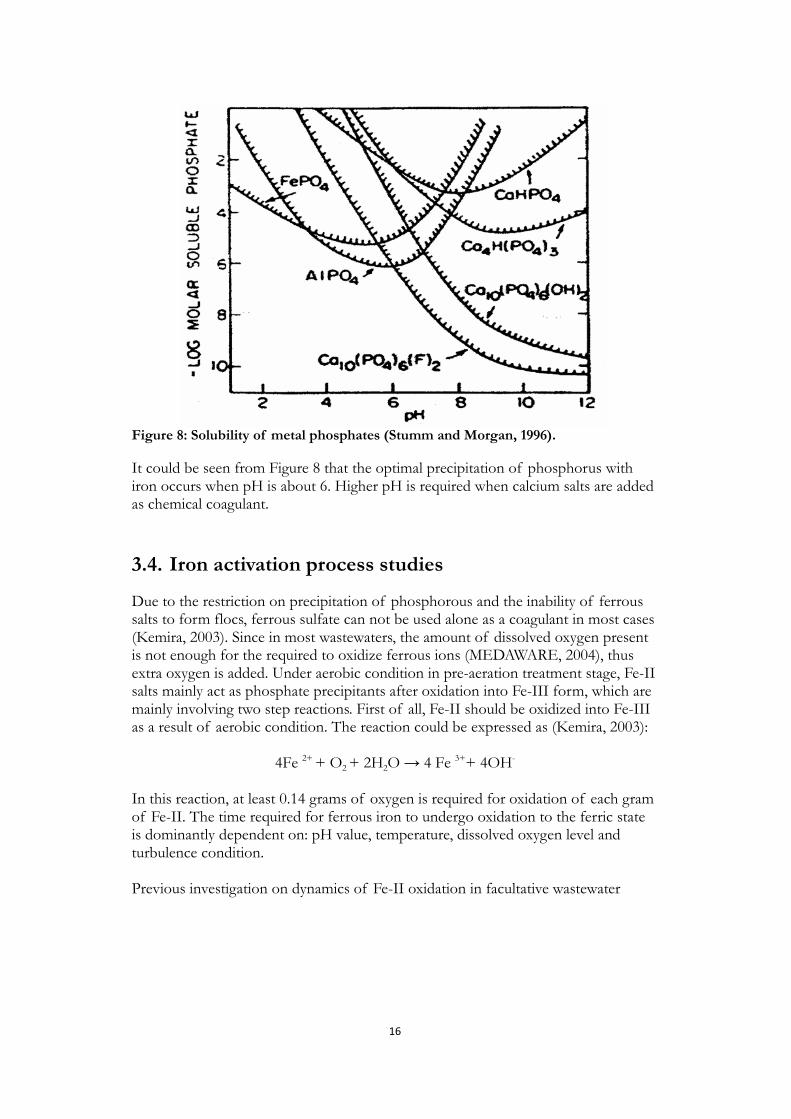
Figure 8: Solubility of metal phosphates (Stumm and Morgan, 1996).
It could be seen from Figure 8 that the optimal precipitation of phosphorus with iron occurs when pH is about 6. Higher pH is required when calcium salts are added as chemical coagulant.
3.4. Iron activation process studies
Due to the restriction on precipitation of phosphorous and the inability of ferrous salts to form flocs, ferrous sulfate can not be used alone as a coagulant in most cases (Kemira, 2003). Since in most wastewaters, the amount of dissolved oxygen present is not enough for the required to oxidize ferrous ions (MEDAWARE, 2004), thus extra oxygen is added. Under aerobic condition in pre-aeration treatment stage, Fe-II salts mainly act as phosphate precipitants after oxidation into Fe-III form, which are mainly involving two step reactions. First of all, Fe-II should be oxidized into Fe-III as a result of aerobic condition. The reaction could be expressed as (Kemira, 2003):
4Fe 2+ + O2 + 2H2O → 4 Fe 3++ 4OH-
In this reaction, at least 0.14 grams of oxygen is required for oxidation of each gram of Fe-II. The time required for ferrous iron to undergo oxidation to the ferric state is dominantly dependent on: pH value, temperature, dissolved oxygen level and turbulence condition. Previous investigation on dynamics of Fe-II oxidation in facultative wastewater
17
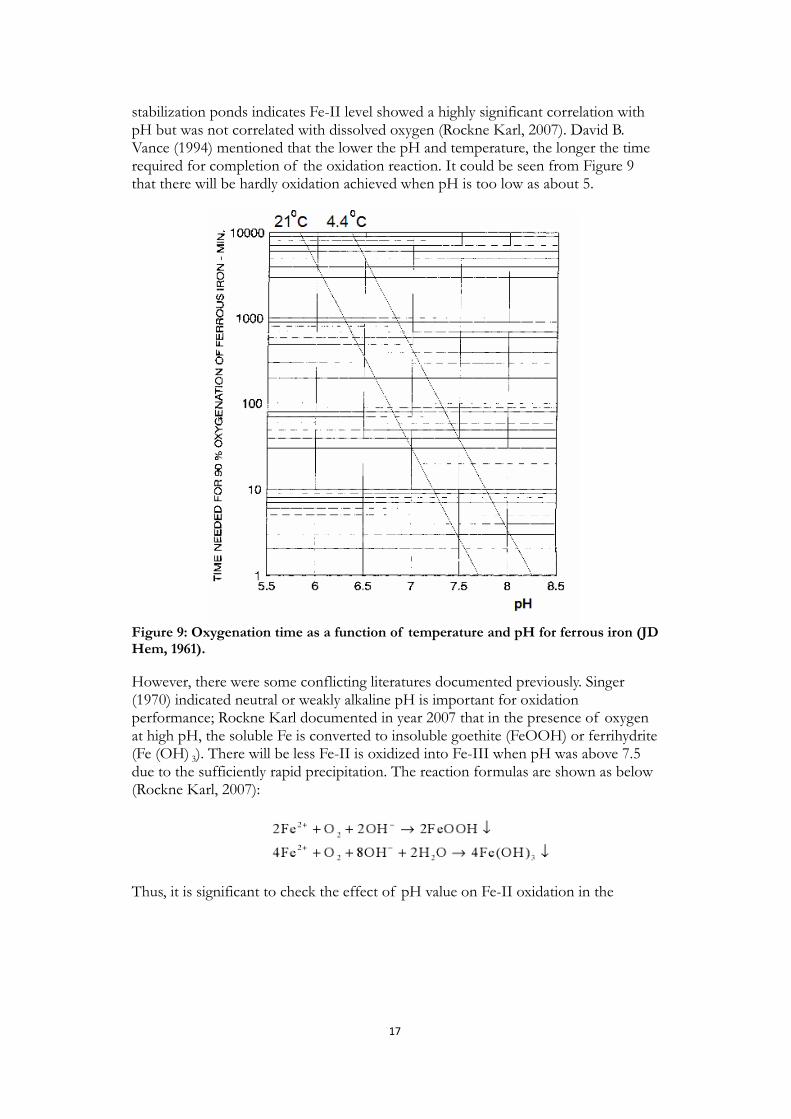
stabilization ponds indicates Fe-II level showed a highly significant correlation with pH but was not correlated with dissolved oxygen (Rockne Karl, 2007). David B. Vance (1994) mentioned that the lower the pH and temperature, the longer the time required for completion of the oxidation reaction. It could be seen from Figure 9 that there will be hardly oxidation achieved when pH is too low as about 5.
Figure 9: Oxygenation time as a function of temperature and pH for ferrous iron (JD Hem, 1961).
However, there were some conflicting literatures documented previously. Singer (1970) indicated neutral or weakly alkaline pH is important for oxidation performance; Rockne Karl documented in year 2007 that in the presence of oxygen at high pH, the soluble Fe is converted to insoluble goethite (FeOOH) or ferrihydrite (Fe (OH) 3). There will be less Fe-II is oxidized into Fe-III when pH was above 7.5 due to the sufficiently rapid precipitation. The reaction formulas are shown as below (Rockne Karl, 2007):
Thus, it is significant to check the effect of pH value on Fe-II oxidation in the
18
laboratory for the individual case. Meanwhile, a pH drop might occur during the first several minutes after Fe-II added into the water, which is mainly due to the two reactions occur in the water. The reactions could be expressed as (Kemira, 2003):
Fe 2+ + 0.25 O2 + 0.5 H2O → Fe 3++ OH-
Fe 3+ + 2H2O → Fe (OH) 3+ 3 H+
1 mole Fe 2+ generates 2 moles H+, thus pH will potentially decrease when Fe-II ions are added into the water. However, there are many factors that contribute alkalinity in wastewater, which gives strongly buffered capacity of pH change. Since there was only 8 mg/l Fe-II normally added in the wastewater at Sjölunda WWTP in summer (Qianqian Zhou, 2008), which is too slight to observe a pH drop. Moreover, to achieve an effective Fe-II oxidation, oxygen-rich condition is required, since dissolved iron mainly occurs as divalent iron under oxygen-poor condition. The higher the dissolved oxygen concentration the less time required for the oxidation process. Meanwhile, a long aeration period is essential to obtain effective oxidation results (Kemira, 2003). The reaction half time for oxidation of Fe-II into Fe-III is about 16 minutes at pH value 7.0, 2 mg/l dissolved oxygen (DO) and 25°C (Singer, 1972). Fe-III precipitates phosphorous in the form of ferric phosphate (FePO4) by reacting with orthophosphate (orthoP). At the same time, it is inevitable that Fe-III ions react with hydrogen or hydroxide ions to form amorphous iron hydroxide flocs. This iron hydroxide is positively charged and thus can participate in the removal of phosphorus by setting up a slow exchange reaction of hydroxyl ions with orthophosphate ions (PO4
3-) (Rabinowitz and Marais, 1980). Since the iron hydroxide can destabilize and enmesh the negatively charged iron-phosphate colloids, and provide an adsorption capability for orthophosphate and polyphosphate (polyP) molecules (DW de Haas, MC Wentzel and GA Ekama, 2000). The mentioned reactions are shown as followed (Metcalf & Eddy, 2003):
Fe 3++ HnPO4 3-n ↔ FePO4 + nH+
Fe 3++ 3H2O → Fe (OH) 3 + 3H+
Based on the reaction formula, the precipitation of 1 mole P requires 1mole Fe 3+. However, as mentioned previously there is likelihood that part of iron ions could react with water instead of precipitating with orthophosphate ions, more Fe 3+ is needed to comply with the demand of P removal. Thus, the precipitation of orthophosphate requires 1-1.5 moles of Fe 3+ per mole of P (2.7 g Fe-III / g P) normally and effective precipitation occurs in the pH range 4-8 (Kemira, 2003).
19
Results from the laboratory tests made by Hove, M.; van Hille, R.P.; Lewis, A.E in 2008 indicated that pH has a essential effect on the precipitated particle size distribution and the stability of the formed precipitates. High pH value promotes high oxidation rates and gives a more stable precipitates in a short time. Thus, there is more particle throughput but less big size particles formed under high pH condition, which increases the difficulty in removing precipitated particles. On the other hand, lower pH gives a slow oxidation kinetics with bigger particles but less stabilization, which gives benefits for solid-liquid separation (suspend solids removal) and significant savings in chemical cost. Furthermore, there are some uncertain components in the activated sludge tank that could promote Fe-II oxidation and precipitation process. Proper amount of sludge could be used to promote flocculation performance and activated sludge flocs could be reflocculated under aerobic condition after deflocculating under short-term anaerobic conditions (Wilen, B. -M; Keiding, K.; Nielsen, P. H., 2004).
3.5. Comparison among different chemical coagulants utilized in the pre-precipitation treatment process
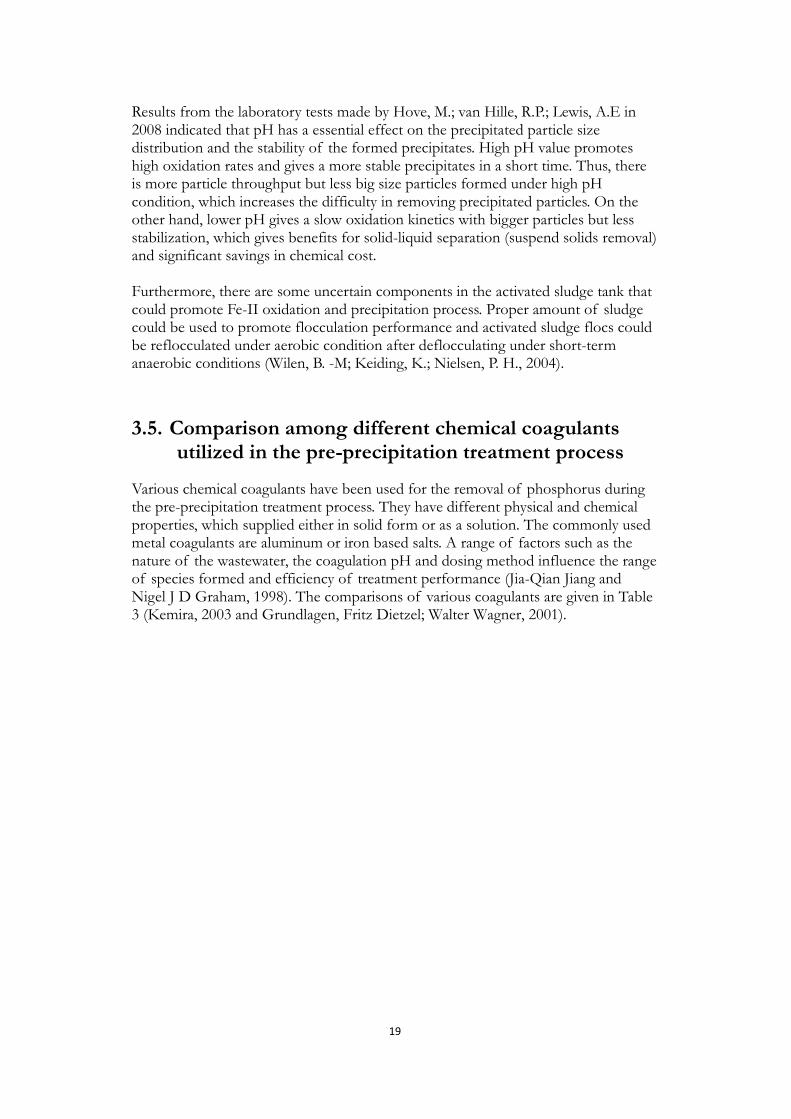
Various chemical coagulants have been used for the removal of phosphorus during the pre-precipitation treatment process. They have different physical and chemical properties, which supplied either in solid form or as a solution. The commonly used metal coagulants are aluminum or iron based salts. A range of factors such as the nature of the wastewater, the coagulation pH and dosing method influence the range of species formed and efficiency of treatment performance (Jia-Qian Jiang and Nigel J D Graham, 1998). The comparisons of various coagulants are given in Table 3 (Kemira, 2003 and Grundlagen, Fritz Dietzel; Walter Wagner, 2001).
20
Table 3: Physical and chemical properties of some chemical coagulants. It could be seen from Table 3 that there are many chemical coagulants could be applied for the removal of phosphorus. The choice of the chemical coagulant is based on their individual physical and chemical properties.
Chemical product
Iron(II) chloride
Iron(III) chloride
Iron(III) chloride sulfate
Iron(II) Sulfate
Iron(III) Sulfate
Chemical form
FeCl2 FeCl3 FeClSO4 FeSO4*7H2O Fe2(SO4)3
Supply form
liquid liquid liquid Crystals liquid
Density tones/m3
1.24-1.37 1.41-1.43 1.43-1.52 1.2 1.4-1.5
Metal content %
11.5-14 11.5-14 11.5-14 18 11.5-14
Storage and dosage
Tank Acid-resistant,
pump
Tank Acid-resistant,
pump
Tank Acid-resistant,
pump Sump-bunker
Tank Acid-resistant,
pump
21
4. Lab-work strategies and preparations
4.1. Experimental Strategies
The expected Fe-II oxidation didn’t occur in the pre-aeration tank but is seen in the activated sludge tank instead at Sjölunda WWTP. In order to figure out the main reason of the delayed and inefficient oxidation performance, it is necessary to know how fast Fe-II oxidation performs in wastewater. Moreover, it is interesting to see the required oxidation time in deionized water and tap water. This could be used to compare to the oxidation performance in wastewater to give further operational and analytic reference on lab tests. How significantly the oxidation time and operational parameter (pH, DO, turbulence condition) affect the oxidation process are respectively investigated. Thus, there are two main lab tests performed to get a better understanding and clearer clue on iron activation process, which are aeration test and flocculation test. The aeration tests were carried out to investigate the required time for oxidizing ferrous ions and the influencing factors in the pre-aeration process. The flocculation tests were performed to aid the study how the achieved oxidation affects the subsequent precipitation performance. Meanwhile, it is essential to check the oxidation caused by the pre-precipitation process, if there is any difference obtained in Fe-II concentration and water quality during the flocculation.
4.2. Overview of performed laboratory tests
The laboratory tests were planned and performed based on the previous experimental strategies. Figure 10 shows the overview of the performed lab tests during the thesis study. As shown in Figure 10 the analysis of required oxidation time for Fe-II oxidation was carried out by testing with deionized water, tap water and wastewater respectively. Old Fe-II solution and settled samples have been used for mentioned tests. The outcomes from the lab tests indicated the deionized water and tap water are not suitable for the further lab tests and low Fe-II oxidation has been achieved in wastewater over a long aeration process. The detail information of the analysis is demonstrated in the section 5.1. Since unfiltrated samples were used for the lab tests, this might affect the measuring accuracy. The filtrated sample was utilized for rechecking the previously achieved oxidation efficiency in wastewater and recommended for the further lab tests. Low Fe-II oxidation efficiency was achieved again by rechecking with the filtrated sample in wastewater. More detail descriptions are shown in section 5.1.4.

22
Figure 10: Overview of laboratory works.

23
In order to find out the causes of the inefficient oxidation, the respective effects of the influencing factors (such as pH, DO level, turbulence condition and dosed chemical properties) on Fe-II oxidation have been analyzed. Meanwhile, new Fe-II solution was used for the lab tests. The detail information on the performed tests is shown in section 5.2. How the achieved oxidation performance influences the subsequent precipitation and the effect of coagulation and flocculation on Fe-II oxidation were documented in section 5.3. There are four sub-lab works aimed to aid the investigations, the first lab test was mainly aimed to analyze the variation of oxygen level in the wastewater during the flocculation process. The second laboratory task was to present the achieved Fe-II oxidation during flocculation by applying different aerated time scale. The third lab test was to investigate the Fe-II oxidation process in each flocculation step. The last laboratory test was the analysis of the effect of activated sludge on Fe-II oxidation during flocculation.
4.3. Laboratory test methodologies
4.3.1. (Pre-)Aeration analysis
The (pre)aeration test was operated to simulate the pre-aeration process at Sjölunda WWTP. As shown in Figure 11, air was pumped into the beaker through an air diffuser to oxidize ferrous ions in the pre-aeration test (aeration test). A magnetic stirrer was used to keep high turbulence in the tested water sampling. The oxygen concentration in the water was normally kept around 8-10 mg/l O2. The aerated time was determined based on the demand of the individual case.
Figure 11: Equipment utilized in pre-aeration process.
24
4.3.2. Flocculation simulation
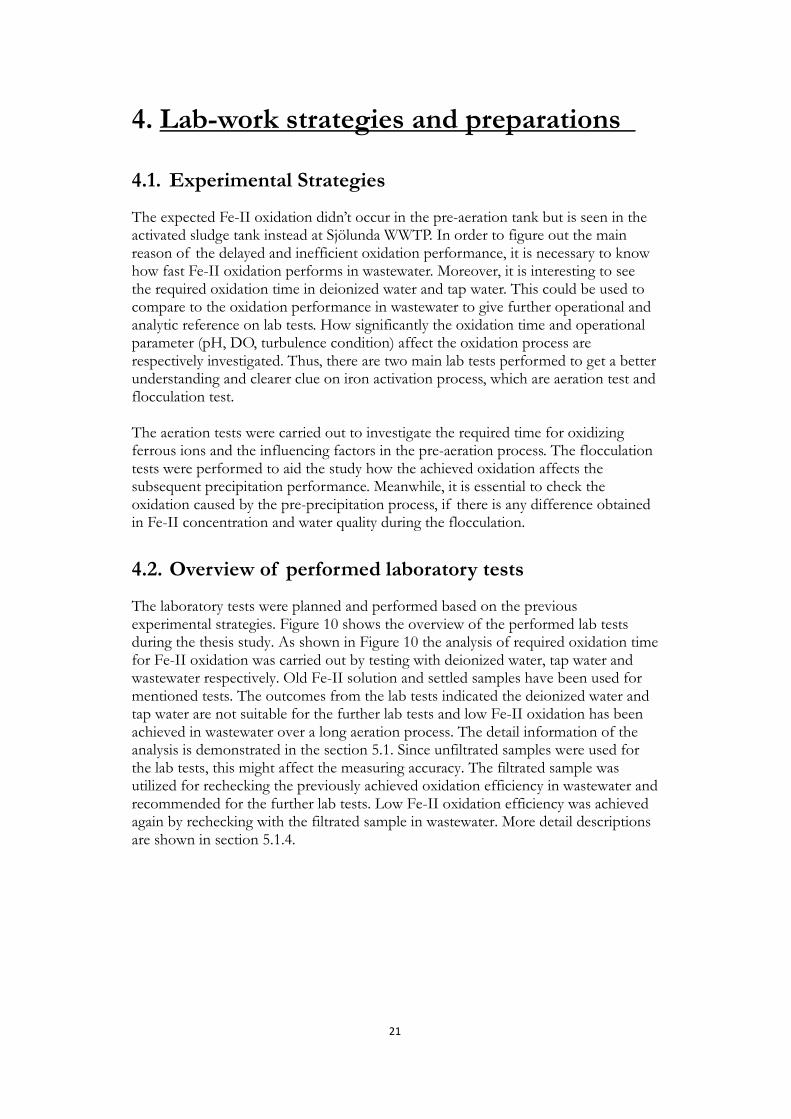
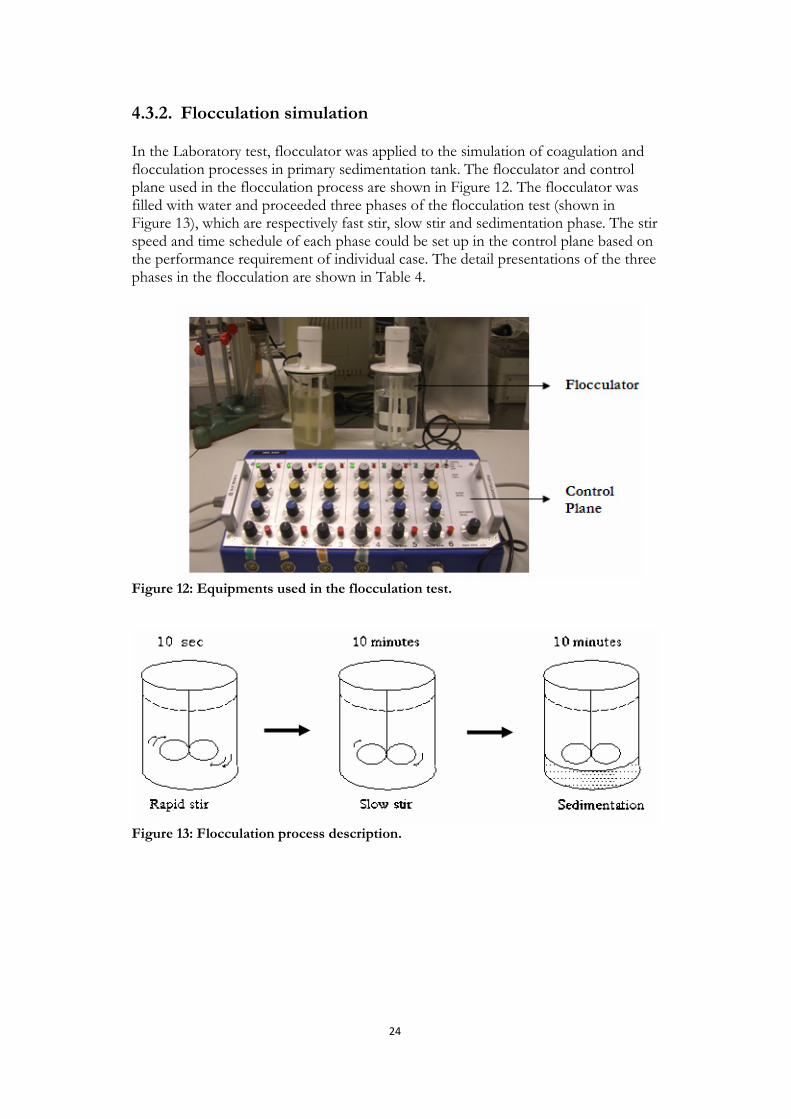
In the Laboratory test, flocculator was applied to the simulation of coagulation and flocculation processes in primary sedimentation tank. The flocculator and control plane used in the flocculation process are shown in Figure 12. The flocculator was filled with water and proceeded three phases of the flocculation test (shown in Figure 13), which are respectively fast stir, slow stir and sedimentation phase. The stir speed and time schedule of each phase could be set up in the control plane based on the performance requirement of individual case. The detail presentations of the three phases in the flocculation are shown in Table 4.
Figure 12: Equipments used in the flocculation test.
Figure 13: Flocculation process description.
25
Table 4: Process information of flocculation test.
Phase description
Step no Standard Duration
[minutes] Stir Speed [RPM*]
Fast stir 1 0.17 (10 sec) 350
Slow stir 2 10 30
Sedimentation 3 10 0
* RPM: Rotation(s) Per Minute
4.4. Material and equipment
4.4.1. Material
� Wastewater
� Ferrous sulfate
Old Fe-II solution: Sjölunda WWTP in Malmö, ferrous sulfate solution from the dosing point in pre-aeration tank on 19th Sep. 2008.
New Fe-II solution: Freshly made ferrous sulfate solution in the lab. (More detail about ferrous sulfate is shown in Appendix 1)
Table 5 shows the information of chemical cuvettes utilized for checking the water quality and compositions of water sampling during laboratory tests (More detail information about the mentioned chemical cuvette is shown in Appendix 2). Table 5: Information of cuvettes used in the lab tests.
Cuvette Product Application
LCK320 (Dr. Lange)
LCK320 (Dr. Lange) has been applied for the measurement of Fe-II and Fe-III concentrations in the sampling. Due to the restriction of measurable principle of LCK320, settled and filtrated samplings were used for the laboratory tests. The measured Fe-II and Fe-III was the concentration sum of soluble Fe-II and Fe-III and Fe-II and Fe-III bonded with micro-suspend solid in the sample. More detail information on measuring range, test procedure, influencing factors of chemical cuvette LCK320 are shown in Appendix 3.
LCK 303 (Dr. Lange) NH4-N concentration measurement
26
LCK 114 (Dr. Lange) Total COD check
LCK 348 (Dr. Lange) PO4-P concentration measurement
4.4.2. Equipment
� Beaker
� Rubber hose
� Aerator
� Air diffuser
� Magnetic Stirrer
� Timer
� Micropipette
� Filter paper1 (MUNKTELL FILTER AB, Grade 1002) Filter paper2 (GF C mirofibre filters, Cat no: 1822-055)
Table 6: Information of applied Equipments in the pre-laboratory tests.
Equipment Application
Flocculator (Kemira, NR. 232) Flocculation test
Oxygen meter (WTW Oxi 197-S) Oxygen level measurement
pH meter (WTW pH 320) Temperature and pH value measurement
Spectrophotometer (LANGE DR LASA 100 & LANGE DR ISIS 9000)
Evaluate the concentration of the components(such as Fe-II/Fe-III, total COD) in the sampling
Turbid meter (HACH Ratio TURBIDIMETER)
Turbidity evaluation
Thermostat (DR LANGE) Heating up cuvette LCK114
Micro centrifuge (Wood bridge, NJ ) Centrifugal separation of tested sampling
More detail information on the applied equipments in the lab tests is shown in Appendix 4.
27
5. Lab works
5.1. Investigations of required oxidation time for Fe-II in pre-aeration process
5.1.1. Investigation of Fe-II oxidation in wastewater
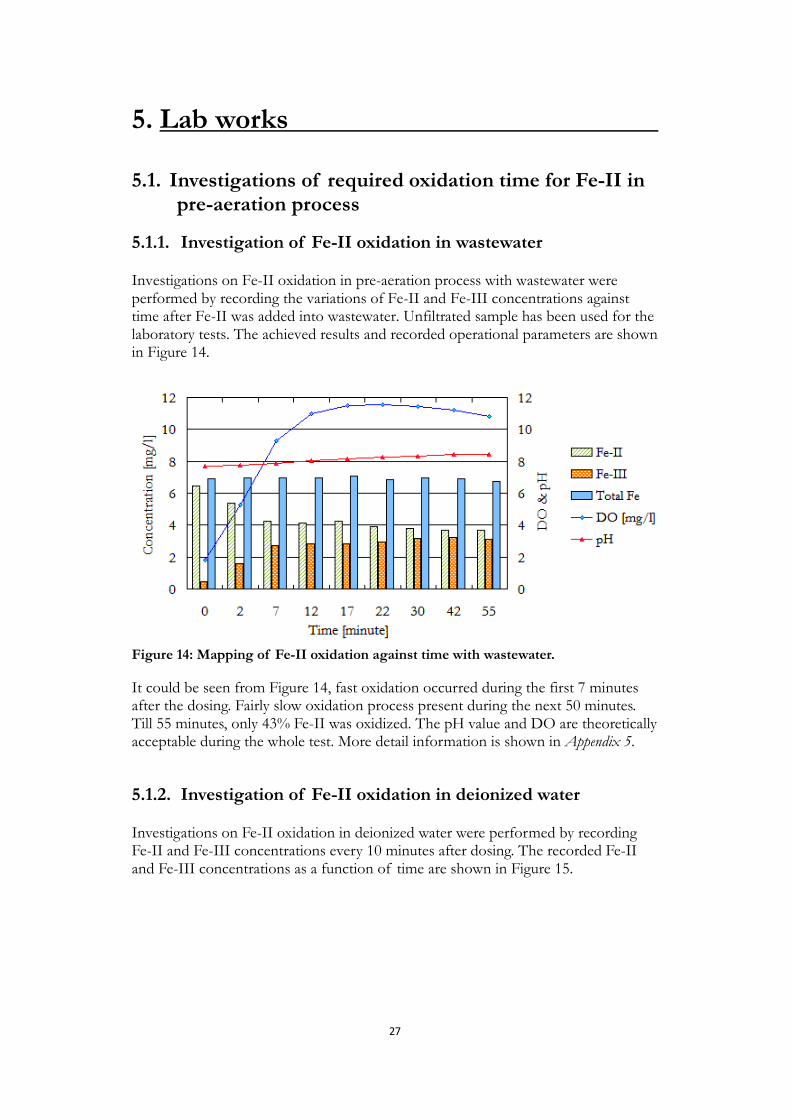
Investigations on Fe-II oxidation in pre-aeration process with wastewater were performed by recording the variations of Fe-II and Fe-III concentrations against time after Fe-II was added into wastewater. Unfiltrated sample has been used for the laboratory tests. The achieved results and recorded operational parameters are shown in Figure 14.
Figure 14: Mapping of Fe-II oxidation against time with wastewater.
It could be seen from Figure 14, fast oxidation occurred during the first 7 minutes after the dosing. Fairly slow oxidation process present during the next 50 minutes. Till 55 minutes, only 43% Fe-II was oxidized. The pH value and DO are theoretically acceptable during the whole test. More detail information is shown in Appendix 5.
5.1.2. Investigation of Fe-II oxidation in deionized water
Investigations on Fe-II oxidation in deionized water were performed by recording Fe-II and Fe-III concentrations every 10 minutes after dosing. The recorded Fe-II and Fe-III concentrations as a function of time are shown in Figure 15.

28
Figure 15: Mapping of Fe-II oxidation against time with deionized water.
It could be seen from Figure 15 that there was almost no Fe-II oxidized into Fe-III in more than one hour. During the whole test, the temperature was around 22ºC and the oxygen level in deionized water was kept high above 9 mg/l, which are reasonable for Fe-II oxidation. However, the present pH value (pH was about 5) was quite low in the deionized water. The detail information can be checked from Appendix 6. Deionized water sampling has been aerated for a long time (more than 2 hours) in order to check if ferrous ions will be oxidized with longer aeration period. During the recorded period, there is no color change in the sampling, which is shown in Figure 16. Even though long aeration has been applied, there was still no Fe-II oxidation achieved in the deionized water. The detail results of measured Fe-II and Fe-III are shown in Appendix 6 as well.
Figure 16: Fe-II oxidation with deionized water against time. As shown in the graph, there was no color change observed in the sampling during the whole test. No Fe-II oxidation was achieved in the deionized water over 2 hours.
29
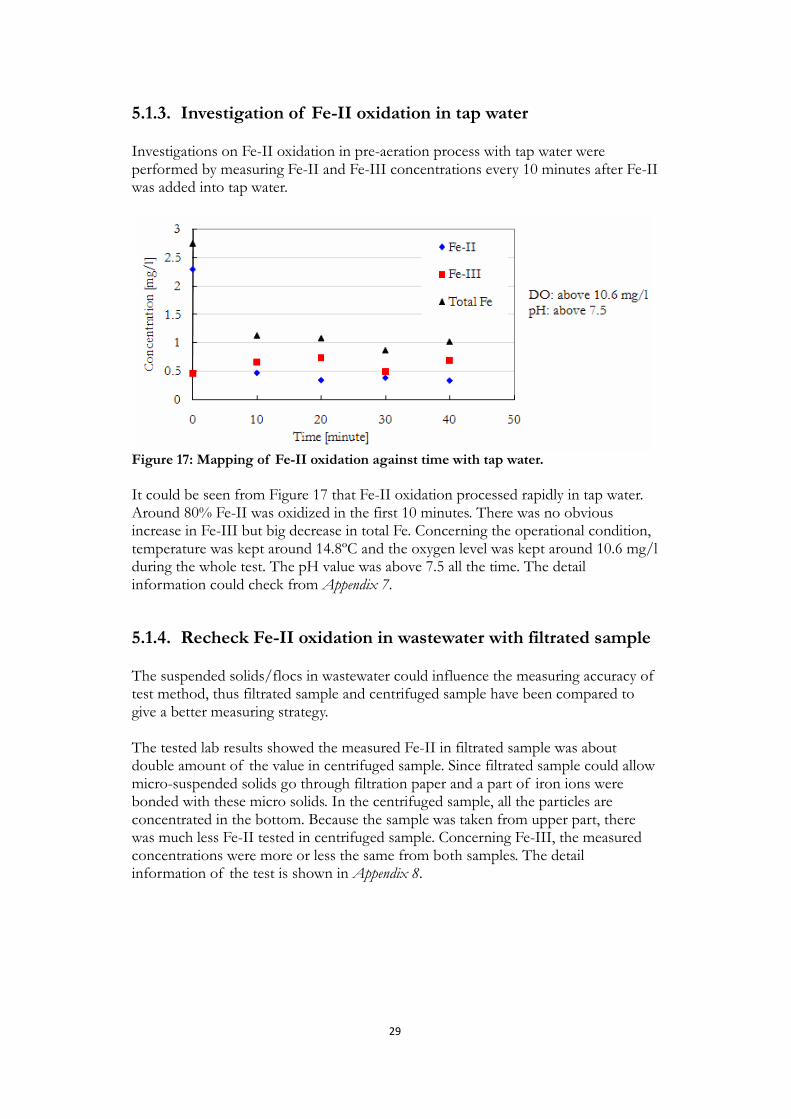
5.1.3. Investigation of Fe-II oxidation in tap water
Investigations on Fe-II oxidation in pre-aeration process with tap water were performed by measuring Fe-II and Fe-III concentrations every 10 minutes after Fe-II was added into tap water.
Figure 17: Mapping of Fe-II oxidation against time with tap water.
It could be seen from Figure 17 that Fe-II oxidation processed rapidly in tap water. Around 80% Fe-II was oxidized in the first 10 minutes. There was no obvious increase in Fe-III but big decrease in total Fe. Concerning the operational condition, temperature was kept around 14.8ºC and the oxygen level was kept around 10.6 mg/l during the whole test. The pH value was above 7.5 all the time. The detail information could check from Appendix 7.
5.1.4. Recheck Fe-II oxidation in wastewater with filtrated sample
The suspended solids/flocs in wastewater could influence the measuring accuracy of test method, thus filtrated sample and centrifuged sample have been compared to give a better measuring strategy. The tested lab results showed the measured Fe-II in filtrated sample was about double amount of the value in centrifuged sample. Since filtrated sample could allow micro-suspended solids go through filtration paper and a part of iron ions were bonded with these micro solids. In the centrifuged sample, all the particles are concentrated in the bottom. Because the sample was taken from upper part, there was much less Fe-II tested in centrifuged sample. Concerning Fe-III, the measured concentrations were more or less the same from both samples. The detail information of the test is shown in Appendix 8.
30
It is necessary to stress that micro-suspended solids have significant effect on iron activation and phosphorous removal. The dissolved phosphates are strongly associated with the iron ions, which are attached to the surfaces of micro-suspended solids. These micro solids could be preserved in the filtrated sample since they are smaller than the pore size of filter paper. Thus, compared to the centrifuged sample, filtrated sample could not only eliminate the negative effects caused by the suspended solids in the wastewater but also could preserve the iron ions bond to those micro particles. Filtrated samples were used to recheck the oxidation efficiency achieved from previous aeration tests. The results from the recheck test showed the achieved Fe-II oxidation percentage was about 28% after 70-minute aeration by using filtrated sample. Thus, we could draw a conclusion that low Fe-II oxidation efficiency achieved in wastewater no matter whether settled sample or filtrated sample utilized for lab tests. The detail information of the performed test is shown in Appendix 9.
5.1.5. Summary on performed aeration tests
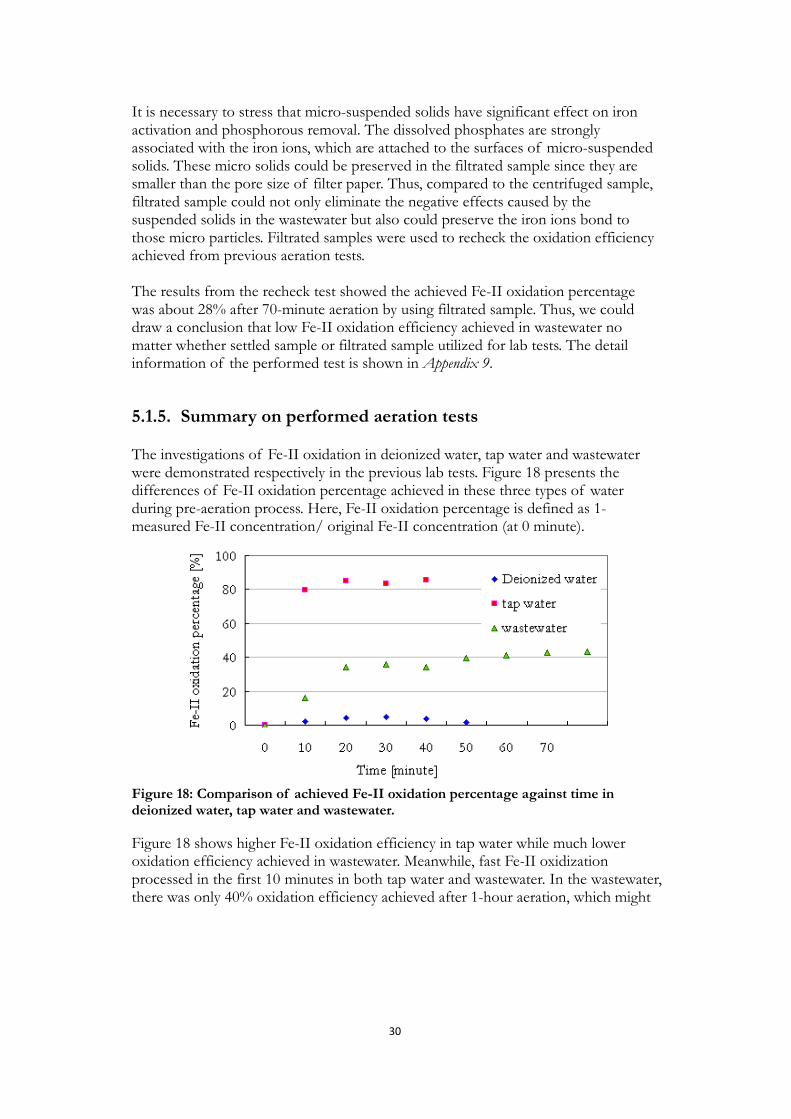
The investigations of Fe-II oxidation in deionized water, tap water and wastewater were demonstrated respectively in the previous lab tests. Figure 18 presents the differences of Fe-II oxidation percentage achieved in these three types of water during pre-aeration process. Here, Fe-II oxidation percentage is defined as 1- measured Fe-II concentration/ original Fe-II concentration (at 0 minute).
Figure 18: Comparison of achieved Fe-II oxidation percentage against time in deionized water, tap water and wastewater.
Figure 18 shows higher Fe-II oxidation efficiency in tap water while much lower oxidation efficiency achieved in wastewater. Meanwhile, fast Fe-II oxidization processed in the first 10 minutes in both tap water and wastewater. In the wastewater, there was only 40% oxidation efficiency achieved after 1-hour aeration, which might

31
be due to ferrous ions have reacted with/inhibited by some other compound and therefore were not available for Fe-II oxidation. There is almost no Fe-II oxidation achieved in deionized water. In order to find out the reason of different Fe-II oxidation efficiencies achieved in these three types of water, pH variation was measured and analyzed for each. Figure 19 shows the comparison of pH variations.
Figure 19: Comparison of pH variation in deionized water, tap water and wastewater.
It could be seen from Figure 19, for tap water there was a pH drop until more than 80% of iron was oxidized and then the pH was stable. Meanwhile, pH value in tap water and wastewater was stay above pH 7.5 all the time, which are acceptable for Fe-II oxidation. The slight increase in pH occurred in wastewater was probably caused by biological activities. Raw wastewater might have a very high metabolism and therefore a lot of CO2 is produced that increases the alkalinity.
Concerning pH variation in deionized water, there was a drop in pH to 5.0 after Fe-II dosing in deionized water. According to the previous literature study, the oxidation rate of Fe-II ions is heavily pH-dependent. Thus, pH 5 was too low for Fe-II oxidation to be performed even though oxygen level and temperature were quite reasonable during aeration test.
It could be concluded that deionized water can not be used for further aeration test due to its low pH value. Meanwhile, since more contaminated components and uncertainty processes existed in the wastewater, fairly different oxidation performances achieved between tap water and wastewater. Thus, tap water can not properly reflect the practical conditions and reactions occurred in the wastewater, wastewater is recommended to be applied to the further lab tests.
32
5.2. Study of effects of the influencing factors on Fe-II oxidation
5.2.1. Analysis of pH effect on Fe-II oxidation in wastewater
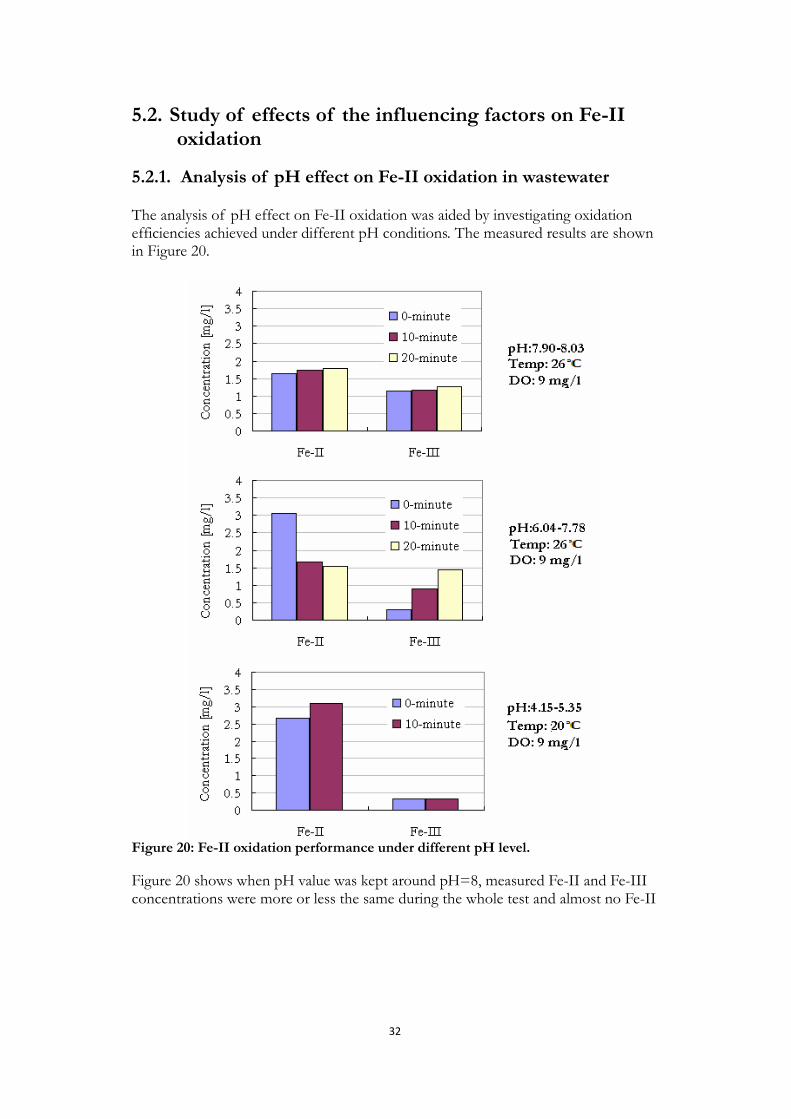
The analysis of pH effect on Fe-II oxidation was aided by investigating oxidation efficiencies achieved under different pH conditions. The measured results are shown in Figure 20.
Figure 20: Fe-II oxidation performance under different pH level.
Figure 20 shows when pH value was kept around pH=8, measured Fe-II and Fe-III concentrations were more or less the same during the whole test and almost no Fe-II

33
oxidation could be observed in the aeration. As shown in the second graph of Figure 20, there was Fe-II oxidation observed during the aeration. The oxidation processed accompanying with the increase of pH during the aeration. When the pH reached to around 8, oxidation almost completed. There is no oxidation performance observed under low pH (4.15-5.35) condition. The detail information of the tests is shown in Appendix 10.
5.2.2. The investigation of the effect of DO on Fe-II oxidation
In order to investigate the effect of DO on Fe-II oxidation, two aeration tests were performed by applying with fresh ferrous sulfate solution under high and low oxygen level. Same turbulence generated by magnetic stirrer and the operational conditions were similar in these two aeration tests. The detail information is shown in Figure 21 and Table 7. The oxygen level was above 9 mg/l in high DO condition and about 1.5 mg/l under low DO condition.
Figure 21: Effect of oxygen level on Fe-II oxidation. As shown in the graph, the starting
values under both conditions are the same: 5.1 mg/l Fe-II and 0.073 mg/l Fe-III. Big drops
occurred in Fe-II concentrations under both conditions during the first minute after dosing.
However, there was less Fe-II and Fe-III observed under high DO condition.
34
Table 7: Comparison of new aeration tests with fresh Fe-II solution under high/ low
DO condition.
Fe-II Fe-III Total Fe Sample description
[mg/l] [mg/l] [mg/l]
Operational Condition
Original value in ww 0.100 0.073 0.173 Added Fe-II in ww 5 0 0 Total value at 0 minute 5.100 0.073 5.173
pH=7.48 Temp=16.5ºC DO=6.27 mg/l
1 0.399 0.153 0.553 3 0.288 0.090 0.377
Aeration 1 [minute]
7 0.071 0.213 0.285
pH=8.18 Temp=16.8ºC DO=9.5-10 mg/l
1 1.12 0.673 1.80 5 0.381 0.622 1.00
Aeration 2 [minute]
16 0.242 0.159 0.401
pH=8.08 Temp=16.7ºC DO=1.3-1.7 mg/l
Fe-II solution: Freshly made ferrous solution, 10g/l Fe-II, 10th Dec. 2008 Wastewater: The raw wastewater after screening, Källby WWTP, 8 am 10th Dec. 2008 Filtration paper: GF C filters
5.2.3. The analysis of turbulence effect on Fe-II oxidation
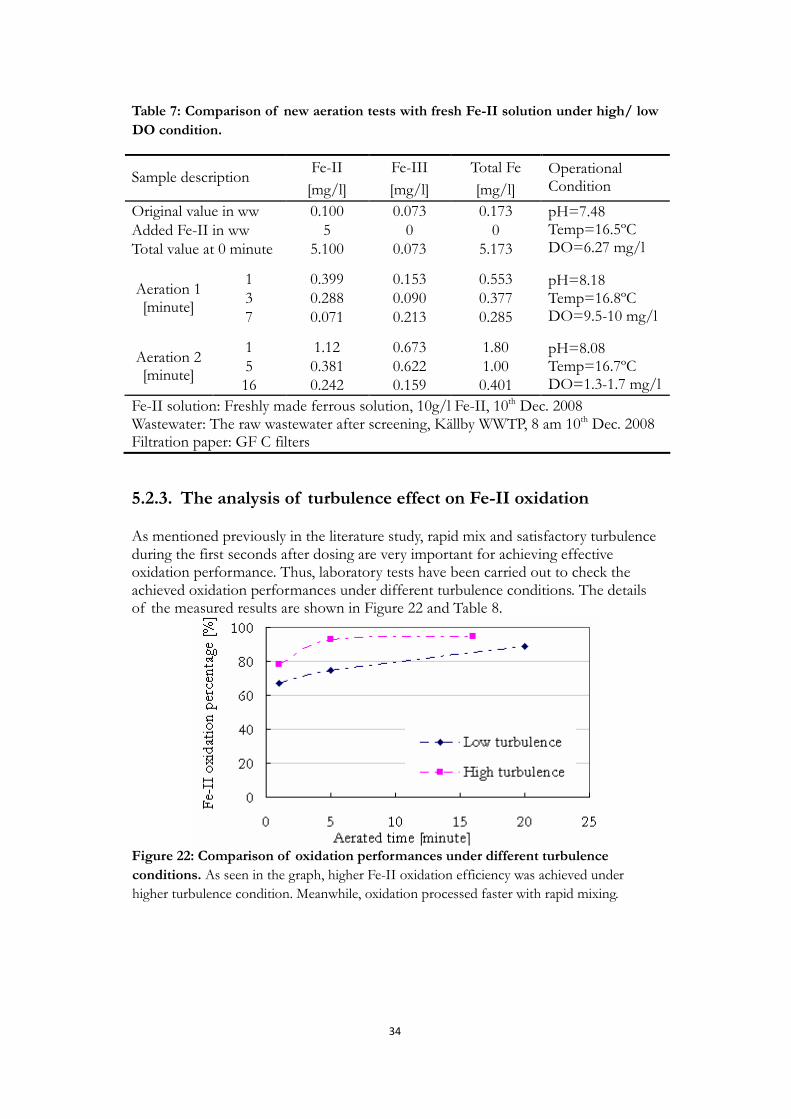
As mentioned previously in the literature study, rapid mix and satisfactory turbulence during the first seconds after dosing are very important for achieving effective oxidation performance. Thus, laboratory tests have been carried out to check the achieved oxidation performances under different turbulence conditions. The details of the measured results are shown in Figure 22 and Table 8.
Figure 22: Comparison of oxidation performances under different turbulence
conditions. As seen in the graph, higher Fe-II oxidation efficiency was achieved under
higher turbulence condition. Meanwhile, oxidation processed faster with rapid mixing.
35
Table 8: Results of achieved oxidation performances under different turbulence
conditions.
Fe-II Fe-III Total Fe
Sample description [mg/l]
0xidation percentage
[mg/l] [mg/l] Operational Condition
0 5.625 0% 0.42 6.03
1 1.85 67% 1.24 3.09
5 1.41 75% 0.722 2.13
Aeration 1 [minute]
20 0.633 89% 0.296 0.929
pH=7.89 Temp=18ºC DO=1.5-2 mg/l Low turbulence
0 5.100 0% 0.073 5.173
1 1.12 78% 0.673 1.80
5 0.381 93% 0.622 1.00
Aeration 2 [minute]
16 0.242 95% 0.159 0.401
pH=8.08 Temp=17ºC DO=1.3-1.7 mg/l High turbulence
Filtration paper: GF C filters
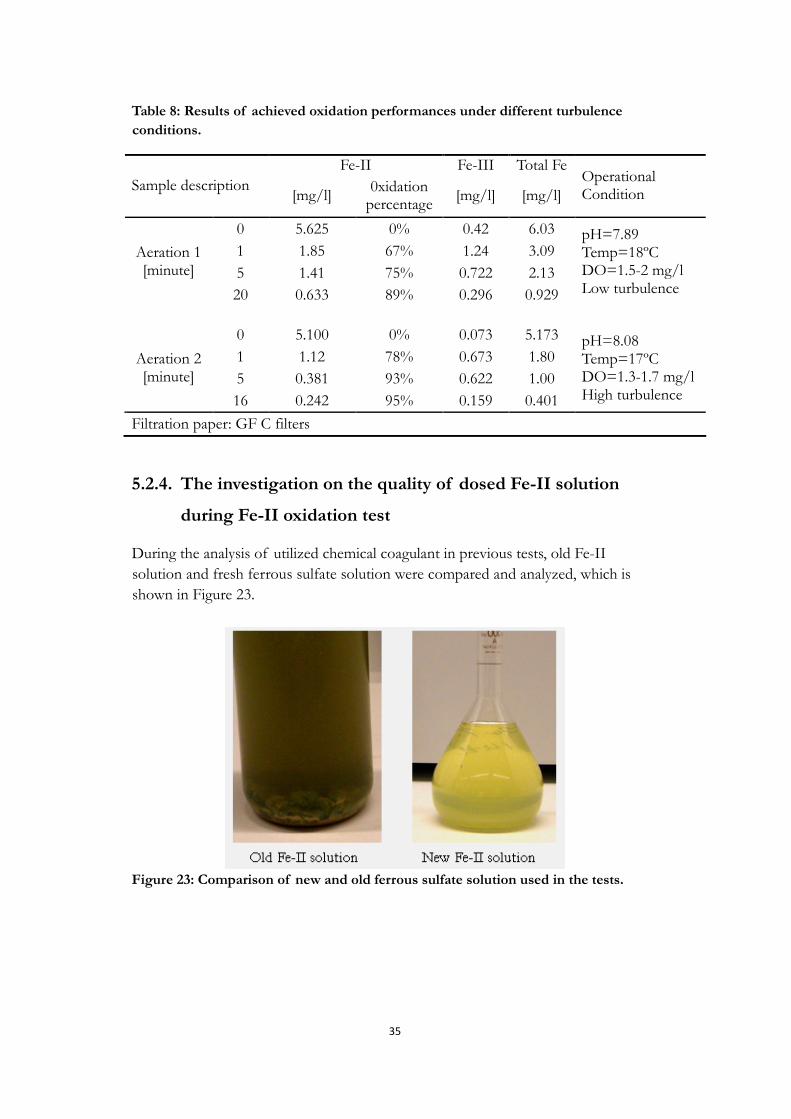
5.2.4. The investigation on the quality of dosed Fe-II solution
during Fe-II oxidation test
During the analysis of utilized chemical coagulant in previous tests, old Fe-II
solution and fresh ferrous sulfate solution were compared and analyzed, which is
shown in Figure 23.
Figure 23: Comparison of new and old ferrous sulfate solution used in the tests.
36
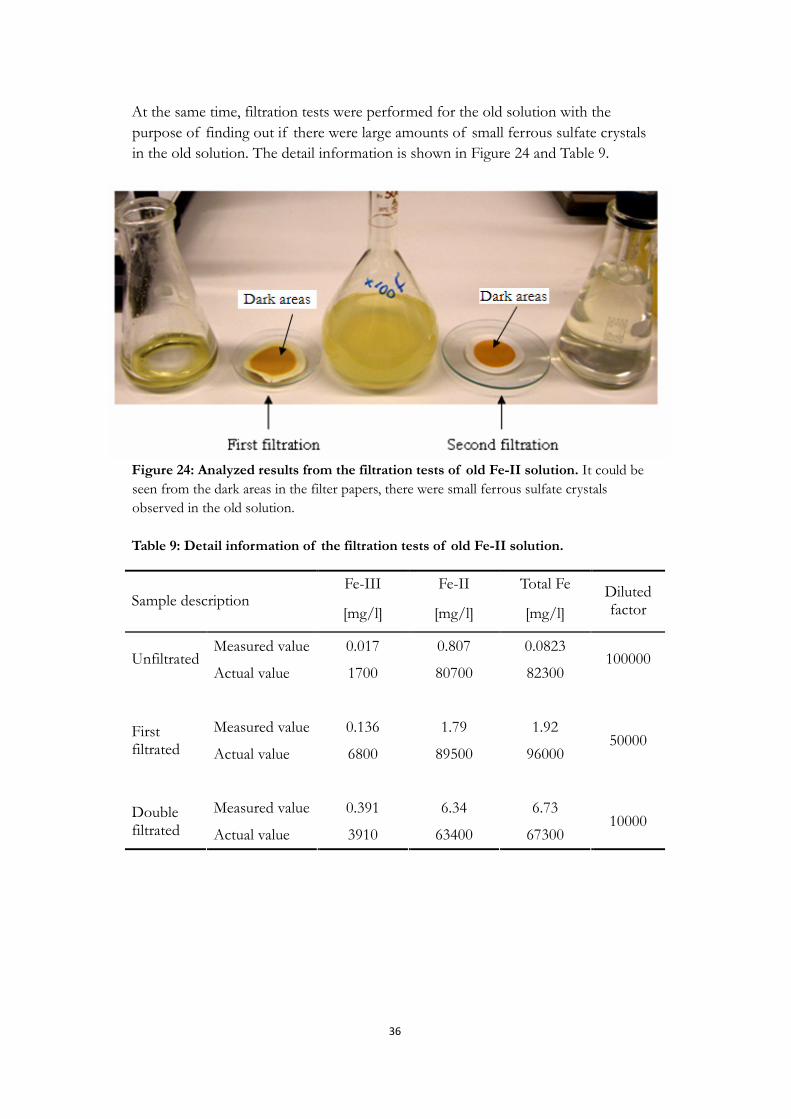
At the same time, filtration tests were performed for the old solution with the
purpose of finding out if there were large amounts of small ferrous sulfate crystals
in the old solution. The detail information is shown in Figure 24 and Table 9.
Figure 24: Analyzed results from the filtration tests of old Fe-II solution. It could be
seen from the dark areas in the filter papers, there were small ferrous sulfate crystals
observed in the old solution.
Table 9: Detail information of the filtration tests of old Fe-II solution.
Fe-III Fe-II Total Fe Sample description
[mg/l] [mg/l] [mg/l]
Diluted factor
Measured value 0.017 0.807 0.0823 Unfiltrated
Actual value 1700 80700 82300 100000
Measured value 0.136 1.79 1.92 First filtrated Actual value 6800 89500 96000
50000
Measured value 0.391 6.34 6.73 Double filtrated Actual value 3910 63400 67300
10000
37
5.2.5. The study of existing forms of iron in the wastewater
The added iron ions exist as different forms in the wastewater. It could be seen from Table 10, there was 0.8 mg/l total iron tested in the sample. However, there was only 0.173 mg/l existed as Fe-II and Fe-III forms after filtration. Thus, it could be drawn the conclusion that there was only a small part of iron ions dissolved in the sampling, most of the iron ions were attached to the suspended solids and flocs. Thus, much higher iron level was measured and observed in the unfiltrated sample (as shown in Appendix 11). Table 10: Comparison of dissolved iron and total iron in the wastewater.
Total iron tested in the sample: 0.8 mg /l Fe
Fe-II Fe-III Fe-II+Fe-III
After filtration [mg/l] 0.100 0.073 0.173
Wastewater: The raw wastewater after screening, Källby WWTP, 8 am 10th Dec. 2008 Filtration paper: GF C filters
It could be seen from Table 11 that much more Fe-II was measured in the unfiltrated sample compared with filtrated sample. This indicates that the attached iron ions are more difficult to be oxidized compared with dissolved ones (shown in Appendix 11). Table 11: Measured results of iron from filtrated sample and unfiltrated sample.
Aerated time Fe-II Fe-III Total Fe Sample description [minute] [mg/l] [mg/l] [mg/l]
Unfiltrated sample 18.5 2.95 3.79 6.74
Filtrated sample 19 0.693 0.943 1.64
Wastewater: The raw wastewater after screening, Sjölunda WWTP, 8 am 1st Dec. 2008 Filtration paper: Grade 1002
5.2.6. Sum-up of performed tests
It could be concluded that pH has a significant consequence on Fe-II oxidation. Neutral and weakly alkaline is optimum pH for oxidation while low pH inhibits the process. Figure 20 showed there was no Fe-II oxidation observed under high pH condition during the analyzed period, which might have two explanations. One could be as mentioned previously that in the presence of oxygen and high pH, the soluble Fe is converted to insoluble goethite (FeOOH) or ferrihydrite (Fe (OH) 3). Less Fe-II is oxidized into Fe-III and the precipitation was sufficiently rapid when the pH was above 7.5 (Rockne Karl, 2007). The other explanation could be less aeration time

38
required under higher pH condition documented by David B. Vance (1994). Since pH=8 was good for oxidation, almost all the oxidable iron ions were oxidized immediately after the dosing even though low oxygen level present (1.57 mg/l O2). Thus, no oxidation was observed later in the test.
However, uncompleted oxidation occurred in the mentioned tests where most of Fe-II still didn’t get oxidized. At the same time, it could be found out that there was always low oxidation efficiency achieved in the wastewater regardless of acceptable operational parameters (pH, temperature, DO) present. DO has significant influence on Fe-II oxidation as well. The initial oxygen level in the wastewater sampling might be insufficient, which inhibited the Fe-II oxidation at the moment when ferrous was added. It could be seen from Figure 21 and Table 7 that most of ferrous ions were oxidized in the first 3 minutes under high DO condition. There were less oxidation efficiency and much slower oxidation process under low oxygen level. As mentioned in the literature study that at least 0.14 grams of oxygen required for oxidation of each gram of Fe-II (Kemira, 2003), which means at least 0.8 mg/l was required in our case (Table 8, 5.10 mg/l Fe-II in the solution). During the analysis of low DO on Fe-II oxidation, 1.3-1.7 mg/l O2 was present in the whole test, which should completely fulfill the theoretical requirement for Fe-II oxidation. However, we could come to the conclusion by checking the measured results that much more oxygen is practically needed to achieve effective oxidation in the wastewater.
Figure 22 indicates there is significant effect of turbulence for Fe-II oxidation, higher
oxidation percentage achieved under high turbulence condition and less iron
hydroxides generated.
Concerning the effect caused by the chemical, it could be seen from Figure 23, there were lots of ferrous sulfate crystals in the old solution, which could not be oxidized and precipitated with phosphorus directly until these small-molecule crystals were dissolved in the sampling. Normally the crystal dissolve process takes 2-3 hours, thus there were lots of ferrous sulfate crystal in the sampling during the lab tests (normally takes less than 1 hour). However, during the measurement of Fe-II concentration in the sampling, LCK320 might take these small-molecule ferrous crystals as dissolved ferrous ions. Thus, there was Fe-II measured in the sampling but no Fe-II oxidation achieved in the aeration process since most of Fe-II was stay in crystal form. Figure 24 and Table 9 demonstrate the analyzed results from old Fe-II solution. It could be seen from Figure 24, the sample with first filtration got lot of turbidity again after about 10 minutes, lot of precipitations generated in the process. Thus, second filtration was performed to remove the particles. By comparing the measured results from Table 9, there were lots of small ferrous particles in the old solution.
39
5.3. Investigating of the effect of achieved oxidation on the subsequent flocculation performance
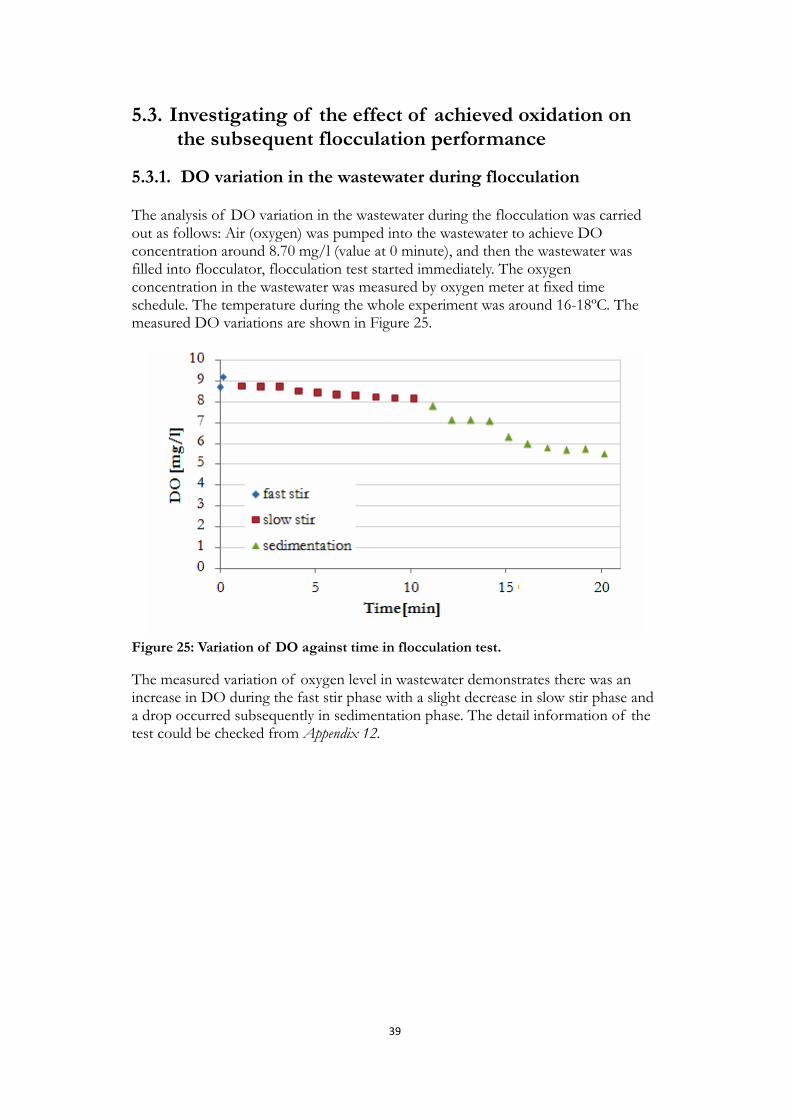
5.3.1. DO variation in the wastewater during flocculation
The analysis of DO variation in the wastewater during the flocculation was carried out as follows: Air (oxygen) was pumped into the wastewater to achieve DO concentration around 8.70 mg/l (value at 0 minute), and then the wastewater was filled into flocculator, flocculation test started immediately. The oxygen concentration in the wastewater was measured by oxygen meter at fixed time schedule. The temperature during the whole experiment was around 16-18ºC. The measured DO variations are shown in Figure 25.
Figure 25: Variation of DO against time in flocculation test.
The measured variation of oxygen level in wastewater demonstrates there was an increase in DO during the fast stir phase with a slight decrease in slow stir phase and a drop occurred subsequently in sedimentation phase. The detail information of the test could be checked from Appendix 12.
40
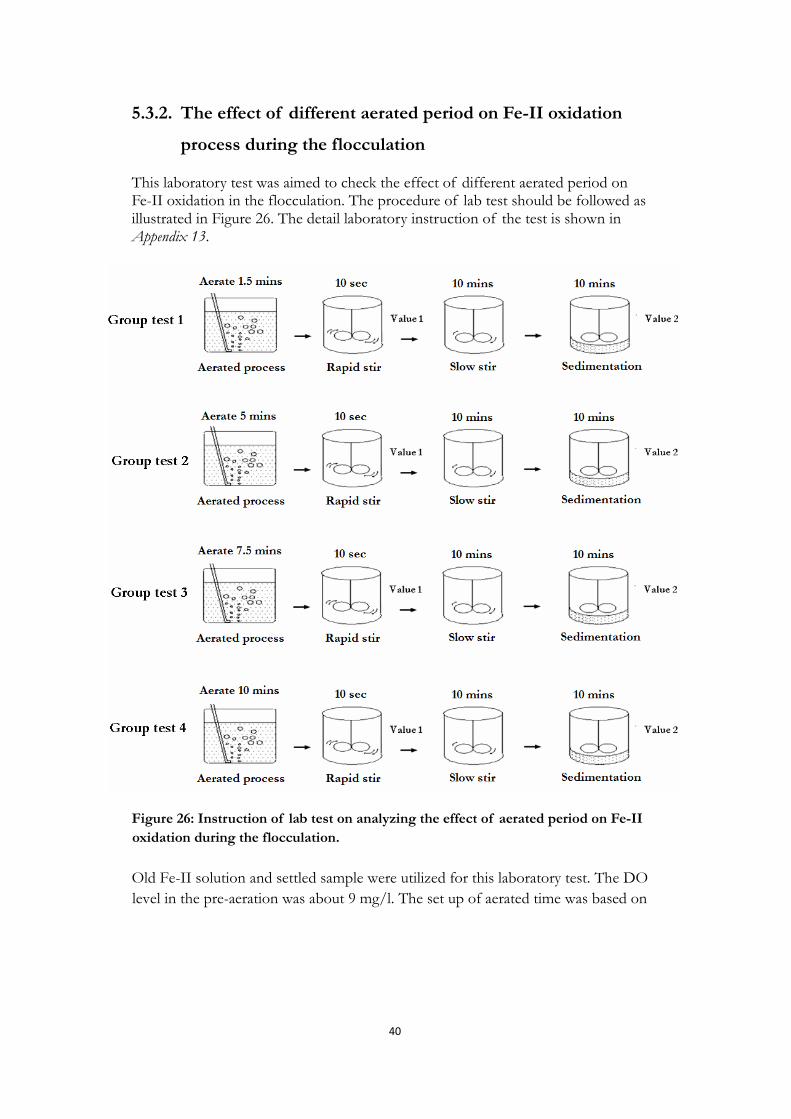
5.3.2. The effect of different aerated period on Fe-II oxidation
process during the flocculation
This laboratory test was aimed to check the effect of different aerated period on Fe-II oxidation in the flocculation. The procedure of lab test should be followed as illustrated in Figure 26. The detail laboratory instruction of the test is shown in Appendix 13.
Figure 26: Instruction of lab test on analyzing the effect of aerated period on Fe-II
oxidation during the flocculation.
Old Fe-II solution and settled sample were utilized for this laboratory test. The DO
level in the pre-aeration was about 9 mg/l. The set up of aerated time was based on
41
the previous analysis of Fe-II oxidation in wastewater. The achieved result are shown
in Table 12.
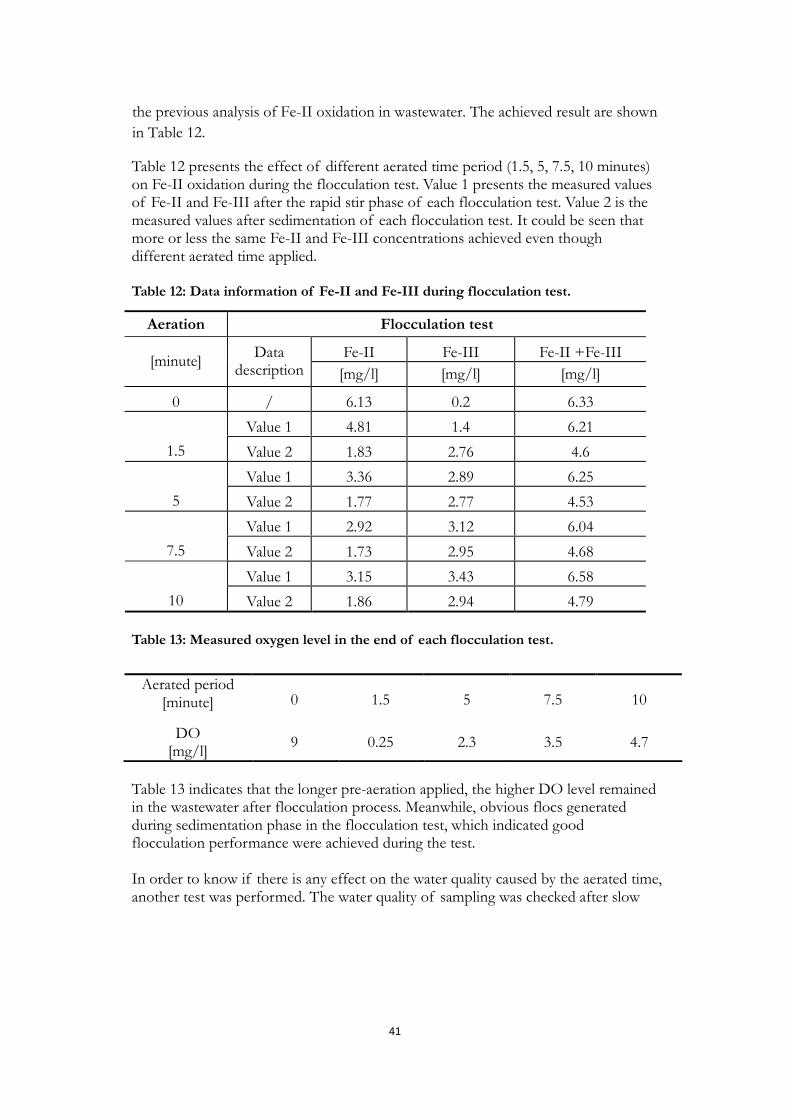
Table 12 presents the effect of different aerated time period (1.5, 5, 7.5, 10 minutes) on Fe-II oxidation during the flocculation test. Value 1 presents the measured values of Fe-II and Fe-III after the rapid stir phase of each flocculation test. Value 2 is the measured values after sedimentation of each flocculation test. It could be seen that more or less the same Fe-II and Fe-III concentrations achieved even though different aerated time applied. Table 12: Data information of Fe-II and Fe-III during flocculation test.
Table 13: Measured oxygen level in the end of each flocculation test.
Table 13 indicates that the longer pre-aeration applied, the higher DO level remained in the wastewater after flocculation process. Meanwhile, obvious flocs generated during sedimentation phase in the flocculation test, which indicated good flocculation performance were achieved during the test. In order to know if there is any effect on the water quality caused by the aerated time, another test was performed. The water quality of sampling was checked after slow
Aeration Flocculation test
Fe-II Fe-III Fe-II +Fe-III [minute]
Data description [mg/l] [mg/l] [mg/l]
0 / 6.13 0.2 6.33
Value 1 4.81 1.4 6.21
1.5 Value 2 1.83 2.76 4.6
Value 1 3.36 2.89 6.25
5 Value 2 1.77 2.77 4.53
Value 1 2.92 3.12 6.04
7.5 Value 2 1.73 2.95 4.68
Value 1 3.15 3.43 6.58
10 Value 2 1.86 2.94 4.79
Aerated period [minute] 0 1.5 5 7.5 10
DO [mg/l]
9 0.25 2.3 3.5 4.7
42
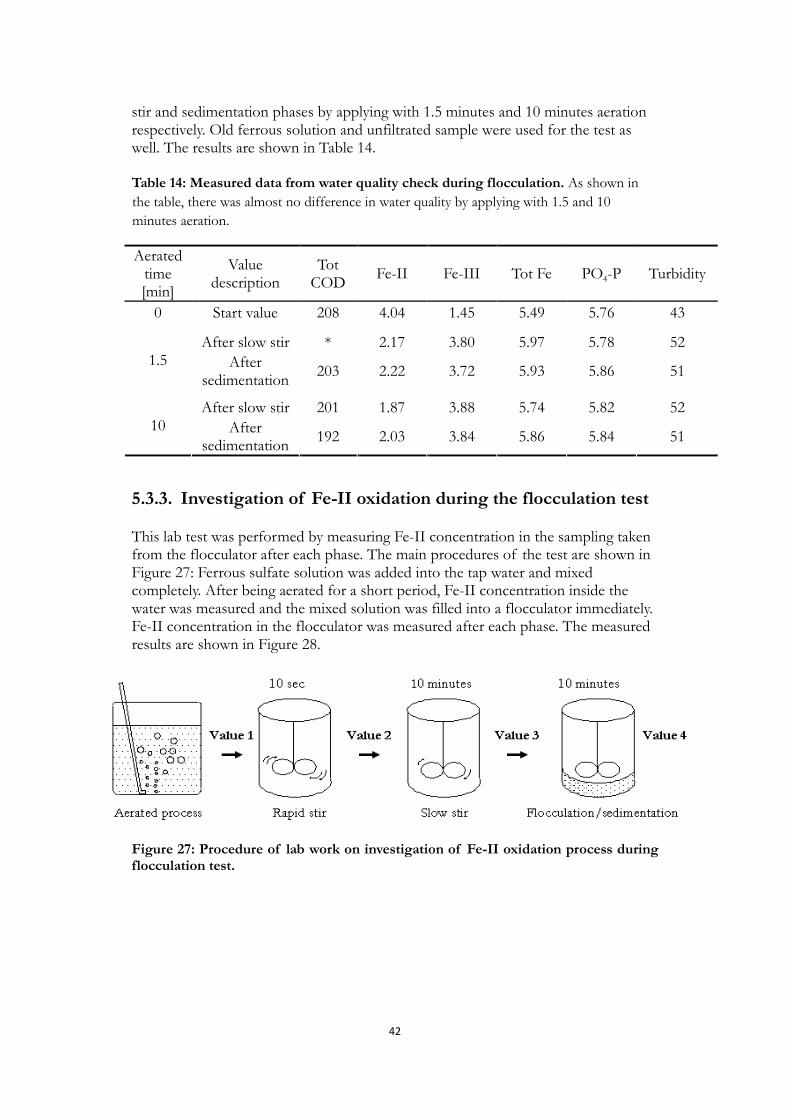
stir and sedimentation phases by applying with 1.5 minutes and 10 minutes aeration respectively. Old ferrous solution and unfiltrated sample were used for the test as well. The results are shown in Table 14. Table 14: Measured data from water quality check during flocculation. As shown in
the table, there was almost no difference in water quality by applying with 1.5 and 10
minutes aeration.
Aerated time [min]
Value description
Tot COD
Fe-II Fe-III Tot Fe PO4-P Turbidity
0 Start value 208 4.04 1.45 5.49 5.76 43
After slow stir * 2.17 3.80 5.97 5.78 52 1.5 After
sedimentation 203 2.22 3.72 5.93 5.86 51
After slow stir 201 1.87 3.88 5.74 5.82 52 10 After
sedimentation 192 2.03 3.84 5.86 5.84 51
5.3.3. Investigation of Fe-II oxidation during the flocculation test
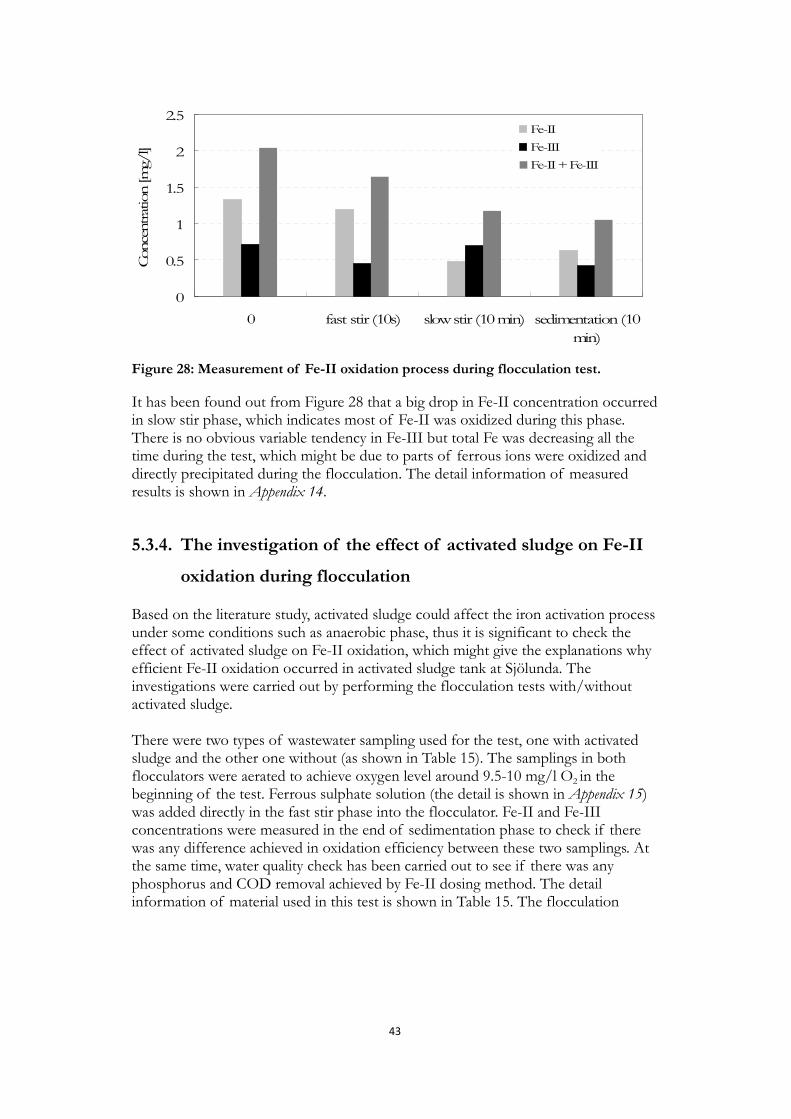
This lab test was performed by measuring Fe-II concentration in the sampling taken from the flocculator after each phase. The main procedures of the test are shown in Figure 27: Ferrous sulfate solution was added into the tap water and mixed completely. After being aerated for a short period, Fe-II concentration inside the water was measured and the mixed solution was filled into a flocculator immediately. Fe-II concentration in the flocculator was measured after each phase. The measured results are shown in Figure 28.
Figure 27: Procedure of lab work on investigation of Fe-II oxidation process during flocculation test.
43
0
0.5
1
1.5
2
2.5
0 fast stir (10s) slow stir (10 min) sedimentation (10
min)
Conce
ntration [mg/
l] ]
Fe-II
Fe-III
Fe-II + Fe-III
Figure 28: Measurement of Fe-II oxidation process during flocculation test.
It has been found out from Figure 28 that a big drop in Fe-II concentration occurred in slow stir phase, which indicates most of Fe-II was oxidized during this phase. There is no obvious variable tendency in Fe-III but total Fe was decreasing all the time during the test, which might be due to parts of ferrous ions were oxidized and directly precipitated during the flocculation. The detail information of measured results is shown in Appendix 14.
5.3.4. The investigation of the effect of activated sludge on Fe-II
oxidation during flocculation
Based on the literature study, activated sludge could affect the iron activation process under some conditions such as anaerobic phase, thus it is significant to check the effect of activated sludge on Fe-II oxidation, which might give the explanations why efficient Fe-II oxidation occurred in activated sludge tank at Sjölunda. The investigations were carried out by performing the flocculation tests with/without activated sludge. There were two types of wastewater sampling used for the test, one with activated sludge and the other one without (as shown in Table 15). The samplings in both flocculators were aerated to achieve oxygen level around 9.5-10 mg/l O2 in the beginning of the test. Ferrous sulphate solution (the detail is shown in Appendix 15) was added directly in the fast stir phase into the flocculator. Fe-II and Fe-III concentrations were measured in the end of sedimentation phase to check if there was any difference achieved in oxidation efficiency between these two samplings. At the same time, water quality check has been carried out to see if there was any phosphorus and COD removal achieved by Fe-II dosing method. The detail information of material used in this test is shown in Table 15. The flocculation
44
performances achieved after sedimentation phase for both samplings are shown in Figure 29. The details of the measured results are shown in Figure 30 and Table 16.
Table 15: Information of material used in the investigation of the effect of activated
sludge on Fe-II oxidation.
pH Temp. DO when Fe-II added
Water sampling
Dimensionless ºC mg/l
Flocculation test time set up
Wastewater 8.03 16.5 9.5-10
Activated sludge
7.78 16 9.5-10
Fast stir: 20s Slow stir: 10mins Sedimentation: 10mins
Wastewater: wastewater after screening, Källby WWTP in Lund, 25th Nov. 2008
Activated sludge: activated sludge in the activated sludge tank, Källby WWTP in Lund, 25th Nov. 2008. The suspend solids concentration of the sampling is about 3200mg SS/l
Fe-II solution: freshly made ferrous sulfate solution, 25th Nov. 2008
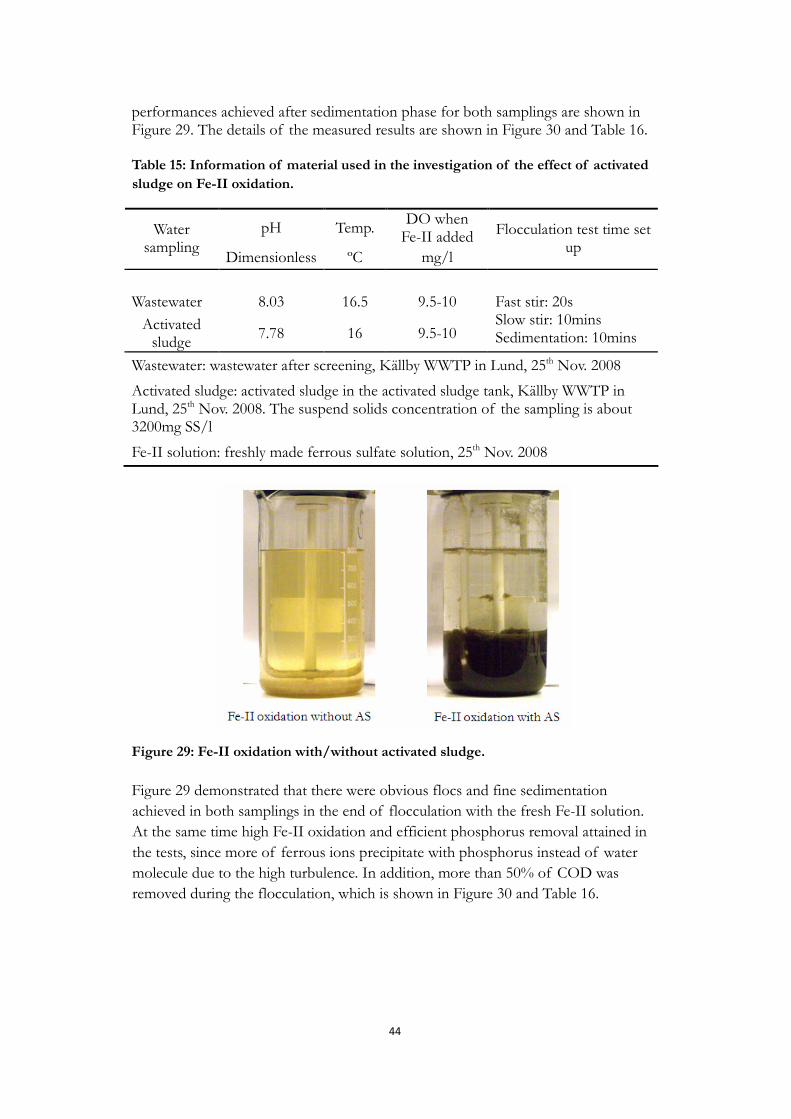
Figure 29: Fe-II oxidation with/without activated sludge.
Figure 29 demonstrated that there were obvious flocs and fine sedimentation
achieved in both samplings in the end of flocculation with the fresh Fe-II solution.
At the same time high Fe-II oxidation and efficient phosphorus removal attained in
the tests, since more of ferrous ions precipitate with phosphorus instead of water
molecule due to the high turbulence. In addition, more than 50% of COD was
removed during the flocculation, which is shown in Figure 30 and Table 16.
45
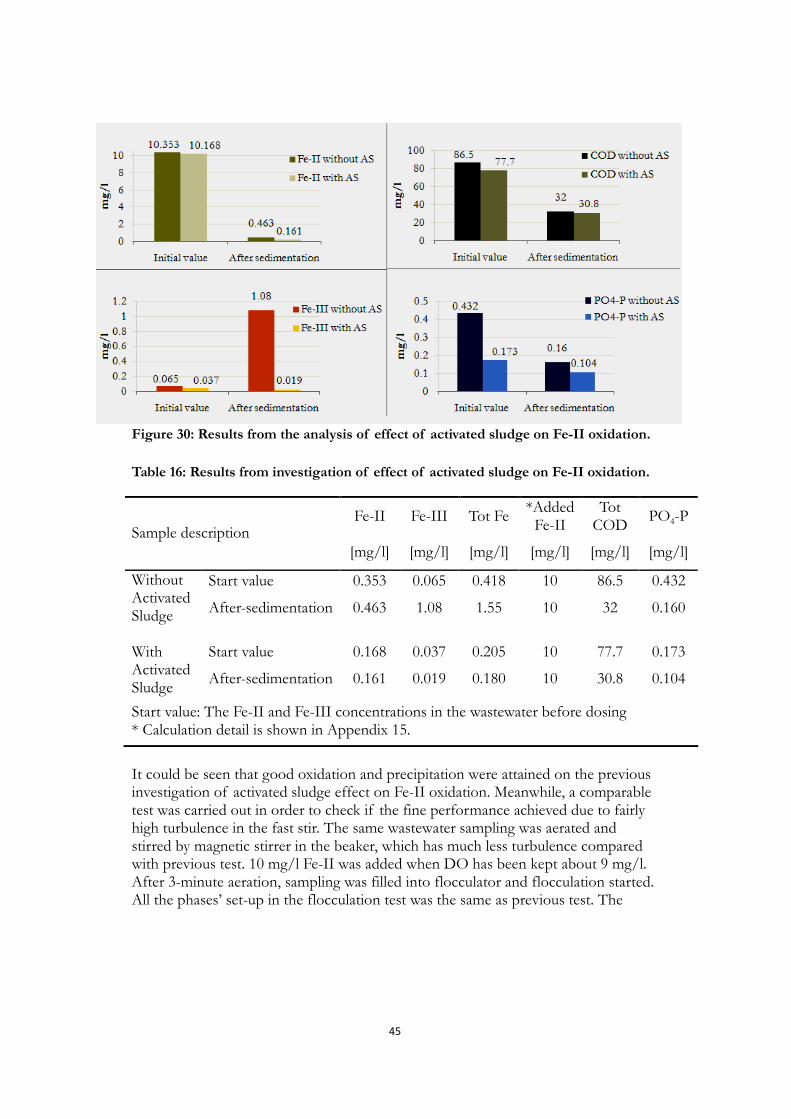
Figure 30: Results from the analysis of effect of activated sludge on Fe-II oxidation.
Table 16: Results from investigation of effect of activated sludge on Fe-II oxidation.
Fe-II Fe-III Tot Fe *Added Fe-II
Tot COD
PO4-P Sample description
[mg/l] [mg/l] [mg/l] [mg/l] [mg/l] [mg/l]
Start value 0.353 0.065 0.418 10 86.5 0.432 Without Activated Sludge
After-sedimentation 0.463 1.08 1.55 10 32 0.160
Start value 0.168 0.037 0.205 10 77.7 0.173 With
Activated Sludge
After-sedimentation 0.161 0.019 0.180 10 30.8 0.104
Start value: The Fe-II and Fe-III concentrations in the wastewater before dosing * Calculation detail is shown in Appendix 15.
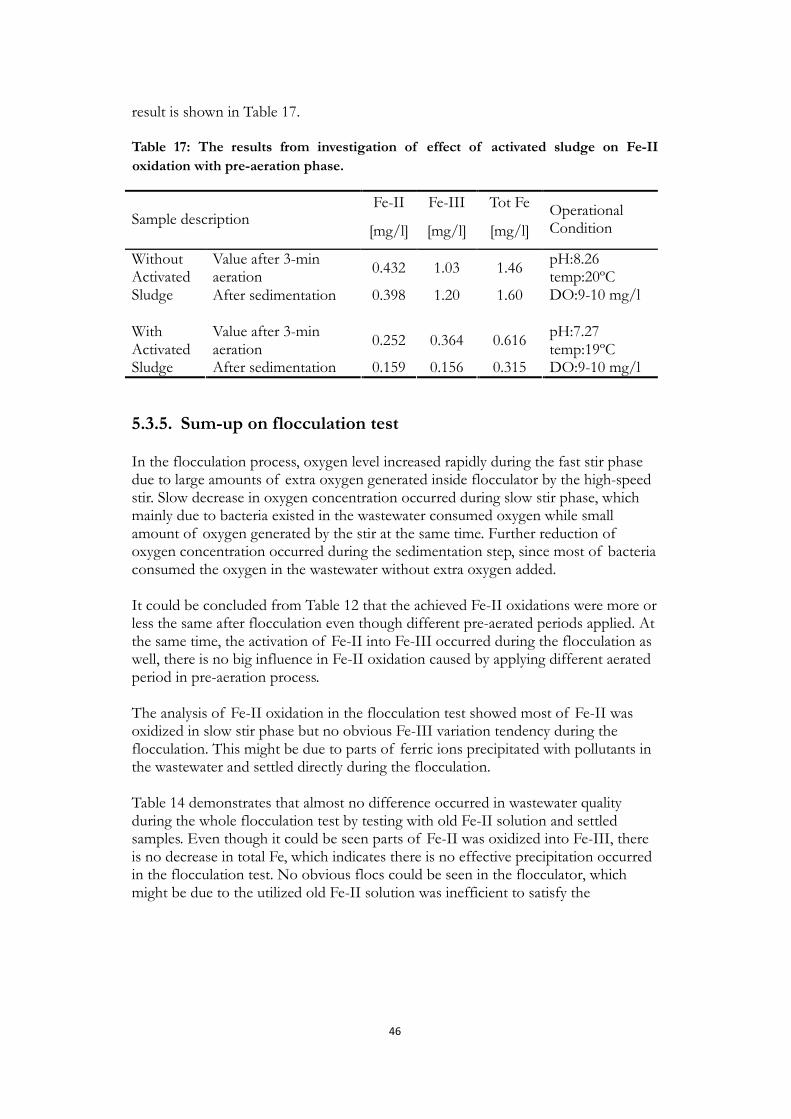
It could be seen that good oxidation and precipitation were attained on the previous investigation of activated sludge effect on Fe-II oxidation. Meanwhile, a comparable test was carried out in order to check if the fine performance achieved due to fairly high turbulence in the fast stir. The same wastewater sampling was aerated and stirred by magnetic stirrer in the beaker, which has much less turbulence compared with previous test. 10 mg/l Fe-II was added when DO has been kept about 9 mg/l. After 3-minute aeration, sampling was filled into flocculator and flocculation started. All the phases’ set-up in the flocculation test was the same as previous test. The
46
result is shown in Table 17. Table 17: The results from investigation of effect of activated sludge on Fe-II
oxidation with pre-aeration phase.
Fe-II Fe-III Tot Fe Sample description
[mg/l] [mg/l] [mg/l]
Operational Condition
Value after 3-min aeration
0.432 1.03 1.46 Without Activated Sludge After sedimentation 0.398 1.20 1.60
pH:8.26 temp:20ºC DO:9-10 mg/l
Value after 3-min aeration
0.252 0.364 0.616 With Activated Sludge After sedimentation 0.159 0.156 0.315
pH:7.27 temp:19ºC DO:9-10 mg/l
5.3.5. Sum-up on flocculation test
In the flocculation process, oxygen level increased rapidly during the fast stir phase due to large amounts of extra oxygen generated inside flocculator by the high-speed stir. Slow decrease in oxygen concentration occurred during slow stir phase, which mainly due to bacteria existed in the wastewater consumed oxygen while small amount of oxygen generated by the stir at the same time. Further reduction of oxygen concentration occurred during the sedimentation step, since most of bacteria consumed the oxygen in the wastewater without extra oxygen added. It could be concluded from Table 12 that the achieved Fe-II oxidations were more or less the same after flocculation even though different pre-aerated periods applied. At the same time, the activation of Fe-II into Fe-III occurred during the flocculation as well, there is no big influence in Fe-II oxidation caused by applying different aerated period in pre-aeration process. The analysis of Fe-II oxidation in the flocculation test showed most of Fe-II was oxidized in slow stir phase but no obvious Fe-III variation tendency during the flocculation. This might be due to parts of ferric ions precipitated with pollutants in the wastewater and settled directly during the flocculation. Table 14 demonstrates that almost no difference occurred in wastewater quality during the whole flocculation test by testing with old Fe-II solution and settled samples. Even though it could be seen parts of Fe-II was oxidized into Fe-III, there is no decrease in total Fe, which indicates there is no effective precipitation occurred in the flocculation test. No obvious flocs could be seen in the flocculator, which might be due to the utilized old Fe-II solution was inefficient to satisfy the
47
precipitation with phosphorus. On the other hand, the set-up time of each phase in the flocculation (10-minute slow stir and 10-minute sedimentation) might be not long enough for flocs forming. Appendix 16 shows the recheck of flocculation test by filtrated sample. Similar oxidation efficiencies were achieved in the end of the flocculation again. Even though filtrated sample applied for testing, there was still no significant influence caused by the different pre-aerated time scale. Effective phosphorus and COD removal present in the study of the effect of
activated sludge on Fe-II oxidation. Better oxidation performance and water-treat
efficiency achieved with activated sludge as shown in Figure 30. Furthermore, Table
16 and Table 17 present more or less the same treated results from both flocculation
tests, which indicate that the turbulence generated by the magnetic stirrer and
aeration is high enough to comply with an effective utilization of applied chemical
salt (ferrous sulfate). Thus, the turbulence generated in the pre-aeration process at
Sjölunda WWTP was acceptable for Fe-II oxidation.

48
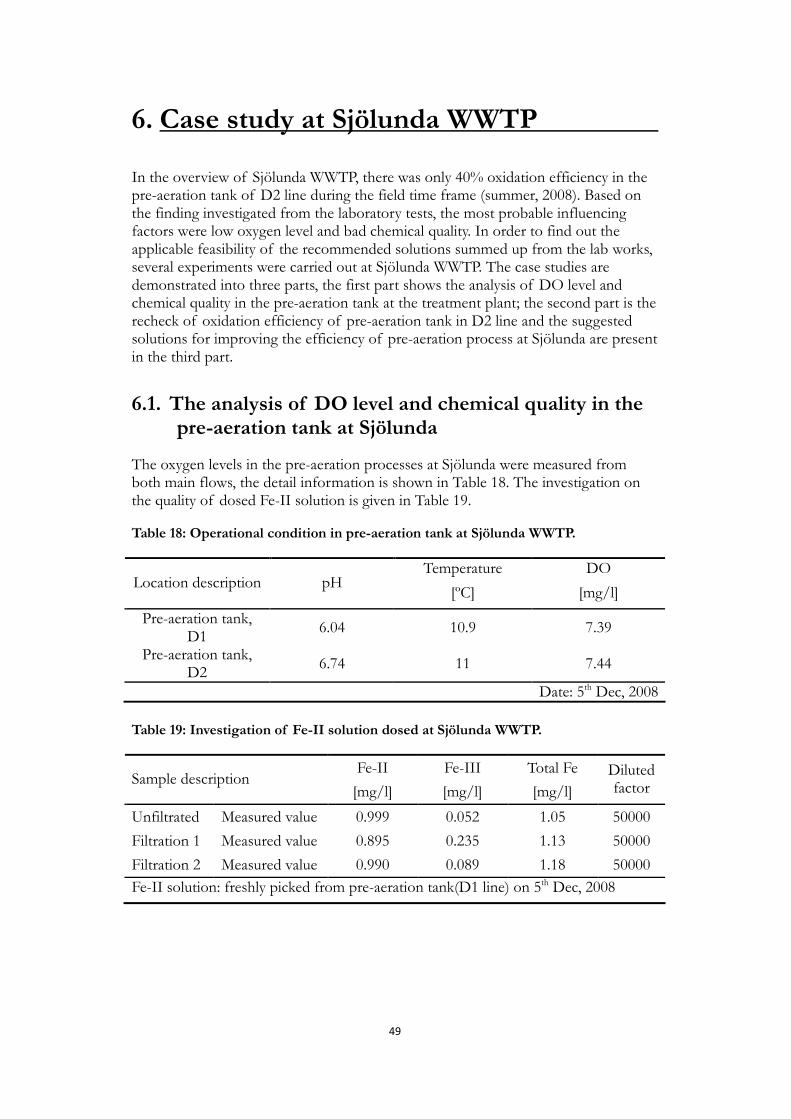
49
6. Case study at Sjölunda WWTP
In the overview of Sjölunda WWTP, there was only 40% oxidation efficiency in the pre-aeration tank of D2 line during the field time frame (summer, 2008). Based on the finding investigated from the laboratory tests, the most probable influencing factors were low oxygen level and bad chemical quality. In order to find out the applicable feasibility of the recommended solutions summed up from the lab works, several experiments were carried out at Sjölunda WWTP. The case studies are demonstrated into three parts, the first part shows the analysis of DO level and chemical quality in the pre-aeration tank at the treatment plant; the second part is the recheck of oxidation efficiency of pre-aeration tank in D2 line and the suggested solutions for improving the efficiency of pre-aeration process at Sjölunda are present in the third part.
6.1. The analysis of DO level and chemical quality in the pre-aeration tank at Sjölunda
The oxygen levels in the pre-aeration processes at Sjölunda were measured from both main flows, the detail information is shown in Table 18. The investigation on the quality of dosed Fe-II solution is given in Table 19. Table 18: Operational condition in pre-aeration tank at Sjölunda WWTP.
Temperature DO Location description pH
[ºC] [mg/l]
Pre-aeration tank, D1
6.04 10.9 7.39
Pre-aeration tank, D2
6.74 11 7.44
Date: 5th Dec, 2008
Table 19: Investigation of Fe-II solution dosed at Sjölunda WWTP.
Fe-II Fe-III Total Fe Sample description
[mg/l] [mg/l] [mg/l]
Diluted factor
Unfiltrated Measured value 0.999 0.052 1.05 50000
Filtration 1 Measured value 0.895 0.235 1.13 50000
Filtration 2 Measured value 0.990 0.089 1.18 50000
Fe-II solution: freshly picked from pre-aeration tank(D1 line) on 5th Dec, 2008
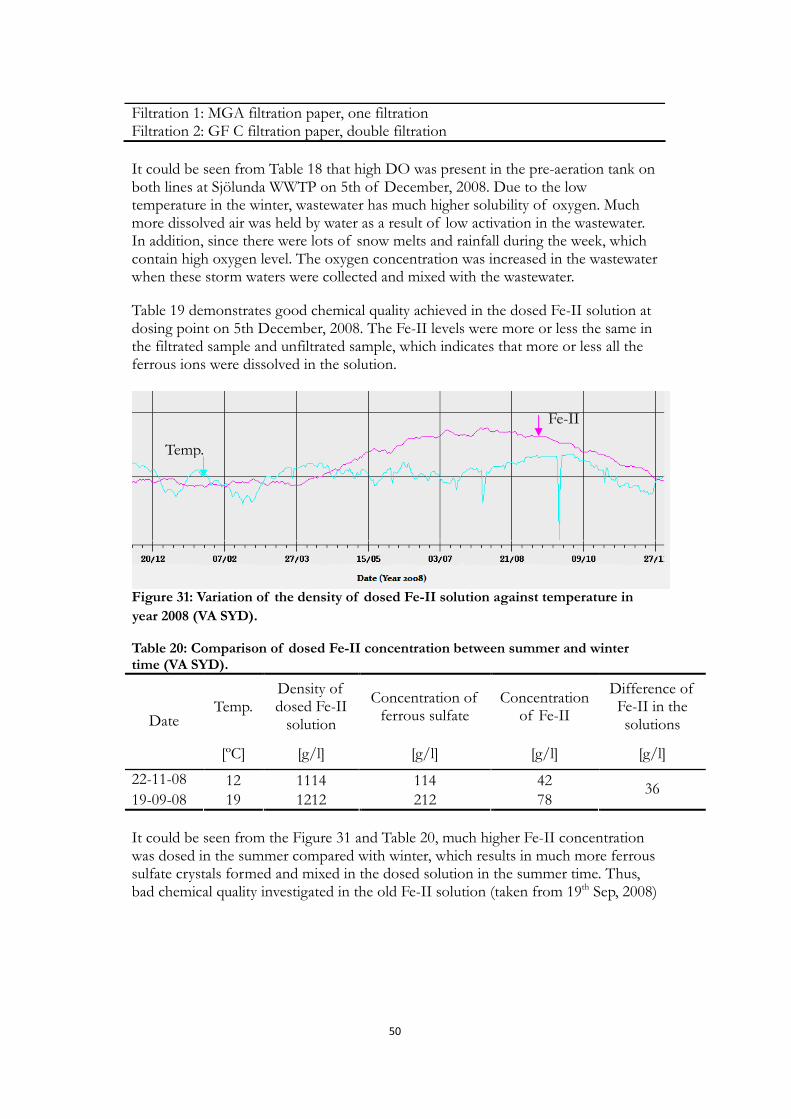
50
Filtration 1: MGA filtration paper, one filtration Filtration 2: GF C filtration paper, double filtration
It could be seen from Table 18 that high DO was present in the pre-aeration tank on both lines at Sjölunda WWTP on 5th of December, 2008. Due to the low temperature in the winter, wastewater has much higher solubility of oxygen. Much more dissolved air was held by water as a result of low activation in the wastewater. In addition, since there were lots of snow melts and rainfall during the week, which contain high oxygen level. The oxygen concentration was increased in the wastewater when these storm waters were collected and mixed with the wastewater.
Table 19 demonstrates good chemical quality achieved in the dosed Fe-II solution at dosing point on 5th December, 2008. The Fe-II levels were more or less the same in the filtrated sample and unfiltrated sample, which indicates that more or less all the ferrous ions were dissolved in the solution.
Figure 31: Variation of the density of dosed Fe-II solution against temperature in
year 2008 (VA SYD).
Table 20: Comparison of dosed Fe-II concentration between summer and winter time (VA SYD).
Temp. Density of dosed Fe-II
solution
Concentration of ferrous sulfate
Concentration of Fe-II
Difference of Fe-II in the solutions Date
[ºC] [g/l] [g/l] [g/l] [g/l]
22-11-08 12 1114 114 42
19-09-08 19 1212 212 78 36
It could be seen from the Figure 31 and Table 20, much higher Fe-II concentration was dosed in the summer compared with winter, which results in much more ferrous sulfate crystals formed and mixed in the dosed solution in the summer time. Thus, bad chemical quality investigated in the old Fe-II solution (taken from 19th Sep, 2008)
Fe-II
Temp.
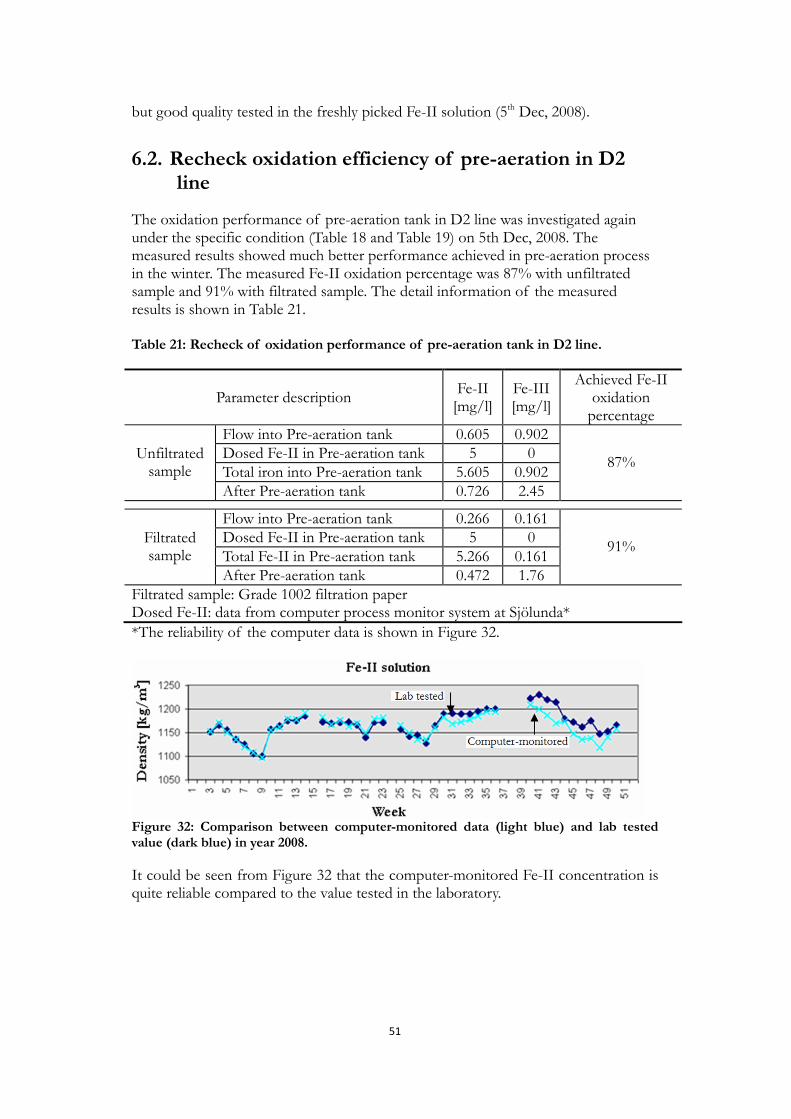
51
but good quality tested in the freshly picked Fe-II solution (5th Dec, 2008).
6.2. Recheck oxidation efficiency of pre-aeration in D2 line
The oxidation performance of pre-aeration tank in D2 line was investigated again under the specific condition (Table 18 and Table 19) on 5th Dec, 2008. The measured results showed much better performance achieved in pre-aeration process in the winter. The measured Fe-II oxidation percentage was 87% with unfiltrated sample and 91% with filtrated sample. The detail information of the measured results is shown in Table 21. Table 21: Recheck of oxidation performance of pre-aeration tank in D2 line.
Parameter description Fe-II [mg/l]
Fe-III [mg/l]
Achieved Fe-II oxidation percentage
Flow into Pre-aeration tank 0.605 0.902 Dosed Fe-II in Pre-aeration tank 5 0 Total iron into Pre-aeration tank 5.605 0.902
Unfiltrated sample
After Pre-aeration tank 0.726 2.45
87%
Flow into Pre-aeration tank 0.266 0.161 Dosed Fe-II in Pre-aeration tank 5 0 Total Fe-II in Pre-aeration tank 5.266 0.161
Filtrated sample
After Pre-aeration tank 0.472 1.76
91%
Filtrated sample: Grade 1002 filtration paper Dosed Fe-II: data from computer process monitor system at Sjölunda*
*The reliability of the computer data is shown in Figure 32.
Figure 32: Comparison between computer-monitored data (light blue) and lab tested value (dark blue) in year 2008.
It could be seen from Figure 32 that the computer-monitored Fe-II concentration is quite reliable compared to the value tested in the laboratory.
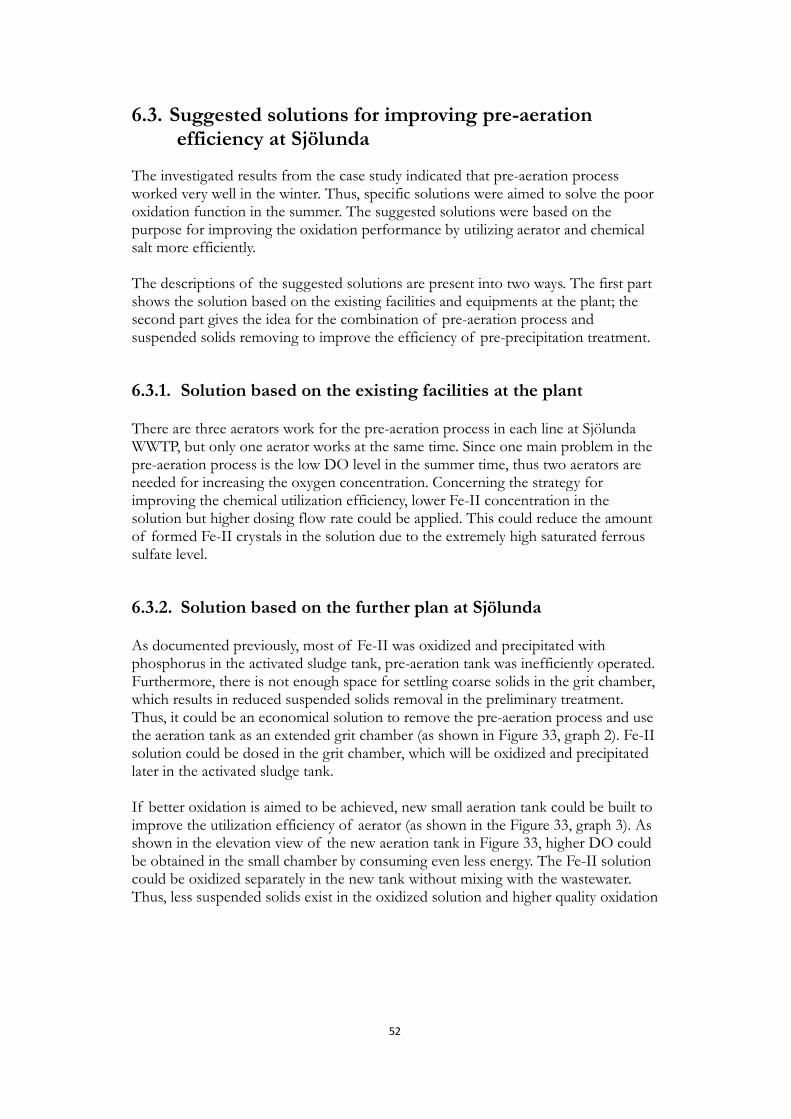
52
6.3. Suggested solutions for improving pre-aeration efficiency at Sjölunda
The investigated results from the case study indicated that pre-aeration process worked very well in the winter. Thus, specific solutions were aimed to solve the poor oxidation function in the summer. The suggested solutions were based on the purpose for improving the oxidation performance by utilizing aerator and chemical salt more efficiently. The descriptions of the suggested solutions are present into two ways. The first part shows the solution based on the existing facilities and equipments at the plant; the second part gives the idea for the combination of pre-aeration process and suspended solids removing to improve the efficiency of pre-precipitation treatment.
6.3.1. Solution based on the existing facilities at the plant
There are three aerators work for the pre-aeration process in each line at Sjölunda WWTP, but only one aerator works at the same time. Since one main problem in the pre-aeration process is the low DO level in the summer time, thus two aerators are needed for increasing the oxygen concentration. Concerning the strategy for improving the chemical utilization efficiency, lower Fe-II concentration in the solution but higher dosing flow rate could be applied. This could reduce the amount of formed Fe-II crystals in the solution due to the extremely high saturated ferrous sulfate level.
6.3.2. Solution based on the further plan at Sjölunda
As documented previously, most of Fe-II was oxidized and precipitated with phosphorus in the activated sludge tank, pre-aeration tank was inefficiently operated. Furthermore, there is not enough space for settling coarse solids in the grit chamber, which results in reduced suspended solids removal in the preliminary treatment. Thus, it could be an economical solution to remove the pre-aeration process and use the aeration tank as an extended grit chamber (as shown in Figure 33, graph 2). Fe-II solution could be dosed in the grit chamber, which will be oxidized and precipitated later in the activated sludge tank. If better oxidation is aimed to be achieved, new small aeration tank could be built to improve the utilization efficiency of aerator (as shown in the Figure 33, graph 3). As shown in the elevation view of the new aeration tank in Figure 33, higher DO could be obtained in the small chamber by consuming even less energy. The Fe-II solution could be oxidized separately in the new tank without mixing with the wastewater. Thus, less suspended solids exist in the oxidized solution and higher quality oxidation
53
could be achieved. The on-line DO and pH meter monitor the operational condition (pH, DO) in the tank. When the Fe-II solution was properly oxidized, it will be pumped to the grit chamber and precipitate with phosphorus in the primary sedimentation tank.
Figure 33: Scheme of the pre-aeration process at Sjölunda WWTP.

54
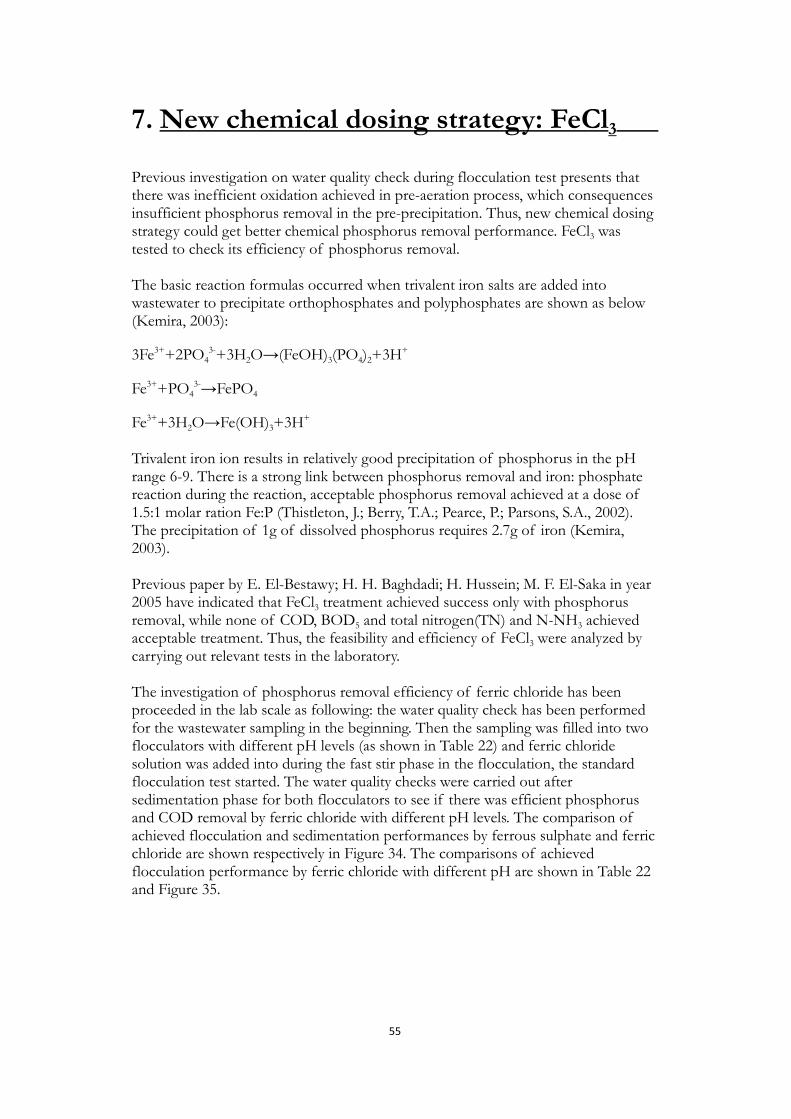
55
7. New chemical dosing strategy: FeCl3
Previous investigation on water quality check during flocculation test presents that there was inefficient oxidation achieved in pre-aeration process, which consequences insufficient phosphorus removal in the pre-precipitation. Thus, new chemical dosing strategy could get better chemical phosphorus removal performance. FeCl3 was tested to check its efficiency of phosphorus removal. The basic reaction formulas occurred when trivalent iron salts are added into wastewater to precipitate orthophosphates and polyphosphates are shown as below (Kemira, 2003):
3Fe3++2PO43-+3H2O→(FeOH)3(PO4)2+3H+
Fe3++PO43-→FePO4
Fe3++3H2O→Fe(OH)3+3H+ Trivalent iron ion results in relatively good precipitation of phosphorus in the pH range 6-9. There is a strong link between phosphorus removal and iron: phosphate reaction during the reaction, acceptable phosphorus removal achieved at a dose of 1.5:1 molar ration Fe:P (Thistleton, J.; Berry, T.A.; Pearce, P.; Parsons, S.A., 2002). The precipitation of 1g of dissolved phosphorus requires 2.7g of iron (Kemira, 2003). Previous paper by E. El-Bestawy; H. H. Baghdadi; H. Hussein; M. F. El-Saka in year 2005 have indicated that FeCl3 treatment achieved success only with phosphorus removal, while none of COD, BOD5 and total nitrogen(TN) and N-NH3 achieved acceptable treatment. Thus, the feasibility and efficiency of FeCl3 were analyzed by carrying out relevant tests in the laboratory. The investigation of phosphorus removal efficiency of ferric chloride has been proceeded in the lab scale as following: the water quality check has been performed for the wastewater sampling in the beginning. Then the sampling was filled into two flocculators with different pH levels (as shown in Table 22) and ferric chloride solution was added into during the fast stir phase in the flocculation, the standard flocculation test started. The water quality checks were carried out after sedimentation phase for both flocculators to see if there was efficient phosphorus and COD removal by ferric chloride with different pH levels. The comparison of achieved flocculation and sedimentation performances by ferrous sulphate and ferric chloride are shown respectively in Figure 34. The comparisons of achieved flocculation performance by ferric chloride with different pH are shown in Table 22 and Figure 35.
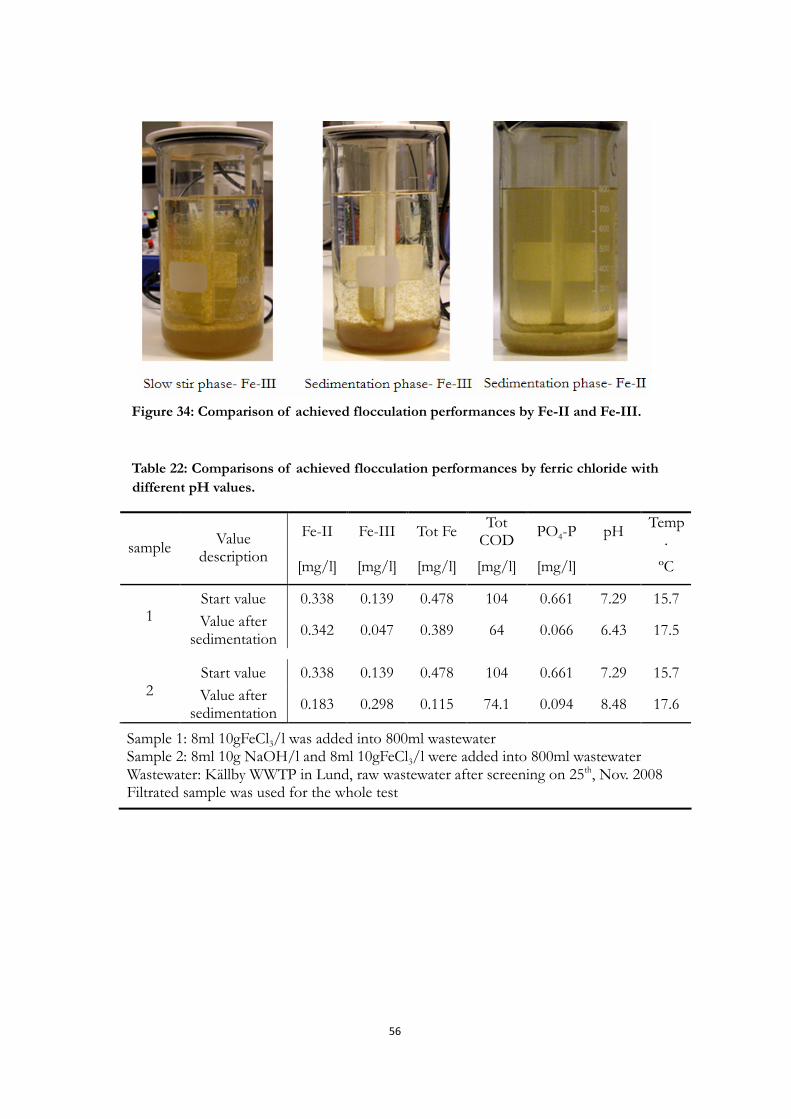
56
Figure 34: Comparison of achieved flocculation performances by Fe-II and Fe-III.
Table 22: Comparisons of achieved flocculation performances by ferric chloride with
different pH values.
Fe-II Fe-III Tot Fe Tot
COD PO4-P pH
Temp. sample
Value description
[mg/l] [mg/l] [mg/l] [mg/l] [mg/l] ºC
Start value 0.338 0.139 0.478 104 0.661 7.29 15.7 1 Value after
sedimentation 0.342 0.047 0.389 64 0.066 6.43 17.5
Start value 0.338 0.139 0.478 104 0.661 7.29 15.7 2 Value after
sedimentation 0.183 0.298 0.115 74.1 0.094 8.48 17.6
Sample 1: 8ml 10gFeCl3/l was added into 800ml wastewater Sample 2: 8ml 10g NaOH/l and 8ml 10gFeCl3/l were added into 800ml wastewater Wastewater: Källby WWTP in Lund, raw wastewater after screening on 25th, Nov. 2008 Filtrated sample was used for the whole test

57
Figure 35: Achieved COD and phosphorus removal by ferric chloride.
It could be seen from Table 22 that more or less the same work performance achieved in the two tests. Thus, we could get conclusions that ferric chloride works well in its acceptable pH range, there is no significant effect on the flocculation caused by pH difference. Better precipitation performance was achieved by ferric chloride in the comparisons of the flocculation performance obtained by using ferric and ferrous. In the investigation of Fe-III dosing strategy(ferric chloride), high efficiency achieved in phosphorus removal but low level COD reduction in the flocculation process. It could be seen from Figure 34, better water quality and less turbidity in the treated sampling obtained from ferric chloride compare with ferrous sulphate. At the same time, ferric chloride has much higher work stability in precipitating phosphorus, less process and operation control needed for the flocculation, such as DO level and pH control. The investigation of applying ferric chloride in the full scale process hasn’t been investigated yet. However, acceptable treated quality was achieved by ferrous sulphate in the laboratory test as well. Previous economical investigation indicated that much lower costs was needed for Fe-II dosing method (666.3SEK/ ton ferrous sulphate crystal) compared with Fe-III dosing strategy, which cost 850 SEK/ ton ferric chloride (Qianqian Zhou, 2008). In order to gain higher economic benefit, Fe-II dosing strategy could be recommended for the pre-precipitation treatment process if acceptable treated efficiency achieved in the full-scale.

58
59
8. Discussion
The outcomes from the investigation of the required time for effective Fe-II oxidation in wastewater showed that low oxidation was present over the long-time aeration. Thus, the influencing factors of Fe-II oxidation have been analyzed respectively in the laboratory to figure out the poor oxidation reasons. It has been indicated that acceptable pH, DO and turbulence conditions during the aeration process were significant for the efficient oxidation. Meanwhile, pH and turbulence were reasonable in the performed pre-aeration tests. Totally different oxidation performances were achieved in the later laboratory tests, which are shown in Table 23. By compared the operational conditions present in the previous and later laboratory tests, it has been found out the utilized Fe-II solution and different initial DO level might be the reasonable causes of the poor oxidation. Comparisons of the operational conditions between the pre-lab tests and later laboratory works are shown in Table 24 and Table 25. Table 23: Comparisons of the work performance between previous and new tests.
Test description Achieved work performance
Previous Tests: Tests performed with old Fe-II solution and low start DO level
Low oxidation achieved in wastewater No obvious flocculation observed No phosphorus removal achieved
New Tests: Tests performed with new Fe-II solution and high start DO level
High Fe-II oxidation efficiency achieved Obvious flocs and fine sedimentation Effective phosphorus and COD removal
Table 24: Sameness of operational conditions between previous and new tests.
Sameness
pH More or less the same in used wastewater sampling: pH=7.5-8.5
Temperature All the temperature acceptable for oxidation: 15-25ºC
Wastewater type
Sjölunda WWTP, Malmö Källby WWWTP, Lund
Turbulence Almost same turbulence generated by magnetic stirrer and aeration, and high enough for oxidation and precipitation
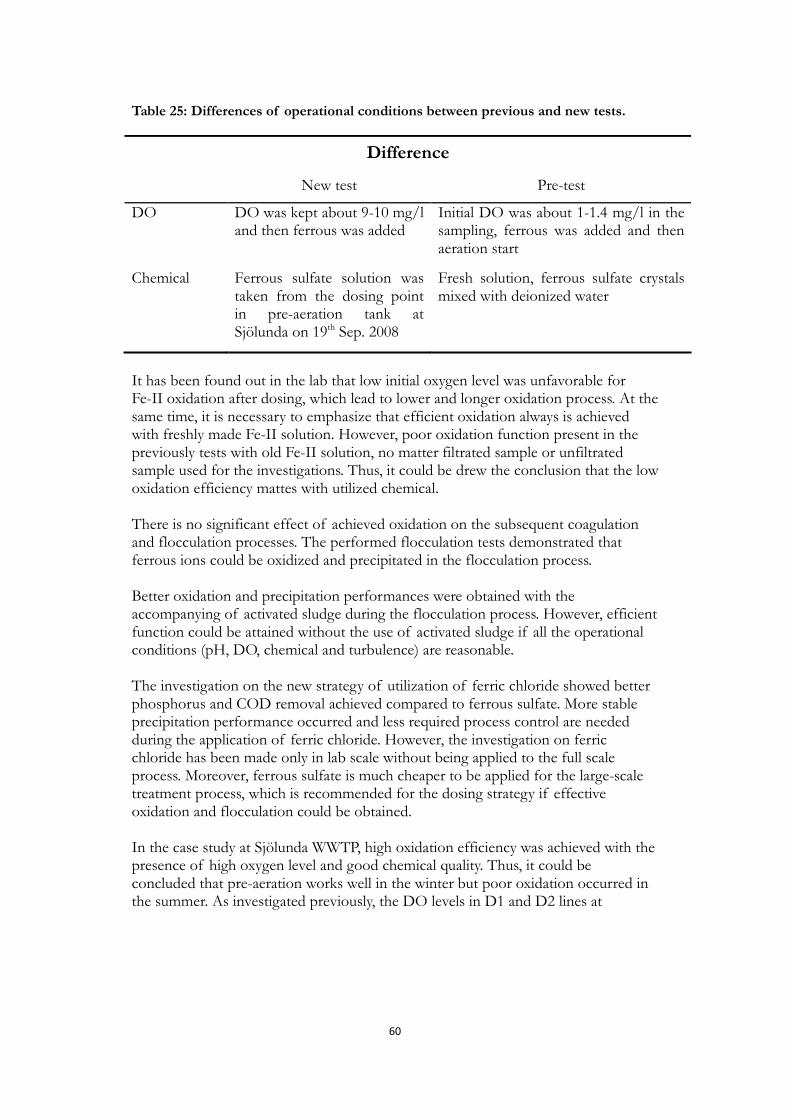
60
Table 25: Differences of operational conditions between previous and new tests.
Difference
New test Pre-test
DO DO was kept about 9-10 mg/l and then ferrous was added
Initial DO was about 1-1.4 mg/l in the sampling, ferrous was added and then aeration start
Chemical Ferrous sulfate solution was taken from the dosing point in pre-aeration tank at Sjölunda on 19th Sep. 2008
Fresh solution, ferrous sulfate crystals mixed with deionized water
It has been found out in the lab that low initial oxygen level was unfavorable for Fe-II oxidation after dosing, which lead to lower and longer oxidation process. At the same time, it is necessary to emphasize that efficient oxidation always is achieved with freshly made Fe-II solution. However, poor oxidation function present in the previously tests with old Fe-II solution, no matter filtrated sample or unfiltrated sample used for the investigations. Thus, it could be drew the conclusion that the low oxidation efficiency mattes with utilized chemical. There is no significant effect of achieved oxidation on the subsequent coagulation and flocculation processes. The performed flocculation tests demonstrated that ferrous ions could be oxidized and precipitated in the flocculation process. Better oxidation and precipitation performances were obtained with the accompanying of activated sludge during the flocculation process. However, efficient function could be attained without the use of activated sludge if all the operational conditions (pH, DO, chemical and turbulence) are reasonable. The investigation on the new strategy of utilization of ferric chloride showed better phosphorus and COD removal achieved compared to ferrous sulfate. More stable precipitation performance occurred and less required process control are needed during the application of ferric chloride. However, the investigation on ferric chloride has been made only in lab scale without being applied to the full scale process. Moreover, ferrous sulfate is much cheaper to be applied for the large-scale treatment process, which is recommended for the dosing strategy if effective oxidation and flocculation could be obtained. In the case study at Sjölunda WWTP, high oxidation efficiency was achieved with the presence of high oxygen level and good chemical quality. Thus, it could be concluded that pre-aeration works well in the winter but poor oxidation occurred in the summer. As investigated previously, the DO levels in D1 and D2 lines at
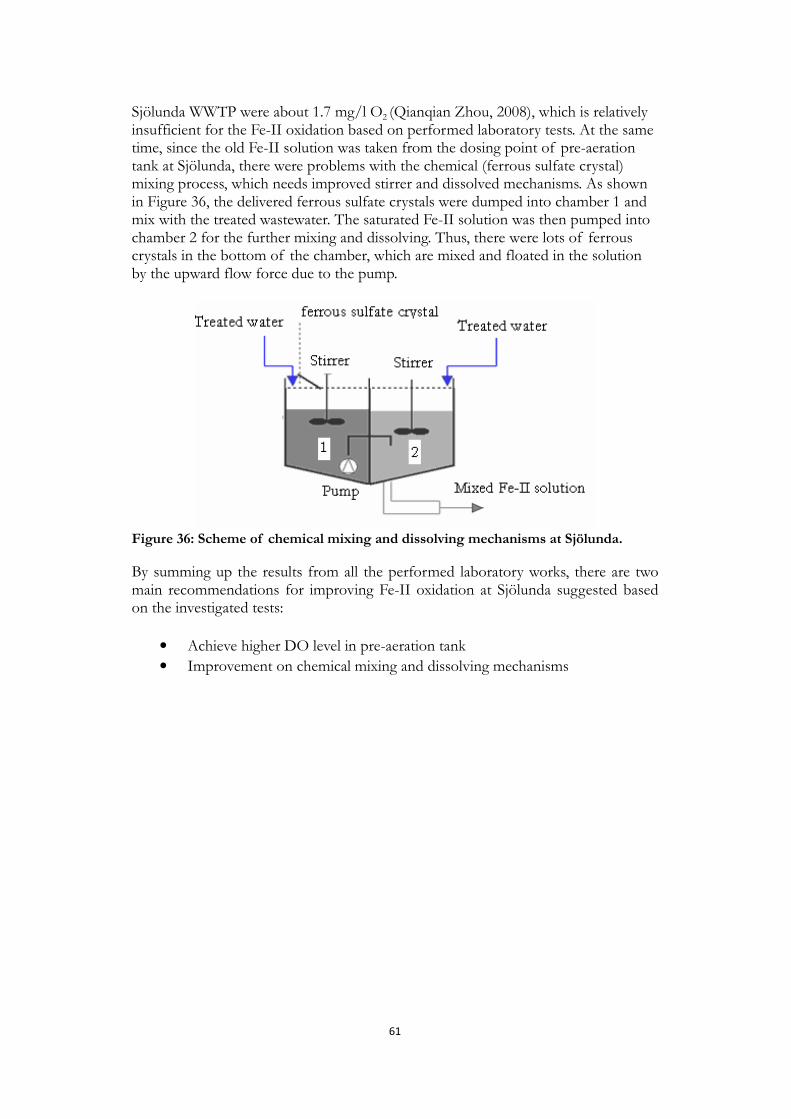
61
Sjölunda WWTP were about 1.7 mg/l O2 (Qianqian Zhou, 2008), which is relatively insufficient for the Fe-II oxidation based on performed laboratory tests. At the same time, since the old Fe-II solution was taken from the dosing point of pre-aeration tank at Sjölunda, there were problems with the chemical (ferrous sulfate crystal) mixing process, which needs improved stirrer and dissolved mechanisms. As shown in Figure 36, the delivered ferrous sulfate crystals were dumped into chamber 1 and mix with the treated wastewater. The saturated Fe-II solution was then pumped into chamber 2 for the further mixing and dissolving. Thus, there were lots of ferrous crystals in the bottom of the chamber, which are mixed and floated in the solution by the upward flow force due to the pump.
Figure 36: Scheme of chemical mixing and dissolving mechanisms at Sjölunda.
By summing up the results from all the performed laboratory works, there are two main recommendations for improving Fe-II oxidation at Sjölunda suggested based on the investigated tests:
• Achieve higher DO level in pre-aeration tank
• Improvement on chemical mixing and dissolving mechanisms

62
63
9. Conclusion
The overall conclusions based on the performed tests and investigations of the pre-precipitation process can be drawn as below:
• The operational condition parameters has significant influence on Fe-II oxidation in the wastewater, which are pH value, oxygen level, turbulence condition and utilized chemical quality.
• The achieved oxidation performance during the pre-aeration has no significant effect on the subsequent flocculation process. Ferrous ions could be oxidized during flocculation in the laboratory but not in full scale strategy.
• The activated sludge could promote oxidation and flocculation performances during the pre-precipitation process.
• Pre-precipitation process at Sjölunda WWTP works well in the winter but has low oxidation efficiency in the summer time.
• Temperature, pH level and turbulence conditions are acceptable at Sjölunda WWTP. The low and delayed Fe-II oxidation was due to low oxygen level and bad chemical quality during the pre-aeration.
• New dosing strategy FeCl3 was successfully applied to the pre-precipitation treatment process in the lab scale, which has higher efficiency on phosphorus removal. However, Ferric chloride has not been applied to the full scale process yet. Moreover, it costs more compared to ferrous sulfate.

64

65
10. Suggestions for further thesis work
Effects of DO, pH level, turbulence condition and dosed chemical in the pre-aeration process have been identified in the laboratory. However, the influences caused by the temperature and microorganism activities in the wastewater on Fe-II oxidation are still unclear. As documented in the case study at Sjölunda WWTP, quite different Fe-II oxidation performances were observed in the pre-aeration tank between summer and winter time. This indicates that the oxidation performance is temperature dependent. Further thesis work could focus on the investigations of effects of temperature and microorganisms on oxidation process.

66
67
11. Reference
Agneta Lindquist-Kemira Kemwater, 2003. “About water treatment”, ISBN 91-631-4344-5, Kemira Kemwater, Helsingborg, Sweden
Caceres, L.; Contreras, R., 1995. “Municipal wastewater treatment by lime/ferrous sulfate and dissolved air flotation”, Water Science and Technology, Volume 31, Number 3
Daniel C. Harris.-5th ed, 1998. “Quantitative Chemical Analysis”, W. H. Freeman and Company, New York
David B. Vance, 1994. “Iron- The Environmental Impact of A Universal Element” National Environmental Journal May. /June 1994 Vol. 4 No. 3 Page 24-25
David Gustavsson, 2008. Personal communication
DW de Haas, MC Wentzel and GA Ekama, 2000. “The use of simultaneous chemical precipitation in modified activated sludge systems exhibiting biological excess phosphate removal”. Department of Civil Engineering, University of Cape Town, Rondebosch 7700, South Africa
E. El-Bestawy; H. H. Baghdadi; H. Hussein; M. F. El-Saka, 2005. “Comparison between biological and chemical treatment of wastewater containing nitrogen and phosphorus”, Journal of Industrial Microbiology & Biotechnology, vol. 32: 195-203
Fangwen Li; Jianfeng Wu; Xiaohong Xu; Xiaoai Wu; Songjiang Ma,2008. “Iron Removal from Oilfield Produced Water by Chemical Precipitation and Filtration, 2008 2nd”, International Conference on Bioinformatics and Biomedical Engineering, IEEE
Henrik Aspegren, 1995. “Evaluation of a High Loaded Activated Sludge Process for Biological Phosphorus Removal”, Ph.D. Thesis, Dept of Water and Environmental Engineering, Lund University
Hove, M.; van Hille, R.P.; Lewis, A.E. 2008. “Mechanisms of formation of iron precipitates from ferrous solutions at high and low pH”, ISSN: 00092509, Chemical Engineering Science, 2008; 63 (6), Page 1626-1635
JD Hem, 1961. “Stability field diagrams as aids in iron chemistry studies”, Journal American Water Works Association, volume 53(2)
Jia-Qian Jiang and Nigel J D Graham, 1998. “Pre-polymerized inorganic coagulants and phosphorous removal by coagulation”, Department of Civil Engineering, Imperial College of

68
Science, Technology and Medicine, London SW7 2BU
Kugelman, I.J., 1976. “Status of Advanced Waste Treatment”, H.W. Gehm and J.I. Bregman (Eds.) Handbook of Water Resources and Pollution Control, Van Nostrand, New York
MEDAWARE, 2004. “Development of Tools and Guidelines for the Promotion of the Sustainable Urban Wastewater Treatment and Reuse in the Agricultural Production in the Mediterranean Countries” Meda Water, European commission Metcalf & Eddy, Inc; George Tchobanoglous; Franklin L. Burton; H. David Stensel, 2003. “Wastewater Engineering Treatment and Reuse, 4th ed”, ISBN: 0070418780, McGraw-Hill Book Comany
Qianqian Zhou, 2008. “Economical and process investigations of iron activation process in the pre-precipitation treatment at Sjölunda WWTP” VA SYD (Internal report)
Richard I. Sedlak, 1991. “Phosphorus and Nitrogen Removal from Municipal Wastewater: Principles and Practice, 2nd Ed”, Lewis Publishers, Boca Raton, Florida
Rockne Karl, 2007. “Kinetic hindrance of Fe (II) oxidation at alkaline pH and in the presence of nitrate and oxygen in a facultative wastewater stabilization pond”, Journal of Environmental Science and Health, Part A, Taylor & Feancis
Stumm, W. and Morgan, J.J. , 1996. “Aquatic Chemistry, Chemical Equilibrium and Rates in Natural Waters, 3rd ed”, Wiley, Canada, 1022
Thomas Deppe, Jurgen Benndorf., 2002. “Phosphorus reduction in a shallow hypereutrophic reservoir by in-lake dosage of ferrous iron” Dresden University of Technology, Institute of Hydrobiology, D-01062 Dresden, Germany Thistleton, J.; Berry, T.A.; Pearce, P.; Parsons, S.A., 2002. “Mechanisms of Chemical Phosphorus Removal II”, Process safety and environmental protection: transactions of the Institution of Chemical Engineers, Volume 80, and Issue 5. Elsevier
Utku Köz, 2007. “Modeling & Simulation of Reject Water Treatment at Sjölunda WWTP with WEST”, Master’s Thesis, Lund institution of Technology, Lund University VA SYD, 2008. Personal communication Wilen, B. -M; Keiding, K.; Nielsen, P. H., 2004. “Flocculation of activated sludge flocs by stimulation of the aerobic biological activity”, Water research [0043-1354] vol.38 num 18 Page 3909
69
The Swedish Environmental Code http://www.regeringen.se/sb/d/108/a/1348 Accessed on 02-09-2008 Pre-precipitation, kemira http://www.kemira.com/en/solutionsproducts/Pages/Pre-precipitation.aspx Accessed on 03-09-2008 WST 2003, About Chemical Precipitation http://www.waterspecialists.biz/html/about_chemical_precipitation.html Accessed on 11-09-2008 Coagulation and flocculation http://www.mrwa.com/OP-Coagulation.pdf Accessed on 28-10-2008 Roger S. Miller, 1999, Phosphorus http://www.thekrib.com/Plants/Fertilizer/phosphorus.html Accessed on 08-11-2008

70

Appendix Book
1. Ferrous sulfate .........................................................................................................................1
2. Chemical Cuvette Products....................................................................................................2
3. Cuvette test LCK 320 .............................................................................................................3
4. Equipment utilized in the laboratory tests...........................................................................6
5. Fe-II oxidation with wastewater............................................................................................8
6. Fe-II oxidation with deionized water ...................................................................................9
7. Fe-II oxidation with tap water.............................................................................................10
8. Comparison between filtrated sample and centrifuged sample......................................12
9. Aeration test by using filtrated sampling............................................................................13
10. The effect of pH on Fe-II oxidation..................................................................................14
11. Study of Fe-II oxidation with fresh chemical by using unfiltrated sample...................15
12. DO variation during flocculation test ................................................................................16
13. Procedure of flocculation test.............................................................................................17
14. Fe-II oxidation during flocculation test .............................................................................18
15. Added Fe-II in the activated sludge test ............................................................................19
16. Recheck of flocculation test by using filtrated sampling.................................................20


1
1. Ferrous sulfate
Figure 1: Ferrous sulfate (Iron (II) sulfate, Wikipedia)
Chemical compound ferrous sulfate (FeSO4*7H2O) is most commonly encountered as the
odorless blue green crystals. It is an easily soluble metal salts with density 1.898 g/cm³ under
standard state1. Ferrous sulfate is stable for usage and storage under ordinary conditions,
however, it will from a brown coating of corrosive basic ferric sulfate when it exposure to
moisture (MSDA Number: F1802). Ferrous sulfate has been widely applied for phosphate
removal and the purification of water by flocculation in municipal wastewater treatment plants
to prevent eutrophication of surface (Iron (II) sulfate, Wikipedia).
1 Standard State: 25 degree,100KPa (1 Bar)
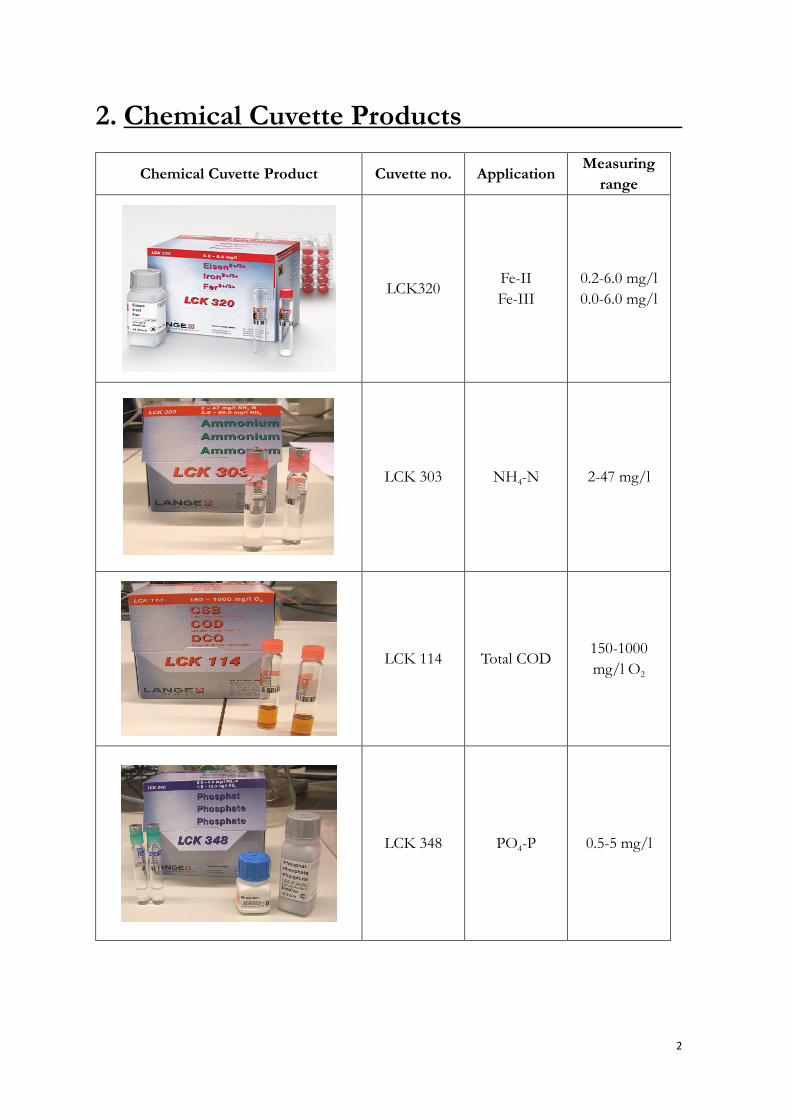
2
2. Chemical Cuvette Products
Chemical Cuvette Product Cuvette no. Application Measuring
range
LCK320 Fe-II
Fe-III
0.2-6.0 mg/l
0.0-6.0 mg/l
LCK 303 NH4-N 2-47 mg/l
LCK 114 Total COD 150-1000
mg/l O2
LCK 348 PO4-P 0.5-5 mg/l
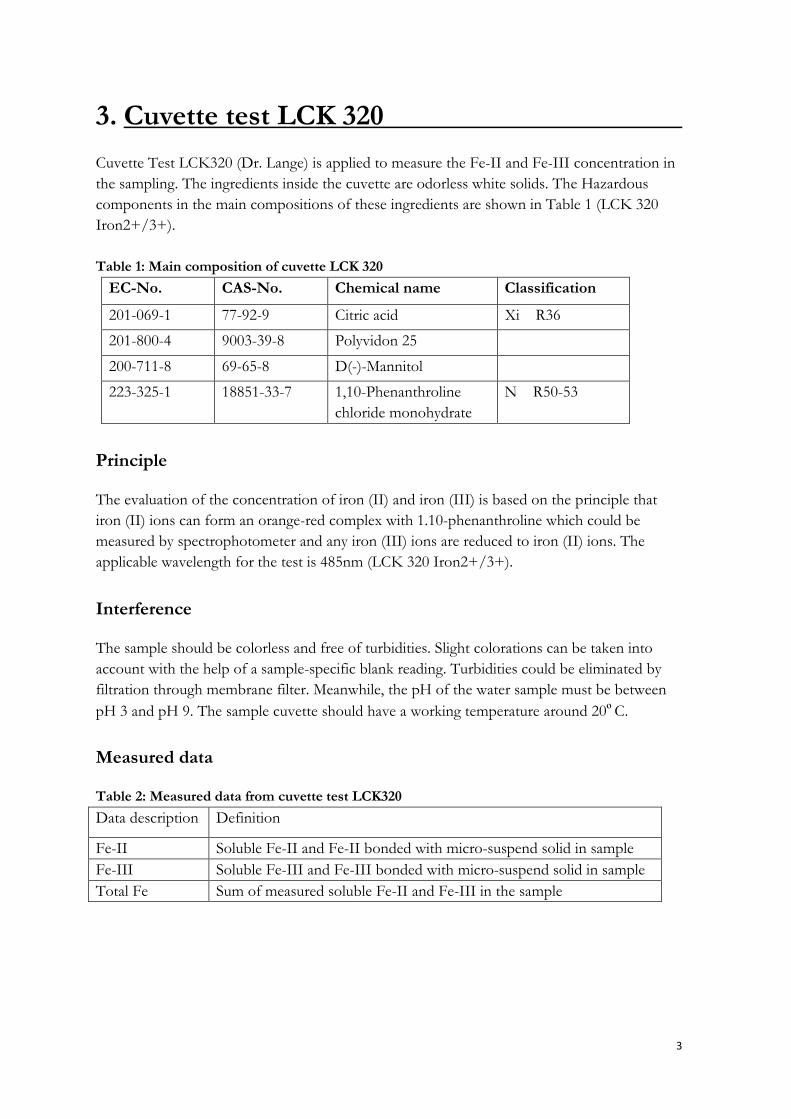
3
3. Cuvette test LCK 320
Cuvette Test LCK320 (Dr. Lange) is applied to measure the Fe-II and Fe-III concentration in
the sampling. The ingredients inside the cuvette are odorless white solids. The Hazardous
components in the main compositions of these ingredients are shown in Table 1 (LCK 320
Iron2+/3+).
Table 1: Main composition of cuvette LCK 320
EC-No. CAS-No. Chemical name Classification
201-069-1 77-92-9 Citric acid Xi R36
201-800-4 9003-39-8 Polyvidon 25
200-711-8 69-65-8 D(-)-Mannitol
223-325-1 18851-33-7 1,10-Phenanthroline
chloride monohydrate
N R50-53
Principle
The evaluation of the concentration of iron (II) and iron (III) is based on the principle that
iron (II) ions can form an orange-red complex with 1.10-phenanthroline which could be
measured by spectrophotometer and any iron (III) ions are reduced to iron (II) ions. The
applicable wavelength for the test is 485nm (LCK 320 Iron2+/3+).
Interference
The sample should be colorless and free of turbidities. Slight colorations can be taken into
account with the help of a sample-specific blank reading. Turbidities could be eliminated by
filtration through membrane filter. Meanwhile, the pH of the water sample must be between
pH 3 and pH 9. The sample cuvette should have a working temperature around 20ºC.
Measured data
Table 2: Measured data from cuvette test LCK320
Data description Definition
Fe-II Soluble Fe-II and Fe-II bonded with micro-suspend solid in sample
Fe-III Soluble Fe-III and Fe-III bonded with micro-suspend solid in sample
Total Fe Sum of measured soluble Fe-II and Fe-III in the sample

4
Measuring range of LCK320
Table 3: Measured data from cuvette test LCK320
Parameter Display Measuring range
Iron II (Fe II) Fe III LCK 320 0.2 – 6.0 mg/l
Iron total (Fe tot) 0.2 – 6.0 mg/l
Iron III (Fe III) 0.0 – 6.0 mg/l
Sample Test Procedure Instruction
1. Take 2ml sample by micropipette and fill the diluted sample into sample curette
2. Shake and mix the sample with chemical inside the cuvette
3. Press Timer>OK, wait for a 5-minute reaction
4. Shake the sample again, and then clean thoroughly the outside of cuvette, insert the
cuvette into the spectrophotometer and choose evaluation of iron (III), the
spectrophotometer records the original data as “E”.
5. Remove the sample cuvette from the spectrophotometer and screw a DosiCap A
(LCK 320A) onto the same cuvette by changing the head.
6. Shake and invert the cuvette a few times to make sure the chemical inside the head mix
properly with sample.
7. Press Time>Ok, wait for another 5-minute reaction.
8. After 5 minutes, invert the cuvette a few times more and thoroughly clean the outside
of the cuvette.
9. Insert the sample cuvette into spectrophotometer again and evaluate.
20 sec display = Fe 2 (Fe II)
20 sec display = Fe t (Fe total)
20 sec display = Fe 3 (Fe III)
10. Check if the evaluated concentration of Fe II and Fe III comes within the measuring
Range. Retest and reevaluate the sample with higher diluting factor if the evaluated
value exceeds the measuring range.
* Modify from LCK 320 Iron2+/3+
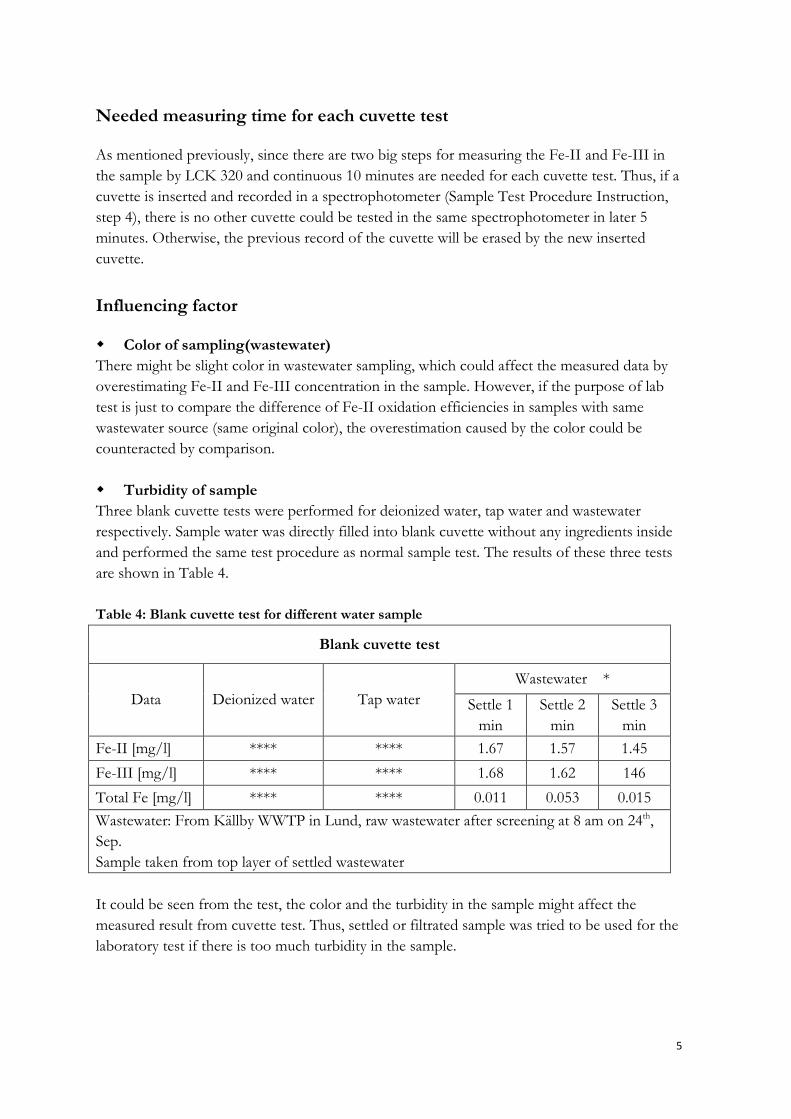
5
Needed measuring time for each cuvette test
As mentioned previously, since there are two big steps for measuring the Fe-II and Fe-III in
the sample by LCK 320 and continuous 10 minutes are needed for each cuvette test. Thus, if a
cuvette is inserted and recorded in a spectrophotometer (Sample Test Procedure Instruction,
step 4), there is no other cuvette could be tested in the same spectrophotometer in later 5
minutes. Otherwise, the previous record of the cuvette will be erased by the new inserted
cuvette.
Influencing factor
� Color of sampling(wastewater)
There might be slight color in wastewater sampling, which could affect the measured data by
overestimating Fe-II and Fe-III concentration in the sample. However, if the purpose of lab
test is just to compare the difference of Fe-II oxidation efficiencies in samples with same
wastewater source (same original color), the overestimation caused by the color could be
counteracted by comparison.
� Turbidity of sample
Three blank cuvette tests were performed for deionized water, tap water and wastewater
respectively. Sample water was directly filled into blank cuvette without any ingredients inside
and performed the same test procedure as normal sample test. The results of these three tests
are shown in Table 4.
Table 4: Blank cuvette test for different water sample
Blank cuvette test
Wastewater *
Data Deionized water Tap water Settle 1
min
Settle 2
min
Settle 3
min
Fe-II [mg/l] **** **** 1.67 1.57 1.45
Fe-III [mg/l] **** **** 1.68 1.62 146
Total Fe [mg/l] **** **** 0.011 0.053 0.015
Wastewater: From Källby WWTP in Lund, raw wastewater after screening at 8 am on 24th,
Sep.
Sample taken from top layer of settled wastewater
It could be seen from the test, the color and the turbidity in the sample might affect the
measured result from cuvette test. Thus, settled or filtrated sample was tried to be used for the
laboratory test if there is too much turbidity in the sample.
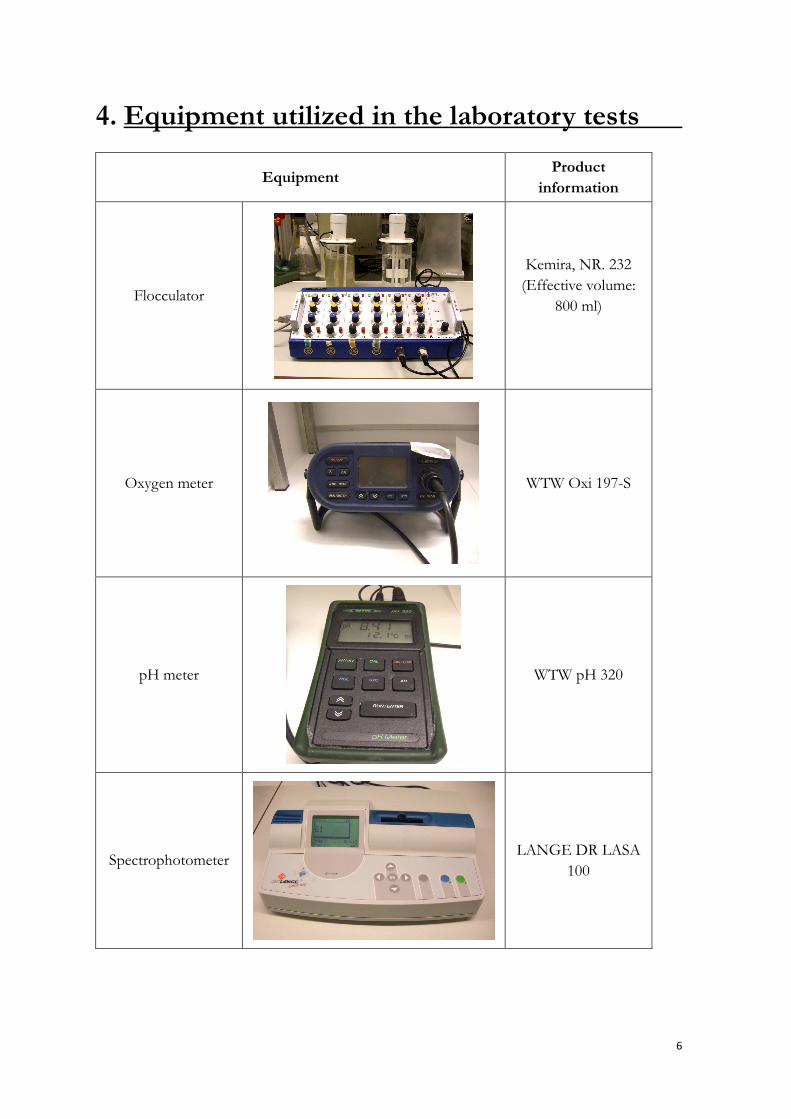
6
4. Equipment utilized in the laboratory tests
Equipment Product
information
Flocculator
Kemira, NR. 232
(Effective volume:
800 ml)
Oxygen meter
WTW Oxi 197-S
pH meter
WTW pH 320
Spectrophotometer
LANGE DR LASA
100
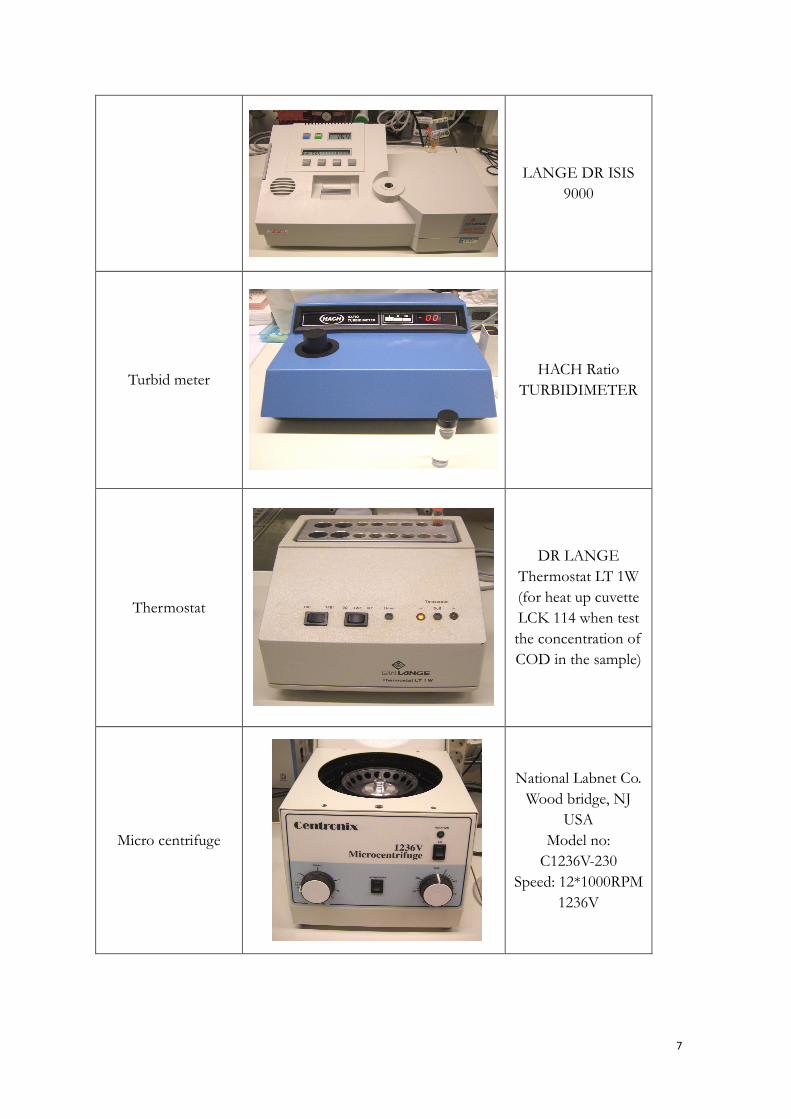
7
LANGE DR ISIS
9000
Turbid meter
HACH Ratio
TURBIDIMETER
Thermostat
DR LANGE
Thermostat LT 1W
(for heat up cuvette
LCK 114 when test
the concentration of
COD in the sample)
Micro centrifuge
National Labnet Co.
Wood bridge, NJ
USA
Model no:
C1236V-230
Speed: 12*1000RPM
1236V
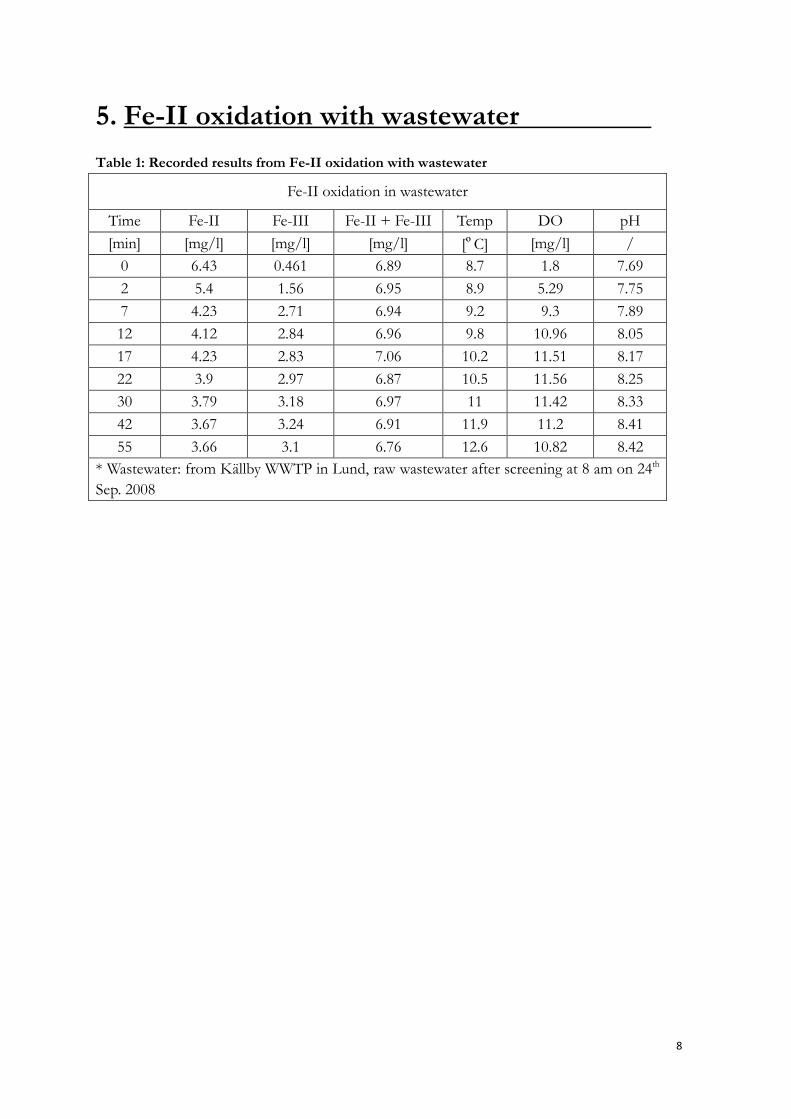
8
5. Fe-II oxidation with wastewater
Table 1: Recorded results from Fe-II oxidation with wastewater
Fe-II oxidation in wastewater
Time Fe-II Fe-III Fe-II + Fe-III Temp DO pH
[min] [mg/l] [mg/l] [mg/l] [ºC] [mg/l] /
0 6.43 0.461 6.89 8.7 1.8 7.69
2 5.4 1.56 6.95 8.9 5.29 7.75
7 4.23 2.71 6.94 9.2 9.3 7.89
12 4.12 2.84 6.96 9.8 10.96 8.05
17 4.23 2.83 7.06 10.2 11.51 8.17
22 3.9 2.97 6.87 10.5 11.56 8.25
30 3.79 3.18 6.97 11 11.42 8.33
42 3.67 3.24 6.91 11.9 11.2 8.41
55 3.66 3.1 6.76 12.6 10.82 8.42
* Wastewater: from Källby WWTP in Lund, raw wastewater after screening at 8 am on 24th
Sep. 2008
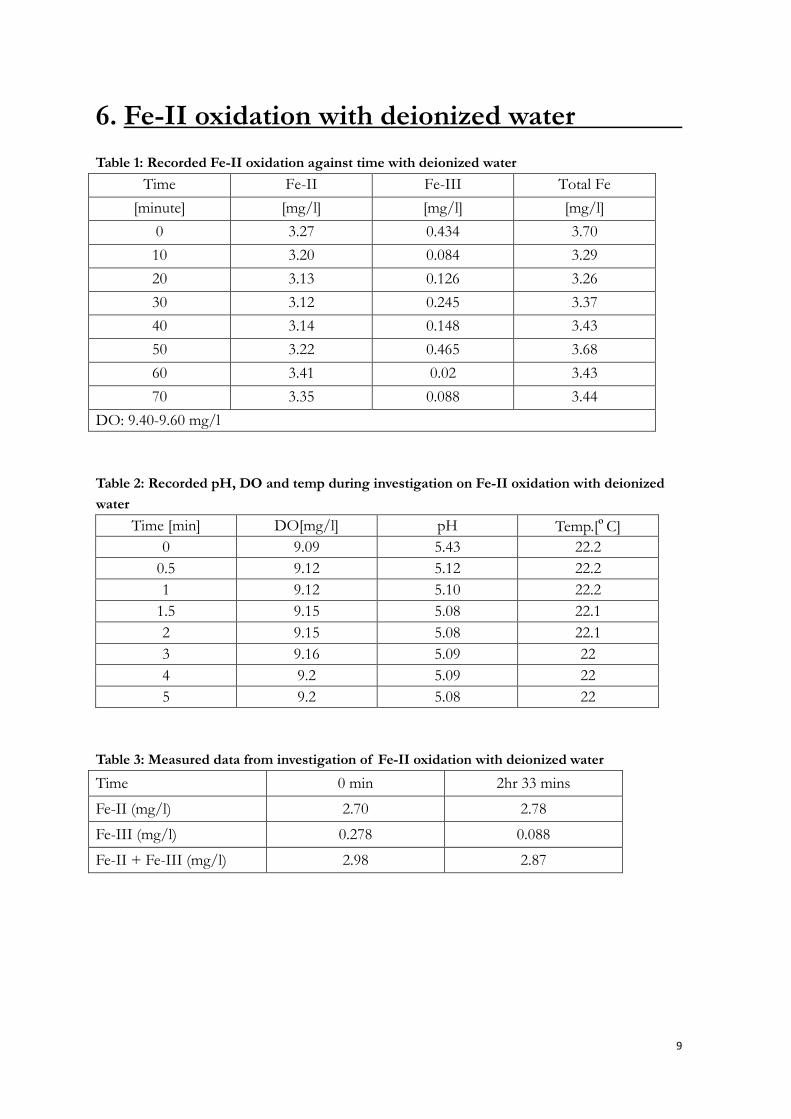
9
6. Fe-II oxidation with deionized water
Table 1: Recorded Fe-II oxidation against time with deionized water
Time Fe-II Fe-III Total Fe
[minute] [mg/l] [mg/l] [mg/l]
0 3.27 0.434 3.70
10 3.20 0.084 3.29
20 3.13 0.126 3.26
30 3.12 0.245 3.37
40 3.14 0.148 3.43
50 3.22 0.465 3.68
60 3.41 0.02 3.43
70 3.35 0.088 3.44
DO: 9.40-9.60 mg/l
Table 2: Recorded pH, DO and temp during investigation on Fe-II oxidation with deionized
water
Time [min] DO[mg/l] pH Temp.[ºC]
0 9.09 5.43 22.2
0.5 9.12 5.12 22.2
1 9.12 5.10 22.2
1.5 9.15 5.08 22.1
2 9.15 5.08 22.1
3 9.16 5.09 22
4 9.2 5.09 22
5 9.2 5.08 22
Table 3: Measured data from investigation of Fe-II oxidation with deionized water
Time 0 min 2hr 33 mins
Fe-II (mg/l) 2.70 2.78
Fe-III (mg/l) 0.278 0.088
Fe-II + Fe-III (mg/l) 2.98 2.87
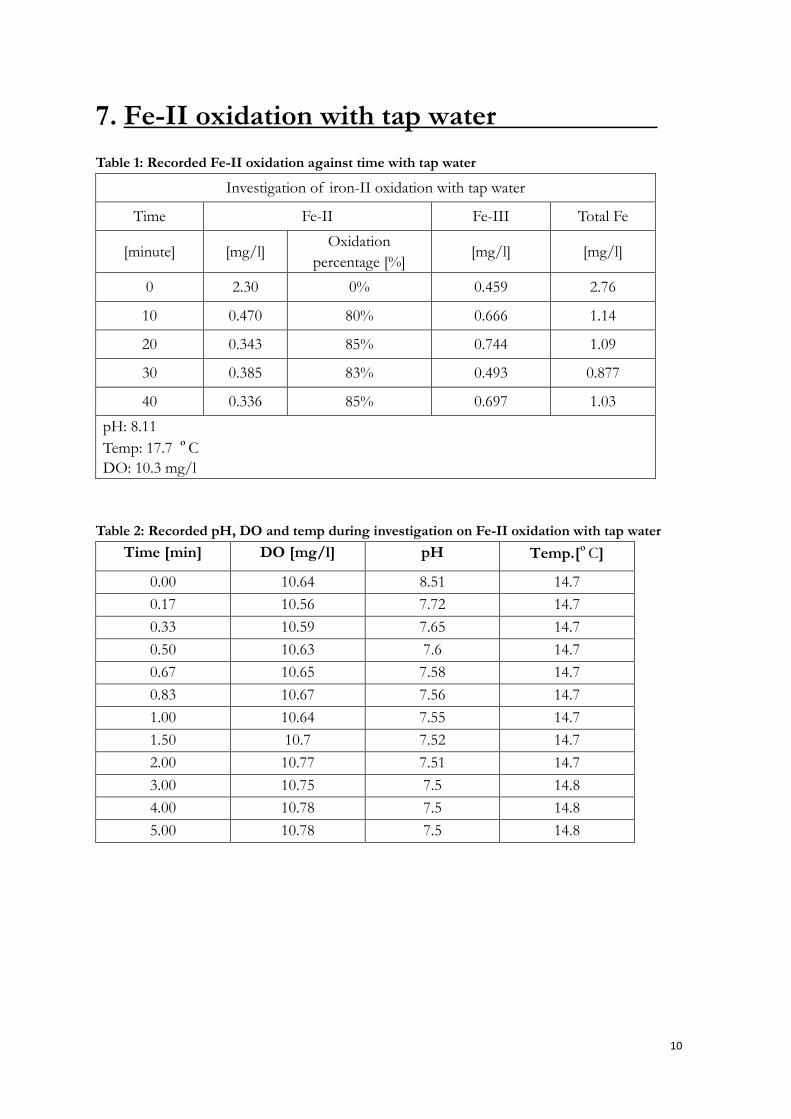
10
7. Fe-II oxidation with tap water
Table 1: Recorded Fe-II oxidation against time with tap water
Investigation of iron-II oxidation with tap water
Time Fe-II Fe-III Total Fe
[minute] [mg/l] Oxidation
percentage [%] [mg/l] [mg/l]
0 2.30 0% 0.459 2.76
10 0.470 80% 0.666 1.14
20 0.343 85% 0.744 1.09
30 0.385 83% 0.493 0.877
40 0.336 85% 0.697 1.03
pH: 8.11
Temp: 17.7 ºC
DO: 10.3 mg/l
Table 2: Recorded pH, DO and temp during investigation on Fe-II oxidation with tap water
Time [min] DO [mg/l] pH Temp.[ºC]
0.00 10.64 8.51 14.7
0.17 10.56 7.72 14.7
0.33 10.59 7.65 14.7
0.50 10.63 7.6 14.7
0.67 10.65 7.58 14.7
0.83 10.67 7.56 14.7
1.00 10.64 7.55 14.7
1.50 10.7 7.52 14.7
2.00 10.77 7.51 14.7
3.00 10.75 7.5 14.8
4.00 10.78 7.5 14.8
5.00 10.78 7.5 14.8
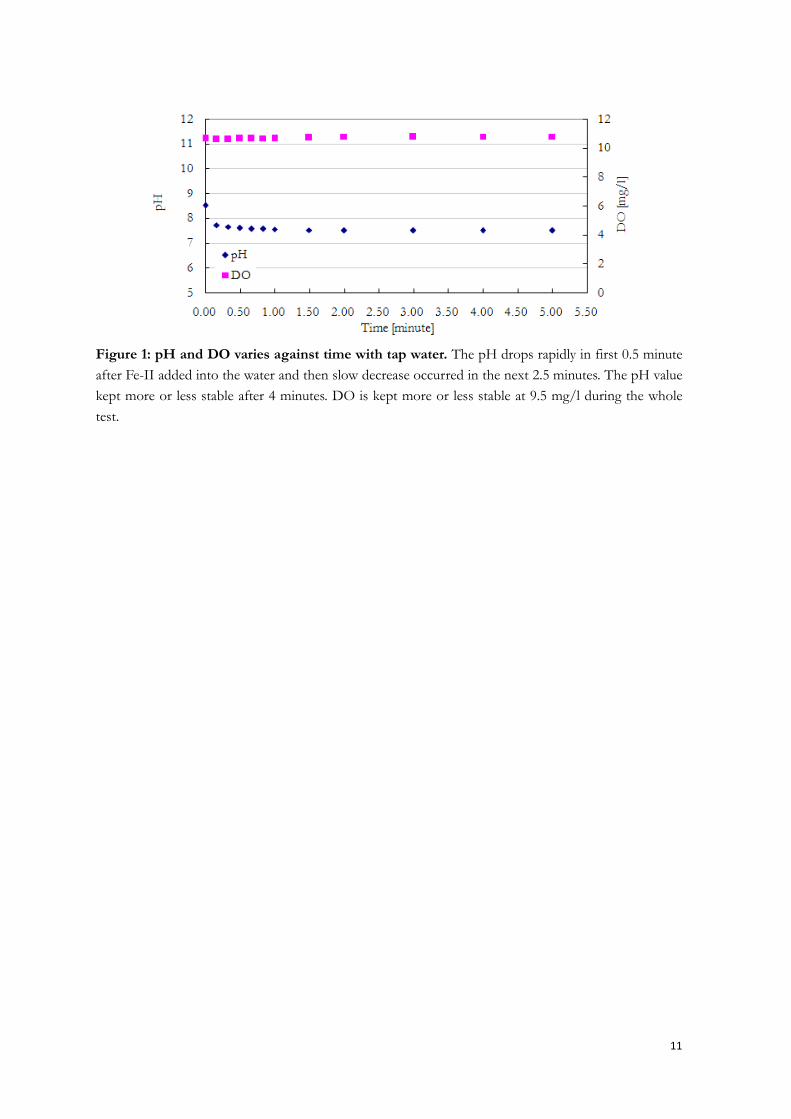
11
Figure 1: pH and DO varies against time with tap water. The pH drops rapidly in first 0.5 minute
after Fe-II added into the water and then slow decrease occurred in the next 2.5 minutes. The pH value
kept more or less stable after 4 minutes. DO is kept more or less stable at 9.5 mg/l during the whole
test.
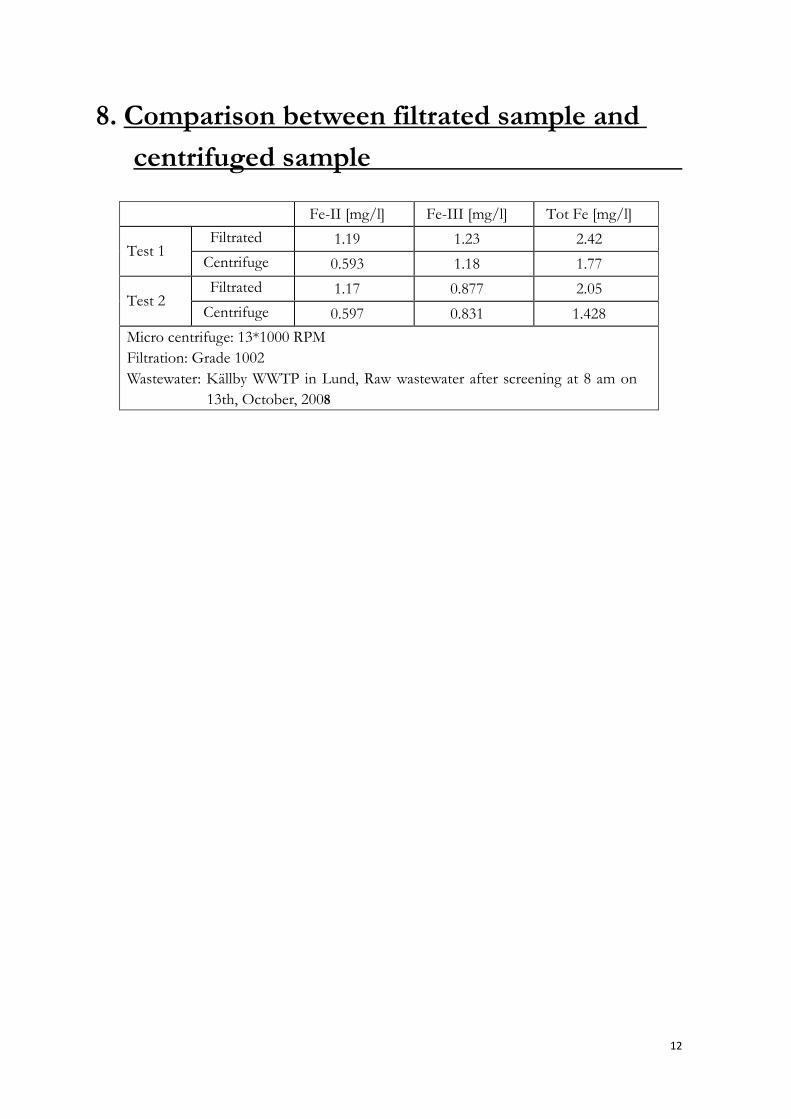
12
8. Comparison between filtrated sample and
centrifuged sample
Fe-II [mg/l] Fe-III [mg/l] Tot Fe [mg/l]
Filtrated 1.19 1.23 2.42 Test 1
Centrifuge 0.593 1.18 1.77
Filtrated 1.17 0.877 2.05 Test 2
Centrifuge 0.597 0.831 1.428
Micro centrifuge: 13*1000 RPM
Filtration: Grade 1002
Wastewater: Källby WWTP in Lund, Raw wastewater after screening at 8 am on
13th, October, 2008
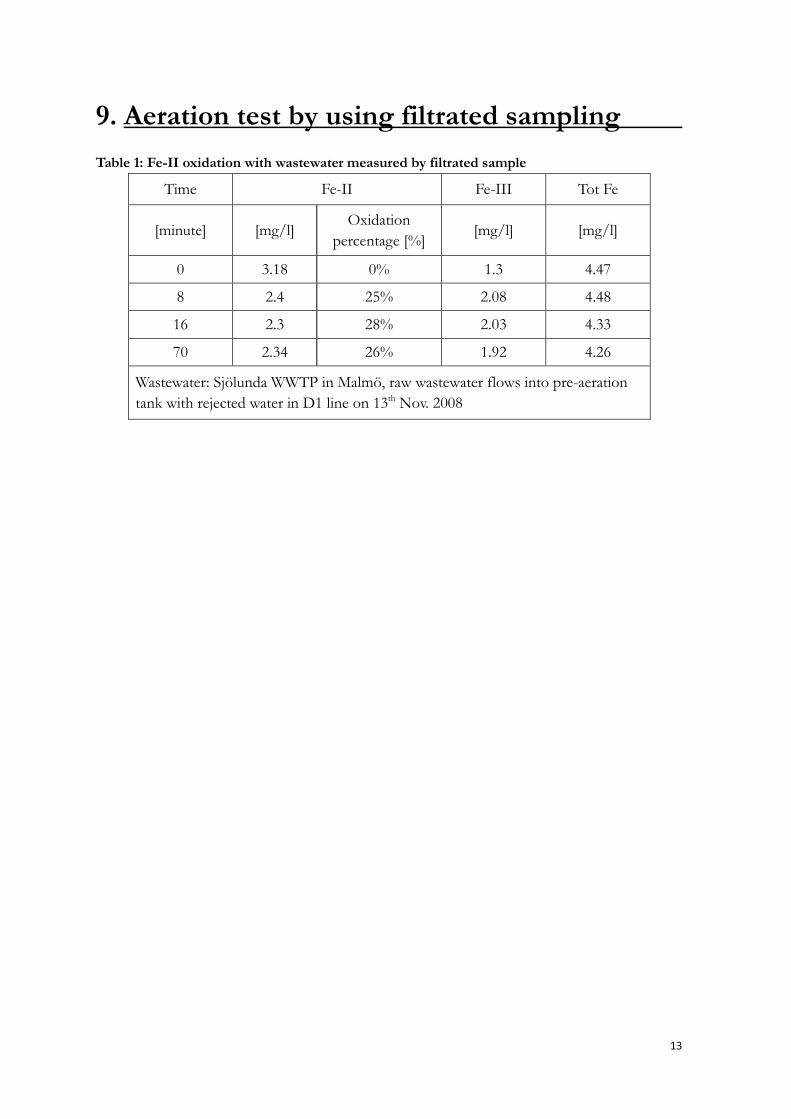
13
9. Aeration test by using filtrated sampling
Table 1: Fe-II oxidation with wastewater measured by filtrated sample
Time Fe-II Fe-III Tot Fe
[minute] [mg/l] Oxidation
percentage [%] [mg/l] [mg/l]
0 3.18 0% 1.3 4.47
8 2.4 25% 2.08 4.48
16 2.3 28% 2.03 4.33
70 2.34 26% 1.92 4.26
Wastewater: Sjölunda WWTP in Malmö, raw wastewater flows into pre-aeration
tank with rejected water in D1 line on 13th Nov. 2008
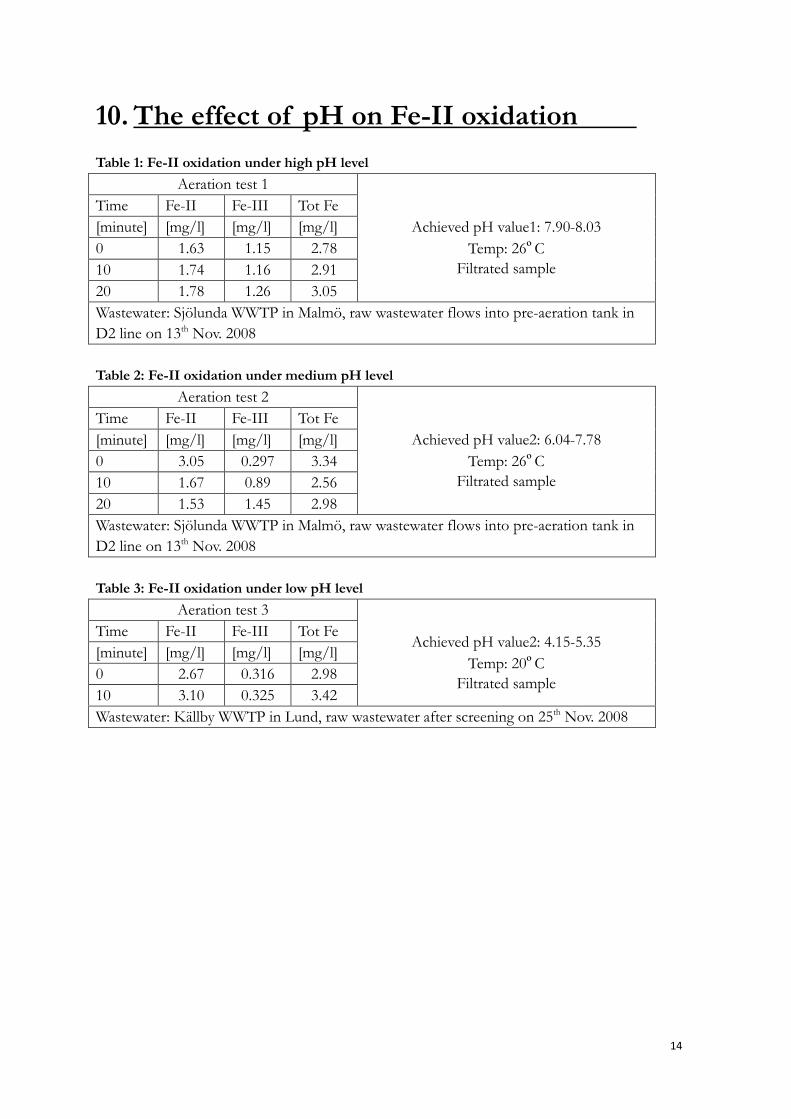
14
10. The effect of pH on Fe-II oxidation
Table 1: Fe-II oxidation under high pH level
Aeration test 1
Time Fe-II Fe-III Tot Fe
[minute] [mg/l] [mg/l] [mg/l]
0 1.63 1.15 2.78
10 1.74 1.16 2.91
20 1.78 1.26 3.05
Achieved pH value1: 7.90-8.03
Temp: 26ºC
Filtrated sample
Wastewater: Sjölunda WWTP in Malmö, raw wastewater flows into pre-aeration tank in
D2 line on 13th Nov. 2008
Table 2: Fe-II oxidation under medium pH level
Aeration test 2
Time Fe-II Fe-III Tot Fe
[minute] [mg/l] [mg/l] [mg/l]
0 3.05 0.297 3.34
10 1.67 0.89 2.56
20 1.53 1.45 2.98
Achieved pH value2: 6.04-7.78
Temp: 26ºC
Filtrated sample
Wastewater: Sjölunda WWTP in Malmö, raw wastewater flows into pre-aeration tank in
D2 line on 13th Nov. 2008
Table 3: Fe-II oxidation under low pH level
Aeration test 3
Time Fe-II Fe-III Tot Fe
[minute] [mg/l] [mg/l] [mg/l]
0 2.67 0.316 2.98
10 3.10 0.325 3.42
Achieved pH value2: 4.15-5.35
Temp: 20ºC
Filtrated sample
Wastewater: Källby WWTP in Lund, raw wastewater after screening on 25th Nov. 2008
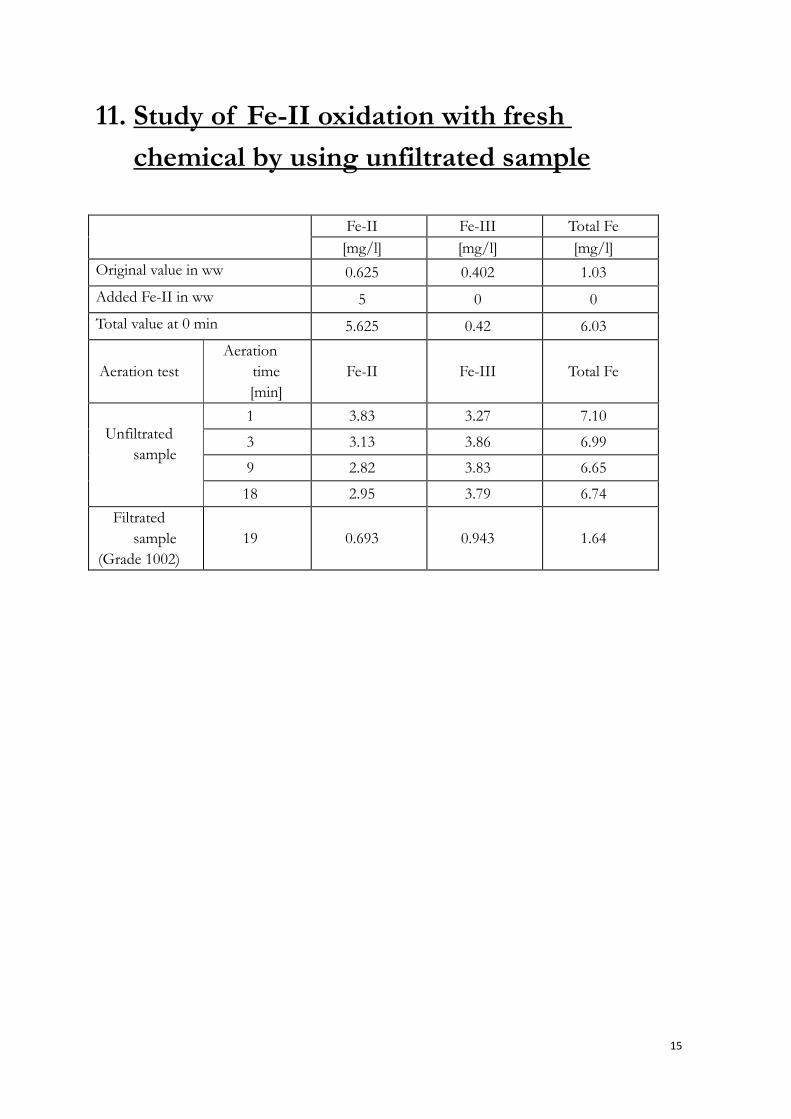
15
11. Study of Fe-II oxidation with fresh
chemical by using unfiltrated sample
Fe-II Fe-III Total Fe
[mg/l] [mg/l] [mg/l]
Original value in ww 0.625 0.402 1.03
Added Fe-II in ww 5 0 0
Total value at 0 min 5.625 0.42 6.03
Aeration test
Aeration
time
[min]
Fe-II Fe-III Total Fe
1 3.83 3.27 7.10
3 3.13 3.86 6.99
9 2.82 3.83 6.65
Unfiltrated
sample
18 2.95 3.79 6.74
Filtrated
sample
(Grade 1002)
19 0.693 0.943 1.64
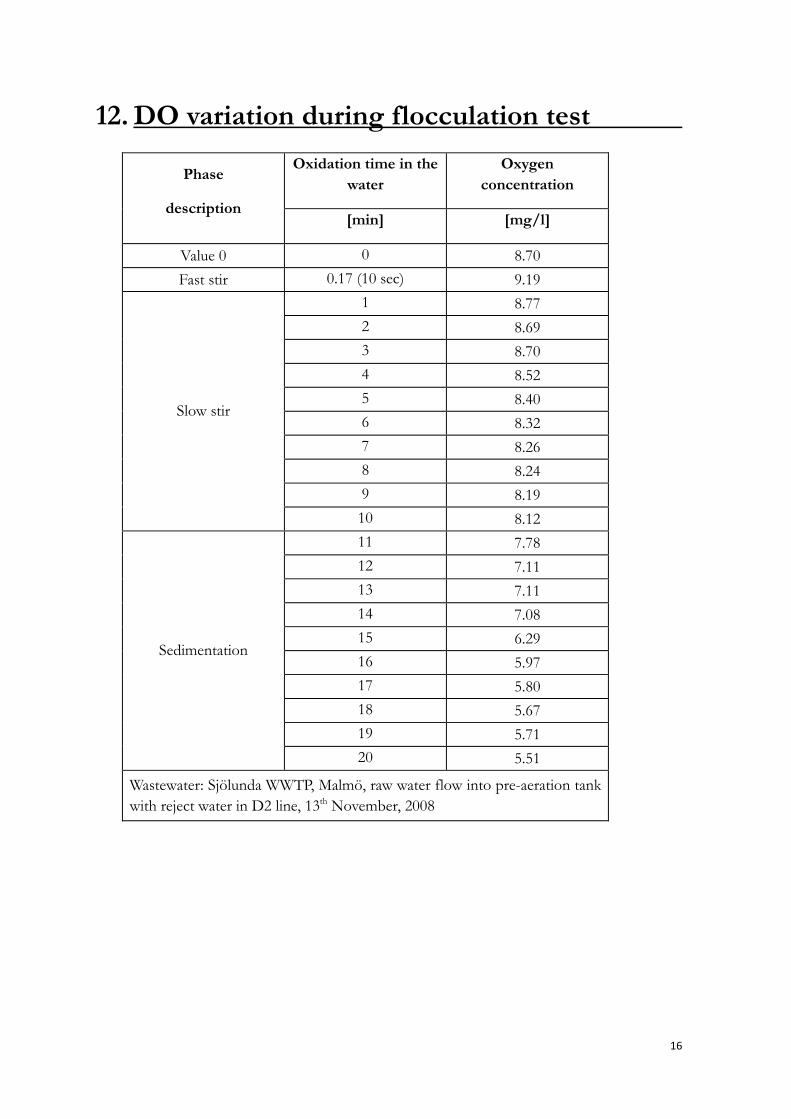
16
12. DO variation during flocculation test
Oxidation time in the
water
Oxygen
concentration Phase
description [min] [mg/l]
Value 0 0 8.70
Fast stir 0.17 (10 sec) 9.19
1 8.77
2 8.69
3 8.70
4 8.52
5 8.40
6 8.32
7 8.26
8 8.24
9 8.19
Slow stir
10 8.12
11 7.78
12 7.11
13 7.11
14 7.08
15 6.29
16 5.97
17 5.80
18 5.67
19 5.71
Sedimentation
20 5.51
Wastewater: Sjölunda WWTP, Malmö, raw water flow into pre-aeration tank
with reject water in D2 line, 13th November, 2008

17
13. Procedure of flocculation test
1. Fill the beaker with 3.5 liter wastewater and 0.15 ml ferrous sulfate and mix the solution
completely, take sample from the mixed solution and perform cuvette test, record the
measured value as “reference value” or value at 0 minutes.
2. Start to pump air into the beaker, press Timer>OK and maintain higher oxygen level in
the chemical solution.
3. Wait for 1.5 minutes aeration, take 800 ml wastewater from the beaker and fill it into one
flocculator, perform flocculation test immediately.
4. Wait for 10 seconds fast stir inside flocculator, take sample from the flocculator
immediately and perform cuvette test, record the measured value as “value 1”.
5. Wait for 10 minutes slow stir and 10 minutes sedimentation*, take sample from
flocculator and perform the cuvette test again, record the measured value as “value 2”.
Until then, the group tests for first round are done.
6. Second round start with: Wait for the Timer goes to 5 minutes (as shown in table 4), take
800ml sample from the beaker again and fill into flocculation beaker. Repeat same
flocculation test for the taken sample.
7. Taken 800ml sample from beaker after 7.5 minutes and 10 minutes respectively, repeat the
same flocculation test as described above for each sample.
8. Record measured data of Fe-II and Fe-III concentration for each time schedule and map
the recorded data subsequently.
* The reason for there is no cuvette test on Fe-II and Fe-III between slow stir phase and
sedimentation phase is due to the limitation on the needed measuring time of chemical cuvette
LCK 320(mentioned previously in Chemical cuvette LCK320). Continuous 10 minutes is
needed for each cuvette test, no other cuvette could be test in this 10 minutes. Thus there is no
enough time for the cuvette test if sample point is added after slow stir.

18
14. Fe-II oxidation during flocculation test
Table 1: Measured data from the investigation on Fe-II oxidation process during flocculation
test
Flocculation test on iron-II oxidation (Tap water)
Time Fe-II Fe-III Total Fe Data
description min
Process
description [mg/l] [mg/l] [mg/l]
Value 1 0 Start point 1.33 0.713 2.04
Value 2 0.16 fast stir 1.19 0.451 1.64
Value 3 10 slow stir 0.480 0.692 1.17
Value 4 10 sedimentation 0.631 0.419 1.05
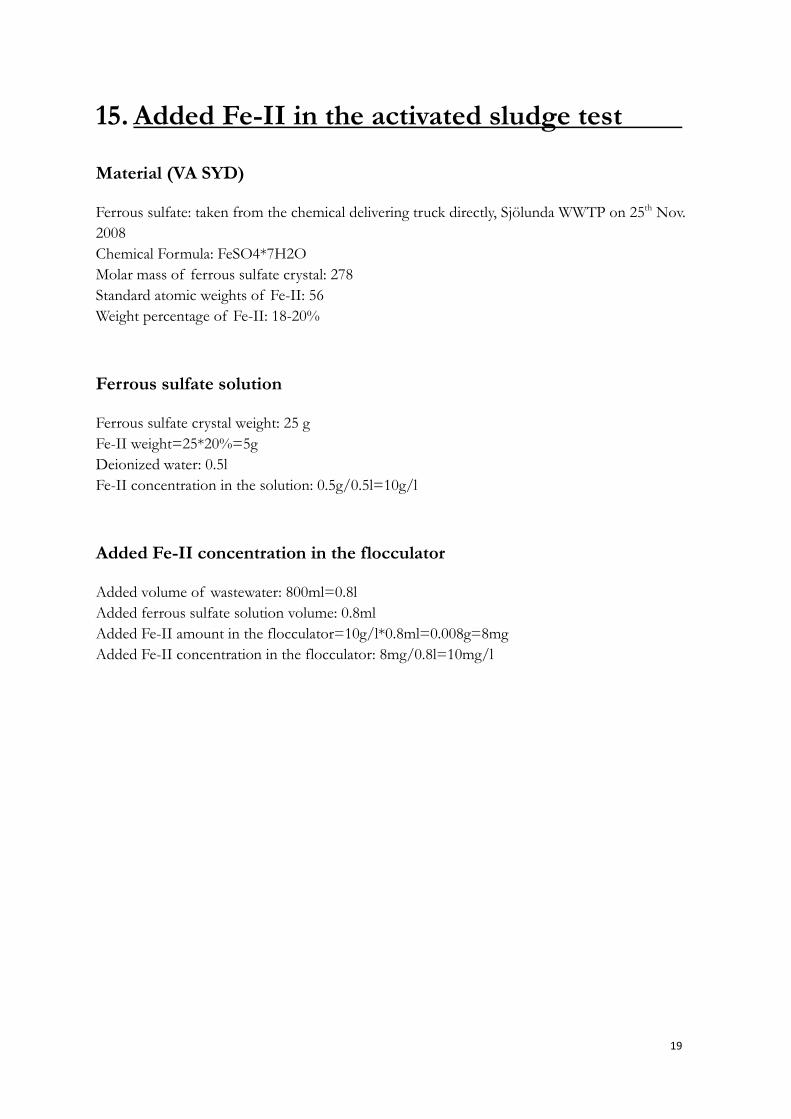
19
15. Added Fe-II in the activated sludge test
Material (VA SYD)
Ferrous sulfate: taken from the chemical delivering truck directly, Sjölunda WWTP on 25th Nov.
2008
Chemical Formula: FeSO4*7H2O
Molar mass of ferrous sulfate crystal: 278
Standard atomic weights of Fe-II: 56
Weight percentage of Fe-II: 18-20%
Ferrous sulfate solution
Ferrous sulfate crystal weight: 25 g
Fe-II weight=25*20%=5g
Deionized water: 0.5l
Fe-II concentration in the solution: 0.5g/0.5l=10g/l
Added Fe-II concentration in the flocculator
Added volume of wastewater: 800ml=0.8l
Added ferrous sulfate solution volume: 0.8ml
Added Fe-II amount in the flocculator=10g/l*0.8ml=0.008g=8mg
Added Fe-II concentration in the flocculator: 8mg/0.8l=10mg/l
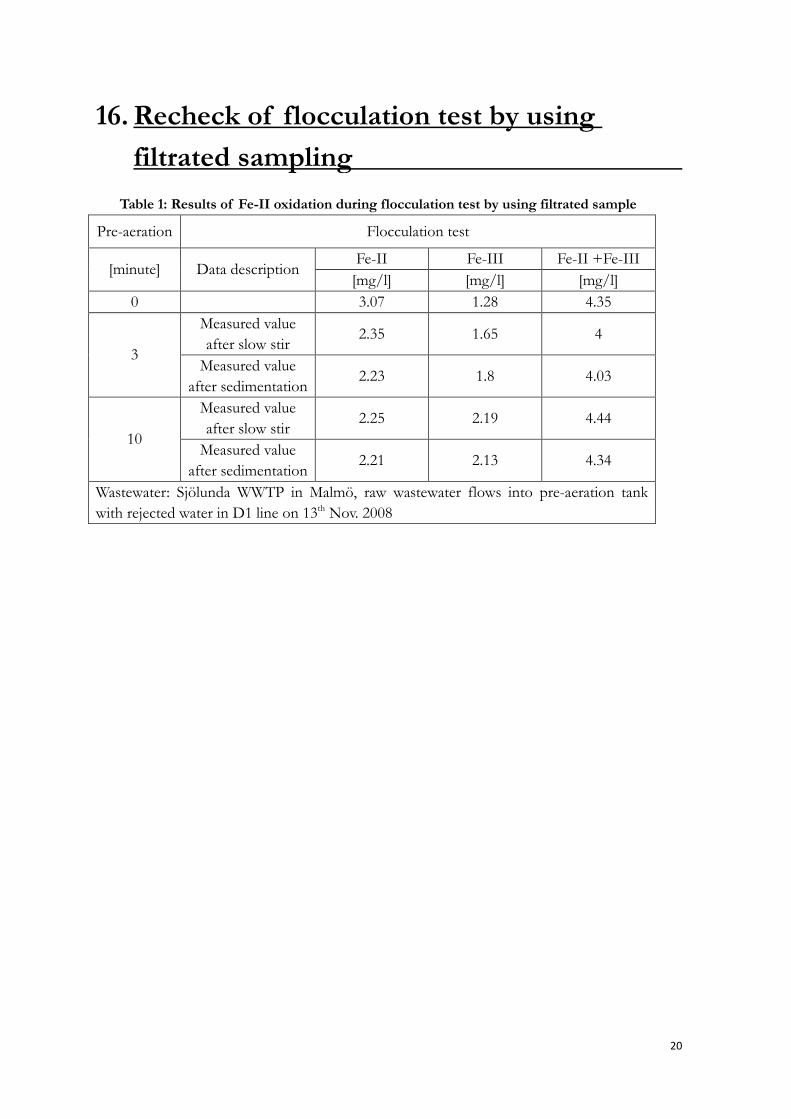
20
16. Recheck of flocculation test by using
filtrated sampling
Table 1: Results of Fe-II oxidation during flocculation test by using filtrated sample
Pre-aeration Flocculation test
Fe-II Fe-III Fe-II +Fe-III [minute] Data description
[mg/l] [mg/l] [mg/l]
0 3.07 1.28 4.35
Measured value
after slow stir 2.35 1.65 4
3 Measured value
after sedimentation 2.23 1.8 4.03
Measured value
after slow stir 2.25 2.19 4.44
10 Measured value
after sedimentation 2.21 2.13 4.34
Wastewater: Sjölunda WWTP in Malmö, raw wastewater flows into pre-aeration tank
with rejected water in D1 line on 13th Nov. 2008
21
Investigation on improving efficiency of pre-precipitation
process at Sjölunda wastewater treatment plant
Qianqian Zhou
Water and Environmental Engineering, Department of Chemical Engineering, LTH
Abstract
Poor Fe-II oxidation performance was documented in the pre-aeration process at Sjölunda
WWTP in the summer, 2008. The expected oxidation didn’t occur in the pre-aeration tank but
in the subsequent activated sludge tank instead. This leads to reduced phosphorus and COD
removals in pre-precipitation and extra investment in the activated sludge tank. Influencing
factors of the low efficiency in pre-aeration process and the effect of Fe-II oxidation on the
subsequent flocculation process have been identified. The analyzed results showed the
temperature, pH level and turbulence condition in the pre-aeration tank are acceptable. The
low oxidation efficiency is mainly due to the insufficient oxygen level and bad chemical quality
in the summer. The suggested solutions recommend utilizing aerator and chemical salt more
efficiently.
Keywords: pre-precipitation; pre-aeration; ferrous sulfate; phosphorus; oxidation; chemical
treatment; wastewater
1. Introduction
It has been documented that Fe-II
oxidation performance of pre-aeration tank
is an issue of the utmost importance in
pre-precipitation process based on the
previous process investigations on iron
activation in the pre-precipitation treatment
at Sjölunda WWTP (Qianqian Zhou, 2008).
Low oxidation efficiency of pre-aeration
tank is a key problem in the primary
treatment process at Sjölunda in the summer
time. The expected Fe-II oxidation has not
been achieved in the pre-aeration process
but in the subsequent activated sludge tank.
The activated sludge tank is an aerobic
sludge tank, where most of ferrous ions
were oxidized and precipitated. Meanwhile, it
has been found out that due to the variable
oxidation performance of pre-aeration tank,
fluctuated activation of Fe-II into Fe-III has
been observed. This not only leads to
reduced P, COD removal in pre-precipitation
process but also needs additional process
and economical costs invested in the
activated sludge tank (Qianqian Zhou, 2008).
Thus, it is important to find out the cause of
the inefficient oxidation. Meanwhile, it is
necessary to work out the way to improve
Fe-II oxidation efficiency in the pre-aeration
tank by fulfilling the demand on both
economical aspects and effluent requirement.
This paper presents the pre-precipitation
process at Sjölunda WWTP, achieved
analyzed results and further suggestions for
full scale operation strategy.
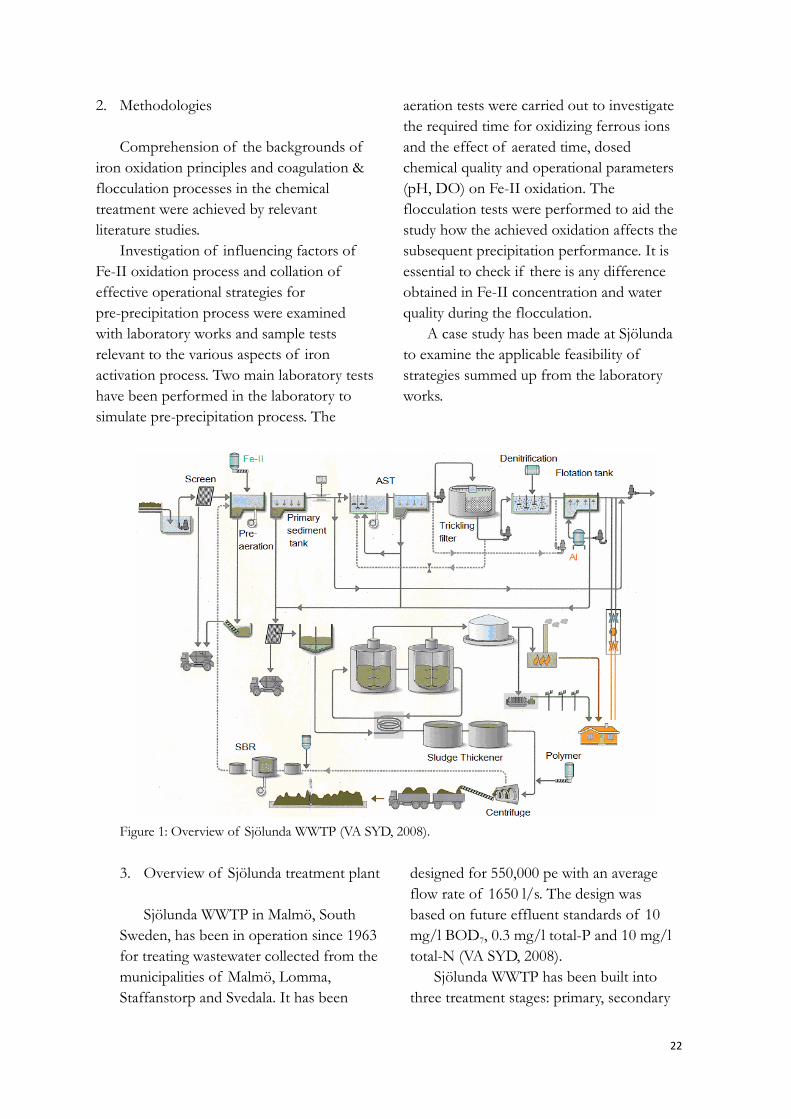
22
2. Methodologies
Comprehension of the backgrounds of
iron oxidation principles and coagulation &
flocculation processes in the chemical
treatment were achieved by relevant
literature studies.
Investigation of influencing factors of
Fe-II oxidation process and collation of
effective operational strategies for
pre-precipitation process were examined
with laboratory works and sample tests
relevant to the various aspects of iron
activation process. Two main laboratory tests
have been performed in the laboratory to
simulate pre-precipitation process. The
aeration tests were carried out to investigate
the required time for oxidizing ferrous ions
and the effect of aerated time, dosed
chemical quality and operational parameters
(pH, DO) on Fe-II oxidation. The
flocculation tests were performed to aid the
study how the achieved oxidation affects the
subsequent precipitation performance. It is
essential to check if there is any difference
obtained in Fe-II concentration and water
quality during the flocculation.
A case study has been made at Sjölunda
to examine the applicable feasibility of
strategies summed up from the laboratory
works.
Figure 1: Overview of Sjölunda WWTP (VA SYD, 2008).
3. Overview of Sjölunda treatment plant
Sjölunda WWTP in Malmö, South
Sweden, has been in operation since 1963
for treating wastewater collected from the
municipalities of Malmö, Lomma,
Staffanstorp and Svedala. It has been
designed for 550,000 pe with an average
flow rate of 1650 l/s. The design was
based on future effluent standards of 10
mg/l BOD7, 0.3 mg/l total-P and 10 mg/l
total-N (VA SYD, 2008).
Sjölunda WWTP has been built into
three treatment stages: primary, secondary
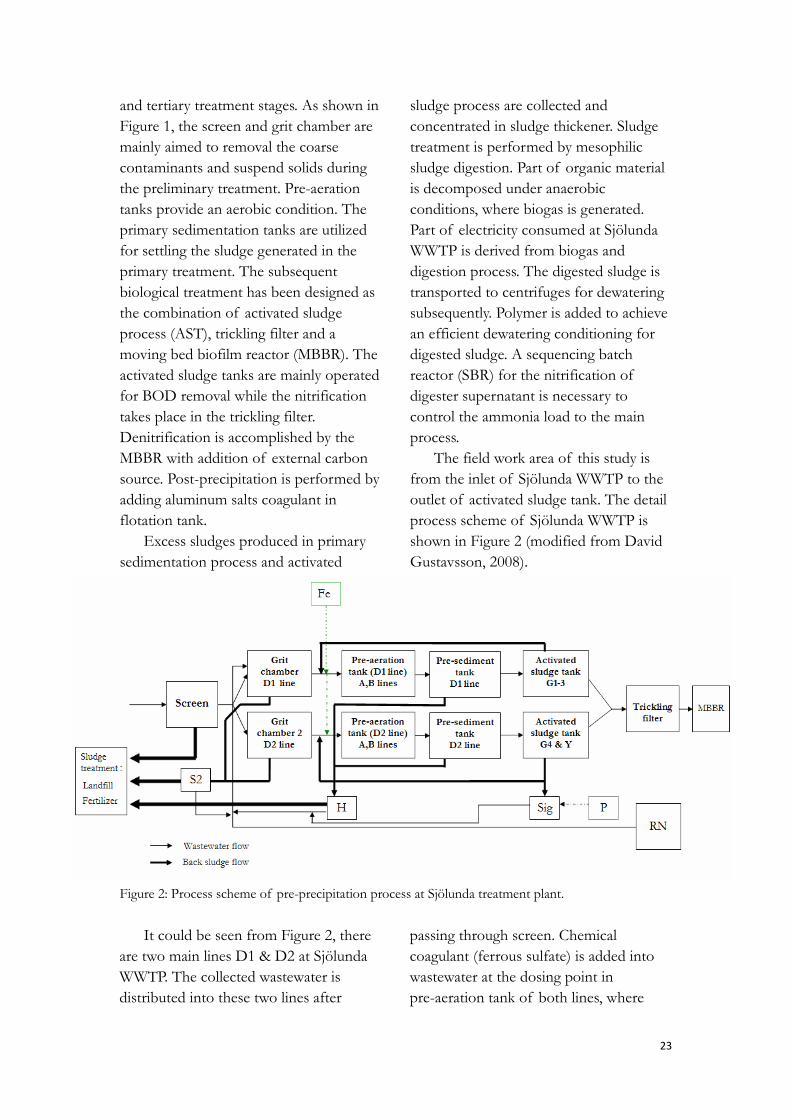
23
and tertiary treatment stages. As shown in
Figure 1, the screen and grit chamber are
mainly aimed to removal the coarse
contaminants and suspend solids during
the preliminary treatment. Pre-aeration
tanks provide an aerobic condition. The
primary sedimentation tanks are utilized
for settling the sludge generated in the
primary treatment. The subsequent
biological treatment has been designed as
the combination of activated sludge
process (AST), trickling filter and a
moving bed biofilm reactor (MBBR). The
activated sludge tanks are mainly operated
for BOD removal while the nitrification
takes place in the trickling filter.
Denitrification is accomplished by the
MBBR with addition of external carbon
source. Post-precipitation is performed by
adding aluminum salts coagulant in
flotation tank.
Excess sludges produced in primary
sedimentation process and activated
sludge process are collected and
concentrated in sludge thickener. Sludge
treatment is performed by mesophilic
sludge digestion. Part of organic material
is decomposed under anaerobic
conditions, where biogas is generated.
Part of electricity consumed at Sjölunda
WWTP is derived from biogas and
digestion process. The digested sludge is
transported to centrifuges for dewatering
subsequently. Polymer is added to achieve
an efficient dewatering conditioning for
digested sludge. A sequencing batch
reactor (SBR) for the nitrification of
digester supernatant is necessary to
control the ammonia load to the main
process.
The field work area of this study is
from the inlet of Sjölunda WWTP to the
outlet of activated sludge tank. The detail
process scheme of Sjölunda WWTP is
shown in Figure 2 (modified from David
Gustavsson, 2008).
Figure 2: Process scheme of pre-precipitation process at Sjölunda treatment plant.
It could be seen from Figure 2, there
are two main lines D1 & D2 at Sjölunda
WWTP. The collected wastewater is
distributed into these two lines after
passing through screen. Chemical
coagulant (ferrous sulfate) is added into
wastewater at the dosing point in
pre-aeration tank of both lines, where
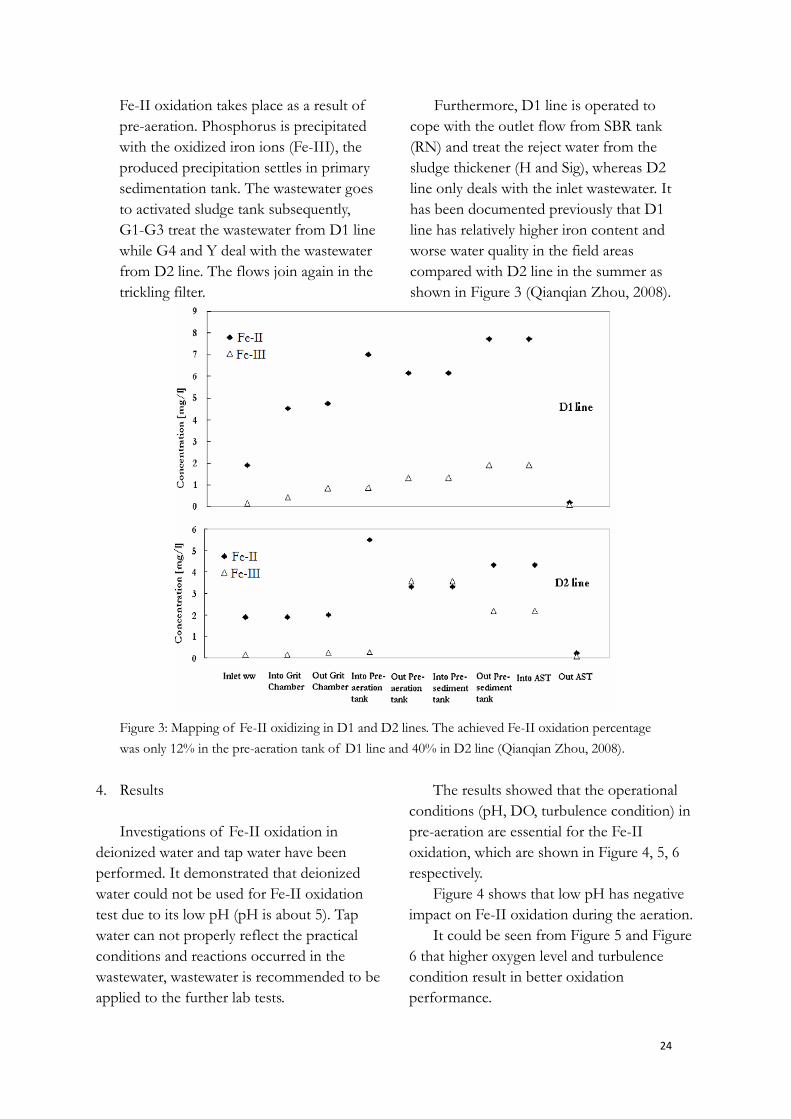
24
Fe-II oxidation takes place as a result of
pre-aeration. Phosphorus is precipitated
with the oxidized iron ions (Fe-III), the
produced precipitation settles in primary
sedimentation tank. The wastewater goes
to activated sludge tank subsequently,
G1-G3 treat the wastewater from D1 line
while G4 and Y deal with the wastewater
from D2 line. The flows join again in the
trickling filter.
Furthermore, D1 line is operated to
cope with the outlet flow from SBR tank
(RN) and treat the reject water from the
sludge thickener (H and Sig), whereas D2
line only deals with the inlet wastewater. It
has been documented previously that D1
line has relatively higher iron content and
worse water quality in the field areas
compared with D2 line in the summer as
shown in Figure 3 (Qianqian Zhou, 2008).
Figure 3: Mapping of Fe-II oxidizing in D1 and D2 lines. The achieved Fe-II oxidation percentage
was only 12% in the pre-aeration tank of D1 line and 40% in D2 line (Qianqian Zhou, 2008).
4. Results
Investigations of Fe-II oxidation in
deionized water and tap water have been
performed. It demonstrated that deionized
water could not be used for Fe-II oxidation
test due to its low pH (pH is about 5). Tap
water can not properly reflect the practical
conditions and reactions occurred in the
wastewater, wastewater is recommended to be
applied to the further lab tests.
The results showed that the operational
conditions (pH, DO, turbulence condition) in
pre-aeration are essential for the Fe-II
oxidation, which are shown in Figure 4, 5, 6
respectively.
Figure 4 shows that low pH has negative
impact on Fe-II oxidation during the aeration.
It could be seen from Figure 5 and Figure
6 that higher oxygen level and turbulence
condition result in better oxidation
performance.
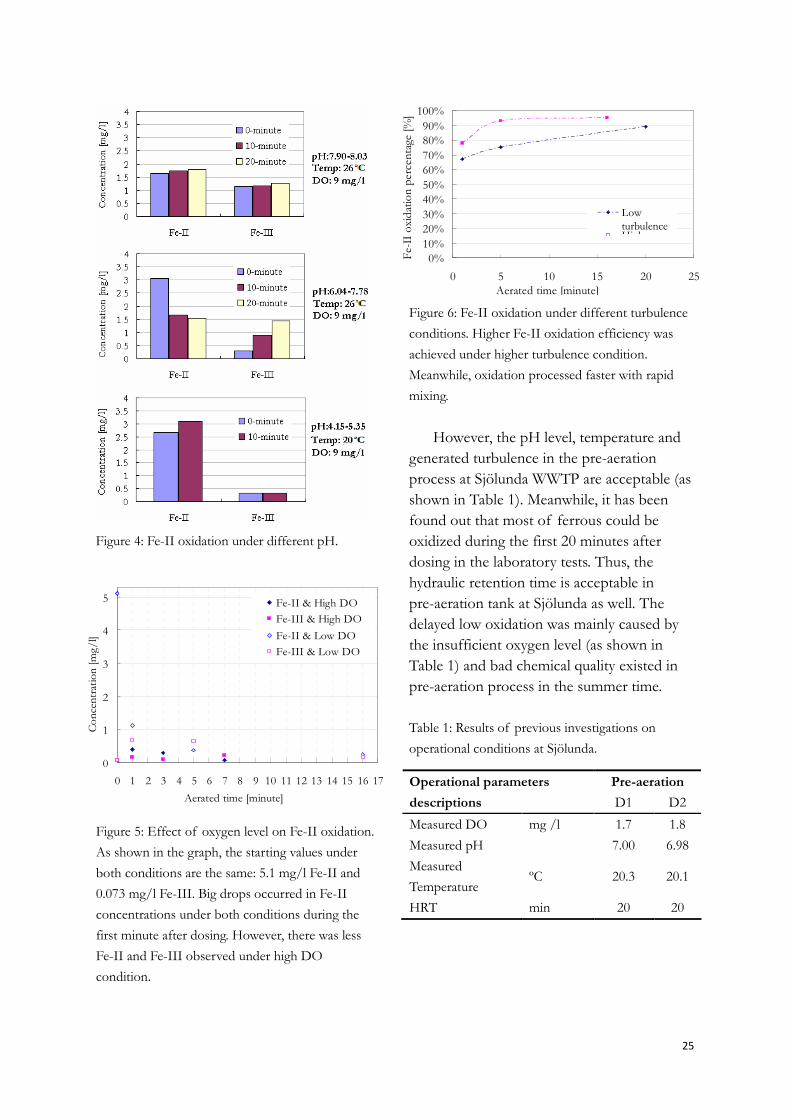
25
Figure 4: Fe-II oxidation under different pH.
0
1
2
3
4
5
0 1 2 3 4 5 6 7 8 9 10 11 12 13 14 15 16 17
Aerated time [minute]
Conce
ntr
atio
n [m
g/l]
Fe-II & High DO
Fe-III & High DO
Fe-II & Low DO
Fe-III & Low DO
Figure 5: Effect of oxygen level on Fe-II oxidation.
As shown in the graph, the starting values under
both conditions are the same: 5.1 mg/l Fe-II and
0.073 mg/l Fe-III. Big drops occurred in Fe-II
concentrations under both conditions during the
first minute after dosing. However, there was less
Fe-II and Fe-III observed under high DO
condition.
0%
10%
20%
30%
40%
50%
60%
70%
80%
90%
100%
0 5 10 15 20 25Aerated time [minute]
Fe-
II o
xidat
ion p
erce
nta
ge [%
]
LowturbulenceHigh
Figure 6: Fe-II oxidation under different turbulence
conditions. Higher Fe-II oxidation efficiency was
achieved under higher turbulence condition.
Meanwhile, oxidation processed faster with rapid
mixing.
However, the pH level, temperature and
generated turbulence in the pre-aeration
process at Sjölunda WWTP are acceptable (as
shown in Table 1). Meanwhile, it has been
found out that most of ferrous could be
oxidized during the first 20 minutes after
dosing in the laboratory tests. Thus, the
hydraulic retention time is acceptable in
pre-aeration tank at Sjölunda as well. The
delayed low oxidation was mainly caused by
the insufficient oxygen level (as shown in
Table 1) and bad chemical quality existed in
pre-aeration process in the summer time.
Table 1: Results of previous investigations on
operational conditions at Sjölunda.
Pre-aeration Operational parameters
descriptions D1 D2
Measured DO mg /l 1.7 1.8
Measured pH 7.00 6.98
Measured
Temperature ºC 20.3 20.1
HRT min 20 20
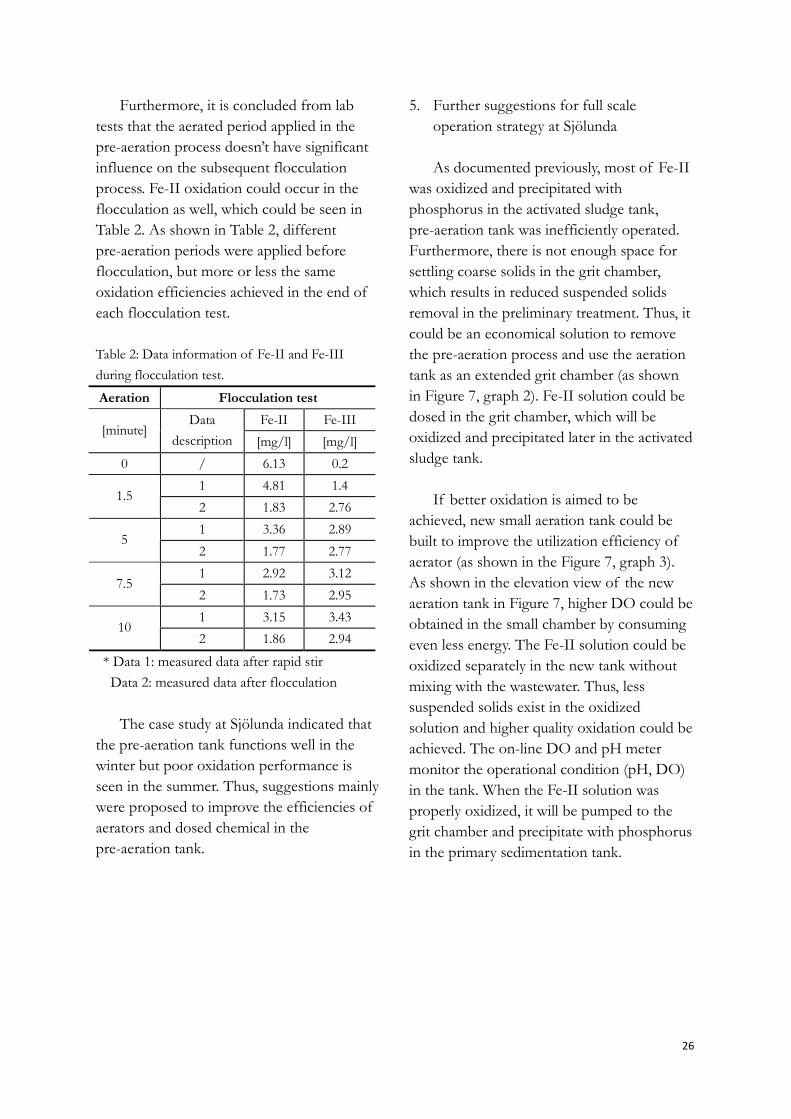
26
Furthermore, it is concluded from lab
tests that the aerated period applied in the
pre-aeration process doesn’t have significant
influence on the subsequent flocculation
process. Fe-II oxidation could occur in the
flocculation as well, which could be seen in
Table 2. As shown in Table 2, different
pre-aeration periods were applied before
flocculation, but more or less the same
oxidation efficiencies achieved in the end of
each flocculation test.
Table 2: Data information of Fe-II and Fe-III
during flocculation test.
* Data 1: measured data after rapid stir
Data 2: measured data after flocculation
The case study at Sjölunda indicated that
the pre-aeration tank functions well in the
winter but poor oxidation performance is
seen in the summer. Thus, suggestions mainly
were proposed to improve the efficiencies of
aerators and dosed chemical in the
pre-aeration tank.
5. Further suggestions for full scale
operation strategy at Sjölunda
As documented previously, most of Fe-II
was oxidized and precipitated with
phosphorus in the activated sludge tank,
pre-aeration tank was inefficiently operated.
Furthermore, there is not enough space for
settling coarse solids in the grit chamber,
which results in reduced suspended solids
removal in the preliminary treatment. Thus, it
could be an economical solution to remove
the pre-aeration process and use the aeration
tank as an extended grit chamber (as shown
in Figure 7, graph 2). Fe-II solution could be
dosed in the grit chamber, which will be
oxidized and precipitated later in the activated
sludge tank.
If better oxidation is aimed to be
achieved, new small aeration tank could be
built to improve the utilization efficiency of
aerator (as shown in the Figure 7, graph 3).
As shown in the elevation view of the new
aeration tank in Figure 7, higher DO could be
obtained in the small chamber by consuming
even less energy. The Fe-II solution could be
oxidized separately in the new tank without
mixing with the wastewater. Thus, less
suspended solids exist in the oxidized
solution and higher quality oxidation could be
achieved. The on-line DO and pH meter
monitor the operational condition (pH, DO)
in the tank. When the Fe-II solution was
properly oxidized, it will be pumped to the
grit chamber and precipitate with phosphorus
in the primary sedimentation tank.
Aeration Flocculation test
Fe-II Fe-III [minute]
Data
description [mg/l] [mg/l]
0 / 6.13 0.2
1 4.81 1.4 1.5
2 1.83 2.76
1 3.36 2.89 5
2 1.77 2.77
1 2.92 3.12 7.5
2 1.73 2.95
1 3.15 3.43 10
2 1.86 2.94
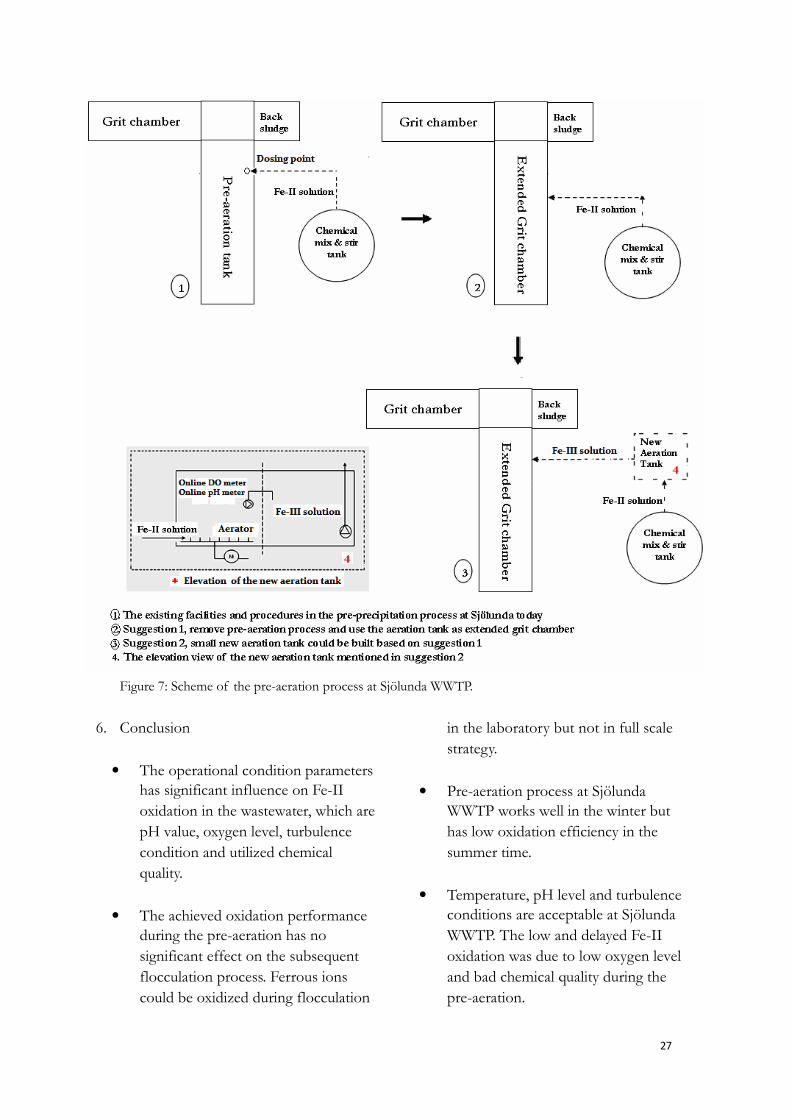
27
Figure 7: Scheme of the pre-aeration process at Sjölunda WWTP.
6. Conclusion
• The operational condition parameters
has significant influence on Fe-II
oxidation in the wastewater, which are
pH value, oxygen level, turbulence
condition and utilized chemical
quality.
• The achieved oxidation performance
during the pre-aeration has no
significant effect on the subsequent
flocculation process. Ferrous ions
could be oxidized during flocculation
in the laboratory but not in full scale
strategy.
• Pre-aeration process at Sjölunda
WWTP works well in the winter but
has low oxidation efficiency in the
summer time.
• Temperature, pH level and turbulence
conditions are acceptable at Sjölunda
WWTP. The low and delayed Fe-II
oxidation was due to low oxygen level
and bad chemical quality during the
pre-aeration.

2
Reference
David Gustavsson, 2008. Personal
communication
Qianqian Zhou, 2008. “Economical and process
investigations of iron activation process in the
pre-precipitation treatment at Sjölunda WWTP”
VA SYD (Internal report)
VA SYD, 2008. Personal communication