investigations on bendamustine esters as new antitumor ... · pdf file1.4.3 identification of...
TRANSCRIPT

Investigations on bendamustine esters as new
antitumor agents and the role of ABCG2 as a
surrogate marker of breast cancer initiating cells
Dissertation
Zur Erlangung des Doktorgrades der Naturwissenschaften (Dr. rer. nat.)
an der Fakultät Chemie und Pharmazie der Universität Regensburg.
vorgelegt von
Stefan Huber
aus Waiblingen
2015


Die vorliegende Arbeit entstand in der Zeit vom März 2011 bis November 2014 unter der
Anleitung von Herrn Prof. Dr. Armin Buschauer am Institut für Pharmazie der
Naturwissenschaftlichen Fakultät IV – Chemie und Pharmazie – der Universität Regensburg.
Das Promotionsgesuch wurde eingereicht im Februar 2015.
Tag der mündlichen Prüfung: 06.03.2015
Prüfungsausschuss: Prof. Dr. J. Heilmann (Vorsitzender)
Prof. Dr. A. Buschauer (Erstgutachter)
Prof. Dr. G. Brockhoff (Zweitgutachter)
Prof. Dr. J. Wegener (Drittprüfer)


Für meine Familie


Danksagung:
An dieser Stelle möchte ich mich herzlich bei allen die zum Gelingen dieser Arbeit beigetragen
und mich während der Promotion begleitet haben bedanken. Besonderer Dank geht an:
Herrn Prof. Dr. Armin Buschauer für die Möglichkeit interessante und vielseitige Projekte zu
bearbeiten, für die stete Ermöglichung Ideen umsetzen zu können und die gewährte forscherische
Freiheit, für die zu jedem Zeitpunkt gesicherte Finanzierung und nicht zuletzt für die konstruktive
Kritik und die vielen investierten Stunden bei der Durchsicht der Publikationen und dieser Arbeit.
Prof. Dr. Gero Brockhoff (Abteilung für Frauenheilkunde und Geburtshilfe, Universität
Regensburg) für die Unterstützung und das stete, große Interesse am Fortgang meiner Arbeit, für
die kompetente Hilfe bei verschiedenen Fragestellungen und für die konstruktive Kritik und
investierte Zeit bei der Durchsicht der Publikation.
Prof. Dr. Günther Bernhardt für seine Hilfsbereitschaft, sein breites Wissen, die konstruktive Kritik
bei der Durchsicht der Publikationen und für das hervorragende Sommerfest.
Der Arevi Pharma GmbH sowie Dr. Helmut Schickaneder und Christian Schickaneder für die
Synthese und Bereitstellung der Bendamustinester.
Prof. Dr. Jörg König (Abteilung klinische Pharmakologie, Institut für Pharmakologie und
Toxikologie, Friedrich-Alexander Universität, Erlangen) für die zur Verfügung gestellten HEK-OCT
Zelllinien und die Durchführung der qPCR auf OCT-Expression in humanen Krebszelllinien sowie
die Durchsicht der Publikation.
Dr. Anja Wege (Abteilung für Frauenheilkunde und Geburtshilfe, Universität Regensburg) für die
hohe Motivation, außerordentliche Freundlichkeit und stete Hilfsbereitschaft bei zytometrischen
und tierexperimentellen Arbeiten, sowie für die Durchführung der Versuche im NSG-Mausmodell.
Johannes Hüttner (Institut für Pharmakologie und Toxikologie, Universität Regensburg) für viele
zum einen kritische, fachlich inspirierende und zum anderen freundschaftliche und
unterhaltsame Gespräche inner- und außerhalb der Universität sowie für die tatkräftige
Unterstützung bei der Konfokalmikroskopie.
Frauke Antoni für die gute Zusammenarbeit und ihr großes Engagement und Interesse während
ihrer Masterarbeit sowie für die Synthese und Testung der Bendamustinester die Teil dieser
Arbeit wurden.
PD Dr. Petra Hoffmann (Klinik und Polyklinik für Innere Medizin III, Universität Regensburg) und
ihren Mitarbeitern Dr. Monique Germerodt und Rüdiger Eder für die Möglichkeit den FACSAria™
IIu zur Zellsortierung zu nutzen und die große Hilfe bei der praktischen Durchführung.
Dr. Thilo Spruss und Franz Wiesenmayer für die Betreuung und Hilfe bei der Durchführung der
tierexperimentellen Arbeiten.

Maria Beer-Krön für die tatkräftige Unterstützung bei verschiedensten Laborarbeiten sowie für
ihr stetes Interesse, ihre Fröhlichkeit und Hilfsbereitschaft bei jedwedem Problem.
Petra Pistor und Rosa Kromas für die Anfertigung der histologischen Färbungen der Maustumore.
Peter Richthammer für die Unterstützung bei technischen Problemen und der Wartung von
Geräten.
Brigitte Wenzl für die Vorbereitung des Biochemiepraktikums und die Durchführung der
Mycoplasmentests.
Meinen Bürokollegen Dr. Johannes Felixberger, Dr. Uwe Nordemann und Nicole Plank für viele
unterhaltsame Stunden, anregende Diskussionen fachlicher und anderweitiger Natur und die
stets hervorragende Stimmung.
Allen aktuellen und ehemaligen Mitarbeitern des Lehrstuhls, insbesondere Dr. Paul Baumeister,
Dr. Tobias Birnkammer, Dr. Miriam Ertel, Dr. Roland Geyer, Dr. Tobias Holzammer, Dr. Melanie
Kaske, Dr. Carolin Meyer, Dr. Nikola Pluym und Dr. Stefanie Rodler für die herzliche Aufnahme im
Arbeitskreis, viele unterhaltsame Gespräche und die schöne gemeinsame Zeit in Regensburg.
Zuletzt denjenigen die den Weg bis zur Promotion erst ermöglicht haben und derer Unterstützung
ich mir auch währenddessen immer bewusst sein konnte: meinen Eltern, meinen Brüdern und
meiner Freundin Maria.

Patents and Publications:
Patents:
1. Schickaneder H., Schickaneder C., Buschauer A., Bernhardt G., Huber S., Limmert M.,
Bendamustine derivatives and related compounds, and medical use thereof in cancer therapy,
International Patent Application, Int. Pub. Nr.: WO2013/189847 A1, 2013
2. Schickaneder H., Buschauer A., Bernhardt G., Schickaneder C., Limmert M., Huber S., Esters of
bendamustine and related compounds, and medical use thereof, European Patent
Application, Appl. Nr.: 12165728.2, 2013
Publications:
1. Huber S, Antoni F, Schickaneder C, Schickaneder H, Bernhardt G, Buschauer A, Stabilities of
neutral and basic esters of bendamustine in plasma compared to the parent compound:
Kinetic investigations by HPLC, J Pharm Biomed Anal. 2015;104: 137-143
2. Huber S, Wege A K, Bernhardt G, Buschauer A, Brockhoff G, Topotecan-induced ABCG2
expression in MCF7-cells is associated with decreased CD24 and EpCAM expression and a loss
of tumorigenicity, Cytometry A. 2014, under revision
3. Huber S, Huettner J P, Hacker K, Bernhardt G, König J, Buschauer A, Esters of bendamustine
are by far more potent cytotoxic agents than the parent compound against human sarcoma
and carcinoma cells, PloS One. 2015, submitted
Poster presentations:
10/2014 Annual conference of the DGFZ, Dresden.
Huber S., Wege A. K., Bernhardt G., Buschauer A., Brockhoff G.
„Topotecan-induced decrease in CD24 expression leads to a loss of tumorigenicity
of human MCF-7 breast cancer cells.”
10/2013 Annual meeting of the DPhG, Freiburg.
Huber S., Bernhardt G., Buschauer A.
„Bendamustine esters versus bendamustine: cytotoxicity and stability“
10/2013 Annual meeting of the DPhG, Freiburg.
Huber S., Bernhardt G., Buschauer A.
„Esters of bendamustine are superior to the parent compound in terms of
induction of p53 expression and cellular accumulation“


Contents:
1. Chapter I: General Introduction ....................................................................... 1
1.1 Cancer - definition and significance .................................................................................. 2
1.2 Classification of cancer ...................................................................................................... 2
1.3 Development of cancer ..................................................................................................... 2
1.4 Tumor heterogeneity and cancer stem cells ..................................................................... 4
1.4.1 Cancer stem cells or cancer initiating cells?............................................................... 4
1.4.2 Origin of cancer initiating cells ................................................................................... 5
1.4.3 Identification of cancer initiating cells ....................................................................... 5
1.5 Cancer chemotherapy ....................................................................................................... 7
1.5.1 Alkylating agents ........................................................................................................ 7
1.5.2 Classical alkylating agents .......................................................................................... 7
1.5.2.1 Nitrogen mustard (N-Lost) derivatives .............................................................................. 9
1.6 Bendamustine .................................................................................................................. 11
1.6.1 Development of bendamustine ............................................................................... 11
1.6.2 Bendamustine in cancer therapy ............................................................................. 11
1.6.3 Mechanism of action ................................................................................................ 12
1.6.4 Stability and metabolism .......................................................................................... 12
1.7 References ....................................................................................................................... 14
2. Chapter II: Scope and Objectives .................................................................... 23
2.1 Investigation of ABC transporter expression and cancer initiating cells in human cancer cell lines ...................................................................................................................................... 24
2.2 Investigations on the stability and cytotoxic activity of bendamustine esters ............... 24
2.3 References ....................................................................................................................... 25
3. Chapter III: Investigation of ABC transporter expression and cancer initiating cells in human cancer cell lines .......................................................................... 27
3.1 Introduction ..................................................................................................................... 28
3.2 Materials and methods.................................................................................................... 30
3.2.1 Reagents and antibodies .......................................................................................... 30
3.2.2 Cell lines and standard cell culture .......................................................................... 30
3.2.3 Neuro-/mammosphere culture and limiting dilution assay ..................................... 31

3.2.4 Determination of IC50 values .................................................................................... 32
3.2.5 Flow cytometric screening of CIC - and side population markers ........................... 32
3.2.5.1 Cell surface markers ........................................................................................................ 32
3.2.5.2 Flow cytometric mitoxantrone efflux assay .................................................................... 33
3.2.6 Fluorescence activated cell sorting (FACS)............................................................... 33
3.2.7 Tumorigenicity and growth kinetics of subcutaneous tumors in nude mice .......... 34
3.2.8 Tumor processing ..................................................................................................... 34
3.2.8.1 Flow cytometric characterization of tumors ................................................................... 34
3.2.8.2 Histology .......................................................................................................................... 35
3.3 Investigation of human brain tumor cells ....................................................................... 36
3.3.1 Expression of CD133 and ABC-transporters ............................................................. 36
3.3.2 Neurosphere culture and stability of CD133 expression in Daoy-CD133+ cells ....... 37
3.3.3 Tumorigenicity of Daoy and Daoy-CD133+ cells ....................................................... 38
3.3.4 Flow cytometric characterization of Daoy tumors................................................... 38
3.3.5 Discussion ................................................................................................................. 39
3.4 Investigation of human breast cancer cells ..................................................................... 40
3.4.1 Expression of CD24, CD44, ABCB1 and ABCG2 ........................................................ 40
3.4.2 Tumorigenicity of MDA-MB-231 cells ...................................................................... 41
3.4.3 Discussion ................................................................................................................. 41
3.5 Effects of topotecan treatment on MCF-7 cells .............................................................. 42
3.5.1 Expression profile of ABCG2 and ABCB1 in different MCF-7 variants ..................... 42
3.5.2 Expression of CD24, CD44, EpCAM and HER2 in MCF-7 variants ............................ 43
3.5.3 Chemosensitivity of MCF-7 and MCF-7/Topo cells .................................................. 44
3.5.4 Mammosphere culture and limiting dilution assays ................................................ 44
3.5.5 In vivo investigations of MCF-7 variants .................................................................. 46
3.5.6 Discussion ................................................................................................................. 48
3.6 Conclusion ....................................................................................................................... 50
3.7 References ....................................................................................................................... 51
4. Chapter IV: Stabilities of neutral and basic esters of bendamustine in plasma compared to the parent compound: Kinetic investigations by HPLC .................. 55
4.1 Introduction ..................................................................................................................... 56
4.2 Materials and Methods ................................................................................................... 58
4.2.1 Chemicals and reagents ........................................................................................... 58

4.2.2 Analytical procedures ............................................................................................... 58
4.2.2.1 Instumentation ................................................................................................................ 58
4.2.2.2 HPLC conditions ............................................................................................................... 58
4.2.2.3 Standards and calibration ................................................................................................ 58
4.2.3 Determination of the stability of bendamustine and bendamustine esters ........... 59
4.2.3.1 Stability in phosphate buffer ........................................................................................... 59
4.2.3.2 Stability in human and murine plasma ............................................................................ 59
4.2.3.3 Stability depending on protein concentration ................................................................ 60
4.2.3.4 Determination of the activity of unspecific esterases ..................................................... 60
4.3 Results .............................................................................................................................. 61
4.3.1 Validation of the HPLC-method................................................................................ 61
4.3.2 Stability in phosphate buffer (pH 7.4) ...................................................................... 64
4.3.3 Stability in murine and human plasma .................................................................... 64
4.3.4 Influence of protein concentration and esterase activity on the degradation of bendamustine esters .............................................................................................................. 67
4.4 Discussion ........................................................................................................................ 68
4.5 Conclusion ....................................................................................................................... 70
4.6 Supplementary material: Method validation .................................................................. 71
4.7 References ....................................................................................................................... 74
5. Chapter V: Esters of bendamustine are by far more potent cytotoxic agents than the parent compound against human sarcoma and carcinoma cells .................. 77
5.1 Introduction ..................................................................................................................... 78
5.2 Material and Methods ..................................................................................................... 80
5.2.1 Ethics Statement ...................................................................................................... 80
5.2.2 Chemicals and reagents ........................................................................................... 80
5.2.3 Cell culture................................................................................................................ 80
5.2.3.1 HEK293 cells expressing the human organic cation transporters OCT1 or OCT3 ........... 81
5.2.4 Chemosensitivity assays ........................................................................................... 81
5.2.5 Detection of apoptosis (annexin V/propidium iodide assay)................................... 82
5.2.6 Detection of p53 expression by immunoblotting .................................................... 82
5.2.7 Quantification of cell-associated bendamustine and derivatives ............................ 83
5.2.8 Flow cytometric determination of OCT1 and OCT3 activity .................................... 83
5.2.9 Imaging of cellular ASP+ uptake by confocal laser scanning microscopy ................. 84

5.2.10 Determination of OCT1 and OCT3 expression by various cancer cells .................... 84
5.2.11 Western blot analysis of hOCT1 expression ............................................................. 85
5.2.12 Immunofluorescence detection of hOCT1 expression ............................................. 86
5.2.13 [3H]MPP+ transport assay ........................................................................................ 86
5.3 Results and discussion ..................................................................................................... 87
5.3.1 Cytotoxicity of bendamustine and derivatives ........................................................ 87
5.3.2 Induction of apoptosis and p53 expression by compounds 1, 2, 4 and 5 ................ 90
5.3.3 Cellular accumulation of bendamustine and derivatives......................................... 91
5.3.4 Effect of bendamustine derivatives on the activities of OCT1 and OCT3 ................ 94
5.3.4.1 ASP+ uptake by OCT1 and OCT3 expressing HEK293 cells ............................................... 94
5.3.4.2 Determination of the affinities of OCT1 and OCT3 to ASP+ as substrate. ....................... 95
5.3.4.3 Inhibition of OCT mediated ASP+ uptake by bendamustine derivatives. ........................ 95
5.3.4.4 Expression of OCT1 (SLC22A1) and OCT3 (SLC22A3) by cancer cells. ............................. 96
5.4 Conclusion ....................................................................................................................... 97
5.5 Supporting Information ................................................................................................... 98
5.6 References ..................................................................................................................... 112
6. Chapter VI: Summary ................................................................................... 117

1 Chapter I
General introduction

2 Chapter I
1.1 Cancer - definition and significance
The National Cancer Institute defines cancer as a “term used for diseases in which abnormal cells
divide without control and are able to invade other tissues”. More than 100 different identified
types of cancer underline the variability of this disease (c.f.
http://www.cancer.gov/cancertopics/cancerlibrary/what-is-cancer). Malignant neoplasms,
termed cancer, differ from benign neoplasms in the ability to infiltrate the surrounding tissues,
resulting in the destruction of the latter, as well as the ability to spread to regional lymph nodes
and distant organs via blood vessels and lymphatic channels (metastasis).
Cancer is among the leading causes of death worldwide, with estimated 8.2 million deaths in 2012
[1] and additional 32.6 million people living with cancer. Among the multitude of different cancer
types, lung (1.6 million), liver (0.75 million), stomach, colorectal (both 0.7 million) and breast
cancers (0.5 million) cause the highest number of deaths each year. The frequency of cancer types
and related deaths is sex-dependent, which becomes most obvious in the case of breast cancer
which had the highest mortality among women in 2008 [2].
1.2 Classification of cancer
The variety of cancer types can be described according to different criteria. Based on the cells of
origin, cancer is usually distinguished in carcinomas, and sarcomas, the latter including
hematological neoplasms (leukemia and lymphoma), all of which are divided into subgroups [3].
Carcinomas, which are divided into the major subtypes adenocarcinoma and squamous cell
carcinoma, arise from epithelial cells and represent the vast majority of all cancer types (85 %),
including most neoplasms of lung, breast, prostate, colon and pancreas. Sarcomas are defined as
cancer arising from mesenchymal origin, e.g. bone, muscle or connective tissues. The
hematological neoplasms leukemia and lymphoma arise from the hematopoietic tissue. Leukemia
develops in the bone marrow and is characterized by an overproduction of immature white blood
cells. Lymphomas (e. g. Hodgkin and non-Hodgkin lymphoma) and myelomas develop in the
primary and secondary lymphatic tissues.
1.3 Development of cancer
Cancer development is most commonly regarded as a clonal process, derived from a single cell
[4], comprising different stages, termed initiation, promotion and progression [5]. Initiation is
characterized by alterations (mutations) in the genome, whereby additional spontaneous
mutations and external effectors are considered as triggers. The external carcinogenic factors
comprise physical (e.g. ionizing radiation), chemical (e.g. polycyclic aromatic hydrocarbons,

Development of cancer 3
alkylating agents) and biological (e.g. viral infections [6]) damages. Epigenetic alterations such as
changes in DNA methylation [7] as well as a variety of possible mutations, for example alterations
in single nucleotides [8, 9] or chromosomal translocation [10-12], have been associated with
cancer development.
Especially mutations in tumor suppressor genes (usually accompanied by a loss of function) and
proto-oncogenes (usually gain of function) are associated with cancer [13]. For instance, cells with
mutations in the tumor suppressor gene p53, i.e. decrease/loss of function of the p53 protein,
can escape apoptosis [14]. However, “Gain of function” such as enhanced cell proliferation or the
stimulation of epithelial-to-mesenchymal transition, cell motility and invasion are associated with
p53 mutations as well [14]. In contrast, mutated or abnormally expressed proto-oncogenes (then
referred to as activated oncogenes) and the related oncoproteins (e.g. platelet derived growth
factor, epidermal growth factor receptor) commonly trigger proliferation or restrict apoptosis
[15]. Besides mutations in tumor suppressor or proto-oncogenes, mutations resulting in reduced
DNA repair contribute to cancer development [16, 17].
It is assumed that promoting agents (e.g. phorbol esters, reactive oxygen species [18-21]), acting
as mitogens, trigger clonal expansion and proliferation of the initiated tumor cell [5, 22, 23]. The
genetic instability, acquired during initiation, in combination with the proliferation and clonal
expansion in the promotion phase leads to varying malignant phenotypes during the progression
phase [24], a process which can take many years, increasing the heterogeneity of the developing
tumor [5]. However, it should be noted that carcinogenesis is considered as a multicausal,
multigenic and multistep process, involving genetic as well as epigenetic factors [25]. Besides
spontaneous mutations and external factors, stromal cells, forming a permissive
microenvironment (niche) surrounding the initiated cell, are assumed to contribute to
carcinogenesis [26].

4 Chapter I
1.4 Tumor heterogeneity and cancer stem cells
The phenotypic heterogeneity of cancer cells [27, 28] is not fully understood. Two models the
“stochastic” and the “cancer stem cell model”, were proposed [29-31].
The “classical” model assumes that random (stochastic) events change the behavior of single
tumor cells, resulting in heterogeneity. These events can either be intrinsic (e.g. transcription
factors) or extrinsic (e.g. microenvironment, immune response). In this model, all cancer cells
have the potential of self-renewal and proliferation.
In contrast, the stem cell model assumes the similarity of tumors to healthy tissues (e.g. colon
epithelium and blood cells), which are commonly organized in hierarchies with stem cells,
possessing self-renewing capacity, on top. In this model, so-called cancer stem cells give rise to
progenitor cells, which in turn differentiate or proliferate resulting in heterogeneous populations
of cancer cells.
However, high plasticity (ability to change the phenotype) between different “states” of cancer
cells was recently reported for breast cancer. Sorted cells of three distinct differentiation states,
described as stem-like (CD24-/CD44high/EpCAMlow), basal (CD24-/CD44high/EpCAM-) and luminal
(CD24high/CD44low/EpCAMhigh), were able to give rise to all three phenotypes by interconversion,
resulting in initial equilibrium proportions [32]. It has to be stated that the authors of the cited
study did not claim that their data would contradict the presence of “cancer stem cells”. In
contrast, they concluded that cells in different “states” are able to give rise to “cancer stem cells”.
The increasing knowledge about plasticity of cancer cells challenges cancer hierarchy, requiring
more complex models to explain cancer cell heterogeneity. One approach, addressing this issue
is for example the “CSC plasticity model” [33], which considers the majority of the tumor cell mass
as cells with stem cell properties. The stem cell properties are supposed to vary depending, for
example, on the microenvironment.
1.4.1 Cancer stem cells or cancer initiating cells?
Uni- or multipotent adult stem cells in healthy tissues share properties with cancer cells, such as
self-renewal and asymmetric division, giving rise to new tissue [34]. This fueled speculations
about the existence of cancer stem cells (CSC) and their involvement in carcinogenesis and
relapse. The self-renewing capacity of both cell types is considered to be regulated by similar
signaling pathways (e.g. Wnt [35, 36], Sonic Hedgehog [36, 37] and Notch [38, 39]). According to
McCulloch and Siminovitch [40, 41], the proof of stem cell properties is achieved by
demonstrating the self-renewing capacity, illustrated by colony forming ability in vitro [42] and
tumorigenicity in vivo. Lapidot et al. identified “cancer stem cells” in acute myeloid leukemia
(AML) [43], and suggested the formation of colonies or tumor spheres in vitro [44, 45] and the

Tumor heterogeneity and cancer stem cells 5
tumorigenicity in immunodeficient mice as the state-of-the-art methods to define “cancer stem
cell” properties [29, 46]. In accordance to the methods used for the actual proof of stem cell-like
properties by tumor initiation respectively sphere formation, Beck et al. suggested the use of the
terms “tumor propagating” or “cancer initiating cell” (TPC, CIC) rather than cancer stem cell [29].
Apart from self-renewal and asymmetric cell division, adult stem cells and CICs share
characteristics such as the ability to secrete growth factors, leading to independent growth
control of cells and induction of angiogenesis [47], the expression of ABC transporters [29] and
other cell surface proteins referred to as stem cell markers (discussed in section 1.4.3).
1.4.2 Origin of cancer initiating cells
The origin of CICs has not unambiguously been clarified. Different hypotheses especially for
hematological diseases, have been discussed in the last years [43]. CICs may result from
transforming mutations of adult stem cells leading to abnormal growth and differentiation [34,
48-50]. This is supported by the fact that tissue specific stem cell markers are also expressed on
the corresponding CICs [51]. The influence of the surrounding microenvironment (niche),
especially in endothelial tissue, may also play a crucial role in the development of CICs originating
from adult stem cells [47, 52, 53].
A different concept considers mutations in progenitor cells as initial step in the development of
CICs [34, 54], since only few mutations affecting mechanisms which regulate cell death would be
necessary to gain stem cell properties accompanied by uncontrolled cell growth [43, 55, 56].
Additionally, de-differentiation of progenitor or differentiated cells as well as the fusion of tissue-
specific stem cells with circulating bone marrow stem cells are discussed [51, 57].
1.4.3 Identification of cancer initiating cells
A considerable number of markers, usually expressed on CICs and adult stem cells originating
from specific tissues, was described in the last years. The detection of their expression is the most
commonly used method for the identification of CICs [46]. To name only a few examples, the
detection of CD133 [58, 59] respectively a combination of CD133 and nestin [60, 61] is considered
indicative for brain tumor initiating cells (BTIC). The identification of breast cancer initiating cells
(BCIC) is usually based on the differential expression of the cell surface proteins CD24 and CD44.
The expression pattern of BCIC populations was reported as CD24-/CD44+ [62-64]. Nevertheless,
there is no clear correlation between the expression of these proteins and stem cell properties
(c.f. section 1.4.1) [65].

6 Chapter I
Besides the detection of cell surface proteins, the identification of CICs based on functional assays
was proposed, e. g. by determining the activities of aldehyde dehydrogenase (ALDH) [66-68] or
the proteasome [69].
Especially in the absence of other specific markers, the determination of so-called side
populations (SP), expressing ATP-binding cassette (ABC) transporters such as ABCB1, ABCC1 and
ABCG2 may be a valuable approach to the identification and enrichment of CICs [70]. However,
the expression of such transporters alone is not strictly associated with stem cell properties, since
CICs often represent only a fraction of the side population [71, 72]. In addition to the
Hoechst 33342 efflux assay for the identification of SPs [73, 74], methods such as the ABCG2-
mediated mitoxantrone efflux assay [75] or the immunodetection of transporter proteins are
frequently performed. Apart from being considered as marker proteins, ABC-transporters such as
ABCB1 (P-gp) [76] and ABCG2 [77-79] impart increased resistance against chemotherapy, as a
considerable number of cytostatic drugs are substrates of these efflux pumps [80].
Commercially available antibodies against CIC markers in combination with flow cytometry led to
the identification of CICs in a great variety of cancer types, including brain tumors [44, 58], breast
cancer [62], colorectal cancer [81, 82], skin squamous cell carcinoma [83], head and neck cancer
[84], lung cancer [85], pancreatic cancer [86], prostate cancer[87] and ovarian cancer [88, 89].

Cancer chemotherapy 7
1.5 Cancer chemotherapy
Chemotherapeutic regimens for the treatment of the majority of cancer types comprise a
combination of different drugs. It is conceivable that enhanced anti-cancer efficacy of drug
combinations is accompanied by reduced systemic toxicity, since lower doses of the individual
drugs are required, especially, if the mechanisms of action and the side effects of the individual
drugs do not overlap. Profound knowledge of the phenotype (e.g. expression of HER2 or EGFR) or
resistance mechanisms (e.g. increased expression of dihydrofolate reductase in case of
methotrexate treatment) favors the identification of appropriate drug combinations. Most
chemotherapeutic regimens are applied in repetitive cycles in order to achieve a reduction of
tumor mass in each cycle [90].
1.5.1 Alkylating agents
Despite the development of targeted anti-tumor drugs, alkylating agents continue to play a
central role amongst cytotoxic chemotherapeutics (e.g. antifolates, antimetabolites, antimitotics,
platinum analogs, topoisomerase inhibitors). Such drugs are applied in conventional combination
therapy as well as in high-dose protocols with subsequent hematopoietic cell transplantation
[91]. Besides the classical alkylating agents (which will be discussed in the following), so-called
nonclassical agents, which do not contain alkylating moieties such as the nitrosourea or the
nitrogen mustard group are frequently used (e.g. procarbazine, temozolomide). These
“monofunctional” drugs are cytotoxic due to covalent binding to the DNA, too, but they usually
undergo complex metabolic transformation to active intermediates [91].
1.5.2 Classical alkylating agents
Alkyl alkanesulfonates (e.g. busulfan), nitrosureas (e.g. carmustine) and nitrogen mustard
derivatives (e.g. bendamustine), the first non-hormonal anti-cancer drugs, are usually classified
as classical alkylating agents. The primary mechanism of action is the covalent binding to DNA,
whereby an active intermediate acts as alkylating agent rather than the parent compound. The
alkylating reaction may proceed according to a SN1 (e.g. chloroethylnitrosureas) or SN2 (e.g.
busulfan) mechanism, which particularly differ regarding the rate of reaction. Alkylation of DNA
results in cytotoxic, mutagenic and carcinogenic effects. The effectiveness of alkylating agents can
be enhanced, for example, by radiation, hyperthermia, inhibition of DNA repair mechanisms and
glutathione depletion [91]. The examination of the sites of alkylation revealed that oxygen atoms
in phosphates [92, 93] and bases as well as nitrogen atoms of purine bases [94] are preferentially

8 Chapter I
alkylated. However, DNA is not exclusively alkylated, but other cellular constituents such as
proteins are alkylated to a minor extent, as shown for nitrogen mustard [95].
Bifunctional alkylators (e.g. nitrogen mustard derivatives) cause intra- and, in particular,
interstrand crosslinks, responsible for effective inhibition of DNA replication and transcription
[96, 97]. This is reflected by overall higher cytotoxic activities of bifunctional agents [98, 99].
Apart from different reactivity of the alkylating moiety, the antitumor activities of alkylating
agents mainly depend on their (physico)chemical properties, influencing the pharmacokinetics
including diffusion or transport across membranes or the activation of cellular resistance
mechanisms [91]. For instance, the uptake of melphalan was reported to be enhanced by amino
acid transporters [100] and the human organic cation transporter 3 (OCT3) [101], which was
recently identified in some human cancer cell lines [101, 102]. Contrary, reduced drug uptake is
a well-known resistance mechanism, for example, for melphalan [103] and mustine (nitrogen
mustard) [104]. Further resistance mechanisms against alkylating agents include enhanced drug
inactivation, changes in cell-cycle checkpoint function (e.g. loss of normal p53 function) and
alterations in DNA repair mechanisms (e.g. enhanced base – and nucleotide excision repair) [91].
The induction of such resistance mechanisms is often accompanied by the development of cross-
resistances against other alkylating agents [91].

Cancer chemotherapy 9
1.5.2.1 Nitrogen mustard (N-Lost) derivatives
The term “Lost” for bis(2-chloroethyl) derivatives of nitrogen and sulfur goes back to the names
of the inventors of this compound class, Lommel and Steinkopf. S-Lost (sulfur mustard, yellow
cross) (Fig. 1.1) was used as a warfare gas in World War I. Massive lymphopenia,
granulocytopenia, thrombocytopenia and moderate anemia in soldiers, who were accidentally
exposed to S-Lost, suggested the therapeutic potential of Lost derivatives [105].
Figure 1.1: Structures of sulfur mustard (war gas), nitrogen mustard (N-Lost, mustine, chlormethine, mechlorethamine) and various derivatives.
Based on these findings, clinical trials on the effects of mustard derivatives against neoplasms of
lymphoid tissue were performed in the US. Sulfur mustard derivatives proved to be inappropriate
for parenteral administration due to severe adverse effects [105]. By contrast, the less reactive
nitrogen mustard derivatives (e.g. mustine (mechlorethamine); c.f. Fig. 1.1) were better tolerated
and led to an initial remission, especially in Hodgkin´s lymphoma [106, 107].
Subsequent investigations focused on structural modification of the N-Lost structure, aiming at
higher chemical stability and less side effects. Therefore, the methyl group in mustine was
replaced by electron-withdrawing substituents, rendering the nitrogen less nucleophilic (Fig. 1.1).
Indeed, such N-Lost derivatives revealed lower systemic toxicities, though accompanied by

10 Chapter I
reduced antitumor activity. Melphalan, chlorambucil, bendamustine, cyclophosphamide and
ifosfamide are examples of approved nitrogen mustard derivatives (c.f. Fig. 1.1). The aziridine
derivative thio-TEPA is also related to the class of nitrogen mustards, although it does not
comprise the bis(2-chloroethyl) group. Upon protonation, the aziridine rings correspond to
aziridinium ions, reminiscent of the highly reactive alkylating intermediates formed from N-Lost
derived alkylators.
Most nitrogen mustard derivatives are indicated to treat hematologic malignancies such as
chronic lymphocytic leukemia (CLL) [108-110], non-Hodgkin´s lymphoma (NHL) [111, 112] and
multiple myeloma (MM) [113]. In contrast to classical mustard derivatives such as melphalan,
spontaneous formation of aziridinium intermediates does not occur in case of cyclophosphamide
and analogs such as ifosfamide. Instead, metabolic activation by CYP450 enzymes is required
[114]. Cyclophosphamide and ifosfamide are also used in the treatment of solid tumors (e.g.
breast cancer [115]; soft tissue sarcoma [116]).
The high alkylating potency of the N-Lost moiety is based on the presence of a nucleophilic center
(S or N) in -position relative to the halogen atom, enabling an intramolecular nucleophilic attack
of a lone pair of electrons. This results in the displacement of the chloro substituent and the
formation of a positively charged group, the highly reactive electrophilic aziridinium moiety,
which subsequently reacts with nucleophiles in the DNA (Fig. 1.2). Due to the bifunctional
character of the nitrogen mustard, this reaction can take place twice, resulting in DNA cross-links
[105].
Figure 1.2: Mechanism of the alkylation of nucleophiles (Nu) by nitrogen mustard derivatives. The bifunctional character enables two consecutive alkylating steps.

Bendamustine 11
1.6 Bendamustine
1.6.1 Development of bendamustine
Bendamustine (initially termed IMET3393) (c.f. Fig. 1.1) was synthesized in 1963 by Ozegowski et
al. at the Institute for Microbiology and Experimental Therapy (IMET) in Jena [117, 118]. The
inventors aimed at combining the alkylating activity of the nitrogen mustard group and potential
antimetabolite properties of the benzimidazole scaffold. In addition, the electron-withdrawing
benzimidazole structure should decrease the nucleophilicity of the nitrogen atom in the N-Lost
group resulting in decreased reactivity and reduced toxicity [119]. To improve the solubility of the
new compound, the butyric acid side chain was introduced, by analogy with the approach known
from chlorambucil (c.f. Fig. 1.1).
First clinical trials with bendamustine in the treatment of several cancer types (e.g., hematologic
malignancies, breast cancer, small cell lung cancer, ovarial cancer) were performed in 1965 [119].
However, bendamustine was barely used in Europe and the US before the end of the “cold war”.
Subsequently, the drug was “re-discovered”, came into the focus of cancer research in Europe
and the US at the end of the 1990s, and has been investigated in many clinical trials.
1.6.2 Bendamustine in cancer therapy
Bendamustine is approved for the treatment of CLL [110, 120], indolent NHL [121] and MM [122,
123] in Germany (Levact®) and for CLL and indolent NHL in the US (Treanda®). Most treatment
regimens apply bendamustine in combination with other cytostatic drugs [124], often with
rituximab [125-127]. Clinical research on bendamustine has been intensified in the last years.
However, most trials with bendamustine as a single agent, for instance, for the treatment of bile
duct cancer [128], soft tissue sarcoma [129], germ cell cancer [130], small cell lung cancer [131-
133], pretreated metastatic [134, 135] or advanced [136] breast cancer revealed on the one hand
good tolerability, but on the other hand limited benefit. Studies on bendamustine in combination
therapy, for example with methotrexate and 5-fluorouracil for the treatment of metastatic breast
cancer [137] or bendamustine with carboplatin for the treatment of small cell lung cancer [138],
reported efficacies which were comparable to respective standard treatment regimens. Due to
mild side effects and reduced cross resistances with other alkylating drugs, bendamustine was
claimed to be an interesting drug for the treatment of patients in poor clinical condition [139] or
as second line therapy [111, 140, 141].

12 Chapter I
1.6.3 Mechanism of action
Speculations about mechanisms of action of bendamustine different from the alkylation of DNA
go back to the synthesis of the compound, based on the idea that the benzimidazole scaffold
might confer antimetabolite activities. This was supported by the COMPARE analysis conducted
at the national cancer institute [142]. In this study, bendamustine revealed a unique activity
pattern against human cancer cell lines, which differed significantly from the activity pattern of
other nitrogen mustard derivatives such as melphalan, chlorambucil and cyclophosphamide.
Gene expression analyses indicated differential bendamustine-induced effects with respect to
genes grouped into “response to DNA-damage stress” and “DNA-metabolism”. These findings led
the authors to the assumption that bendamustine is unique in its ability to induce p53, regulate
DNA-repair and inhibit mitotic checkpoints, leading to mitotic catastrophe [142]. However,
detailed experiments verifying these mechanisms are lacking.
Several recent publications reported the induction of p53 [143, 144] and a concentration
dependent induction of G2 phase arrest by bendamustine [143, 145, 146]. Additional evidence
for effects on the cell cycle was provided by the analysis of proteins regulating cell cycle
checkpoints, e. g. Chk1 [145] and Chk2 [143], and the induction of proteins involved in apoptosis
(caspase-2 and caspase-8) [146]. Therefore, the induction of mitotic catastrophe, an alternate
mechanism of cell death, which is particularly important in cells resistant to apoptosis, is
discussed for bendamustine [146].
Recently, the putative activity as an antimetabolite was re-considered due to additive effects of
various alkylating agents with bendamustine in vitro [147]. The fact that bendamustine was
effective (e.g. induction of apoptosis) already after short exposure (3 hours), was interpreted as
a hint to fast cellular uptake. Accordingly, the additive effect with other alkylating agents was
explained by early effects of bendamustine combined with delayed cytotoxic effects of
compounds entering the cells less rapidly. Moreover, co-incubation of bendamustine with
cytosine arabinoside (CA) (pyrimidine antimetabolite) induced effects which are usually observed
for combinations of pyrimidine with purine analogs (up-regulation of ENT1 expression and
increased concentration of the active metabolite of CA, Ara-CTP). This was interpreted as further
evidence for antimetabolite activity.
1.6.4 Stability and metabolism
The nitrogen mustard group is prone to chemical hydrolysis, in particular at neutral or basic pH
values [148], resulting in the inactive bis(2-hydroxyethylamino)-substituted benzimidazole
derivative upon twofold hydrolysis (Fig. 1.3). The hydrolytic decomposition is prevented or
reduced at acidic pH, because the protonation of the nitrogen atom leads to decreased

Bendamustine 13
nucleophilicity and, consequently, the tendency to form an aziridinium ion is considerably
lowered. The hydrolysis rate is also retarded in the presence of high concentrations of chloride
[148].
Figure 1.3: Phase I metabolism and chemical hydrolysis of bendamustine.
In addition to the chemical hydrolysis of the nitrogen mustard group in plasma, phase I and phase
II metabolites of bendamustine are described in literature. Especially CYP1A2 was assumed to be
relevant for the formation of the two known active phase I metabolites, N-desmethyl-
bendamustine and γ-OH-bendamustine (c.f. Fig. 1.3) [149]. With regard to phase II metabolites,
biliary excretion of N-acetyl-L-cysteine conjugates was previously described as a mechanism of
bendamustine elimination [150, 151].

14 Chapter I
1.7 References
1. Ferlay J, et al. Cancer incidence and mortality worldwide: Sources, methods and major patterns in GLOBOCAN 2012. Int J Cancer. 2014.
2. Jemal A, et al. Global cancer statistics. CA Cancer J Clin. 2011;61: 69-90. 3. Hesketh R. Introduction to Cancer Biology. New York: Cambridge University Press; 2013. 4. Fialkow PJ. Clonal origin of human tumors. Biochim Biophys Acta. 1976;458: 283-321. 5. Ruddon RW. Causes of Cancer. Cancer Biology. New York: Oxford University Press; 2007.
pp. 17-61. 6. de Martel C, et al. Global burden of cancers attributable to infections in 2008: a review
and synthetic analysis. Lancet Oncol. 2012;13: 607-615. 7. Xu Z, Taylor JA. Genome-wide age-related DNA methylation changes in blood and other
tissues relate to histone modification, expression and cancer. Carcinogenesis. 2014;35: 356-364.
8. Davies H, et al. Mutations of the BRAF gene in human cancer. Nature. 2002;417: 949-954. 9. Park JY, et al. Single nucleotide polymorphisms in DNA repair genes and prostate cancer
risk. Methods Mol Biol. 2009;471: 361-385. 10. Croce CM. Chromosome translocations and human cancer. Cancer Res. 1986;46: 6019-
6023. 11. Nussenzweig A, Nussenzweig MC. Origin of chromosomal translocations in lymphoid
cancer. Cell. 2010;141: 27-38. 12. Rowley JD. Letter: A new consistent chromosomal abnormality in chronic myelogenous
leukaemia identified by quinacrine fluorescence and Giemsa staining. Nature. 1973;243: 290-293.
13. King RJB, Robins M. Oncogenes, tumour suppressor genes and viruses. Cancer Biology. Harlow (Essex), England: Pearson Education Limited; 2006. pp. 62-86.
14. Shetzer Y, et al. The paradigm of mutant p53-expressing cancer stem cells and drug resistance. Carcinogenesis. 2014;35: 1196-1208.
15. Croce CM. Oncogenes and cancer. N Engl J Med. 2008;358: 502-511. 16. Dietlein F, et al. Cancer-specific defects in DNA repair pathways as targets for personalized
therapeutic approaches. Trends Genet. 2014;30: 326-339. 17. Lahtz C, Pfeifer GP. Epigenetic changes of DNA repair genes in cancer. J Mol Cell Biol.
2011;3: 51-58. 18. Nakamura Y, et al. Role of reactive oxygen in tumor promotion: implication of superoxide
anion in promotion of neoplastic transformation in JB-6 cells by TPA. Carcinogenesis. 1985;6: 229-235.
19. Waris G, Ahsan H. Reactive oxygen species: role in the development of cancer and various chronic conditions. J Carcinog. 2006;5: 14.
20. Furstenberger G, et al. Skin tumor promotion by phorbol esters is a two-stage process. Proc Natl Acad Sci U S A. 1981;78: 7722-7726.
21. Marks F, Furstenberger G. Multistage tumor promotion in skin. Princess Takamatsu Symp. 1983;14: 273-287.
22. Ruddon RW. Characteristics of Human Cancer. Cancer Biology. New York: Oxford University Press; 2007. pp. 3-16.

References 15
23. Trosko JE, et al. Ignored hallmarks of carcinogenesis: stem cells and cell-cell communication. Ann N Y Acad Sci. 2004;1028: 192-201.
24. Pitot HC, Dragan YP. Facts and theories concerning the mechanisms of carcinogenesis. FASEB J. 1991;5: 2280-2286.
25. Barrett JC. Mechanisms of multistep carcinogenesis and carcinogen risk assessment. Environ Health Perspect. 1993;100: 9-20.
26. Barcellos-Hoff MH, et al. The evolution of the cancer niche during multistage carcinogenesis. Nat Rev Cancer. 2013;13: 511-518.
27. Allison KH, Sledge GW, Jr. Heterogeneity and Cancer. Oncology (Williston Park). 2014;28. 28. Dexter DL, et al. Heterogeneity of cancer cells from a single human colon carcinoma. Am
J Med. 1981;71: 949-956. 29. Beck B, Blanpain C. Unravelling cancer stem cell potential. Nat Rev Cancer. 2013;13: 727-
738. 30. Dick JE. Looking ahead in cancer stem cell research. Nat Biotechnol. 2009;27: 44-46. 31. Dick JE. Stem cell concepts renew cancer research. Blood. 2008;112: 4793-4807. 32. Gupta PB, et al. Stochastic state transitions give rise to phenotypic equilibrium in
populations of cancer cells. Cell. 2011;146: 633-644. 33. Singh AK, et al. Tumor heterogeneity and cancer stem cell paradigm: Updates in concept,
controversies and clinical relevance. Int J Cancer. 2014. 34. Reya T, et al. Stem cells, cancer, and cancer stem cells. Nature. 2001;414: 105-111. 35. Austin TW, et al. A role for the Wnt gene family in hematopoiesis: expansion of
multilineage progenitor cells. Blood. 1997;89: 3624-3635. 36. Taipale J, Beachy PA. The Hedgehog and Wnt signalling pathways in cancer. Nature.
2001;411: 349-354. 37. Bhardwaj G, et al. Sonic hedgehog induces the proliferation of primitive human
hematopoietic cells via BMP regulation. Nat Immunol. 2001;2: 172-180. 38. Karanu FN, et al. The notch ligand jagged-1 represents a novel growth factor of human
hematopoietic stem cells. J Exp Med. 2000;192: 1365-1372. 39. Varnum-Finney B, et al. Pluripotent, cytokine-dependent, hematopoietic stem cells are
immortalized by constitutive Notch1 signaling. Nat Med. 2000;6: 1278-1281. 40. Till JE, Mc CE. A direct measurement of the radiation sensitivity of normal mouse bone
marrow cells. Radiat Res. 1961;14: 213-222. 41. Siminovitch L, et al. The Distribution of Colony-Forming Cells among Spleen Colonies. J Cell
Physiol. 1963;62: 327-336. 42. Svendsen CN, et al. A new method for the rapid and long term growth of human neural
precursor cells. J Neurosci Methods. 1998;85: 141-152. 43. Lapidot T, et al. A cell initiating human acute myeloid leukaemia after transplantation into
SCID mice. Nature. 1994;367: 645-648. 44. Hemmati HD, et al. Cancerous stem cells can arise from pediatric brain tumors. Proc Natl
Acad Sci U S A. 2003;100: 15178-15183. 45. Groszer M, et al. Negative regulation of neural stem/progenitor cell proliferation by the
Pten tumor suppressor gene in vivo. Science. 2001;294: 2186-2189. 46. Moghbeli M, et al. Cancer stem cell detection and isolation. Med Oncol. 2014;31: 69. 47. Ye J, et al. The cancer stem cell niche: cross talk between cancer stem cells and their
microenvironment. Tumour Biol. 2014;35: 3945-3951.

16 Chapter I
48. Bapat SA. Evolution of cancer stem cells. Semin Cancer Biol. 2007;17: 204-213. 49. Bonnet D, Dick JE. Human acute myeloid leukemia is organized as a hierarchy that
originates from a primitive hematopoietic cell. Nat Med. 1997;3: 730-737. 50. Calabrese P, et al. Pretumor progression: clonal evolution of human stem cell populations.
Am J Pathol. 2004;164: 1337-1346. 51. Costa FF, et al. Concise review: cancer/testis antigens, stem cells, and cancer. Stem Cells.
2007;25: 707-711. 52. Lu J, et al. Endothelial cells promote the colorectal cancer stem cell phenotype through a
soluble form of Jagged-1. Cancer Cell. 2013;23: 171-185. 53. Sigurdsson V, et al. Endothelial induced EMT in breast epithelial cells with stem cell
properties. PLoS One. 2011;6: e23833. 54. Krivtsov AV, et al. Transformation from committed progenitor to leukaemia stem cell
initiated by MLL-AF9. Nature. 2006;442: 818-822. 55. Lagasse E, Weissman IL. bcl-2 inhibits apoptosis of neutrophils but not their engulfment
by macrophages. J Exp Med. 1994;179: 1047-1052. 56. Traver D, et al. Mice defective in two apoptosis pathways in the myeloid lineage develop
acute myeloblastic leukemia. Immunity. 1998;9: 47-57. 57. Bapat S. Cancer stem cells identification and targets. Hoboken, NJ: Wiley; 2009. 58. Singh SK, et al. Identification of human brain tumour initiating cells. Nature. 2004;432:
396-401. 59. Uchida N, et al. Direct isolation of human central nervous system stem cells. Proc Natl
Acad Sci U S A. 2000;97: 14720-14725. 60. Dahlstrand J, et al. Expression of the class VI intermediate filament nestin in human central
nervous system tumors. Cancer Res. 1992;52: 5334-5341. 61. Ehrmann J, et al. Nestin as a diagnostic and prognostic marker: immunohistochemical
analysis of its expression in different tumours. J Clin Pathol. 2005;58: 222-223. 62. Al-Hajj M, et al. Prospective identification of tumorigenic breast cancer cells. Proc Natl
Acad Sci U S A. 2003;100: 3983-3988. 63. Ponti D, et al. Isolation and in vitro propagation of tumorigenic breast cancer cells with
stem/progenitor cell properties. Cancer Res. 2005;65: 5506-5511. 64. Manuel Iglesias J, et al. Mammosphere formation in breast carcinoma cell lines depends
upon expression of E-cadherin. PLoS One. 2013;8: e77281. 65. Lehmann C, et al. Established breast cancer stem cell markers do not correlate with in vivo
tumorigenicity of tumor-initiating cells. Int J Oncol. 2012;41: 1932-1942. 66. Rasper M, et al. Aldehyde dehydrogenase 1 positive glioblastoma cells show brain tumor
stem cell capacity. Neuro Oncol. 2010;12: 1024-1033. 67. Marcato P, et al. Aldehyde dehydrogenase activity of breast cancer stem cells is primarily
due to isoform ALDH1A3 and its expression is predictive of metastasis. Stem Cells. 2011;29: 32-45.
68. Ma S, et al. Aldehyde dehydrogenase discriminates the CD133 liver cancer stem cell populations. Mol Cancer Res. 2008;6: 1146-1153.
69. Adikrisna R, et al. Identification of pancreatic cancer stem cells and selective toxicity of chemotherapeutic agents. Gastroenterology. 2012;143: 234-245 e237.
70. Richard V, et al. Side population cells as prototype of chemoresistant, tumor-initiating cells. Biomed Res Int. 2013;2013: 517237.

References 17
71. Zhou S, et al. Bcrp1 gene expression is required for normal numbers of side population stem cells in mice, and confers relative protection to mitoxantrone in hematopoietic cells in vivo. Proc Natl Acad Sci U S A. 2002;99: 12339-12344.
72. Zhou S, et al. The ABC transporter Bcrp1/ABCG2 is expressed in a wide variety of stem cells and is a molecular determinant of the side-population phenotype. Nat Med. 2001;7: 1028-1034.
73. Goodell MA, et al. Dye efflux studies suggest that hematopoietic stem cells expressing low or undetectable levels of CD34 antigen exist in multiple species. Nat Med. 1997;3: 1337-1345.
74. Scharenberg CW, et al. The ABCG2 transporter is an efficient Hoechst 33342 efflux pump and is preferentially expressed by immature human hematopoietic progenitors. Blood. 2002;99: 507-512.
75. Robey RW, et al. A functional assay for detection of the mitoxantrone resistance protein, MXR (ABCG2). Biochim Biophys Acta. 2001;1512: 171-182.
76. Challen GA, Little MH. A side order of stem cells: the SP phenotype. Stem Cells. 2006;24: 3-12.
77. Katayama R, et al. Dofequidar fumarate sensitizes cancer stem-like side population cells to chemotherapeutic drugs by inhibiting ABCG2/BCRP-mediated drug export. Cancer Sci. 2009;100: 2060-2068.
78. Chikazawa N, et al. Inhibition of Wnt signaling pathway decreases chemotherapy-resistant side-population colon cancer cells. Anticancer Res. 2010;30: 2041-2048.
79. Noguchi K, et al. Human ABC transporter ABCG2/BCRP expression in chemoresistance: basic and clinical perspectives for molecular cancer therapeutics. Pharmgenomics Pers Med. 2014;7: 53-64.
80. Dean M, et al. Tumour stem cells and drug resistance. Nat Rev Cancer. 2005;5: 275-284. 81. O'Brien CA, et al. A human colon cancer cell capable of initiating tumour growth in
immunodeficient mice. Nature. 2007;445: 106-110. 82. Ricci-Vitiani L, et al. Identification and expansion of human colon-cancer-initiating cells.
Nature. 2007;445: 111-115. 83. Malanchi I, et al. Cutaneous cancer stem cell maintenance is dependent on beta-catenin
signalling. Nature. 2008;452: 650-653. 84. Prince ME, et al. Identification of a subpopulation of cells with cancer stem cell properties
in head and neck squamous cell carcinoma. Proc Natl Acad Sci U S A. 2007;104: 973-978. 85. Eramo A, et al. Identification and expansion of the tumorigenic lung cancer stem cell
population. Cell Death Differ. 2008;15: 504-514. 86. Li C, et al. Identification of pancreatic cancer stem cells. Cancer Res. 2007;67: 1030-1037. 87. Collins AT, et al. Prospective identification of tumorigenic prostate cancer stem cells.
Cancer Res. 2005;65: 10946-10951. 88. Curley MD, et al. CD133 expression defines a tumor initiating cell population in primary
human ovarian cancer. Stem Cells. 2009;27: 2875-2883. 89. Zhang S, et al. Identification and characterization of ovarian cancer-initiating cells from
primary human tumors. Cancer Res. 2008;68: 4311-4320. 90. Chabner BA. Clinical Strategies for Cancer treatment: The Role of Drugs. In: J. W. Pine Jr.,
editor editors. Cancer Chemotherapy and Biotherapy: Principles and Practice. Philadelphia, USA: Wolters Kluwer; Lippincott Williams & Wilkins; 2011. pp. 3-14.

18 Chapter I
91. Gerson SL, et al. Alkylating Agents. In: J. W. Pine Jr., editor editors. Cancer Chemotherapy and Biotherapy: Principles and Practice. Philadelphia, USA: Wolters Kluwer; Lippincott Williams & Wilkins; 2011. pp. 267-310.
92. Bannon P, Verly W. Alkylation of phosphates and stability of phosphate triesters in DNA. Eur J Biochem. 1972;31: 103-111.
93. Lawley PD. Reaction of N-methyl-N-nitrosourea (MNUA) with 32P-labelled DNA: evidence for formation of phosphotriesters. Chem Biol Interact. 1973;7: 127-130.
94. Osborne MR, Lawley PD. Alkylation of DNA by melphalan with special reference to adenine derivatives and adenine-guanine cross-linking. Chem Biol Interact. 1993;89: 49-60.
95. Skipper HE, et al. Over-all tracer studies with C14 labeled nitrogen mustard in normal and leukemic mice. Cancer. 1951;4: 1025-1027.
96. Brookes P, Lawley PD. The reaction of mono- and di-functional alkylating agents with nucleic acids. Biochem J. 1961;80: 496-503.
97. Lawley PD, Brookes P. The Action of Alkylating Agents on Deoxyribonucleic Acid in Relation to Biological Effects of the Alkylating Agents. Exp Cell Res. 1963;24: SUPPL9:512-520.
98. Erickson LC, et al. DNA crosslinking and cytotoxicity in normal and transformed human cells treated with antitumor nitrosoureas. Proc Natl Acad Sci U S A. 1980;77: 467-471.
99. Garcia ST, et al. Correlation between the cytotoxicity of melphalan and DNA crosslinks as detected by the ethidium bromide fluorescence assay in the F1 variant of B16 melanoma cells. Biochem Pharmacol. 1988;37: 3189-3192.
100. Millar BC, et al. Melphalan transport into human malignant lymphoid cells differs from the murine equivalent in vitro. Br J Cancer. 1989;59: 710-713.
101. Shnitsar V, et al. Expression of human organic cation transporter 3 in kidney carcinoma cell lines increases chemosensitivity to melphalan, irinotecan, and vincristine. Cancer Res. 2009;69: 1494-1501.
102. Yokoo S, et al. Significance of organic cation transporter 3 (SLC22A3) expression for the cytotoxic effect of oxaliplatin in colorectal cancer. Drug Metab Dispos. 2008;36: 2299-2306.
103. Harada N, et al. Down-regulation of CD98 in melphalan-resistant myeloma cells with reduced drug uptake. Acta Haematol. 2000;103: 144-151.
104. Wolpert MK, Ruddon RW. A study on the mechanism of resistance to nitrogen mustard (HN2) in Ehrlich ascites tumor cells: comparison of uptake of HN2-14-C into sensitive and resistant cells. Cancer Res. 1969;29: 873-879.
105. Gilman A, Philips FS. The Biological Actions and Therapeutic Applications of the B-Chloroethyl Amines and Sulfides. Science. 1946;103: 409-436.
106. Jacobson L, Wachowski TJ. The use of nitrogen mustard in the treatment of neoplastic diseases. Bull North Shore Branch Chic Med Soc. 1947: 3-8.
107. Wintrobe MM, et al. Nitrogen mustard as a therapeutic agent for Hodgkin's disease, lymphosarcoma and leukemia. Ann Intern Med. 1947;27: 529-540.
108. Hillmen P, et al. Rituximab plus chlorambucil as first-line treatment for chronic lymphocytic leukemia: Final analysis of an open-label phase II study. J Clin Oncol. 2014;32: 1236-1241.
109. Rai KR, et al. Fludarabine compared with chlorambucil as primary therapy for chronic lymphocytic leukemia. N Engl J Med. 2000;343: 1750-1757.

References 19
110. Knauf WU, et al. Bendamustine compared with chlorambucil in previously untreated patients with chronic lymphocytic leukaemia: updated results of a randomized phase III trial. Br J Haematol. 2012;159: 67-77.
111. Cheson BD, et al. Bendamustine produces durable responses with an acceptable safety profile in patients with rituximab-refractory indolent non-Hodgkin lymphoma. Clin Lymphoma Myeloma Leuk. 2010;10: 452-457.
112. Nordstrom BL, et al. The safety of bendamustine in patients with chronic lymphocytic leukemia or non-Hodgkin lymphoma and concomitant renal impairment: a retrospective electronic medical record database analysis. Leuk Lymphoma. 2014;55: 1266-1273.
113. Suzuki K. Current therapeutic strategy for multiple myeloma. Jpn J Clin Oncol. 2013;43: 116-124.
114. Chang TK, et al. Differential activation of cyclophosphamide and ifosphamide by cytochromes P-450 2B and 3A in human liver microsomes. Cancer Res. 1993;53: 5629-5637.
115. Joensuu H, Gligorov J. Adjuvant treatments for triple-negative breast cancers. Ann Oncol. 2012;23 Suppl 6: vi40-45.
116. van Oosterom AT, et al. Results of randomised studies of the EORTC Soft Tissue and Bone Sarcoma Group (STBSG) with two different ifosfamide regimens in first- and second-line chemotherapy in advanced soft tissue sarcoma patients. Eur J Cancer. 2002;38: 2397-2406.
117. Ozegowski W, Krebs D. Aminosäureantagonisten. III. ω-[Bis-(β-chloräthyl)-amino-benzimidazolyl-(2)]-propion- bzw. -buttersäuren als potentielle Cytostatika. J Prakt Chem. 1963;20: 178-186.
118. Ozegowski W, Krebs D. IMET 3393, -[1-methyl-5-bis-(-chloroethyl)-amino-benzimidazolyl-(2)]-butyric acid hydrochloride, a new cytostatic agent from among the series of benzimidazole mustard compounds. Zentralbl Pharm. 1971;110: 1013-1019.
119. Werner W, et al. [Developmental history: bendamustine yesterday, today, tomorrow]. Onkologie. 2013;36 Suppl 1: 2-10.
120. Hallek M. Signaling the end of chronic lymphocytic leukemia: new frontline treatment strategies. Hematology. 2013: 138-150.
121. Gil L, et al. Bendamustine-based therapy as first-line treatment for non-Hodgkin lymphoma. Med Oncol. 2014;31: 944.
122. Pönisch W, et al. Bendamustine and prednisone in combination with bortezomib (BPV) in the treatment of patients with newly diagnosed/untreated multiple myeloma. J Cancer Res Clin Oncol. 2014;140: 1947-1956.
123. Pönisch W, et al. Treatment of bendamustine and prednisone in patients with newly diagnosed multiple myeloma results in superior complete response rate, prolonged time to treatment failure and improved quality of life compared to treatment with melphalan and prednisone--a randomized phase III study of the East German Study Group of Hematology and Oncology (OSHO). J Cancer Res Clin Oncol. 2006;132: 205-212.
124. Lentzsch S. Bendamustine: the remedy that came in from the cold. Blood. 2014;123: 948-950.
125. Friedberg JW, et al. The combination of bendamustine, bortezomib, and rituximab for patients with relapsed/refractory indolent and mantle cell non-Hodgkin lymphoma. Blood. 2011;117: 2807-2812.

20 Chapter I
126. Rummel MJ, et al. Bendamustine plus rituximab is effective and has a favorable toxicity profile in the treatment of mantle cell and low-grade non-Hodgkin's lymphoma. J Clin Oncol. 2005;23: 3383-3389.
127. Rummel MJ, et al. In vitro studies with bendamustine: enhanced activity in combination with rituximab. Semin Oncol. 2002;29: 12-14.
128. Schoppmeyer K, et al. A pilot study of bendamustine in advanced bile duct cancer. Anticancer Drugs. 2007;18: 697-702.
129. Hartmann JT, et al. Bendamustine hydrochloride in patients with refractory soft tissue sarcoma: a noncomparative multicenter phase 2 study of the German sarcoma group (AIO-001). Cancer. 2007;110: 861-866.
130. Kollmannsberger C, et al. Phase II study of bendamustine in patients with relapsed or cisplatin-refractory germ cell cancer. Anticancer Drugs. 2000;11: 535-539.
131. Lammers PE, et al. Phase II study of bendamustine in relapsed chemotherapy sensitive or resistant small-cell lung cancer. J Thorac Oncol. 2014;9: 559-562.
132. Reck M, et al. [Chemotherapy of advanced non-small-cell and small-cell bronchial carcinoma with bendamustine--a phase II study]. Pneumologie. 1998;52: 570-573.
133. Schmittel A, et al. Phase II trial of second-line bendamustine chemotherapy in relapsed small cell lung cancer patients. Lung Cancer. 2007;55: 109-113.
134. Eichbaum MH, et al. Weekly administration of bendamustine as salvage therapy in metastatic breast cancer: final results of a phase II study. Anticancer Drugs. 2007;18: 963-968.
135. Steinbild S, et al. Phase II STUdy with 3rd- or 4th-line bendamustine (flat dose) therapy in patients with metastatic breast cancer. Onkologie. 2009;32: 488-492.
136. Hoffken K, et al. Bendamustine as salvage treatment in patients with advanced progressive breast cancer: a phase II study. J Cancer Res Clin Oncol. 1998;124: 627-632.
137. von Minckwitz G, et al. Bendamustine prolongs progression-free survival in metastatic breast cancer (MBC): a phase III prospective, randomized, multicenter trial of bendamustine hydrochloride, methotrexate and 5-fluorouracil (BMF) versus cyclophosphamide, methotrexate and 5-fluorouracil (CMF) as first-line treatment of MBC. Anticancer Drugs. 2005;16: 871-877.
138. Koster W, et al. Phase II trial with carboplatin and bendamustine in patients with extensive stage small-cell lung cancer. J Thorac Oncol. 2007;2: 312-316.
139. Leoni LM. Bendamustine: rescue of an effective antineoplastic agent from the mid-twentieth century. Semin Hematol. 2011;48 Suppl 1: S4-11.
140. Ludwig H, et al. Bendamustine-bortezomib-dexamethasone is an active and well-tolerated regimen in patients with relapsed or refractory multiple myeloma. Blood. 2014;123: 985-991.
141. Kahl BS, et al. Bendamustine is effective therapy in patients with rituximab-refractory, indolent B-cell non-Hodgkin lymphoma: results from a Multicenter Study. Cancer. 2010;116: 106-114.
142. Leoni LM, et al. Bendamustine (Treanda) displays a distinct pattern of cytotoxicity and unique mechanistic features compared with other alkylating agents. Clin Cancer Res. 2008;14: 309-317.

References 21
143. Gaul L, et al. Bendamustine induces G2 cell cycle arrest and apoptosis in myeloma cells: the role of ATM-Chk2-Cdc25A and ATM-p53-p21-pathways. J Cancer Res Clin Oncol. 2008;134: 245-253.
144. Surget S, et al. Bendamustine and melphalan kill myeloma cells similarly through reactive oxygen species production and activation of the p53 pathway and do not overcome resistance to each other. Leuk Lymphoma. 2014;55: 2165-2173.
145. Beeharry N, et al. Dose dependent effects on cell cycle checkpoints and DNA repair by bendamustine. PLoS One. 2012;7: e40342.
146. Cives M, et al. Bendamustine overcomes resistance to melphalan in myeloma cell lines by inducing cell death through mitotic catastrophe. Cell Signal. 2013;25: 1108-1117.
147. Hiraoka N, et al. Purine analog-like properties of bendamustine underlie rapid activation of DNA damage response and synergistic effects with pyrimidine analogues in lymphoid malignancies. PLoS One. 2014;9: e90675.
148. Maas B, et al. Stabilität von Bendamustinhydrochlorid in Infusionslösungen. Pharmazie. 1994;49: 775-777.
149. Teichert J, et al. Characterization of two phase I metabolites of bendamustine in human liver microsomes and in cancer patients treated with bendamustine hydrochloride. Cancer Chemother Pharmacol. 2007;59: 759-770.
150. Teichert J, et al. Synthesis and characterization of some new phase II metabolites of the alkylator bendamustine and their identification in human bile, urine, and plasma from patients with cholangiocarcinoma. Drug Metab Dispos. 2005;33: 984-992.
151. Teichert J, et al. Identification and quantitation of the N-acetyl-L-cysteine S-conjugates of bendamustine and its sulfoxides in human bile after administration of bendamustine hydrochloride. Drug Metab Dispos. 2009;37: 292-301.


2 Chapter II
Scope and objectives

24 Chapter II
2.1 Investigation of ABC transporter expression and cancer initiating cells
in human cancer cell lines
The expression of ATP driven efflux pumps (ABC transporters) such as ABCB1 and ABCG2 is known
to confer resistance to diverse cytostatic drugs [1]. The exposure of cancer cells to cytostatic drugs
such as topotecan can cause elevated ABCG2-expression [2]. Moreover, side populations of
cancer cells, expressing ABC-transporters (ABCB1, ABCG2) were recently reported to comprise
cancer initiating cells [3]. However, knowledge whether the expression of ABC-transporters is
actually linked to properties of cancer initiating cells such as in vitro clonogenicity and
tumorigenicity is incomplete.
Aim of this project was the flow cytometric screening for cancer initiating- and side population
cells in human brain tumor and breast cancer cells. Additionally, MCF-7 breast cancer cells were
chosen for treatment with topotecan to examine the impact of this treatment on the expression
of ABC-transporters and different marker proteins, which are commonly used for the
identification of breast cancer initiating cells (CD24, CD44, EpCAM). Moreover, the effect of
topotecan treatment on the in vitro clonogenicity and the tumorigencity of MCF-7 cells was
planned to be investigated.
2.2 Investigations on the stability and cytotoxic activity of bendamustine
esters Aiming at oral bioavailability, improved pharmacokinetic properties or increased stability, various
bendamustine esters [4], oligomers [5] and complex pharmaceutical formulations [6] were
claimed for patent in the last years. Among the recently reported bendamustine derivatives are
a number of neutral and basic esters. Such structural modifications may not only influence the
stability of the nitrogen mustard group, but also the cytotoxic activity. Moreover, in a biological
environment the spectrum of possible degradation products for bendamustine esters is expected
to become more complex compared to the parent compound, as, in addition to nucleophiles
attacking the nitrogen mustard moiety, enzymatic process such as oxidation and, in particular,
hydrolysis may contribute to degradation.
The second objective of this project was to establish and apply analytical procedures for the
detailed investigation of the degradation of structurally diverse bendamustine esters in aqueous
solution as well as in murine and human plasma. Moreover, as these esters might act not only as
bendamustine prodrugs but also as cytotoxic agents of their own, investigations on the
antiproliferative activity at a broad panel of human cancer cell lines, including hematologic

References 25
malignancies, osteosarcomas and different carcinomas, were envisaged. In addition, studies on
the cellular uptake of representative esters and the parent compound as well as the effect on the
expression of the p53 tumor suppressor were planned in case of eventually discovered significant
differences in cytotoxicity.
2.3 References
1. Noguchi K, et al. Human ABC transporter ABCG2/BCRP expression in chemoresistance: basic and clinical perspectives for molecular cancer therapeutics. Pharmgenomics Pers Med. 2014;7: 53-64.
2. Maliepaard M, et al. Overexpression of the BCRP/MXR/ABCP gene in a topotecan-selected ovarian tumor cell line. Cancer Res. 1999;59: 4559-4563.
3. Richard V, et al. Side population cells as prototype of chemoresistant, tumor-initiating cells. Biomed Res Int. 2013;2013: 517237.
4. Bakale RP, et al. Preparation of bendamustine esters and bendamustine amides and their use for the treatment of cancer. Patent WO2014075035A1. 2014. Referenced in: Chem Abstr 160:723974.
5. Scutaru AM, et al. Optimization of the N-lost drugs melphalan and bendamustine: synthesis and cytotoxicity of a new set of dendrimer-drug conjugates as tumor therapeutic agents. Bioconjug Chem. 2010;21: 1728-1743.
6. Colledge J. Solid dosage forms of bendamustine. Patent WO2010063476. 2010. Referenced in: Chem Abstr 153:70374.

3 Chapter III
Investigation of ABC transporter
expression and cancer initiating cells in
human cancer cell lines
Note: As stated in the list of publications, parts of this chapter have already been submitted for publication,
prior to the submission of this thesis. For detailed information on the contribution of other authors see also
“Acknowledgements”.

28 Chapter III
3.1 Introduction
The expression of ATP-driven efflux transporters such as the breast cancer resistance protein
(BCRP, ABCG2) is a crucial mechanism that causes multidrug resistance in cancer cells [1].
Determining the efflux of different substrates, e.g. the fluorescent Hoechst dye [2] or
mitoxantrone [3] allows to identify cancer cells expressing ABCG2, whereas Hoechst efflux defines
so-called side populations [4]. Presupposed that resistance against cytostatics is also a property
of cancer initiating cells (CICs), side populations are often considered to comprise an increased
fraction of those cells compared to the bulk of cancer cells. Exposing cancer cells in vitro to
cytostatic drugs like topotecan, mitoxantrone [5], and doxorubicin [6] can cause elevated ABCG2
expression. The effect of such cytotoxic treatments on the regulation and expression of other
proteins related to poor clinical outcome has been less extensively examined.
Brain tumor initiating cells were previously described as a CD133+ subpopulation [7] and identified
in different brain tumor types. Nowadays, CD133 is frequently used as a marker for cancer
initiating cells originating from diverse tumor entities, for example, ovarian and liver cancer [8,
9]. However, the function of CD133, which was first described as a marker of primitive
hematopoietic and neural stem cells [10], is not completely clarified.
Treatment efficiency and outcome of breast cancer patients is strongly affected by tumor
heterogeneity, which therefore, constitutes a significant clinical problem. Nowadays the human
epidermal growth factor receptor 2 (HER2) and the estrogen receptor (ER) represent well-
established diagnostic markers and therapeutic drug targets whereas the importance of CD24,
CD44 and EpCAM is less clear. Distinct expression profiles of these proteins are considered as
markers of CICs and their expression has been related to mechanisms involved in metastasis and
therefore with poor clinical outcome. Among other markers, the expression profile of a CIC
(sub-)population in breast cancer has been described as CD24-/low/CD44+ [11].
Considering the fact that increased CD24 expression is linked to poor prognosis in different solid
tumor types including breast cancer [12, 13], low CD24 expression in CICs appears inexplicable at
first glance. However, the association of high CD24 expression levels and metastasis [14],
enhanced cell proliferation [15] and in vitro clonogenicity [16] is widely accepted. Nevertheless,
regulation and function of CD24 are not fully elucidated yet.
The CD44 molecule, respectively variants thereof [17], is almost ubiquitously expressed on
carcinoma cells [18]. It can interact with a variety of effectors [19, 20] and is involved in a
multitude of regulatory mechanisms related to adhesion, cell proliferation, migration,
invasiveness and chemoresistance [18, 21, 22].
Likewise, EpCAM, which was first described as a marker of human embryonic stem cells, is
expressed on cancer cells of a variety of entities [23]. In many cancer types, including breast

Introduction 29
cancer, high expression levels of EpCAM correlate with poor prognosis [24]. Although the
functions of EpCAM as a cell adhesion molecule and promoter of cell proliferation are generally
accepted and alterations in the expression level are closely related to epithelial-mesenchymal
transition (EMT) during metastasis, the role of EpCAM in cancer cells is not yet fully elucidated
[23, 25].
The HER2 receptor is overexpressed in up to 20 to 25 % of invasive breast cancers [26] and
predicts poor clinical outcome. HER2 overexpression can result in constitutive kinase activity that
causes increased cell proliferation and invasion [27].
In order to investigate correlations between side populations and cancer initiating cells, a panel
of human brain tumor and breast cancer cell lines was screened for the expression of different
CIC markers (CD133, CD24, CD44) as well as ABCB1 and ABCG2. Moreover, it was explored
whether the topotecan induced ABCG2 expression manipulates the CD24, CD44, EpCAM, and
HER2 related phenotype and if an enhanced ABCG2 expression affects in vitro clonogenicity or
tumorigenicity in immunodeficient mice. To this end, ABCG2 expression was induced in MCF-7
breast cancer cells by long-term exposure to topotecan and the respective biomarker expression
was assessed by flow cytometry. Moreover, the impact of topotecan treatment on cell
propagation and the capacity of self-renewal was explored in mammosphere formation assays
and the tumorigenicity of untreated vs. topotecan treated cells was evaluated in immunodeficient
mice.

30 Chapter III
3.2 Materials and methods
3.2.1 Reagents and antibodies
Unless stated otherwise, all commercially available solvents and chemicals were of analytical
grade and purchased from Merck (Darmstadt, Germany) or Sigma (Taufkirchen, Germany). For
the purification of demineralized water, a Milli-Q system (Millipore, Eschborn, Germany) was
used. A 1 mM stock solution of mitoxantrone was prepared by diluting Novatron® (Wyeth
Pharma, Münster, Germany) in 70 % ethanol. Doxorubicin and topotecan were both from Sigma
(Taufkirchen, Germany) and the stock solutions were also prepared in 70 % ethanol. Tariquidar
was synthesized in our laboratory according to literature [28, 29] and dissolved in 70 % ethanol
(100 µM). Calcein-AM (100 µM), 5-fluorouracil, methotrexate (all purchased from Sigma,
Taufkirchen, Germany) and fumitremorgin C (1 mM) (Merck, Darmstadt, Germany) were
dissolved in DMSO. All stock solutions were stored at – 20 °C. A solution of 2 % glutardialdehyde
(v/v) in PBS was prepared by diluting the commercially available 25 % (v/v) solution (Sigma,
Taufkirchen, Germany). PBS containing 2 % fetal calf serum (FCS; Biochrom, Berlin, Germany) was
used as buffer for all cytometric measurements. The following antibodies were used for the flow
cytometric analyses: APC anti-mouse/human CD44, Alexa Fluor 488 anti-mouse/human CD44,
FITC anti-human CD24, Alexa Fluor 647 anti-human CD24, Brilliant Violet 421 anti-human CD326
(EpCAM) and pacific blue anti-human CD338 (ABCG2), as well as the isotype controls
recommended by the manufacturer were purchased from BioLegend (London, UK). FITC anti-
human P-glycoprotein and IgG2b isotype control as well as Anti-Her-2/neu PE respectively PE
Mouse IgG1 Isotype control were from BD Biosciences (Heidelberg, Germany). CD133/1-PE (clone
AC133) respectively CD133/1-APC (clone AC133) antibodies and the respective mouse IgG1
isotype controls were purchased from Miltenyi Biotec (Bergisch Gladbach, Germany).
3.2.2 Cell lines and standard cell culture
The human brain tumor cell lines LN-18 (ATCC® CRL-2610™; glioblastoma grade IV), U-87 MG
(ATCC® HTB-14™; astrocytoma grad IV), SW-1783 (ATCC® HTB-13; astrocytoma grade III) and Daoy
(ATCC® HTB-186™; desmoplastic cerebellar medulloblastoma) as well as the human breast cancer
cell lines MCF-7 (ATCC® HTB-22™; breast adenocarcinoma), ZR-75-1 (ATCC® CRL-1500™; breast
ductal carcinoma), T-47D (ATCC® HTB-133™; mammary gland ductal carcinoma), JIMT-1 (provided
by Prof. Dr. Gero Brockhoff, Institute of Gynecology and Obstetrics, University of Regensburg),
MDA-MB-231 (ATCC® HTB-26™; triple negative breast adenocarcinoma), HCC-1806 (triple
negative primary acantholytic squamous cell carcinoma) and HCC-1937 (triple negative primary
ductal carcinoma) (both provided by Dr. Jörg Engel, Frauenklinik, University of Würzburg) were
maintained in RPMI-1640 (Sigma, Taufkirchen, Germany), supplemented with 2 g/L NaHCO3

Materials and methods 31
(Merck, Darmstadt, Germany), 110 mg/L sodium pyruvate, 10 mM HEPES (both from Serva,
Heidelberg, Germany) and 10 % fetal calf serum (Biochrom, Berlin, Germany). For the incubation
of MCF-7/Topo cells (ABCG2 overexpressing subclone of MCF-7) [29, 30] the culture medium was
additionally supplemented with 500 nM topotecan. For experiments determining the expression
stability of ABCG2 in MCF-7/Topo cells, the cells (hereafter referred to as MCF-7/Topo/wo) were
maintained for several weeks in topotecan-free medium.All cell lines were maintained in cell
culture flasks (Sarsted, Nurembrecht, Germany) at 37 °C and 5 % CO2 in a water-saturated
atmosphere and serially passaged as required following the treatment with trypsin/EDTA (0.5
mg/mL / 0.22 mg/mL) (PAA, Pasching, Austria).
3.2.3 Neuro-/mammosphere culture and limiting dilution assay
Neuro- respectively mammosphere culture was basically performed as previously described [31-
33]. Cells were maintained in suspension culture, using ultra-low attachment plates (Corning Inc.,
Corning, NY). MCF-7, MCF-7/Topo and MCF-7/Topo-CD24low cells were maintained in DMEM/F12
supplemented with 20 ng/mL bFGF (both from Gibco®/Life Technologies, Carlsbad, CA), 20 ng/mL
EGF and 5 µg/mL insulin (both from Sigma, Taufkirchen, Germany). For the incubation of Daoy
and sorted CD133+-Daoy cells, the medium described above was additionally supplemented with
B-27 (Gibco®/Life Technologies).
The growth capacity was determined by serial passaging of MCF-7, MCF-7/Topo, sorted MCF-7-
CD24low, Daoy and sorted Daoy-CD133+ cells. To this end, 5 x 10³ single cells were seeded per well
in 100 µL medium. Every 3-4 days, fresh medium was added or, if the cells had reached confluency
of approximately 80 %, spheres were enzymatically singularized and single cells were passaged.
The cell growth was regularly monitored for at least 3 weeks. The expression of CD133 in sorted
Daoy-CD133+ cells was again examined by flow cytometry (see 3.2.4.1) after 2 weeks of
incubation.
The mammo- respectively neurosphere forming ability of freshly sorted MCF-7/Topo-CD24low,
and Daoy-CD133+ cells, was compared to unsorted cells using limiting dilution assays. For this
purpose, different cell counts (1, 3, 10, 30, 100, 300, 1000 cells/well, 100µL) of singularized cells
were plated in sextuplicate into 96-well ultra-low attachment plates (Corning). Wild type cells
were trypsinized, washed 3 times with PBS in order to remove remaining FCS and trypsin and
filtrated through a 40 µm cell strainer (BD Falcon, Heidelberg, Germany) to exclude agglomerates.
Every 2-3 days, 20 µL of fresh medium were added and the number of spheres with diameters
above 80 µm was determined in each well after 12 days [34, 35]. Pictures were taken with a DCM-
510 ocular microscope camera (OCS.tec GmbH & Co. KG, Erding, Germany) controlled by
ScopePhoto V3.0.12.498 software (Hangzhou Scopetek Opto-electric Co., Ltd., Hangzhou, China).
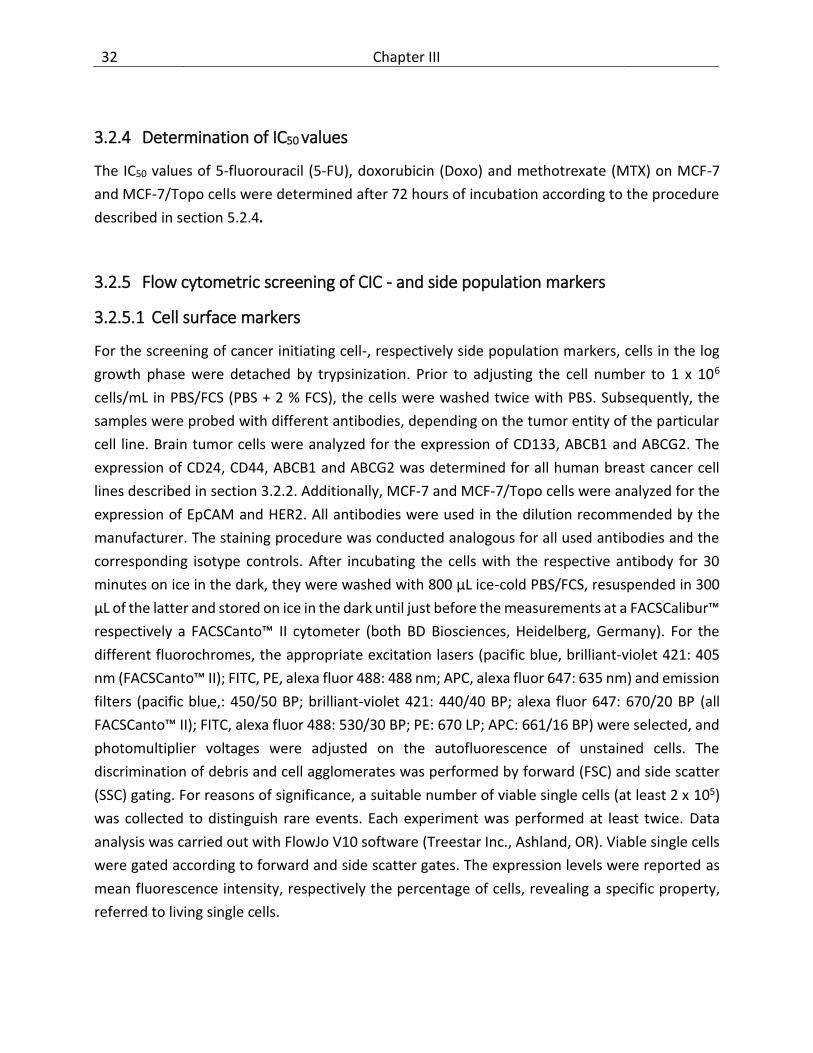
32 Chapter III
3.2.4 Determination of IC50 values
The IC50 values of 5-fluorouracil (5-FU), doxorubicin (Doxo) and methotrexate (MTX) on MCF-7
and MCF-7/Topo cells were determined after 72 hours of incubation according to the procedure
described in section 5.2.4.
3.2.5 Flow cytometric screening of CIC - and side population markers
3.2.5.1 Cell surface markers
For the screening of cancer initiating cell-, respectively side population markers, cells in the log
growth phase were detached by trypsinization. Prior to adjusting the cell number to 1 x 10⁶
cells/mL in PBS/FCS (PBS + 2 % FCS), the cells were washed twice with PBS. Subsequently, the
samples were probed with different antibodies, depending on the tumor entity of the particular
cell line. Brain tumor cells were analyzed for the expression of CD133, ABCB1 and ABCG2. The
expression of CD24, CD44, ABCB1 and ABCG2 was determined for all human breast cancer cell
lines described in section 3.2.2. Additionally, MCF-7 and MCF-7/Topo cells were analyzed for the
expression of EpCAM and HER2. All antibodies were used in the dilution recommended by the
manufacturer. The staining procedure was conducted analogous for all used antibodies and the
corresponding isotype controls. After incubating the cells with the respective antibody for 30
minutes on ice in the dark, they were washed with 800 µL ice-cold PBS/FCS, resuspended in 300
µL of the latter and stored on ice in the dark until just before the measurements at a FACSCalibur™
respectively a FACSCanto™ II cytometer (both BD Biosciences, Heidelberg, Germany). For the
different fluorochromes, the appropriate excitation lasers (pacific blue, brilliant-violet 421: 405
nm (FACSCanto™ II); FITC, PE, alexa fluor 488: 488 nm; APC, alexa fluor 647: 635 nm) and emission
filters (pacific blue,: 450/50 BP; brilliant-violet 421: 440/40 BP; alexa fluor 647: 670/20 BP (all
FACSCanto™ II); FITC, alexa fluor 488: 530/30 BP; PE: 670 LP; APC: 661/16 BP) were selected, and
photomultiplier voltages were adjusted on the autofluorescence of unstained cells. The
discrimination of debris and cell agglomerates was performed by forward (FSC) and side scatter
(SSC) gating. For reasons of significance, a suitable number of viable single cells (at least 2 x 10⁵)
was collected to distinguish rare events. Each experiment was performed at least twice. Data
analysis was carried out with FlowJo V10 software (Treestar Inc., Ashland, OR). Viable single cells
were gated according to forward and side scatter gates. The expression levels were reported as
mean fluorescence intensity, respectively the percentage of cells, revealing a specific property,
referred to living single cells.

Materials and methods 33
3.2.5.2 Flow cytometric mitoxantrone efflux assay
The investigation of ABCG2-activity was based on the previously described mitoxantrone efflux
assay with minor alterations [3, 36]. In principle, unstained control cells, cells incubated with the
fluorescent substrate mitoxantrone, and cells incubated with mitoxantrone and the ABCG2
inhibitor fumitremorgin C (FTC) were compared for each tested cell line.
Cells (approx. 80 % confluence) were detached by trypsinization, washed two times with PBS and
resuspended in PBS containing 2 % FCS (PBS/FCS). For each sample, the cell number was adjusted
to 5 x 10⁵ cells per 500 µL and 2.5 µL mitoxantrone (1 mM stock solution in 70 % ethanol) were
added to reach a final concentration of 5 µM. Subsequently, 5 µL of the 1 mM FTC stock solution
(final concentration 10 µM), respectively an equivalent amount of solvent (DMSO) was added.
The samples were vortexed and incubated at 37 °C for 30 minutes to allow maximal mitoxantrone
uptake. After adding 800 µL cold PBS/FCS (4 °C) and centrifugation (3 minutes, 300 g, 4 °C), the
cell pellet was resuspended in 300 µL PBS/FCS and stored on ice in the dark until just before
measurement. Mitoxantrone accumulation respectively efflux was determined at a FACSCalibur™
(BD Biosciences, Heidelberg, Germany), using an excitation wavelength of 635 nm while emission
was detected at 661/16 nm bandpass filter (FL4). A minimum of 2 x 10⁵ viable single cells, defined
by side scatter (SSC) and forward scatter (FSC) gates, were collected and raw data was analyzed
with FlowJo V10 software.
3.2.6 Fluorescence activated cell sorting (FACS)
Tumor cells displaying marker expression patterns of interest, such as CD133+ in the case of Daoy
cells and CD24low for MCF-7/Topo cells, were sorted using a FACSAria™ IIu (BD Biosciences,
Heidelberg, Germany) equipped with a 70 µm nozzle. Except for small alterations in the antibody
dilution, the staining procedure was performed exactly as described under 3.2.5.1 except for the
omission of isotype controls. In brief: for Daoy, approximately 5 x 10⁷ cells were suspended in 800
µL ice-cold PBS/FCS and 100 µL of the antibody solution (APC-anti-CD133/1 (AC133), Miltenyi)
were added. About 9 x 10⁷ MCF-7/Topo cells were suspended in 9 mL ice-cold PBS/FCS, followed
by the addition of 125 µL APC anti-mouse/human CD44 and 400 µL FITC anti-human CD24
antibody (both BioLegend). After the incubation for 30 minutes on ice in the dark, the cells were
washed and resuspended in ice-cold PBS/FCS to a final cell count of approximately 2 x 10⁷
cells/mL. Prior to the sorting procedure, the cells were filtrated through a 35 µm cell strainer (BD
Falcon, Heidelberg, Germany) and stored on ice in the dark. The flow- and sorting rate were
regularly checked and adjusted to reach a sort efficacy of above 90 %. Cells were sorted using a
three-way gating strategy. Initially, dead cells and debris were gated on a two physical parameter
dot plot (FSC/SSC) followed by the exclusion of doublets by using pulse processing (FSC-height vs.

34 Chapter III
FSC-area). Finally, the CD24low subpopulation was gated. Sorted cells were collected in RPMI-1640
medium, containing penicillin-streptomycin (100 U/mL / 100 µg/mL) (Sigma, Taufkirchen,
Germany) and subsequently used for further experiments.
3.2.7 Tumorigenicity and growth kinetics of subcutaneous tumors in nude mice
Adult, female NMRI-nu/nu mice respectively new born (24-48 hours) NOD.Cg-Prkdcscid
Il2rgtm1Wjl/SzJ (NSG) mice were employed to determine the tumorigenicity and growth kinetics of
tumor cell lines. For cell implantation, adherently growing tumor cells were washed twice with
serum-free RPMI-1640 to remove residual FCS. Depending on the adherence of the particular cell
line, the cells were rinsed off with medium or detached by trypsinization. Subsequently, the cells
were washed two times with serum-free medium and the cell number was adjusted in RPMI-
1640. For sorted cell populations (see 3.2.6), the cell number was adjusted directly after the
sorting procedure and the cells were injected immediately. For initial experiments regarding the
growth kinetics, usually 1-3 x 10⁶ cells in 100 µL serum-free RPMI-1640 were injected under the
thoracic dermis of each mouse. Differences of the in vivo tumorigenicity were determined by
injecting 103, 104, 105 respectively 106 MCF-7, MCF-7/Topo, MCF-7/Topo-CD24low (both mouse
strains), Daoy wild type and Daoy-CD133+ cells (only NMRI-nu/nu) into each mouse. The body
weight and tumor diameters of each mouse were monitored weekly.
3.2.8 Tumor processing
3.2.8.1 Flow cytometric characterization of tumors
Depending on the growth rate, the tumors were excised after 2-5 months when a sufficient size
of at least 20 mm2 was reached. Excised tumors were stored immediately in ice-cold FCS-free
RPMI-1640. With respect to the following FACS-analysis of cell surface marker expression, tumors
were dissected mechanically to prevent interference with proteolytic enzymes. The mechanical
dissection was performed in ice-cold medium in 6 cm cell culture plates by cutting the tumor into
small pieces. The tumor pieces were strained through a 40 µm mesh (BD Falcon, Heidelberg,
Germany) which was subsequently rinsed with the medium in which the tumors were dissected
and then washed two times with 5 mL of fresh, ice-cold RPMI-1640. For the exclusion of tissue
and major cell agglomerates, the cell suspension was filtrated through a 40-µm cell strainer (BD
Falcon) without mechanical pressure prior to the staining procedure (c.f. section 3.2.5.1)

Materials and methods 35
3.2.8.2 Histology
For the determination of the morphology, proliferative activity and formation of metastasis of
MCF-7-tumors, tissue samples of liver, lung and the formed tumors of NSG mice were fixed in 4
% formalin, embedded in paraffin and stained as previously described [37]. Briefly, samples were
deparaffinized, microwave-heated for 30 min in 0.1 M citrate buffer (pH 7.3) and stained
automatically on a Ventana Nexes autostainer (Ventana, Tuscon, USA) by using the streptavidin-
biotin-peroxidase complex method and 3.3-diaminobenzidine as chromogen. The following
antibodies in the ultraView Universal DAB Detection Kit (Ventana, Roche) were used: anti-CK8
monoclonal mouse anti-human (clone: 35βH11) anti-CK18 monoclonal mouse anti-human (clone:
DC10) and anti-MIB-1/Ki-67 monoclonal mouse anti-human (clone: MIB-1) (all from
DakoCytomation, Glostrup, Denmark). Samples were analyzed microscopically (Zeiss Axiovert
200).

36 Chapter III
3.3 Investigation of human brain tumor cells
3.3.1 Expression of CD133 and ABC-transporters
CD133 (AC133) is a 5-transmembrane cell surface protein which was originally described as a
marker for hematopoietic stem and progenitor cells [38, 39]. CD133-expression was detected on
on several other cell types such as epithelial cells [40] or acute myeloid leukemia [41]. Moreover,
CD133 is frequently used as a marker for brain tumor initiating cells (BTICs) as suggested by Singh
et al. [7]. The glioblastoma cell lines U-87MG and LN-18, the astrocytoma cell line SW-1783 and
the medulloblastoma cell line Daoy were analyzed for the expression of CD133. Only Daoy cells
expressed CD133 (Fig. 3.1) and were therefore additionally analyzed for the expression of ABCB1
and ABCG2. However, both transporters were not expressed in Daoy cells (Fig. 3.1).
Figure 3.1: Expression of CD133 (A), ABCB1 (B) and ABCG2 (C) in Daoy cells. A, B: Isotype controls are depicted in inserts. C: Mitoxantrone (Mito) efflux assay with Daoy cells. As a control experiment, Mito efflux was inhibited by the ABCG2 modulator fumitremorgin C (inset). The small insets (SSC/FSC) illustrate the applied physical gates (SSC/FSC). According to the gating strategy illustrated in Fig. 3.1 A, the CD133+ subpopulation of Daoy cells
was sorted to collect cells for the investigation of the stability of CD133 expression, the in vitro
growth capacity and sphere formation ability (neurosphere culture) as well as the tumorigenicity
in NMRI-nu/nu mice. However, Daoy cells proved to be inappropriate for high throughput sorting.
The comparatively large cells caused unstable hydrodynamic focusing, resulting in low sorting
efficiency at high flow rates. Additionally, the propensity to sediment and form agglomerates at
high cell concentrations required an extensive dilution of the cell suspension and periodical
resuspension of the cells. Consequently, it was impossible to sort high numbers of cells within an
adequate period of time.

Investigation of human brain tumor cells 37
3.3.2 Neurosphere culture and stability of CD133 expression in Daoy-CD133+ cells
Critical properties of CICs, for example, the growth capacity and sphere formation ability, can be
monitored under special in vitro culture conditions. For this purpose, a combination of a serum-
free culture medium, only supplemented with specific growth factors, and the incubation in non-
adherent cell culture conditions (ultra-low attachment plates) was used (sphere culture).
Theoretically, these conditions allow for the maintenance of undifferentiated stem cells and the
proliferation of multipotent, self-renewing stem cells [7]. By serial passaging under these
conditions, it was possible to estimate the growth capacity of the respective cells.
Figure 3.2: Expression of CD133 in Daoy wild type (A), freshly sorted Daoy-CD133+ (B) and Daoy-CD133+ cells after 14 days in neurosphere culture (C). Isotype controls are illustrated in the insets. Small inserts depict the applied gating strategy (SSC/FSC).
The sphere formation ability in limiting dilution assays was compared for Daoy wild type and
Daoy-CD133+ cells. Within 24 hours after seeding of more than 300 cells per well, Daoy-CD133+
cells formed definite spheres, whereas Daoy wild type cells formed loosely adherent aggregates.
However, both cell types could be cultured for several passages over a period of 3 weeks under
these conditions without significant changes of growth. The CD133 expression by the sorted
Daoy-CD133+ cell population, maintained in neurosphere culture for a period of 2 weeks, was re-
analyzed by flow cytometry. Interestingly, the phenotype reverted with respect to CD133
expression, resembling the Daoy wild type cells (Fig. 3.2). In contrast to the comparable growth
capacity of Daoy wild type and Daoy-CD133+ cells, the sphere formation ability in limiting dilution
assays was significantly different. Daoy wild type cells formed irregularly shaped aggregates only
at cell counts above 100 cells per well, whereas Daoy-CD133+ cells formed spheres with diameters
of around 100 µm within 9 days (Fig. 3.3), even when only 1 cell/well was seeded (Table 3.1).
Interestingly, the maximum number of spheres was comparable, regardless of the number of
Daoy-CD133+ cells seeded: 300 or 1000 cells/well resulted in 3-5 spheres of different size.

38 Chapter III
3.3.3 Tumorigenicity of Daoy and Daoy-CD133+ cells
Different numbers of Daoy and sorted Daoy-CD133+ cells were subcutaneously injected into nude
mice (NMRI-nu/nu). The injection of 106 Daoy wild type cells led to the formation of tumors in 7
out of 12 mice within 3 months. When 1.5 x 10⁵ Daoy cells were injected, 1 out of 3 mice
developed a tumor. By contrast, tumor formation was not observed after injection of 1.5 x 10⁵ or
1.5 x 10⁴ sorted Daoy-CD133+ cells. Due to inefficient cell sorting, higher amounts of Daoy-CD133+
cells were not available to perform additional experiments. However, there is no hint to increased
tumorigenicity of Daoy-CD133+ compared to wild type cells in this mouse model.
3.3.4 Flow cytometric characterization of Daoy tumors
The tumors formed after the injection of Daoy cells did not allow the preparation of single cell
suspensions. Accordingly, flow cytometric analysis revealed mainly no live cells, precluding the
determination of the expression of CD133, ABCB1 and ABCG2. With regard to possible impacts
on flow cytometric measurements, enzymatic methods for tumor disaggregation were not
applied.
Figure 3.3: Limiting dilution assay with Daoy-CD133+ (A-F) and Daoy cells (G-I). Formed spheres, 9 days after seeding of 1 (A), 3 (B), 10 (C), 30 (D), 100 (G), 300 (E, H) and 103 (F, I) cells/well.
Table 3.1: Number of spheres (± SEM) formed per well after seeding of different numbers of CD133+ cells (n=2).
Cells/well Spheres/well
100 2.2 ± 0.0
30 2.1 ± 0.3
10 1.4 ± 0.1
3 0.7 ± 0.2
1 0.4 ± 0.01

Investigation of human brain tumor cells 39
3.3.5 Discussion
The flow cytometric examination of CD133 expression in human brain tumor cells (Daoy, LN-18,
U-87MG, SW-1783) revealed a subpopulation of CD133+ cells only in Daoy medulloblastoma cells.
A side population expressing ABCG2 or ABCB1 was not observed in Daoy cells. In contrast to the
extent of sphere formation of sorted Daoy-CD133+ cells, compatible with the concept of CIC-like
properties, the ability to form tumors in nude mice was not enhanced. On the contrary, slow
restoration of a CD133- subpopulation (50 % after 2 weeks) suggests a preferential growth of
CD133- cells. This slow process may result from asymmetric divisions, a stem cell property [42],
or the preferential growth of a small number of residual CD133- cells. Plasticity of CICs, as recently
reported for breast cancer cells [43], should result in a faster re-adjustment of initial proportions
of CD133- and CD133+ cells. Additional investigations including markers of BTICs, such as nestin
[44], could help to decide whether Daoy-CD133+ cells can be considered CICs. However, Daoy cells
turned out to be inappropriate for high throughput cell sorting, compromising further
experiments regarding cancer initiating cells, although a CD133+ subpopulation indicated at least
increased clonogenicity in vitro.
Previously, CD133- glioma cells were also described as highly tumorigenic [45]. According to a
recent publication the validity of CD133 as a universal marker of cancer initiating cells is doubtful
[46].

40 Chapter III
3.4 Investigation of human breast cancer cells
3.4.1 Expression of CD24, CD44, ABCB1 and ABCG2
Since Al-Hajj et al. [11] described a tumorigenic CD24-/low/CD44+ subpopulation in breast cancer
cells, this marker combination is most commonly used for the identification of breast cancer
initiating cells (BCICs). All breast cancer cell lines examined in this study were CD44+, whereas the
expression of CD24 varied in a wide range (Fig. 3.4). The expression of ABCB1 and ABCG2 was
additionally determined. Apart from a weak ABCG2-expression in JIMT-1 cells and the induced
ABCG2 expression in MCF-7/Topo and MCF-7/Topo/wo cells, none of the cell lines comprised cells
expressing ABCB1 or ABCG2. The comparison of results obtained by mitoxantrone efflux and the
antibody-based determination of ABCG2 transporters in MCF-7/Topo cells revealed a better
distinction between ABCG2- and ABCG2+ cells using the specific antibody (Fig. 3.5).
Figure 3.4: Expression of CD24/CD44 (left) and ABCG2 (right) in breast cancer cell lines. Left panel: Expression of CD24 (y-axes) and CD44 (x-axes) in ZR-75-1, JIMT-1, HCC1937 and MDA-MB-231 cells. The respective isotype controls are depicted in red. The small insets illustrate the applied physical gating strategy (SSC/FSC). Right panel: Mitoxantrone efflux as indicator of ABCG2 activity in ZR-75-1 and JIMT-1 cells. Mitoxantrone efflux was inhibited by fumitremorgin C (FTC) (insets). The small insets illustrate the applied physical gates (SSC/FSC).

Investigation of human breast cancer cells 41
Figure 3.5: Flow cytometric determination of ABCG2 expression in MCF-7/Topo cells with anti-ABCG2-pacific blue antibody (A) and the mitoxantrone-efflux (Mito) assay (B). Isotype control respectively Mito efflux inhibited by fumitremorgin C (FTC) are illustrated as black line. Mean fluorescence intensities (MFI) are shown in the inserted tables.
3.4.2 Tumorigenicity of MDA-MB-231 cells
As stated in section 3.4.1, the triple negative breast adenocarcinoma cell line MDA-MB-231
exhibited the CD24-/low/CD44+ expression level which described for breast cancer initiating cells.
The tumorigenicity of MDA-MB-231 cells was investigated in NMRI-nu/nu mice. The injection of
2 x 10⁶ cells resulted in tumor formation in 4 out of 20 mice within 4 months.
3.4.3 Discussion
The CD24-/CD44+ expression pattern is the most frequently used marker combination to identify
breast cancer initiating cells. However, the abundance of CD44 on carcinoma cells of diverse
entities [18], but particularly on breast cancer cells appears surprising for a cancer initiating cell
marker. The investigation of CD24/CD44 expression in diverse breast cancer cell lines revealed
that the CD24-/low phenotype is the unique characteristic of the CD24-/CD44+ cell population since
the vast majority of all cell lines was CD24+/CD44+. Only HCC1806 and HCC1937 exhibited a weak
CD24 expression, comprising a small CD24low subpopulation. By contrast, more than 80 % of MDA-
MB-231 cells were CD24-/CD44+. Besides, MDA-MB-231 cells revealed the highest CD44
expression of all examined cell lines. None of the examined cell lines revealed ABCB1 expression,
and only JIMT-1 (and the ABCG2 induced MCF-7/Topo) cells comprised a side population
expressing ABCG2. Contrary to the expected high tumorigenicity of the CD24-/CD44high MDA-MB-
231 cells, the take rates after the injection of 2x10⁶ cells in NMRI-nu/nu mice were poor (4 tumors
in 20 mice), suggesting that this phenotype is not necessarily linked to enhanced tumorigenicity.
Notably, a lack of correlation between breast cancer stem cell markers (CD24low/CD44+/EpCAM+)
and tumorigenicity was recently reported [48].

42 Chapter III
3.5 Effects of topotecan treatment on MCF-7 cells
Note: This results have been submitted for publication under the title “Topotecan-induced ABCG2
expression in MCF-7 cells is associated with decreased CD24 and EpCAM expression and a loss of
tumorigenicity”, prior to the submission of this thesis.
3.5.1 Expression profile of ABCG2 and ABCB1 in different MCF-7 variants
The topoisomerase inhibitor topotecan is widely used in cancer therapy, especially in the
treatment of ovarial carcinoma and small cell bronchial carcinoma. It is a known substrate of the
breast cancer resistance protein ABCG2 and long-term treatment of cancer cells in vitro leads to
the induction of ABCG2. The function of the ABCG2 transporter was determined in the
mitoxantrone efflux assay, and the expression was confirmed with a pacific blue coupled
monoclonal antibody against an extracellular part of the protein (data not shown). While MCF-7
cells did not express the ABCG2 transporter, topotecan-treatment induced a high and
homogenous expression of ABCG2 in MCF-7/Topo cells (Fig. 3.6). MCF-7/Topo cells cultivated in
topotecan-free medium (MCF-7/Topo/wo cells) maintained the expression level of ABCG2 over a
period of approximately 6 weeks. Later on, a small proportion of the cells (approx. 12 % after 10
weeks cultivation in the absence of topotecan) lost the ability of mitoxantrone efflux, whereas
high expression of ABCG2 persisted in the majority of the cells. Comparing the ratio of the mean
fluorescence intensities (RMFI) between Mito+ (ABCG2 mediated mitoxantrone-efflux inhibited by
FTC) and Mito- (ABCG2 mediated mitoxantrone-efflux) cells revealed no significant difference for
Figure 3.6: Expression of ABCG2 in MCF-7, MCF-7/Topo and MCF-7/Topo/wo cells. Flow cytometric measurement of Mito efflux as indicator for ABCG2 activity in MCF-7 (A), MCF-7/Topo (B) and MCF-7/Topo/wo (C) (10 weeks in topotecan-free medium) cells. Mito efflux was inhibited by fumitremorgin C (FTC) (black line). A: MCF-7 cells do not express ABCG2. B, C: red line: uninhibited ABCG2-mediated efflux of Mito. black line: inhibition of Mito efflux by FTC. The inserts illustrate the applied physical gates (SSC/FSC). Mean fluorescence intensities are given in the inserted tables.

Effects of topotecan treatment on MCF-7 cells 43
MCF-7/Topo (RMFI = 5.7 ± 1.3) and MCF-7/Topo/wo cells (RMFI = 5.4 ± 0.3) after cultivation over 10
weeks in the absence of topotecan (Fig. 3.6). ABCB1 (P-gp) expression was determined by the use
of a monoclonal antibody. Topotecan treatment had no effect on the expression of ABCB1, since
both cell variants, MCF-7 and MCF-7/Topo, were ABCB1 negative (data not shown).
3.5.2 Expression of CD24, CD44, EpCAM and HER2 in MCF-7 variants
The HER2 receptor and the cell surface proteins CD24, CD44, and EpCAM are important markers
for breast cancer cell phenotyping. MCF-7 cells express all four marker proteins (CD24+, CD44+,
EpCAM+, HER2+). However, long-term treatment of MCF-7 cells with topotecan caused a
significantly altered CD24, EpCAM and HER2 expression profile with the most pronounced effect
on CD24: The previously homogenous expression in MCF-7 cells became heterogenous, and the
Figure 3.7: Expression of CD24, CD44, EpCAM and HER2 in different MCF-7 variants. A: Expression of CD24 and CD44 in MCF-7, MCF-7/Topo and MCF-7/Topo/wo (6 weeks in topotecan-free medium) cells. Isotype controls in the dot plots are depicted in red. The applied gating strategy is illustrated in the small inserted two parameter (SSC/FSC) dot blots. B: Expression of EpCAM (a) and HER2 (b) in MCF-7 (filled) and MCF-7/Topo (empty) cells. Mean fluorescence intensities (MFI) are shown in the inserted tables. Isotype controls are illustrated in the small inserts.

44 Chapter III
overall expression level decreased distinctly, resulting in 10 to 15 % CD24low cells. (Fig. 3.7 A) While
the expression of CD44 remained virtually unaffected by topotecan treatment, EpCAM was
downregulated by 45 % and HER2 was up-regulated by 60 % (Fig. 3.7 B). Unlike the expression of
ABCG2, which was quite stable in culture in the absence of topotecan, the expression level of
CD24 in MCF-7/Topo/wo cells recovered within 6 weeks to the initially homogenous expression
level as observed in MCF-7 cells (Fig. 3.7 A). The CD24low subpopulation of MCF-7/Topo cells was
sorted and tumorigenicity as well as mammosphere formation capacity in vitro was assessed. A
high degree of purity in CD24low sorted cells (referred to as MCF-7/Topo-CD24low) was confirmed
(>98 %, data not shown).
3.5.3 Chemosensitivity of MCF-7 and MCF-7/Topo cells
Doxo, MTX, and 5-FU are often used in different combinations with other drugs for chemotherapy
of breast cancer [47]. The cytotoxic effect of these cytostatic drugs was determined as an
indicator of the induction of ABCG2 transporter expression. The IC50 values of Doxo and MTX on
MCF-7 cells were in a low nanomolar range (Table 3.2). On the contrary, MCF-7/Topo cells
revealed a 1.5 fold increase in the IC50 value of MTX (p < 0.05) and 4.0 fold increased IC50 value of
Doxo (p < 0.001). However, MTX treatment did not induce a cytocidal drug effect, neither in MCF-
7 nor in MCF-7/Topo cells, but resulted in a decrease of the cell number by 70 % compared to the
untreated control. 5-FU exhibited cytotoxic effects in considerably higher concentrations (Table
3.2) than Doxo and MTX, but revealed no significant difference regarding the IC50 value in both
cell lines.
3.5.4 Mammosphere culture and limiting dilution assays
In adherent cell culture MCF-7 and MCF-7/Topo cells exhibited no significant difference in the
growth characteristics: Both cell variants revealed epithelial, polygonal morphology and showed
comparable doubling times (MCF-7: 22.8 ± 1.7 hours; MCF-7/Topo: 23.4 ± 0.9 hours; n = 3).
Mammosphere formation under non adherent growth conditions was assessed to examine the
tumor initiating capacity of MCF-7, MCF-7/Topo, and MCF-7/Top-CD24low cells. Therefore, the
Table 3.2: IC50 values (± SEM, n = 3) in nM of Doxo, MTX, and 5-FU determined in MCF-7 and MCF-7/Topo cells after 72 hours of incubation.
Compd. Cell variant
MCF-7 MCF-7/Topo
Doxo 19.7 ± 4.7 77.4 ± 6.9 MTX 19.2 ± 0.3 32.1 ± 3.1 5-FU 2440 ± 235 2325 ± 435
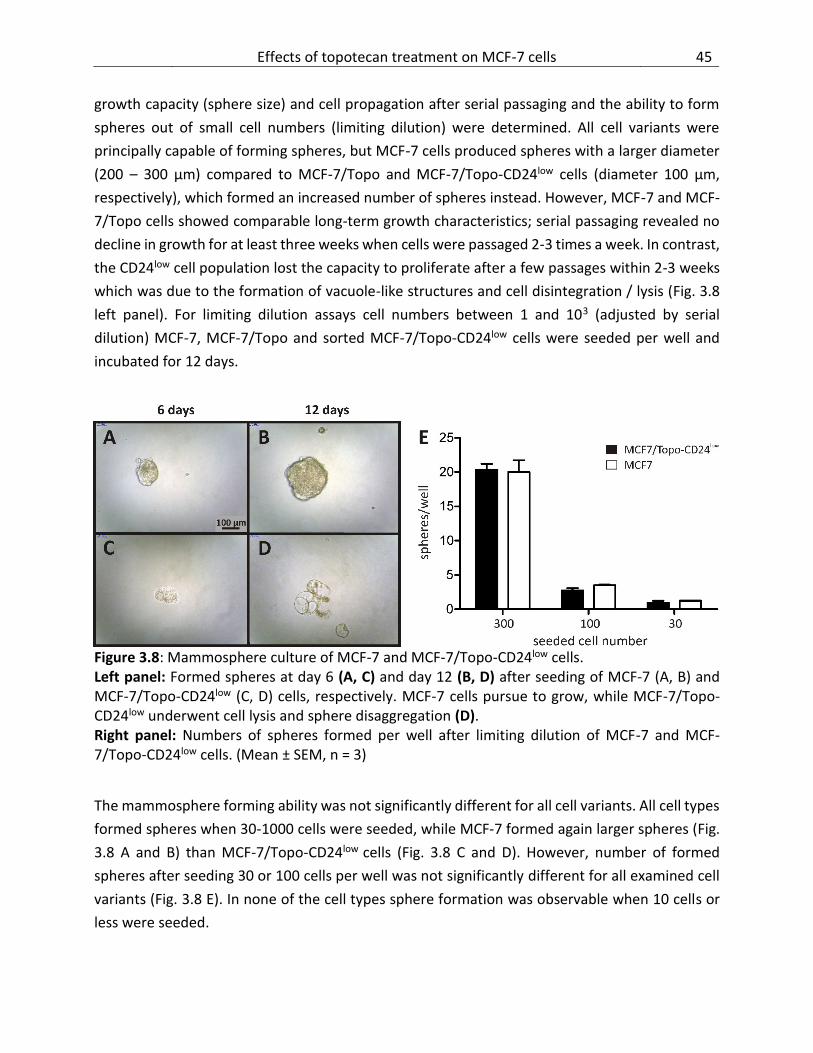
Effects of topotecan treatment on MCF-7 cells 45
growth capacity (sphere size) and cell propagation after serial passaging and the ability to form
spheres out of small cell numbers (limiting dilution) were determined. All cell variants were
principally capable of forming spheres, but MCF-7 cells produced spheres with a larger diameter
(200 – 300 µm) compared to MCF-7/Topo and MCF-7/Topo-CD24low cells (diameter 100 µm,
respectively), which formed an increased number of spheres instead. However, MCF-7 and MCF-
7/Topo cells showed comparable long-term growth characteristics; serial passaging revealed no
decline in growth for at least three weeks when cells were passaged 2-3 times a week. In contrast,
the CD24low cell population lost the capacity to proliferate after a few passages within 2-3 weeks
which was due to the formation of vacuole-like structures and cell disintegration / lysis (Fig. 3.8
left panel). For limiting dilution assays cell numbers between 1 and 103 (adjusted by serial
dilution) MCF-7, MCF-7/Topo and sorted MCF-7/Topo-CD24low cells were seeded per well and
incubated for 12 days.
Figure 3.8: Mammosphere culture of MCF-7 and MCF-7/Topo-CD24low cells. Left panel: Formed spheres at day 6 (A, C) and day 12 (B, D) after seeding of MCF-7 (A, B) and MCF-7/Topo-CD24low (C, D) cells, respectively. MCF-7 cells pursue to grow, while MCF-7/Topo-CD24low underwent cell lysis and sphere disaggregation (D). Right panel: Numbers of spheres formed per well after limiting dilution of MCF-7 and MCF-7/Topo-CD24low cells. (Mean ± SEM, n = 3)
The mammosphere forming ability was not significantly different for all cell variants. All cell types
formed spheres when 30-1000 cells were seeded, while MCF-7 formed again larger spheres (Fig.
3.8 A and B) than MCF-7/Topo-CD24low cells (Fig. 3.8 C and D). However, number of formed
spheres after seeding 30 or 100 cells per well was not significantly different for all examined cell
variants (Fig. 3.8 E). In none of the cell types sphere formation was observable when 10 cells or
less were seeded.

46 Chapter III
3.5.5 In vivo investigations of MCF-7 variants
Beyond the assessment of mammosphere formation in vitro the tumorigenicity of MCF-7,
MCF-7/Topo and MCF-7/TopoCD24low cells was determined in newborn NSG respectively adult
NMRI-nu/nu mice. For this purpose, different cell numbers of the respective cell variant were
subcutaneously injected and the tumor growth as well as the body weight was monitored over a
period of 3-5 months. The tumorigenicity was considerably higher in newborn NSG-mice than in
NMRI-nu/nu mice (Table 3.3). The injection of only 1 x 10⁵ MCF-7 cells led to the formation of
tumors (3 of 3 mice; Fig. 3.9 A), while at least 1 x 10⁶ cells were required to induce tumor growth
in NMRI-nu/nu mice (2 of 6 mice). The in vivo tumorigenicity of MCF-7 and MCF-7/Topo cells was
compared after injecting 1 x 10⁶ cells into NMRI-nu/nu mice (n = 6). MCF-7 cells formed tumors
in 2 of 6 mice, while the injection of MCF-7/Topo cells did not result in tumor growth. Additionally,
the tumor-initiating efficacy of MCF-7 and sorted MCF-7/Topo-CD24low cells in NMRI-nu/nu mice
was compared as a function of 1 x 10³ and 1 x 10⁶ injected cells (n = 3 for each cell number). Unlike
MCF-7 cells, which formed tumors after injection of 1 x 10⁶ cells in 33 % of used mice, the injection
of MCF-7/Topo and MCF-7/Topo-CD24low cells did not result in tumor growth. The impaired
tumorigenicity of MCF-7/Topo-CD24low cells could be confirmed in the NSG-mouse model (Fig.
3.9 B). MCF-7 cells showed tumor growth even after the injection of only 105 cells while MCF-
7/Topo-CD24low cells only formed slowly growing tumors after the injection of 106 cells.
Tumors were excised after 3-5 months and analyzed by histology and flow cytometry. In
histological specimens CK8, CK18, and Ki67 stainings [48, 49] were performed to verify the
presence (CK8, CK18) and proliferation capacity (Ki67) of injected, human tumor cells (Fig. 3.9
lower panel). All examined tumors arose at the site of injection and developed epithelial
morphology. The histological examination of liver and lung revealed no evidence for metastases.
Flow cytometric measurements of MCF-7 tumors revealed a CD24low/CD44high subpopulation (2.8
% ± 1.0 (SEM, n = 3)) while 46.9 % ± 2.9 (SEM, n = 3) of solid cancer cells showed a CD24-, CD44-,
Table 3.3: Tumorigenicity of MCF-7, MCF-7/Topo and MCF-7/Topo-CD24low cells in NMRI-nu/nu and NSG mice. Take rate, expressed as number of tumors per number of injected mice.
Cell number
NMRI-nu/nu NSG
MCF-7 MCF-
7/Topo MCF-7/Topo-
CD24low
MCF-7 MCF-7/Topo-
CD24low
106 3/9 0/9 0/3 3/3 2/2
105 0/3 0/3 0/3 3/3 0/2
104 0/3 0/3 0/3 0/3 0/2
103 0/3 0/3 0/3 n. d. n. d.
n. d.: not determined

Effects of topotecan treatment on MCF-7 cells 47
EpCAM-, and HER2- phenotype (Fig. 3.9 C). In tumors which were formed after the injection of
MCF-7/Topo-CD24low cells, the majority of cells remained a CD24low, CD44+, EpCAM+ and HER2+
expression. Only small subsets of approximately 5 % of CD24+/CD44+ and 3 % CD24low/CD44high
cells were observed. In addition, the rate of EpCAM/HER2 negative cells was lower (27 %) than in
MCF-7 tumors (47 %).
Figure 3.9: Flow cytometric and immunohistological analyses of excised tumors (NSG-mice). A: Size and shape of MCF-7 tumors formed in different mice. B: Final size of formed tumors [mm3] after the injection of different cell numbers of MCF-7 and MCF-7/Topo-CD24low cells. C: Flow cytometric analysis of tumor cell suspensions, prepared from MCF-7 or MCF-7/Topo-CD24low tumor tissue. Respective flow cytometric analyses of MCF-7 respectively MCF-7/Topo cells are shown as inserts. Lower panel: Expression of CK8, CK18 and Ki67 in MCF-7 tumor cells visualized by immunohistochemistry.

48 Chapter III
3.5.6 Discussion
ABCG2 transporter expression in tumor cells is induced upon treatment with a variety of
cytostatic drugs and enables the efflux of different chemotherapeutics (multidrug resistance).
ABCG2 activity can be experimentally identified in so-called “side populations”. Since those “side
populations” have been considered to comprise CICs, we examined the effect of cytotoxic
treatment on the expression of CD24, CD44, EpCAM, and HER2, which all are supposed to
enhance tumorigenicity, tumor progression, and metastasis. For example, a CD24- phenotype has
been linked to treatment-resistant breast cancer cells [50, 51], whereas another group reported
the enrichment of a highly tumorigenic CD24- subpopulation as a result of anti-Her2 treatment
with Trastuzumab in the presence of natural killer cells [52]. Hence, we assessed the capacity of
mammosphere formation in MCF-7 cells in vitro and tumor outgrowth in immunodeficient mice
as a function of treatment with Topo.
We report that long-term exposure of MCF-7 breast cancer cells to Topo led to a homogenously
high expression level of ABCG2 (= MCF-7/Topo), which remained stable for several weeks after
removal of Topo. As expected, MCF/Topo cells exhibited an increased chemoresistance against
cytostatic drugs like Doxo and MTX (i.e. ABCG2-substrates) [1]. However, the induction of ABCG2
in MCF-7/Topo cells under chemotherapeutic pressure did not result in an increased capacity to
form mammospheres. By contrast, MCF-7/Topo cells revealed a considerably decreased
tumorigenicity compared to MCF-7 cells. These findings suggest that the induction of ABCG2 upon
Topo treatment does not induce cells with enhanced cancer-initiating properties. It has been
reported that ABCG2- cells tended to form tumors more efficiently than ABCG2+ cells [53]. ABCG2
expression was indicative of fast-cycling tumor progenitors, whereas the ABCG2- population
expressed genes which are generally associated with “stemness”. The decreased tumorigenicity
of the ABCG2+ cell variant MCF-7/Topo as observed in this study may be attributed to the
concurrent Topo-treatment related downregulation of CD24 and EpCAM, which has not been
analyzed in the context of ABCG2 expression so far. However, it remains to be examined whether
Topo treatment causes both, increased ABCG2 and decreased CD24/EpCAM expression, or
whether the reduced CD24/EpCAM expression is a consequence of ABCG2 upregulation. Apart
from that, the increased CD24low/EpCAMlow subpopulation could either originate from the
selection of a pre-existing subpopulation or by a real downregulation of those markers.
Nevertheless, the association of CD24 with tumor clonogenicity becomes obvious from the
considerably reduced mammosphere formation in vitro and tumor outgrowth in vivo of sorted
MCF-7/Topo-CD24low cells. Notably, a positive correlation between high CD24 expression and
enhanced cell proliferation in vitro and in vivo was reported previously [16]. For example, CD24+
cells from pleural effusions of different carcinomas revealed increased tumorigenicity in
immunodeficient mice [54]. Further evidence for the impact of CD24 was previously provided by
the comparison of CD24low and CD24high subpopulations of MCF-7 cells [55]. The CD24high

Effects of topotecan treatment on MCF-7 cells 49
subpopulation proliferated faster and exhibited increased adhesion and invasiveness in vitro.
However, the expression of ABCG2 and the sensitivity against doxorubicin did not differ between
both cell types. Moreover, CD24 has been suggested to be involved in the metastatic process. It
has been described to be involved in tumor cell dissemination/seeding by mediating an
interaction of tumor cells with platelets and endothelial cells [56].
The concurrent downregulation of EpCAM in MCF-7 cells upon treatment with Topo, as observed
in this study, is likely to enhance the impact of reduced CD24 expression on clonogenicity and
tumorigenicity. While high EpCAM expression levels obviously favor cell aggregation [57] lower
expression of EpCAM impairs mammosphere formation of MCF-7/Topo cells. Alike CD24, the
EpCAM molecule is apparently involved in cell migration and invasive growth [58, 59]. However,
the regulation of EpCAM during metastasis is postulated to be more complex: EpCAM positive
but also negative circulating and disseminated tumor cells have been reported, although cell
migration would rather implicate a low EpCAM expression. Conversely, the subsequent tissue
invasion as well as the formation of micrometastases would require distinct EpCAM expression
[60].
In the past, a number of distinctive biomarker patterns have been associated to breast cancer
stem cells. Nevertheless, a definite or unique stem cell phenotype could not be established,
whereas even a pronounced plasticity of cell populations with distinct marker expression patterns
(CD24, CD44, EpCAM) was recently reported [43]. Moreover, even a missing correlation of a
typical profile of breast cancer stem cell markers (i.e., CD24low, CD44high, ALDHhigh, EpCAMlow) and
enhanced tumorigenicity has been reported [61]. The present study substantiates existing
evidence for the importance of CD24 and EpCAM in tumor formation and outgrowth. Beyond
that, the data indicate that induced ABCG2 expression is not necessarily linked to a more
aggressive phenotype.

50 Chapter III
3.6 Conclusion
Distinct cancer initiating cell marker expression was found in Daoy (brain tumor), MDA-MB-231,
HCC1806 and HCC1937 (triple negative breast cancer) cells. The sorted Daoy-CD133+
subpopulation revealed also significantly enhanced clonogenicity in vitro. However, Daoy cells
showed inappropriate characteristics for cell sorting, impeding investigations with high numbers
of sorted cells. Furthermore, overall poor take rates in NMRI-nu/nu mice hampered the in vivo
investigations of brain (Daoy) and breast cancer (MCF-7) cell lines. Apart from that, evidence for
lacking correlations between established markers of cancer initiating cells and tumorigenicity
were provided for MDA-MB-231 cells, which underlines the importance of the combination of
several markers with in vivo experiments.
The treatment of MCF-7 breast cancer cells with topotecan induces ABCG2-expression and thus
leads to increased cellular resistance against cytostatic drugs which are substrates of the
transporter molecule. Concurrently, topotecan treatment resulted in a persisting but reversible
reduction of CD24 and EpCAM expression. This phenotype modification was not associated with
an enhanced, but rather with a reduced clonogenicity and tumorigenicity. Nevertheless, further
investigations are necessary to determine whether ABCG2 induction and CD24/EpCAM
downregulation, respectively the selection of a CD224low/EpCAMlow subpopulation are correlated
or independent processes.

References 51
3.7 References
1. Noguchi K, et al. Human ABC transporter ABCG2/BCRP expression in chemoresistance: basic and clinical perspectives for molecular cancer therapeutics. Pharmgenomics Pers Med. 2014;7: 53-64.
2. Goodell MA, et al. Dye efflux studies suggest that hematopoietic stem cells expressing low or undetectable levels of CD34 antigen exist in multiple species. Nat Med. 1997;3: 1337-1345.
3. Robey RW, et al. A functional assay for detection of the mitoxantrone resistance protein, MXR (ABCG2). Biochim Biophys Acta. 2001;1512: 171-182.
4. Richard V, et al. Side population cells as prototype of chemoresistant, tumor-initiating cells. Biomed Res Int. 2013;2013: 517237.
5. Maliepaard M, et al. Overexpression of the BCRP/MXR/ABCP gene in a topotecan-selected ovarian tumor cell line. Cancer Res. 1999;59: 4559-4563.
6. Calcagno AM, et al. Single-step doxorubicin-selected cancer cells overexpress the ABCG2 drug transporter through epigenetic changes. Br J Cancer. 2008;98: 1515-1524.
7. Singh SK, et al. Identification of a cancer stem cell in human brain tumors. Cancer Res. 2003;63: 5821-5828.
8. Curley MD, et al. CD133 expression defines a tumor initiating cell population in primary human ovarian cancer. Stem Cells. 2009;27: 2875-2883.
9. Ma S, et al. Aldehyde dehydrogenase discriminates the CD133 liver cancer stem cell populations. Mol Cancer Res. 2008;6: 1146-1153.
10. Mizrak D, et al. CD133: molecule of the moment. J Pathol. 2008;214: 3-9. 11. Al-Hajj M, et al. Prospective identification of tumorigenic breast cancer cells. Proc Natl
Acad Sci U S A. 2003;100: 3983-3988. 12. Sagiv E, Arber N. The novel oncogene CD24 and its arising role in the carcinogenesis of the
GI tract: from research to therapy. Expert Rev Gastroenterol Hepatol. 2008;2: 125-133. 13. Kristiansen G, et al. CD24 expression is a new prognostic marker in breast cancer. Clin
Cancer Res. 2003;9: 4906-4913. 14. Lim SC, Oh SH. The role of CD24 in various human epithelial neoplasias. Pathol Res Pract.
2005;201: 479-486. 15. Baumann P, et al. CD24 expression causes the acquisition of multiple cellular properties
associated with tumor growth and metastasis. Cancer Res. 2005;65: 10783-10793. 16. Smith SC, et al. The metastasis-associated gene CD24 is regulated by Ral GTPase and is a
mediator of cell proliferation and survival in human cancer. Cancer Res. 2006;66: 1917-1922.
17. Ponta H, et al. CD44: from adhesion molecules to signalling regulators. Nat Rev Mol Cell Biol. 2003;4: 33-45.
18. Zoller M. CD44: can a cancer-initiating cell profit from an abundantly expressed molecule? Nat Rev Cancer. 2011;11: 254-267.
19. Louderbough JM, Schroeder JA. Understanding the dual nature of CD44 in breast cancer progression. Mol Cancer Res. 2011;9: 1573-1586.
20. Toole BP. Hyaluronan-CD44 Interactions in Cancer: Paradoxes and Possibilities. Clin Cancer Res. 2009;15: 7462-7468.

52 Chapter III
21. Naor D, et al. Involvement of CD44, a molecule with a thousand faces, in cancer dissemination. Semin Cancer Biol. 2008;18: 260-267.
22. Williams K, et al. CD44 integrates signaling in normal stem cell, cancer stem cell and (pre)metastatic niches. Exp Biol Med (Maywood). 2013;238: 324-338.
23. Gires O. Lessons from common markers of tumor-initiating cells in solid cancers. Cell Mol Life Sci. 2011;68: 4009-4022.
24. Spizzo G, et al. High Ep-CAM expression is associated with poor prognosis in node-positive breast cancer. Breast Cancer Res Treat. 2004;86: 207-213.
25. Jojovic M, et al. Epithelial glycoprotein-2 expression is subject to regulatory processes in epithelial-mesenchymal transitions during metastases: an investigation of human cancers transplanted into severe combined immunodeficient mice. Histochem J. 1998;30: 723-729.
26. Brufsky AM. Current Approaches and Emerging Directions in HER2-resistant Breast Cancer. Breast Cancer (Auckl). 2014;8: 109-118.
27. Olayioye MA. Update on HER-2 as a target for cancer therapy: intracellular signaling pathways of ErbB2/HER-2 and family members. Breast Cancer Res. 2001;3: 385-389.
28. Dodic N, et al. Synthesis and activity against multidrug resistance in Chinese hamster ovary cells of new acridone-4-carboxamides. J Med Chem. 1995;38: 2418-2426.
29. Hubensack M. Approaches to Overcome the Blood-Brain Barrier in the Chemotherapy of Primary and Secondary Brain Tumors: Modulation of P-glycoprotein 170 and Targeting of the Transferrin Receptor. PhD Thesis, University of Regensburg. 2005. Available: http://epub.uni-regensburg.de/10297/.
30. Kühnle M, et al. Potent and selective inhibitors of breast cancer resistance protein (ABCG2) derived from the p-glycoprotein (ABCB1) modulator tariquidar. J Med Chem. 2009;52: 1190-1197.
31. Hemmati HD, et al. Cancerous stem cells can arise from pediatric brain tumors. Proc Natl Acad Sci U S A. 2003;100: 15178-15183.
32. Ponti D, et al. Isolation and in vitro propagation of tumorigenic breast cancer cells with stem/progenitor cell properties. Cancer Res. 2005;65: 5506-5511.
33. Dontu G, et al. In vitro propagation and transcriptional profiling of human mammary stem/progenitor cells. Genes Dev. 2003;17: 1253-1270.
34. Calvet CY, et al. The culture of cancer cell lines as tumorspheres does not systematically result in cancer stem cell enrichment. PLoS One. 2014;9: e89644.
35. Cioce M, et al. Mammosphere-forming cells from breast cancer cell lines as a tool for the identification of CSC-like- and early progenitor-targeting drugs. Cell Cycle. 2010;9: 2878-2887.
36. Müller C. New approaches to the therapy of glioblastoma: investigations on RNA interference, kinesin Eg5 and ABCB1/ABCG2 inhibition. PhD Thesis, University of Regensburg. 2007. Available: http://epub.uni-regensburg.de/10567/.
37. Wege AK, et al. Humanized tumor mice--a new model to study and manipulate the immune response in advanced cancer therapy. Int J Cancer. 2011;129: 2194-2206.
38. Miraglia S, et al. A novel five-transmembrane hematopoietic stem cell antigen: isolation, characterization, and molecular cloning. Blood. 1997;90: 5013-5021.
39. Yin AH, et al. AC133, a novel marker for human hematopoietic stem and progenitor cells. Blood. 1997;90: 5002-5012.
References 53
40. Corbeil D, et al. The human AC133 hematopoietic stem cell antigen is also expressed in epithelial cells and targeted to plasma membrane protrusions. J Biol Chem. 2000;275: 5512-5520.
41. Horn PA, et al. Expression of AC133, a novel hematopoietic precursor antigen, on acute myeloid leukemia cells. Blood. 1999;93: 1435-1437.
42. Morrison SJ, Kimble J. Asymmetric and symmetric stem-cell divisions in development and cancer. Nature. 2006;441: 1068-1074.
43. Gupta PB, et al. Stochastic state transitions give rise to phenotypic equilibrium in populations of cancer cells. Cell. 2011;146: 633-644.
44. Lendahl U, et al. CNS stem cells express a new class of intermediate filament protein. Cell. 1990;60: 585-595.
45. Wang J, et al. CD133 negative glioma cells form tumors in nude rats and give rise to CD133 positive cells. Int J Cancer. 2008;122: 761-768.
46. Irollo E, Pirozzi G. CD133: to be or not to be, is this the real question? Am J Transl Res. 2013;5: 563-581.
47. Schmidt M. Chemotherapy in early breast cancer: when, how and which one? Breast Care (Basel). 2014;9: 154-160.
48. Leccia F, et al. Cytometric and biochemical characterization of human breast cancer cells reveals heterogeneous myoepithelial phenotypes. Cytometry A. 2012;81: 960-972.
49. Taylor-Papadimitriou J, et al. Keratin expression in human mammary epithelial cells cultured from normal and malignant tissue: relation to in vivo phenotypes and influence of medium. J Cell Sci. 1989;94 ( Pt 3): 403-413.
50. Creighton CJ, et al. Residual breast cancers after conventional therapy display mesenchymal as well as tumor-initiating features. Proc Natl Acad Sci U S A. 2009;106: 13820-13825.
51. Tanaka H, et al. The Hedgehog signaling pathway plays an essential role in maintaining the CD44+CD24-/low subpopulation and the side population of breast cancer cells. Anticancer Res. 2009;29: 2147-2157.
52. Reim F, et al. Immunoselection of breast and ovarian cancer cells with trastuzumab and natural killer cells: selective escape of CD44high/CD24low/HER2low breast cancer stem cells. Cancer Res. 2009;69: 8058-8066.
53. Patrawala L, et al. Side population is enriched in tumorigenic, stem-like cancer cells, whereas ABCG2+ and ABCG2- cancer cells are similarly tumorigenic. Cancer Res. 2005;65: 6207-6219.
54. Yao X, et al. Determination of 35 cell surface antigen levels in malignant pleural effusions identifies CD24 as a marker of disseminated tumor cells. Int J Cancer. 2013;133: 2925-2933.
55. Kim HJ, et al. Isolation of CD24(high) and CD24(low/-) cells from MCF-7: CD24 expression is positively related with proliferation, adhesion and invasion in MCF-7. Cancer Lett. 2007;258: 98-108.
56. Aigner S, et al. CD24 mediates rolling of breast carcinoma cells on P-selectin. FASEB J. 1998;12: 1241-1251.
57. Litvinov SV, et al. Epithelial cell adhesion molecule (Ep-CAM) modulates cell-cell interactions mediated by classic cadherins. J Cell Biol. 1997;139: 1337-1348.

54 Chapter III
58. Munz M, et al. The carcinoma-associated antigen EpCAM upregulates c-myc and induces cell proliferation. Oncogene. 2004;23: 5748-5758.
59. Osta WA, et al. EpCAM is overexpressed in breast cancer and is a potential target for breast cancer gene therapy. Cancer Res. 2004;64: 5818-5824.
60. Imrich S, et al. EpCAM and its potential role in tumor-initiating cells. Cell Adh Migr. 2012;6: 30-38.
61. Lehmann C, et al. Established breast cancer stem cell markers do not correlate with in vivo tumorigenicity of tumor-initiating cells. Int J Oncol. 2012;41: 1932-1942.

4 Chapter IV
Stabilities of neutral and basic esters of
bendamustine in plasma compared to the
parent compound: Kinetic investigations by
HPLC
Note: As stated in the list of publications, this chapter has already been published prior to the
submission of this thesis [1]. For detailed information on the contribution of other authors see also
“Acknowledgements”.

56 Chapter IV
4.1 Introduction
Bendamustine (1, Fig. 4.1), first synthesized in 1963 [2, 3], was brought on the market in East
Germany under the name “Cytostasan” for the treatment of chronic lymphatic leukemia (CLL),
non-Hodgkin lymphoma (NHL), Hodgkin disease, multiple myeloma (MM) and breast cancer [4-
7]. After passing out of mind, it was rediscovered in the 1990s and marketed in North America.
Today, bendamustine is approved for CLL [8, 9], indolent NHL [10] and MM [11, 12] in Germany
and for CLL and indolent NHL in the US.
Figure 4.1: Structures of bendamustine (1) and the bendamustine esters 2-9.
As a nitrogen mustard derivative, 1 is instable in aqueous solutions, in particular at neutral or
basic pH values [13], resulting in the inactive bis(2-hydroxyethylamino)-substituted
benzimidazole derivative upon twofold hydrolysis. Several HPLC methods for the determination
of bendamustine and related compounds, degradation products and metabolites are reported in
the literature, using UV [14-16], fluorescence [17] and mass spectrometric [18, 19] detection.
Bendamustine is provided as a lyophilized powder for preparation of solutions prior to
intravenous administration [20]. Recent patent applications aimed at improved oral
bioavailability of bendamustine by optimized formulations [21-23]. Simple alkyl esters (e. g.
methyl and ethyl ester) of 1 are mainly known as synthetic intermediates [24, 25]. Dimeric and
dendrimeric bendamustine derivatives were investigated with respect to cytotoxicity [26, 27], and
C1 – C24 alkyl esters were reported as prodrugs to prepare formulations for intravenous injection
[28]. In a different approach, exploring the potential of derivatives of 1, very recently, esters of
bendamustine (compounds 2-7 (Fig. 4.1) cf. ref. [29]) proved to possess considerably increased
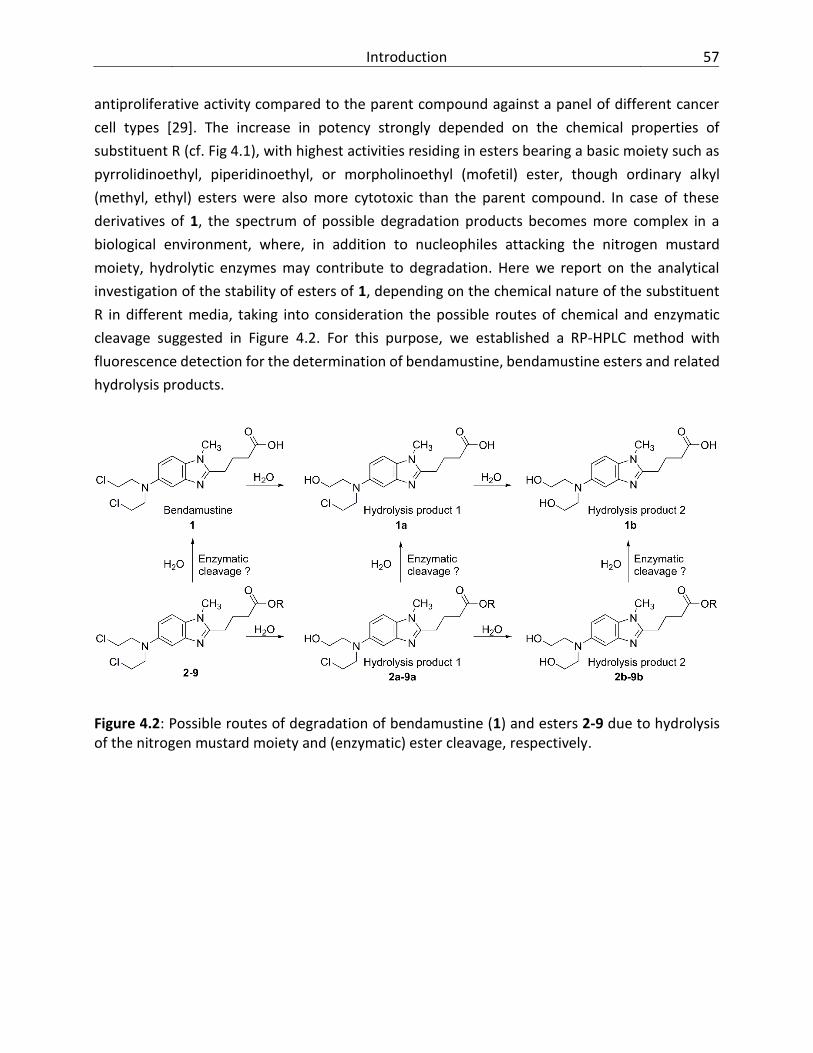
Introduction 57
antiproliferative activity compared to the parent compound against a panel of different cancer
cell types [29]. The increase in potency strongly depended on the chemical properties of
substituent R (cf. Fig 4.1), with highest activities residing in esters bearing a basic moiety such as
pyrrolidinoethyl, piperidinoethyl, or morpholinoethyl (mofetil) ester, though ordinary alkyl
(methyl, ethyl) esters were also more cytotoxic than the parent compound. In case of these
derivatives of 1, the spectrum of possible degradation products becomes more complex in a
biological environment, where, in addition to nucleophiles attacking the nitrogen mustard
moiety, hydrolytic enzymes may contribute to degradation. Here we report on the analytical
investigation of the stability of esters of 1, depending on the chemical nature of the substituent
R in different media, taking into consideration the possible routes of chemical and enzymatic
cleavage suggested in Figure 4.2. For this purpose, we established a RP-HPLC method with
fluorescence detection for the determination of bendamustine, bendamustine esters and related
hydrolysis products.
Figure 4.2: Possible routes of degradation of bendamustine (1) and esters 2-9 due to hydrolysis of the nitrogen mustard moiety and (enzymatic) ester cleavage, respectively.

58 Chapter IV
4.2 Materials and Methods
4.2.1 Chemicals and reagents
Bendamustine-HCl as well as the esters 2-7 [29] were provided by Arevipharma GmbH (Radebeul,
Germany). Compounds 8 (1) and 9 (1) (Fig. 4.1) were synthesized in our laboratory (for synthesis
protocols and analytical data cf. master thesis of F. Antoni [30]). Physostigmine, umbelliferone,
porcine liver esterase and o-nitrophenyl butyrate were from Sigma-Aldrich (Taufkirchen,
Germany). HPLC-grade acetonitrile was obtained from Fisher Scientific (Schwerte, Germany).
Demineralized water was purified with a Milli-Q system (Merck KGAa, Darmstadt, Germany). All
other reagents, if not otherwise stated, were of analytical grade and from Sigma-Aldrich
(Taufkirchen, Germany).
4.2.2 Analytical procedures
4.2.2.1 Instumentation
HPLC analyses were performed with a system from Thermo Separation Products (Dreieich,
Germany), consisting of a SN 4000 Controller, a P4000 pump, an AS3000 autosampler, a Spectra
Focus 2000 UV‐Vis detector a FL3000 fluorescence detector and a SCM 400 solvent degasser. A
Synergi Hydro RP column (4 µm; 80A; 250 x 4.0 mm), equipped with a guard cartridge (AQ C18,
Phenomenex, Aschaffenburg, Germany) was used for separation of the analytes.
4.2.2.2 HPLC conditions
The mobile phase consisted of NaH2PO4 (10 mM, pH 3.0) (A), filtrated through a 0.22 µm Steritop-
GP filter (Merck, Darmstadt, Germany) and acetonitrile (B). Both eluents were degassed with
helium prior to use. For all analyses, the injection volume was 50 µL, and a linear gradient from 5
– 50 % B within 15 min at a flow rate of 0.75 mL/min and a column temperature of 30 °C was
used. Fluorescence detection was performed at an excitation wavelength of 330 nm and emission
at 420 nm. Void volume was determined with uracil.
4.2.2.3 Standards and calibration
Solutions of 1-9 and of the internal standard umbelliferone were prepared in dimethyl sulfoxide
(DMSO). The identities of the reference compounds (“standards”), umbelliferone, bendamustine
(1) and 4-{5-[bis(2-hydroxyethyl)amino]-1-methyl-1H-benzo[d]imidazol-2-yl}butanoic acid (1b)
1 Synthesized and examined by F. Antoni [30].

Materials and Methods 59
were confirmed by LC-MS and 1H NMR spectroscopy, respectively (data not shown). For
calibration, solutions of 1-9 (at least 8 concentrations between 5 nM and 30 µM) were prepared
by serial dilution of the stock solutions with an aqueous solution of NaH2PO4 (10 mM) adjusted to
pH 2.0 with phosphoric acid. In case of the internal standard (umbelliferone), nine different
concentrations (5 nM - 25 µM), obtained by dilution with phosphate solution pH 2.0, were used
for calibration.
4.2.3 Determination of the stability of bendamustine and bendamustine esters
4.2.3.1 Stability in phosphate buffer
Stock solutions (3 mM) of 1-7 were diluted with phosphate buffer (10 mM Na2HPO4, pH was
adjusted to 7.4 with phosphoric acid) to a final concentration of 30 µM. After different periods of
incubation (0, 7.5, 15 and 30 min) at 37 °C, hydrolysis of the nitrogen mustard moiety was stopped
by adding 20 µL of the sample to 180 µL ice cold acidic phosphate solution (10 mM, pH 2.0). After
filtration (Phenex-RC 4-mm Syringe Filters 0.2 µm; Phenomenex), 50 µL of this solution were
injected into the HPLC system.
Half-lives were calculated from plots of peak areas versus time, using the “one phase exponential
decomposition” option of GraphPad Prism 5 (GraphPad Software, La Jolla, USA).
With respect to the preferred deproteination procedure and the sample preparation and storage,
the stability of the analytes was assessed in PBS containing 0.5 M perchloric acid at 4 °C over a
period of 8 h.
4.2.3.2 Stability in human and murine plasma
Human CPD (citrate, phosphate, dextrose)-plasma was a gift from the Bavarian Red Cross. Murine
blood was collected from nude mice (NMRI-nu/nu) by cardiac punction using heparin-coated
syringes. Blood samples were immediately stored on ice until the cellular components were
removed by centrifugation at 4 °C and 5000 g for 10 min. The plasma samples were stored at -80
°C.
Solutions of 1-9 (20 µL, 1 mM) were mixed with 180 µL of a 200 µM solution of the internal
standard (umbelliferone) in phosphate buffered saline (PBS). Afterwards, this mixture was added
to human or murine plasma, giving a concentration of 10 µM of 1-9.
After incubation at 37 °C for different periods, depending on the individual compound,
deproteination of the samples was performed by adding the same volume of ice-cold perchloric
acid (1 M) and vortexing. After storage for 20 min at 4 °C and subsequent centrifugation of the
60 Chapter IV
samples (3 min, 4 °C, 16,000 g; Eppendorf Centrifuge 5415 R, Hamburg, Germany), the
supernatants were filtrated (Phenex-RC 4-mm Syringe Filters 0.2 µm; Phenomenex) and stored
on ice until HPLC analysis. To inhibit unspecific esterases (butyrylcholinesterase) in human
plasma, samples were incubated with physostigmine (100 µM) at 37 °C for 30 min prior to the
addition of the esters 4 and 5.
4.2.3.3 Stability depending on protein concentration
The influence of the protein concentration on the stability of different bendamustine derivatives
was determined by analogy with the stability in plasma, except for the replacement of plasma by
a solution of porcine liver esterase (5.48 U/mL) in PBS, containing different concentrations of
bovine serum albumin (BSA) ranging from 20 mg/mL to 70 mg/mL. The most pronounced effect
was observed at concentrations from 30 mg/mL to 50 mg/mL.
4.2.3.4 Determination of the activity of unspecific esterases
Esterase activity was determined photometrically using o-nitrophenyl butyrate as substrate [31,
32]. o-Nitrophenyl butyrate (40 µL of a 100 mM stock solution in DMSO) was mixed with 1 mL of
phosphate buffer (0.1 M, pH 7.4). When the solution had reached 37 °C, 10 µL of murine or human
plasma were added, and the increasing absorbance was recorded at 414 nm for 4 min. The volume
activity VA was determined from the initial rate according to the following equation:
VA=(ΔA / t) . V / (ε . d . v)
(Volume activity VA (µmol . min-1 . mL-1), ΔA = increase in absorbance at 414 nm, ε = 3190 L . mol-1 .
cm-1 [33], d = path length (cm), V = total volume (mL), v = volume of enzyme/plasma containing
solution (mL))

Results 61
4.3 Results
4.3.1 Validation of the HPLC-method
The analytical procedure was validated according to the ICH guideline Q2 (R1) [34] with respect
to selectivity, linearity, limits of quantification (LOQ), limit of detection (LOD), accuracy, precision
(repeatability), and robustness (for details cf. supplementary material, Tables S4.1-S4.6). As
shown in Figure 4.3, baseline separation of the parent compounds and the corresponding
cleavage products was achieved.
Figure 4.3: Representative chromatograms of 1 (A) and 7 (B) obtained after incubating the compounds in (A) phosphate buffer (pH 7.4) or (B) human plasma for 5 min. Fluorescence at an excitation wavelength of 330 nm and emission at 420 nm.
Table 4.1: Retention factors (k) of the analytes 1-9 and the internal standard (IS), and selectivities (α) of the HPLC method.
Compd. X k(X) Selectivitya
α (X; Xa) α (X; 1) α (X; IS) α (Xa; IS)
1 2.50 1.54 - 1.14 1.36
2 2.88 1.47 1.15 1.31 1.12
3 3.07 1.48 1.23 1.40 1.06
4 1.89 1.58 1.32 1.16 1.83
5 1.91 1.54 1.31 1.15 1.77
6 1.98 1.61 1.26 1.11 1.79
7 1.86 1.54 1.34 1.18 1.82
8b 2.01 1.50 1.24 1.09 1.64
9b 1.81 1.39 1.38 1.22 1.69
IS 2.20 - - - - a Selectivities α calculated from the retention factors (k) of the parent compounds X (1-9), and the k values of the corresponding products of the first hydrolysis of the nitrogen mustard moiety Xa (1a – 9a, structures cf. Fig. 4.2), bendamustine (1) and the internal standard (IS) as indicated in parentheses. b Data provided by F. Antoni.

62 Chapter IV
The retention factors (k) of 1-9 and of the
internal standard, as well as the separation
factors (α) are summarized in Table 4.1.
Calibration curves (examples, cf. Figure 4.4) of
the test compounds 1-9 and the internal
standard in the concentration range between
50 nM and 30 µM were linear with correlation
coefficients r2 ≥ 0.996 for all test compounds
(Table S4.1). The LOD and LOQ of compounds
1-9 and the internal standard were calculated
based on peak heights for a signal–to-noise
ratio of 3:1 and 10:1, respectively. The LOD
was in the range between 1.6 nM and 9.3 nM,
and LOQ was between 5.4 nM and 31.2 nM
(Table S4.2). Repeatability and accuracy were
determined by analyzing three different
concentrations within the specified range
(250 nM – 10 µM) (Table S4.3). The relative standard deviation (RSD) was < 5% for all analytes
and the accuracy was between 96.3% and 107.1%. Inter-day precision (coefficients of variation
were ≤ 6.3%) was determined over a period of six months (Table S4.4).
The method was demonstrated to be robust with respect to changes of flow rate (0.7 mL/min and
0.8 mL/min), gradient (0 – 45% and 10 - 55% acetonitrile), pH of the mobile phase (pH 3 and 4),
column temperature (25 °C and 35 °C), excitation and emission wavelengths (ex.: 320 nm, em:
410 nm and ex: 340 nm, em: 430 nm) and duration of treatment with perchloric acid (1 M) for
deproteination of BSA (50 mg/mL) containing solutions (Table S4.5, S4.6). The specificity and the
baseline separation remained unaffected by varying mobile phase, flow rate and temperature.
The peak areas were increased (up to approximately 12%) when the samples were treated with
perchloric acid for 25 minutes compared to 15 minutes.
Figure 4.4. Concentration-dependent intensity of the fluorescence signal of 1, 7 and the internal standard (IS) umbelliferon. Analytes were dissolved in acidic phosphate solution (pH 2), prior to HPLC analysis. Excitation at 330 nm, emission at 420 nm.

Results 63
Figure 4.5: Stability of 1, 4 and the internal standard (IS) umbelliferone. Conditions: Storage at 4 °C in phosphate solution pH 2 for 24 hours (A) or in phosphate solution containing 0.5 M perchloric acid for 8 hours (B) to stop the hydrolysis of the nitrogen mustard group. Mean values ± SEM (N = 3).
The analytes were stable in 10 mM phosphate buffer
(pH 2.0) over a period of 24 h, as shown in Figure 4.5 A
for 1, 4 and umbelliferone as examples. We compared
different deproteination procedures (acetonitrile, 2 M
trichloroacetic acid, 2 M trichloroacetic acid in
ethanol, 1 M perchloric acid) with regard to stability
and recovery (Table 4.2) of the analytes. Treatment
with 1 M ice-cold perchloric acid gave the best results.
With respect to sample processing, stability of the
analytes was guaranteed in the presence of 0.5 M
perchloric acid over a period of 8 hours (examples cf.
Figure 4.5 B). By contrast, in human and, especially, in
murine plasma, the ester cleavage was too fast in case
of 5-7 and 9 to determine the recovery of the intact
compounds; considerable amounts degraded within
seconds.
Table 4.2: Recovery from human plasma (mean values ± SEM, n = 4)
Compd. % Recovery from human plasma
1 89.2 ± 0.7 2 74.5 ± 2.9 3 66.1 ± 1.6
4 78.7 ± 4.0 5 n. d.a 6 n. d.a 7 n. d.a
8b 55.4 ± 5.0
9b n. d.a IS 83.9 ± 1.6
a Recovery not determined due to the short half-life. b Data provided by F. Antoni.
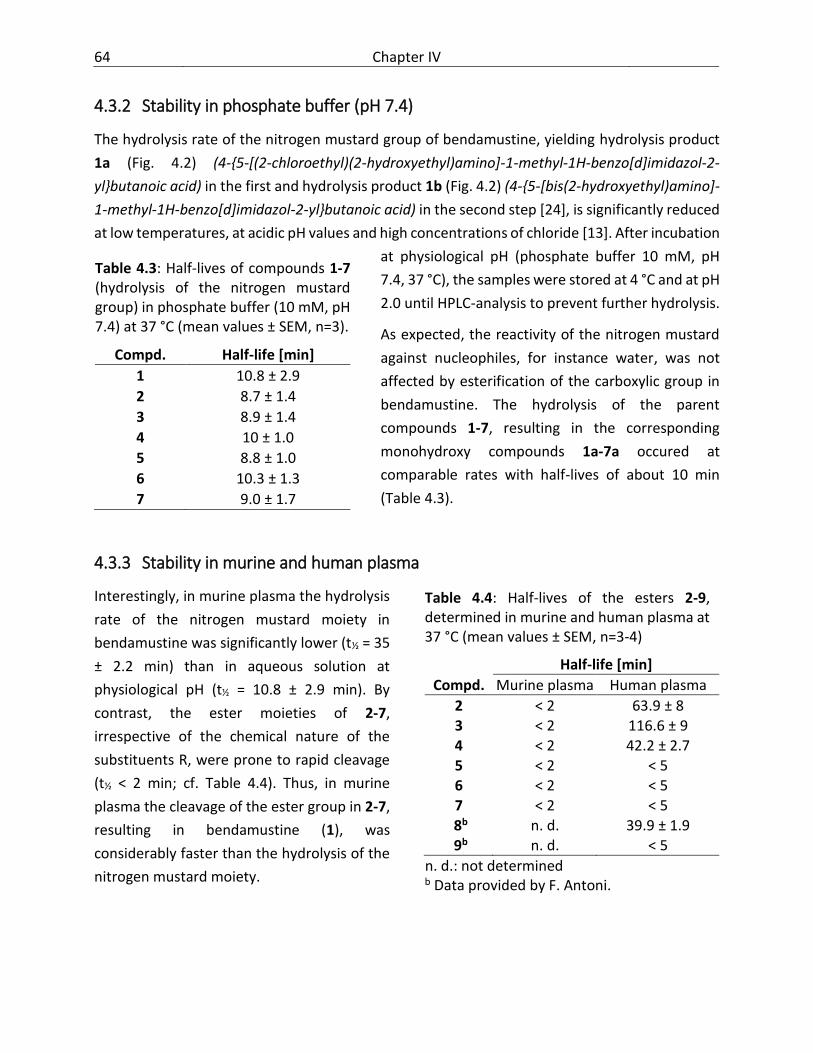
64 Chapter IV
4.3.2 Stability in phosphate buffer (pH 7.4)
The hydrolysis rate of the nitrogen mustard group of bendamustine, yielding hydrolysis product
1a (Fig. 4.2) (4-{5-[(2-chloroethyl)(2-hydroxyethyl)amino]-1-methyl-1H-benzo[d]imidazol-2-
yl}butanoic acid) in the first and hydrolysis product 1b (Fig. 4.2) (4-{5-[bis(2-hydroxyethyl)amino]-
1-methyl-1H-benzo[d]imidazol-2-yl}butanoic acid) in the second step [24], is significantly reduced
at low temperatures, at acidic pH values and high concentrations of chloride [13]. After incubation
at physiological pH (phosphate buffer 10 mM, pH
7.4, 37 °C), the samples were stored at 4 °C and at pH
2.0 until HPLC-analysis to prevent further hydrolysis.
As expected, the reactivity of the nitrogen mustard
against nucleophiles, for instance water, was not
affected by esterification of the carboxylic group in
bendamustine. The hydrolysis of the parent
compounds 1-7, resulting in the corresponding
monohydroxy compounds 1a-7a occured at
comparable rates with half-lives of about 10 min
(Table 4.3).
4.3.3 Stability in murine and human plasma
Interestingly, in murine plasma the hydrolysis
rate of the nitrogen mustard moiety in
bendamustine was significantly lower (t½ = 35
± 2.2 min) than in aqueous solution at
physiological pH (t½ = 10.8 ± 2.9 min). By
contrast, the ester moieties of 2-7,
irrespective of the chemical nature of the
substituents R, were prone to rapid cleavage
(t½ < 2 min; cf. Table 4.4). Thus, in murine
plasma the cleavage of the ester group in 2-7,
resulting in bendamustine (1), was
considerably faster than the hydrolysis of the
nitrogen mustard moiety.
Table 4.4: Half-lives of the esters 2-9, determined in murine and human plasma at 37 °C (mean values ± SEM, n=3-4)
Half-life [min]
Compd. Murine plasma Human plasma
2 < 2 63.9 ± 8 3 < 2 116.6 ± 9 4 < 2 42.2 ± 2.7 5 < 2 < 5 6 < 2 < 5
7 < 2 < 5 8b n. d. 39.9 ± 1.9
9b n. d. < 5
n. d.: not determined b Data provided by F. Antoni.
Table 4.3: Half-lives of compounds 1-7 (hydrolysis of the nitrogen mustard group) in phosphate buffer (10 mM, pH 7.4) at 37 °C (mean values ± SEM, n=3).
Compd. Half-life [min]
1 10.8 ± 2.9
2 8.7 ± 1.4
3 8.9 ± 1.4
4 10 ± 1.0
5 8.8 ± 1.0
6 10.3 ± 1.3
7 9.0 ± 1.7

Results 65
Surprisingly, compounds 1-9 behaved differently in human compared to murine plasma. Firstly,
the rate of the hydrolysis of the nitrogen mustard group was significantly slower in human plasma
(1: t½ = 131 ± 10.2 min). Secondly, the chemical nature of the substituent R substantially
determined the rates of ester cleavage (Table 4.4). Representative chromatograms of the
decomposition in human plasma of compounds 2, 4, 7 and 8 are shown in Fig. 4.6.
Figure 4.6. Representative chromatograms illustrating the different rates of decomposition of compounds 2 (A), 4 (B), 8 (C) and 7 (D; data provided by F. Antoni) after the incubation in human plasma at 37 °C for different periods of time.
The sequence of degradation of the aminoalkyl esters 5, 6, 7 and 9, comprising unsubstituted
ethylene (5-7) or trimethylene (9) chains, was the same as in murine plasma, yielding
bendamustine as the first degradation product, due to rapid ester cleavage (t½ < 5 min, Table 4.4),
followed by hydrolysis of the nitrogen mustard group.
The neutral alkyl esters 2 (t½ = 63.9 ± 8 min) and 3 (t½ = 116.6 ± 9 min), the weakly basic
morpholinoethyl (mofetil) ester 4 (t½ = 42.2 ± 2.7 min) and the branched, more basic pyrrolidino-
substituted ester 8 (t½ = 39.9 ± 1.9 min) showed considerably increased half-lives in human plasma
compared to murine plasma (Table 4.4). The fast cleavage of 5, 6, 7 and 9, reminiscent of
substrates of unspecific cholinesterases, in comparison to the retarded degradation of neutral,

66 Chapter IV
less basic or branched esters (2, 3, 4 and 8) suggested an enzyme-mediated hydrolysis of the ester
bond. Indeed, the inhibition of unspecific plasma esterases by physostigmine resulted in
prolonged half-lives of compounds 4 and 5, which were investigated as examples. The effect of
physostigmine was much more pronounced in case of the heterocyclic basic ester 5 (48.3
compared to <5 min) than for the mofetil ester 4 (52.8 compared to 42.2 min) (Fig. 4.7).
Figure 4.7. Decomposition of bendamustine mofetil ester 4 (A) and bendamustine pyrrolidinoethyl ester 5 (B) in human plasma at 37 °C in the presence (empty symbols) and the absence (filled symbols) of the esterase inhibitor physostigmine (100 µM).

Results 67
4.3.4 Influence of protein concentration and esterase activity on the degradation of
bendamustine esters
The discrepancies between the decomposition kinetics of 1-7 in human and murine plasma
supported the hypothesis that species-specific differences in protein content and esterase activity
were associated with this phenomenon. Therefore, we determined the decomposition kinetics of
1 and 4 as examples in the presence of both porcine liver esterase and different amounts of
bovine serum albumin. The results revealed a significant correlation between the half-lives and
the albumin concentration. The increase in the albumin concentration from 30 mg/mL to 50
mg/mL led to the prolongation of the half-life by 42 % for compound 1 (t½ = 120.4 ± 7.0 min vs. t½
= 170.7 ± 14.2 min) and by 70% for compound 4 (t½ = 7.3 ± 1.3 vs. t½ = 12.4 ± 0.5) (Fig. 4.8).
Figure 4.8: Decomposition of bendamustine 1 (A) and bendamustine mofetil ester 4 (B) in a solution of porcine liver esterase in phosphate buffer (pH 7.4) containing different concentrations (circles: 30 g/L; squares: 40 g/L; triangles: 50 g/L) of BSA. Compound 1 decomposed by hydrolysis of the nitrogen mustard moiety, whereas compound 4 primarily underwent ester cleavage to give 1 under the conditions of this experiment (cf. Fig. 4.2).
Additionally, the determination of the amounts of unspecific esterases revealed nearly 1.5 fold
higher activity in murine plasma (6.04 ± 0.2 µmol·min-1·mL-1) compared to human plasma (4.26 ±
0.23 µmol·min-1·mL-1). In this context it should be noted that the protein content of murine
plasma (total protein: 40-60 g/L, albumin: 20-35 g/L [35]) is lower than that of human plasma
(total protein: 64-83 g/L, albumin: 35-55 g/L [36]). The combination of both, the lower protein
content and the higher esterase activity appear to be responsible for the considerably lower
stability of bendamustine and esters of 1 in murine plasma.

68 Chapter IV
4.4 Discussion
Previously, solid phase extraction and mass spectrometric detection, requiring special equipment,
were applied for the analysis of bendamustine in biological material [18, 37]. We aimed at
establishing a simple, specific, sensitive and fast method to analyze esters of bendamustine (2-7)
and the corresponding decomposition products, including 1, in aqueous solution and in biological
material. Pencheva et al. (1: LOD 9.6 µg/mL, LOQ 34 µg/mL) [15] and Mathrusri Annapurna et al.
(1: LOD 0.24 µg/mL, LOQ 0.73 µg/mL) [15] described HPLC methods using UV detection. Xie et al.
[17] reported a more sensitive, convenient method for the determination of 1 and -hydroxy-
bendamustine in plasma, using perchloric acid for deproteination and fluorescence detection (1:
LOD 5 ng/mL in plasma and urine). As the fluorescence-based method was most promising, we
adapted this approach especially to the quantification of the new bendamustine esters and the
corresponding hydrolysis products. Regarding the sensitivity and recovery of bendamustine, the
modified HPLC procedure described here was comparable to the data reported by Xie et al. [17].
It should be stressed that, according to the optimized protocol, fluorescence detection allowed
for the specific quantification of bendamustine derivatives with high signal-to-noise ratios despite
protein precipitation with perchloric acid, which was reported unfavorable by
Dubbelmann et al. [18].
Recently, several esters (2-7) of the cytostatic bendamustine (1) were demonstrated to be
significantly more potent than the parent compound as cytostatic agents against a variety of
human cancer cell types in vitro [29]. These results suggest that the antiproliferative activity has
to be attributed to the derivatives on their own rather than to the conversion of the esters to
bendamustine as the active principle. With respect to exploring the potential value as anticancer
drugs in vivo, information on the stability of the esters in biological matrices are of utmost
importance.
The alkylating activity of nitrogen mustard derivatives such as 1-9 originates from the bis(2-
chloroethylamino) group, which is, apart from the reaction with bionucleophiles, a labile group,
undergoing hydrolysis in solutions, especially at neutral or basic pH [13]. This reaction can be
stopped by addition of acid, as demonstrated under the conditions of the HPLC analysis, when
acidic phosphate solution was used as a component of the mobile phase, and perchloric acid and
low temperature to precipitate plasma proteins. The established HPLC method enabled the
analysis of the stability of 1 and corresponding neutral and basic esters in buffer, plasma, and
against porcine liver esterase in the presence of different amounts of albumin.
In buffer at pH 7.4 hydrolysis of the nitrogen mustard group was the prevailing reaction, occurring
with comparable half-lives of around 10 min (1-7, Table 4.3). Interestingly, this decomposition
reaction slowed down by a factor of up to 13 in the presence of plasma protein. This can be
Discussion 69
explained by protection of the parent compounds in a hydrophobic environment when bound to
albumin [38].
Due to different rates of hydrolysis of the ester and the nitrogen mustard moiety, the cleavage of
the derivatives proved to be much more complex than that of 1. Cleavage of the ester group was
slowest in case of the ethyl ester (3, t½ 116 min) followed by compounds 2 (t½ 64 min), 4 (t½ 42
min) and 8 (t½ 40 min), i.e., in these cases the degradation kinetics was dominated by the
hydrolysis of the nitrogen mustard moiety. These compounds having a more stable ester group
(2, 3, 4 and 8) were converted to 1a (1b not determinable with this method) via bendamustine
(1) and underwent hydrolysis at the nitrogen mustard moiety to give 2a, 3a, 4a, 8a as
intermediates (examples cf. Fig. 4.6). By contrast, the cleavage of the ester bond was rapid (t½ <5
min) in case of the 2-pyrrolidinoethyl (5), 2-piperidinoethyl (6), 2-(4-methylpiperazino)ethyl (7),
and 3-pyrrolidinopropyl ester (9). For compounds such as 7, the corresponding hydrolysis product
7a was not detectable due to very fast conversion to 1 (Fig. 4.2). It should be mentioned that
unidentified reaction products were observed to a minor extent in the chromatograms (Fig. 4.6).
Chemical reactions of the alkylating molecular species with bionucleophiles in the incubation
mixture could have taken place, lowering the portion of residual analytes detectable with the
applied method.
The enzymatic hydrolysis in human plasma strongly depended on the presence or absence of a
strongly basic group (cf. compds. 5-9) and on sterical hindrance (cf. compd. 8). These structural
characteristics are reminiscent of substrates of unspecific cholinesterases [39]. Accordingly, the
enzymatic cleavage was strongly inhibited by physostigmine in case of 5, but only slightly affected
for the less basic ester 4. Interestingly, in contrast to human plasma, the same analytes were
much less stable in murine plasma (t½ <2 min). These differences can be explained by the lower
protein content and the higher enzymatic activity in murine compared to human plasma. The
determination of the decomposition kinetics of 1 and 4 in presence of porcine liver esterase and
different concentrations of bovine serum albumin (Fig. 4.8) revealed that the concentration of
albumin had a significant effect on the hydrolytic stability of both, the nitrogen mustard and the
ester bond.

70 Chapter IV
4.5 Conclusion
The properties of the introduced ester moieties define whether bendamustine esters are
preferred substrates of unspecific plasma esterases and thus strongly determine the stability of
the particular ester bond. The stabilization of bendamustine and esters by plasma proteins
became obvious from the studies in the presence of different amounts of bovine serum albumin
and from the investigations in murine and human plasma, which considerably differ regarding
protein content. The activity of unspecific esterases was much higher in murine compared to
human plasma. In concert, these species-dependent differences proved to cause tremendous
discrepancies regarding the stability of the title compounds. This phenomenon has to be taken
into account with respect to translational animal studies, and may also be relevant to
pharmacological investigations of structurally diverse bioactive compounds other than
cytostatics.

Supplementary material: Method validation 71
4.6 Supplementary material: Method validation
Table S4.1: Slopes and intercepts of the equation y = a·x + b. Coefficients of determination (r2)
calculated by simple linear regression from the data of three independent experiments.
Compound a [µV·s·µM-1] b [µV·s] r2
1 93570 ± 281.1 275.5 ± 941.2 0.9999 2 103700 ± 572.3 -755.7 ± 1916 0.9997 3 65030 ± 1107 -5786 ± 4702 0.9998 4 23440 ± 1143 8122 ± 4899 0.9926 5 45260 ± 782.8 2077 ± 3357 0.9983 6 66850 ± 1286 7719 ± 5516 0.9963 7 56700 ± 344.2 -2240 ± 1476 0.9994
8a 32990 ± 184.2 -2073 ± 794.5 0.9998 9a 35970 ± 146.1 -3619 ± 630.1 0.9999 IS 69430 ± 218 -715.4 ± 1976 0.9994
a Data provided by F. Antoni.
Table S4.2: Limit of detection (LOD) and
quantification (LOQ) calculated with a signal
to noise ratio of the peak heights of 3:1 and
10:1, respectively.
Compound LOD [nM] LOQ [nM]
1 1.6 5.4
2 2.4 7.9
3 8.0 26.6
4 9.3 31.2
5 5.0 16.7
6 4.8 16.1
7 4.5 15.1
8a 5.0 16.5
9a 4.9 16.3
IS 3.6 12.1 a Data provided by F. Antoni.
Table S4.4: Inter-day precision of
the HPLC-method over a period of 6
months. (Coefficient of variation (CV)
in %, n = 6)
Compound CV (%)
1 2.37
2 5.26
3 3.14
4 7.00
5 3.58
6 3.32
7 4.46
8a 6.30
9a 4.73
IS 4.91 a Data provided by F. Antoni.

72 Chapter IV
Table S4.3: Repeatability and accuracy of the HPLC-method. (n = 3-4)
Compound
Repeatability Accuracy [%]
nominal concentration
[µM]
determined concentration ±
SD [µM] RSD [%]
95 % confidence intervall
1
10 10.03 ± 0.146 1.45 9.670 - 10.39 99.7
1 1.079 ± 0.018 1.63 1.035 - 1.122 92.7
0.25 0.273 ± 0.016 5.77 0.234 - 0.312 91.7
2
10 9.948 ± 0.214 2.15 9.417 - 10.48 100.5
1 1.134 ± 0.065 5.71 0.973 - 1.294 88.2
0.25 0.243 ± 0.008 3.32 0.223 - 0.263 102.7
3
10 10.05 ± 0.071 0.71 8.195 - 11.31 99.5
1 1.017 ± 0.031 3.06 0.861 - 1.097 98.3
0.25 0.238 ± 0.007 2.76 0.215 - 0.252 105.0
4
10 9.750 ± 0.626 6.42 8.195 - 11.31 102.6
1 0.979 ± 0.047 4.84 0.861 - 1.097 102.1 0.25 0.234 ± 0.001 3.25 0.215 - 0.252 107.1
5 10 9.910 ± 0.202 2.04 9.410 - 10.41 100.9 1 0.983 ± 0.055 5.61 0.846 - 1.120 101.7
0.25 0.254 ± 0.011 4.18 0.228 - 0.280 98.4
6 10 9.885 ± 0.177 1.79 9.440 - 10.33 101.2 1 1.024 ± 0.045 4.37 0.913 - 1.135 97.7
0.25 0.243 ± 0.012 4.97 0.213 - 0.273 102.8
7 10 9.893 ± 0.142 1.43 9.540 - 10.24 101.1 1 0.916 ± 0.027 2.93 0.849 - 0.983 109.2
0.25 0.256 ± 0.011 4.17 0.229 - 0.282 97.7
8a
10 9.918 ± 0.450 4.54 8.800 - 11.04 100.8 1 0.974 ± 0.012 1.23 0.944 - 1.004 102.7
0.25 0.244 ± 0.001 0.21 0.243 - 0.245 102.5
9a
10 10.38 ± 0.283 2.73 9.674 - 11.08 96.3 1 0.995 ± 0.01 0.98 0.972 - 1.020 100.5
0.25 0.256 ± 0.01 2.84 0.238 - 0.273 97.7
IS
10 10.05 ± 0.143 1.42 9.700 - 10.41 99.5
1 0.987 ± 0.015 1.52 0.950 - 1.025 101.3
0.25 0.256 ± 0.012 4.84 0.225 - 0.286 97.7 a Data provided by F. Antoni.

Table S4.5: Effect of the flow rate, the composition and the pH of the mobile phase and the column temperature on the retention factors relative to the respective retention factors of the optimized method (100%).
Compound Flow rate Gradient a) pH = 4 Temperature
0.7 mL/min 0.8 mL/min 0 - 45% MeCN 10 - 55% MeCN 25 °C 35 °C
1b 96.64 104.80 80.85 81.35 100.44 102.79 98.38
1 94.72 105.39 76.85 100.40 101.64 101.36 100.16
2 94.77 105.54 73.12 102.00 105.24 101.16 100.45
4 94.72 105.43 77.61 96.59 112.31 101.41 99.97
IS 95.66 104.31 78.07 99.12 100.72 102.53 98.74
a) MeCN = acetonitrile
Table S4.6: Effects of the flow rate, the composition and the pH of the mobile phase, the column temperature, the wavelengths and the duration of treatment with perchloric acid on the peak areas relative to the respective peak areas of the optimized method (100%).
Compound Flow rate Gradient a) pH = 4 Temperature Wavelengths b) Incubation period c)
0.7
mL/min
0.8
mL/min
0-45 %
MeCN
10-55 %
MeCN
25 °C 35 °C λex: 320
λem: 410
λex: 340
λem: 430
15 min 25 min
1b 100.24 97.29 109.00 99.35 106.52 100.25 98.15 69.47 113.42 102.30 107.62
1 107.07 94.43 96.78 101.97 103.10 98.82 99.06 90.40 79.87 99.57 114.93
2 108.44 94.12 102.05 101.11 100.23 98.92 99.03 89.96 80.33 102.21 115.63
4 107.22 92.00 97.32 97.57 102.67 98.58 97.87 88.09 82.48 101.16 114.86
IS 106.91 96.08 101.15 99.39 101.53 97.01 99.17 46.59 156.49 100.50 113.30
a) MeCN = acetonitrile; b) λex: excitation wavelength, λem: emission wavelength; c) Incubation period for deproteination of BSA (50 mg/mL) containing solutions with perchloric acid (1 M).

74 Chapter IV
4.7 References
1. Huber S, et al. Stabilities of neutral and basic esters of bendamustine in plasma compared to the parent compound: Kinetic investigations by HPLC. J Pharm Biomed Anal. 2015;104: 137-143.
2. Ozegowski W, Krebs D. Aminosäureantagonisten. III. ω-[Bis-(β-chloräthyl)-amino-benzimidazolyl-(2)]-propion- bzw. -buttersäuren als potentielle Cytostatika. J Prakt Chem. 1963;20: 178-186.
3. Ozegowski W, Krebs D. IMET 3393, -[1-methyl-5-bis-(-chloroethyl)-amino-benzimidazolyl-(2)]-butyric acid hydrochloride, a new cytostatic agent from among the series of benzimidazole mustard compounds. Zentralbl Pharm. 1971;110: 1013-1019.
4. Cheson BD, Rummel MJ. Bendamustine: rebirth of an old drug. J Clin Oncol. 2009;27: 1492-1501.
5. Kalaycio M. Bendamustine: a new look at an old drug. Cancer. 2009;115: 473-479. 6. Leoni LM. The evolving role of bendamustine in lymphoid malignancy: understanding the
drug and its mechanism of action--introduction. Semin Hematol. 2011;48 Suppl 1: S1-3. 7. Tageja N, Nagi J. Bendamustine: something old, something new. Cancer Chemother
Pharmacol. 2010;66: 413-423. 8. Hallek M. Signaling the end of chronic lymphocytic leukemia: new frontline treatment
strategies. Hematology. 2013: 138-150. 9. Knauf WU, et al. Bendamustine compared with chlorambucil in previously untreated
patients with chronic lymphocytic leukaemia: updated results of a randomized phase III trial. Br J Haematol. 2012;159: 67-77.
10. Gil L, et al. Bendamustine-based therapy as first-line treatment for non-Hodgkin lymphoma. Med Oncol. 2014;31: 944.
11. Pönisch W, et al. Bendamustine and prednisone in combination with bortezomib (BPV) in the treatment of patients with newly diagnosed/untreated multiple myeloma. J Cancer Res Clin Oncol. 2014;140: 1947-1956.
12. Pönisch W, et al. Treatment of bendamustine and prednisone in patients with newly diagnosed multiple myeloma results in superior complete response rate, prolonged time to treatment failure and improved quality of life compared to treatment with melphalan and prednisone--a randomized phase III study of the East German Study Group of Hematology and Oncology (OSHO). J Cancer Res Clin Oncol. 2006;132: 205-212.
13. Maas B, et al. Stabilität von Bendamustinhydrochlorid in Infusionslösungen. Pharmazie. 1994;49: 775-777.
14. Kasa S, et al. Stability-Indicating LC Method for the Estimation of Bendamustine Hydrochloride and its Related Impurities. J Chromatogr Sci. 2013.
15. Pencheva I, et al. HPLC study on the stability of bendamustine hydrochloride immobilized onto polyphosphoesters. J Pharm Biomed Anal. 2008;48: 1143-1150.
16. Mathrusri Annapurna M, et al. Stability-indicating high performance liquid chromatographic determination of bendamustine hydrochloride (an anti-cancer agent) as bulk drug and in pharmaceutical dosage form. Drug Invention Today. 2012;4: 629-634.
17. Xie F, et al. Simultaneous determination of bendamustine and its active metabolite, gamma-hydroxy-bendamustine in human plasma and urine using HPLC-fluorescence

References 75
detector: Application to a pharmacokinetic study in Chinese cancer patients. J Chromatogr B Analyt Technol Biomed Life Sci. 2014;960C: 98-104.
18. Dubbelman AC, et al. Development and validation of LC-MS/MS assays for the quantification of bendamustine and its metabolites in human plasma and urine. J Chromatogr B Analyt Technol Biomed Life Sci. 2012;893-894: 92-100.
19. He L, et al. Development and validation of sensitive liquid chromatography/tandem mass spectrometry method for quantification of bendamustine in mouse brain tissue. J Chromatogr B Analyt Technol Biomed Life Sci. 2012;905: 141-144.
20. Brittain JE, Franklin JC. Lyophilized bendamustine pharmaceutical compositions for treatment of autoimmune and neoplastic diseases. Patent WO2006076620A2. 2006. Referenced in: Chem Abstr 145:152740.
21. Colledge J. Solid dosage forms of bendamustine. Patent WO2010063476. 2010. Referenced in: Chem Abstr 153:70374.
22. Colledge J. Oral dosage forms of bendamustine. Patent WO2010063493. 2010. Referenced in: Chem Abstr 153:21223.
23. Labell RY, Patel PR. Oral formulations of bendamustine for cancer treatment. Patent WO2010126676. 2010. Referenced in: Chem Abstr 153:589513
24. Gust R, Krauser R. Investigations on the Stability of Bendamustin, a Cytostatic Agent of the Nitrogen Mustard Type, I. Synthesis, Isolation, and Characterization of Reference Substances. Monatsh Chem. 1997;128: 291-299.
25. Werner W, et al. [Synthesis of a potential metabolite of the carcinostatic bendamustin (Cytostasen)]. Pharmazie. 1991;46: 113-114.
26. Scutaru AM, et al. Bivalent bendamustine and melphalan derivatives as anticancer agents. Eur J Med Chem. 2011;46: 1604-1615.
27. Scutaru AM, et al. Optimization of the N-lost drugs melphalan and bendamustine: synthesis and cytotoxicity of a new set of dendrimer-drug conjugates as tumor therapeutic agents. Bioconjug Chem. 2010;21: 1728-1743.
28. Bakale RP, et al. Preparation of bendamustine esters and bendamustine amides and their use for the treatment of cancer. Patent WO2014075035A1. 2014. Referenced in: Chem Abstr 160:723974.
29. Schickaneder H, et al. Esters of bendamustine and related compounds, and medical use thereof. Patent EP2656843. 2013. Referenced in: Chem Abstr 159:691800
30. Antoni F. Synthesis and Pharmacological Characterization of Bendamustine Derivatives. Master Thesis, University of Regensburg. 2013.
31. Main AR, et al. The determination of human-serum-cholinesterase activity with o-nitrophenyl butyrate. Biochem J. 1961;78: 769-776.
32. Miller RB, Karn RC. A rapid spectrophotometric method for the determination of esterase activity. J Biochem Biophys Methods. 1980;3: 345-354.
33. Lockridge O, La Du BN. Comparison of atypical and usual human serum cholinesterase. Purification, number of active sites, substrate affinity, and turnover number. J Biol Chem. 1978;253: 361-366.
34. ICH Harmonised tripartite guideline. Validation of analytical procedures: text and methodology Q2(R1). International conference on harmonisation of technical requirements for registration of pharmaceuticals for human use; 1994. pp.

76 Chapter IV
http://www.ich.org/fileadmin/Public_Web_Site/ICH_Products/Guidelines/Quality/Q2_R1/Step4/Q2_R1__Guideline.pdf.
35. Bernstein SE. Physiological Characteristics. In: E. L. Green, editor editors. Biology of the Laboratory Mouse. New York: Dover; 1966. pp. http://www.informatics.jax.org/greenbook/frames/frame16.shtml.
36. Pagana TJ, Pagana KD. Mosby´s Manual of Diagnostic and Laboratory Tests. 4th St. Louis: Mosby Elsevier; 2010.
37. Teichert J, et al. Synthesis and characterization of some new phase II metabolites of the alkylator bendamustine and their identification in human bile, urine, and plasma from patients with cholangiocarcinoma. Drug Metab Dispos. 2005;33: 984-992.
38. Wang Y, et al. Competitive interactions of anti-carcinogens with serum albumin: a spectroscopic study of bendamustine and dexamethasone with the aid of chemometrics. Spectrochim Acta A. 2014;123: 241-248.
39. Moralev SN, Rozengart EV. Specificity of cholinesterases in reaction with substrates. Comparative enzymology of cholinesterases. La Jolla: International University Line; 2007. pp. 15-98.

5 Chapter V
Esters of bendamustine are by far more
potent cytotoxic agents than the parent
compound against human sarcoma and
carcinoma cells
Note: As stated in the list of publications, this chapter has been submitted for publication prior to
the submission of this thesis. For detailed information on the contribution of other authors see
also “Acknowledgements”.

78 Chapter V
5.1 Introduction
The alkylating agent bendamustine (1, Fig. 5.1) was synthesized in 1963 [1, 2] and developed as
an anticancer drug in the German Democratic Republic [3-5]. In the 1990s bendamustine got into
the focus of research again [6]. It is approved for the treatment of chronic lymphocytic leukemia
(CLL) [7, 8], indolent non-Hodgkin lymphoma (NHL) [9] and multiple myeloma (MM) [10, 11] or as
second line therapy of refractory diseases [12-14] in various countries. Current clinical trials
suggest beneficial effects in the treatment of solid cancer types such as breast cancer [15] or
small-cell lung cancer [16]. Most treatment regimens include bendamustine in combination with
other anticancer drugs including biologicals [17-20], for instance rituximab [17, 19, 20]. It has
been hypothesized that, apart from the alkylating nitrogen mustard group (N-Lost), the
benzimidazole scaffold may contribute to the antitumor activity for instance, due to
antimetabolite properties, by facilitating nuclear transport or inhibiting DNA repair [6]. Besides
the alkylation of DNA, causing strand breaks, bendamustine induces the expression of p53 [21],
triggers apoptosis [22] and down-regulates mitotic checkpoints, leading to mitotic catastrophe
[23, 24]. Recent patent applications aimed at formulations for oral administration [25-27]. Alkyl
(C1 – C24) esters of bendamustine were reported as potential prodrugs for intravenous application
[28], and biodegradable polyphosphoesters were described as an approach to stabilize
bendamustine in solution [29]. Another approach aimed at increasing the cytotoxicity by
constructing dimeric and dendrimeric bendamustine derivatives [30].
Figure 5.1: Structures of bendamustine (1) and the bendamustine esters 2-7.

Introduction 79
Exploring the properties of derivatives of bendamustine (1), esters of bendamustine (2-7, Fig. 5.1)
[31] comprising basic moieties (4-7) were prepared as potential prodrugs with higher solubility
compared to simple esters such as compounds 2 and 3, which were mainly prepared as synthetic
intermediates [32, 33]. Very recently, we reported on the stability of the nitrogen mustard and
the ester moieties in compounds 2-7 against hydrolysis and enzymatic cleavage in buffer, in the
presence of porcine butyrylcholine esterase as well as in human and murine plasma [34]. The
moderately basic morpholinoethyl ester (4) proved to be of particular interest with respect to
both solubility and stability [34]. Preliminary data suggested considerably increased cytotoxicity
of the esters compared to the parent compound 1, the basic compounds being of particular
interest [31]. Based on the assumption that higher antiproliferative activity may result from
increased cellular accumulation, additional mechanisms of action or both, we compared
compounds 2-7 with bendamustine (1) regarding cytotoxicity against a panel of human sarcoma
and carcinoma cell types, representing hematologic and solid malignancies. Additionally, the
induction of p53 expression and apoptosis, cellular enrichment and the involvement of the
organic cation transporters OCT1 and OCT3 were investigated.

80 Chapter V
5.2 Material and Methods
5.2.1 Ethics Statement
Human embryonal kidney (HEK293) cells were purchased from the German Collection of
Microorganism and Cell Cultures (DSMZ, Braunschweig, Germany). Cancer cell lines were
obtained from the American Type Culture Collection (ATCC; Rockville, MD, USA): SK-MEL-3
(malignant melanoma; HTB-69), Capan-1 (pancreatic adenocarcinoma; HTB-79), HT-29 (colorectal
adenocarcinoma; HTB-38), SK-ES-1 (Ewing´s sarcoma; HTB-86), HEL92.1.7 (erythroleukemia; TIB-
180), Jurkat (acute T-cell leukemia; TIB-152), U-937 (histiocytic lymphoma; CRL-1593.2), LNCaP
(prostate cancer; CRL-1740) and NCI-H460 (large cell lung cancer; HTB-177), and MG-63
(osteosarcoma; CRL-1427) cells.
5.2.2 Chemicals and reagents
Bendamustine hydrochloride (1) and the esters 2-7 were kindly provided by Arevipharma
(Radebeul, Germany). Stock and working solutions of 1-7 were prepared in dimethylsulfoxide
(DMSO). Thiazolyl blue tetrazolium bromide (MTT), umbelliferone, 4-[4-(dimethylamino)styryl]-
N-methylpyridinium iodide (ASP+), penicillin-streptomycin and tetrapentyl ammonium (TPA) were
from Sigma (Taufkirchen, Germany). Hygromycin B was from A.G. Scientific, (San Diego, CA, USA).
Fetal calf serum (FCS) was from Biochrom (Berlin, Germany). A 1 mM stock solution of TPA was
prepared in phosphate buffered saline (PBS). The 100 µM stock solution of ASP+ was prepared in
PBS containing 10 % DMSO. HPLC-grade acetonitrile was from Fisher Scientific (Schwerte,
Germany). Demineralized water was prepared with a Milli-Q system (Merck; Schwalbach,
Germany). If not otherwise stated, all other reagents were of analytical grade and purchased from
Sigma (Taufkirchen, Germany).
5.2.3 Cell culture
Cancer cells: All media were from Sigma (Taufkirchen, Germany) and supplemented with 10 %
FCS. SK-MEL-3, Capan-1, HT-29 and SK-ES-1 cells were cultured in McCoy´s 5A medium,
supplemented with 2.2 g/L NaHCO3 (Merck, Darmstadt, Germany). HEL92.1.7, Jurkat, U-937,
LNCaP and NCI-H460 were cultured in RPMI-1640 containing 110 mg/L sodium pyruvate, 10 mM
HEPES (both from Serva, Heidelberg, Germany) and 2.0 g/L NaHCO3. MG-63 cells were cultured
in EMEM supplemented with 2.2 g/L NaHCO3. Genetically modified HEK293 cells: Transfected
human embryonic kidney cells (HEK293) were cultured in EMEM, supplemented with
penicillin/streptomycin (100 U/mL / 100 µg/mL) and 250 µg/mL hygromycin B. The cells were
cultured in a water-saturated atmosphere with 5 % CO2 at 37 °C and passaged once to twice a

Material and Methods 81
week. Adherently growing cells were treated with trypsin/EDTA (0.5 mg/mL / 0.22 mg/mL) (PAA,
Pasching, Austria) and washed with medium prior to transfer into new culture flasks. Cells
growing in suspension were passaged after mechanical separation of cell agglomerates.
5.2.3.1 HEK293 cells expressing the human organic cation transporters OCT1 or OCT3
Parental HEK293 cells were transfected with the plasmid pcDNA3.1/Hygro(-)-OCT1, containing
the full length SLC22A1 cDNA (NM_003057) encoding the human OCT1 protein, as described [35].
After hygromycin selection, single colonies were characterized for SLC22A1 mRNA expression by
real-time qRT-PCR, and the cell clone with the highest expression was further analyzed with
respect to protein expression and [3H]-1-methyl-4-phenylpyridinium ([3H]MPP+) uptake (cf.
Supporting Information). HEK-Co cells (control) were established by the same method using the
empty plasmid pcDNA3.1/Hy(-) for transfection [36] (characterization of HEK-OCT1 and HEK-Co
cells cf. Supporting Information Fig. S5.1). HEK-OCT3 cells were recently described [37]. HEK-Co,
HEK-OCT1 and HEK-OCT3 cells were provided by Prof. Dr. Jörg König.
5.2.4 Chemosensitivity assays
Depending on the characteristics of the cells, two different assays were performed. For
adherently growing cells (HT-29, NCI-H460, SK-MEL-3, MG-63, Capan-1), cytotoxic and cytocidal
effects were determined in the crystal violet assay [38], whereas for loosely adherent cells
(LNCaP, SK-ES-1) and cells growing in suspension (HEL 92.1.7, Jurkat, U-937) the MTT-assay [39]
was used with minor modifications [38]. In brief, 1.5 · 103 (HT-29, NCI-H460, SK-MEL-3, MG-63,
Capan-1) or 5 · 103 (Jurkat, U-937, HEL92.1.7, LNCaP, SK-ES-1) cells per well were seeded into flat-
bottom 96-well plates (Sarstedt, Nümbrecht, Germany). All compounds were used as solutions
prepared in DMSO (final concentration of DMSO in the assays: 0.1 %) and tested at final
concentrations (8 replicates per concentration) of 1, 3, 10, 30 and 50 µM. Absorbance was
measured at 580 nm in a 96-well plate reader (GENios pro microplate reader, Tecan, Salzburg,
Austria). Effects were quantified as previously described [40] for both assays.
In addition to long-term exposure, IC50 values were determined after an incubation period of 96
hours, following the same procedure as described above (4 instead of 8 replicates). As suggested
by the National Cancer Institute [41] the corrected T/C values (T/Ccorr) were plotted against the
logarithm of the concentrations, and the IC50 values were calculated using Prism 5.01 (GraphPad
Software, La Jolla, CA, USA) according to the “log (inhibitor) vs. normalized response-variable
slope” equation.

82 Chapter V
5.2.5 Detection of apoptosis (annexin V/propidium iodide assay)
Apoptosis was determined by incubating progrediently growing Jurkat cells with medium
containing 1, 2, 4 or 5 at a concentration of 10 µM or 0.1 % of DMSO (untreated control). After
different periods of incubation (6, 24, 48 hours), samples were analyzed using the Annexin V-FITC
apoptosis detection kit l (BD Biosciences, Heidelberg, Germany) according to the manufacturer’s
protocol using 106 cells/mL. Cells were analyzed using a FACSCalibur flow cytometer
(BD Biosciences, Heidelberg, Germany). The compensation was performed for each experiment
with annexin V-FITC (530/30 BP filter) and propidium iodide (585/42 BP filter), respectively. At
least 1 · 104 events were registered per sample and debris as well as cell aggregates were excluded
by forward (FSC) versus side scatter (SSC) gates. Raw data were analyzed using FlowJo V10
software (Treestar Inc., Ashland, OR, USA).
5.2.6 Detection of p53 expression by immunoblotting
The expression of the tumor suppressor p53 by NCI-H460 and HT-29 cells was determined after
incubating the cells with compounds 1, 2, 4 and 5 at different concentrations for 24 hours. The
cells (from a 10-cm culture dish, 70 % confluency) were washed twice with PBS and harvested by
scraping after addition of ice-cold buffer A (10 mM HEPES pH = 7.9, 10 mM KCl, 0.1 mM EDTA,
0.1 mM EGTA, protease inhibitor mix (Sigma-Aldrich)). After adding Nonidet P-40 (NP-40) (Sigma,
Taufkirchen, Germany) to a final concentration of 1 %, the cell suspensions were vortexed and
subsequently centrifuged at 13000 g and 4 °C for 30 seconds. The pellets were re-suspended in
buffer B (buffer A + 400 mM NaCl, 1% NP-40) and gently agitated using a Sarmix M2000 (Sarstedt,
Nümbrecht, Germany) at 4 °C for 15 min, followed by centrifugation (13000 g, 4 °C, 5 min;
Microfuge; Eppendorf, Hamburg, Germany). The concentration of soluble protein was
determined according to Bradford using the Bio-Rad Protein Assay (Bio-Rad Laboratories, Munich,
Germany). An amount of 30 µg total protein of each sample and 8 µL of a biotinylated molecular
weight standard (1:6 dilution) (Cell Signaling, Danvers, MA, USA) was separated by SDS-PAGE
(12 % gel) and afterwards electroblotted (150 V, 30 min) to nitrocellulose membrane (Peqlab,
Erlangen, Germany). The blot was incubated with anti-p53 rabbit mAb (dilution 1:1000) (Cell
Signaling) and anti-histone H2B Ab (dilution 1:1000) (Cell Signaling) as loading control. The
primary antibodies and the “protein ladder” were simultaneously detected with a horseradish
peroxidase (HRP)-coupled donkey anti rabbit mAb (dilution 1:1000) (Santa Cruz biotechnology,
Heidelberg, Germany) or the anti-biotin HRP-coupled antibody (dilution 1:5000) (Cell Signaling),
respectively. The bands were detected by bioluminescence using the Pierce ECL Western Blotting
Substrate (Thermo Scientific, Dreieich, Germany). After exposure, the x-ray film (Amersham
Hyperfilm™ ECL, GE Healthcare, München, Germany) was developed (CAWOMAT 2000 IR, CAWO,

Material and Methods 83
Schrobenhausen, Germany) and analyzed using a GS-710 imaging densitometer and Quantity One
V. 4 software (Bio-Rad Laboratories, Munich, Germany).
5.2.7 Quantification of cell-associated bendamustine and derivatives
Accumulation of bendamustine and selected bendamustine esters by HT-29 and NCI-H460 cells
was determined by HPLC. For this purpose, 1.5 · 106 cells/well were seeded into 6-well plates
(Sarstedt, Nümbrecht, Germany). After two days of cultivation, the cells were incubated in PBS
containing 30 µM of 1, 2, 4 or 5 and 200 µM of umbelliferone as internal standard at 37 °C for
10 minutes. After removing the medium, the cells were washed three times with PBS. Untreated
cells were detached with trypsin/EDTA and counted. The treated cells were harvested by adding
200 µL of ice-cold perchloric acid (1 M) and scraping. Subsequently, the samples were vortexed
and sonicated (Branson 3200 ultrasonic cleaner; Branson, Danbury, USA) for 10 minutes. After
5 minutes of centrifugation (13000 g, 4 °C), the supernatants were filtered (0.2 µm Phenex;
Phenomenex, Aschaffenburg, Germany) and directly analyzed by HPLC with fluorescence
detection according to a recently reported validated procedure [34]. The normalization of the
measured concentration to the cell count allowed for a calculation of the cell-associated amount
of the respective test compound. Additionally, the ratio of cell-associated substance compared to
the applied concentration (30 µM) was calculated based on an average cell volume of 3 pL.
5.2.8 Flow cytometric determination of OCT1 and OCT3 activity
The previously described fluorescent substrate of organic cation transporters, 4-(4-
dimethylaminostyryl)-N-methylpyridinium (ASP+) [42-45], was used to determine the function of
OCT1 and OCT3 by flow cytometry in the absence and the presence of bendamustine and selected
bendamustine esters. HEK293 cells expressing the transporter of interest were trypsinized and
washed twice with PBS, prior to re-suspension of 0.5 · 106 cells in 500 µL of PBS containing
2 % (v/v) FCS. The cells were incubated with ASP+ (100 µM stock solution in PBS containing 10 %
DMSO) for 5 minutes, allowing for cellular accumulation, and subsequently analyzed with a
FACSCalibur flow cytometer. ASP+ was excited at 488 nm and the fluorescence was measured
using a 530/30 nm and a 585/42 band-pass filter. At least 1 · 104 single cells were analyzed by
appropriate FSC/SSC gating.
For the determination of Km, cell suspensions of HEK-OCT1 and HEK-OCT3 cells as well as HEK-Co
cells as control for unspecific uptake of ASP+ were incubated with ASP+ at increasing
concentrations at 37 °C for 5 minutes. Subsequently, two volumes of an ice-cold 200 µM solution
of the standard inhibitor tetrapentyl ammonium (TPA) [46-48] in PBS/FCS were added to one
volume of cell suspension. The mixture was immediately analyzed. The mean fluorescence

84 Chapter V
intensities (MFI) were calculated using FlowJo V10, and the difference between total (HEK-OCT1
or HEK-OCT3 cells) and unspecific (HEK-Co cells) uptake was plotted as specific uptake against the
concentration of ASP+. The linearity of ASP+ uptake (1 µM) at 37 °C was assessed between
30 seconds and 7 (HEK-OCT1) respectively 9 (HEK-OCT3) minutes. Km was calculated (GraphPad
Prism 5.01) using the Michaelis-Menten equation.
The inhibition of ASP+ uptake was measured to determine the IC50 values of TPA and compounds
1, 2, 4 and 5. The cells were pre-incubated with the respective test compound at different
concentrations at room temperature for 10 minutes. Afterwards, ASP+ was added to a final
concentration of 1 µM, and the samples were incubated at 37 °C in the dark for 5 minutes.
Subsequently, the cells were washed, re-suspended in ice-cold PBS/FCS and stored on ice in the
dark until measurement. The normalized mean fluorescence intensities of the OCT expressing
cells, set to 100 % in the absence of an inhibitor, were calculated by subtracting the mean
fluorescence intensity of unspecific ASP+ uptake into HEK-Co control cells. The normalized
fluorescence intensities in the presence of an inhibitor were plotted against the logarithm of the
concentrations of the test compounds to calculate IC50 values. The “log (inhibitor) vs. normalized
response-variable slope” equation of GraphPad Prism 5.01 was used for this purpose.
5.2.9 Imaging of cellular ASP+ uptake by confocal laser scanning microscopy
HEK-Co, HEK-OCT1 and HEK-OCT3 cells were seeded into 8-well µ-Slides (Ibidi, Munich, Germany)
(2 · 104 cells/well) and allowed to attach for 48 hours. Prior to the staining procedure, the medium
was replaced by PBS and the DNA probe Draq5 (5 µM) (Biostatus, Shepshed, UK) was added to
each well. To monitor the inhibition of ASP+ uptake, 200 µM of TPA or 15 µM of compound 5,
respectively, were added and incubated at 37 °C for 5 minutes. Subsequently, ASP+ was added to
reach a concentration of 1 µM, and the cells were incubated for 5 minutes in the dark. Imaging
was performed with an Axiovert 200 M confocal microscope coupled to a Zeiss LSM 510 scanning
device (Carl Zeiss, Oberkochen, Germany) using a Plan-Apochromat 63x/1.40 oil immersion
objective. Draq5 was excited at 633 nm and fluorescence was detected using a 650 nm long-pass
filter, ASP+ was excited at 488 nm and detected using a 565/35 nm band-pass filter.
5.2.10 Determination of OCT1 and OCT3 expression by various cancer cells
The expression of SLC22A1 and SLC22A3 mRNA in different cancer cell types was analyzed by
quantitative RT-PCR using the Roche LightCycler system. Total RNA was isolated using the
NucleoSpin RNA Purification Kit (Macherey-Nagel, Dueren, Germany) according to the
manufacturer’s instructions. One µg of total RNA was reversely transcribed using the iScript Kit
(Biorad, Munich, Germany) according to the manufacturer´s instructions. SLC22A1, SLC22A3 and

Material and Methods 85
-actin mRNA levels were determined using the LightCycler System and the FastStart DNA Master
SYBR Green I Kit (both from Roche, Mannheim, Germany). The primer pair for the amplification
of the SLC22A1 cDNA fragment was oOCT1-RT.for (CTGCCTGGTGAATGCTGAGC) and oOCT1-
RT.rev (ACATCTCTCTCAGGTGCCCG), for the SLC22A3 cDNA fragment oOCT3-RT.for
(CAAGCAATATAGTGGCAGGGG) and oOCT3-RT.rev (CCTCAAAGGTGAGAGCGGGA) and for the -
actin fragment oActin.for (TGACGGGGTCACCACACACTGTGTGCCCATCTA) and oActin.rev
(CTAGAAGCATTTGCGGTGGACGATGGAGGG). PCR was performed according to the
manufacturer´s instructions with 0.5 µM of the respective sense and antisense primers, 4 mM
MgCl2 and 1-fold FastStart DNA Master SYBR green I mix in a total volume of 20 µL including 1 µL
of the synthesized sscDNA. Cycling conditions were as follows: 10 min denaturation at 94 °C,
followed by 45 cycles of 10 s denaturation at 94 °C, 15 s primer annealing at 64 °C and 30 s of
elongation at 72 °C. The amount of -actin, SLC22A1 and SLC22A3 cDNAs were determined using
a serial plasmid dilution (pOCT1.31; from 106 to 104 fg) as amplification standard. The -actin
concentration, calculated in relation to the standard curve, was set to 100 % and the respective
SLC22A1 and SLC22A3 mRNA values are given as a percentage of -actin amplification.
5.2.11 Western blot analysis of hOCT1 expression
HEK-Co and HEK-OCT1 cells were lysed with 0.2% ice-cold SDS containing protease inhibitor
mixture (Mini-complete protease inhibitor cocktail tablets; Roche Diagnostics-Applied Science,
Mannheim, Germany). Protein concentration of each lysate was measured with a bicinchoninic
acid assay (BCA protein assay kit, Thermo Fisher Scientific, Waltham, MA, USA). 20 µg of cell
lysates were subjected to a 10% SDS-polyacrylamide gel electrophoresis under reducing
conditions. Separated proteins were transferred onto nitrocellulose membranes (Protran
nitrocellulose transfer membrane; Whatman, Dassel, Germany). Blots were probed with the KEN
antiserum (1:10000) directed against human OCT1 [49] overnight at 4 °C. Membranes were then
incubated with a horseradish peroxidase-conjugated goat-anti-rabbit secondary antibody
(1:10 000; Sigma Aldrich, Munich, Germany). Immunoreactive bands were visualized using an ECL
western blotting detection reagent (GE Healthcare, Buckinghamshire, UK) and a Chemidoc XRS
imaging system (Bio-Rad, Munich, Germany). To control sample loading, membranes were
incubated for 30 min with restore western blot stripping buffer (Pierce, Rockford, USA) at 37 °C
and reprobed with a mouse monoclonal anti-human β-actin antibody (1:10000; Sigma Aldrich,
Munich, Germany). A horseradish peroxidase-conjugated goat-anti-mouse antibody
(GE Healthcare Europe, Freiburg, Germany) was used as secondary antibody (dilution 1:4000).

86 Chapter V
5.2.12 Immunofluorescence detection of hOCT1 expression
The cellular localization of the OCT1 protein in the stably transfected HEK-OCT1 cells was analyzed
by immunofluorescent staining. The OCT1-specific KEN antiserum was used at a dilution of
1:1000. Subsequently, cells were incubated with an Alexa Fluor 488 conjugated goat-anti-rabbit
secondary antibody (1:10,000; Invitrogen, Carlsbad, CA).
5.2.13 [3H]MPP+ transport assay
HEK-OCT1 and HEK-Co cells were seeded in poly-D-lysine (Sigma Aldrich, Taufkirchen, Germany)
coated 48-well plates at a density of 1.2 · 105 cells/well. After incubation at 37 °C and 5% CO2 for
48 h medium was replaced by warm (37 °C) uptake buffer (142 mM NaCl, 5 mM KCl, 1 mM K2HPO4,
1.2 mM MgSO4, 1.5 mM CaCl2, 5 mM glucose and 12.5 mM HEPES, pH 7.3). The uptake assay was
started by addition of [3H]MPP+ (80 Ci/mmol, American Radiolabeled Chemicals, St Louis, MO) at
indicated concentrations (concentration dependency) or at a concentration of 50 µM (time
dependency). Cells were incubated at 37 °C for 3 min (concentration dependency) or at indicated
time points (time dependency). Uptake was stopped by washing the cells three times with ice-
cold uptake buffer. Afterwards, cells were lysed with 5 mM Tris buffer (pH 7.3) containing 0.1%
Triton X-100. The intracellular accumulation of radioactivity was determined by liquid scintillation
counting (PerkinElmer, Rodgau-Jügesheim, Germany) and protein concentration of each lysate
was measured with the BCA assay. We performed two experiments each on two different days (n
= 4). The OCT1-mediated net uptake of [3H]MPP+ was determined as the difference in substrate
uptake between HEK-OCT1 and HEK-Co cells. Data were presented as means ± standard error of
the mean. A value of p < 0.05 was considered statistically significant.
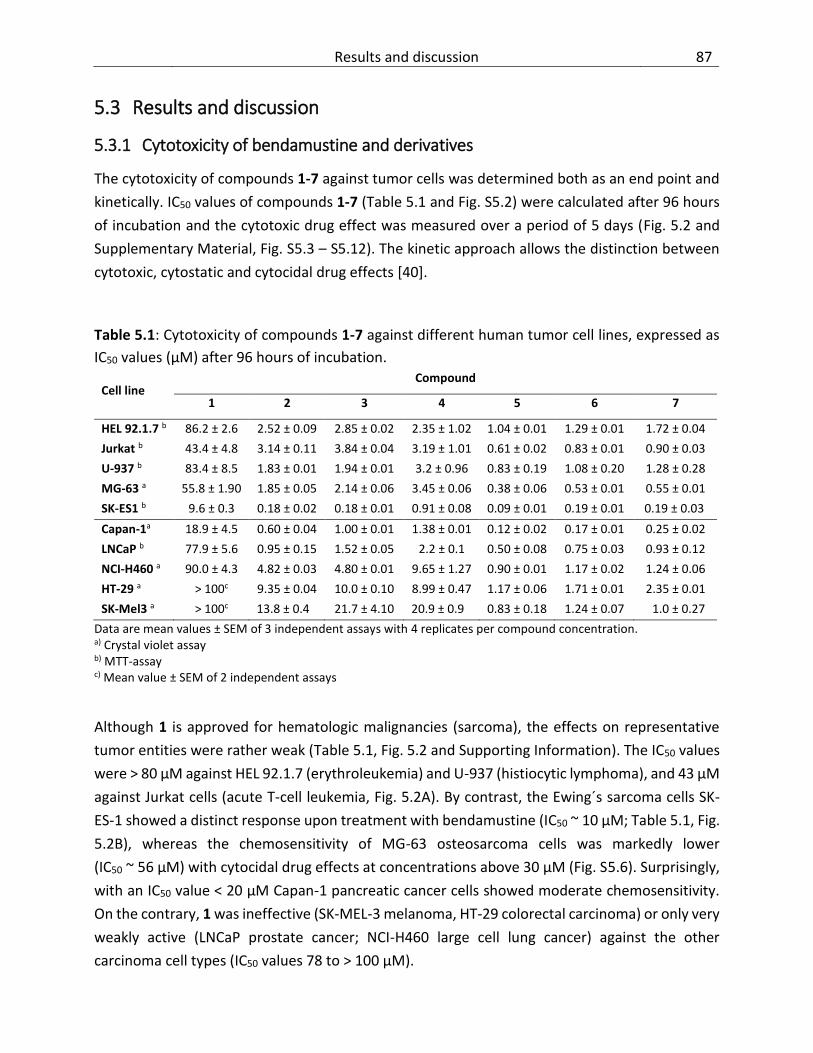
Results and discussion 87
5.3 Results and discussion
5.3.1 Cytotoxicity of bendamustine and derivatives
The cytotoxicity of compounds 1-7 against tumor cells was determined both as an end point and
kinetically. IC50 values of compounds 1-7 (Table 5.1 and Fig. S5.2) were calculated after 96 hours
of incubation and the cytotoxic drug effect was measured over a period of 5 days (Fig. 5.2 and
Supplementary Material, Fig. S5.3 – S5.12). The kinetic approach allows the distinction between
cytotoxic, cytostatic and cytocidal drug effects [40].
Table 5.1: Cytotoxicity of compounds 1-7 against different human tumor cell lines, expressed as
IC50 values (µM) after 96 hours of incubation.
Cell line Compound
1 2 3 4 5 6 7
HEL 92.1.7 b 86.2 ± 2.6 2.52 ± 0.09 2.85 ± 0.02 2.35 ± 1.02 1.04 ± 0.01 1.29 ± 0.01 1.72 ± 0.04
Jurkat b 43.4 ± 4.8 3.14 ± 0.11 3.84 ± 0.04 3.19 ± 1.01 0.61 ± 0.02 0.83 ± 0.01 0.90 ± 0.03
U-937 b 83.4 ± 8.5 1.83 ± 0.01 1.94 ± 0.01 3.2 ± 0.96 0.83 ± 0.19 1.08 ± 0.20 1.28 ± 0.28
MG-63 a 55.8 ± 1.90 1.85 ± 0.05 2.14 ± 0.06 3.45 ± 0.06 0.38 ± 0.06 0.53 ± 0.01 0.55 ± 0.01
SK-ES1 b 9.6 ± 0.3 0.18 ± 0.02 0.18 ± 0.01 0.91 ± 0.08 0.09 ± 0.01 0.19 ± 0.01 0.19 ± 0.03
Capan-1a 18.9 ± 4.5 0.60 ± 0.04 1.00 ± 0.01 1.38 ± 0.01 0.12 ± 0.02 0.17 ± 0.01 0.25 ± 0.02
LNCaP b 77.9 ± 5.6 0.95 ± 0.15 1.52 ± 0.05 2.2 ± 0.1 0.50 ± 0.08 0.75 ± 0.03 0.93 ± 0.12
NCI-H460 a 90.0 ± 4.3 4.82 ± 0.03 4.80 ± 0.01 9.65 ± 1.27 0.90 ± 0.01 1.17 ± 0.02 1.24 ± 0.06
HT-29 a > 100c 9.35 ± 0.04 10.0 ± 0.10 8.99 ± 0.47 1.17 ± 0.06 1.71 ± 0.01 2.35 ± 0.01
SK-Mel3 a > 100c 13.8 ± 0.4 21.7 ± 4.10 20.9 ± 0.9 0.83 ± 0.18 1.24 ± 0.07 1.0 ± 0.27
Data are mean values ± SEM of 3 independent assays with 4 replicates per compound concentration. a) Crystal violet assay b) MTT-assay c) Mean value ± SEM of 2 independent assays
Although 1 is approved for hematologic malignancies (sarcoma), the effects on representative
tumor entities were rather weak (Table 5.1, Fig. 5.2 and Supporting Information). The IC50 values
were > 80 µM against HEL 92.1.7 (erythroleukemia) and U-937 (histiocytic lymphoma), and 43 µM
against Jurkat cells (acute T-cell leukemia, Fig. 5.2A). By contrast, the Ewing´s sarcoma cells SK-
ES-1 showed a distinct response upon treatment with bendamustine (IC50 ~ 10 µM; Table 5.1, Fig.
5.2B), whereas the chemosensitivity of MG-63 osteosarcoma cells was markedly lower
(IC50 ~ 56 µM) with cytocidal drug effects at concentrations above 30 µM (Fig. S5.6). Surprisingly,
with an IC50 value < 20 µM Capan-1 pancreatic cancer cells showed moderate chemosensitivity.
On the contrary, 1 was ineffective (SK-MEL-3 melanoma, HT-29 colorectal carcinoma) or only very
weakly active (LNCaP prostate cancer; NCI-H460 large cell lung cancer) against the other
carcinoma cell types (IC50 values 78 to > 100 µM).
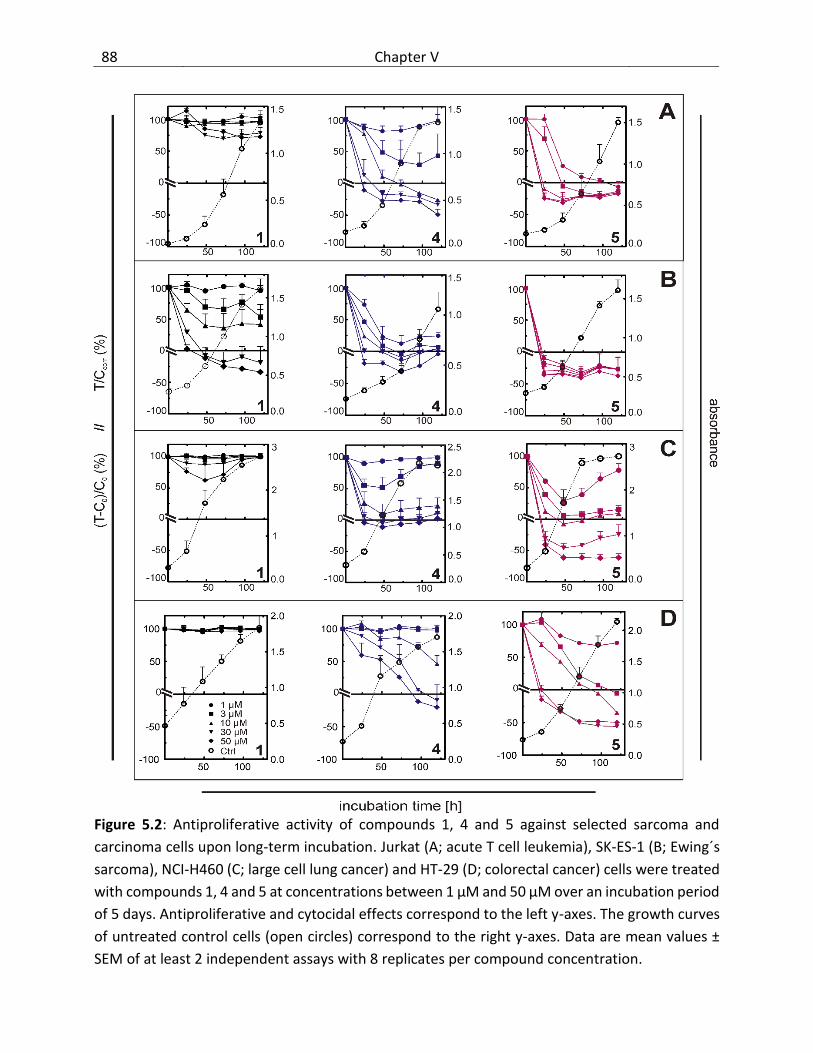
88 Chapter V
Figure 5.2: Antiproliferative activity of compounds 1, 4 and 5 against selected sarcoma and
carcinoma cells upon long-term incubation. Jurkat (A; acute T cell leukemia), SK-ES-1 (B; Ewing´s
sarcoma), NCI-H460 (C; large cell lung cancer) and HT-29 (D; colorectal cancer) cells were treated
with compounds 1, 4 and 5 at concentrations between 1 µM and 50 µM over an incubation period
of 5 days. Antiproliferative and cytocidal effects correspond to the left y-axes. The growth curves
of untreated control cells (open circles) correspond to the right y-axes. Data are mean values ±
SEM of at least 2 independent assays with 8 replicates per compound concentration.

Results and discussion 89
In contrast to the parent compound bendamustine, the derivatives 2-7 exhibited considerably
higher potencies up to factors > 100 both, against the sarcoma and the carcinoma cells
investigated. With respect to the cytotoxic effects, compounds 2-7 fall into two groups: the alkyl
esters (2, 3) and the mofetil ester 4 on one hand, and the basic heterocyclic esters 5-7 on the
other hand. Compared to bendamustine, compounds 2-4 showed a 10- to 30-fold increase in
potency, and 5-7 were 60- to 120-fold more potent than 1.
Compounds 2-4: Among compounds 2-4, minor differences were observed at SK-ES-1 and
NCIH460 cells (Table 5.1) with a more pronounced effect of the alkyl esters 2 and 3 against
SKES1 cells (IC50 values: 2 and 3: ~ 0.2 µM, 4: 0.9 µM). The increase in toxicity compared to 1
was most striking at HEL92.1.7, LNCaP, MG-63 and, in case of the alkyl esters 2 and 3, at SK-ES-1
cells. Comparable IC50 values of 2-4 were confirmed by the cytotoxic drug effects over a period of
5 days (Fig. S5.3-S5.12). Compounds 2-4 revealed cytocidal effects at all investigated cancer cell
types at concentrations of 30 and 50 µM, except for SK-MEL-3, HT-29 and NCI-H460.
Compounds 5-7: Except for the hematologic malignancies (HEL92.1.7, Jurkat, U-937), SK-ES-1 and
LNCaP cells, compounds 5-7 exhibited a distinct increase in cytotoxicity compared to 2-4, showing
IC50 values in low micro- to nanomolar range and cytocidal effects at concentrations as low as
110 µM at all treated cancer cells. The antiproliferative activity of compounds 5-7 was
comparable both, in the end-point (cf. Table 5.1) and in the kinetic assays over a period of 5 days
(Supporting Information, Fig. S5.3 – S5.12). Remarkably, compared to 1, compounds 5-7 were up
to > 100 times more potent against tumor cells such as SK-MEL3, NCI-H460, HT-29 and MG-63,
which were refractory against treatment with bendamustine.
Data on the in vitro cytotoxicity of bendamustine are scarce. In the literature, for myeloma cells
IC50 values around 100 µM or even higher are reported [22, 23]. A very recent study on several
hematologic malignancies revealed IC50 values between approximately 10 µM and 250 µM.
Especially mantle cell lymphoma, Burkitt’s lymphoma and T-cell acute lymphoblastic leukemia
derived cell lines were relatively sensitive to bendamustine treatment [50]. The IC50 value
(approximately 50 µM) reported by Hiraoka et al. [50] for Jurkat cells is in good agreement with
our data. Published plasma levels of 1 after intravenous administration (Cmax = 6 µg/mL (≈ 17 µM)
[51]; Cmax = 11 µg/mL (≈ 31 µM) [52]) suggest that the chemotherapy with bendamustine must be
considered ineffective in case of tumor entities showing IC50 values in the two- to three-digit
micromolar range in vitro. In this context the up to 100-fold antiproliferative activity of the
bendamustine esters, in particular 5-7, suggest both, higher efficacy in case of malignancies for
which the parent compound is approved and a possible extension of the scope of indications.

90 Chapter V
5.3.2 Induction of apoptosis and p53 expression by compounds 1, 2, 4 and 5
Bendamustine was reported to trigger apoptosis [22]. In search for an explanation of the higher
antiproliferative activity of the bendamustine esters compared to the parent compound, we
determined early and late stage of apoptosis by flow cytometry (annexin V/propidium iodide
staining) after treatment of Jurkat cells with 10 µM of compounds 1, 2, 4 or 5 for 6, 24 and 48
hours (Fig. 5.3; Fig. S5.13). As becomes obvious from Fig. 5.3, annexin V+/PI+cells, defined as late
apoptotic/necrotic cells, amounted to approximately 10 % of the total cell population, most
probably resulting from sample preparation. As expected from the results of the MTT assay, at a
concentration of 10 µM, bendamustine had no effect compared to the control cells, regardless of
the period of incubation. After 6 hours, the fraction of early apoptotic cells was less than 1 %
except for compound 5 (~2.5 %; cf. Supporting Information, Fig. S5.13). Compounds 2 and 4
showed induction of apoptosis in around 10 % of the cells after 24 hours of incubation. After 48
hours of incubation, 15 % of the cells were in an early apoptotic state and a considerable fraction
(20-25 %) was late-apoptotic/necrotic cells. In agreement with the results from the
chemosensitivity assays, compound 5 was more potent, exhibiting a more rapid onset of action
and a higher maximal response compared to 1, 2 and 4 regarding induction of apoptosis.
Approximately 50 % of the cells were either early apoptotic (20 %) or late apoptotic/necrotic (30
%) after 24 hours. Two days after treatment, only around 15 % of the cells were viable, whereas
the majority of the cells was late apoptotic (30 %) or necrotic (40 %).
Figure 5.3: Induction of apoptosis in Jurkat cells. Results of annexin V/propidium iodide staining, performed after incubating Jurkat cells with compounds 1, 2, 4 and 5 at a concentration of 10 µM for different periods. Annexin V+/PI- cells were defined as early apoptotic, whereas late apoptotic/necrotic cells were annexin V+/PI+. Significances illustrated on top of the columns refer to the overall effect (apoptotic + necrotic cells), those depicted in the columns refer to apoptotic cells. After 48 hours, apoptotic and necrotic cells were significantly different (p < 0.001) (mean ± SEM, N = 3). One-way ANOVA and Bonferroni’s post-test were applied to calculate the significance of the apoptotic fraction and the sum of apoptotic and necrotic cells; n.s.: not significant; *: p < 0.05; **: p < 0.01, ***: p < 0.001.

Results and discussion 91
Bendamustine was reported to induce the expression of p53 [21, 23, 50]. As the derivatives of 1
were much more potent against large cell lung and colorectal cancer cells, we investigated the
induction of p53 expression in NCI-H460 and HT-29 cells after 24 hours of incubation with
compounds 1, 2, 4 and 5 (Fig. 5.4).
Figure 5.4: Effect of 1, 2, 4 and 5 on the expression of p53 in NCI-H460 and HT-29 cells. Western blot of p53 and histone H2B (loading control) of NCI-H460 (A) and HT-29 (B) cells. A: Nuclear extracts of NCI-H460 cells, incubated with different concentrations of 1 (10, 30 and 100 µM) or 10 µM of 2, 4, or 5 for 24 hours. Nuclear extracts (NE) and whole cell lysates (WCE) of untreated cells were used as control (Ctrl). B: Nuclear extracts of HT-29 cells, incubated with 10 µM of 1, 2, 4, 5 for 24 hours. Untreated cells served as control (Ctrl).
Especially in NCI-H460 cells, p53 expression was significantly induced by the treatment with 10
µM of compounds 2, 4 and 5, while 5 led to the most pronounced effect. Bendamustine also
weakly induced the expression of p53, although at a tenfold higher concentration (100 µM).
Interestingly, p53 was only detectable in nuclear extracts of NCI-H460 cells after treatment,
whereas HT-29 cells exhibited a high constitutive expression of the tumor suppressor protein.
Nevertheless, the treatment with compounds 1, 2, 4 and 5 increased the expression of p53 in HT-
29 cells but, similar to NCI-H460 cells, compounds 2, 4 and 5 caused a higher expression level than
1. Another notable observation was a slight induction of p53 expression in HT-29 cells after
treatment with 10 µM of 1, since proliferation assays revealed no toxic effect at this
concentration. It is known from the literature that concentrations of ≥ 80 µM of bendamustine
are required to produce a significant induction of p53 expression in various tumor cell types [22].
Both, the induction of p53 and apoptosis, correlated with the cytotoxic potency of bendamustine
and derivatives.
5.3.3 Cellular accumulation of bendamustine and derivatives
Higher cellular uptake of the neutral (2, 3) and basic (4-7) bendamustine esters compared to the
parent compound could account for the increased potency in terms of antiproliferative activity,

92 Chapter V
induction of apoptosis and p53 expression. Therefore, we performed HPLC analyses to determine
the amount of cell-associated test compounds 1, 2, 4 and 5 at a concentration of 30 µM after
10 minutes of incubation. NCI-H460 and HT-29 cells were selected as examples of solid tumors,
which surprisingly proved to be sensitive against bendamustine esters (Fig. 5.5). The recently
reported validated HPLC method was applied [34]. To prevent hydrolysis of the nitrogen mustard
group during sample preparation and analysis, cell lysis and deproteination were performed
under acidic conditions (1 M perchloric acid, sonication). The esters were proven to be stable over
the incubation period of 10 minutes in the presence of cells (Supporting Information; Fig. S5.14).
The cellular association of the internal standard umbelliferone did not significantly differ between
both cell lines (p > 0.05). The amounts of cell-associated bendamustine (1) were extremely low
(HT-29: 0.07 ± 0.011 nmol/106 cells; NCI-H460: 0.03 ± 0.001 nmol/106 cells). The ratio of
cellassociated to the applied concentration of the test compound (accumulation factor) was 1:3
for NCI-H460 cells and 2:3 for HT-29 cells, indicating an incomplete uptake. In contrast,
compounds 2, 4 and 5 revealed considerably higher cell-associated amounts, with 5 reaching the
highest cellular concentrations. A pronounced cellular enrichment of 2, 4 and 5 was particularly
observed in HT-29 cells. Compounds 2 (2.05 ± 0.39 nmol/106 cells) and 4 (1.59 ± 0.23 nmol/106
cells) revealed a 20- to 30-fold, and 5 (5.01 ± 0.34 nmol/106 cells) an approximately 70-fold higher
cellular enrichment than bendamustine. Qualitatively, the cellular accumulation of the
bendamustine derivatives was comparable in HT-29 and NCI-H460 cells, though at a lower level
(factor of approximately three) in case of the latter. The amounts of cell-associated 2, 4 and 5
were 0.28 ± 0.06 nmol/106 cells, 0.59 ± 0.04 nmol/106 cells and 1.89 ± 0.14 nmol/106 cells,
respectively.
Figure 5.5: Accumulation of 1 and compounds 2, 4 and 5 by HT-29 and NCI-H460 cells. Amount (mean ± SEM, N = 3-4) of cell-associated 1, 2, 4 and 5, expressed as nmol/106 cells (left y-axis) and cellular enrichment (right y-axis) in HT-29 (A) and NCI-H460 (B) cells. A mean cell volume of 3 pL was used to calculate accumulation factors. Significance was calculated using one-way Anova: n.s.: not significant; *: p < 0.05; **: p < 0.01, ***: p < 0.001.

Results and discussion 93
The levels of cellular enrichment correlate very well with the antiproliferative activities,
underlining a crucial role of the ester moiety depending on the chemical nature, covering a
neutral group (2) or substructures with different degree of basicity (4 and 5). In particular, the
contribution of the pyrrolidino group in 5, which is positively charged under assay conditions,
becomes obvious from the increased cellular accumulation which is paralleled by the
antiproliferative activity, the induction of apoptosis and p53 expression. The high cellular
accumulation of 5 and the comparable effects of 5-7 concerning the toxicity suggest an important
role of the basic substituent and the positive charge for the cellular association and thus for the
toxicity. Apart from that, the significant difference between HT-29 and NCI-H460 cells might result
from a different extent of diffusion and transporter-mediated uptake. Therefore, a possible
contribution of organic cation transporters (OCT) was taken into account [53]. To test this
hypothesis, functional studies on recombinant OCT1 and OCT3, expressed in HEK293 cells, were
performed. Additionally, the expression of the respective transporters by the tumor cell types
selected for cytotoxicity studies was investigated.

94 Chapter V
5.3.4 Effect of bendamustine derivatives on the activities of OCT1 and OCT3
5.3.4.1 ASP+ uptake by OCT1 and OCT3 expressing HEK293 cells
Confocal laser scanning microscopy revealed specific uptake of the fluorescent substrate ASP+ by
organic cation transporter expressing HEK293 cells (Fig. 5.6). OCT1 activity was lower than that of
OCT3. The activities of both transporters were inhibited by compound 5 and the reference
inhibitor TPA (Fig. 5.6).
Figure 5.6: Confocal laser scanning microscopy of Cellular ASP+ uptake via OCT1 and OCT3. Uptake of fluorescent ASP+ [1 µM] (green) in the absence and presence of compound 5 or TPA after 5 minutes of pre-incubation. Nuclei were stained with Draq5 [5 µM] (red). A, B: HEK-Co (control) cells, treated with Draq5 (A) or ASP+ plus Draq5 (B). C-E: HEK-OCT1 cells, treated with ASP+ plus Draq5 (C), ASP plus Draq5 plus compound 5 [15 µM] (D), or ASP+ plus Draq5 plus TPA [200 µM] (E). F-H: HEK-OCT3 cells, treated with ASP+ plus Draq5 (F), ASP+ plus Draq5 plus compound 5 [15 µM] (G), or ASP+ plus Draq5 plus TPA [200 µM] (H).

Results and discussion 95
5.3.4.2 Determination of the affinities of OCT1 and OCT3 to ASP+ as substrate.
Flow cytometry was applied to determine Km values (Fig. 5.7). The kinetics of ASP+-uptake and
thus the increase in fluorescence were linear for both transporters (Fig. 5.7A), allowing the
determination of initial velocities (v0) at different concentrations (Fig. 5.7B). The affinity to ASP+
was not significantly different for OCT1 (Km = 3.1 ± 0.1 µM) and OCT3 (Km = 2.7 ± 0.1 µM). By
contrast, the maximal uptake rate for ASP+ was significantly higher for
OCT3 (vmax = 5321 ± 89 MFI/(104 cells · min)) than for OCT1 (vmax = 2808 ± 78 MFI/(104 cells · min);
p < 0.001).
Figure 5.7: Specific uptake of ASP+ and Michaelis-Menten kinetics determined by flow cytometry. A: Time dependency of the specific mean fluorescence intensity (MFI) after incubating HEK-OCT1 and HEK-OCT3 cells with 1 µM ASP+ (means ± SEM, N = 3). B: Concentration dependency of the initial velocity of the specific increase in the mean fluorescence intensity (MFI) caused by ASP+-uptake into HEK-OCT1 and HEK-OCT3 cells. HEK cells transfected with an empty vector served as control for unspecific uptake (means ± SEM, N = 3).
5.3.4.3 Inhibition of OCT mediated ASP+ uptake by bendamustine derivatives.
Bendamustine (1), the derivatives 2, 4 and 5 and the standard inhibitor tetrapentyl ammonium
(TPA) were investigated in the flow cytometric ASP+-uptake assay to determine IC50 values. The
IC50 values of TPA in HEK-OCT1 (IC50 = 6.04 ± 0.83 µM) and HEK-OCT3 (IC50 = 19.9 ± 2.23) cells were
consistent with previously published data, obtained in a microtiter assay (OCT1: IC50 = 7.9 µM
[46], OCT3: IC50 = 28 µM [47]). Whereas compounds 2, 4 and 5 (Fig. 5.8) revealed concentration-
dependent inhibition of both transporters, incomplete inhibition of OCT1 (35 %) and OCT3 (37 %)
was observed at the highest examined concentration of bendamustine (200 µM). Compounds 2
and 4 were comparable to TPA at OCT1, whereas 5 was more potent by a factor of approximately
20 (Table 5.2). By contrast, compounds 2, 4 and 5 were almost equipotent at OCT3 and
approximately four times more potent than the reference compound TPA (p ≤ 0.05). Several

96 Chapter V
studies conducted in the last years focused on
the uptake of cytostatic drugs by organic
cation transporters. Oxaliplatin [54], picoplatin
[55], imatinib [56], paclitaxel and irinotecan
[57] were identified as OCT1 substrates and
oxaliplatin [58], melphalan, irinotecan and
vincristine [59] as substrates for OCT3.
Compared to other cytostatic drugs such as
cisplatin (IC50 value > 100 µM at OCT1 [60]) and
mitoxantrone (IC50 16 µM at OCT1; 440 µM at
OCT3 [61]), especially 5 revealed remarkably higher potency at OCT1 (IC50 0.35 ± 0.03 µM).
Whether compounds 2, 4 and 5 are inhibitors or substrates of OCT1 and OCT3 is a matter of
question. Supposed that these bendamustine derivatives, in particular the basic ester 5, are
substrates, accumulation and cytotoxicity should be related to the OCT expression.
Figure 5.8: Concentration-dependent inhibition of ASP+-uptake by OCT expressing HEK-cells. Inhibition of ASP+-uptake (1 µM) into HEK-OCT1 (A) and HEK-OCT3 (B) cells by TPA, 2, 4 or 5. The mean fluorescence intensities were normalized to uninhibited ASP+-uptake (N=3).
5.3.4.4 Expression of OCT1 (SLC22A1) and OCT3 (SLC22A3) by cancer cells.
Previously, OCT1-mediated uptake of cytostatics in tumor cells was reported for chronic myeloid
leukemia [56], chronic lymphocytic leukemia [57], and colon carcinoma [54], whereas OCT3
expression was associated with colorectal [58] and renal cancer [59]. We applied quantitative RT-
PCR for the examination of OCT1 and OCT3 expression in all used cancer cell lines (Fig. 5.9).
Table 5.2: IC50 (µM) values (± SEM, N=3) of the ASP+-uptake inhibition into HEK-OCT1 and HEK-OCT3 cells.
Compound OCT1 OCT3
TPA 6.04 ± 0.83 19.9 ± 2.23
1 > 200 > 200
2 11.32 ± 1.93 5.07 ± 1.41
4 10.05 ± 2.49 5.11 ± 0.02
5 0.35 ± 0.03 3.41 ± 0.16

Conclusion 97
Whereas OCT1 was weakly expressed in SK-ES1 and SK-MEL3 cells, OCT3 expression was high in
HT-29 cells, and clear bands were detectable upon analysis of Capan-1 and LNCaP cells. The
differential expression (Fig. 5.9) does not support the hypothesis that the chemosensivities of the
investigated cancer cell types (Table 5.1) are primarily determined by OCT-mediated uptake of
the bendamustine esters.
Figure 5.9: Gel electrophoretic analysis of SLC22A1 (encoding human OCT1) and SLC22A3 (encoding human OCT3) mRNA expression by different human cancer cell types after quantitative RT-PCR. Human SLC22A1 mRNA was detected using the primer pair oOCT1-RT.for – oOCT1-RT.rev, resulting in a specific band of 319 bp, human SLC22A3 mRNA by the primer pair oOCT3-RT.for – oOCT3-RT.rev, resulting in a band of 439 bp. As a positive control, the plasmids pOCT1.31 and pOCT3.31 (cDNA) were used as templates of SLC22A1 and SLC22A3, respectively. NTC = non-template control. Data provided by Prof. Dr. Jörg König.
5.4 Conclusion
Although the investigated compounds are sufficiently stable to act as antitumor agents on their
own, it cannot be precluded that the esters are only prodrugs, allowing for increased intracellular
accumulation of bendamustine. Having the N-Lost moiety in common, alkylating property is a
characteristic feature of both, the parent compound and the derivatives. In concert with the
increase in apoptotic processes and elevated p53 expression, the data may be interpreted as a
hint to a dual mechanism of action, in particular in case of the basic bendamustine esters.

98 Chapter V
5.5 Supporting Information
Figure S5.1: Characterization of HEK293 cells stably expressing human OCT1. A: Immunoblot analysis of lysates (20 µg each) of HEK-Co and HEK-OCT1 cells. OCT1 was detected with the antiserum KEN (see: Material and Methods). B: Immunolocalization of human OCT1 in HEK-Co and HEK-OCT1 cells by confocal microscopy. The OCT1 protein was detected in the plasma membrane of transfected HEK-OCT1 cells and no OCT1-specific staining was detectable in HEK-Co cells. C: Concentration dependent [3H]MPP+ uptake in HEK-Co and HEK-OCT1 cells (incubation time: 3 min). D: Time-dependent uptake of [3H]MPP+ (50 µM) by HEK-Co and HEK-OCT1 cells. In both cases OCT1-mediated uptake (squares) of [3H]MPP+ was determined by subtracting uptake in HEK-Co cells from the uptake into HEK-OCT1 cells. Data provided by Prof. Dr. Jörg König.

Supporting Information 99
Figure S5.2: Concentration-response curves of 1, 2 and 5 against Jurkat (A) and HT-29 (B) cells after 96 hours of incubation. T/Ccorr values represent the net proliferation of the treated cells referred to the vehicle treated control cells (set to 100%). The obtained data were used for the calculation of IC50 values (mean values ± SEM of 2-3 independent experiments with 4 replicates per concentration).

100 Chapter V
Figure S5.3: Chemosensitivity of HEL92.1.7 cells against compounds 1 and 3-7. Antiproliferative and cytocidal effects correspond to the left y-axes. The growth curves of untreated cells (open circles) correspond to the right y-axes. Mean values ± SEM of 2-3 independent assays with 8 replicates per concentration and time point.

Supporting Information 101
Figure S5.4: Chemosensitivity of Jurkat cells against compounds 1 and 3-7. Antiproliferative and cytocidal effects correspond to the left y-axes. The growth curves of untreated cells (open circles) correspond to the right y-axes. Mean values ± SEM of 2-3 independent assays with 8 replicates per concentration and time point.

102 Chapter V
Figure S5.5: Chemosensitivity of U-937 cells against compounds 1 and 3-7. Antiproliferative and cytocidal effects correspond to the left y-axes. The growth curves of untreated cells (open circles) correspond to the right y-axes. Mean values ± SEM of 2-3 independent assays with 8 replicates per concentration and time point.

Supporting Information 103
Figure S5.6: Chemosensitivity of MG-63 cells against compounds 1 and 3-7. Antiproliferative and cytocidal effects correspond to the left y-axes. The growth curves of untreated cells (open circles) correspond to the right y-axes. Mean values ± SEM of 2-3 independent assays with 8 replicates per concentration and time point.
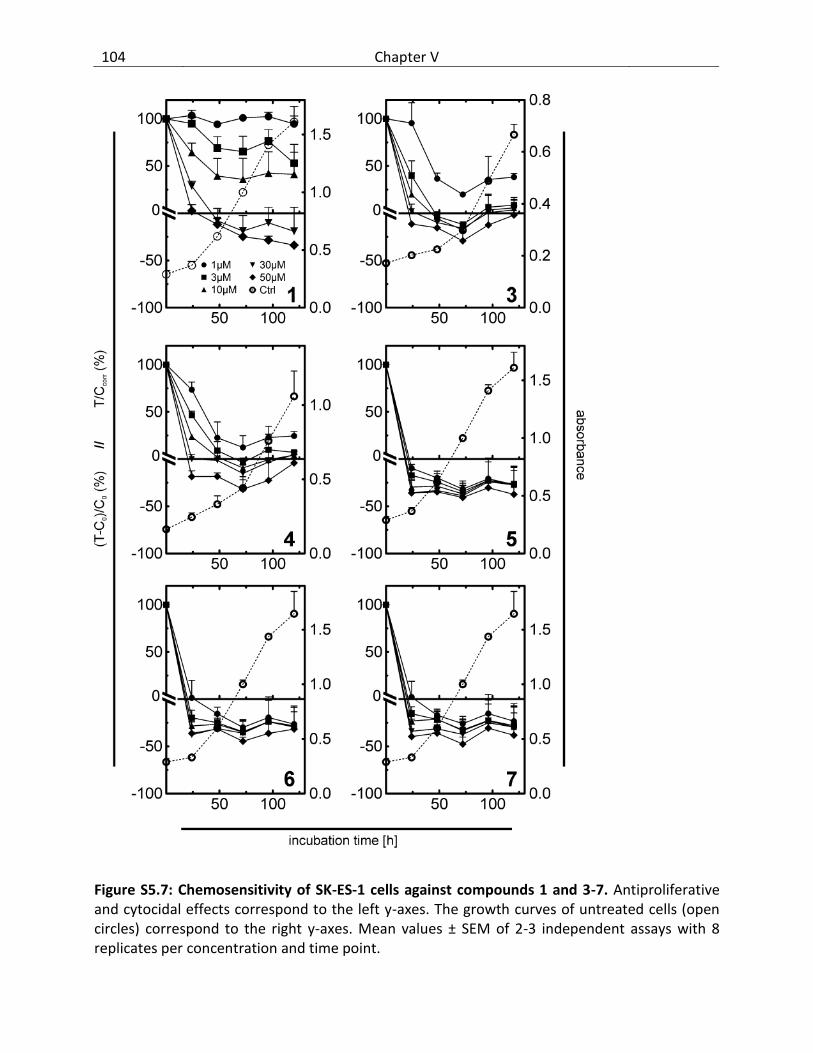
104 Chapter V
Figure S5.7: Chemosensitivity of SK-ES-1 cells against compounds 1 and 3-7. Antiproliferative and cytocidal effects correspond to the left y-axes. The growth curves of untreated cells (open circles) correspond to the right y-axes. Mean values ± SEM of 2-3 independent assays with 8 replicates per concentration and time point.

Supporting Information 105
Figure S5.8: Chemosensitivity of Capan-1 cells against compounds 1 and 3-7. Antiproliferative and cytocidal effects correspond to the left y-axes. The growth curves of untreated cells (open circles) correspond to the right y-axes. Mean values ± SEM of 2-3 independent assays with 8 replicates per concentration and time point.

106 Chapter V
Figure S5.9: Chemosensitivity of LNCaPcells against compounds 1 and 3-7. Antiproliferative and cytocidal effects correspond to the left y-axes. The growth curves of untreated cells (open circles) correspond to the right y-axes. Mean values ± SEM of 2-3 independent assays with 8 replicates per concentration and time point.

Supporting Information 107
Figure S5.10: Chemosensitivity of NCI-H460 cells against compounds 1 and 3-7. Antiproliferative and cytocidal effects correspond to the left y-axes. The growth curves of untreated cells (open circles) correspond to the right y-axes. Mean values ± SEM of 2-3 independent assays with 8 replicates per concentration and time point.

108 Chapter V
Figure S5.11: Chemosensitivity of HT-29 cells against compounds 1 and 3-7. Antiproliferative and cytocidal effects correspond to the left y-axes. The growth curves of untreated cells (open circles) correspond to the right y-axes. Mean values ± SEM of 2-3 independent assays with 8 replicates per concentration and time point.

Supporting Information 109
Figure S5.12: Chemosensitivity of SK-MEL-3 cells against compounds 1 and 3-7. Antiproliferative and cytocidal effects correspond to the left y-axes. The growth curves of untreated cells (open circles) correspond to the right y-axes. Mean values ± SEM of 2-3 independent assays with 8 replicates per concentration and time point.

110 Chapter V
Figure S5.13: Flow cytometric analysis of Jurkat cells. Cells were treated with 10 µM 1, 2, 4 and 5 after different periods of incubation (6, 24, 48 hours) by annexin V-FITC (x-axis) and propidium iodide (y-axis) staining. Samples of untreated cells were collected at the same time points and served as control (Ctrl). The indicated percentages are related to the total number of collected single cells. The different test compounds are arranged horizontally.

Supporting Information 111
Figure S5.14: Stability of compounds 1 and 4 in the presence of NCI-H460 cells. Representative chromatograms, indicating the stability of compounds 1 and 4 in the presence of NCI-H460 cells (IS = internal standard, umbelliferone). Samples were measured immediately before the incubation (t = 0 minutes) and after 10 minutes of incubation at 25 °C (t = 10 minutes). The kinetics of the hydrolysis of the N-Lost group, yielding 1a or 4a, is the same in case of bendamustine (1) and the morpholinoethyl ester 4, respectively. Other decomposition products were not detected. The same holds for compounds 2 and 5 upon incubation with cells under the same conditions (data not shown).

112 Chapter V
5.6 References
1. Ozegowski W, Krebs D. Aminosäureantagonisten. III. ω-[Bis-(β-chloräthyl)-amino-benzimidazolyl-(2)]-propion- bzw. -buttersäuren als potentielle Cytostatika. J Prakt Chem. 1963;20: 178-186.
2. Ozegowski W, Krebs D. IMET 3393, -[1-methyl-5-bis-(-chloroethyl)-amino-benzimidazolyl-(2)]-butyric acid hydrochloride, a new cytostatic agent from among the series of benzimidazole mustard compounds. Zentralbl Pharm. 1971;110: 1013-1019.
3. Cheson BD, Rummel MJ. Bendamustine: rebirth of an old drug. J Clin Oncol. 2009;27: 1492-1501.
4. Kalaycio M. Bendamustine: a new look at an old drug. Cancer. 2009;115: 473-479. 5. Tageja N, Nagi J. Bendamustine: something old, something new. Cancer Chemother
Pharmacol. 2010;66: 413-423. 6. Leoni LM. Bendamustine: rescue of an effective antineoplastic agent from the mid-
twentieth century. Semin Hematol. 2011;48 Suppl 1: S4-11. 7. Hallek M. Signaling the end of chronic lymphocytic leukemia: new frontline treatment
strategies. Hematology. 2013: 138-150. 8. Knauf WU, et al. Bendamustine compared with chlorambucil in previously untreated
patients with chronic lymphocytic leukaemia: updated results of a randomized phase III trial. Br J Haematol. 2012;159: 67-77.
9. Gil L, et al. Bendamustine-based therapy as first-line treatment for non-Hodgkin lymphoma. Med Oncol. 2014;31: 944.
10. Pönisch W, et al. Bendamustine and prednisone in combination with bortezomib (BPV) in the treatment of patients with newly diagnosed/untreated multiple myeloma. J Cancer Res Clin Oncol. 2014;140: 1947-1956.
11. Pönisch W, et al. Treatment of bendamustine and prednisone in patients with newly diagnosed multiple myeloma results in superior complete response rate, prolonged time to treatment failure and improved quality of life compared to treatment with melphalan and prednisone--a randomized phase III study of the East German Study Group of Hematology and Oncology (OSHO). J Cancer Res Clin Oncol. 2006;132: 205-212.
12. Cheson BD, et al. Bendamustine produces durable responses with an acceptable safety profile in patients with rituximab-refractory indolent non-Hodgkin lymphoma. Clin Lymphoma Myeloma Leuk. 2010;10: 452-457.
13. Kahl BS, et al. Bendamustine is effective therapy in patients with rituximab-refractory, indolent B-cell non-Hodgkin lymphoma: results from a Multicenter Study. Cancer. 2010;116: 106-114.
14. Ludwig H, et al. Bendamustine-bortezomib-dexamethasone is an active and well-tolerated regimen in patients with relapsed or refractory multiple myeloma. Blood. 2014;123: 985-991.
15. Eichbaum MH, et al. Weekly administration of bendamustine as salvage therapy in metastatic breast cancer: final results of a phase II study. Anticancer Drugs. 2007;18: 963-968.
16. Lammers PE, et al. Phase II study of bendamustine in relapsed chemotherapy sensitive or resistant small-cell lung cancer. J Thorac Oncol. 2014;9: 559-562.

References 113
17. Friedberg JW, et al. The combination of bendamustine, bortezomib, and rituximab for patients with relapsed/refractory indolent and mantle cell non-Hodgkin lymphoma. Blood. 2011;117: 2807-2812.
18. Lentzsch S. Bendamustine: the remedy that came in from the cold. Blood. 2014;123: 948-950.
19. Rummel MJ, et al. Bendamustine plus rituximab is effective and has a favorable toxicity profile in the treatment of mantle cell and low-grade non-Hodgkin's lymphoma. J Clin Oncol. 2005;23: 3383-3389.
20. Rummel MJ, et al. In vitro studies with bendamustine: enhanced activity in combination with rituximab. Semin Oncol. 2002;29: 12-14.
21. Surget S, et al. Bendamustine and melphalan kill myeloma cells similarly through reactive oxygen species production and activation of the p53 pathway and do not overcome resistance to each other. Leuk Lymphoma. 2014;55: 2165-2173.
22. Gaul L, et al. Bendamustine induces G2 cell cycle arrest and apoptosis in myeloma cells: the role of ATM-Chk2-Cdc25A and ATM-p53-p21-pathways. J Cancer Res Clin Oncol. 2008;134: 245-253.
23. Cives M, et al. Bendamustine overcomes resistance to melphalan in myeloma cell lines by inducing cell death through mitotic catastrophe. Cell Signal. 2013;25: 1108-1117.
24. Leoni LM, et al. Bendamustine (Treanda) displays a distinct pattern of cytotoxicity and unique mechanistic features compared with other alkylating agents. Clin Cancer Res. 2008;14: 309-317.
25. Colledge J. Solid dosage forms of bendamustine. Patent WO2010063476. 2010. Referenced in: Chem Abstr 153:70374.
26. Colledge J. Oral dosage forms of bendamustine. Patent WO2010063493. 2010. Referenced in: Chem Abstr 153:21223.
27. Labell RY, Patel PR. Oral formulations of bendamustine for cancer treatment. Patent WO2010126676. 2010. Referenced in: Chem Abstr 153:589513
28. Bakale RP, et al. Preparation of bendamustine esters and bendamustine amides and their use for the treatment of cancer. Patent WO2014075035A1. 2014. Referenced in: Chem Abstr 160:723974.
29. Pencheva I, et al. HPLC study on the stability of bendamustine hydrochloride immobilized onto polyphosphoesters. J Pharm Biomed Anal. 2008;48: 1143-1150.
30. Scutaru AM, et al. Optimization of the N-lost drugs melphalan and bendamustine: synthesis and cytotoxicity of a new set of dendrimer-drug conjugates as tumor therapeutic agents. Bioconjug Chem. 2010;21: 1728-1743.
31. Schickaneder H, et al. Esters of bendamustine and related compounds, and medical use thereof. Patent EP2656843. 2013. Referenced in: Chem Abstr 159:691800
32. Gust R, Krauser R. Investigations on the Stability of Bendamustin, a Cytostatic Agent of the Nitrogen Mustard Type, I. Synthesis, Isolation, and Characterization of Reference Substances. Monatsh Chem. 1997;128: 291-299.
33. Werner W, et al. [Synthesis of a potential metabolite of the carcinostatic bendamustin (Cytostasen)]. Pharmazie. 1991;46: 113-114.
34. Huber S, et al. Stabilities of neutral and basic esters of bendamustine in plasma compared to the parent compound: Kinetic investigations by HPLC. J Pharm Biomed Anal. 2015;104: 137-143.

114 Chapter V
35. Bachmakov I, et al. Interaction of oral antidiabetic drugs with hepatic uptake transporters: focus on organic anion transporting polypeptides and organic cation transporter 1. Diabetes. 2008;57: 1463-1469.
36. Seithel A, et al. The influence of macrolide antibiotics on the uptake of organic anions and drugs mediated by OATP1B1 and OATP1B3. Drug Metab Dispos. 2007;35: 779-786.
37. Solbach TF, et al. Organic cation transporter 3: expression in failing and nonfailing human heart and functional characterization. J Cardiovasc Pharmacol. 2011;58: 409-417.
38. Reile H, et al. Computerized determination of growth kinetic curves and doubling times from cells in microculture. Anal Biochem. 1990;187: 262-267.
39. Mosmann T. Rapid colorimetric assay for cellular growth and survival: application to proliferation and cytotoxicity assays. J Immunol Methods. 1983;65: 55-63.
40. Bernhardt G, et al. Standardized kinetic microassay to quantify differential chemosensitivity on the basis of proliferative activity. J Cancer Res Clin Oncol. 1992;118: 35-43.
41. Monks A, et al. Feasibility of a high-flux anticancer drug screen using a diverse panel of cultured human tumor cell lines. J Natl Cancer Inst. 1991;83: 757-766.
42. Dobretsov GE, et al. [Free energy of the accumulation of a fluorescent cation probe within lymphocyte mitochondria]. Biofizika. 1985;30: 833-836.
43. Pietruck F, Ullrich KJ. Transport interactions of different organic cations during their excretion by the intact rat kidney. Kidney Int. 1995;47: 1647-1657.
44. Rohlicek V, Ullrich KJ. Simple device for continuous measurement of fluorescent anions and cations in the rat kidney in situ. Ren Physiol Biochem. 1994;17: 57-61.
45. Ullrich KJ, Rumrich G. Luminal transport system for choline+ in relation to the other organic cation transport systems in the rat proximal tubule. Kinetics, specificity: alkyl/arylamines, alkylamines with OH, O, SH, NH2, ROCO, RSCO and H2PO4-groups, methylaminostyryl, rhodamine, acridine, phenanthrene and cyanine compounds. Pflugers Arch. 1996;432: 471-485.
46. Ciarimboli G, et al. Regulation of the human organic cation transporter hOCT1. J Cell Physiol. 2004;201: 420-428.
47. Massmann V, et al. The organic cation transporter 3 (OCT3) as molecular target of psychotropic drugs: transport characteristics and acute regulation of cloned murine OCT3. Pflugers Arch. 2014;466: 517-527.
48. Zhang L, et al. Functional characterization of an organic cation transporter (hOCT1) in a transiently transfected human cell line (HeLa). J Pharmacol Exp Ther. 1998;286: 354-361.
49. Nies AT, et al. Vectorial transport of the plant alkaloid berberine by double-transfected cells expressing the human organic cation transporter 1 (OCT1, SLC22A1) and the efflux pump MDR1 P-glycoprotein (ABCB1). Naunyn Schmiedebergs Arch Pharmacol. 2008;376: 449-461.
50. Hiraoka N, et al. Purine analog-like properties of bendamustine underlie rapid activation of DNA damage response and synergistic effects with pyrimidine analogues in lymphoid malignancies. PLoS One. 2014;9: e90675.
51. Owen JS, et al. Bendamustine pharmacokinetic profile and exposure-response relationships in patients with indolent non-Hodgkin's lymphoma. Cancer Chemoth Pharm. 2010;66: 1039-1049.

References 115
52. Preiß S. Untersuchungen zur Pharmakokinetik und Toxizitätsprofil von Bendamustin an Patienten mit eingeschränkter Leberfunktion. PhD Thesis, Charité - Universitätsmedizin 2011. Available: http://www.diss.fu-berlin.de/diss/receive/FUDISS_thesis_000000020028.
53. König J, et al. Transporters and drug-drug interactions: important determinants of drug disposition and effects. Pharmacol Rev. 2013;65: 944-966.
54. Zhang S, et al. Organic cation transporters are determinants of oxaliplatin cytotoxicity. Cancer Res. 2006;66: 8847-8857.
55. More SS, et al. Organic cation transporters modulate the uptake and cytotoxicity of picoplatin, a third-generation platinum analogue. Mol Cancer Ther. 2010;9: 1058-1069.
56. White DL, et al. OCT-1-mediated influx is a key determinant of the intracellular uptake of imatinib but not nilotinib (AMN107): reduced OCT-1 activity is the cause of low in vitro sensitivity to imatinib. Blood. 2006;108: 697-704.
57. Gupta S, et al. Human organic cation transporter 1 is expressed in lymphoma cells and increases susceptibility to irinotecan and paclitaxel. J Pharmacol Exp Ther. 2012;341: 16-23.
58. Yokoo S, et al. Significance of organic cation transporter 3 (SLC22A3) expression for the cytotoxic effect of oxaliplatin in colorectal cancer. Drug Metab Dispos. 2008;36: 2299-2306.
59. Shnitsar V, et al. Expression of human organic cation transporter 3 in kidney carcinoma cell lines increases chemosensitivity to melphalan, irinotecan, and vincristine. Cancer Res. 2009;69: 1494-1501.
60. Ciarimboli G, et al. Cisplatin nephrotoxicity is critically mediated via the human organic cation transporter 2. Am J Pathol. 2005;167: 1477-1484.
61. Koepsell H. The SLC22 family with transporters of organic cations, anions and zwitterions. Mol Aspects Med. 2013;34: 413-435.


6 Chapter VI
Summary

118 Summary
ABC-transporter expression is a crucial mechanism of tumor resistance and was recently also
associated with cancer initiating cells (CIC). Flow cytometry was applied to detect the expression
of CIC-markers, ABCB1 and ABCG2 in human brain- and breast cancer cell lines and to examine
possible correlations between ABC-transporter expression and CICs. Only one of the investigated
brain tumor cell lines (Daoy) comprised cells expressing CIC-markers which revealed increased
clonogenicity in vitro.
For investigations on the correlation between CICs and ABCG2, MCF-7 breast cancer cells were
treated with topotecan (Topo) to induce ABCG2 expression. Topo treatment led to increased
resistance against cytostatic drugs, which are substrates of ABCG2. Concurrently, Topo treatment
induced a reversible decrease in the expression of the CIC-markers CD24 and EpCAM, but did not
result in increased clonogenicity in vivo. In contrast, Topo treated cells revealed decreased
tumorigenicity, most probably due to the down-regulation of CD24 and EpCAM. Nevertheless,
further investigations are necessary to determine whether ABCG2 induction and CD24/EpCAM
down-regulation are interrelated or independent processes.
The nitrogen mustard (N-Lost) derivative bendamustine (BM) has been approved as an anticancer
drug for the treatment of hematopoietic malignancies for decades. Nevertheless, as becomes
obvious from a series of recent publications and patent applications, there is increasing interest
in this cytostatic with respect to, for example, improved oral bioavailability of BM by optimized
formulations. Following a different approach, in this thesis the potential of esters of BM was
explored, with a focus on representative aminoalkyl esters. Alkyl- and various aminoalkyl (e.g. 2-
morpholinoethyl or 2-pyrrolidinoethyl) esters of BM were investigated for stability in various
media and cytotoxicity in vitro against a broad panel of human malignancies.
For this purpose, a fast, selective RP-HPLC method using fluorescence detection was established
and validated. This method enabled the separation of complex mixtures of analytes and
degradation products with low limits of quantification and high accuracy and precision. Liquid
phase extraction with perchloric acid yielded high recovery rates and proved to be applicable to
the determination of the stability of BM and BM esters in biological material.
In aqueous solution, the half-life of the N-Lost moiety remained essentially unchanged upon
esterification of BM. The N-Lost group was significantly more stable in murine plasma, whereas
the ester bonds were prone to enzymatic cleavage. Interestingly, the nitrogen mustard group was
even more stable in human than in murine plasma. The stability of the ester bond substantially
depended on the chemical nature of the substituents at the ester group. Kinetic studies in the
presence of plasma, butyrylcholine esterase and physostigmine revealed that the basic esters are
substrates of unspecific choline esterases. While alkyl esters and the mofetil ester had
significantly longer half-lives in human compared to murine plasma, basic esters, except for the
branched 1-methyl-2-pyrrolidinoethyl ester, were cleaved rapidly. The discrepancies between the

Summary 119
species-dependent stabilities of the BM derivatives can be attributed to lower albumin content
and higher enzymatic activity in mouse compared to human plasma.
Surprisingly, cytotoxicity studies revealed that the BM derivatives possess considerably increased
antiproliferative activity against a panel of human cancer cells, representing not only hematologic
malignancies but also solid tumors (e.g. malignant melanoma, colorectal carcinoma and lung
cancer), which are resistant to the parent compound BM. Although the investigated compounds
are sufficiently stable to act as antitumor agents on their own, it cannot be precluded that the
esters are prodrugs, allowing for increased intracellular accumulation of BM. Especially, basic
esters, positively charged under physiological conditions, were up to approximately 100 times
more effective than BM. This was paralleled by a higher fraction of early apoptotic cancer cells
and increased expression of p53.
As HPLC analyses revealed cellular enrichment of the esters with the highest accumulation factor
in case of the pyrrolidinoethyl ester, transport by organic cation transporters OCT1 and OCT3 was
taken into account. Although differential interactions of the BM derivatives with these
transporters were confirmed in vitro, the OCT expression (mRNA level) of the investigated human
sarcoma and carcinoma cells did not support the hypothesis of an OCT mediated uptake
contributing to the drastic increase in chemosensitivity.
The presented approach to increasing cellular access, enhancing antiproliferative activity – also
against cancer cells refractory to the parent compound - by chemical derivatization might also
add value to alkylating agents other than bendamustine.

Abbreviations
5-FU 5-fluorouracil ABC-transporter ATP-binding casette transporter AF alexa fluor ALDH aldehyde dehydrogenase APC allophycocyanin
ASP+ 4-(4-(dimethylamino)styryl)-N-methylpyridinium iodide BCIC breast cancer initiating cell BCRP breast cancer resistance protein bFGF basic fibroblast growth factor BM bendamustine
BP band pass BTIC brain tumor initiating cell
BV-421 brilliant violet 421 CIC cancer initiating cell CK cytokeratin CLL chronic lymphocytic leukemia CSC cancer stem cell Ctrl control DMSO dimethyl sulfoxid Doxo doxorubicin EDTA ethylenediaminetetraacetic acid EGF epidermal growth factor
EGFR epithelial growth factor receptor EGTA ethylenglycol-bis(aminoethylether)-N,N,N',N'-tetraacetic acid EMT epithelial mesenchymal transition FACS fluorescence activated cell sorting FCS fetal calf serum FITC Fluorescein isothiocyanate FSC forward scatter FSC-H forward scatter height FSC-W forward scatter width FTC fumitremorgin C HE hematoxylin-eosin
HER human estrogen receptor HPLC high performance liquid chromatography HRP horseradish peroxidase IS internal standard LOD limit of detection LOQ limit of quantification LP long pass mAb monoclonal antibody MeCN acetonitrile

MFI mean fluorescence intensity
MG Masson-Goldner Mito mitoxantrone MM multiple myeloma MOA mechanism of action MTT thiazolyl blue tetrazolium bromide MTX methotrexate NHL non-Hodgkin lymphoma NP-40 nonidet P-40 OCT organic cation transporter PB pacific blue PBS phosphate buffered saline
PBS/FCS PBS + 2 % FCS PCR polymerase chain reaction PE phycoerythrin P-gp P-glycoprotein PI propidium iodide RP reverse phase RSD relative standard deviation RT room temperature SDS sodium dodecyl sulfate SP side population SSC side scatter t½ half life
Topo topotecan TPA tetrapentyl ammonium TPC tumor propagating cell WT wild type