investing in carbon efficient equities: how the race to ... · pdf fileinvesting in carbon...
TRANSCRIPT

Investing in carbon efficient equities:how the race to slow climate change may affect stock performance

The world may be reaching a tipping point where policy action on climate change by the European Union, United States, China and other major economies will accelerate the shift from fossil fuel energy supplies to low-carbon technologies and fuels.
Using a scenario-based modeling analysis, we show that climate change policies and related technology developments are shown to affect investment returns, giving rise to investment “winners” and “losers”. We believe investors should view climate change as a new return variable.
Sector impacts can be significant. For example, depending on the scenario that ultimately unfolds, our analysis shows
the average annual returns from the coal sector could fall between 26% and 138% over the coming decade. Conversely, the renewable energy sector could see average annual returns increase between 4% and 97% over the same period.
Effects on regional equity returns may be material but will vary depending on the scenario. A so-called 2°C scenario could see return benefits for emerging market equities, whereas a 4°C scenario could negatively impact emerging market equities.
Investors can take steps now by using emerging tools and carbon analytics to review the carbon intensity of their equity portfolios, identify carbon hot spots, and consider low-carbon optimization strategies.
Lorem Sinvel 1
• More than 40 national and 20 subnational jurisdictions in both developed and developing countries have put a price on carbon emissions or are in the process of doing so.ii
• New commitments are being announced in major economies, including:- a US commitment to reduce emissions by roughly 20% below current levels by 2025, backed up by regulatory efforts to require emissions reductions from power plants,
- an EU pledge to continue reducing carbon emissions with an economy-wide target of at least 40% below 1990 levels by 2030, and
- an announcement by China that it will generate 20 percent of its electricity with non-fossil fuel sources by 2030, and a pledge to peak its carbon emissions by 2030.
• Many business leaders are publicly calling for a strong international climate agreement, including:
-large,influentialfossilfuelcompanies,iii
- over 350 institutional investors representing over $24 trillion in assets under management,iv and
- CEOs of 43 global companies operating across sectors and geographies, representing collectively over $1.2 trillion in revenue.v
According to the World Economic Forum’s 2015 Global Risks report,i in the coming decade four of the top ten global risks are directly or indirectly linked to changes in the earth’s climate system. As concern over climate change persists, government action to mitigate the risk—meaning laws and regulations to reduce carbon emissions from fossil fuels and shift toward low-carbon energy supplies—is likely to accelerate.
Indeed, 2015 may prove to be a critical year in turning the tide against global carbon emissions as the international community will attempt to negotiate a new global climate agreement at the United Nations Climate Change Conference, known as COP21. Though past efforts to negotiate such agreements fell far short of establishing aggressive cuts in emissions, momentum may now be building for significant action, for example:
2
The world’s most authoritative voice on climate change is the Intergovernmental Panel on Climate Change (IPCC). The IPCC is a scientific body that reviews and assesses the most recent scientific, technical and socio-economic information relevant to our understanding of climate change. Thousands of scientists from all over the world contribute to the work of the IPCC on a voluntary basis as authors, contributors and reviewers.
The IPCC’s Fifth Assessment Report released in 2013/14 concluded unequivocally that the climate is warming, and it is extremely likely that human activities have caused more than half of the observed increase in global average surface temperature since 1950.
Humans have contributed to a rise in atmospheric greenhouse gases (GHGs) as a result of increased fossil fuel burning and deforestation. Since the 1700s and the dawn of the Industrial Revolution, the largest contributor to global warming has been carbon dioxide (CO2). CO2
concentrations have increased from 278 parts per million (ppm) in 1750 to 401 ppm in 2015 – a 44% rise. This significant increase in GHGs has coincided with a variety of shifts in short and long-term weather patterns.
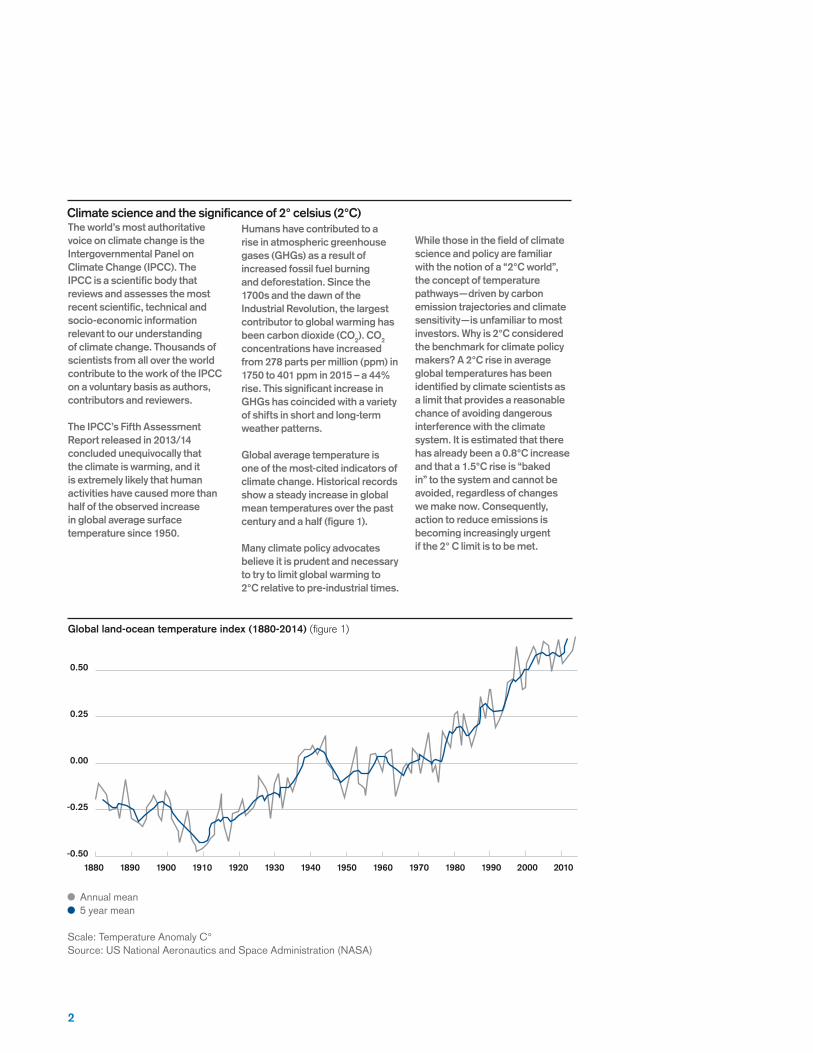
Global average temperature is one of the most-cited indicators of climate change. Historical records show a steady increase in global mean temperatures over the past century and a half (figure 1).
Many climate policy advocates believe it is prudent and necessary to try to limit global warming to 2°C relative to pre-industrial times.
Climate science and the significance of 2° celsius (2°C)
Global land-ocean temperature index (1880-2014) (figure1)
While those in the field of climate science and policy are familiar with the notion of a “2°C world”, the concept of temperature pathways—driven by carbon emission trajectories and climate sensitivity—is unfamiliar to most investors. Why is 2°C considered the benchmark for climate policy makers? A 2°C rise in average global temperatures has been identified by climate scientists as a limit that provides a reasonable chance of avoiding dangerous interference with the climate system. It is estimated that there has already been a 0.8°C increase and that a 1.5°C rise is “baked in” to the system and cannot be avoided, regardless of changes we make now. Consequently, action to reduce emissions is becoming increasingly urgent if the 2° C limit is to be met.
Annual mean 5 year mean
Scale: Temperature Anomaly C°Source: US National Aeronautics and Space Administration (NASA)
1880 19401890 19501900 19601910 19701920 19801930 20001990 2010
0.50
0.25
0.00
-0.25
-0.50
Lorem Sinvel 3
Analyzing climate change as investment risk and opportunity
Carbon-intensive companies make up a significantsegmentofmajorstockmarketsaround the world. Considering the S&P 500, for example, energy, utilities and industrials sectors have historically made up as much as 25 percent of the total weighting of the index. Consequently, manyinvestorshaveasignificantexposureto carbon-intensive stocks, including companies that produce oil and gas, coal, electric power, minerals, metals and more. The race to slow climate change, therefore, presents investors with risks—and opportunities—that may materialize in the short, medium and long term.
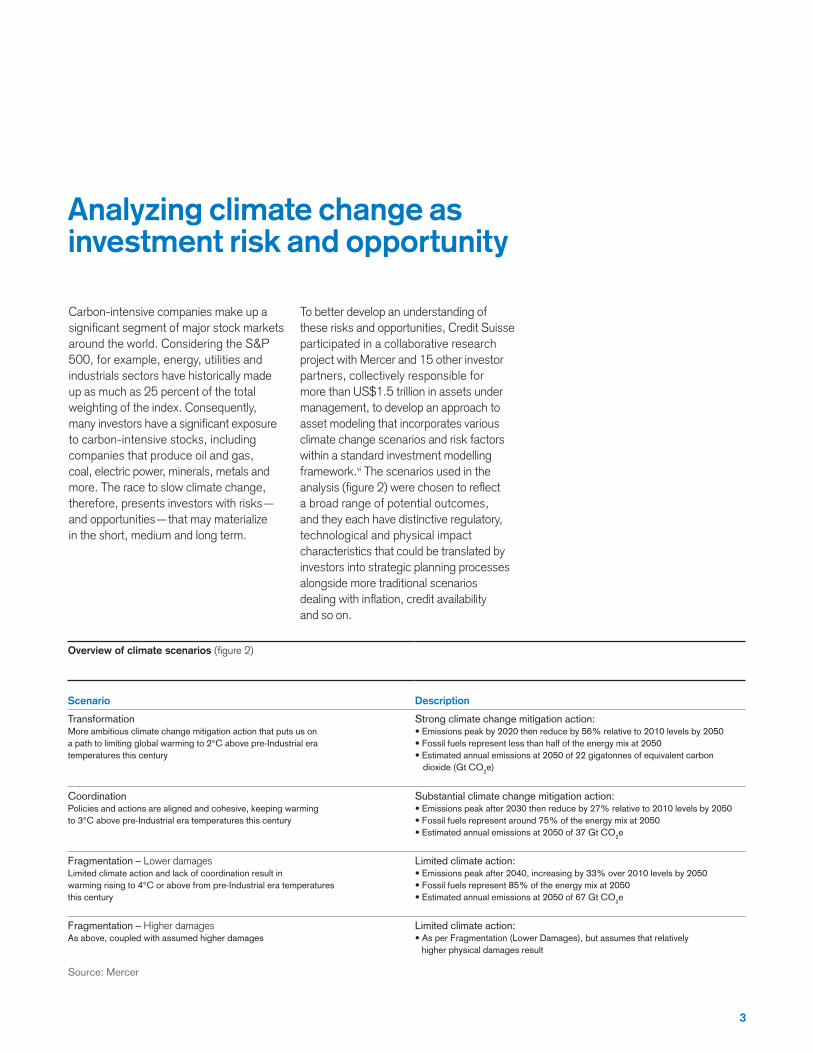
To better develop an understanding of these risks and opportunities, Credit Suisse participated in a collaborative research project with Mercer and 15 other investor partners, collectively responsible for more than US$1.5 trillion in assets under management, to develop an approach to asset modeling that incorporates various climate change scenarios and risk factors within a standard investment modelling framework.vi The scenarios used in the analysis(figure2)werechosentoreflecta broad range of potential outcomes, and they each have distinctive regulatory, technological and physical impact characteristics that could be translated by investors into strategic planning processes alongside more traditional scenarios dealingwithinflation,creditavailability and so on.
Overview of climate scenarios (figure2)
Scenario Description
TransformationMore ambitious climate change mitigation action that puts us on a path to limiting global warming to 2°C above pre-Industrial era temperatures this century
Strong climate change mitigation action:• Emissions peak by 2020 then reduce by 56% relative to 2010 levels by 2050• Fossil fuels represent less than half of the energy mix at 2050• Estimated annual emissions at 2050 of 22 gigatonnes of equivalent carbon dioxide (Gt CO2e)
CoordinationPolicies and actions are aligned and cohesive, keeping warming to 3°C above pre-Industrial era temperatures this century
Substantial climate change mitigation action:• Emissions peak after 2030 then reduce by 27% relative to 2010 levels by 2050• Fossil fuels represent around 75% of the energy mix at 2050• Estimated annual emissions at 2050 of 37 Gt CO2e
Fragmentation – Lower damagesLimited climate action and lack of coordination result in warming rising to 4°C or above from pre-Industrial era temperatures this century
Limited climate action:• Emissions peak after 2040, increasing by 33% over 2010 levels by 2050• Fossil fuels represent 85% of the energy mix at 2050• Estimated annual emissions at 2050 of 67 Gt CO2e
Fragmentation – Higher damagesAs above, coupled with assumed higher damages
Limited climate action:• As per Fragmentation (Lower Damages), but assumes that relatively higher physical damages result
Source: Mercer

4
Climate change related public policy and technology deployment will impact returns The modeling analysis considered multiple climate change risk factors, but for the purposes of this research brief we focus specificallyonpublicpolicyandtechnologydeployment.vii Climate-related policy may involve a variety of measures that can have significantmarketimpacts,suchas:• Explicit carbon-pricing mechanisms,
e.g., carbon taxes, emissions trading systems,
• Energy taxes and subsidies, including removal of subsidies,
• Regulatory standards on energy supply measures, e.g., renewable energy mandates,
•Energyefficiencymeasures,e.g.,building codes, appliance standards, fuel-efficiencystandards,etc.,
• Land use measures such as programs to reduce emissions from deforestation, and
• Targeted support for research and development, e.g., subsidies relating to clean technology.
Timing and magnitude of policies may differ across regions, but aggregate scenarios emerge The stringency and timing of climate-related policies are the critical factors to consider when evaluating investment impacts. Indeed, a key feature of climate policy is the extent to which it assigns a cost—either explicitly or implicitly—to carbon emissions and increases the cost sufficientlyovertimetoshiftbehaviorstoward a low-carbon economy.
Estimatesofthe“costofcarbon”(figure3)offer a relative indicator of the strength of climate polices aimed at reducing emissions. In practice, a comprehensive climate policy strategymayincludemanyregulations,fiscalmeasures and so on. These measures will also vary by region and jurisdiction depending on their ambition, carbon intensity and other local circumstances. Thus, actual measures used may not represent the least costly approach as assumed with the carbon prices used in this modeling analysis. The analysis does not assess the cost-effectiveness of differentmeasuresbutseekstoreflectthestrength of the market drivers that mobilize economic shifts within each scenario.
2015
250
200
150
100
50
02019 2023 2027 2031 2035 2039 2043 2047
Fragmentation Coordination Transformation
Scale: Carbon Price Curves ($2013/Tonne CO2e)Source: Mercer
Carbon pricing pathways by scenario (figure3)
Lorem Sinvel 5
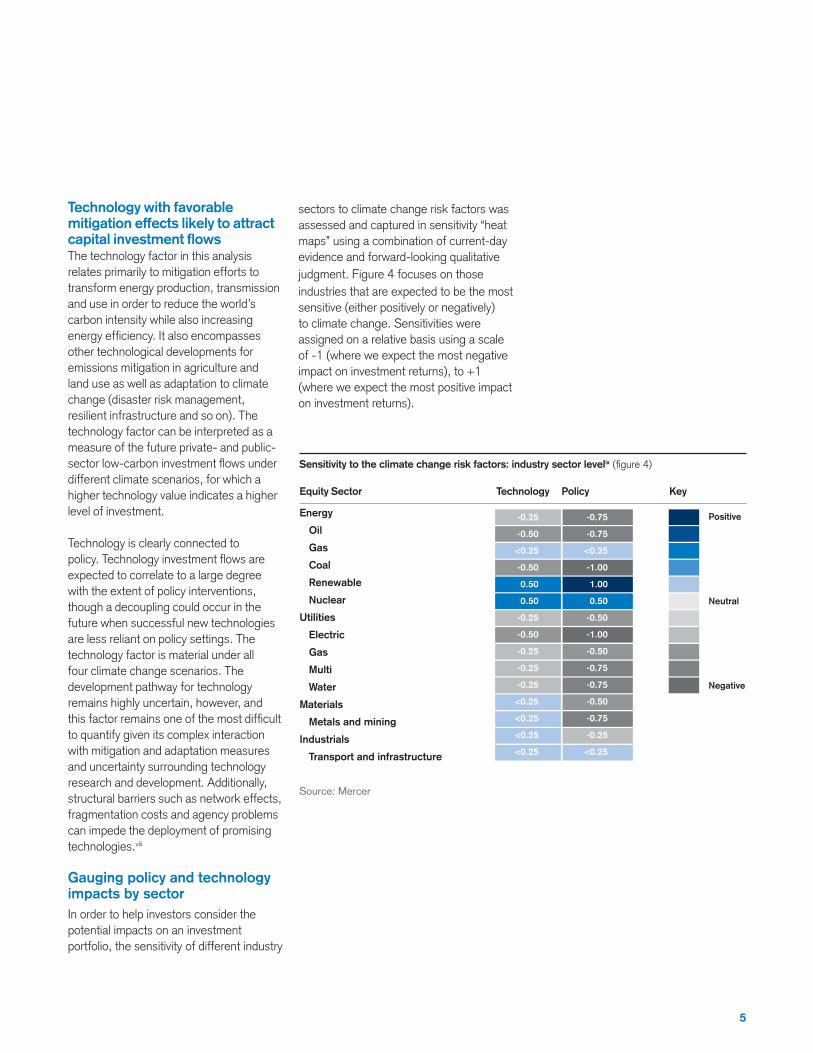
Technology with favorable mitigation effects likely to attract capital investment flows The technology factor in this analysis relates primarily to mitigation efforts to transform energy production, transmission and use in order to reduce the world’s carbon intensity while also increasing energyefficiency.Italsoencompassesother technological developments for emissions mitigation in agriculture and land use as well as adaptation to climate change (disaster risk management, resilientinfrastructureandsoon).Thetechnology factor can be interpreted as a measure of the future private- and public-sectorlow-carboninvestmentflowsunderdifferent climate scenarios, for which a higher technology value indicates a higher level of investment.
Technology is clearly connected to policy.Technologyinvestmentflowsareexpected to correlate to a large degree with the extent of policy interventions, though a decoupling could occur in the future when successful new technologies are less reliant on policy settings. The technology factor is material under all four climate change scenarios. The development pathway for technology remains highly uncertain, however, and thisfactorremainsoneofthemostdifficultto quantify given its complex interaction with mitigation and adaptation measures and uncertainty surrounding technology research and development. Additionally, structural barriers such as network effects, fragmentation costs and agency problems can impede the deployment of promising technologies.viii
Gauging policy and technology impacts by sectorIn order to help investors consider the potential impacts on an investment portfolio, the sensitivity of different industry
sectors to climate change risk factors was assessed and captured in sensitivity “heat maps” using a combination of current-day evidence and forward-looking qualitative judgment. Figure 4 focuses on those industries that are expected to be the most sensitive(eitherpositivelyornegatively) to climate change. Sensitivities were assigned on a relative basis using a scale of -1 (where we expect the most negative impactoninvestmentreturns),to+1(where we expect the most positive impact oninvestmentreturns).
-0.25
-0.50
<0.25
-0.50
0.50
0.50
-0.25
-0.50
-0.25
-0.25
-0.25
<0.25
<0.25
<0.25
<0.25
-0.75
-0.75
<0.25
-1.00
1.00
0.50
-0.50
-1.00
-0.50
-0.75
-0.75
-0.50
-0.75
-0.25
<0.25
Positive
Neutral
Negative
Energy
Oil
Gas
Coal
Renewable
Nuclear
Utilities
Electric
Gas
Multi
Water
Materials
Metals and mining
Industrials
Transport and infrastructure
Equity Sector Technology Policy Key
Source: Mercer
Sensitivity to the climate change risk factors: industry sector levelix (figure4)
6
Additional variability Min Impact
Source: Mercer
Renew
ables
Nuclea
r IT Gas
Health
Consu
mer
discr
etion
ary
Telec
oms
Indus
trials
Consu
mer
staple
s
Finan
cials
Mater
ials
Utilitie
s OilCoa
l
4.0%
3.0%
2.0%
1.0%
0.0%
-1.0%
-2.0%
-3.0%
-4.0%
-5.0%
-6.0%
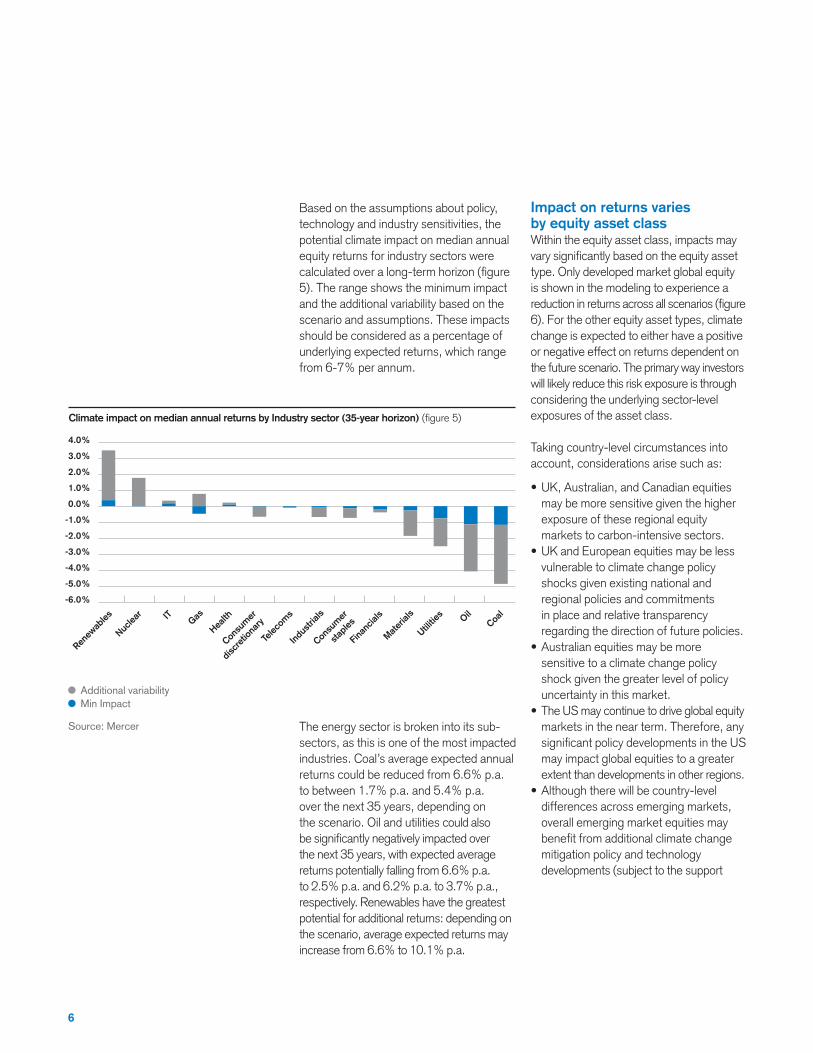
Climate impact on median annual returns by Industry sector (35-year horizon) (figure5)
Based on the assumptions about policy, technology and industry sensitivities, the potential climate impact on median annual equity returns for industry sectors were calculatedoveralong-termhorizon(figure5).Therangeshowstheminimumimpactand the additional variability based on the scenario and assumptions. These impacts should be considered as a percentage of underlying expected returns, which range from 6-7% per annum.
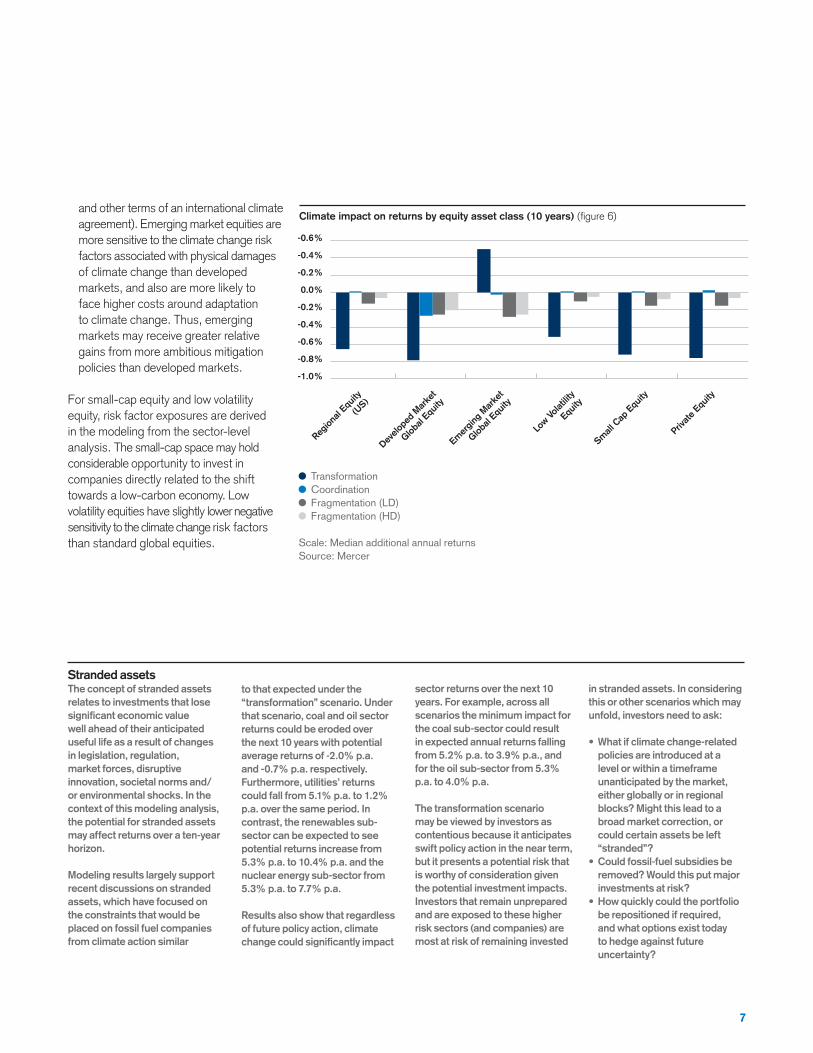
Impact on returns varies by equity asset classWithin the equity asset class, impacts may varysignificantlybasedontheequityassettype. Only developed market global equity is shown in the modeling to experience a reductioninreturnsacrossallscenarios(figure6).Fortheotherequityassettypes,climatechange is expected to either have a positive or negative effect on returns dependent on the future scenario. The primary way investors will likely reduce this risk exposure is through considering the underlying sector-level exposures of the asset class.
Taking country-level circumstances into account, considerations arise such as:
• UK, Australian, and Canadian equities may be more sensitive given the higher exposure of these regional equity markets to carbon-intensive sectors.
• UK and European equities may be less vulnerable to climate change policy shocks given existing national and regional policies and commitments in place and relative transparency regarding the direction of future policies.
• Australian equities may be more sensitive to a climate change policy shock given the greater level of policy uncertainty in this market.
• The US may continue to drive global equity markets in the near term. Therefore, any significantpolicydevelopmentsintheUSmay impact global equities to a greater extent than developments in other regions.
• Although there will be country-level differences across emerging markets, overall emerging market equities may benefitfromadditionalclimatechangemitigation policy and technology developments (subject to the support
The energy sector is broken into its sub-sectors, as this is one of the most impacted industries. Coal’s average expected annual returns could be reduced from 6.6% p.a. to between 1.7% p.a. and 5.4% p.a. over the next 35 years, depending on the scenario. Oil and utilities could also besignificantlynegativelyimpactedoverthe next 35 years, with expected average returns potentially falling from 6.6% p.a. to 2.5% p.a. and 6.2% p.a. to 3.7% p.a., respectively. Renewables have the greatest potential for additional returns: depending on the scenario, average expected returns may increase from 6.6% to 10.1% p.a.
Lorem Sinvel 7
Transformation Coordination Fragmentation (LD) Fragmentation (HD)
Scale: Median additional annual returnsSource: Mercer
-0.6%
-0.4%
-0.2%
0.0%
-0.2%
-0.4%
-0.6%
-0.8%
-1.0%
Climate impact on returns by equity asset class (10 years) (figure6)
Region
al Equ
ity
(US)
Develo
ped
Marke
t
Global
Equity
Emer
ging
Marke
t
Global
Equity
Low Vo
latilit
y
Equity
Small
Cap
Equ
ity
Privat
e Equ
ity
Stranded assets The concept of stranded assets relates to investments that lose significant economic value well ahead of their anticipated useful life as a result of changes in legislation, regulation, market forces, disruptive innovation, societal norms and/or environmental shocks. In the context of this modeling analysis, the potential for stranded assets may affect returns over a ten-year horizon.
Modeling results largely support recent discussions on stranded assets, which have focused on the constraints that would be placed on fossil fuel companies from climate action similar
to that expected under the “transformation” scenario. Under that scenario, coal and oil sector returns could be eroded over the next 10 years with potential average returns of -2.0% p.a. and -0.7% p.a. respectively. Furthermore, utilities’ returns could fall from 5.1% p.a. to 1.2% p.a. over the same period. In contrast, the renewables sub-sector can be expected to see potential returns increase from 5.3% p.a. to 10.4% p.a. and the nuclear energy sub-sector from 5.3% p.a. to 7.7% p.a.
Results also show that regardless of future policy action, climate change could significantly impact
sector returns over the next 10 years. For example, across all scenarios the minimum impact for the coal sub-sector could result in expected annual returns falling from 5.2% p.a. to 3.9% p.a., and for the oil sub-sector from 5.3% p.a. to 4.0% p.a.
The transformation scenario may be viewed by investors as contentious because it anticipates swift policy action in the near term, but it presents a potential risk that is worthy of consideration given the potential investment impacts. Investors that remain unprepared and are exposed to these higher risk sectors (and companies) are most at risk of remaining invested
in stranded assets. In considering this or other scenarios which may unfold, investors need to ask:
• What if climate change-related policies are introduced at a level or within a timeframe unanticipated by the market, either globally or in regional blocks? Might this lead to a broad market correction, or could certain assets be left “stranded”?
• Could fossil-fuel subsidies be removed? Would this put major investments at risk?
• How quickly could the portfolio be repositioned if required, and what options exist today to hedge against future uncertainty?
and other terms of an international climate agreement).Emergingmarketequitiesaremore sensitive to the climate change risk factors associated with physical damages of climate change than developed markets, and also are more likely to face higher costs around adaptation to climate change. Thus, emerging markets may receive greater relative gains from more ambitious mitigation policies than developed markets.
For small-cap equity and low volatility equity, risk factor exposures are derived in the modeling from the sector-level analysis. The small-cap space may hold considerable opportunity to invest in companies directly related to the shift towards a low-carbon economy. Low volatility equities have slightly lower negative sensitivity to the climate change risk factors than standard global equities.
8
Developing carbon efficient equity portfolios
The future of climate change policy and its effects on technology deployment are uncertain, but our scenario analysis shows that whatever the path, stock prices are likely to be affected. Consequently, uncertainty about the future need not be a barrier to action. Rather, investors—both private and institutional—can take advantage of emerging tools to manage carbon risk and protect their portfolios, starting with an assessment of the “carbon footprint” of an equity portfolio as well as the relative carbon intensity of the equity positions and the portfolio as a whole. In fact, many large investors have already pledged to analyze their carbon footprint, and some jurisdictions are actually moving to make this a requirement.x
Measuring the carbon footprint of an equity portfolio starts with data on the amount of carbon emitted by portfolio companies on an annual basis, usually expressed in metrictonnes(MT)orkilograms(kg)ofcarbon dioxide equivalents (CO2e).Thecarbon footprint is the portion of those emissions attributable to the investor’s (i.e.,owner’s)equityposition.Thiscanbecalculated using outstanding shares or market capitalization. For a hypothetical equity portfolio shown in table 2, we use the number of outstanding shares divided
by the issuer’s emissions, resulting in an estimate of the “embedded carbon” in each share that an investor owns. Based on the number of shares held, the carbon footprint of each equity position and the portfolio as a whole is calculated.
No global requirement exists for companies to report their carbon emissions, but most large companies voluntarily self-report in line with a global standard known as the GHG Protocol.xi The quality of disclosure varies, but most large companies provide adequate information and, in some instances, the reported information is backed up by third party assuranceorverification.
In performing carbon footprint analyses, Credit Suisse uses data that focuses on a company’s direct carbon emissions as well as the emissions from the electricity, heat or steam energy that the company purchases to run its operations, known as “scope 1” and “scope 2” emissions, respectively, in the parlance of carbon emissions accounting. Focusing on these emissions allows for meaningful company-to-company comparisons, including cross- sector comparisons, and closely tracks with a company’s exposure to climate policy risk. It omits carbon emissions that may reside upstream or downstream in a company’s value chain, but reliable data and estimates ofthoseemissionsaredifficulttoobtain.
Carbon footprint analysis allows the investor to see carbon hot spots in the portfolio, including company, sector and
regional breakdowns, among other data views. This includes, for example, carbon intensity expressed as emissions per unit of revenue and/or earnings. Empowered with that information, private and institutional investors can consider adjustments to their equity holdings, for example, by adjusting sector weights, tilting toward less carbon- intensive companies within sectors, exiting very carbon-intensive sectors and/or hedging. This reduces the climate policy risk of the portfolio, and, more broadly, helps to address market mispricing of carbon. The lower the carbon- intensity of the holdings, the less susceptible they should be to increasing carbon pricing and/or related regulation.
Low-carbon portfolio optimization may also lead to increased investment exposure tocompaniesorassetsbenefitingfromclimate action strategies, which are more likely to be supported by new technology solutions. In principle, low- carbon portfolios supporttheflowofcapitaltoaresilientlow-carbon economy, which should help to reduce the long-term physical impacts of climate change. For investors who are concerned about climate change and want to invest in a manner that is aligned with their values, low-carbon portfolio optimization may be an effective approach.
Lorem Sinvel 9
Facebook Inc
Tencent Holdings Ltd
Taiwan Semiconductor
Wells Fargo & Co
JPMorgan Chase
Bank of China Ltd
Novartis AG
Novo Nordisk A/S
PfizerInc.
The Walt Disney Co
Amazon.com
McDonald’s Corp
The Boeing Company
UnionPacificCorp
United Parcel Service
Nestle SA
Toyota Motor
Anheuser Busch InBev
Total SA
BP PLC
Schlumberger LTD
NextEra Energy
Electricite de France
Dominion Resources
Bayer AG
BHP Billiton Ltd
BASF
China Mobile
Ltd AT&T Inc
Vodafone Group PLC
FB
TCEHY
TSM
WFC
JPM
BACHY
NVS
NVO
PFE
DIS
AMZN
MCD
BA
UNP
UPS
NESN.VX
TM
BUD
TOT
BP
SLB
NEE
EDF.PA
D
BAYGn.DE
BBL
BASFn.DE
CHL
T
VOD
Technology
Technology
Technology
Financials
Financials
Financials
Health Care
Health Care
Health Care
Consumer Disc
Consumer Disc
Consumer Disc
Industrials
Industrials
Industrials
Consumer Staples
Consumer Staples
Consumer Staples
Energy
Energy
Energy
Utilities
Utilities
Utilities
Materials
Materials
Materials
Telecom
Telecom
Telecom
US
China
Taiwan
US
US
China
Switzerland
Denmark
US
US
US
US
US
US
US
Switzerland
Japan
Belgium
France
UK
US
US
France
US
Germany
Australia
Germany
Hong Kong
US
UK
6.00%
6.00%
6.00%
5.67%
5.67%
5.67%
5.00%
5.00%
5.00%
4.00%
4.00%
4.00%
3.67%
3.67%
3.67%
3.33%
3.33%
3.33%
2.67%
2.67%
2.67%
1.00%
1.00%
1.00%
1.00%
1.00%
1.00%
1.00%
1.00%
1.00%
Low
Low
High
High
High
Low
Medium
High
High
Medium
Low
Medium
High
High
High
High
High
High
High
High
High
Medium
High
Medium
High
High
High
High
High
High
0.17
0.01
0.98
0.27
0.32
0.08
0.72
0.07
0.27
1.05
2.24
2.01
2.41
13.78
14.06
2.45
4.45
3.30
20.83
18.28
1.75
97.62
43.59
56.97
10.13
17.54
24.86
2.85
1.48
1.01
1,150
527
30,149
2,982
2,937
3,997
3,802
665
4,304
4,229
1,808
8,592
6,927
60,588
54,142
11,607
12,983
10,381
122,425
151,654
6,203
102,376
211,132
83,673
7,870
51,479
32,298
4,814
4,583
2,995
1,003,273
Company name Ticker Sector Domicile Portfolio weight
6,878
37,313
30,912
11,113
9,222
52,276
5,281
9,225
15,944
2,877
4,398
3,852
4,745
2,915
3,143
4,020
806
4,279
5,876
8,297
3,536
1,049
4,843
1,469
777
2,934
1,299
1,691
3,094
2,971
# shares held1
Quality of emissions disclosure
Embedded carbon
per share (kg CO2e/
share)
Carbon footprint of
position (kg CO2e)
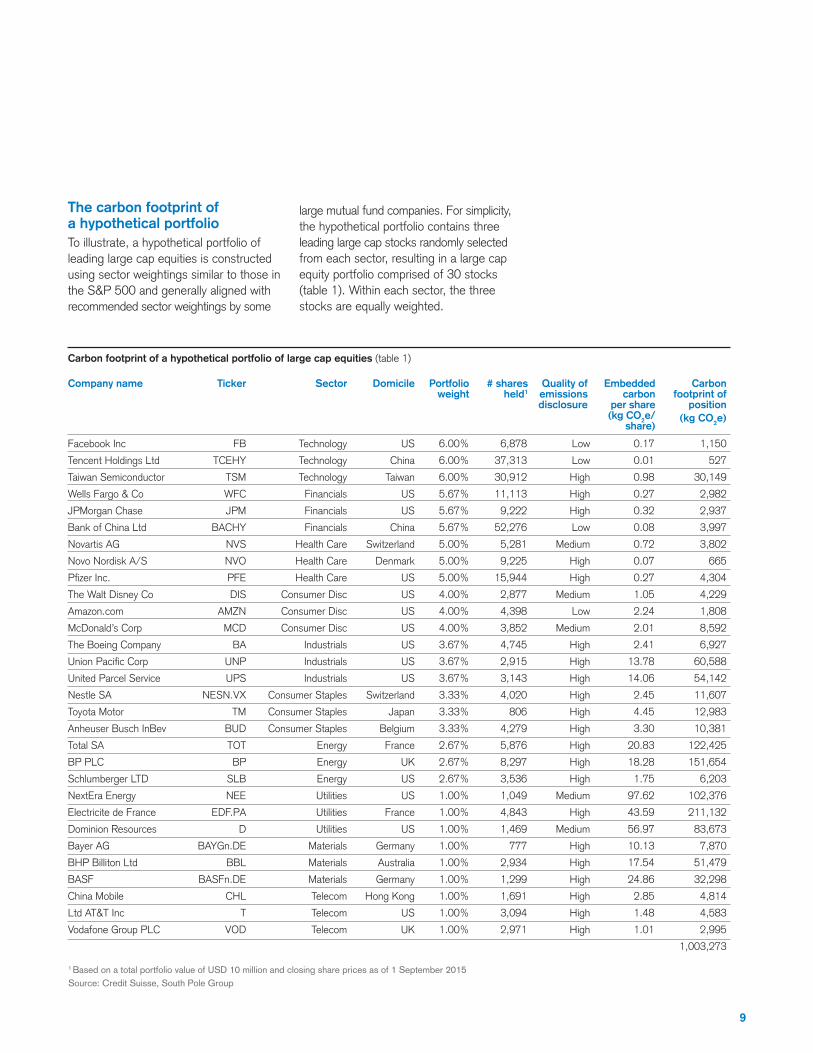
Carbon footprint of a hypothetical portfolio of large cap equities (table1)
1 Based on a total portfolio value of USD 10 million and closing share prices as of 1 September 2015Source: Credit Suisse, South Pole Group
The carbon footprint of a hypothetical portfolioTo illustrate, a hypothetical portfolio of leading large cap equities is constructed using sector weightings similar to those in the S&P 500 and generally aligned with recommended sector weightings by some
large mutual fund companies. For simplicity, the hypothetical portfolio contains three leading large cap stocks randomly selected from each sector, resulting in a large cap equity portfolio comprised of 30 stocks (table1).Withineachsector,thethreestocks are equally weighted.
10
Finan
cials
Tech
nolog
y
Health
care
Consu
mer
discr
ectio
nary
Indus
trials
Energ
y
Utilitie
s
Mater
ials
Telec
om
Consu
mer
staple
45
40
35
30
25
20
15
10
5
0
77% of footprint
Portfolio’s sector weighting Portfolio’s carbon footprint by sector
Scale: Percentage (%)Source: Credit Suisse, South Pole Group
Sector weighting vs. sector carbon footprint for hypothetical portfolio (figure7)
Other, 10%
Taiwan Semiconductor Manufacturing, 3%
BASF, 3%
United Parcel Service Inc., 5%
BHP Billiton, 5%
Union Pacific, 5%
Dominion Resources, 9%
NextEra Energy Inc., 10%
Scale: Percentage of total portfolio carbon footprint Source: Credit Suisse, South Pole Group
Electricite de France, 24%
BP, 14%
Total, 11%
Carbon footprint by company/position, percentage of total portfolio carbon footprint (figure8)
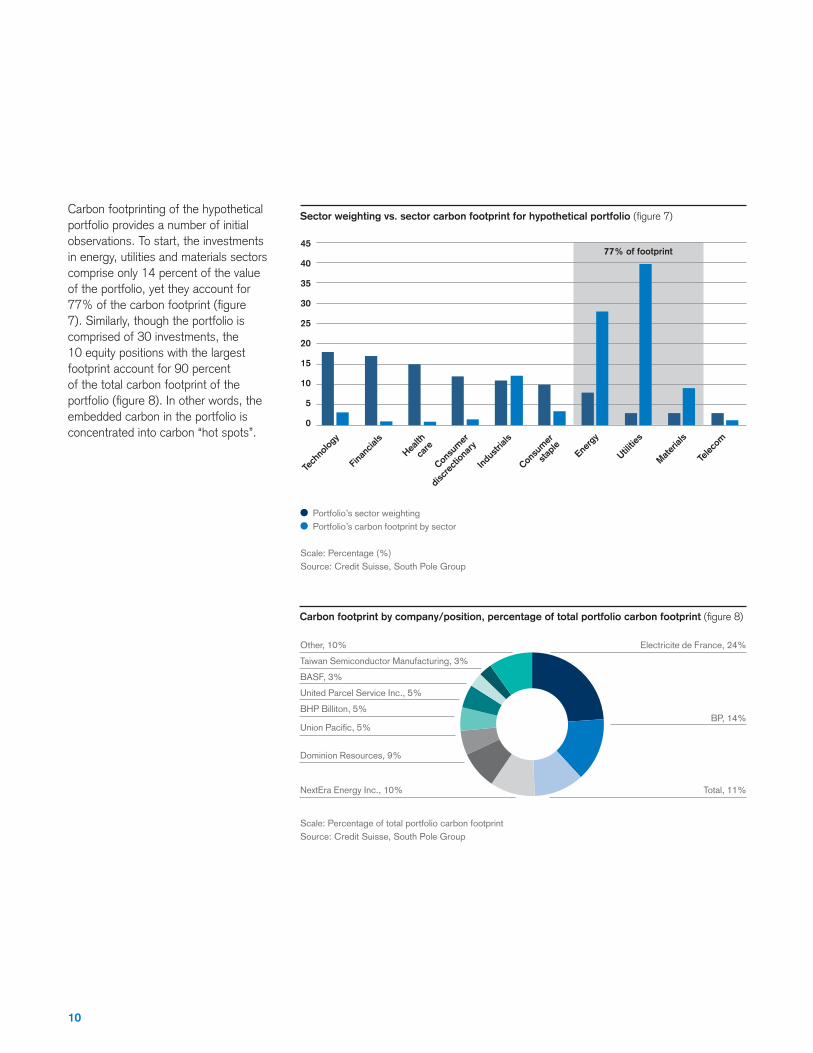
Carbon footprinting of the hypotheticalportfolio provides a number of initialobservations. To start, the investmentsin energy, utilities and materials sectorscomprise only 14 percent of the value of the portfolio, yet they account for 77%ofthecarbonfootprint(figure7).Similarly,thoughtheportfolioiscomprised of 30 investments, the 10 equity positions with the largest footprint account for 90 percent of the total carbon footprint of the portfolio(figure8).Inotherwords,theembedded carbon in the portfolio isconcentrated into carbon “hot spots”.
Lorem Sinvel 11
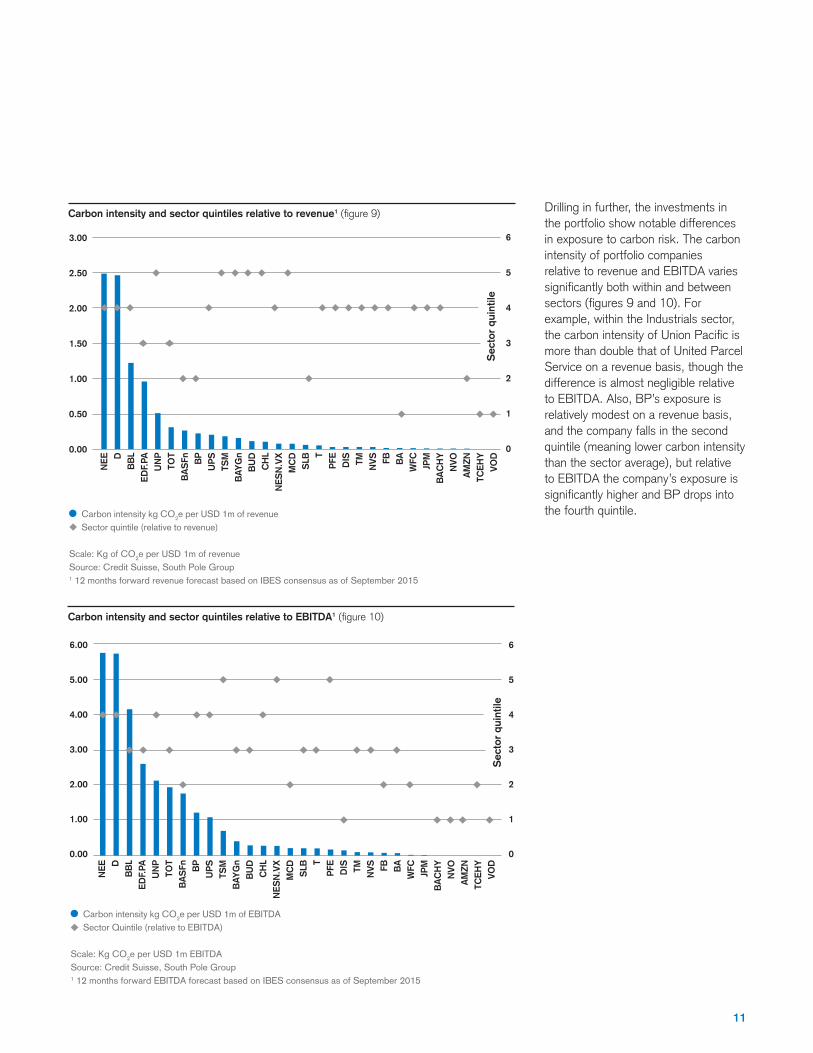
Drilling in further, the investments in the portfolio show notable differences in exposure to carbon risk. The carbon intensity of portfolio companies relative to revenue and EBITDA varies significantlybothwithinandbetweensectors(figures9and10).Forexample, within the Industrials sector, thecarbonintensityofUnionPacificismore than double that of United Parcel Service on a revenue basis, though the difference is almost negligible relative to EBITDA. Also, BP’s exposure is relatively modest on a revenue basis, and the company falls in the second quintile (meaning lower carbon intensity thanthesectoraverage),butrelativeto EBITDA the company’s exposure is significantlyhigherandBPdropsintothe fourth quintile.
3.00
2.50
2.00
1.50
1.00
0.50
0.00
Carbon intensity kg CO2e per USD 1m of revenue Sector quintile (relative to revenue)
Scale: Kg of CO2e per USD 1m of revenue Source: Credit Suisse, South Pole Group1 12 months forward revenue forecast based on IBES consensus as of September 2015
NE
E DB
BL
ED
F.PA
UN
PTO
TB
AS
Fn BP
UP
STS
MB
AYG
nB
UD
CH
LN
ES
N.V
XM
CD
SLB
TP
FE DIS TM N
VS FB BA
WFC JPM
BA
CH
YN
VOA
MZN
TCE
HY
VOD
Sec
tor
quin
tile
6
5
4
3
2
1
0
Carbon intensity kg CO2e per USD 1m of EBITDA Sector Quintile (relative to EBITDA)
Scale: Kg CO2e per USD 1m EBITDASource: Credit Suisse, South Pole Group1 12 months forward EBITDA forecast based on IBES consensus as of September 2015
NE
E DB
BL
ED
F.PA
UN
PTO
TB
AS
Fn BP
UP
STS
MB
AYG
nB
UD
CH
LN
ES
N.V
XM
CD
SLB
TP
FE DIS TM N
VS FB BA
WFC JPM
BA
CH
YN
VOA
MZN
TCE
HY
VOD
6.00
5.00
4.00
3.00
2.00
1.00
0.00
Sec
tor
quin
tile
6
5
4
3
2
1
0
Carbon intensity and sector quintiles relative to revenue1 (figure9)
Carbon intensity and sector quintiles relative to EBITDA1 (figure10)
12
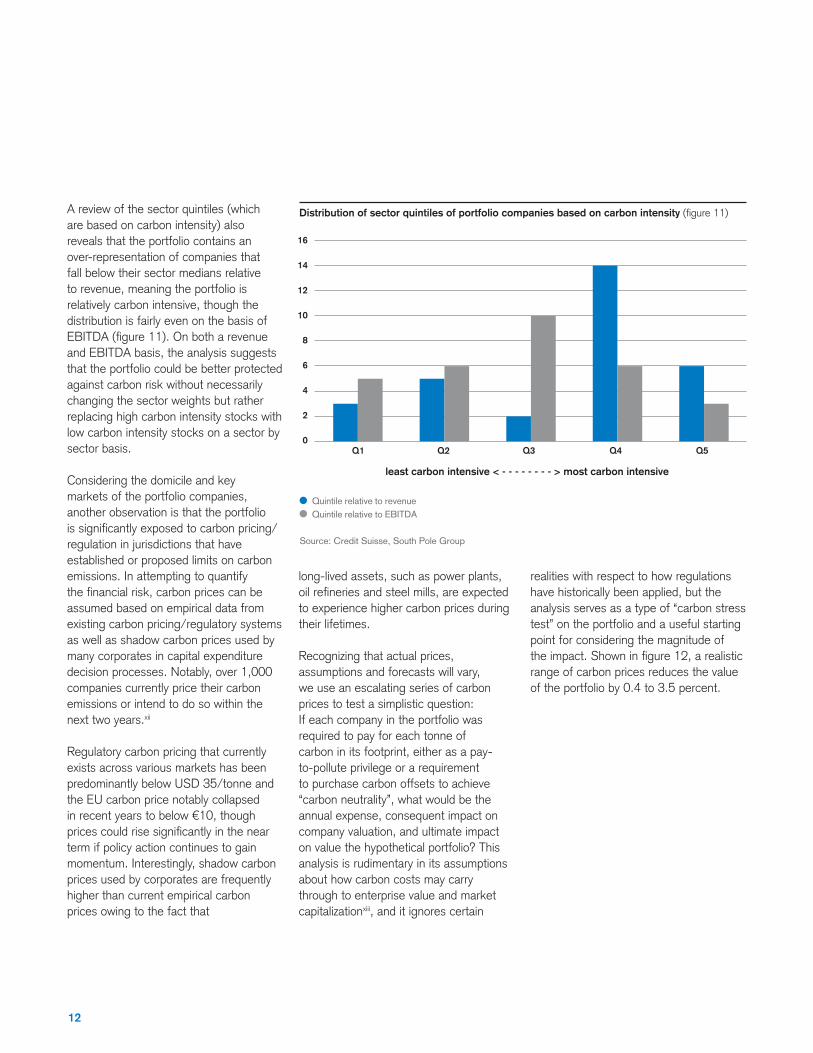
A review of the sector quintiles (which arebasedoncarbonintensity)alsoreveals that the portfolio contains an over-representation of companies that fall below their sector medians relative to revenue, meaning the portfolio is relatively carbon intensive, though the distribution is fairly even on the basis of EBITDA(figure11).Onbotharevenueand EBITDA basis, the analysis suggests that the portfolio could be better protected against carbon risk without necessarily changing the sector weights but rather replacing high carbon intensity stocks with low carbon intensity stocks on a sector by sector basis.
Considering the domicile and key markets of the portfolio companies, another observation is that the portfolio issignificantlyexposedtocarbonpricing/regulation in jurisdictions that have established or proposed limits on carbon emissions. In attempting to quantify thefinancialrisk,carbonpricescanbeassumed based on empirical data from existing carbon pricing/regulatory systems as well as shadow carbon prices used by many corporates in capital expenditure decision processes. Notably, over 1,000 companies currently price their carbon emissions or intend to do so within the next two years.xii
Regulatory carbon pricing that currently exists across various markets has been predominantly below USD 35/tonne and the EU carbon price notably collapsed in recent years to below €10, though pricescouldrisesignificantlyinthenearterm if policy action continues to gain momentum. Interestingly, shadow carbon prices used by corporates are frequently higher than current empirical carbon prices owing to the fact that
long-lived assets, such as power plants, oilrefineriesandsteelmills,areexpectedto experience higher carbon prices during their lifetimes.
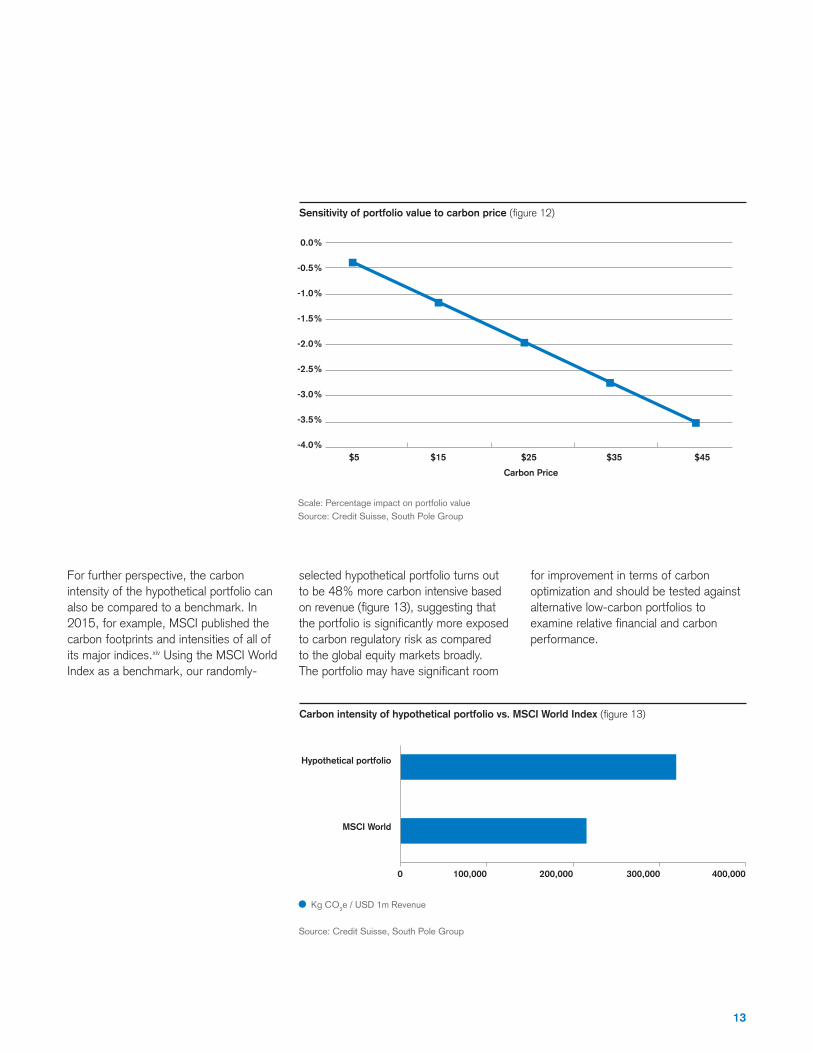
Recognizing that actual prices, assumptions and forecasts will vary, we use an escalating series of carbon prices to test a simplistic question: If each company in the portfolio was required to pay for each tonne of carbon in its footprint, either as a pay-to-pollute privilege or a requirement to purchase carbon offsets to achieve “carbon neutrality”, what would be the annual expense, consequent impact on company valuation, and ultimate impact on value the hypothetical portfolio? This analysis is rudimentary in its assumptions about how carbon costs may carry through to enterprise value and market capitalizationxiii, and it ignores certain
realities with respect to how regulations have historically been applied, but the analysis serves as a type of “carbon stress test” on the portfolio and a useful starting point for considering the magnitude of theimpact.Showninfigure12,arealisticrange of carbon prices reduces the value of the portfolio by 0.4 to 3.5 percent.
Quintile relative to revenue Quintile relative to EBITDA
Source: Credit Suisse, South Pole Group
16
14
12
10
8
6
4
2
0Q1 Q2 Q3 Q4 Q5
least carbon intensive < - - - - - - - - > most carbon intensive
Distribution of sector quintiles of portfolio companies based on carbon intensity (figure11)
Lorem Sinvel 13
Scale: Percentage impact on portfolio valueSource: Credit Suisse, South Pole Group
0.0%
-0.5%
-1.0%
-1.5%
-2.0%
-2.5%
-3.0%
-3.5%
-4.0%$5 $15 $25 $35 $45
Carbon Price
For further perspective, the carbon intensity of the hypothetical portfolio can also be compared to a benchmark. In 2015, for example, MSCI published the carbon footprints and intensities of all of its major indices.xiv Using the MSCI World Index as a benchmark, our randomly-
selected hypothetical portfolio turns out to be 48% more carbon intensive based onrevenue(figure13),suggestingthattheportfolioissignificantlymoreexposedto carbon regulatory risk as compared to the global equity markets broadly. Theportfoliomayhavesignificantroom
for improvement in terms of carbon optimization and should be tested against alternative low-carbon portfolios to examinerelativefinancialandcarbonperformance.
Kg CO2e / USD 1m Revenue
Source: Credit Suisse, South Pole Group
Hypothetical portfolio
MSCI World
0 100,000 200,000 300,000 400,000
Sensitivity of portfolio value to carbon price (figure12)
Carbon intensity of hypothetical portfolio vs. MSCI World Index (figure13)
14
Conclusion
Carbon regulatory risk is now established in many key jurisdictions and will be an increasingly relevant return variable over time. The United Nations Climate Change ConferenceinParis(COP21)isanimportant reminder of persistent efforts at both national and global levels to shift to low-carbon energy supplies. Regardless of the outcome of that conference, policy action on climate change—and the risks and opportunities that it creates—will continue into the foreseeable future.We recommend that investors begin screening their equity portfolios for carbon intensity.Sufficientcarbondataandtoolsexist to run a set of carbon analytics on an investment portfolio, considering, for example:
• the portfolio’s carbon footprint, • carbon intensity of the equity
investments relative to key financialmetrics,
•identificationofcarbonhotspots,• carbon stress tests based on various
carbon pricing scenarios, and • portfolio performance relative to
low-carbon portfolio alternatives.
Empowered with the information from carbon analytics, investors may then evaluate different approaches to carbon optimization, for example, adjusting sector weights, tilting toward less carbon-intensive companies within sectors, exiting very carbon-intensive sectors and/or hedging.

Lorem Sinvel 15
AuthorsAndrew Aulisi, Sustainability Affairs, Credit Suisse
Daniel Schuster, Equity Research, Credit Suisse
AcknowledgementsFor helpful support and insights in the
development of this research brief, the authors
wish to acknowledge: Bruno Bischoff (Credit
Suisse),RenéBuholzer(CreditSuisse),Fredrik
Fogde(SouthPoleGroup),MaximilianHorster
(SouthPoleGroup),FabianHuwyler(Credit
Suisse),SandraMcCullough(CreditSuisse)
andJasonSwinbourne(CreditSuisse).
Sections of this research brief were developed in
part or in whole by Mercer as part of its Investing
in a Time of Climate Change research report,
published in 2015. Special acknowledgements
are made to Alex Bernhardt, Karen Lockridge
and Jillian Reid of Mercer.
This research brief has been developed jointly
between Credit Suisse Sustainability Affairs and
Equity Research. Any views or opinions expressed
are solely those of the authors.
Endnotesi WorldEconomicForum(2015)Global Risks Report 2015
ii WorldBankGroup(2014)State and Trends of Carbon Pricing
iii http://newsroom.unfccc.int/unfccc-newsroom/major-oil-companies-letter-to-un/
iv http://globalinvestorcoalition.org/investor-statements-on-climate-change/
v https://medium.com/@ClimateCEOs/open-letter-from-global-ceos-to-world-leaders-urging-
concrete-climate-action- e4b12689cddf
vi Mercer(2015) Investing in a Time of Climate Change
vii TheMercerstudyincludedfourriskfactors:Policy,Technology,ResourceAvailabilityand(physical)
Impact. The results of the analyses integrate all of these factors are not based solely on Policy and
Technology. However, this research brief only discusses the results in relation to Policy and Technology.
viiiCreditSuisse,WorldWildlifeFund&McKinsey(2011) Transition to a Low-Carbon Economy
ix BasedonMSCIGlobalIndustryClassificationSystem
x See Montreal Carbon Pledge and mandatory carbon reporting by institutional investors in France.
xi See http://www.ghgprotocol.org.
xii CarbonDisclosureProject(2015)Putting a price on risk: Carbon pricing in the corporate world.
CDP Report 2015 v.1.1
xiii To test the impact of a carbon price on the hypothetical portfolio, the calculation relies on number of
rudimentaryassumptionssuchas:Itisbasedonenterprisevalue(EV)dividedbyEBITDA,whichmaynot
be an appropriate valuation approach for all companies; It assumes that the EV impact translates directly
into a reduction into market capitalization on a 1:1 basis, meaning debt and cash levels are assumed to
be a constant; It does not account for the tax reduction that would be associated with the carbon expense;
and It does not account for the fact that some companies are already paying for carbon emissions
either via a compliance market or on a voluntary basis.
xiv See: https://www.msci.com/index-carbon-footprint-metrics
This document was produced by Credit Suisse AG, a bank organized under the lawsofSwitzerland,and/oritsaffiliates(collectively“CS”).CSprovidesnoguarantee with regard to its content and completeness and does not accept any liability for losses which might arise from making use of this information. The opinions expressed in this document are those of CS at the time of writing and are subject to change at any time without notice. This document is provided for information purposes only and is for the exclusive use of the recipient. Nothing in this document shall constitute an offer or a solicitation of an offer to buy or sell any products or services, including but notlimitedtoanysecurities,financialinstruments or other investments or investment advice, and does not release the recipient from exercising his/her own judgment.
Nothing in this material constitutes investment, legal, accounting or tax advice, or a representation that any investment or strategy is suitable or appropriate to your individual circumstances, or otherwise constitutes a personal recommendation to you. The price and value of investments mentioned and any income that might accruemayfluctuateandmayfallorrise.Any reference to past performance is not a guide to the future.
The information and analysis contained in this publication have been compiled or arrived at from sources believed to be reliable but authors do not make any representation as to their accuracy or completeness and does not accept liability for any loss arising from the use hereof. CS may have acted upon the information and analysis contained in this publication before being made available to you. Before entering into any transaction, you should consider the suitability of the transaction to your particular circumstances and independently review (with your
professionaladvisersasnecessary)thespecificfinancialrisksaswellaslegal,regulatory, credit, tax and accounting consequences.
Unlessotherwisespecified,theterm“Credit Suisse” is the global marketing brand name for the investment banking, private banking and wealth management services offered by Credit Suisse Group AGsubsidiariesandaffiliatesworldwide.Credit Suisse Group AG is headquartered in Zurich. Each Credit Suisse Group AG entity is subject to distinct regulatory requirements and certain products and services may not be available in certain countries or to all customers. No product or service will be offered where unlawful under applicable law.
This document is issued and distributed in the United States by Credit Suisse Securities(USA)LLC,aU.S.registeredbroker-dealer; in Canada by Credit Suisse Securities(Canada),Inc.;andinBrazilby Banco de Investimentos Credit Suisse (Brasil)S.A.Thisdocumentisdistributedin Switzerland by Credit Suisse AG, a Swiss bank. Credit Suisse is authorized and regulated by the Swiss Financial MarketSupervisoryAuthority(FINMA).This document is issued and distributed inEurope(exceptSwitzerland)byCreditSuisse(UK)LimitedandCreditSuisseSecurities(Europe)Limited,London.CreditSuisseSecurities(Europe)Limited,LondonandCreditSuisse(UK)Limited, both authorized and regulated by the Financial Conduct Authority, are associated but independent legal and regulated entities within Credit Suisse. The protections made available by the UK’s Financial Conduct Authority for private customers do not apply to investments or services provided by a person outside the UK, nor will the Financial Services Compensation Scheme be available if the issuer of the investment fails to meet its obligations.
This document is distributed in Guernsey byCreditSuisse(Guernsey)Limited,an independent legal entity registered in Guernsey under 15197, with its registered address at Helvetia Court, Les Echelons, South Esplanade, St Peter Port,Guernsey.CreditSuisse(Guernsey)Limited is wholly owned by Credit Suisse and is regulated by the Guernsey Financial Services Commission. Copies of the latest audited accounts are available on request. This document is distributed in Jersey byCreditSuisse(Guernsey)Limited,Jersey Branch, which is regulated by the Jersey Financial Services Commission. The business address of Credit Suisse (Guernsey)Limited,JerseyBranch,in Jersey is: TradeWind House, 22 Esplanade, St Helier, Jersey JE2 3QA. This document has been issued in Asia-Pacificbywhicheverofthefollowingisthe appropriately authorised entity of the relevant jurisdiction: in Hong Kong by CreditSuisse(HongKong)Limited,acorporation licensed with the Hong Kong Securities and Futures Commission or Credit Suisse Hong Kong branch, an Authorized Institution regulated by the Hong Kong Monetary Authority and a Registered Institution regulated by the Securities and Futures Ordinance (Chapter571oftheLawsofHongKong);in Japan by Credit Suisse Securities (Japan)Limited;elsewhereinAsia/Pacificbywhicheverofthefollowingis the appropriately authorized entity in the relevant jurisdiction: Credit Suisse Equities(Australia)Limited,CreditSuisseSecurities(Thailand)Limited,CreditSuisseSecurities(Malaysia)SdnBhd,Credit Suisse AG, Singapore Branch, and elsewhere in the world by the relevant authorizedaffiliateoftheabove.
This document and its content may not be reproduced either in part or in full, altered in any way, transmitted to or distributed to any other party without the written permission of CS.


Copyright©2015CreditSuisseGroupAGand/oritsaffiliatedcompanies.Allrightsreserved.