investment analysis picking the right projects - nyuadamodar/pdfiles/ovhds/inv.pdf · what is a...
TRANSCRIPT
Asw
ath Dam
odaran55
Picking the R
ight Projects:
Investment A
nalysis
Asw
ath Dam
odaran

Asw
ath Dam
odaran56
First P
rinciples
Invest in projects that yield a return greater than the minim
umacceptable hurdle rate.•
The hurdle rate should be higher for riskier projects and reflect the
financing mix used - ow
ners’ funds (equity) or borrowed m
oney(debt)
•R
eturns on projects should be measured based on cash flow
s generatedand the tim
ing of these cash flows; they should also consider both positive
and negative side effects of these projects.
Choose a financing m
ix that minim
izes the hurdle rate and matches the
assets being financed.
If there are not enough investments that earn the hurdle rate, return the
cash to stockholders.•
The form
of returns - dividends and stock buybacks - will depend upon
the stockholders’ characteristics.
Asw
ath Dam
odaran57
What is a investm
ent or a project?
Any decision that requires the use of resources (financial or otherw
ise)is a project.
Broad strategic decisions•
Entering new
areas of business
•E
ntering new m
arkets
•A
cquiring other companies
Tactical decisions
Managem
ent decisions•
The product m
ix to carry
•T
he level of inventory and credit terms
Decisions on delivering a needed service
•L
ease or buy a distribution system
•C
reating and delivering a managem
ent information system

Asw
ath Dam
odaran58
The notion of a benchm
ark
Since financial resources are finite, there is a hurdle that projects haveto cross before being deem
ed acceptable.
This hurdle w
ill be higher for riskier projects than for safer projects.
A sim
ple representation of the hurdle rate is as follows:
Hurdle rate =
R
iskless Rate +
Risk Prem
ium
The tw
o basic questions that every risk and return model in finance
tries to answer are:
•H
ow do you m
easure risk?
•H
ow do you translate this risk m
easure into a risk premium
?

Asw
ath Dam
odaran59
What is R
isk?
Risk, in traditional term
s, is viewed as a ‘negative’. W
ebster’sdictionary, for instance, defines risk as “exposing to danger or hazard”.T
he Chinese sym
bols for risk, reproduced below, give a m
uch betterdescription of risk
The first sym
bol is the symbol for “danger”, w
hile the second is thesym
bol for “opportunity”, making risk a m
ix of danger andopportunity.

Asw
ath Dam
odaran60
The C
apital Asset P
ricing Model
Uses variance as a m
easure of risk
Specifies that a portion of variance can be diversified away, and that is
only the non-diversifiable portion that is rewarded.
Measures the non-diversifiable risk w
ith beta, which is standardized
around one.
Translates beta into expected return -
Expected R
eturn = R
iskfree rate + B
eta * Risk Prem
ium
Works as w
ell as the next best alternative in most cases.

Asw
ath Dam
odaran61
The M
ean-Variance F
ramew
ork
The variance on any investm
ent measures the disparity betw
een actualand expected returns.
Expected R
eturn
Low
Variance Investm
ent
High V
ariance Investment

Asw
ath Dam
odaran62
The Im
portance of Diversification: R
isk Types
The risk (variance) on any individual investm
ent can be broken down
into two sources. Som
e of the risk is specific to the firm, and is called
firm-specific, w
hereas the rest of the risk is market w
ide and affects allinvestm
ents.
The risk faced by a firm
can be fall into the following categories –
•(1) Project-specific; an individual project m
ay have higher or lower cash
flows than expected.
•(2) C
ompetitive R
isk, which is that the earnings and cash flow
s on aproject can be affected by the actions of com
petitors.
•(3) Industry-specific R
isk, which covers factors that prim
arily impact the
earnings and cash flows of a specific industry.
•(4) International R
isk, arising from having som
e cash flows in currencies
other than the one in which the earnings are m
easured and stock is priced
•(5) M
arket risk, which reflects the effect on earnings and cash flow
s ofm
acro economic factors that essentially affect all com
panies

Asw
ath Dam
odaran63
The E
ffects of Diversification
Firm-specific risk can be reduced, if not elim
inated, by increasing thenum
ber of investments in your portfolio (i.e., by being diversified).
Market-w
ide risk cannot. This can be justified on either econom
ic orstatistical grounds.
On econom
ic grounds, diversifying and holding a larger portfolioelim
inates firm-specific risk for tw
o reasons-•
(a) Each investm
ent is a much sm
aller percentage of the portfolio, muting
the effect (positive or negative) on the overall portfolio.
•(b) Firm
-specific actions can be either positive or negative. In a largeportfolio, it is argued, these effects w
ill average out to zero. (For everyfirm
, where som
ething bad happens, there will be som
e other firm, w
heresom
ething good happens.)
Asw
ath Dam
odaran64
The R
ole of the Marginal Investor
The m
arginal investor in a firm is the investor w
ho is most likely to be
the buyer or seller on the next trade.
Generally speaking, the m
arginal investor in a stock has to own a lot of
stock and also trade a lot.
Since trading is required, the largest investor may not be the m
arginalinvestor, especially if he or she is a founder/m
anager of the firm(M
ichael Dell at D
ell Com
puters or Bill G
ates at Microsoft)
In all risk and return models in finance, w
e assume that the m
arginalinvestor is w
ell diversified.

Asw
ath Dam
odaran65
The M
arket Portfolio
Assum
ing diversification costs nothing (in terms of transactions costs),
and that all assets can be traded, the limit of diversification is to hold a
portfolio of every single asset in the economy (in proportion to m
arketvalue). T
his portfolio is called the market portfolio.
Individual investors will adjust for risk, by adjusting their allocations
to this market portfolio and a riskless asset (such as a T
-Bill)
Preferred risk level
Allocation decision
No risk
100% in T
-Bills
Some risk
50% in T
-Bills; 50%
in Market Portfolio;
A little m
ore risk25%
in T-B
ills; 75% in M
arket Portfolio
Even m
ore risk100%
in Market Portfolio
A risk hog..
Borrow
money; Invest in m
arket portfolio;
Every investor holds som
e combination of the risk free asset and the
market portfolio.

Asw
ath Dam
odaran66
The R
isk of an Individual Asset
The risk of any asset is the risk that it adds to the m
arket portfolio
Statistically, this risk can be measured by how
much an asset m
ovesw
ith the market (called the covariance)
Beta is a standardized m
easure of this covariance
Beta is a m
easure of the non-diversifiable risk for any asset can bem
easured by the covariance of its returns with returns on a m
arketindex, w
hich is defined to be the asset's beta.
The cost of equity w
ill be the required return,
Cost of E
quity = R
f + E
quity Beta * (E
(Rm ) - R
f )w
here,
Rf =
Riskfree rate
E(R
m ) = E
xpected Return on the M
arket Index
Asw
ath Dam
odaran67
Limitations of the C
AP
M
1. The m
odel makes unrealistic assum
ptions
2. The param
eters of the model cannot be estim
ated precisely- D
efinition of a market index
- Firm m
ay have changed during the 'estimation' period'
3. The m
odel does not work w
ell- If the m
odel is right, there should be a linear relationship betw
een returns and betas
the only variable that should explain returns is betas
- The reality is that
the relationship between betas and returns is w
eak
Other variables (size, price/book value) seem
to explain differences in returnsbetter.

Asw
ath Dam
odaran68
Alternatives to the C
AP
M
Th
e risk in an
investm
ent can
be m
easured
by th
e variance in
actual retu
rns aro
un
d an
exp
ected retu
rnE(R
)
Riskless Investm
entLow
Risk Investm
entH
igh Risk Investm
ent
E(R
)E
(R)
Risk that is specific to investm
ent (Firm
Specific)
Risk that affects all investm
ents (Market R
isk)C
an be diversified away in a diversified portfolio
Cannot be diversified aw
ay since most assets
1. each investment is a sm
all proportion of portfolioare affected by it.
2. risk averages out across investments in portfolio
Th
e marg
inal in
vestor is assu
med
to h
old
a “diversified
” po
rtfolio
. Th
us, o
nly m
arket risk will
be rew
arded
and
priced
.
Th
e CA
PM
Th
e AP
MM
ulti-F
actor M
od
elsP
roxy M
od
elsIf there is 1. no private inform
ation2. no transactions costthe optim
al diversified portfolio includes everytraded asset. E
veryonew
ill hold this market portfolio
Market R
isk = Risk
add
ed b
y any in
vestmen
t to
the m
arket po
rtfolio
:
If there are no arbitrage opportunities then the m
arket risk ofany asset m
ust be captured by betas relative to factors that affect all investm
ents.M
arket Risk = R
isk exp
osu
res of an
y asset to
market
factors
Beta of asset relative t o
Market portfolio (from
a regression)
Betas of asset relative
to unspecified market
factors (from a factor
analysis)
Since m
arket risk affectsm
ost or all investments,
it must com
e from
macro econom
ic factors.M
arket Risk = R
isk exp
osu
res of an
y asset to
macro
eco
no
mic facto
rs.
Betas of assets relativ e
to specified macro
economic factors (from
a regression)
In an efficient market,
differences in returnsacross long periods m
ustbe due to m
arket riskdifferences. Looking forvariables correlated w
ithreturns should then give us proxies for this risk.M
arket Risk =
Cap
tured
by th
e P
roxy V
ariable(s)
Equation relating
returns to proxy variables (from
aregression)
Step
1: Defin
ing
Risk
Step
2: Differen
tiating
betw
een R
eward
ed an
d U
nrew
arded
Risk
Step
3: Measu
ring
Market R
isk

Asw
ath Dam
odaran69
Identifying the Marginal Investor in your firm
…
Percent of Stock held by
Institutions
Percent of Stock held by
Insiders
Marginal Investor
High
Low
Institutional Investora
High
High
Institutional Investor, with
insider influence
Low
High (held by
founder/manager of firm
)
Insider (often undiversified)
Low
High (held by w
ealthy
individual investor)
Wealthy individual
investor, fairly diversified
Low
Low
Sm
all individual investor
with restricted
diversification

Asw
ath Dam
odaran70
Analyzing D
isney’s Stockholders
Percent of stock held by insiders = 1%
Percent of stock held by institutions = 62%
Who is the m
arginal investor in Disney?
Asw
ath Dam
odaran71
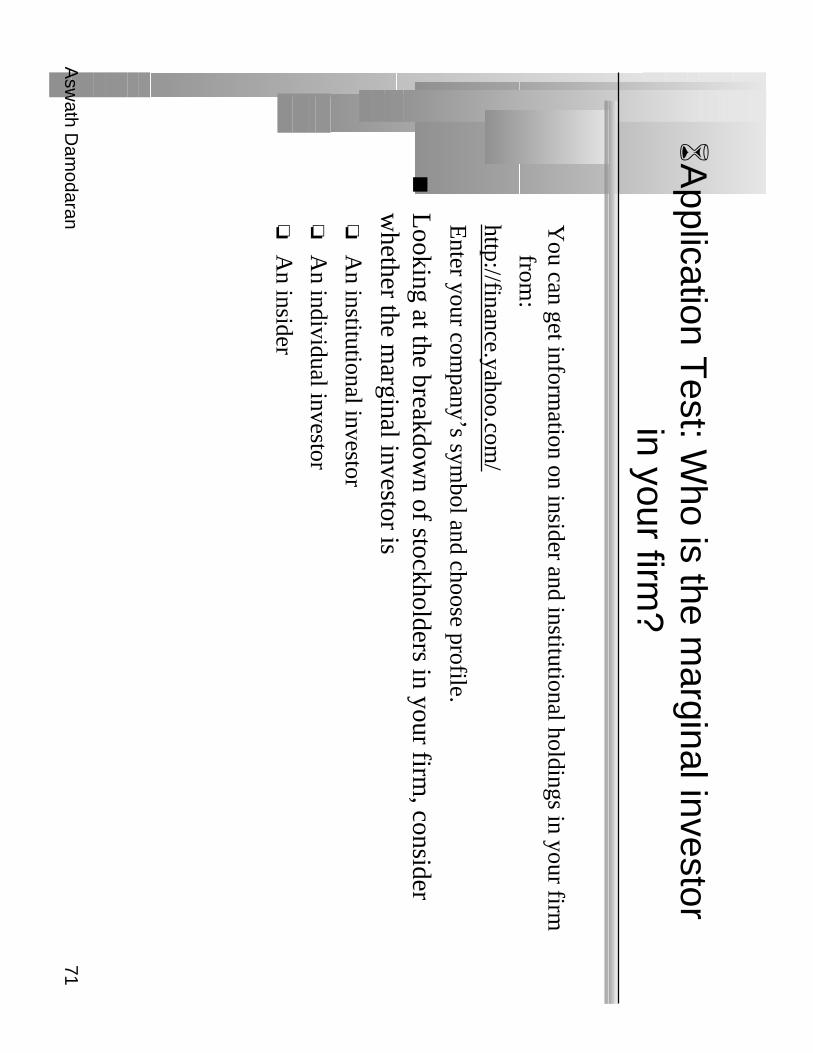
Application T
est: Who is the m
arginal investorin your firm
?
You can get inform
ation on insider and institutional holdings in your firmfrom
:
http://finance.yahoo.com/
Enter your com
pany’s symbol and choose profile.
Looking at the breakdow
n of stockholders in your firm, consider
whether the m
arginal investor isA
n institutional investor
An individual investor
An insider
Asw
ath Dam
odaran72
Inputs required to use the CA
PM
-
(a) the current risk-free rate
(b) the expected market risk prem
ium (the prem
ium expected for investing
in risky assets over the riskless asset)
(c) the beta of the asset being analyzed.

Asw
ath Dam
odaran73
The R
iskfree Rate and T
ime H
orizon
On a riskfree asset, the actual return is equal to the expected return.
Therefore, there is no variance around the expected return.
For an investment to be riskfree, i.e., to have an actual return be equal
to the expected return, two conditions have to be m
et –•
There has to be no default risk, w
hich generally implies that the security
has to be issued by the government. N
ote, however, that not all
governments can be view
ed as default free.
•T
here can be no uncertainty about reinvestment rates, w
hich implies that
it is a zero coupon security with the sam
e maturity as the cash flow
beinganalyzed.
Asw
ath Dam
odaran74
Riskfree R
ate in Practice
The riskfree rate is the rate on a zero coupon governm
ent bondm
atching the time horizon of the cash flow
being analyzed.
Theoretically, this translates into using different riskfree rates for each
cash flow - the 1 year zero coupon rate for the cash flow
in year 1, the2-year zero coupon rate for the cash flow
in year 2 ...
Practically speaking, if there is substantial uncertainty about expectedcash flow
s, the present value effect of using time varying riskfree rates
is small enough that it m
ay not be worth it.

Asw
ath Dam
odaran75
The B
ottom Line on R
iskfree Rates
Using a long term
government rate (even on a coupon bond) as the
riskfree rate on all of the cash flows in a long term
analysis will yield a
close approximation of the true value.
For short term analysis, it is entirely appropriate to use a short term
government security rate as the riskfree rate.
If the analysis is being done in real terms (rather than nom
inal terms)
use a real riskfree rate, which can be obtained in one of tw
o ways –
•from
an inflation-indexed government bond, if one exists
•set equal, approxim
ately, to the long term real grow
th rate of the economy
in which the valuation is being done.
Data Source: Y
ou can get riskfree rates for the US in a num
ber ofsites. T
ry http://ww
w.bloom
berg.com/m
arkets.
Asw
ath Dam
odaran76
Measurem
ent of the risk premium
The risk prem
ium is the prem
ium that investors dem
and for investingin an average risk investm
ent, relative to the riskfree rate.
As a general proposition, this prem
ium should be
•greater than zero
•increase w
ith the risk aversion of the investors in that market
•increase w
ith the riskiness of the “average” risk investment

Asw
ath Dam
odaran77
What is your risk prem
ium?
Assum
e that stocks are the only risky assets and that you are offered two
investment options:
•a riskless investm
ent (say a Governm
ent Security), on which you can m
ake 5%
•a m
utual fund of all stocks, on which the returns are uncertain
How
much of an expected return w
ould you demand to shift your m
oney from the
riskless asset to the mutual fund?
Less than 5%
Betw
een 5 - 7%
Betw
een 7 - 9%
Betw
een 9 - 11%
Betw
een 11- 13%
More than 13%
Check your prem
ium against the survey prem
ium on m
y web site.
Asw
ath Dam
odaran78
Risk A
version and Risk P
remium
s
If this were the capital m
arket line, the risk premium
would be a
weighted average of the risk prem
iums dem
anded by each and everyinvestor.
The w
eights will be determ
ined by the magnitude of w
ealth that eachinvestor has. T
hus, Warren B
ufffet’s risk aversion counts more
towards determ
ining the “equilibrium” prem
ium than yours’ and m
ine.
As investors becom
e more risk averse, you w
ould expect the“equilibrium
” premium
to increase.

Asw
ath Dam
odaran79
Risk P
remium
s do change..
Go back to the previous exam
ple. Assum
e now that you are m
aking thesam
e choice but that you are making it in the afterm
ath of a stockm
arket crash (it has dropped 25% in the last m
onth). Would you
change your answer?
I would dem
and a larger premium
I would dem
and a smaller prem
ium
I would dem
and the same prem
ium

Asw
ath Dam
odaran80
Estim
ating Risk P
remium
s in Practice
Survey investors on their desired risk premium
s and use the averageprem
ium from
these surveys.
Assum
e that the actual premium
delivered over long time periods is
equal to the expected premium
- i.e., use historical data
Estim
ate the implied prem
ium in today’s asset prices.

Asw
ath Dam
odaran81
The S
urvey Approach
Surveying all investors in a market place is im
practical.
How
ever, you can survey a few investors (especially the larger
investors) and use these results. In practice, this translates into surveysof m
oney managers’ expectations of expected returns on stocks over
the next year.
The lim
itations of this approach are:•
there are no constraints on reasonability (the survey could producenegative risk prem
iums or risk prem
iums of 50%
)
•they are extrem
ely volatile
•they tend to be short term
; even the longest surveys do not go beyond oneyear

Asw
ath Dam
odaran82
The H
istorical Prem
ium A
pproach
This is the default approach used by m
ost to arrive at the premium
touse in the m
odel
In most cases, this approach does the follow
ing•
it defines a time period for the estim
ation (1926-Present, 1962-Present....)
•it calculates average returns on a stock index during the period
•it calculates average returns on a riskless security over the period
•it calculates the difference betw
een the two
•and uses it as a prem
ium looking forw
ard
The lim
itations of this approach are:•
it assumes that the risk aversion of investors has not changed in a
systematic w
ay across time. (T
he risk aversion may change from
year toyear, but it reverts back to historical averages)
•it assum
es that the riskiness of the “risky” portfolio (stock index) has notchanged in a system
atic way across tim
e.
Asw
ath Dam
odaran83
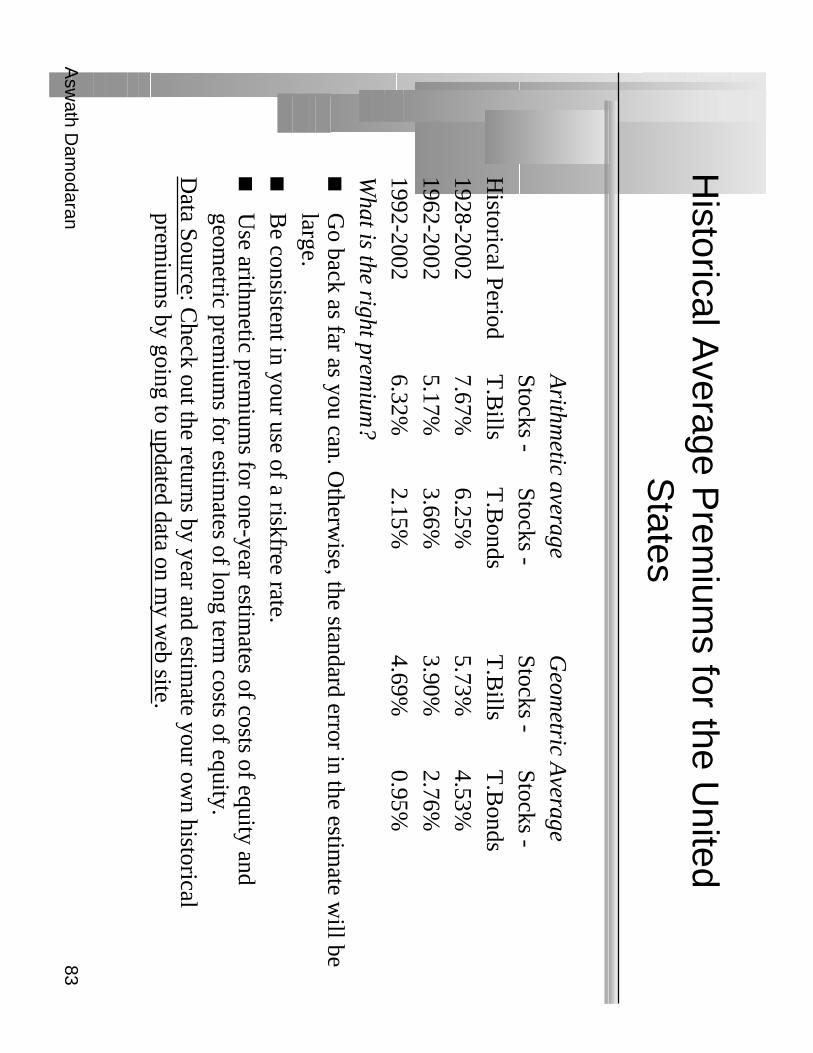
Historical A
verage Prem
iums for the U
nitedS
tates
Arithm
etic averageG
eometric A
verageStocks -
Stocks -Stocks -
Stocks -H
istorical PeriodT
.Bills
T.B
ondsT
.Bills
T.B
onds1928-2002
7.67%6.25%
5.73%4.53%
1962-20025.17%
3.66%3.90%
2.76%1992-2002
6.32%2.15%
4.69%0.95%
What is the right prem
ium?
Go back as far as you can. O
therwise, the standard error in the estim
ate will be
large.B
e consistent in your use of a riskfree rate.U
se arithmetic prem
iums for one-year estim
ates of costs of equity andgeom
etric premium
s for estimates of long term
costs of equity.D
ata Source: Check out the returns by year and estim
ate your own historical
premium
s by going to updated data on my w
eb site.

Asw
ath Dam
odaran84
What about historical prem
iums for other
markets?
Historical data for m
arkets outside the United States tends to be sketch
and unreliable.Ibbotson, for instance, estim
ates the following prem
iums for m
ajorm
arkets from 1970-1996
Country
Stock return B
ond Return
Equity R
isk Prem
iumA
ustralia8.47%
6.99%1.48%
France11.51%
9.17%2.34%
Germ
any11.30%
12.10%-0.80%
Italy5.49%
7.84%-2.35%
Japan15.73%
12.69%3.04%
Mexico
11.88%10.71%
1.17%Singapore
15.48%6.45%
9.03%Spain
8.22%7.91%
0.31%Sw
itzerland13.49%
10.11%3.38%
UK
12.42%7.81%
4.61%
Asw
ath Dam
odaran85
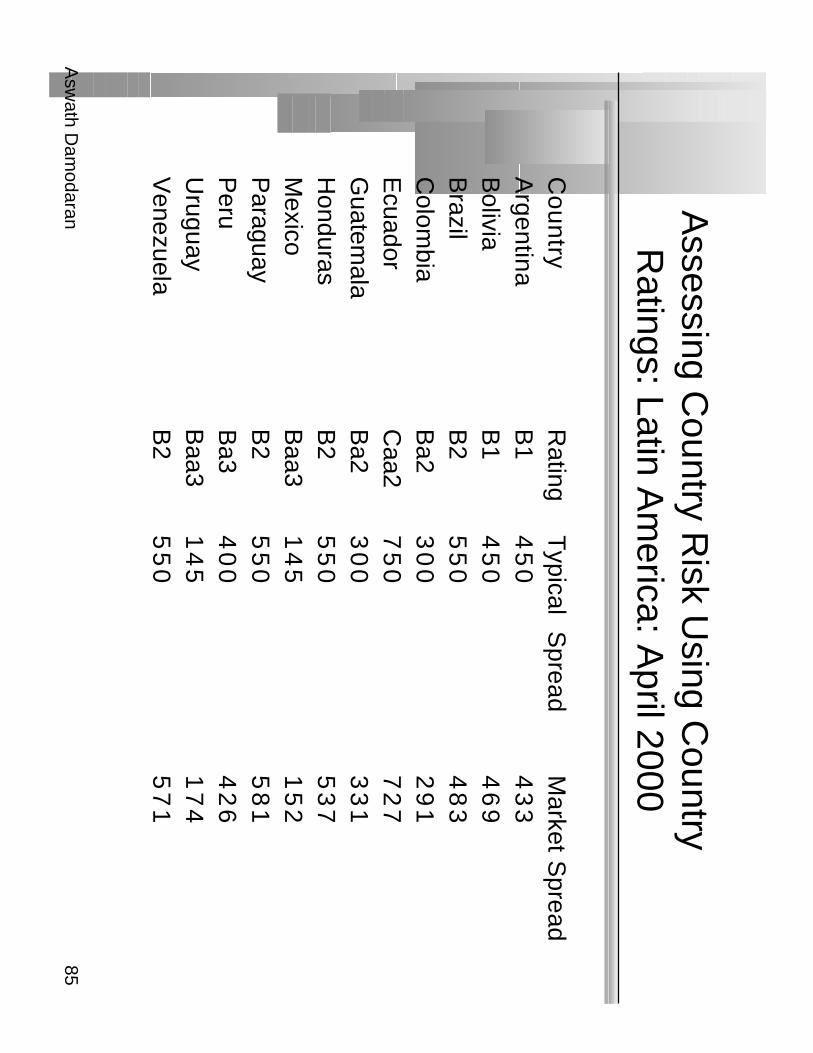
Assessing C
ountry Risk U
sing Country
Ratings: Latin A
merica: A
pril 2000
Co
un
tryR
atingT
ypical Spread
Market S
preadA
rgentina B
1 4
50
43
3B
olivia B
1 4
50
46
9B
razil B
2 5
50
48
3C
olombia
Ba2
30
02
91
Ecuador
Caa2
75
07
27
Guatem
ala B
a2 3
00
33
1H
onduras B
2 5
50
53
7M
exico B
aa3 1
45
15
2P
araguay B
2 5
50
58
1P
eru B
a3 4
00
42
6U
ruguay B
aa3 1
45
17
4V
enezuela B
2 5
50
57
1
Asw
ath Dam
odaran86
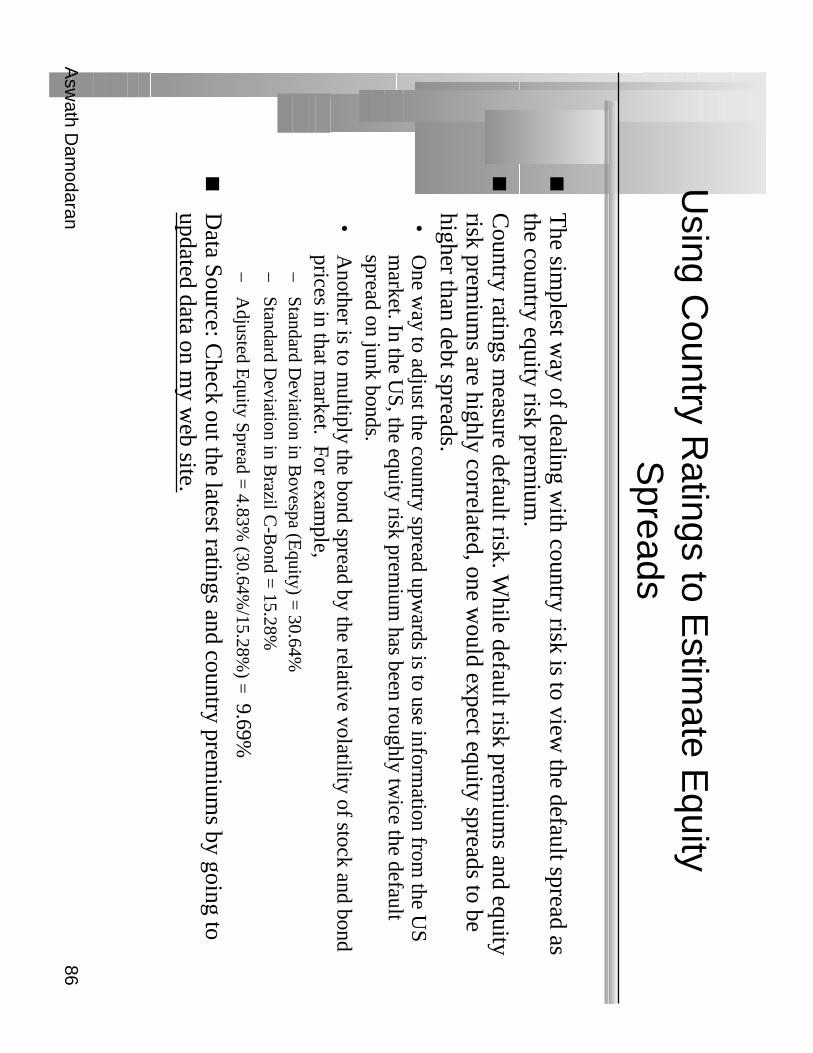
Using C
ountry Ratings to E
stimate E
quityS
preads
The sim
plest way of dealing w
ith country risk is to view the default spread as
the country equity risk premium
.C
ountry ratings measure default risk. W
hile default risk premium
s and equityrisk prem
iums are highly correlated, one w
ould expect equity spreads to behigher than debt spreads.
•O
ne way to adjust the country spread upw
ards is to use information from
the US
market. In the U
S, the equity risk premium
has been roughly twice the default
spread on junk bonds.•
Another is to m
ultiply the bond spread by the relative volatility of stock and bondprices in that m
arket. For example,
–Standard D
eviation in Bovespa (E
quity) = 30.64%
–Standard D
eviation in Brazil C
-Bond =
15.28%
–A
djusted Equity Spread =
4.83% (30.64%
/15.28%) =
9.69%
Data Source: C
heck out the latest ratings and country premium
s by going toupdated data on m
y web site.

Asw
ath Dam
odaran87
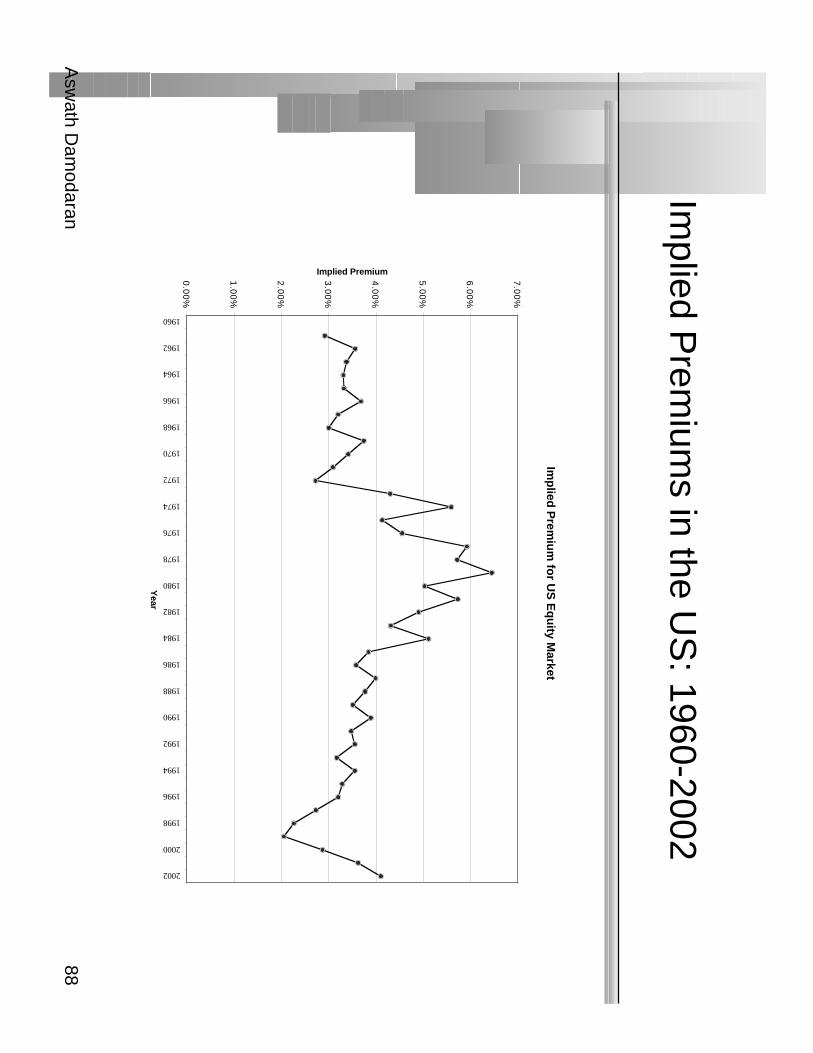
Implied E
quity Prem
iums
If we use a basic discounted cash flow
model, w
e can estimate the
implied risk prem
ium from
the current level of stock prices.
For instance, if stock prices are determined by the sim
ple Gordon
Grow
th Model:
•V
alue = E
xpected Dividends next year/ (R
equired Returns on Stocks -
Expected G
rowth R
ate)
•Plugging in the current level of the index, the dividends on the index andexpected grow
th rate will yield a “im
plied” expected return on stocks.Subtracting out the riskfree rate w
ill yield the implied prem
ium.
The problem
s with this approach are:
•the discounted cash flow
model used to value the stock index has to be the
right one.
•the inputs on dividends and expected grow
th have to be correct
•it im
plicitly assumes that the m
arket is currently correctly valued
Asw
ath Dam
odaran88
Implied P
remium
s in the US
: 1960-2002
Imp
lied P
remiu
m fo
r US
Eq
uity M
arket
0.0
0%
1.0
0%
2.0
0%
3.0
0%
4.0
0%
5.0
0%
6.0
0%
7.0
0%
1960
1962
1964
1966
1968
1970
1972
1974
1976
1978
1980
1982
1984
1986
1988
1990
1992
1994
1996
1998
2000
2002
Year
Implied Premium

Asw
ath Dam
odaran89
A
pplication Test: A
Market R
isk Prem
ium
Based upon our discussion of historical risk prem
iums so far, the risk
premium
looking forward should be:
About 7.5%
, which is w
hat the arithmetic average prem
ium has been
since 1981, for stocks over T.B
ills
About 4.5%
, which is the geom
etric average premium
since 1928, forstocks over T
.Bonds
About 4%
, which is the im
plied premium
in the stock market today

Asw
ath Dam
odaran90
Estim
ating Beta
The standard procedure for estim
ating betas is to regress stock returns(R
j ) against market returns (R
m ) -
Rj =
a + b R
m
•w
here a is the intercept and b is the slope of the regression.
The slope of the regression corresponds to the beta of the stock, and
measures the riskiness of the stock.
Asw
ath Dam
odaran91
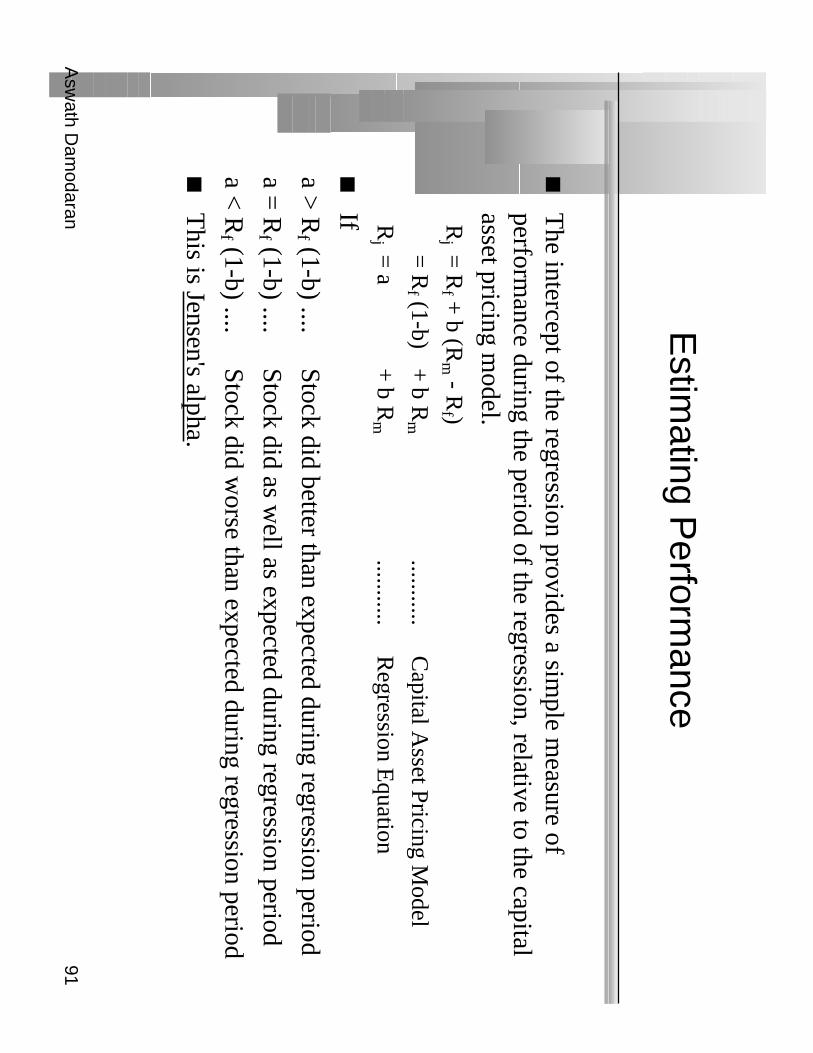
Estim
ating Perform
ance
The intercept of the regression provides a sim
ple measure of
performance during the period of the regression, relative to the capital
asset pricing model.
Rj =
Rf +
b (Rm - R
f )
= R
f (1-b) + b R
m...........
Capital A
sset Pricing Model
Rj =
a + b R
m...........
Regression E
quation
If
a > R
f (1-b) ....Stock did better than expected during regression period
a = R
f (1-b) ....Stock did as w
ell as expected during regression period
a < R
f (1-b) ....Stock did w
orse than expected during regression period
This is Jensen's alpha.

Asw
ath Dam
odaran92
Firm
Specific and M
arket Risk
The R
squared (R2) of the regression provides an estim
ate of theproportion of the risk (variance) of a firm
that can be attributed tom
arket risk;
The balance (1 - R
2) can be attributed to firm specific risk.

Asw
ath Dam
odaran93
Setting up for the E
stimation
Decide on an estim
ation period•
Services use periods ranging from 2 to 5 years for the regression
•L
onger estimation period provides m
ore data, but firms change.
•Shorter periods can be affected m
ore easily by significant firm-specific
event that occurred during the period (Exam
ple: ITT
for 1995-1997)
Decide on a return interval - daily, w
eekly, monthly
•Shorter intervals yield m
ore observations, but suffer from m
ore noise.
•N
oise is created by stocks not trading and biases all betas towards one.
Estim
ate returns (including dividends) on stock•
Return =
(PriceE
nd - PriceB
eginning + D
ividendsPeriod )/ Price
Beginning
•Included dividends only in ex-dividend m
onth
Choose a m
arket index, and estimate returns (inclusive of dividends)
on the index for each interval for the period.

Asw
ath Dam
odaran94
Choosing the P
arameters: D
isney
Period used: 5 years
Return Interval =
Monthly
Market Index: S&
P 500 Index.
For instance, to calculate returns on Disney in A
pril 1992,•
Price for Disney at end of M
arch = $ 37.87
•Price for D
isney at end of April =
$ 36.42
•D
ividends during month =
$0.05 (It was an ex-dividend m
onth)
•R
eturn =($36.42 - $ 37.87 +
$ 0.05)/$ 37.87=-3.69%
To estim
ate returns on the index in the same m
onth•
Index level (including dividends) at end of March =
404.35
•Index level (including dividends) at end of A
pril = 415.53
•R
eturn =(415.53 - 404.35)/ 404.35 =
2.76%

Asw
ath Dam
odaran95
Disney’s H
istorical Beta
Disn
ey versus S
&P
500: 1992-1996
-6.0
0%
-4.0
0%
-2.0
0%
0.0
0%
2.0
0%
4.0
0%
6.0
0%
8.0
0%
-15
.00
%-1
0.0
0%
-5.0
0%
0.0
0%
5.0
0%
10
.00
%1
5.0
0%
20
.00
%
Asw
ath Dam
odaran96
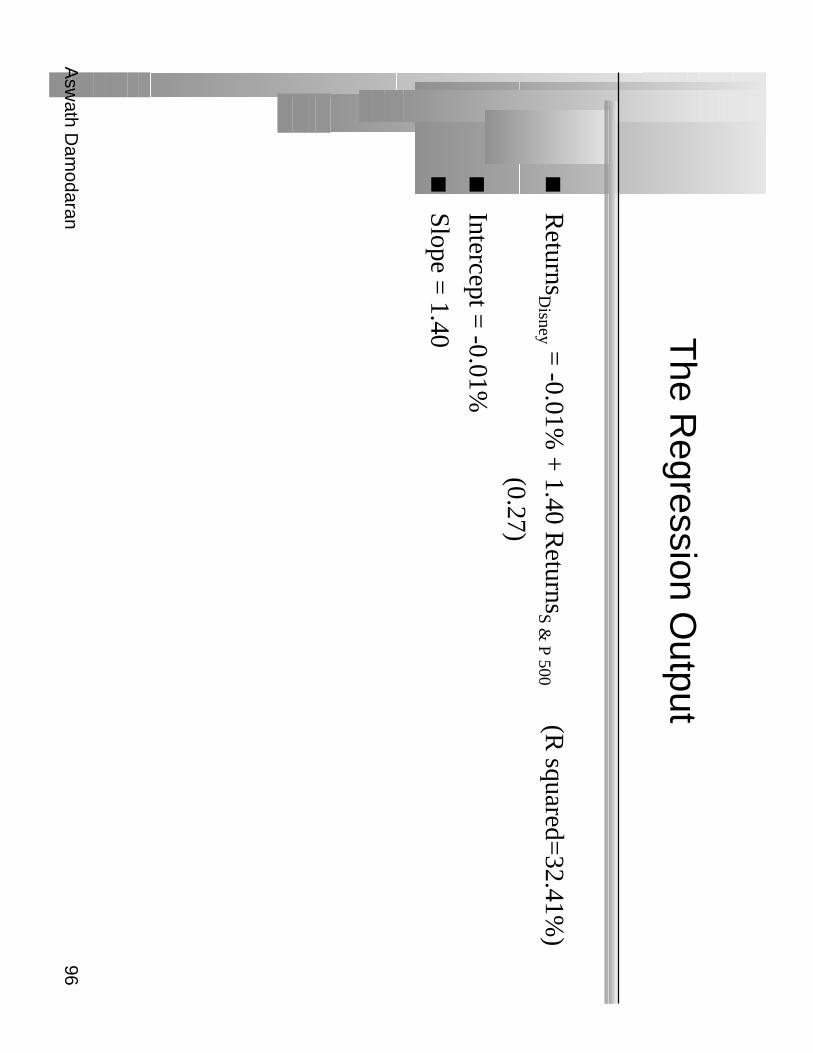
The R
egression Output
Returns
Disney =
-0.01% +
1.40 Returns
S & P 500 (R
squared=32.41%
)
(0.27)
Intercept = -0.01%
Slope = 1.40

Asw
ath Dam
odaran97
Analyzing D
isney’s Perform
ance
Intercept = -0.01%
•T
his is an intercept based on monthly returns. T
hus, it has to be compared
to a monthly riskfree rate.
•B
etween 1992 and 1996,
–M
onthly Riskfree R
ate = 0.4%
(Annual T
.Bill rate divided by 12)
–R
iskfree Rate (1-B
eta) = 0.4%
(1-1.40) = -.16%
The C
omparison is then betw
eenIntercept
versusR
iskfree Rate (1 - B
eta)-0.01%
versus0.4%
(1-1.40)=-0.16%
•Jensen’s A
lpha = -0.01%
-(-0.16%) =
0.15%
Disney did 0.15%
better than expected, per month, betw
een 1992 and1996.•
Annualized, D
isney’s annual excess return = (1.0015) 12-1=
1.81%

Asw
ath Dam
odaran98
More on Jensen’s A
lpha
If you did this analysis on every stock listed on an exchange, what w
ouldthe average Jensen’s alpha be across all stocks?
Depend upon w
hether the market w
ent up or down during the period
Should be zero
Should be greater than zero, because stocks tend to go up more often
than down
Asw
ath Dam
odaran99
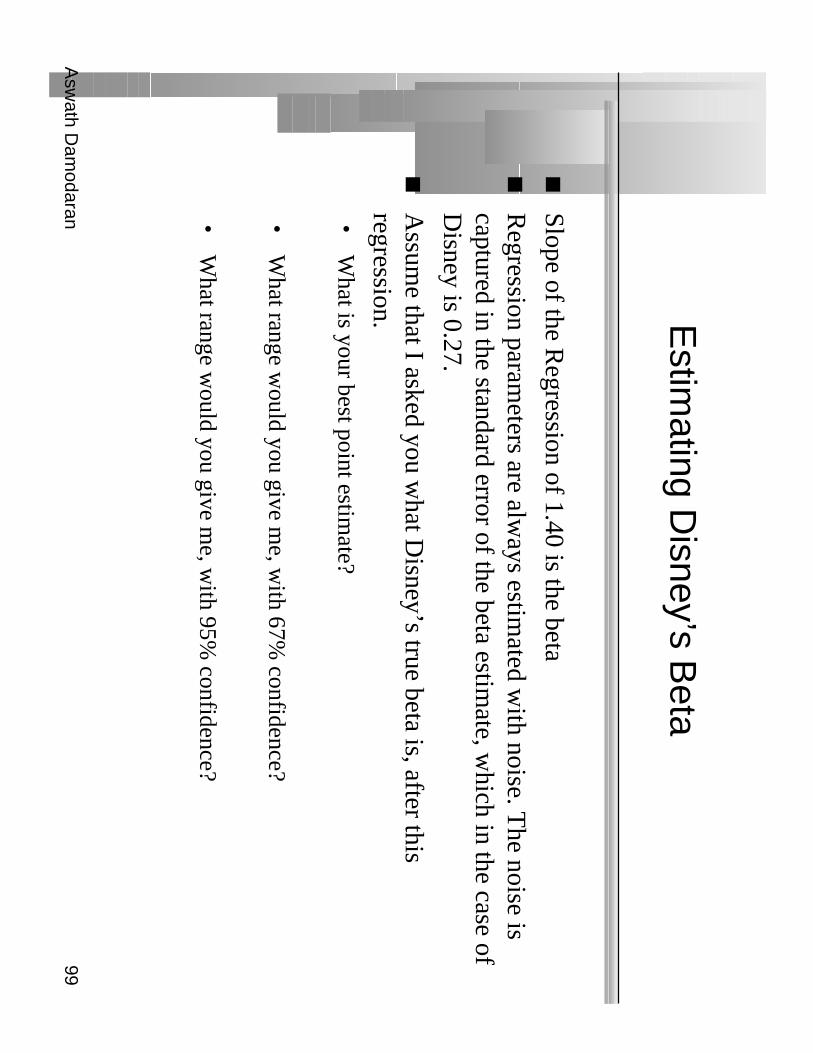
Estim
ating Disney’s B
eta
Slope of the Regression of 1.40 is the beta
Regression param
eters are always estim
ated with noise. T
he noise iscaptured in the standard error of the beta estim
ate, which in the case of
Disney is 0.27.
Assum
e that I asked you what D
isney’s true beta is, after thisregression.•
What is your best point estim
ate?
•W
hat range would you give m
e, with 67%
confidence?
•W
hat range would you give m
e, with 95%
confidence?

Asw
ath Dam
odaran100
The D
irty Secret of “S
tandard Error”
Distrib
utio
n o
f Stan
dard
Erro
rs: Beta E
stimates fo
r U.S
. stocks
0
20
0
40
0
60
0
80
0
10
00
12
00
14
00
16
00
<.1
0.10 - .20
.20 - .30.30 - .40
.40 -.50.50 - .75
> .75
Stan
dard
Erro
r in B
eta Estim
ate
Number of Firms
Asw
ath Dam
odaran101
Breaking dow
n Disney’s R
isk
R Squared =
32%
This im
plies that•
32% of the risk at D
isney comes from
market sources
•68%
, therefore, comes from
firm-specific sources
The firm
-specific risk is diversifiable and will not be rew
arded

Asw
ath Dam
odaran102
The R
elevance of R S
quared
You are a diversified investor trying to decide w
hether you should investin D
isney or Am
gen. They both have betas of 140, but D
isney has anR
Squared of 32% w
hile Am
gen’s R squared of only 15%
. Which one
would you invest in?
Am
gen, because it has the lower R
squared
Disney, because it has the higher R
squared
You w
ould be indifferent
Would your answ
er be different if you were an undiversified investor?
Asw
ath Dam
odaran103
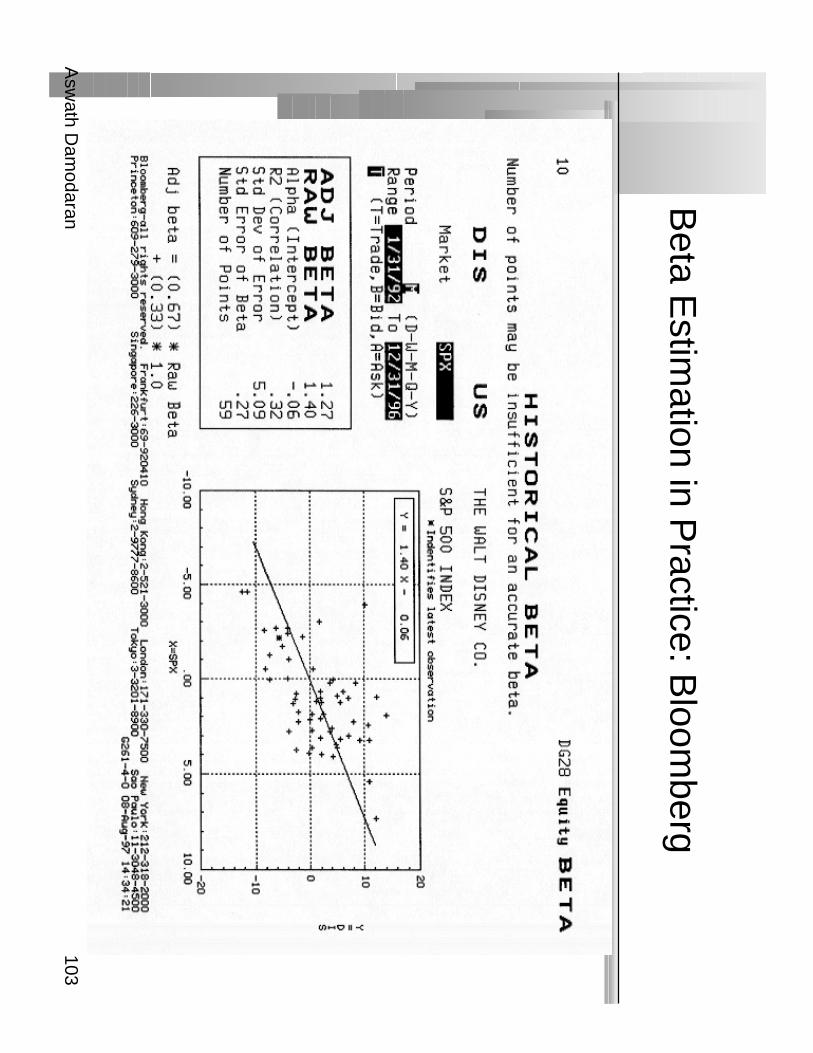
Beta E
stimation in P
ractice: Bloom
berg

Asw
ath Dam
odaran104
Estim
ating Expected R
eturns: Septem
ber 30,1997
Inputs to the expected return calculation•
Disney’s B
eta = 1.40
•R
iskfree Rate =
7.00% (L
ong term G
overnment B
ond rate)
•R
isk Premium
= 5.50%
(Approxim
ate historical premium
)
Expected R
eturn = R
iskfree Rate +
Beta (R
isk Premium
)
= 7.00%
+ 1.40 (5.50%
) = 14.70%

Asw
ath Dam
odaran105
Use to a P
otential Investor in Disney
As a potential investor in D
isney, what does this expected return of
14.70% tell you?
This is the return that I can expect to m
ake in the long term on D
isney,if the stock is correctly priced and the C
APM
is the right model for
risk,
This is the return that I need to m
ake on Disney in the long term
tobreak even on m
y investment in the stock
Both
Assum
e now that you are an active investor and that your research
suggests that an investment in D
isney will yield 25%
a year for thenext 5 years. B
ased upon the expected return of 14.70%, you w
ould
Buy the stock
Sell the stock

Asw
ath Dam
odaran106
How
managers use this expected return
Managers at D
isney•
need to make at least 14.70%
as a return for their equity investors to breakeven.
•this is the hurdle rate for projects, w
hen the investment is analyzed from
an equity standpoint
In other words, D
isney’s cost of equity is 14.70%.
What is the cost of not delivering this cost of equity?

Asw
ath Dam
odaran107
A
pplication Test: A
nalyzing the Risk
Regression
Using your B
loomberg risk and return print out, answ
er the following
questions:•
How
well or badly did your stock do, relative to the m
arket, during theperiod of the regression? (Y
ou can assume an annualized riskfree rate of
4.8% during the regression period)
Intercept - 0.4% (1- B
eta) = Jensen’s A
lpha
•W
hat proportion of the risk in your stock is attributable to the market?
What proportion is firm
-specific?
•W
hat is the historical estimate of beta for your stock? W
hat is the rangeon this estim
ate with 67%
probability? With 95%
probability?
•B
ased upon this beta, what is your estim
ate of the required return on thisstock?
Riskless R
ate + B
eta * Risk Prem
ium

Asw
ath Dam
odaran108
A Q
uick Test
You are advising a very risky softw
are firm on the right cost of equity to
use in project analysis. You estim
ate a beta of 2.0 for the firm and
come up w
ith a cost of equity of 18%. T
he CFO
of the firm is
concerned about the high cost of equity and wants to know
whether
there is anything he can do to lower his beta.
How
do you bring your beta down?
Should you focus your attention on bringing your beta down?
Yes
No
Asw
ath Dam
odaran109
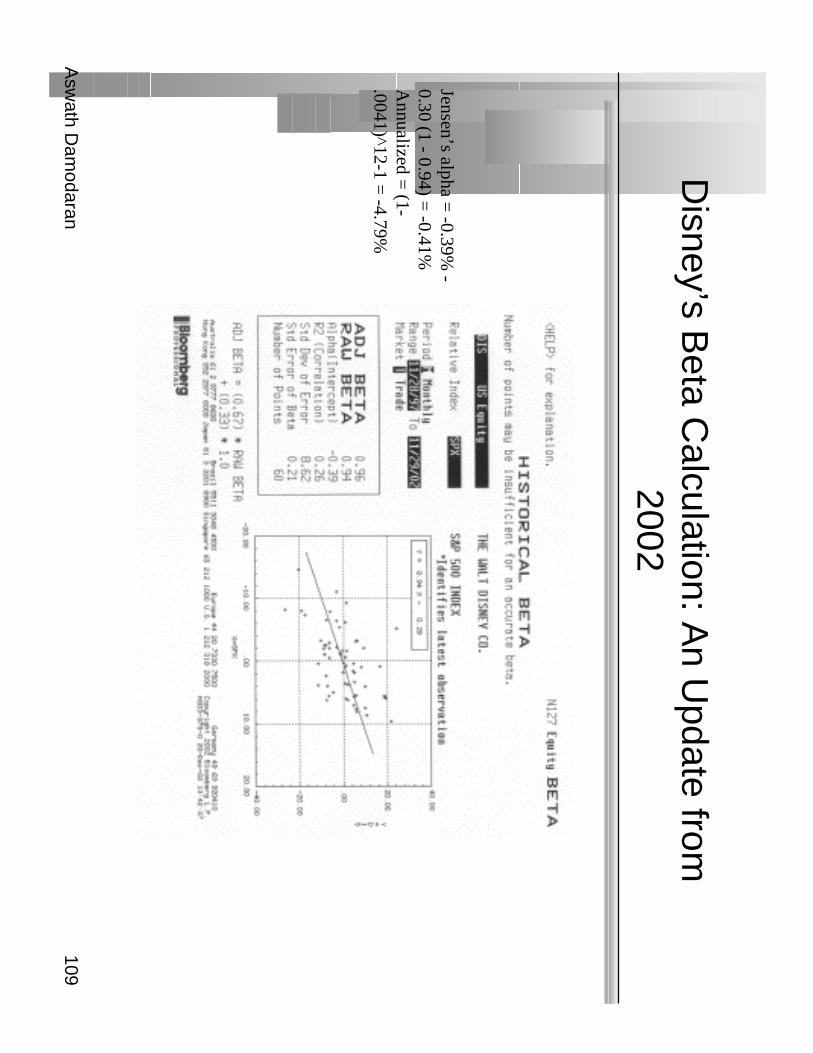
Disney’s B
eta Calculation: A
n Update from
2002
Jensen’s alpha = -0.39%
-0.30 (1 - 0.94) =
-0.41%A
nnualized = (1-
.0041)^12-1 = -4.79%
Asw
ath Dam
odaran110
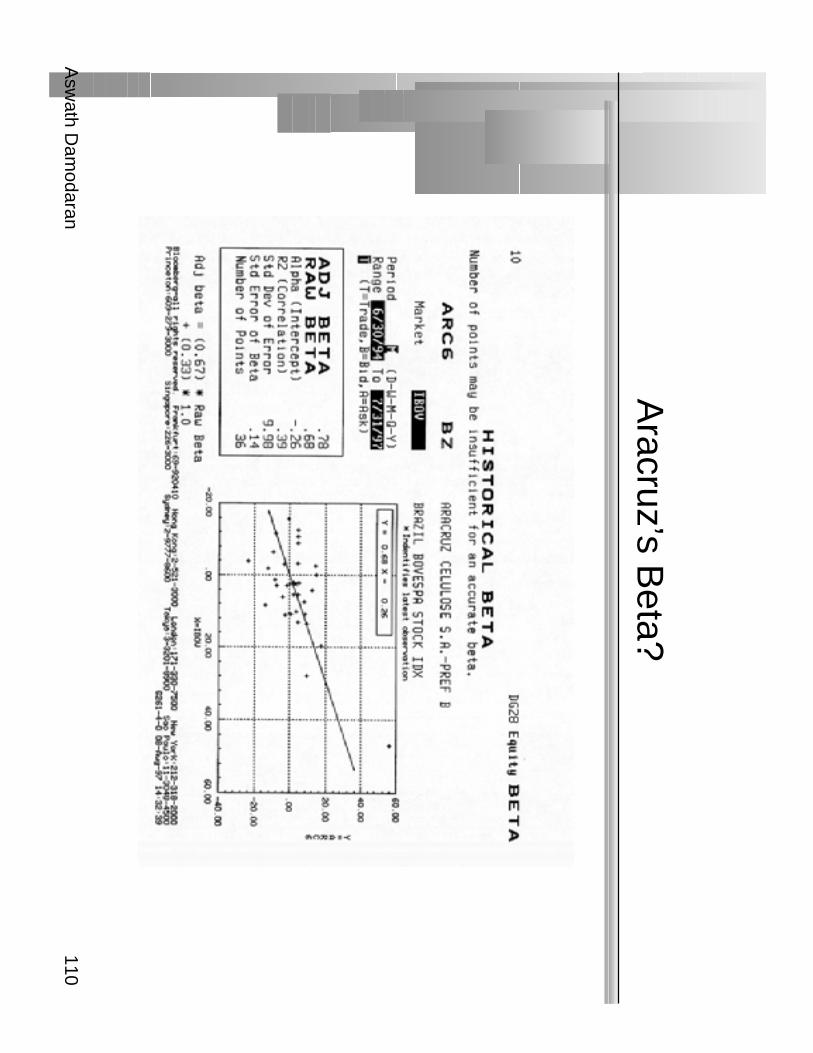
Aracruz’s B
eta?

Asw
ath Dam
odaran111
Telebras: H
igh R S
quared?
Asw
ath Dam
odaran112
A F
ew Q
uestions
The R
squared for Telebras is very high (70%
), at least relative to U.S.
firms. W
hy is that?
The beta for T
elebras is 1.11.•
Is this an appropriate measure of risk?
•If not, w
hy not?
The beta for every other stock in the index is also m
isestimated. Is
there a way to get a better estim
ate?
Asw
ath Dam
odaran113
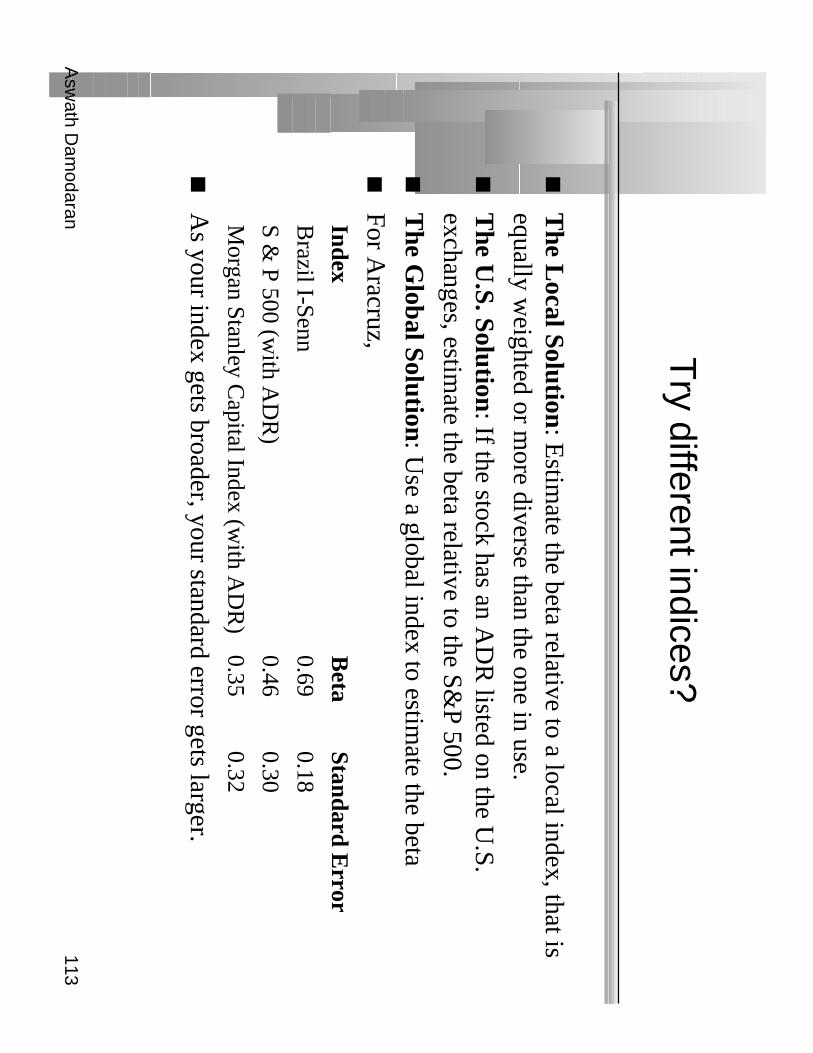
Try different indices?
The L
ocal Solution: E
stimate the beta relative to a local index, that is
equally weighted or m
ore diverse than the one in use.
The U
.S. Solution: If the stock has an A
DR
listed on the U.S.
exchanges, estimate the beta relative to the S&
P 500.
The G
lobal Solution: Use a global index to estim
ate the beta
For Aracruz,
IndexB
etaStandard E
rrorB
razil I-Senn0.69
0.18
S & P 500 (w
ith AD
R)
0.460.30
Morgan Stanley C
apital Index (with A
DR
)0.35
0.32
As your index gets broader, your standard error gets larger.

Asw
ath Dam
odaran114
Beta: E
xploring Fundam
entals
Beta =
1
Beta >
1
Beta =
0
Beta <
1
Real N
etworks: 3.2 4
Qw
est Com
munications: 2.60
General E
lectric: 1.10
Microsoft: 1..2 5
Philip M
orris: 0.65
Exxon M
obil: 0.40
Barrick (G
old Mines): - 0.10
Enron: 0.95

Asw
ath Dam
odaran115
Determ
inant 1: Product T
ype
Industry Effects: T
he beta value for a firm depends upon the
sensitivity of the demand for its products and services and of its costs
to macroeconom
ic factors that affect the overall market.
•C
yclical companies have higher betas than non-cyclical firm
s
•Firm
s which sell m
ore discretionary products will have higher betas than
firms that sell less discretionary products

Asw
ath Dam
odaran116
A S
imple T
est
Consider an investm
ent in Tiffany’s. W
hat kind of beta do you think thisinvestm
ent will have?
Much higher than one
Close to one
Much low
er than one
Asw
ath Dam
odaran117
Determ
inant 2: Operating Leverage E
ffects
Operating leverage refers to the proportion of the total costs of the firm
that are fixed.
Other things rem
aining equal, higher operating leverage results ingreater earnings variability w
hich in turn results in higher betas.

Asw
ath Dam
odaran118
Measures of O
perating Leverage
Fixed Costs M
easure = Fixed C
osts / Variable C
osts
This m
easures the relationship between fixed and variable costs. T
hehigher the proportion, the higher the operating leverage.
EB
IT V
ariability Measure =
% C
hange in EB
IT / %
Change in R
evenues
This m
easures how quickly the earnings before interest and taxes
changes as revenue changes. The higher this num
ber, the greater theoperating leverage.

Asw
ath Dam
odaran119
A Look at D
isney’s Operating Leverage
Year
Net Sales
% C
hange
in Sales
EB
IT%
Change
in EB
IT
19872877
756
19883438
19.50%848
12.17%
19894594
33.62%1177
38.80%
19905844
27.21%1368
16.23%
19916182
5.78%1124
-17.84%
19927504
21.38%1429
27.14%
19938529
13.66%1232
-13.79%
199410055
17.89%1933
56.90%
199512112
20.46%2295
18.73%
199618739
54.71%2540
10.68%
Average
23.80%16.56%
Asw
ath Dam
odaran120
Reading D
isney’s Operating Leverage
Operating L
everage =
% C
hange in EB
IT/ %
Change in Sales
= 16.56%
/ 23.80 % =
0.70
This is low
er than the operating leverage for other entertainment firm
s,w
hich we com
puted to be 1.15. This w
ould suggest that Disney has
lower fixed costs than its com
petitors.
The acquisition of C
apital Cities by D
isney in 1996 may be skew
ingthe operating leverage dow
nwards. For instance, looking at the
operating leverage for 1987-1995:O
perating Leverage1987-95 =
17.29%/19.94%
= 0.87

Asw
ath Dam
odaran121
A T
est
Assum
e that you are comparing a E
uropean automobile m
anufacturingfirm
with a U
.S. automobile firm
. European firm
s are generally much
more constrained in term
s of laying off employees, if they get into
financial trouble. What im
plications does this have for betas, if theyare estim
ated relative to a comm
on index?
European firm
s will have m
uch higher betas than U.S. firm
s
European firm
s will have sim
ilar betas to U.S. firm
s
European firm
s will have m
uch lower betas than U
.S. firms

Asw
ath Dam
odaran122
Determ
inant 3: Financial Leverage
As firm
s borrow, they create fixed costs (interest paym
ents) that make
their earnings to equity investors more volatile.
This increased earnings volatility w
hich increases the equity beta
Asw
ath Dam
odaran123
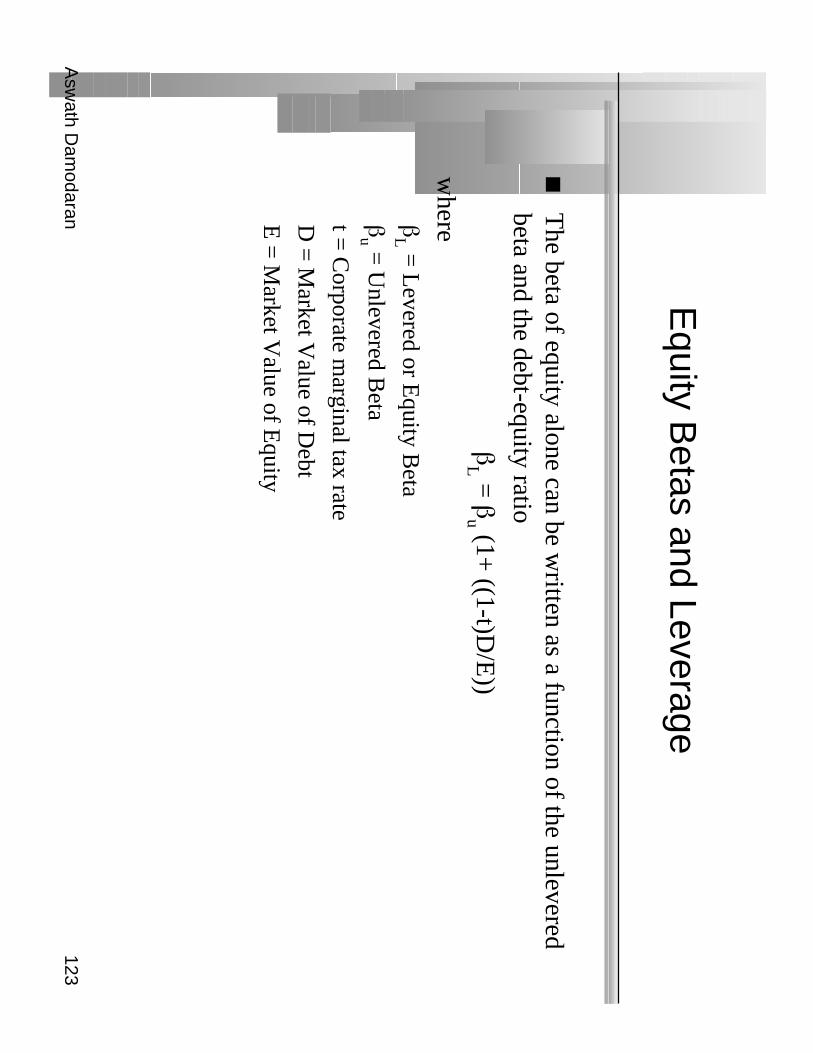
Equity B
etas and Leverage
The beta of equity alone can be w
ritten as a function of the unleveredbeta and the debt-equity ratio
βL =
βu (1+
((1-t)D/E
))
whereβ
L = L
evered or Equity B
eta
βu =
Unlevered B
eta
t = C
orporate marginal tax rate
D =
Market V
alue of Debt
E =
Market V
alue of Equity
Asw
ath Dam
odaran124
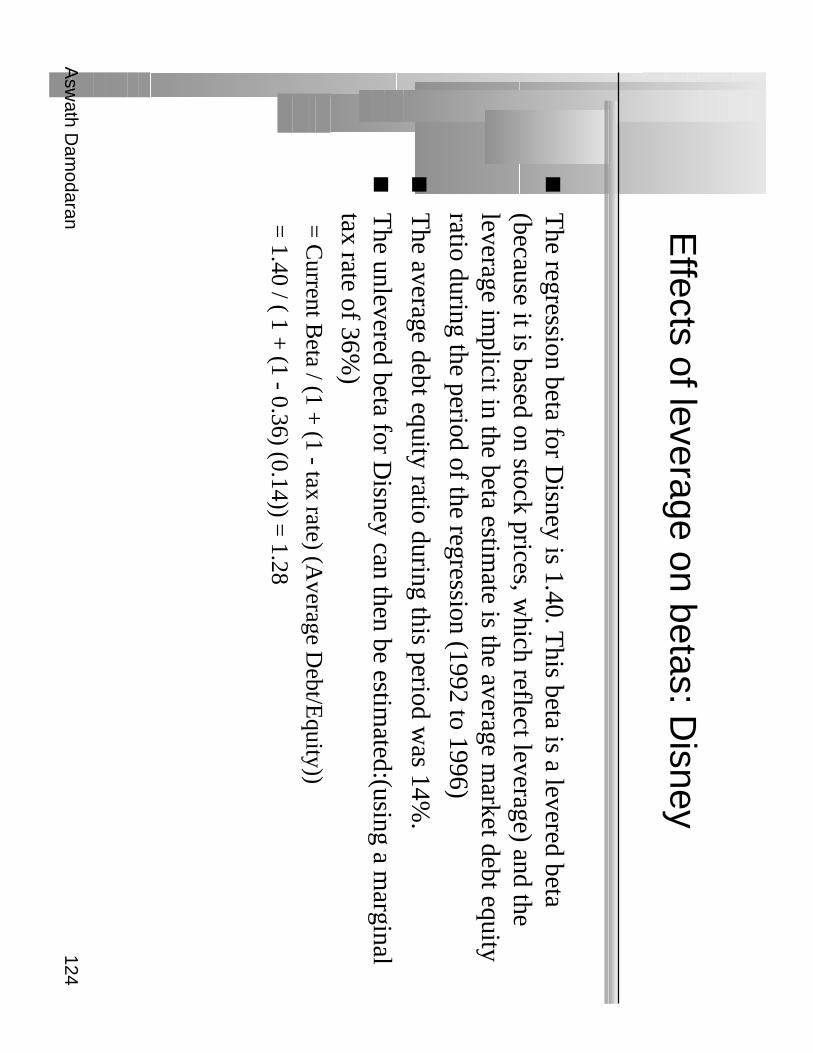
Effects of leverage on betas: D
isney
The regression beta for D
isney is 1.40. This beta is a levered beta
(because it is based on stock prices, which reflect leverage) and the
leverage implicit in the beta estim
ate is the average market debt equity
ratio during the period of the regression (1992 to 1996)
The average debt equity ratio during this period w
as 14%.
The unlevered beta for D
isney can then be estimated:(using a m
arginaltax rate of 36%
)=
Current B
eta / (1 + (1 - tax rate) (A
verage Debt/E
quity))
= 1.40 / ( 1 +
(1 - 0.36) (0.14)) = 1.28

Asw
ath Dam
odaran125
Disney : B
eta and Leverage
Debt to C
apitalD
ebt/Equity R
atioB
etaE
ffect of Leverage
0.00%0.00%
1.280.00
10.00%11.11%
1.380.09
20.00%25.00%
1.490.21
30.00%42.86%
1.640.35
40.00%66.67%
1.830.55
50.00%100.00%
2.110.82
60.00%150.00%
2.521.23
70.00%233.33%
3.201.92
80.00%400.00%
4.573.29
90.00%900.00%
8.697.40

Asw
ath Dam
odaran126
Betas are w
eighted Averages
The beta of a portfolio is alw
ays the market-value w
eighted average ofthe betas of the individual investm
ents in that portfolio.
Thus,•
the beta of a mutual fund is the w
eighted average of the betas of the stocksand other investm
ent in that portfolio
•the beta of a firm
after a merger is the m
arket-value weighted average of
the betas of the companies involved in the m
erger.
Asw
ath Dam
odaran127
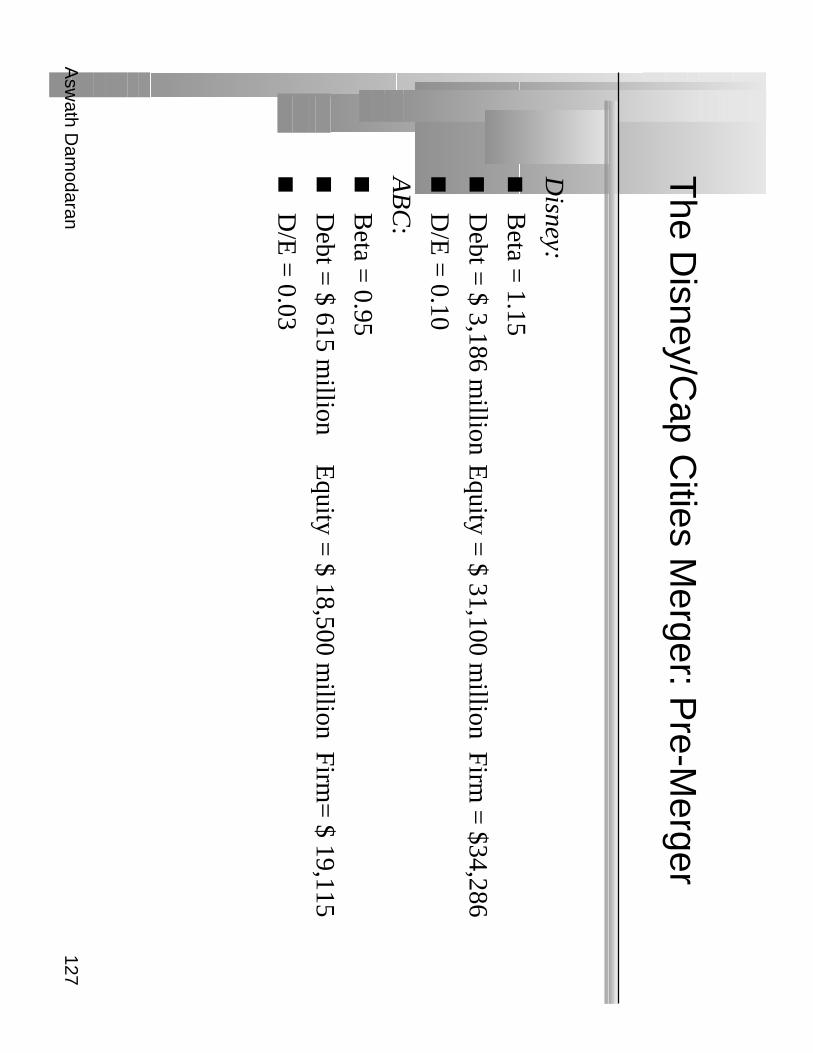
The D
isney/Cap C
ities Merger: P
re-Merger
Disney:
Beta =
1.15
Debt =
$ 3,186 million
Equity =
$ 31,100 million
Firm =
$34,286
D/E
= 0.10
AB
C:Beta =
0.95
Debt =
$ 615 million
Equity =
$ 18,500 million
Firm=
$ 19,115
D/E
= 0.03
Asw
ath Dam
odaran128
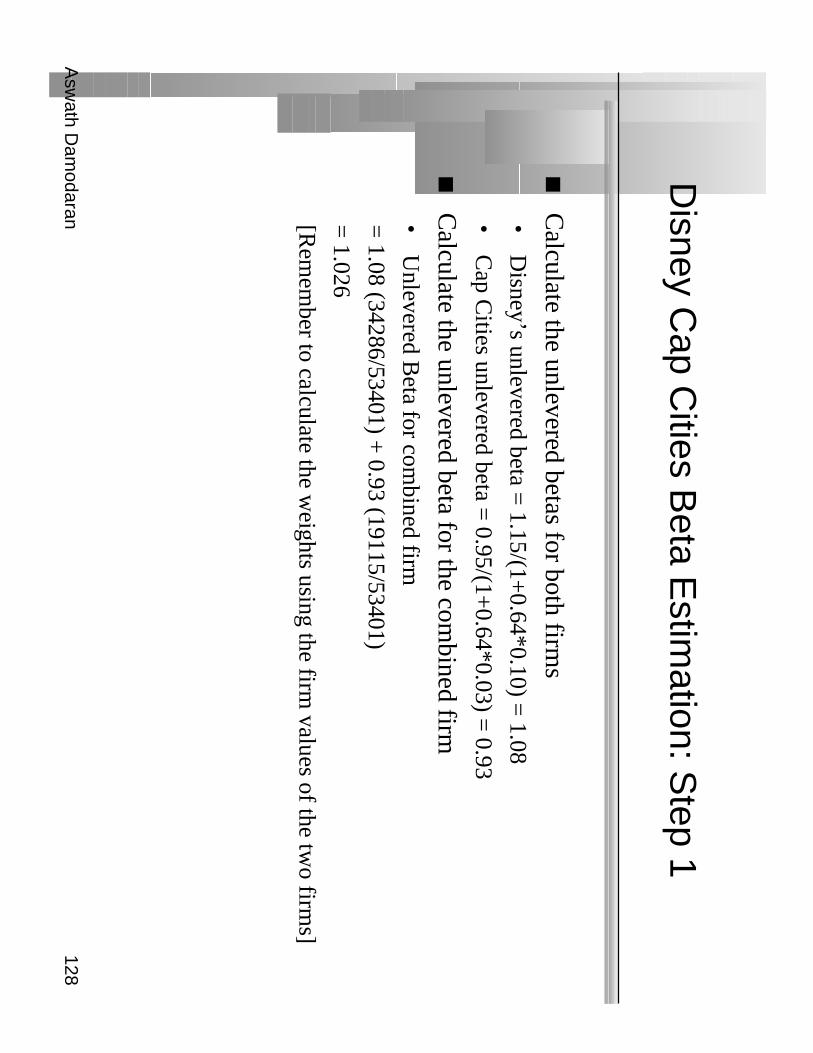
Disney C
ap Cities B
eta Estim
ation: Step 1
Calculate the unlevered betas for both firm
s•
Disney’s unlevered beta =
1.15/(1+0.64*0.10) =
1.08
•C
ap Cities unlevered beta =
0.95/(1+0.64*0.03) =
0.93
Calculate the unlevered beta for the com
bined firm•
Unlevered B
eta for combined firm
= 1.08 (34286/53401) +
0.93 (19115/53401)
= 1.026
[Rem
ember to calculate the w
eights using the firm values of the tw
o firms]

Asw
ath Dam
odaran129
Disney C
ap Cities B
eta Estim
ation: Step 2
If Disney had used all equity to buy C
ap Cities
•D
ebt = $ 615 +
$ 3,186 = $ 3,801 m
illion
•E
quity = $ 18,500 +
$ 31,100 = $ 49,600
•D
/E R
atio = 3,801/49600 =
7.66%
•N
ew B
eta = 1.026 (1 +
0.64 (.0766)) = 1.08
Since Disney borrow
ed $ 10 billion to buy Cap C
ities/AB
C•
Debt =
$ 615 + $ 3,186 +
$ 10,000 = $ 13,801 m
illion
•E
quity = $ 39,600
•D
/E R
atio = 13,801/39600 =
34.82%
•N
ew B
eta = 1.026 (1 +
0.64 (.3482)) = 1.25
Asw
ath Dam
odaran130
Firm
Betas versus divisional B
etas
Firm B
etas as weighted averages: T
he beta of a firm is the w
eightedaverage of the betas of its individual projects.
At a broader level of aggregation, the beta of a firm
is the weighted
average of the betas of its individual division.
Asw
ath Dam
odaran131
Bottom
-up versus Top-dow
n Beta
The top-dow
n beta for a firm com
es from a regression
The bottom
up beta can be estimated by doing the follow
ing:•
Find out the businesses that a firm operates in
•Find the unlevered betas of other firm
s in these businesses
•T
ake a weighted (by sales or operating incom
e) average of theseunlevered betas
•L
ever up using the firm’s debt/equity ratio
The bottom
up beta will give you a better estim
ate of the true betaw
hen•
the standard error of the beta from the regression is high (and) the beta for
a firm is very different from
the average for the business
•the firm
has reorganized or restructured itself substantially during theperiod of the regression
•w
hen a firm is not traded
Asw
ath Dam
odaran132
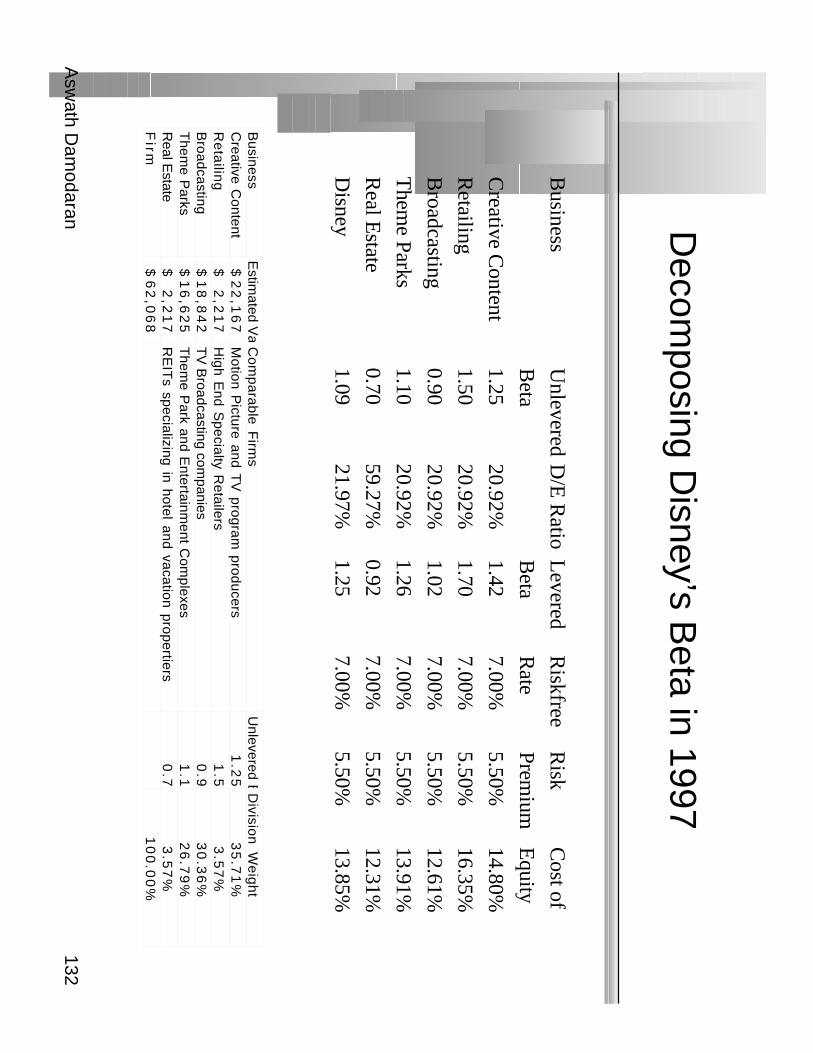
Decom
posing Disney’s B
eta in 1997
Business
Unlevered
D/E
Ratio
Levered
Riskfree
Risk
Cost of
Beta
Beta
Rate
Premium
Equity
Creative C
ontent1.25
20.92%1.42
7.00%5.50%
14.80%
Retailing
1.5020.92%
1.707.00%
5.50%16.35%
Broadcasting
0.9020.92%
1.027.00%
5.50%12.61%
Them
e Parks1.10
20.92%1.26
7.00%5.50%
13.91%
Real E
state0.70
59.27%0.92
7.00%5.50%
12.31%
Disney
1.0921.97%
1.257.00%
5.50%13.85%
Business
Estim
ated Va
Co
mp
ara
ble
Firm
sU
nlevered BD
ivision
We
igh
tC
reative Content
22
,16
7$
Motion P
icture and TV
program producers
1.2
53
5.7
1%
Re
tailin
g2
,21
7$
High E
nd Specialty R
etailers1
.53
.57
%B
roadcasting1
8,8
42
$ T
V B
roadcasting companies
0.9
30
.36
%T
heme P
arks1
6,6
25
$ T
heme P
ark and Entertainm
ent Com
plexes1
.12
6.7
9%
Real E
state2
,21
7$
RE
ITs specializing in hotel and vacation propertiers
0.7
3.5
7%
Firm
62
,06
8$
10
0.0
0%

Asw
ath Dam
odaran133
Discussion Issue
If you were the chief financial officer of D
isney, what cost of equity
would you use in capital budgeting in the different divisions?
The cost of equity for D
isney as a company
The cost of equity for each of D
isney’s divisions?
Asw
ath Dam
odaran134
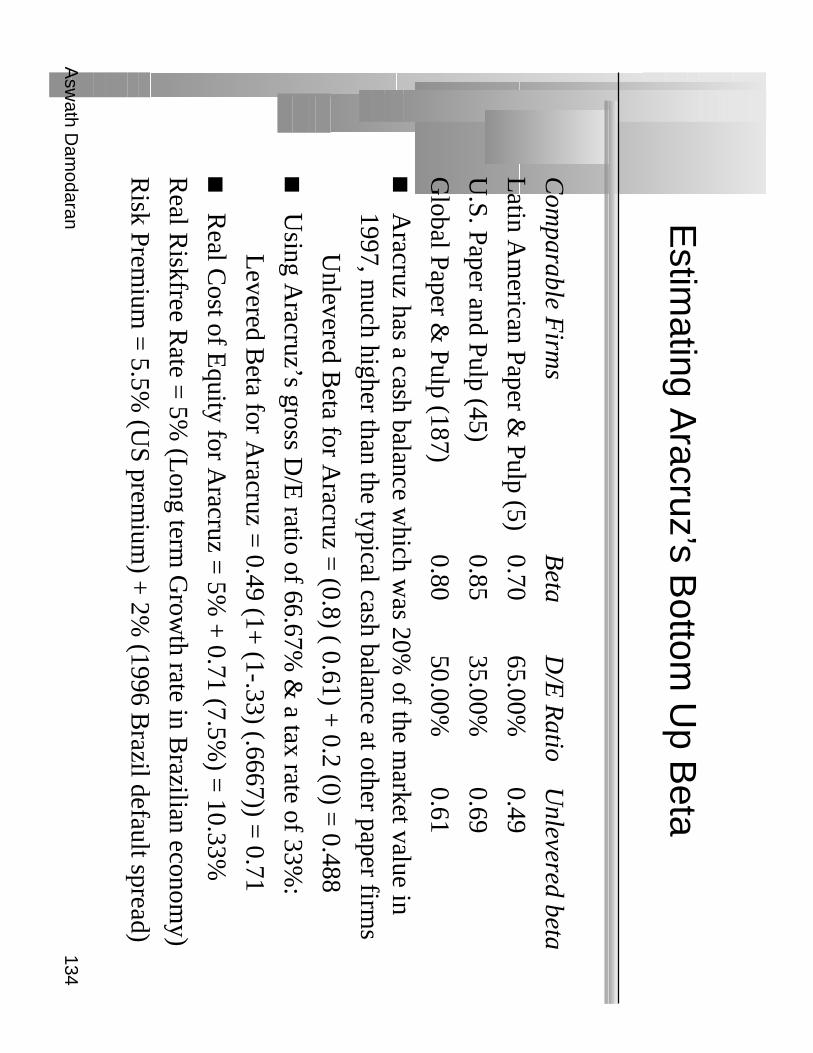
Estim
ating Aracruz’s B
ottom U
p Beta
Com
parable Firm
sB
eta D
/E R
atioU
nlevered beta
Latin A
merican Paper &
Pulp (5)0.70
65.00%0.49
U.S. Paper and Pulp (45)
0.8535.00%
0.69
Global Paper &
Pulp (187)0.80
50.00%0.61
Aracruz has a cash balance w
hich was 20%
of the market value in
1997, much higher than the typical cash balance at other paper firm
s
Unlevered B
eta for Aracruz =
(0.8) ( 0.61) + 0.2 (0) =
0.488
Using A
racruz’s gross D/E
ratio of 66.67% &
a tax rate of 33%:
Levered B
eta for Aracruz =
0.49 (1+ (1-.33) (.6667)) =
0.71
Real C
ost of Equity for A
racruz = 5%
+ 0.71 (7.5%
) = 10.33%
Real R
iskfree Rate =
5% (L
ong term G
rowth rate in B
razilian economy)
Risk Prem
ium =
5.5% (U
S premium
) + 2%
(1996 Brazil default spread)

Asw
ath Dam
odaran135
Estim
ating Bottom
-up Beta: D
eutsche Bank
Deutsche B
ank is in two different segm
ents of business - comm
ercialbanking and investm
ent banking.
To estim
ate its comm
ercial banking beta, we w
ill use the average betaof com
mercial banks in G
ermany.
To estim
ate the investment banking beta, w
e will use the average bet
of investment banks in the U
.S and U.K
.
Com
parable Firm
sA
verage Beta
Weight
Com
mercial B
anks in Germ
any0.90
90%
U.K
. and U.S. investm
ent banks1.30
10%
Beta for D
eutsche Bank =
0.9 (.90) + 0.1 (1.30)=
0.94
Cost of E
quity for Deutsche B
ank (in DM
) = 7.5%
+ 0.94 (5.5%
)
= 12.67%

Asw
ath Dam
odaran136
Estim
ating Betas for N
on-Traded A
ssets
The conventional approaches of estim
ating betas from regressions do
not work for assets that are not traded.
There are tw
o ways in w
hich betas can be estimated for non-traded
assets•
using comparable firm
s
•using accounting earnings
Asw
ath Dam
odaran137
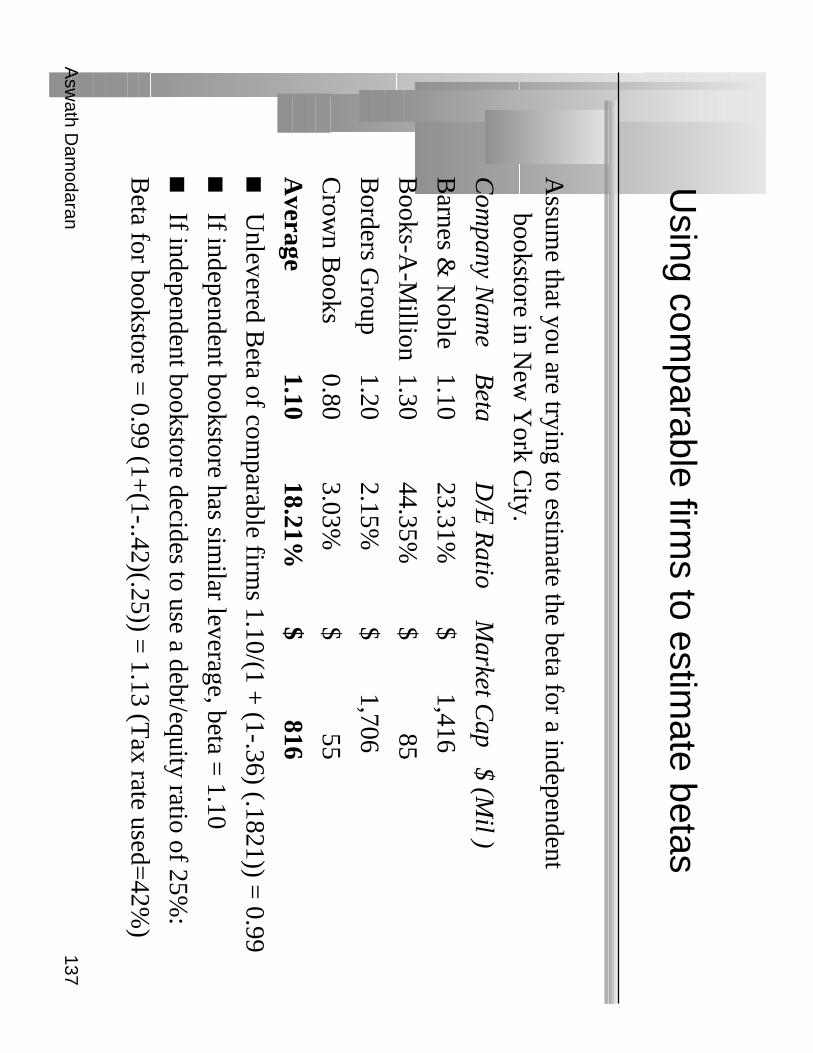
Using com
parable firms to estim
ate betas
Assum
e that you are trying to estimate the beta for a independent
bookstore in New
York C
ity.
Com
pany Nam
eB
etaD
/E R
atioM
arket Cap $ (M
il )
Barnes &
Noble
1.1023.31%
$ 1,416
Books-A
-Million
1.3044.35%
$ 85
Borders G
roup1.20
2.15% $ 1,706
Crow
n Books
0.803.03%
$ 55
Average
1.1018.21%
$ 816
Unlevered B
eta of comparable firm
s 1.10/(1 + (1-.36) (.1821)) =
0.99
If independent bookstore has similar leverage, beta =
1.10
If independent bookstore decides to use a debt/equity ratio of 25%:
Beta for bookstore =
0.99 (1+(1-..42)(.25)) =
1.13 (Tax rate used=
42%)

Asw
ath Dam
odaran138
Using A
ccounting Earnings to E
stimate B
eta
Year
S&P
500B
ookscapeY
earS&
P 500
Bookscape
1980-2.10%
3.55%1989
2.60%3.50%
1981-6.70%
4.05%1990
-18.00%-10.50%
1982-45.50%
-14.33%1991
-47.40%-32.00%
198337.00%
47.55%1992
64.50%55.00%
198441.80%
65.00%1993
20.00%31.00%
1985-11.80%
5.05%1994
25.30%21.06%
19867.00%
8.50%1995
15.50%11.55%
198741.50%
37.00%1996
24.00%19.88%
198841.80%
45.17%
Asw
ath Dam
odaran139
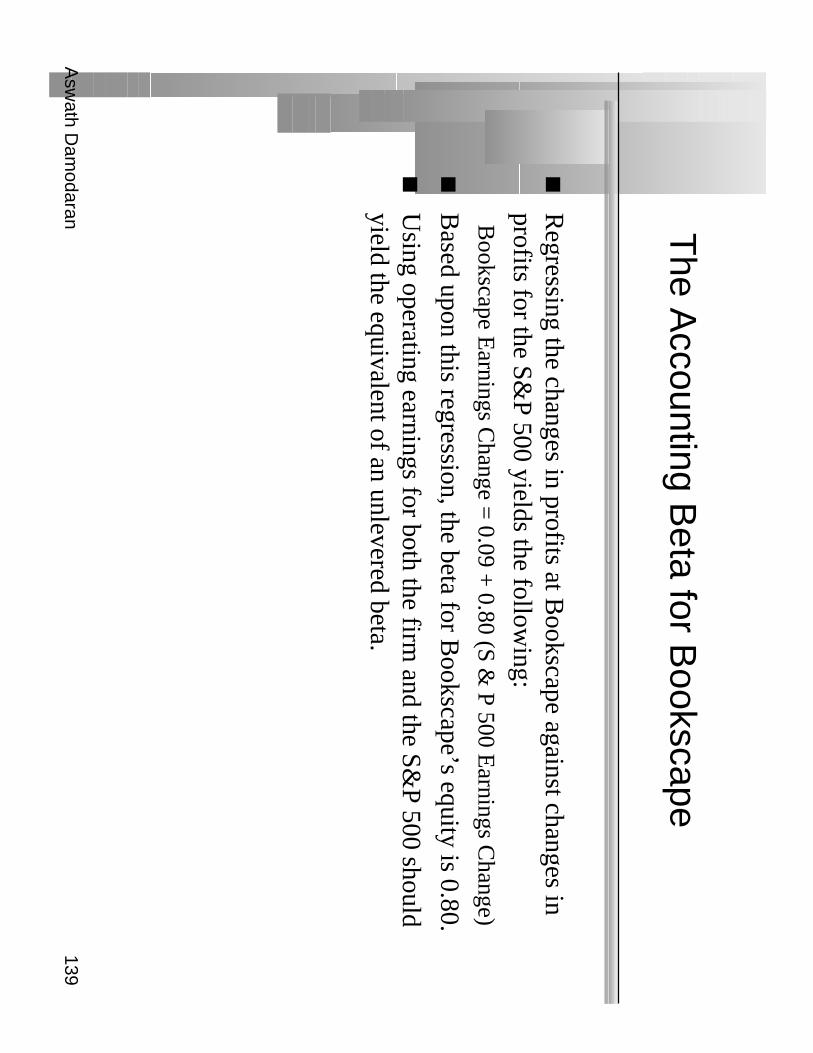
The A
ccounting Beta for B
ookscape
Regressing the changes in profits at B
ookscape against changes inprofits for the S&
P 500 yields the following:
Bookscape E
arnings Change =
0.09 + 0.80 (S &
P 500 Earnings C
hange)
Based upon this regression, the beta for B
ookscape’s equity is 0.80.
Using operating earnings for both the firm
and the S&P 500 should
yield the equivalent of an unlevered beta.
Asw
ath Dam
odaran140
Is Beta an A
dequate Measure of R
isk for aP
rivate Firm
?
The ow
ners of most private firm
s are not diversified. Beta m
easuresthe risk added on to a diversified portfolio. T
herefore, using beta toarrive at a cost of equity for a private firm
will
Under estim
ate the cost of equity for the private firm
Over estim
ate the cost of equity for the private firm
Could under or over estim
ate the cost of equity for the private firm

Asw
ath Dam
odaran141
Total R
isk versus Market R
isk
Adjust the beta to reflect total risk rather than m
arket risk. This
adjustment is a relatively sim
ple one, since the R squared of the
regression measures the proportion of the risk that is m
arket risk. T
otal Beta =
Market B
eta / √R squared
In the Bookscapes exam
ple, where the m
arket beta is 1.10 and theaverage correlation of the com
parable publicly traded firms is 33%
,•
Total B
eta = 1.10/0.33 =
3.30
•T
otal Cost of E
quity = 7%
+ 3.30 (5.5%
)= 25.05%

Asw
ath Dam
odaran142
A
pplication Test: E
stimating a B
ottom-up
Beta
Based upon the business or businesses that your firm
is in right now,
and its current financial leverage, estimate the bottom
-up unleveredbeta for your firm
.
Data Source: Y
ou can get a listing of unlevered betas by industry onm
y web site by going to updated data.

Asw
ath Dam
odaran143
From
Cost of E
quity to Cost of C
apital
The cost of capital is a com
posite cost to the firm of raising financing
to fund its projects.
In addition to equity, firms can raise capital from
debt

Asw
ath Dam
odaran144
What is debt?
General R
ule: Debt generally has the follow
ing characteristics:•
Com
mitm
ent to make fixed paym
ents in the future
•T
he fixed payments are tax deductible
•Failure to m
ake the payments can lead to either default or loss of control
of the firm to the party to w
hom paym
ents are due.
As a consequence, debt should include
•A
ny interest-bearing liability, whether short term
or long term.
•A
ny lease obligation, whether operating or capital.

Asw
ath Dam
odaran145
Estim
ating the Cost of D
ebt
If the firm has bonds outstanding, and the bonds are traded, the yield
to maturity on a long-term
, straight (no special features) bond can beused as the interest rate.
If the firm is rated, use the rating and a typical default spread on bonds
with that rating to estim
ate the cost of debt.
If the firm is not rated,
•and it has recently borrow
ed long term from
a bank, use the interest rateon the borrow
ing or
•estim
ate a synthetic rating for the company, and use the synthetic rating to
arrive at a default spread and a cost of debt
The cost of debt has to be estim
ated in the same currency as the cost of
equity and the cash flows in the valuation.
Asw
ath Dam
odaran146
Estim
ating Synthetic R
atings
The rating for a firm
can be estimated using the financial
characteristics of the firm. In its sim
plest form, the rating can be
estimated from
the interest coverage ratio
Interest Coverage R
atio = E
BIT
/ Interest Expenses
For a firm, w
hich has earnings before interest and taxes of $ 3,500m
illion and interest expenses of $ 700 million
Interest Coverage R
atio = 3,500/700=
5.00•
Based upon the relationship betw
een interest coverage ratios and ratings,w
e would estim
ate a rating of A for the firm
.

Asw
ath Dam
odaran147
Interest Coverage R
atios, Ratings and D
efaultS
preads
If Interest Coverage R
atio isE
stimated B
ond Rating
Default Spread
> 8.50A
AA
0.75%6.50 - 8.50
AA
1.00%5.50 - 6.50
A+
1.50%4.25 - 5.50
A1.80%
3.00 - 4.25A
–2.00%
2.50 - 3.00B
BB
2.25%2.00 - 2.50
BB
3.50%1.75 - 2.00
B+
4.75%1.50 - 1.75
B6.50%
1.25 - 1.50B
–8.00%
0.80 - 1.25C
CC
10.00%0.65 - 0.80
CC
11.50%0.20 - 0.65
C12.70%
< 0.20D
14.00%

Asw
ath Dam
odaran148
A
pplication Test: E
stimating a C
ost of Debt
Based upon your firm
’s current earnings before interest and taxes, itsinterest expenses, estim
ate•
An interest coverage ratio for your firm
•A
synthetic rating for your firm (use the table from
previous page)
•A
pre-tax cost of debt for your firm
•A
n after-tax cost of debt for your firm

Asw
ath Dam
odaran149
Estim
ating Market V
alue Weights
Market V
alue of Equity should include the follow
ing•
Market V
alue of Shares outstanding•
Market V
alue of Warrants outstanding
•M
arket Value of C
onversion Option in C
onvertible Bonds
Market V
alue of Debt is m
ore difficult to estimate because few
firms
have only publicly traded debt. There are tw
o solutions:•
Assum
e book value of debt is equal to market value
•E
stimate the m
arket value of debt from the book value
•For D
isney, with book value of $12.342 m
illion, interest expenses of $479m
illion, a current cost of borrowing of 7.5%
and an weighted average
maturity of 3 years.
Estim
ated MV
of Disney D
ebt =479
11
1075
07512
3421
07511
1803
3
((
.)
.,
(.
)$
,−
+=
Asw
ath Dam
odaran150
Converting O
perating Leases to Debt
The “debt value” of operating leases is the present value of the lease
payments, at a rate that reflects their risk.
In general, this rate will be close to or equal to the rate at w
hich thecom
pany can borrow.

Asw
ath Dam
odaran151
Operating Leases at T
he Hom
e Depot
The pre-tax cost of debt at the H
ome D
epot is 6.25%Y
rO
perating Lease Expense
Present V
alue 1
$ 294 $ 277
2$ 291
$ 258 3
$ 264 $ 220
4$ 245
$ 192 5
$ 236 $ 174
6-15 $ 270
$ 1,450 (PV
of 10-yr annuity) P
resent Value of O
perating Leases =$ 2,571
Debt outstanding at the H
ome D
epot = $1,205 +
$2,571 = $3,776 m
il(T
he Hom
e Depot has other debt outstanding of $1,205 m
illion)

Asw
ath Dam
odaran152
A
pplication Test: E
stimating M
arket Value
Estim
ate the•
Market value of equity at your firm
and Book V
alue of equity
•M
arket value of debt and book value of debt (If you cannot find theaverage m
aturity of your debt, use 3 years): Rem
ember to capitalize the
value of operating leases and add them on to both the book value and the
market value of debt.
Estim
ate the•
Weights for equity and debt based upon m
arket value
•W
eights for equity and debt based upon book value

Asw
ath Dam
odaran153
Current C
ost of Capital: D
isney
Equity•
Cost of E
quity = R
iskfree rate + B
eta * Risk Prem
ium=
7% +
1.25 (5.5%) =
13.85%
•M
arket Value of E
quity =
$50.88 Billion
•E
quity/(Debt+
Equity ) =
82%
Debt
•A
fter-tax Cost of debt =
(Riskfree rate +
Default Spread) (1-t)
= (7%
+0.50) (1-.36) =
4.80%
•M
arket Value of D
ebt =$ 11.18 B
illion
•D
ebt/(Debt +
Equity) =
18%
Cost of C
apital = 13.85%
(.82)+4.80%
(.18) = 12.22%
50.88/(50.88+
11.18)
Asw
ath Dam
odaran154
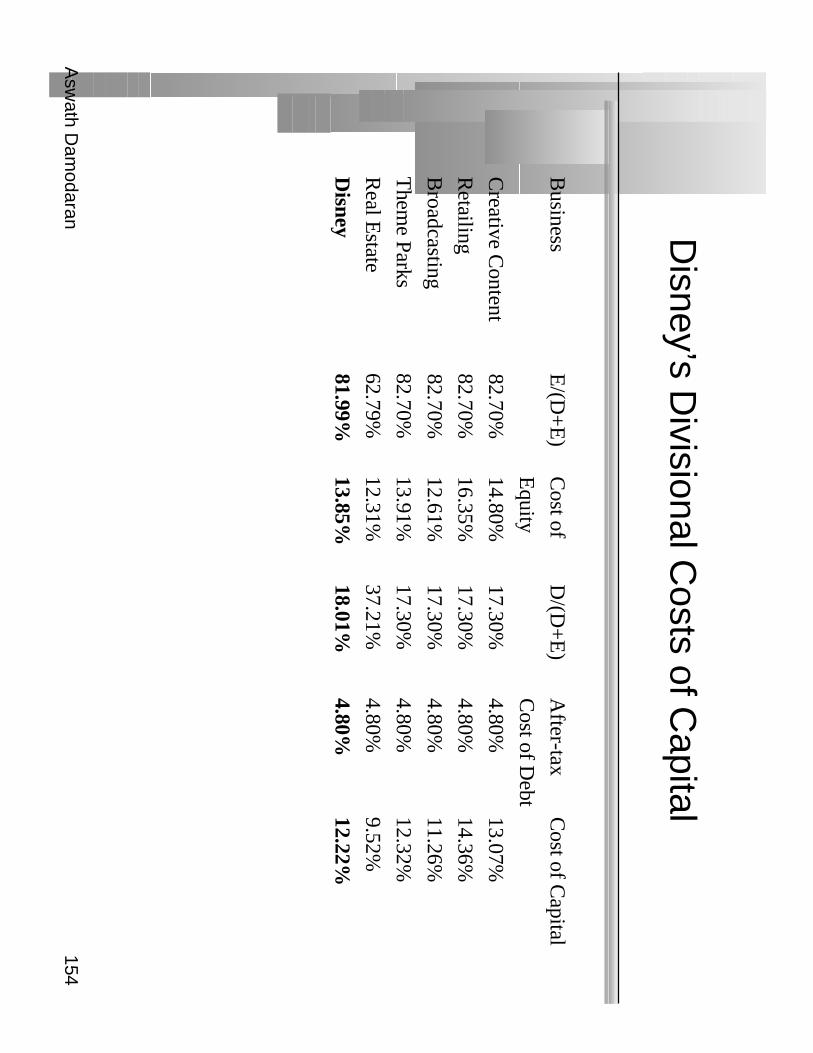
Disney’s D
ivisional Costs of C
apital
Business
E/(D
+E
)C
ost of D
/(D+
E)
After-tax
Cost of C
apital
Equity
Cost of D
ebt
Creative C
ontent82.70%
14.80%17.30%
4.80%13.07%
Retailing
82.70%16.35%
17.30%4.80%
14.36%
Broadcasting
82.70%12.61%
17.30%4.80%
11.26%
Them
e Parks82.70%
13.91%17.30%
4.80%12.32%
Real E
state62.79%
12.31%37.21%
4.80%9.52%
Disney
81.99%13.85%
18.01%4.80%
12.22%
Asw
ath Dam
odaran155
A
pplication Test: E
stimating C
ost of Capital
Using the bottom
-up unlevered beta that you computed for your firm
,and the values of debt and equity you have estim
ated for your firm,
estimate a bottom
-up levered beta and cost of equity for your firm.
Based upon the costs of equity and debt that you have estim
ated, andthe w
eights for each, estimate the cost of capital for your firm
.
How
different would your cost of capital have been, if you used book
value weights?
Asw
ath Dam
odaran156
Choosing a H
urdle Rate
Either the cost of equity or the cost of capital can be used as a hurdle
rate, depending upon whether the returns m
easured are to equityinvestors or to all claim
holders on the firm (capital)
If returns are measured to equity investors, the appropriate hurdle rate
is the cost of equity.
If returns are measured to capital (or the firm
), the appropriate hurdlerate is the cost of capital.

Asw
ath Dam
odaran157
Back to F
irst Principles
Invest in projects that yield a return greater than the minim
umacceptable hurdle rate.•
The hurdle rate should be higher for riskier projects and reflect the
financing mix used - ow
ners’ funds (equity) or borrowed m
oney(debt)
•R
eturns on projects should be measured based on cash flow
s generatedand the tim
ing of these cash flows; they should also consider both positive
and negative side effects of these projects.
Choose a financing m
ix that minim
izes the hurdle rate and matches the
assets being financed.
If there are not enough investments that earn the hurdle rate, return the
cash to stockholders.•
The form
of returns - dividends and stock buybacks - will depend upon
the stockholders’ characteristics.