investment community meeting - cerner corporation
TRANSCRIPT

Investment Community Meeting HIMSS Orlando
Marc Naughton Executive Vice President and Chief Financial Officer
February 25, 2014 Health care is too important to stay the same.TM

© 2011 Cerner Corporation. All rights reserved. This document contains Cerner confidential and/or proprietary information which may not be reproduced or transmitted without the express written consent of Cerner. 2
Agenda

© 2011 Cerner Corporation. All rights reserved. This document contains Cerner confidential and/or proprietary information which may not be reproduced or transmitted without the express written consent of Cerner. 3
Safe Harbor Statement
This presentation may contain forward-looking statements that involve a number of risks and
uncertainties. It is important to note that the Company’s performance, and actual results, financial
condition or business could differ materially from those expressed in such forward-looking
statements. Factors that could cause or contribute to such differences include, but are not limited to: (a) the possibility of product-related liabilities; (b) potential claims for system errors and warranties; (c) the possibility of interruption at
our data centers or client support facilities; (d) our proprietary technology may be subject to claims for infringement or misappropriation
of intellectual property rights of others, or may be infringed or misappropriated by others; (e) risks associated with our non-U.S.
operations; (f) risks associated with our ability to effectively hedge exposure to fluctuations in foreign currency exchange rates; (g) the
potential for tax legislation initiatives that could adversely affect our tax position and/or challenges to our tax positions in the United
States and non-U.S. countries; (h) risks associated with our recruitment and retention of key personnel; (i) risks related to our
dependence on third party suppliers; (j) risks inherent with business acquisitions; (k) the potential for losses resulting from asset
impairment charges; (l) risks associated with uncertainty in global economic conditions; (m) changing political, economic, regulatory and
judicial influences; (n) government regulation; (o) significant competition and market changes; (p) variations in our quarterly operating
results; (q) potential inconsistencies in our sales forecasts compared to actual sales; (r) the volatility in the trading price of our common
stock and the timing and volume of market activity; (s) our directors’ authority to issue preferred stock and the anti-takeover provisions in
our corporate governance documents; and (t) material adverse resolution of legal proceedings.
Additional discussion of these and other risks, uncertainties and factors affecting the Company's
business is contained in the Company's periodic filings with the Securities and Exchange
Commission. The reader should not place undue reliance on forward-looking statements, since the
statements speak only as of the date that they are made. The Company undertakes no obligation to
update forward-looking statements to reflect changed assumptions, the occurrence of unanticipated
events or changes in future operating results, financial condition or business over time. A
reconciliation of non-GAAP financial measures discussed in this presentation can be found in the
Appendix to this presentation and the Company’s most recent earnings release that was furnished to
the SEC and posted on the investor section of Cerner.com.
© 2011 Cerner Corporation. All rights reserved. This document contains Cerner confidential and/or proprietary information which may not be reproduced or transmitted without the express written consent of Cerner. 4
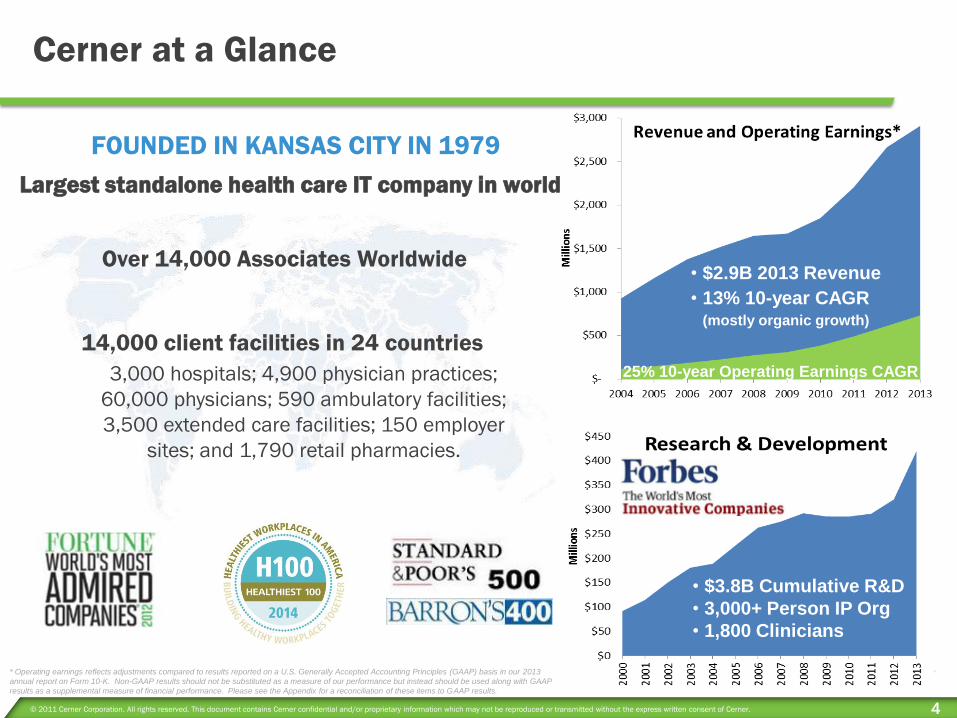
Cerner at a Glance
Over 14,000 Associates Worldwide
* Operating earnings reflects adjustments compared to results reported on a U.S. Generally Accepted Accounting Principles (GAAP) basis in our 2013
annual report on Form 10-K. Non-GAAP results should not be substituted as a measure of our performance but instead should be used along with GAAP
results as a supplemental measure of financial performance. Please see the Appendix for a reconciliation of these items to GAAP results.
• $3.8B Cumulative R&D
• 3,000+ Person IP Org
• 1,800 Clinicians
25% 10-year Operating Earnings CAGR
• $2.9B 2013 Revenue
• 13% 10-year CAGR (mostly organic growth)
14,000 client facilities in 24 countries
3,000 hospitals; 4,900 physician practices;
60,000 physicians; 590 ambulatory facilities;
3,500 extended care facilities; 150 employer
sites; and 1,790 retail pharmacies.
Largest standalone health care IT company in world
FOUNDED IN KANSAS CITY IN 1979

© 2011 Cerner Corporation. All rights reserved. This document contains Cerner confidential and/or proprietary information which may not be reproduced or transmitted without the express written consent of Cerner. 5
2013 Financial Highlights
Income statement Bookings • Up 20% to $3.8B
Revenue • Up 9% to $2.9B
Operating Margin* • Up 220 basis points to 25.1%
EPS* • Up 18% to $1.41
• Met or exceeded guidance 56 / 57 quarters
Balance Sheet and Cash Flow $1.4B cash and investments
$166M debt
Increased investment in R&D and growth
infrastructure resulted in lower 2013 free
cash flow • Expect strong increase in cash flow in 2014
Cash Deployment • Investments in R&D and infrastructure
• $217M repurchase program
• Strategic Acquisitions
$0
$100
$200
$300
$400
$500
$600
$700
$800
2004 2005 2006 2007 2008 2009 2010 2011 2012 2013
$’s
in
Mil
lio
ns
Operating Cash Flow
Free Cash Flow*
*FCF = Operating CF less Capital Expenditures and
Capitalized Software
* Operating margin, earnings per share and free cash flow reflect adjustments compared to results reported on a U.S. Generally Accepted Accounting Principles (GAAP) basis in our 2013 annual report on Form 10-K and
most recent Form 10-Q. Non-GAAP results should not be substituted as a measure of our performance but instead should be used along with GAAP results as a supplemental measure of financial performance. Please see
the Appendix for a reconciliation of these items to GAAP results.
$0.00
$0.20
$0.40
$0.60
$0.80
$1.00
$1.20
$1.40
$1.60
$0
$300
$600
$900
$1,200
$1,500
$1,800
$2,100
$2,400
$2,700
$3,000
'04 '05 '06 '07 '08 '09 '10 '11 '12 '13
EP
S
Reven
ue
($ M
illi
on
s)
Revenue
Earnings Per Share
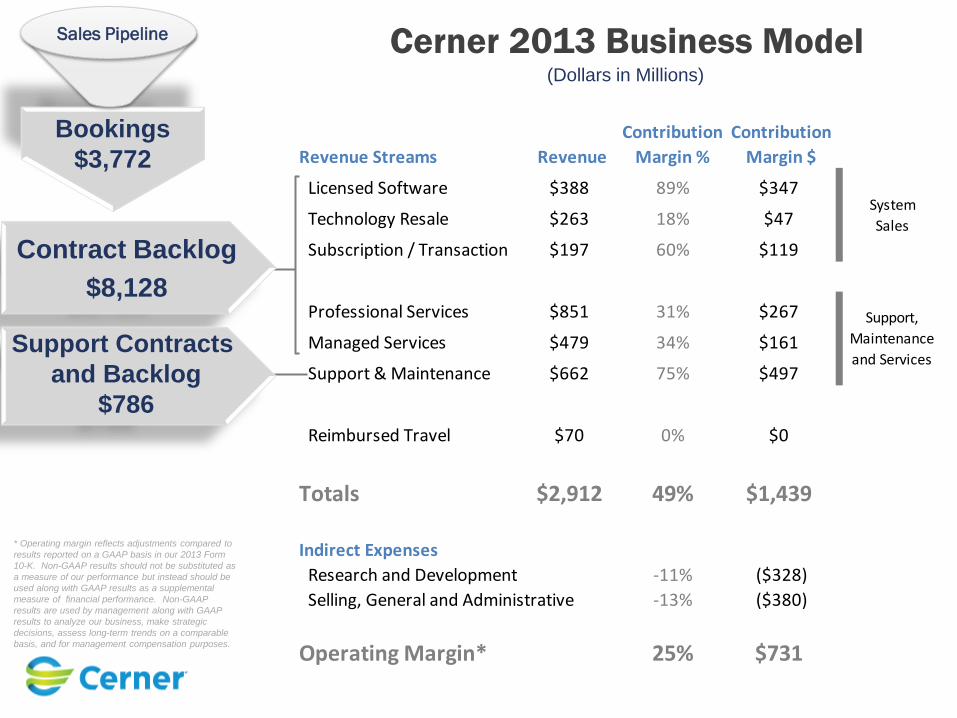
Bookings
$3,772
Cerner 2013 Business Model Sales Pipeline
Contract Backlog
$8,128
Support Contracts
and Backlog
$786
(Dollars in Millions)
* Operating margin reflects adjustments compared to
results reported on a GAAP basis in our 2013 Form
10-K. Non-GAAP results should not be substituted as
a measure of our performance but instead should be
used along with GAAP results as a supplemental
measure of financial performance. Non-GAAP
results are used by management along with GAAP
results to analyze our business, make strategic
decisions, assess long-term trends on a comparable
basis, and for management compensation purposes.
Revenue Streams Revenue
Contribution
Margin %
Contribution
Margin $
Licensed Software $388 89% $347
Technology Resale $263 18% $47
Subscription / Transaction $197 60% $119
Professional Services $851 31% $267
Managed Services $479 34% $161
Support & Maintenance $662 75% $497
Reimbursed Travel $70 0% $0
Totals $2,912 49% $1,439
Indirect Expenses
Research and Development -11% ($328)
Selling, General and Administrative -13% ($380)
Operating Margin* 25% $731
System
Sales
Support,
Maintenance
and Services

Cerner 2013 Business Model
Bookings
$3,772
Sales Pipeline
Contract Backlog
$8,128
Support Contracts
and Backlog
$786
(Dollars in Millions)
* Operating margin reflects adjustments compared to
results reported on a GAAP basis in our 2013 Form
10-K. Non-GAAP results should not be substituted as
a measure of our performance but instead should be
used along with GAAP results as a supplemental
measure of financial performance. Non-GAAP
results are used by management along with GAAP
results to analyze our business, make strategic
decisions, assess long-term trends on a comparable
basis, and for management compensation purposes.
Revenue Streams Revenue
Contribution
Margin %
Contribution
Margin $
Licensed Software $388 89% $347
Technology Resale $263 18% $47
Subscription / Transaction $197 60% $119
Professional Services $851 31% $267
Managed Services $479 34% $161
Support & Maintenance $662 75% $497
Reimbursed Travel $70 0% $0
Totals $2,912 49% $1,439
Indirect Expenses
Research and Development -11% ($328)
Selling, General and Administrative -13% ($380)
Operating Margin* 25% $731
System
Sales
Support,
Maintenance
and Services
Revenue up 12%
~20% of total is SaaS
3-year CAGR 13%
Revenue down 33% on weak device resale
Contribution margin % up from 13% to 18%
on better mix
Margin dollars only down $5M
Revenue up 19% on strong
growth in Subscriptions
Contribution Margin up to
60% from 58% on expense
leverage
Revenue up 15%
Contribution margin up to
34% from 33% on fixed cost
leverage
Revenue up 24%
Contribution margin up from 30% to 31%
Strong leverage in traditional services and
improving Works margins
Revenue up 10%
Contribution margin steady at 75%
Generating approximately $500M of
recurring margin (funds R&D)
2013 Compared to 2012
R&D and SG&A remained
same % of revenue, but
declined as % of gross
margin dollars

© 2011 Cerner Corporation. All rights reserved. This document contains Cerner confidential and/or proprietary information which may not be reproduced or transmitted without the express written consent of Cerner. 8
Increasing Visibility and Profitability
2013 Revenue Mix Summary
Recurring (47%): Managed Services, Support &
Maintenance, Subscriptions
Visible (30%): Professional Services
Non-Recurring (23%): Licensed Software, Technology
Resale
* Operating margin reflects adjustments compared to results reported on a GAAP basis in our 2013 Form 10-K. Non-GAAP results should not be substituted as a measure of our
performance but instead should be used along with GAAP results as a supplemental measure of financial performance. Non-GAAP results are used by management along with
GAAP results to analyze our business, make strategic decisions, assess long-term trends on a comparable basis, and for management compensation purposes.
Margin Growth and Visibility
Operating Margin 9% to 25% since 2003
Source of margin from 45% visible to 73%
Revenue Visibility Remains Strong
77% of Revenue Recurring or Visible
© 2011 Cerner Corporation. All rights reserved. This document contains Cerner confidential and/or proprietary information which may not be reproduced or transmitted without the express written consent of Cerner. 9
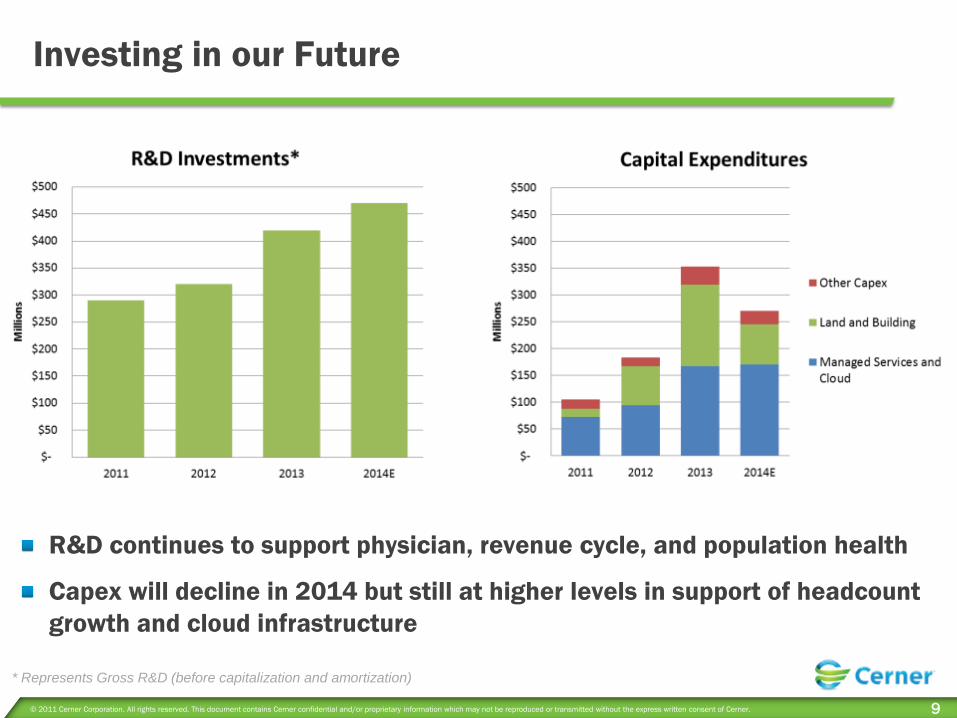
Investing in our Future
* Represents Gross R&D (before capitalization and amortization)
R&D continues to support physician, revenue cycle, and population health
Capex will decline in 2014 but still at higher levels in support of headcount
growth and cloud infrastructure

© 2011 Cerner Corporation. All rights reserved. This document contains Cerner confidential and/or proprietary information which may not be reproduced or transmitted without the express written consent of Cerner. 10
Growth Initiatives Support Strong Growth
Growth scenarios do
not represent formal
financial guidance.

© 2011 Cerner Corporation. All rights reserved. This document contains Cerner confidential and/or proprietary information which may not be reproduced or transmitted without the express written consent of Cerner. 11
Guidance as of February 4, 2014
Reg FD Disclaimer – This slide reflects guidance provided in the most recent earnings press release and
does not imply a reiteration or update of guidance.
Metric Q114 2014
Revenue $770M - $810M $3.2B - $3.4B
Adjusted Diluted Earnings Per Share $0.36 - $0.37 $1.62 - $1.67
New Business Bookings $860M - $930M
Share-based Compensation Expense $0.03 $0.11 - $0.12

Marketplace
Zane Burke President

© 2011 Cerner Corporation. All rights reserved. This document contains Cerner confidential and/or proprietary information which may not be reproduced or transmitted without the express written consent of Cerner. 13
2013 Highlights
Record Bookings of $3.8B
Up 20% on very tough comparable
Growth in base and new footprints
>$1B of new footprint bookings
• Strong win rate
Physician market success
Bookings/Revenue growth of 42%/24%
18 signature displacements
Added 16,000 providers, now over
60,000
Strong ITWorks and Revenue Cycle
ITWorks revenue up 53% to $184M
Revenue Cycle up 51% to $156M
Launch of
Platform Delivered
Four Regional Pilots Launched

© 2011 Cerner Corporation. All rights reserved. This document contains Cerner confidential and/or proprietary information which may not be reproduced or transmitted without the express written consent of Cerner. 14
Strong Pipeline and Competitiveness
Pipeline
More than doubled since
end of 2010
• After bookings of $9.6B in
2011-2013
All categories experiencing
sustained upward trend
Competitiveness
Win rate doubled since 2010
Investments in physician experience and
revenue cycle paying off
Differentiation in population health, which is
playing bigger role in selection process
EMR-agnostic solutions contributing to success
outside base
• Population health and device connectivity

© 2011 Cerner Corporation. All rights reserved. This document contains Cerner confidential and/or proprietary information which may not be reproduced or transmitted without the express written consent of Cerner. 15
Marketplace Trends
Raining Measures
and Mandates
Driving Focus on Quality and Costs
IT biggest remaining
lever – Cerner solutions &
services align with client challenges
Consolidation
Providers seeking scale
across continuum
Cerner Clients Leading
Industry Winners
and Losers
Gap after top two widening
Cerner trend very positive
Another EMR Wave
Expect approx. half of market to
evaluate options
Cerner best positioned
Revenue Cycle
Integrated clinical /
revenue cycle clearly favored
Significant Cerner
Opportunity
Population Health
Shift to at-risk model
Cerner’s approach:
Real Time
Actionable in Workflow
Programmable

© 2014 Cerner Corporation. All rights reserved. This document contains Cerner confidential and/or proprietary information which may not be reproduced or transmitted without the express written consent of Cerner. 16
EHR Incentive Program
ICD-10 Value-Based Purchasing
Readmission Reduction Program
New Electronic Claims Submission Rules
Increased Quality Metrics
Raining Measures & Mandates
Driving focus on Quality and Costs
IT biggest remaining lever

© 2013 Cerner Corporation. All rights reserved. This document contains Cerner confidential and/or proprietary information which may not be reproduced or transmitted without the express written consent of Cerner. 17
-30
-10
10
30
50
70
90
110
130128
26 23
12
2 6
116
24 18
-12 -13
-25
104
11
-7
Acq
uir
ed H
osp
ita
ls
Potential HIT impact of Hospital M&A 2013 Cumulative Year
MEDITECH
Cerner clients accounted for 61% of buying activity
*Total Acquisitions – Total acquisitions by clients
**Potential Losses – Total acquisitions by competitors clients
Source: HIMSS Analytics 2013
**
*
EMR footprint in 17 of top 30
U.S. Health Systems

EMR Waves Transition to Population Health
2009 2010 2011 2012 2013 2014 2015 2016 2017 2018
HITECH MU Stage 1
Starts
VBP &
Readmissions
MU Stage 2
Starts
ICD-10
Transition MU Stage 3
Starts
P.P.A.C.A
MU Stage 1
Rules Finalized MU Stage 2
Rules Finalized ACO Rules
Released
Population Health
Adoption Curve (Estimated)
EMR Adoption Curves (Estimated)
EMR Next Wave Drivers Replacing Outdated Technology
Cost Control
Health System Consolidation
Choosing Supplier With Vision
Fee-for-Service Shifts to At-Risk
Mostly
Replacement
Two suppliers
share most of
business
Greenfield and
upgrades of
existing EMR
Multiple suppliers
benefit
Greenfield
New Competitive
Landscape
Incumbent
Advantage

© 2011 Cerner Corporation. All rights reserved. This document contains Cerner confidential and/or proprietary information which may not be reproduced or transmitted without the express written consent of Cerner. 19
2014 Areas of Focus and Opportunity
• ITWorks, Revenue Cycle, Ambulatory
• EMR to sites acquired by our clients or not yet using Cerner
• Over 200 solutions and services
Grow within our client base
• More competitive than ever - 2013 record year in over-200 bed systems
• CommunityWorks Best in KLAS
• Another wave of EMR purchases
Continue new footprint success
• Behavioral Health, Ambulatory Surgery Centers, Home Care, Extended Care, Rehabilitation
Continuum of Care
• Healthe Intent Smart Registries™ and new PHM tools
Contributions from new population health solutions
• Important global go lives
• Opportunities for growth in Middle East, U.K., Australia, Canada, Brazil
Global execution and growth

Cerner Millennium® localized in four
languages: English, Spanish, French, German
Stage 7 Clients: Spain: Hospital Marina Salud de Dénia
Stage 6 Clients: UAE: Al Ain Hospital //Al Rahba Hospital// Madinat Zayed - Al Gharbia Hospitals// Corniche Hospital// Tawam Hospital //
Chile: Clínica las Condes
France: Centre Hospitalier de Belfort Montbéliard // Centre Hospitalier de Valenciennes //
Saudi Arabia: King Faisal Specialist Hospital & Research Center, Riyadh and Jeddah
Canada: North York General Hospital
Malaysia: Prince Court Medical Centre
2,000 Associates
Live and work outside the US
400+ Millennium facilities outside the USA
USA
1979
Saudi
Arabia
1991 Germany
1992
Malaysia
1996
Australia
1991
Spain
2005 Ireland
2005
Egypt
2005
Chile
2008
Qatar
2008
France
2005
Canada
1985
24 Total
Countries
United Arab
Emirates
2004 India
2004
Argentina
2000
Austria
1999
Switzerland
2002
Cayman Islands
2002
Singapore
1990
UK
1987
Aruba
2008 Morocco
2005
Mexico
2012
Unmatched Global Experience
$0
$50
$100
$150
$200
$250
$300
$350
$400
'04 '05 '06 '07 '08 '09 '10 '11 '12 '13
Mil
lio
ns
Global Revenue
Brazil
2013

Revenue Cycle
Rick Heise Senior Vice President, Revenue Cycle
Bill Wing Executive Vice President and Chief Operating Officer, Adventist Health

© 2011 Cerner Corporation. All rights reserved. This document contains Cerner confidential and/or proprietary information which may not be reproduced or transmitted without the express written consent of Cerner. 22
Revenue Cycle Highlights
Strong Growth and Operational
Progress
Revenue up 51% to $156M in 2013
• Strength across all revenue cycle
solutions and services
• Innovation Differentiation
Case Management (over 100 hospitals live)
Contract Management (GA December)
Delivering Patient Accounting
• Over 900 live sites
150 hospitals; 800 clinics
Marketplace
Significant demand for fully integrated
platform
Large pipeline in existing base and part
of all new RFPs
Demand not interrupted by ICD-10

© 2011 Cerner Corporation. All rights reserved. This document contains Cerner confidential and/or proprietary information which may not be reproduced or transmitted without the express written consent of Cerner. 23
RevWorks – Solutions and Services
Approach
Partner with client to manage revenue
cycle operations
Modernize revenue cycle by innovating
real time – remove human intervention
Focus on controlling cost to collect
Preparing for future reimbursement
models
Outcomes
Top Line Growth
Client Alignment on Financial strategy
• Platform to support Population Health
economics
Patient Attribution and Financial ROI
• Health costs reduction through patient
stratification and proactive health
approach
• Reduced variation in delivery of services
*Represents Ambulatory and Acute Clients

Integrating to Win: The Power of Clinical and Financial Information

Who We Are
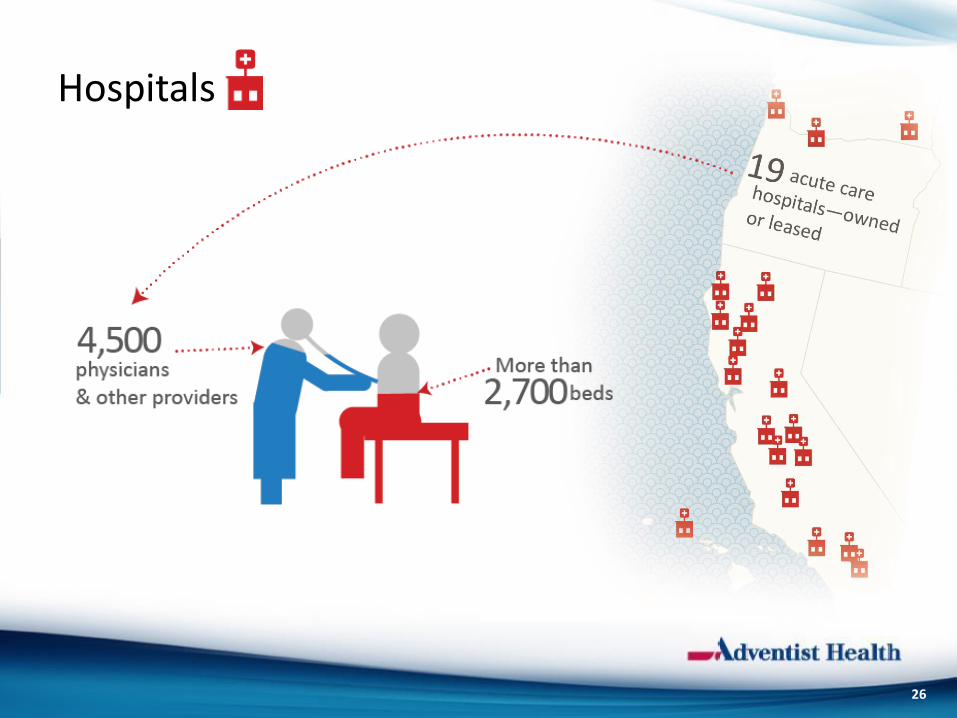
Hospitals
26

Physician Services
27

Workforce
28

Financials
Net Patient Revenue $2.7 billion
EBIDA $298.0 million
Net Income $133.1 million
Admissions 126,210
ED Visits 512,932
OP Visits 2,411,632
Rural Health Clinic Visits 817,900
Patient Days 569,530
Home Care Visits 227,662
Hospice Days 90,789
FYE 12/31/2012
29

Challenges Ahead

From Volume-Centric Care to Person-Centric Health
Population Care Population
Health
FFS +
Avoidable Cost
Bundles & Narrow Network
The Transition
Avoid or Manage Costs (Reactive)
Provider assumes risk on limited basis; majority of reimbursement remains fee-for-service (FFS)
Manage Patients/Members (Proactive)
Risk
Provider assumes significant risk for care costs, outcomes; may be reimbursed on capitated model
31

4.49% 4.0%
-20%
-15%
-10%
-5%
0%
5%
10% 2012 - 2017 Forecasted Performance
$235M
$650M
Adventist Health’s Strategic Journey
Op
erat
ing
Mar
gin
32
Population Care Population Health
FFS +
Avoidable Cost
Bundles & Narrow Network
The Transition
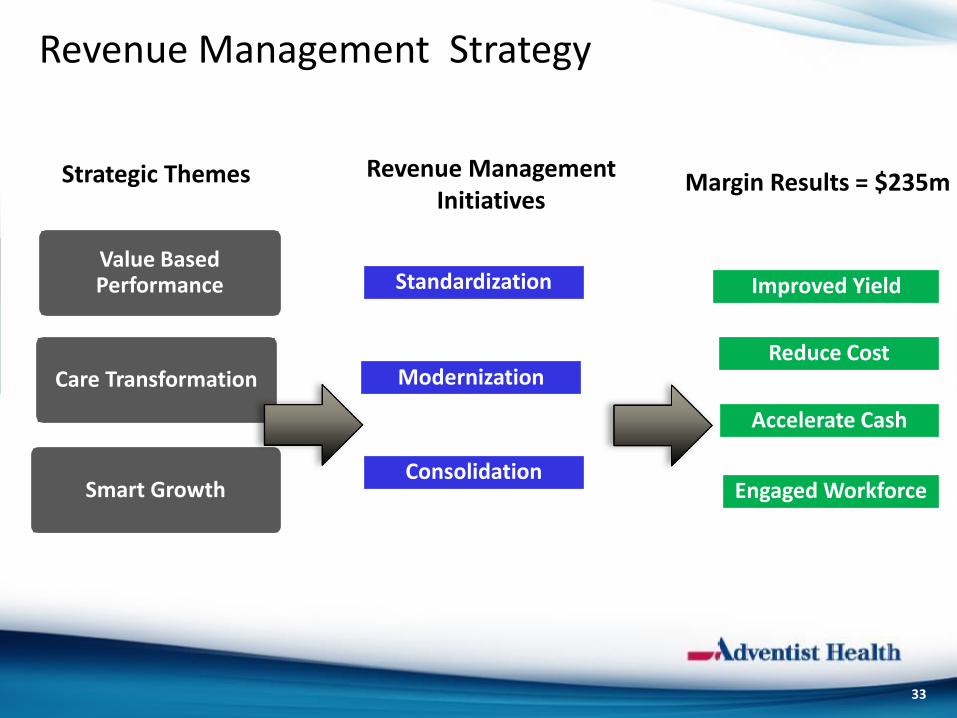
Value Based Performance
Care Transformation
Smart Growth
Strategic Themes Margin Results = $235m Revenue Management
Initiatives
Revenue Management Strategy
Operating Margin $235M
Consolidation
Modernization
Standardization
Reduce Cost
33
Accelerate Cash
Improved Yield
Engaged Workforce

Current State:
Spend: $208M*
Head Count: 2,557
Databases: 20
Bolt-ons: 15
Total Claims: 3.2M+
Cost-to-Collect: 4.9%*
No Centralized Governance
Future State:
Top Quartile
Cost to Collect: 2.78%
Cash Metrics
Single Database
Minimal Bolt-ons
Centralized Governance
*Spend represents all costs; cost-to-collect represents Patient Access, HIM and PFS for benchmarking purposes
Revenue Cycle Journey
34

Closing Thoughts: Revenue Cycle Vision
Modernization “Edge” Upgrade Optimize Adoption Maintenance Innovate
2013 2016 2014 2015 2017
Standardization
Consolidation
Clinically Driven Revenue Cycle
Top Quartile = $235M Improvement in Margin
ICD-10
35
Innovation: Beyond “Revenue Cycle”

Partnership Alignment - Beyond Revenue Cycle
36
Alignment Strategies with Cerner
• Value Based Performance - attaining performance excellence by achieving Top Quartile: • Revenue Management
• Quality and patient safety performance
• Patient experience
• Smart Growth • Expanding Access to Care
• Care Transformation - Delivering population-based care

Advocate Cerner Collaboration Innovation in Population Health Management
Mike Englehart
President
Advocate Physician Partners
Rishi Sikka, MD
SVP, Clinical Transformation
Advocate Health Care
Matthew Swindells
SVP, Population Health & Global Strategy

© 2011 Cerner Corporation. All rights reserved. This document contains Cerner confidential and/or proprietary information which may not be reproduced or transmitted without the express written consent of Cerner. 38
Population Health
Know Engage
Manage
Member / Wellness solutions
Acute / Ambulatory solutions
Long term and Home care
Research
Smart Registries
Predictive modelling
Programmable real time platform
Analytics / Business Intelligence
Care Coordination
Population Health Record
Clinical Programs
Population Health Contract Management
Provider Network Management
Workflow and Algorithm Builders and Editors
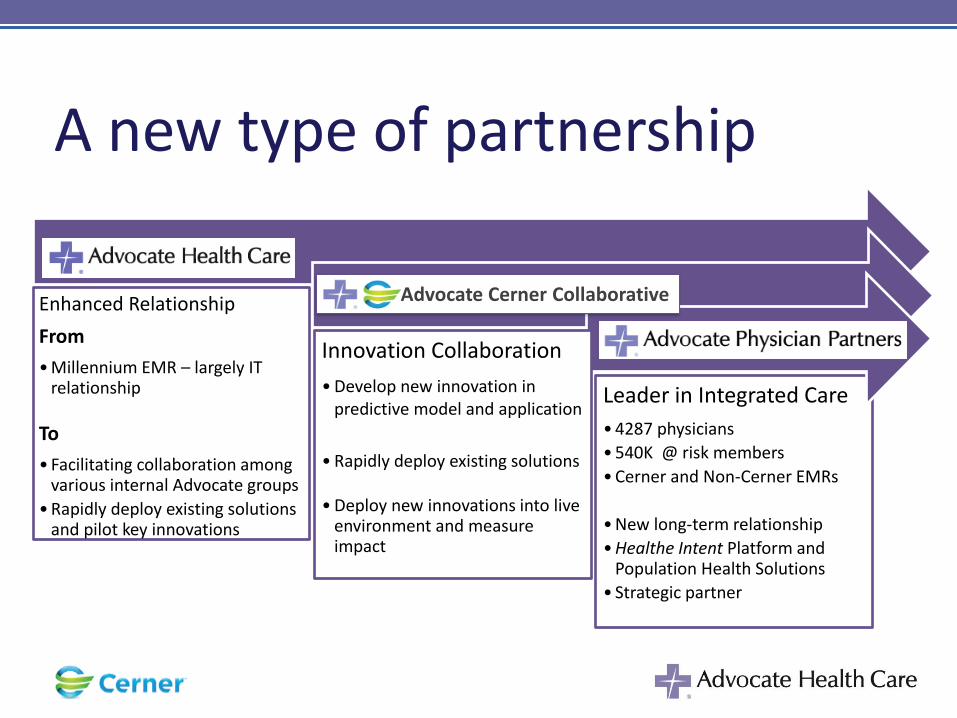
A new type of partnership
Enhanced Relationship
From
• Millennium EMR – largely IT relationship
To
• Facilitating collaboration among various internal Advocate groups
• Rapidly deploy existing solutions and pilot key innovations
Leader in Integrated Care
• 4287 physicians
• 540K @ risk members
• Cerner and Non-Cerner EMRs
• New long-term relationship
• Healthe Intent Platform and Population Health Solutions
• Strategic partner
Innovation Collaboration
• Develop new innovation in predictive model and application
• Rapidly deploy existing solutions
• Deploy new innovations into live environment and measure impact
Advocate Cerner Collaborative

Mike Englehart
President
Advocate Physician Partners

Advocate Health Care Advocate Physician Partners
• $4.7 Billion Annual Revenue
– AA Rated
• 12 Acute Care Hospitals
– 1 Children’s Hospital
– 5 Level 1 Trauma Centers
– 4 Major Teaching Hospitals
– 4 Magnet Designations
• Over 250 Sites of Care
– Advocate Medical Group
– Dreyer Medical Clinic
– Occupational Health
– Imaging Centers
– Immediate Care Centers
– Surgery Centers
– Home Health/Hospice
• Physician Membership
– 1,200 Primary Care Physicians
– 2,800 Specialist Physicians
– Total membership includes 1000
Advocate-employed Physicians
• 9 Physician Hospital Organizations
(PHO’s)
• 230,000 Capitated Lives/ 700,000
PPO Lives/230,000 Attributable
Lives
• Two ACOs
– MSSP
– Commercial

42
Shift to Accountability
Fee-for-Service Pay-for-
Performance
Episodic
Bundling
Partial Risk /
Shared Savings
Full Risk:
% of Premium
HMO
Episodic Cost Total Cost
Provider Accountability
Continuum of Payment Models
Patient Centered Medical Home Accountable Care Organization

43
Connected Data Sources

Population Health Management
Registries – chronic conditions and wellness registries, individual person views
Scorecards – provider and organization performance evaluated against targets
Programmable – algorithms defined to identify population, measure quality, attribution
Analytics – dashboards and adhoc reports
Medications – manage medication utilization and generic/therapeutic alternatives
Healthe Intent Platform– Mutipurpose programmable platform that aggregates, normalizes
and standardizes clinical, financial and broader population data
Smart Registries
44

45

46

Smart Registries Home Page
Scorecard Treemap Scorecard Registry Person View
Medication Utilization
Builder/Editors
Registry Treemap Analytics Dashboard
Healthe Intent Platform
Smart Registries

Rishi Sikka, MD
SVP, Clinical Transformation
Advocate Health Care

Advocate Cerner Collaboration
Model Deployment
Analytic Models
Data Platform
49
Core Competencies

Analytics and Modelling
• All cause readmission model
– Performing approximately 20% better than industry average
– Commercialization to 120 non-Advocate facilities and counting
• Transition of care model
– Predicting the best place to transition a patient from the inpatient setting
– Estimate $230 MM total cost of care savings to Advocate
• ED revisit model
– Estimate $3 MM total cost of care savings for Advocate
• Risk of hospitalization from ambulatory setting
• Population health clustering
50

Readmission Prediction Model High predictive ability
Utilized reliable & clinically-related data
Internal validation
Scalable in large populations

Population Health 101: Stratifying by Cost Only
Case Management
Disease Management
Supported Self-Care
Prevention and Wellness Promotion
Complex 12.0%
Common
Multi-
Chronic
15.8%
Single
Chronic
14.6%
Healthy 35.0%
No Claims 22.5%
52

Population Clustering: Apps for Impact, Adherence and Intervention
Wellness
Co
mp
lexi
ty
Goal Line
Opportunity
Value
53

Intermountain Healthcare Strategic Partnership
Jeff Townsend Executive Vice President and Chief of Staff
Bert Zimmerli Chief Financial Officer, Executive Vice President
Intermountain Healthcare

Intermountain Healthcare and Cerner The Future in Health IT
Bert Zimmerli, CFO, Executive Vice President

Since 1975 • 22 hospitals • 2,784 licensed beds
Since 1983 • Health plans • 635,000 members
Since 1994 • 1,200 employed physicians • 530 advanced practice clinicians
Since 1997 • 9 key service lines
Highly Integrated Health System
Hospitals
SelectHealth
Medical Group
Clinical Programs
Our Charge: To become a “Model Healthcare System”

Core Business
Our efforts are ultimately centered around what matters most to our patients, employees, members and communities:
Perfecting the Clinical Work Process
Best clinical care in the world doesn’t matter
if no one can afford it.

The Intermountain Way
Improved quality & service
Evidence-based practice
Systematic approach- measure & improve
SUCCESS Always led by clinical but including operational, financial and even governance!
ALWAYS DO THE RIGHT THING!

Perfecting the clinical work process through our long-standing commitment to evidence-based medicine
Pioneer in medical informatics
Largest data warehouse in the industry
Invaluable resource towards furthering healthcare
delivery and reducing costs
Data and Medicine

60

Quality of Care State Rankings
Utah Rank
Utah Rate
U.S. Average
Diff.
Healthcare cost per capita 1 $3,972 $7,026 -43%
Medicare admits / 100,000 beneficiaries 1 3,725 6,291 -41%
Infant mortality percentage 1 0.45% 0.68% -34%
Medicare 30-day hospital readmission rate 2 13.6 17.5 -22%
Mortality amenable to healthcare / 100,000 2 64.1 89.9 -29%
Home health patients with hosp. admission 1 21.2 28.7 -26%
Percent asthmatics with ER visit 1 10.8% 16.3% -34%
Source: Commonwealth Fund
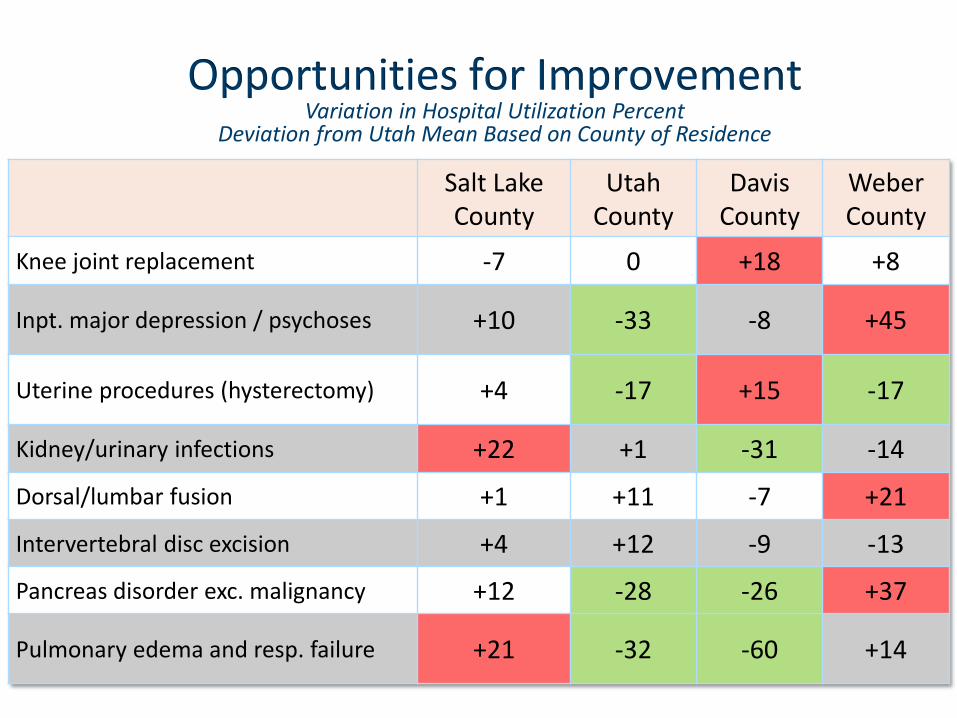
Opportunities for Improvement Variation in Hospital Utilization Percent
Deviation from Utah Mean Based on County of Residence
Salt Lake County
Utah County
Davis County
Weber County
Knee joint replacement -7 0 +18 +8
Inpt. major depression / psychoses +10 -33 -8 +45
Uterine procedures (hysterectomy) +4 -17 +15 -17
Kidney/urinary infections +22 +1 -31 -14
Dorsal/lumbar fusion +1 +11 -7 +21
Intervertebral disc excision +4 +12 -9 -13
Pancreas disorder exc. malignancy +12 -28 -26 +37
Pulmonary edema and resp. failure +21 -32 -60 +14

Aa1/Stable AA+/Stable
“Intermountain has a long track record of producing consistently exceptional results by employing financial and operational best practices under the direction of a seasoned management and Board of Trustees.” — Moody’s, 2013
“A strong board of trustees committed to consistent improvement in governance and active in the setting and monitoring of key medical and safety indicators.” — Standard & Poor’s, 2005

Principles that never change
1. Not for profit must never mean not as efficient

Principles that never change
2. Operate as a system with no unnecessary variation or waste… “Healthcare is a team sport.”
3. Understand and implement best practices including those from other industries and other countries
4. Invest in R&D and process development – always supported by data and metrics… “Process without metrics is religion.”

Principles that never change
5. Always do the right thing which is usually the best long-term financial decision

Where we are going

Clinical excellence Aligned incentives
Efficient operations
Engaged, informed patients
Engaged communities
Transforming Healthcare To Achieve Better Health and Cost Outcomes

Being the Best
“A good hockey player skates to where the puck is…
A GREAT hockey player skates to where the puck is going to be.”
- Wayne Gretzky

70
• Mobile Outreach Focus
• Service Oriented Architecture
• Activity Based Costing

An Investment with a Strategic Partner
• Strong leadership and vision
• Similar company culture
• Modern infrastructure and commitment to standards
• Innovative and forward looking
• Experience with implementation and co-development
We’re all in!

WE ARE THE BRAND
THIS IS PERSONAL

Intermountain Healthcare Strategic Partnership
Jeff Townsend Executive Vice President and Chief of Staff

© 2011 Cerner Corporation. All rights reserved. This document contains Cerner confidential and/or proprietary information which may not be reproduced or transmitted without the express written consent of Cerner. 74
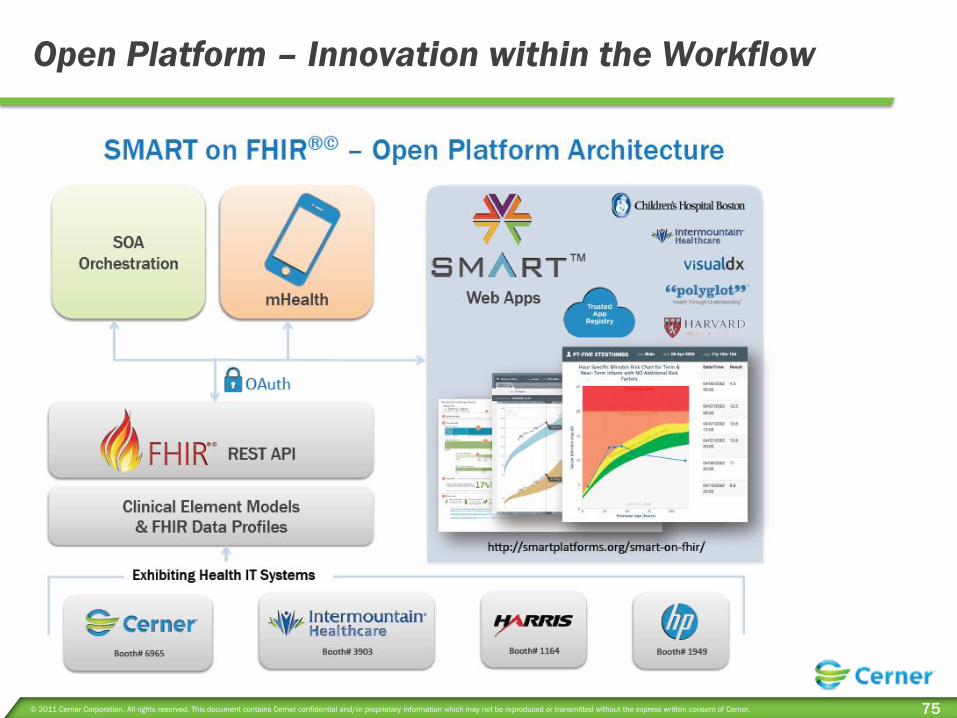
“Accelerating Clinical Computing by a Decade”
Open
Platform
Activity
Based
Costing
Transformation
Lab
Care
Process
Models
Innovation Roadmap to a
Learning Healthcare System
© 2011 Cerner Corporation. All rights reserved. This document contains Cerner confidential and/or proprietary information which may not be reproduced or transmitted without the express written consent of Cerner. 75
Open Platform – Innovation within the Workflow

© 2011 Cerner Corporation. All rights reserved. This document contains Cerner confidential and/or proprietary information which may not be reproduced or transmitted without the express written consent of Cerner. 76
Open Platform – Innovation within the Workflow
Adaptive “Plug-In”
User & Patient Context
Concept Profiles
Conditions & Medications
Workflow Intelligence
Dynamic TOC
PowerChart Actions
Clinical Decision Support

© 2011 Cerner Corporation. All rights reserved. This document contains Cerner confidential and/or proprietary information which may not be reproduced or transmitted without the express written consent of Cerner. 77
Intermountain - Care Process Models
• Developed by interdisciplinary team of healthcare professionals with ongoing
Management and Governance
• Are based on current evidence and accepted expert opinion
• Embedded within Clinical workflows with Decision Support
• Protocol Adherence
• Clinical Outcome
• Economic impact
• Service experience

© 2011 Cerner Corporation. All rights reserved. This document contains Cerner confidential and/or proprietary information which may not be reproduced or transmitted without the express written consent of Cerner. 78
Care Process Model Library
Content + Decision Support + Apps
Behavior Health • ADHD • Bipolar Disorder • Delirium Management • Depression • Eating Disorder • Mental Health / Primary Care
Integration • Restraints • Substance Abuse • Suicide Risks
Cardiovascular • Acute Ischemic Stroke • Acute Myocardial Infarction • Anemia – Perioperative Management • Anticoagulation • Antiplatelet & Anticoagulation after
Coronary Stent Placement • Atrial Fibrillation • Cath Lab – Venue Efficiency • Fluid Volume Excess • Heart Failure • Hyperlipidemia • Hypertension • IVD / CAD • Perioperative Antiplatelet for CAD
Imaging Services • CT Pulmonary Angiogram for PE
Intensive Medicine • Acute Ischemic Stroke • Ectopic Pregnancy • Febrile Infant – ED • Glycemic Control • Moderate Sedation • Rapid Response Team • Sepsis • VTE Prevention
Collaborative Pharmacy • Antibiotics Stewardship Program • Empiric Therapy Advisor • Generic & Therapeutic Alternatives • Medication Adherence • Medication Utilization Management • Pharmacy Collaboration for
Dyslipidemia, DM & Hypertension • Pharmacy Worklist • Transfusion Management • VTE Management
Pediatric Specialty CPMs • Asthma • Childhood Immunizations • Diabetes • Febrile Infant • Pediatric Wellness • Pneumonia (CAP) • Sinusitis, Acute • Weight Management
Pain Services • Acute Pain Management • Chronic Non-cancer Pain • Low Back Pain • Opioid Use in Lactating Mothers • Rehab Pain Management
Primary Care • ADHD
• Adult Wellness • Asthma • Bronchitis • Chronic Kidney Disease
• COPD
• Diabetes - Adult • Hypertension • Lifestyle and Weight Management • Low Back Pain • Mental Health / Primary Care
Integration
• Obstructive Sleep Apnea
• Pneumonia (CAP) • Senior Wellness
• Sinusitis, Acute - Pediatric
• Smoking Cessation
Surgical Services • Anemia Management • Capturing Indications for RBC
Transfusion
• Multidisciplinary Care for Colon Surgery
• Opioid Use in the Lactating Mother • Surgical Site Infection Prevention
• Surgical Venue Efficiencies
Infection Control • Antimicrobial Stewardship * • Catheter Related Infections • Monitoring & Surveillance • Regulatory submission • Surgical Site Infection Prevention • Ventilator Associated Events • Hand Hygiene
Acute Care - Adult • Activity Tolerance & Impaired Mobility • Dysphasia Management • Falls Prevention & Management • Skin Breakdown • Pressure Ulcer Prevention • ED Venue Efficiency • Palliative Care * • Pneumonia (CAP) • Readmission Management
Acute Care - Pediatric • Catheter Related Infection
• Falls Prevention & Management • Pain Management • Readmission Management • Skin Breakdown
Women & Newborns • Ectopic Pregnancy • Elective Labor Induction • Gestational Diabetes • Hydronephrosis • Hyperemesis • Neonatal Hypoglycemia • Opioid Use in the Lactating Mother • Premature Rupture of Membranes
(PROM) • Prenatal Care for Maternal Anti-
Erythrocyte Antibodies • Shoulder Dystocia • Urinary Incontinence in Women • Vaginal Birth After Cesarean (VBAC) • Maternity Health • Cancer Screening – Breast, Cervical

79 79
Intermountain Transformation Lab
Booth #3903
Collaborative Workflows with Awareness
Orchestrated Activity Management & Measurement

© 2011 Cerner Corporation. All rights reserved. This document contains Cerner confidential and/or proprietary information which may not be reproduced or transmitted without the express written consent of Cerner. 80
Activity Based EMR (Modeling, Planning, Costing, Outcomes)
– Componentized Association of Workflow & Evidence
• Problem/Diagnosis - Pneumonia
• Clinical Activity Sets (Orders, Risks, Protocols, Care Decisions)
• Component Activity Master (Adult Monitoring Protocols)
Vitals Capture
• Manual Capture
OR
• Device Integration
• VisiMobile
Vitals Alarming
• One time per
OR
• Continuous
5

© 2011 Cerner Corporation. All rights reserved. This document contains Cerner confidential and/or proprietary information which may not be reproduced or transmitted without the express written consent of Cerner. 81
Care Decisions – (Intelligent Medical Record)
Contextual
Navigation
Moment
Relevant
Summaries
Interactive
Risk
Scoring
Recommended
Actions

Chairman’s Comments and Q&A
Neal Patterson Chairman, Chief Executive Officer and Co-Founder

Health care is too important to stay the same.TM

© 2011 Cerner Corporation. All rights reserved. This document contains Cerner confidential and/or proprietary information which may not be reproduced or transmitted without the express written consent of Cerner. 84
Appendix - Non-GAAP Financial Measures
The presentation of Operating Margin, Earnings per Share, Adjusted Diluted Earnings per Share, Adjusted Net Earnings and Free
Cash Flow (together, the Non-GAAP Financial Measures), are not meant to be considered in isolation, as a substitute for, or
superior to, U.S. Generally Accepted Accounting Principles (GAAP) results and investors should be aware that non-GAAP
financial measures have inherent limitations and should be read only in conjunction with the Company’s consolidated financial
statements prepared in accordance with GAAP. The Non-GAAP Financial Measures may also be different from similar non-GAAP
financial measures used by other companies and may not be comparable to similarly titled captions of other companies due to
potential inconsistencies in the method of calculations. The Company believes that the Non-GAAP Financial Measures are
important to enable investors to better understand and evaluate its ongoing operating results and allows for greater
transparency in the review of its overall financial, operational and economic performance. The Company provides earnings with
and without stock options expense because earnings excluding this expense is used by management along with GAAP results to
analyze its business, make strategic decisions and for management compensation purposes. The Company provides cash flow
with and without capital purchases and software development cost because operating cash flows excluding these expenditures
takes into account the capital expenditures necessary to operate our business. Please see the Company’s earnings release that
was furnished to the SEC and posted on the investor section of Cerner.com for a reconciliation of these items to GAAP results.
($ in millions except Earnings Per Share)
Operating
Earnings
Operating
Margin %
GAAP Operating Earnings 576$ 19.8%
Share-based compensation expense 49
Settlement charge 106
Adjusted Operating Earnings 731$ 25.1%
Net
Earnings
Diluted
Earnings
Per Share
GAAP Net Earnings 398$ 1.13$
Share-based compensation expense, net of tax 30 0.09
Settlement charge, net of tax 68 0.19
Adjusted Net Earnings (non-GAAP) 497$ 1.41$
GAAP Operating Cash Flow 696$
Capital purchases (353)
Capitalized software development costs (175)
Free Cash Flow (Non-GAAP) 168$
Reconciliation of 2013 Non-GAAP Results to GAAP Results*
*More detail on these adjustments and management's use of Non-GAAP results is in our 2013 annual
report on Form 10-K and our current reports on Form 8-K.