cerner corporation (cern) april 5, 2016 · cerner corporation. cerner is a supplier of information...
TRANSCRIPT

Important disclosures appear on the last page of this report.
The Henry Fund Henry B. Tippie School of Management
Casey Farrier Spoden [casey‐[email protected]]
Cerner Corporation (CERN) April 5, 2016
Healthcare Sector – Healthcare information technology Stock Rating Sell
Investment Thesis Target Price $51‐55 We recommend a SELL for Cerner Corporation due to the decreased demand for system sales and the increased pricing power of customers (hospital systems). The HCIT industry grew rapidly from 2009 to 2015 due to government regulations. However, as the industry matures and guidelines are met, Cerner’s growth will slow rapidly to 4% growth from 2020 on. Drivers of Thesis
• Recent winning of $11B bid for the Department of Defense HCIT system that will be slowly implemented in conjunction with Accenture and Leidos over the next 15 years.
• 33% increase in Backlog from 2014 to 2015 booking contracts shows Cerner’s ability to continue selling services to existing customers.
• Cerner’s HealtheIntent system’s ability to scale to and aggregate both Cerner system and outside system population data. The interoperation ability is highly sought after as provider systems continue to merge and need cross‐functional solutions for existing HCIT systems.
• Very low debt (less than 10% leveraged) position Cerner well to carry out acquisitions as necessary to increase their market share or system offerings.
Risks to Thesis • Provider/System focus on decrease costs, plus the current healthcare
industry trend of provider consolidation with force Cerner to compete largely on price.
As providers complete phase one of meaningful use/EMR implementation (98% have a system in place currently), demand for systems will decrease.
Security breaches could threaten the integrity of the record, the reputation of the company by exposing patient/system/payer confidential and protected information
Henry Fund DCF $50.91Henry Fund DDM N/ARelative Multiple $34.82Price Data Current Price $53.7552wk Range $49.59‐75.72Consensus 1yr Target $64.00Key Statistics Market Cap (B) $18.27BShares Outstanding (M) $340.02Institutional Ownership 82.20%Five Year Beta .988Dividend Yield 00.0%Est. 5yr Growth 14.33%Price/Earnings (TTM) 34.86Price/Earnings (FY1) 19.82Price/Sales (TTM) 4.27Price/Book (mrq) 4.80Profitability Operating Margin 20.06%Profit Margin 12.39%Return on Assets (TTM) 10.81%Return on Equity (TTM) 14.51%
Earnings Estimates Year 2013 2014 2015 2016E 2017E 2018E
EPS $1.16 $1.54 $1.57 $1.93 $2.10 $2.22
growth 00.0% 32.76% 1.95% 22.89% 8.59% 5.89%
12 Month Performance Company Description Cerner is a supplier of information technology systems that support clinical, financial, and operational functions within healthcare organizations. The company has two main product lines; Cerner Millenium – a person centric computing platform and HealtheIntent ‐ a cloud based platform for aggregating data across systems and populations. Data Sources: Yahoo Finance, Factset
36.6
14.5 15.6
25.519.6
68.8
0
20
40
60
80
P/E ROE Total D/E
CERN Industry
‐30%
‐25%
‐20%
‐15%
‐10%
‐5%
0%
5%
A M J J A S O N D J F M
CERN S&P 500

Page2
EXECUTIVE SUMMARY
Based on the dire outlook for new system implementation, minimal growth potential and the extremely low valuation outcome, the Henry Fund is recommending a SELL for Cerner Corporation.
Cerner is a supplier of information technology systems that support clinical, financial, and operational functions within healthcare organizations. The company generates revenue is two main business segments. The first segment includes revenue from sales of their actual IT systems which will likely decrease as health organizations ‐ 98% ‐ have already implemented healthcare information technology (HCIT) systems 7. The remaining 2% will begin facing government penalties in 2016.
The second segment includes revenues from support for, maintenance of, and servicing of the existing systems that have already been sold. We believe this revenue segment will maintain a projected year‐over‐year growth rate of 7% vs. 6% for the system sales segment as health organization move toward a maintenance and update phase of system implementation.
The company has two main product lines; Cerner Millenium – a person centric computing platform and HealtheIntent ‐ a cloud based platform for aggregating data across systems and populations.
COMPANY DESCRIPTION
Cerner is a supplier of information technology systems that support clinical, financial, and operational functions within healthcare organizations. The company has two main product lines; Cerner Millenium – a person centric computing platform and HealtheIntent ‐ a cloud based platform for aggregating data across systems and populations.
The company generates revenue in two main ways. The first is by selling the HCIT (Healthcare Information Technology) systems to all types of hospital systems, ambulatory centers, and provider groups. The second way that revenue is generated is by the support, maintenance and servicing of the existing systems in place.
In the charts below we can see that while 29% of revenue comes from system sales while accounting for only 23% of profits due to slightly lower margins on systems than services and support.
The revenue breakdown for FY15 can be seen below:
System Sales
The system sales segment is made up of revenues from the sale of Cerner licensed software, resale of third party technology, upgrade rights, fees for installation of systems, transaction processes and subscriptions. Revenue in this segment increased 36% to $1.3 Billion in 2015 from $946 Million in 2014 2.
We are projecting a 5‐year growth CAGR in this revenue segment of 5.78%, significantly lower than the 5‐year historical CAGR of 16%. This decrease is due to the overall slowing of system sales as most healthcare providers/systems have already implemented EMR/HCIT solutions and are phasing into the improvement of their existing technology. Hospitals and providers are now working to use their systems more efficiently as quality
29%
71%
Revenue Breakdown ‐FY15
Revenues ‐ systemsales
Revenues ‐ support,maintenance &services
23%
77%
Percent of Profits ‐ FY15
System Sales
Support,Maintenance,Service
Data Source: Cerner 10‐K 2015

Page3
metrics and key statistics are increasingly being tied to provider compensation.
Support, Maintenance and Service
Support and maintenance revenues increased from $725 Million in 2014 to $976 Million in 2015 and includes support and maintenance on implemented systems whose revenue were accounted for in the previously discussed system sales segment. Services revenue includes managed and professional services (does not include installation) and this segment increased 28% from 2014 to $2.1 Billion.
We project that growth in this segment will decrease to a compound annual growth rate of 7.04% from 2016 – 2020. This is decreased from a historical growth rate of 20% from 2011 through 2015.
Generally, since the support and maintenance revenue is generated as a result of system sales, they will follow a similar growth pattern which we have accounted for in our revenue projections.
Backlog
Revenue backlog is a significant portion of Cerner’s business model. It represents contracted services and systems that have not yet been recognized as revenue on company income statements. Cerner currently has a backlog of $14.2 Billion, up from $10.6 Billion in 2014.
This backlog is driven primarily by growth in new bookings (new system sales) and contains more long‐term contract systems like the revenue cycle services. Cerner estimates that 27% of current backlog will be recognized as revenue by the end of 2016.
Company Analysis
Cerner Corporation makes money primarily in two ways. The first is through the sales of their proprietary healthcare IT systems, the other is through “solutions” or services that are provided through the implemented system platform.
These provide a wide range of electronic and digital practice management and revenue cycle systems that help to streamline the end to end patient care chain.
The company experienced large growth in the past five years, mainly due to governmental regulations that required providers to implement electronic medical records, which spurred the need for complimentary revenue cycle and practice management systems. However, the deadline for implementation was the end of 2015 and as of this current fiscal year, health systems will be penalized by a 1% reduction in reimbursement per physician if there is not an EMR system in place. This penalty will increase each year. Because of the recently passed deadline, there will be far fewer growth opportunities for companies in the HCIT market. Any growth will likely be sustained only from the upgrades on or new solutions for use with the in place systems or forced by mergers and acquisitions. However, we believe higher rates of M&A will complicate system interoperability as the company tries to combine system strengths.
HealtheIntent
HealtheIntent, a system‐agnostic, near real‐time platform, enables organizations to aggregate health data from multiple sources into a single record to support new models of care. The platform enables care providers to access health records anywhere, anytime to proactively engage patients and manage disease and help prevent illness.
0.00%
5.00%
10.00%
15.00%
20.00%
25.00%
2011‐2015 CAGR 2015‐2020E CAGR
Compound Annual Growth Rate Percentage
System Sales Support, Maintenance, Service
Source Data: Cerner 10‐k

Page4
Millennium
Cerner’s Millennium platform solution enable physicians, nurses and other authorized users to share data and streamline processes across an entire organization. This includes access to an electronic or digital patient information chart in real time, which allows for prompt and accurate decision‐making by providers. The interface also allows physicians to order testing, send prescriptions to pharmacies, and accurately document medical information. This system also allows coders and billers access to pertinent information that simplifies and streamlines the billing and payment process.
Although Cerner has been successful in securing contracts for this HealtheIntent due to the interoperability with most other EMR systems, we do not believe its growth is enough to sway us to maintain our holding. There are other similar systems in the market and organizations/providers that have already implemented a competitor system are unlikely to switch.
RECENT DEVELOPMENTS
Q4 2015 Earnings Results
Cerner released Q4 2015 earnings results on February 16, 2016 and beat analyst EPS estimates by $0.04. They posted earnings of $0.61 EPS when analyst expectations were $0.57 EPS. For the same quarter in 2014, earnings per share were $0.47. Cerner also beat revenue estimates of $1.17 Billion to post revenue of $1.18 Billion in quarter 4. Quarterly revenue has increase 26.9% on a year to year basis 1.
Q1 2016 earnings are scheduled to be released on May 5, 2016. Cerner quarterly EPS targets are set at $0.52 ‐ $0.54 with revenue projections at $1.15 ‐ $1.2 Billion. Full year 2016 Cerner estimates are $2.30 to $2.40 EPS with $4.9 to $5.1 Billion in revenue. Analyst consensus estimates for full year 2016 are $2.36 EPS and $5.02 Billion revenue 3. However, we are less optimistic than analyst consensus estimates and have projected 2016 EPS at $1.92 and revenues at $4.7 Billion.
UHS to implement Cerner revenue cycle
Universal Health Services, Inc. (UHS), the sixth largest hospital management company in the United States, has entered into an agreement to implement Cerner’s clinically driven Millennium Revenue Cycle.
Universal Health Services, Inc. operates (through its subsidiaries) behavioral health facilities, acute care hospitals, and ambulatory centers throughout the United States, Puerto Rico, the United Kingdom and the U.S. Virgin Islands.
Cerner will replace the current UHS INVISION revenue cycle solution. The new Cerner Millennium system will integrate with Cerner Millennium electronic health record (EHR) and HIM health information technology functionality that UHS currently has in place 4.
This will be an enterprise‐wide revenue cycle management system implementation, and will help advance integration between clinical and financial information for UHS. In addition, the contract revenue and sales revenue generation will be good for Cerner growth potential near future as the project rollout begins.
0 50 100 150 200
Community Health Systems…
Hospital Corporation of…
Tenet Healthcare Corp.…
LifePoint Hospitals…
Prime Healthcare Services…
Universal Health Services…
IASIS Healthcare (Franklin,…
Ardent Health Services…
Capella Healthcare (Franklin,…
Steward Health Care System…
Top 10 US for‐profit hospital operators (by # of hospitals)
Source: Statista 2015 data 5.
Page5
Cerner and US Department of Defense
In Q3 2015, the United States government announced that a joint coalition between Cerner, consulting firm Accenture, and Leidos – a defense engineering company – had won a bid to provide healthcare IT services and systems to the US Department of Defense.
This will include comprehensive system implementation in over 55 hospitals and 350 clinics in addition to access on ships, submarines, and other military healthcare operations locations. Over the long life of the project (projected to be close to 15 years) the contract has been estimated by the US government to be worth upwards of $11 Billion.
Even with slow implementation and revenue recognition from this project – the effects are positive for Cerner. This may provide intangible benefits to the company as well. Since the Department of Defense chose to implement their systems, other hospitals and clinics may view the technology as more safe/private/secure which is one of the biggest issues when deciding which system to purchase and implement.
INDUSTRY TRENDS
EMR Mobility
Patients and providers are increasingly interested in access to medical care and information via mobile device. Providers want to provide medical care from their smartphones, and more patients want to access data through mobile devices. To accommodate this need, EHRs will need offer mobile design and functionality. Scheduling and patient chart updates will align with prescribing functions on mobile devices, as well 15.
In addition, more hospitals and clinics are using virtual appointments to diagnose and treat patients. Especially with the increasing number of patients with chronic diseases like diabetes and COPD it is imperative that medical device and equipment companies work with medical information technology systems to produce more user‐friendly/DIY devices.
In conjunction with need for user‐friendly devices, there is also a growing number of devices connected to the internet and the electronic medical systems employed by the clinic/hospital. According to a PwC Health Research
Institute report, internet connected healthcare products are projected to be worth close to $285 billion by 2020. While this offers great opportunities for growth, there is also a growing risk for cyber security breaches with regard to personal and protected medical information and fierce competition from other HCIT companies.
Provider Consolidation
Health systems and providers are increasingly interested in providing high quality care at lower costs, primarily because quality outcomes are being increasingly tied to physician reimbursement and compensation. In recent years, the provider network has been transitioning away from individually‐owned spaces and more toward employment or affiliation with larger hospital systems and organizations. This trend affects the entire HCIT market by greatly decreasing the number of purchasers in the market, largely concentrating purchasing power. Individual physicians have much less power as an employee to dictate purchases of electronic health system.
This trend poses a major threat to overall profitability of the HCIT as larger hospital networks/systems gain more pricing power due to larger orders, and lower customer pool for the firms.
The graph below illustrates the growing trend with physicians to move toward system employment vs. owning their own practice.
Source: Medical Group Management Association Survey Data

Page6
Increased consolidation through M & A (shown in a later table) in the healthcare systems industry continues to lead to higher pricing power of customer will adversely affect the revenue and therefore profitability of Cerner Corporation and the Healthcare IT industry overall.
Population Health
Population Health information is becoming increasingly important given the combination of access to real‐time patient data and the government and industry focus on preventative medicine. Providers was the capability to aggregate large sets of patient data in order to quickly analyze and quickly identify (through statistic and pre‐set metrics) patients who may be at risk for certain outcomes. For example, hospital readmission or risk for diabetes. Both are part of the quality care outcome metrics that are measured and often tied to physician compensation rates.
MARKETS AND COMPETITION
Healthcare Information Technology or HCIT are companies that focus developing software/systems, practice management systems, revenue cycle management system, electronic health records, and the integration of each through the hospital/clinic operation. Companies within this industry compete by selling these systems and accompanying service contracts. They are differentiated primarily in the interactivity of their systems, but sometimes companies also focus on a particular type of client. The cost of switching to a competitor system is also very high.
Cerner provides systems and services to health organization of all sizes, some of their major clients include multi‐state accountable care organizations, academic research facilities, and small, rural, critical access hospitals.
This industry has been largely influence by governmental regulation such as HITECH that require providers to implement electronic medical records. The must also prove meaningful use of those systems by the end of 2015 in the United States or face Medicare reimbursement penalties that increase each year a system is not in place. As of that date, 98% of providers complying with this
regulation. This will result in less growth from the system sales segment.
The chart to the right shows market share of current HCIT companies based on the number of eligible/complying providers as reported to the US government. This shows Cerner in the number four market share position, behind Epic, Meditech, and CPSI. Of the companies listed, only CPSI, Cerner, McKesson, and Allscripts are publicly traded.
It is very unlikely that Cerner will greatly increase its market share through organic growth as there are many other companies providing similar systems/services and have a larger market share. In addition, the fact that most providers have already implemented systems does not create a favorable outlook for Cerner currently. We believe this unfavorable environment will continue.
As a result of the high compliance rate, growth in the Electronic Medical Record space is expected to slow to 5.6% per year beginning in 2016 (down from close to 16% the last five years) 11. As that happens, revenue in the HCIT industry will begin to shift from system sales to support and maintenance service contracts. This slowing growth expectation is noted and worked into our growth assumptions throughout the forecast period.
Since organic sales growth is projected to slow, another way that companies in the HCIT industry are growing is by mergers and acquisitions. As demonstrated in the chart below, M&A has been very active during the last two
Source: Software Advice 9.

Page7
years. One of Cerner’s direct competitors, CareFusion was recently acquired by Becton Dickinson – a leader in the biotechnology and medical device sectors. Cerner can expect to face fierce competition as companies compete in new technology development.
Peer Comparisons
As shown in the comparison chart above, Cerner Corporation has a P/E ratio of 36.66 compared to a healthcare sector average of 43.38 and a technology sector average of 25.53. Cerner also has the highest P/E
ratio of its competitors. This is largely due to the fact that Cerner has very little debt (less than 10%) compared to similar companies, which can make Cerner’s P/E seem unusually high, or comparable companies lower.
The opinion of the Henry Fund analysts is that the high P/E ratio is another sign that the stock is currently overvalued because overall industry growth is declining. Therefore, a comparatively high P/E ratio does not necessarily represent larger or higher growth opportunities.
The most accurate peer comparison for Cerner is Epic. However, with Epic being a private company, there is limited data with which to directly compare ratios or earnings. However, Epic tends to focus on more large scale hospital systems and academic medical centers. So the main competitive advantage Cerner holds is the ability to work with both very large health conglomerates and practices as small as an individual provider.
Comparable companies that are publicly traded include those listed in the table to the right. Cerner outperforms in almost all the metrics listed. This is likely due to the fact that the majority of their revenues come from higher margin service/support/maintenance contracts rather than system sales. It could also be attributed to their very low debt levels.
‐10 0 10 20 30 40
Allscripts Healthcare…
Cerner Corp.
Computer Programs &…
IMS Health Holdings Inc
McKesson Corp.
Quality Systems, Inc.
Average
FY 2015 Ratio Comparison
Total Debt to Equity ROI
Operating Margin Net Profit Margin
Competitor Metric Comparison
Earnings Per
Share(TTM) Market Cap(mil)
PE Ratio
McKesson Corp. 8.48 37,077 19.40
Computer Programs & Systems Inc.
1.62 713 32.78
Cerner Corp. 1.57 19,194 36.66IMS Health Holdings Inc.
1.26 8,599 21.23
Allscripts Healthcare Solutions, Inc.
(0.01) 2,626 N/A
Quality Systems, Inc. 0.54 863 26.26
Data Source: Statista
Source Data: Mergent Online
Source Data: Mergent Online

Page8
ECONOMIC OUTLOOK
Increased Health Spending
Rising economic living standards, GDP growth and an aging population make the health care sector an attractive long‐term investment.
There are two main reasons that health spending varies with income. The first reason is that health care is a somewhat of a superior good – demand rises more than proportionately with income. As countries become richer, people become more willing to spend money on healthcare services that are able to improve or extend life. These are services that before, they may not have been able to afford.
Secondly, very large aging populations are more prevalent in advanced economies. Overall, the aging population (65+) makes up almost one quarter of the populations in more advance economies.
Advanced economies like the U.S., Europe, and Japan spend about twice as much of their income (averaging 12% of GDP) on health care as do emerging markets and developing economies (average of 6% of GDP). Overall, about two‐thirds of the $8 trillion in global health care spending occurs in advanced economies, The US accounts for just over $3 trillion in 2015 10.
US healthcare spending growth estimate are driven primarily by the increased insurance coverage due to the affordable care act and the large aging population
mentioned previously. As shown below, the number of uninsured Americans is at an all‐time low of approximately 9% 16.
Overall, Cerner is well‐positioned to take advantage of the regulations concerning HCIT and their HealtheIntent system focused on cross‐system operability.
GDP
This shows that GDP projections are slated to increase through FY 2017 at before leveling off close to 2020. This forecast is largely in line with our estimated revenue growth projections through 2020 for Cerner Corporation and also in line with the 2‐year Henry Fund GDP consensus of just over 2%. We have seen that although the healthcare is slightly less volatile than the market,
2.71 2.82 2.92 3.08 3.24 3.4 3.59 3.79 4.02 4.27
0
1
2
3
4
5
US Healthcare Spending(in trillions)
Data Source: IBIS World 12.
Source: Fortune

Page9
healthcare spending does fluctuate with GDP. As the economy continues to rebound, providers and health systems will be more likely to invest capital to upgrade or improve the HCIT systems that are already in place.
As long as GDP growth projections do not hit levels of 2008/2009 proportion, Cerner Corp (and the rest of the healthcare industry) is in a good position for sustainable constant growth.
Interest Rates
As fed fund rates are scheduled to increase at least once during FY 16 – Cerner remains in a competitive position due their very low debt to equity ratio. This is important as market share gains are increasingly due to mergers and acquisitions, and Cerner can continue to finance any acquisitions through cash without greatly affecting their financials.
CATALYSTS FOR GROWTH
In the last 6 years, the main growth driver for Cerner and the Healthcare Information Technology Industry was the HITECH Act. This government regulation forced hospitals and clinics to invest significant amount of capital in electronic medical record implementation. Along with EMR, investment in practice management and revenue cycle management systems were imperative for complying with meaningful use requirements.
As of 2015, 98% of hospitals have adopted, implemented or upgraded an EMR system 7. As previously mentioned, there are very high switching costs between HCIT systems. Because of this, any significant increase in Cerner market share will likely come from mergers or acquisitions.
INVESTMENT POSITIVES
Recent winning bid for the Department of Defense HCIT system that will be slowly implemented in conjunction with Accenture and Leidos over the next 15 years – providing steady growth over that period.
• Large increase in Backlog booking contracts shows Cerner’s ability to continue selling services to existing customers.
• Cerner’s HealtheIntent systems ability to scale to and aggregate both Cerner system and outside system population data. The interoperation
ability is highly sought after as provider systems continue to merge and need cross‐functional solutions for existing HCIT systems.
• Very low debt levels (< 10%) position Cerner well to carry out acquisitions as necessary to increase their market share or system offerings.
• Siemens Health acquisition increased exposure to overseas markets.
INVESTMENT NEGATIVES
• Provider/System focus on decrease costs, plus the current healthcare industry trend of provider consolidation with force Cerner to compete largely on price.
• As providers complete phase one of meaningful use/EMR implementation (98% have a system in place currently), system sales will decrease.
VALUATION
To forecast an accurate intrinsic company value and target price, we used three varying valuation methods – Discounted Cash Flow, dividend discount, and relative multiple. Differences in these methods revealed a spread of close to $15 after elimination of the dividend discount model.
The dividend discount model did not forecast an accurate target price since Cerner Corp. has not historically dividends to shareholders – however, it may be useful in the future should the company decide to do so.
Revenue Projection
Estimated growth rates of Cerner Corporation was based on segment growth shown above. As previously discussed, the 5 year historical growth rate in system sales was close to 16%. However, we believe this will slow drastically as providers near the end of phase one HCIT implementation and move toward phase two which is more focused on upgrades and improving system effectiveness. This is why
Projected Growth Rates
Segment 2016E 2017E 2018E 2019E 2020E
Revenues ‐ system sales 6% 5% 4% 4% 4%
Revenues ‐ support, maintenance & services 7% 6% 5% 5% 5%
Reimbursed travel revenues 5% 4% 3% 3% 3%

Page10
support, maintenance, and services growth is slightly higher.
According to the next chart, year‐over‐year growth rates in the medical technology or HCIT industry are estimated to remain steady at just over 5%. We believe this accurately represents the growth opportunities in the market and our year‐over‐year growth estimates reflect this stagnation as well as seen in the previous revenue growth projection chart.
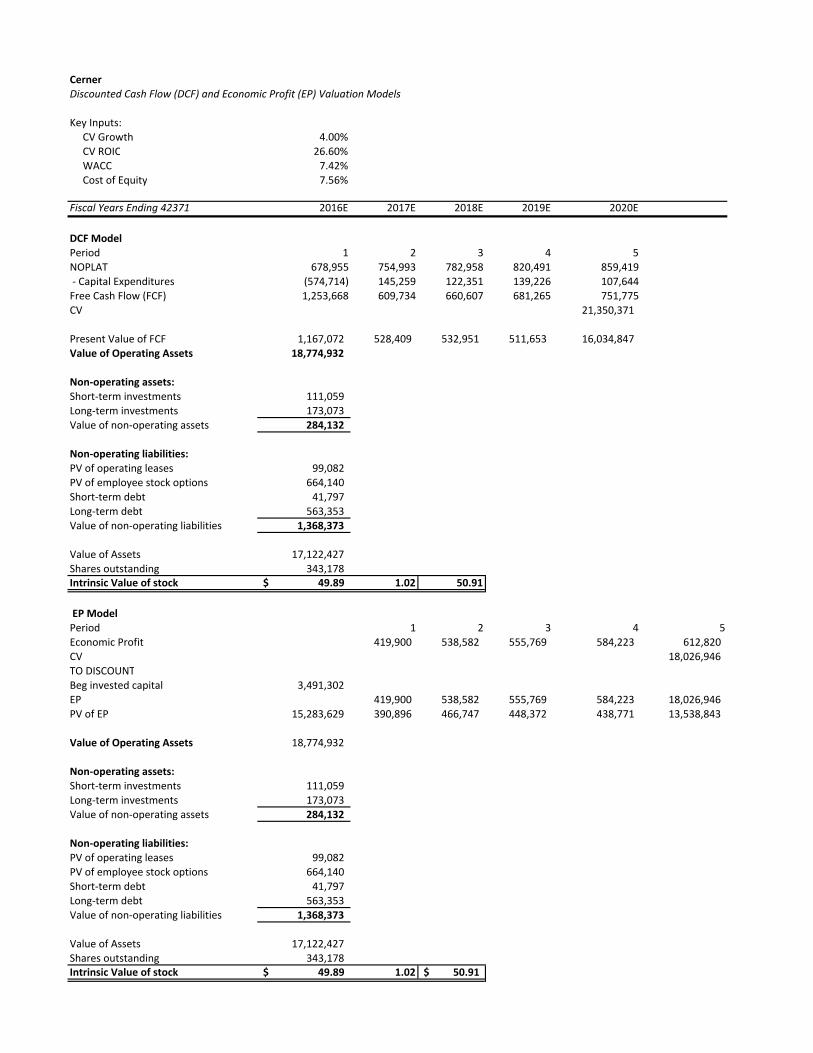
WACC Calculations
Cerner Corporation has not recently issued any debt. To find cost of debt, we started with a similarly rated bond from competitor McKesson with a YTM of 4.399% that matures 3/15/2044 because it was the closest competitor and comparative time frame. To determine cost of equity, we used a Beta of .988 which was calculated as the 2‐year raw Beta from Bloomberg. We also used a market premium of 5% which was a Henry Fund consensus number that we felt reflected the risk in the market going forward. We used a 30‐year treasury bond as the risk free rate of 2.62%. This gave a weighted cost of capital of 7.42%.
DCF/EP Models
The Cerner Corp. estimated target price is based most heavily on the Discounted Cash Flow Model (shown in detail in appendix sheets). A target price of $50.99 shows significant overvaluation by the market as the current
price is almost double the Henry Fund Calculated rate. This low target price is based largely on slow growth projected in the HCIT industry due to the 98% of providers who have already implemented HCIT systems due to governmental regulations.
Relative Price/Earnings Multiple
The relative PE pricing model gave me an intrinsic price that was slightly higher than the DCF/EP but is still much lower than the current trading price. The calculated P/E ratio is higher than competitors at 28 vs. an average competitor P/E of 18. On one hand, this seems to suggest that Cerner outperforms its peers. However, some of Cerner’s closest competitors are not public corporations and their financial data is not available for comparison. We believe this, coupled with significant slowing of growth in the HCIT industry (to 5.2% for the next five years) does not make Cerner an attractive investment. A high P/E could also suggest that the company is overvalued by the market – which is the opinion of the Henry Fund analysts
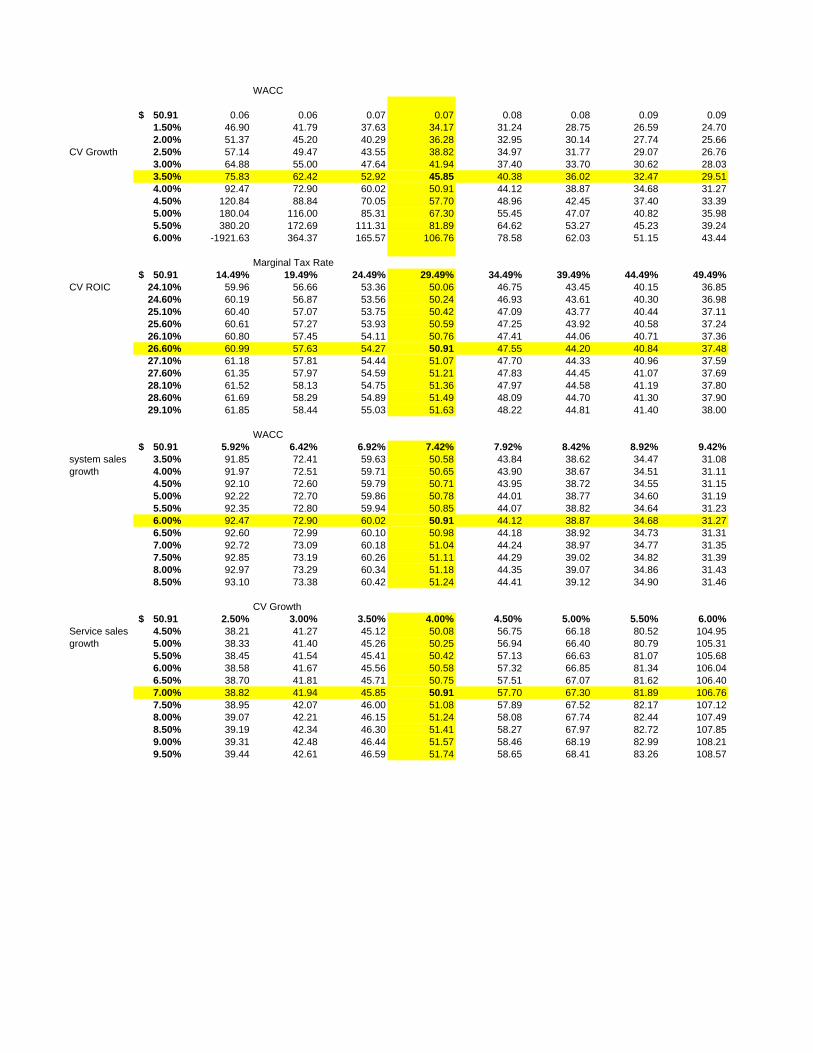
Sensitivity Analysis
This analysis showed that both Beta, CV growth, and WACC assumptions can have a profound effect on the target share price.
Five‐year historical cost and sales data yield an average 80% gross profit margin. Our revenue and cost growth assumptions are such that the profit margin average of 80% is maintained through our five year future forecast.
Operating assumptions were forecasted primarily as a percent of total revenue, which was driven by our baseline revenue growth assumptions previously discussed by business segment.
The overall forecasted revenue growth CAGR is calculated at 6.64% and year over year growth projections are in line with industry experts. Our estimations are not optimistic for the industry or for the company due to limited growth potential and the high levels of competition in the majority of the company’s business segments.
Overall, while there are some positive or optimistic attributes to Cerner Corporation we do not think the company and industry have large enough growth potential to maintain our holding. Since the previous Henry Fund analyst report one year ago recommending we HOLD our position, there has not been enough positive change to
‐4.
‐2.
0.
2.
4.
6.
8.
10.
12.
Total Medtech YOY growth percentage
Source: Statista – via Evaluate Med Tech

Page11
push our recommendation to a BUY. Based on that information and the factors presented above, we are recommending a SELL.
KEYS TO MONITOR
Interoperable capability – platforms that are functional across many systems will be key going forward. In a 2015 Healthcare IT news survey, Cerner was ranked third in this category behind Epic and NextGen 17.
New cloud technology – Cloud services could allow for easier updates and improved system speed/continuity going forward 8.
Safety measures for health information –A data breach for Cerner could pose huge declines in demand if their systems are deemed unsafe.
Changes or updates to current US governmental regulations regarding HCIT and other required implementations could increase our revenue growth projections.
Increased need for HCIT systems as foreign healthcare markets modernize – Cerner’s recent acquisition of Siemens Health Services has increased foreign exposure, but also exposed the company exchange rate risk.
Ultimately, we are not confident that Cerner will achieve high enough organic growth to justify the current price of its stock. This is due to the slowing growth of the HCIT industry as a whole, and increasing levels of market saturation. Going forward, Cerner will have to rely heavily on mergers and acquisitions to grow – which could potentially adjust our recommendation. However, we believe that Cerner is currently overvalued at $53.75 by 5.41% and we recommend a SELL.
REFERENCES
1. Cerner Q4 2015 Earnings Call Transcript. 11 February 2016.
2. Cerner 10‐K 2015 Report 3. Shaw, Gary. “Cerner Q1 Guidance Flops” Investors
Business Daily. 16 February 2016 4. “UHS to Implement Cerner’s Clinically Driven
Revenue Cycle” Cerner Corporation. 6 April 2016. 5. Statista 6. Monegain, Bergin. “Cerner Rides High with Dod
Deal” Healthcare ITNews. 5 August 2015.
7. HealthIT.gov – dashboards 8. Davis, Jessica. “Cloud, Mobile Among top EHR
Trends of 2016” Healthcare IT News. 21 December 2015
9. Kirk, Patricia. “Top 10 Rankings of EHR Market Share” Dark Daily. 29 August 2015
10. Adamant Biomedical Investments “The IVD Market from an Investment Perspective” Asia‐Pacific Biotech News. 2015
11. “Healthcare IT Market by Product” September 2015
12. IBIS World 13. Cerner Corporation, Client Achievements 14. Mergent Online Data 15. Lorenzetti, Laura. “Number of People with Health
Insurance Highest in 20 Years” Fortune. 9 February 2016
16. McCann, Erin. “2015 EHR Satisfaction Survey Overall Results” Healthcare IT News. 18 September 2015.
IMPORTANT DISCLAIMER
Henry Fund reports are created by student enrolled in the Applied Securities Management (Henry Fund) program at the University of Iowa’s Tippie School of Management. These reports are intended to provide potential employers and other interested parties an example of the analytical skills, investment knowledge, and communication abilities of Henry Fund students. Henry Fund analysts are not registered investment advisors, brokers or officially licensed financial professionals. The investment opinion contained in this report does not represent an offer or solicitation to buy or sell any of the aforementioned securities. Unless otherwise noted, facts and figures included in this report are from publicly available sources. This report is not a complete compilation of data, and its accuracy is not guaranteed. From time to time, the University of Iowa, its faculty, staff, students, or the Henry Fund may hold a financial interest in the companies mentioned in this report.

Cerner
Revenue Decomposition
Fiscal Years Ending 42371 2013 2014 2015 2016E 2017E 2018E 2019E 2020E
Revenue
Revenues ‐ system sales 847,809 945,858 1,281,890 1,358,803 1,426,744 1,483,813 1,543,166 1,604,892
Revenues ‐ support, maintenance & services 1,992,830 2,366,959 3,070,575 3,285,515 3,482,646 3,656,778 3,839,617 4,031,598
Reimbursed travel revenues 70,109 89,886 72,802 76,442 79,500 81,885 84,341 86,872
Total revenues 2,910,748 3,402,703 4,425,267 4,720,761 4,988,890 5,222,477 5,467,125 5,723,362
Revenues ‐ system sales 29.13% 27.80% 28.97% 28.78% 28.60% 28.41% 28.23% 28.04%
Revenues ‐ support, maintenance & services 68.46% 69.56% 69.39% 69.60% 69.81% 70.02% 70.23% 70.44%
Reimbursed travel revenues 2.41% 2.64% 1.65% 1.62% 1.59% 1.57% 1.54% 1.52%
Total revenues 100.00% 100.00% 100.00% 100.00% 100.00% 100.00% 100.00% 100.00%
Revenues ‐ system sales ‐6.09% 11.56% 35.53% 6.00% 5.00% 4.00% 4.00% 4.00%
Revenues ‐ support, maintenance & services 16.72% 18.77% 29.73% 7.00% 6.00% 5.00% 5.00% 5.00%
Reimbursed travel revenues 26.76% 28.21% ‐19.01% 5.00% 4.00% 3.00% 3.00% 3.00%
Total YOY Revenue Growth 9.20% 16.90% 30.05% 6.68% 5.68% 4.68% 4.68% 4.69%

Cerner
Income Statement
Fiscal Years Ending 42371 2013 2014 2015 2016E 2017E 2018E 2019E 2020E
Revenue
Revenues ‐ system sales 847,809 945,858 1,281,890 1,358,803 1,426,744 1,483,813 1,543,166 1,604,892
Revenues ‐ support, maintenance & services 1,992,830 2,366,959 3,070,575 3,285,515 3,482,646 3,656,778 3,839,617 4,031,598
Reimbursed travel revenues 70,109 89,886 72,802 76,442 79,500 81,885 84,341 86,872
Total revenues 2,910,748 3,402,703 4,425,267 4,720,761 4,988,890 5,222,477 5,467,125 5,723,362
Expenses
Cost of system sales 302,374 314,089 430,335 555,549 587,103 614,592 643,382 673,537
Cost of support, maintenance & services 142,239 200,402 247,644 242,045 255,792 267,769 280,312 293,450
Cost of reimbursed travel 70,109 89,886 72,802 76,442 79,500 81,885 84,341 86,872
Sales & client service expense 1,173,051 1,395,568 1,838,600 1,894,354 2,001,949 2,095,683 2,193,856 2,296,680
Software development expense 338,786 392,805 539,799 563,711 595,728 623,621 652,835 683,432
General & administrative expense 308,177 246,869 423,424 378,845 400,362 419,108 438,741 459,304
Amortization of acquisition‐related intangibles ‐ ‐ 91,527 19,528 20,637 21,603 22,615 23,675
Total costs & expenses 2,334,736 2,639,619 3,644,131 3,730,473 3,941,072 4,124,261 4,316,083 4,516,950
Operating earnings (loss) 576,012 763,084 781,136 990,288 1,047,818 1,098,216 1,151,041 1,206,412
Interest income 15,314 16,342 11,990 5,086 5,177 5,270 5,364 5,460
Interest expense (4,226) (3,993) (11,820) (26,621) (9,138) (6,607) (4,002) (2,738)
Other income (expense), net 954 (1,259) 74 1,615 1,706 1,786 1,870 1,958
Total other income (expense), net 12,042 11,090 244 (19,920) (2,254) 449 3,232 4,680
Earnings (loss) before income taxes 588,054 774,174 781,380 970,368 1,045,564 1,098,664 1,154,273 1,211,091
Current income tax expense (benefit) 212,347 141,836 176,773 286,201 308,380 324,041 340,442 357,200
Deferred income tax expense (benefit) (22,647) 106,905 65,245 29,148 31,407 33,002 34,672 36,379
Net earnings (loss) 398,354 525,433 539,362 655,018 705,777 741,621 779,158 817,512
Weighted average shares outstanding ‐ basic 343,636 342,150 343,178 341,924 341,045 340,514 340,306 340,399
Net earnings (loss) per share ‐ basic 1.16 1.54 1.57 1.92 2.07 2.18 2.29 2.40
Dividends paid ‐ ‐ ‐ 0 0 0 0 0
Foreign currency translation adjustments ‐ ‐ (32,171)

Cerner
Balance Sheet
In thousandsFiscal Years Ending 42371 2013 2014 2015 2016E 2017E 2018E 2019E 2020E
ASSETS
Cash & cash equivalents 202,377 635,203 402,122 1,215,817 1,602,037 2,040,571 2,531,653 3,099,036
Short‐term investments 677,004 785,663 111,059 113,047 115,070 117,130 119,227 121,361
Receivables, net 582,926 672,778 1,034,084 1,042,432 1,101,640 1,153,220 1,207,243 1,263,825
Inventory 32,299 23,789 15,788 38,818 41,022 42,943 44,955 47,062
Prepaid expenses & other current assets 175,488 209,278 264,780 252,096 266,414 278,888 291,953 305,636
Deferred income taxes, net 91,614 22,075 0.00 0.00 0.00 0.00 0.00 0.00
Total current assets 1,761,708 2,348,786 1,827,833 2,662,209 3,126,184 3,632,753 4,195,030 4,836,920
Property & equipment, gross 1,611,231 1,864,770 2,312,289 2,576,999 2,802,547 2,996,035 3,173,311 3,343,920
Less: accumulated depreciation & leasehold amortization 818,450 940,510 1,003,075 1,372,705 1,529,851 1,663,749 1,778,614 1,883,855
Property & equipment, net 792,781 924,260 1,309,214 1,204,295 1,272,696 1,332,285 1,394,697 1,460,064
Software development costs, net 347,077 420,199 562,559 550,485 581,751 608,989 637,518 667,397
Goodwill 307,422 320,538 799,182 799,182 799,182 799,182 799,182 799,182
Intangible assets, net 144,132 126,636 688,058 121,473 114,428 100,109 96,191 53,452
Long‐term investments 554,873 231,147 173,073 176,171 179,324 182,534 185,802 189,128
Other assets 190,371 158,999 202,065 264,270 279,280 292,356 306,052 320,396
Total assets 4,098,364 4,530,565 5,561,984 5,778,084 6,352,845 6,948,209 7,614,471 8,326,539
LIABILITIES
Accounts payable 145,019 160,285 215,510 224,174 236,907 247,999 259,617 271,785
Current installments of long‐term debt & capital lease obligations 54,107 67,460 41,797 44,045 24,271 14,879 10,270 3,370
Deferred revenue 209,746 209,655 278,443 318,421 336,507 352,262 368,764 386,048
Accrued payroll & tax withholdings 147,986 140,230 184,225 217,393 229,740 240,497 251,763 263,563
Other accrued expenses 83,574 56,685 57,891 99,898 105,572 110,515 115,692 121,114
Total current liabilities 640,432 634,315 777,866 903,931 932,997 966,152 1,006,106 1,045,880
Long‐term debt & capital lease obligations 111,717 62,868 563,353 163,679 125,927 76,097 51,975 35,046
Deferred income taxes & other liabilities 170,392 256,601 324,516 311,807 335,969 353,032 370,901 389,158
Deferred revenue 8,159 10,813 25,865 20,948 22,137 23,174 24,260 25,397
Total liabilities 930,700 964,597 1,691,600 1,400,364 1,417,030 1,418,455 1,453,241 1,495,480
SHAREHOLDER EQUITY
Common stock and Additional paid in Capital 816,296 936,916 1,079,285 1,219,594 1,359,903 1,500,212 1,640,520 1,780,829
Retained earnings (accumulated deficit) 2,393,048 2,918,481 3,457,843 4,112,861 4,818,639 5,560,260 6,339,418 7,156,930
Treasury stock, at cost (28,251) (245,333) (590,390) (878,381) (1,166,373) (1,454,364) (1,742,355) (2,030,347)
Accumulated other comprehensive income (loss), net (13,429) (44,096) (76,354) (76,354) (76,354) (76,354) (76,354) (76,354)
Total Cerner Corporation shareholders' equity 3,167,664 3,565,968 3,870,384 4,377,720 4,935,815 5,529,754 6,161,229 6,831,059
Noncontrolling interest ‐ ‐ ‐ ‐ ‐ ‐ ‐ ‐
Total shareholders' equity 3,167,664 3,565,968 3,870,384 4,377,720 4,935,815 5,529,754 6,161,229 6,831,059

Cerner
Cash Flow Statement
Fiscal Years Ending 42371 2011 2012 2013 2014 2015
CF OPERATIONS
Net earnings (loss) 306,627 397,232 398,354 525,433 539,362
Depreciation & amortization 212,556 222,580 263,538 302,353 452,225
Share‐based compensation expense 27,919 36,113 46,295 59,292 70,121
Provision for (benefit from) deferred income taxes (22,113) 8,342 (22,647) 106,905 65,245
Receivables, net (128,979) (83,705) (9,599) (74,786) (160,124)
Inventory (12,329) (279) (8,111) 8,117 12,951
Prepaid expenses & other assets 9,974 (2,224) (36,038) (14,625) (55,363)
Accounts payable 17,504 35,265 4,130 2,974 7
Accrued income taxes 26,053 (22,784) 14,694 (21,764) (690)
Deferred revenue 33,792 33,277 18,053 4,346 9,450
Other accrued liabilities 75,290 84,497 27,196 (51,218) 14,342
Net cash flows from operating activities 546,294 708,314 695,865 847,027 947,526
CF INVESTING
Capital purchases (104,795) (183,429) (352,877) (276,584) (362,132)
Capitalized software development costs (82,942) (100,189) (174,649) (177,800) (264,656)
Purchases of investments (1,083,274) (1,286,997) (1,106,819) (1,214,036) (487,981)
Sales & maturities of investments 791,881 932,394 1,070,598 1,404,846 1,208,387
Purchase of other intangibles (20,620) (22,870) (56,805) (13,517) (21,432)
Acquisition of businesses, net of cash acquired (65,341) (40,540) (67,877) (7,476) (1,478,129)
Net cash flows from investing activities (565,091) (701,631) (688,429) (284,567) (1,405,943)
CF FINANCING
Long‐term debt issuance ‐ ‐ ‐ ‐ 500,000
Repayment of long‐term debt & capital lease obligations (25,701) (17,083) (24,700) (14,930) (14,325)
Proceeds from excess tax benefits from share‐based compensation 36,433 48,370 39,927 39,532 55,959
Proceeds from exercise of options 38,900 38,147 31,403 31,879 51,475
Treasury stock purchases ‐ ‐ (170,042) (217,082) (345,057)
Contingent consideration payments for acquisition of businesses (779) (3,400) (800) (10,617) (11,012)
Cash grants ‐ ‐ ‐ 48,000 ‐
Other cash flows from financing activities ‐ ‐ 4,823 2,894 (791)
Net cash flows from financing activities 48,853 66,034 (119,389) (120,324) 236,249
Effect of exchange rate changes on cash & cash equivalents (1,421) 1,257 (2,790) (9,310) (10,913)
Net increase (decrease) in cash & cash equivalents 28,635 73,974 (114,743) 432,826 (233,081)
Cash & cash equivalents at beginning of period 214,511 243,146 317,120 202,377 635,203
Cash & cash equivalents at end of period 243,146 317,120 202,377 635,203 402,122
Cash paid during the year for interest 5,786 6,448 6,973 5,682 13,164
Cash paid during the year for income taxes, net of refunds 115,867 158,871 175,377 144,323 118,409

Cerner
Cash Flow Statement
Fiscal Years Ending 42371 2016E 2017E 2018E 2019E 2020E
Operating activitiesNet income (loss) 655,018 705,777 741,621 779,158 817,512
Depreciation and amortization 369,630 157,147 133,898 114,865 105,241
Change in deferred taxes (12,709) 24,163 17,063 17,869 18,257
Change in accounts receiveable (8,348) (59,208) (51,580) (54,023) (56,582)
Change in inventory (23,030) (2,205) (1,921) (2,012) (2,107)
Change in prepaid expenses 12,684 (14,318) (12,474) (13,065) (13,683)
Change in accounts payable 8,664 12,733 11,092 11,618 12,168
Change in other accrued expenses 42,007 5,674 4,943 5,177 5,422
Change in deferred revenues 35,061 19,275 16,792 17,587 18,421
Change in accrued payroll and tax withholdings 33,168 12,347 10,757 11,266 11,800
Net cash from operating activities 1,112,145 861,385 870,191 888,441 916,448
Investing activities
Change in short‐term investments (1,988) (2,024) (2,060) (2,097) (2,134)
Change in long‐term investments (3,098) (3,153) (3,210) (3,267) (3,326)
Capital expenditures (264,710) (225,548) (193,487) (177,276) (170,609)
Change in software development costs 12,074 (31,266) (27,238) (28,528) (29,880)
Change in intangible assets 566,585 7,045 14,319 3,918 42,739
Change in other assets (62,205) (15,010) (13,076) (13,695) (14,344)
Net cash from investing activities 246,658 (269,956) (224,753) (220,946) (177,554)
Financing activities
Change in current portion of long‐term debt 2,248 (19,774) (9,392) (4,609) (6,900)
Proceeds from issuance of long‐term debt (399,674) (37,752) (49,830) (24,122) (16,929)
Proceeds from issuance of common stock 140,309 140,309 140,309 140,309 140,309
Repurchase of common stock (287,991) (287,991) (287,991) (287,991) (287,991)
Net cash from financing activities (545,108) (205,208) (206,904) (176,413) (171,511)
Change in cash 813,695 386,220 438,534 491,082 567,383
Plus beginning cash 402,122 1,215,817 1,602,037 2,040,571 2,531,653
Cash at end of year 1,215,817 1,602,037 2,040,571 2,531,653 3,099,036

Cerner
Common Size Income Statement
Fiscal Years Ending 42371 2013 2014 2015 2016E 2017E 2018E 2019E 2020E
Revenue
Revenues ‐ system sales 29.13% 27.80% 28.97% 28.78% 28.60% 28.41% 28.23% 28.04%
Revenues ‐ support, maintenance & services 68.46% 69.56% 69.39% 69.60% 69.81% 70.02% 70.23% 70.44%
Reimbursed travel revenues 2.41% 2.64% 1.65% 1.62% 1.59% 1.57% 1.54% 1.52%
Total revenues 100.00% 100.00% 100.00% 100.00% 100.00% 100.00% 100.00% 100.00%
Expenses
Cost of system sales 10.39% 9.23% 9.72% 11.77% 11.77% 11.77% 11.77% 11.77%
Cost of support, maintenance & services 4.89% 5.89% 5.60% 5.13% 5.13% 5.13% 5.13% 5.13%
Cost of reimbursed travel 100.00% 100.00% 100.00% 100.00% 100.00% 100.00% 100.00% 100.00%
Sales & client service expense 40.30% 41.01% 41.55% 40.13% 40.13% 40.13% 40.13% 40.13%
Software development expense 11.64% 11.54% 12.20% 11.94% 11.94% 11.94% 11.94% 11.94%
General & administrative expense 10.59% 7.26% 9.57% 8.03% 8.03% 8.03% 8.03% 8.03%
Amortization of acquisition‐related intangibles 0.00% 0.00% 2.07% 0.41% 0.41% 0.41% 0.41% 0.41%
Total costs & expenses 80.21% 77.57% 82.35% 79.02% 79.00% 78.97% 78.95% 78.92%
Operating earnings (loss) 19.79% 22.43% 17.65% 20.98% 21.00% 21.03% 21.05% 21.08%
Interest income 0.53% 0.48% 0.27% 0.11% 0.10% 0.10% 0.10% 0.10%
Interest expense ‐0.15% ‐0.12% ‐0.27% ‐0.56% ‐0.18% ‐0.13% ‐0.07% ‐0.05%
Other income (expense), net 0.03% ‐0.04% 0.00% 0.03% 0.03% 0.03% 0.03% 0.03%
Total other income (expense), net 0.41% 0.33% 0.01% ‐0.42% ‐0.05% 0.01% 0.06% 0.08%
Earnings (loss) before income taxes 20.20% 22.75% 17.66% 20.56% 20.96% 21.04% 21.11% 21.16%
Current income tax expense (benefit) 7.30% 4.17% 3.99% 6.06% 6.18% 6.20% 6.23% 6.24%
Deferred income tax expense (benefit) ‐0.78% 3.14% 1.47% 0.62% 0.63% 0.63% 0.63% 0.64%
Net earnings (loss) 13.69% 15.44% 12.19% 13.88% 14.15% 14.20% 14.25% 14.28%

Cerner
Common Size Balance Sheet
Fiscal Years Ending 42371 2013 2014 2015 2016E 2017E 2018E 2019E 2020E
ASSETS
Cash & cash equivalents 6.95% 18.67% 9.09% 25.75% 32.11% 39.07% 46.31% 54.15%
Short‐term investments 23.26% 23.09% 2.51% 2.39% 2.31% 2.24% 2.18% 2.12%
Receivables, net 20.03% 19.77% 23.37% 22.08% 22.08% 22.08% 22.08% 22.08%
Inventory 1.11% 0.70% 0.36% 0.82% 0.82% 0.82% 0.82% 0.82%
Prepaid expenses & other current assets 6.03% 6.15% 5.98% 5.34% 5.34% 5.34% 5.34% 5.34%
Deferred income taxes, net 3.15% 0.65% 0.00% 0.00% 0.00% 0.00% 0.00% 0.00%
Total current assets 60.52% 69.03% 41.30% 56.39% 62.66% 69.56% 76.73% 84.51%
Property & equipment, gross 55.35% 54.80% 52.25% 54.59% 56.18% 57.37% 58.04% 58.43%
Less: accumulated depreciation & leasehold amortization 28.12% 27.64% 22.67% 29.08% 30.67% 31.86% 32.53% 32.92%
Property & equipment, net 27.24% 27.16% 29.58% 25.51% 25.51% 25.51% 25.51% 25.51%
Software development costs, net 11.92% 12.35% 12.71% 11.66% 11.66% 11.66% 11.66% 11.66%
Goodwill 10.56% 9.42% 18.06% 16.93% 16.02% 15.30% 14.62% 13.96%
Intangible assets, net 4.95% 3.72% 15.55% 2.57% 2.29% 1.92% 1.76% 0.93%
Long‐term investments 19.06% 6.79% 3.91% 3.73% 3.59% 3.50% 3.40% 3.30%
Other assets 6.54% 4.67% 4.57% 5.60% 5.60% 5.60% 5.60% 5.60%
Total assets 140.80% 133.15% 125.69% 122.40% 127.34% 133.04% 139.28% 145.48%
LIABILITIES
Accounts payable 4.98% 4.71% 4.87% 4.75% 4.75% 4.75% 4.75% 4.75%
Current installments of long‐term debt & capital lease obligations 1.86% 1.98% 0.94% 0.93% 0.49% 0.28% 0.19% 0.06%
Deferred revenue 7.21% 6.16% 6.29% 6.75% 6.75% 6.75% 6.75% 6.75%
Accrued payroll & tax withholdings 5.08% 4.12% 4.16% 4.61% 4.61% 4.61% 4.61% 4.61%
Other accrued expenses 2.87% 1.67% 1.31% 2.12% 2.12% 2.12% 2.12% 2.12%
Total current liabilities 22.00% 18.64% 17.58% 19.15% 18.70% 18.50% 18.40% 18.27%
Long‐term debt & capital lease obligations 3.84% 1.85% 12.73% 3.47% 2.52% 1.46% 0.95% 0.61%
Deferred income taxes & other liabilities 5.85% 7.54% 7.33% 6.61% 6.73% 6.76% 6.78% 6.80%
Deferred revenue 0.28% 0.32% 0.58% 0.44% 0.44% 0.44% 0.44% 0.44%
Total liabilities 31.97% 28.35% 38.23% 29.66% 28.40% 27.16% 26.58% 26.13%
SHAREHOLDER EQUITY
Common stock and Additional paid in Capital 28.04% 27.53% 24.39% 25.83% 27.26% 28.73% 30.01% 31.12%
Retained earnings (accumulated deficit) 82.21% 85.77% 78.14% 87.12% 96.59% 106.47% 115.96% 125.05%
Treasury stock, at cost ‐0.97% ‐7.21% ‐13.34% ‐18.61% ‐23.38% ‐27.85% ‐31.87% ‐35.47%
Accumulated other comprehensive income (loss), net ‐0.46% ‐1.30% ‐1.73% ‐1.62% ‐1.53% ‐1.46% ‐1.40% ‐1.33%
Total Cerner Corporation shareholders' equity 108.83% 104.80% 87.46% 92.73% 98.94% 105.88% 112.70% 119.35%
Noncontrolling interest 0.00% 0.00% 0.00% 0.00% 0.00% 0.00% 0.00% 0.00%
Total shareholders' equity 108.83% 104.80% 87.46% 92.73% 98.94% 105.88% 112.70% 119.35%

Cerner
Value Driver Estimation
Fiscal Years Ending 42371 2013 2014 2015 2016E 2017E 2018E 2019E 2020E
MARGINAL TAX RATE
Current income tax expense (benefit) 212,347 141,836 176,773 286,201 308,380 324,041 340,442 357,200
/ EBIT 588,054 774,174 781,380 970,368 1,045,564 1,098,664 1,154,273 1,211,091
= Marginal Tax Rate 36.11% 18.32% 22.62% 29.49% 29.49% 29.49% 29.49% 29.49%
EBITA
Revenue 2,910,748 3,402,703 4,425,267 4,720,761 4,988,890 5,222,477 5,467,125 5,723,362
‐ Cost of Good Sold 514,722 604,377 750,781 874,035 922,395 964,245 1,008,036 1,053,859
‐ Sales & client service expense 1,173,051 1,395,568 1,838,600 1,894,354 2,001,949 2,095,683 2,193,856 2,296,680
‐ Software development expense 338,786 392,805 539,799 563,711 595,728 623,621 652,835 683,432
‐ General & administrative expense 308,177 246,869 423,424 378,845 400,362 419,108 438,741 459,304
+ Implied interest on Op Lease 22,987 21,401 13,742 4,358.64 4,009.34 4,237.06 4,435.45 4,643.23
EBITA 598,999 784,485 886,405 1,014,174 1,072,464 1,124,056 1,178,092 1,234,730
LESS ADJUSTED TAXES
Income Tax Provision 189,700 248,741 242,018 315,349 339,787 357,043 375,115 393,580
+ Tax shield on interest expense 1,526 732 2,674 7,851 2,695 1,949 1,180 808
‐ Tax on interest income (5,530) (2,994) (2,713) (1,500) (1,527) (1,554) (1,582) (1,610)
‐ Tax on other income (344) 231 (17) (476) (503) (527) (552) (577)
+ Tax shield on implied operating lease interest 8,301 3,921 3,109 1,286 1,183 1,250 1,308 1,369
ADJUSTED TAXES 193,652 250,630 245,072 322,510 341,634 358,160 375,470 393,569
Net change in DT liabilities (22,647) 106,905 65,245 (12,709) 24,163 17,063 17,869 18,257
NOPLAT
NOPLAT=EBITA ‐ adj taxes + change in DT 382,700 640,760 706,578 678,955 754,993 782,958 820,491 859,419
OPERATING CURRENT ASSETS
Average of cash on B/S 2011 ‐2015 11.53% 11.53% 11.53% 11.53% 11.53% 11.53% 11.53% 11.53%
x revenue 2,910,748 3,402,703 4,425,267 4,720,761 4,988,890 5,222,477 5,467,125 5,723,362
Normal cash 335,557 392,271 510,154 544,219 575,130 602,058 630,262 659,801
Cash and cash equivalent 202,377 635,203 402,122 1,215,817 1,602,037 2,040,571 2,531,653 3,099,036
lower of normal or actual cash 202,377 392,271 402,122 544,219 575,130 602,058 630,262 659,801
Receivables 582,926 672,778 1,034,084 1,042,432 1,101,640 1,153,220 1,207,243 1,263,825
Inventory 32,299.00 23,789.00 15,788.00 38,817.66 41,022.41 42,943.14 44,954.82 47,061.80
Pre‐paid expenses and other current assets 175,488 209,278 264,780 252,096 266,414 278,888 291,953 305,636
Operating Current Assets 993,090 1,298,116 1,716,774 1,877,565 1,984,206 2,077,110 2,174,412 2,276,325
OPERATING CURRENT LIABILITIES
Accounts payable 145,019 160,285 215,510 224,174 236,907 247,999 259,617 271,785
Accrued payroll and tax withholdings 147,986 140,230 184,225 217,393 229,740 240,497 251,763 263,563
Other accrued expenses 83,574 56,685 57,891 99,898 105,572 110,515 115,692 121,114
Deferred revenue 209,746 209,655 278,443 318,421 336,507 352,262 368,764 386,048
Income taxes payable 170,392 256,601 324,516 311,807 335,969 353,032 370,901 389,158
Operating Current Liabilities 756,717 823,456 1,060,585 1,171,693 1,244,695 1,304,305 1,366,737 1,431,668
NET OPERATING WORKING CAP
Operating CA ‐ Operating CL 236,373 474,660 656,189 705,872 739,511 772,804 807,676 844,657
Net operating working capital 236,373 474,660 656,189 705,872 739,511 772,804 807,676 844,657
+ NET PPE
Plant, property, and equipment 792,781 924,260 1,309,214 1,204,295 1,272,696 1,332,285 1,394,697 1,460,064
Net PPE 792,781 924,260 1,309,214 1,204,295 1,272,696 1,332,285 1,394,697 1,460,064
+ OTHER OPERATING ASSETS
Software development costs, net 347,077 420,199 562,559 550,485 581,751 608,989 637,518 667,397
Net intangible assets 144,132 126,636 688,058 121,473 114,428 100,109 96,191 53,452
PV of operating leases 115,111 119,169 99,082 91,142 96,319 100,829 105,552 110,499
Other operating assets 190,371 158,999 202,065 264,270 279,280 292,356 306,052 320,396
Other Operating Assets 796,691 825,003 1,551,764 1,027,370 1,071,778 1,102,283 1,145,312 1,151,744
‐ OTHER OPERATING LIABILITIES
Deferred revenue (long‐term) 8,159 10,813 25,865 20,948 22,137 23,174 24,260 25,397
Other Operating Liabilities 8,159 10,813 25,865 20,948 22,137 23,174 24,260 25,397
INVESTED CAPITAL
Invested Capital 1,817,686 2,213,110 3,491,302 2,916,589 3,061,848 3,184,199 3,323,425 3,431,069
VALUE DRIVERS
NOPLAT 382,700 640,760 706,578 678,955 754,993 782,958 820,491 859,419
/ Beginning IC 1,613,558 1,817,686 2,213,110 3,491,302 2,916,589 3,061,848 3,184,199 3,323,425
ROIC 23.72% 35.25% 31.93% 19.45% 25.89% 25.57% 25.77% 25.86%
Beginning IC 1,613,558 1,817,686 2,213,110 3,491,302 2,916,589 3,061,848 3,184,199 3,323,425
x (ROIC ‐ WACC) 16.30% 27.83% 24.51% 12.03% 18.47% 18.15% 18.35% 18.44%
Economic Profit (EP) 262,974 505,888 542,365 419,900 538,582 555,769 584,223 612,820
NOPLAT 382,700 640,760 706,578 678,955 754,993 782,958 820,491 859,419
‐ Capital Expenditures 204,128 395,424 1,278,193 (574,714) 145,259 122,351 139,226 107,644
Free Cash Flow (FCF) 178,572 245,336 (571,615) 1,253,668 609,734 660,607 681,265 751,775

Cerner
Weighted Average Cost of Capital (WACC) Estimation
WACC = Re * (E/V) + (D/V) * Rd * (1‐t)
Re = cost of equity
Rd = cost of debt
E = value of equity
D = value of debt
V = E +D
t = corporate tax rate
Cost of Equity
Re = Rf + B (E(Rm) ‐ Rf)
Rf 2.62% based on 30 year treasury
E(Rm) ‐ Rf 5.00% Henry Fund concensus
Beta 0.988
Re 7.56%
Cost of Debt
Rd 4.399% Mckesson bond 3/15/44
Cost of preferred stock
no preferred stock
Market Value of Equity
Shares outstanding 343,178,000
share price $54.08
E 18,559,066,240
Value of Debt
Debt LT & current 605,150,000
PV of Op lease 99,082
Total Debt 605,249,082
Market Value of firm 19,164,315,322
weight of equity 96.84%
weight of debt 3.16%
weight of preferred 0
marginal tax rate 29.49%
WACC 7.42%
CernerDiscounted Cash Flow (DCF) and Economic Profit (EP) Valuation Models
Key Inputs: CV Growth 4.00% CV ROIC 26.60% WACC 7.42% Cost of Equity 7.56%
Fiscal Years Ending 42371 2016E 2017E 2018E 2019E 2020E
DCF ModelPeriod 1 2 3 4 5NOPLAT 678,955 754,993 782,958 820,491 859,419 ‐ Capital Expenditures (574,714) 145,259 122,351 139,226 107,644 Free Cash Flow (FCF) 1,253,668 609,734 660,607 681,265 751,775 CV 21,350,371
Present Value of FCF 1,167,072 528,409 532,951 511,653 16,034,847 Value of Operating Assets 18,774,932
Non‐operating assets:Short‐term investments 111,059 Long‐term investments 173,073 Value of non‐operating assets 284,132
Non‐operating liabilities:PV of operating leases 99,082 PV of employee stock options 664,140 Short‐term debt 41,797 Long‐term debt 563,353 Value of non‐operating liabilities 1,368,373
Value of Assets 17,122,427 Shares outstanding 343,178 Intrinsic Value of stock 49.89$ 1.02 50.91
EP Model Period 1 2 3 4 5Economic Profit 419,900 538,582 555,769 584,223 612,820 CV 18,026,946 TO DISCOUNTBeg invested capital 3,491,302 EP 419,900 538,582 555,769 584,223 18,026,946 PV of EP 15,283,629 390,896 466,747 448,372 438,771 13,538,843
Value of Operating Assets 18,774,932
Non‐operating assets:Short‐term investments 111,059
Long‐term investments 173,073 Value of non‐operating assets 284,132
Non‐operating liabilities:PV of operating leases 99,082 PV of employee stock options 664,140 Short‐term debt 41,797 Long‐term debt 563,353 Value of non‐operating liabilities 1,368,373
Value of Assets 17,122,427
Shares outstanding 343,178 Intrinsic Value of stock 49.89$ 1.02 50.91$

Cerner
Dividend Discount Model (DDM) or Fundamental P/E Valuation Model
Fiscal Years Ending 42371 2016E 2017E 2018E 2019E 2020E
EPS 1.92$ 2.07$ 2.18$ 2.29$ 2.40$
Key Assumptions
CV growth 4.00%
CV ROE 12.58%
Cost of Equity 7.56%
Future Cash Flows
P/E Multiple (CV Year) 19.16
EPS (CV Year) 2.40$
Future Stock Price 46.02$
Dividends Per Share ‐$ ‐$ ‐$ ‐$ ‐$
Future Cash Flows 46.02$
Discounted Cash Flows 0 0 0 0 34.38$
Intrinsic Value 34.38$ 1.02 35.40$

CernerRelative Valuation Models
EPS EPS Est. 5yrTicker Company Price 2015E 2016E P/E 15 P/E 16 EPS gr. PEG 15 PEG 16
MCK Mckesson Corporation $157.41 $12.68 $13.51 12.4 11.7 9.5 1.31 1.23
MDRX Allscripts Healthcare Solutions $13.56 $0.58 $0.68 23.4 19.9 16.2 1.45 1.23
IMS IMS Health Holdings $26.65 $1.57 $1.75 17.0 15.2 10.2 1.66 1.49
QSII Quality Systems $15.25 $0.70 $0.80 21.8 19.1 12.3 1.77 1.55 CPSI Computer Programs and Systems $53.01 $3.38 $3.83 15.7 13.8 11.0 1.43 1.26
Average 18.0 15.9 1.5 1.4
CERN Cerner $54.08 $1.92 $2.07 28.2 26.1 4.6 6.1 5.6
Implied Value:
Relative P/E (EPS15) $ 34.57
Relative P/E (EPS16) 33.00$
PEG Ratio (EPS15) 13.48$
PEG Ratio (EPS16) 12.93$

CernerKey Management Ratios
Fiscal Years Ending 42371 2013 2014 2015 2016E 2017E 2018E 2019E 2020E
Liquidity Ratioscurrent assets 1,761,708 2,348,786 1,827,833 2,662,209 3,126,184 3,632,753 4,195,030 4,836,920 / current liabilities 640,432 634,315 777,866 903,931 932,997 966,152 1,006,106 1,045,880 = current ratio 2.75 3.70 2.35 2.95 3.35 3.76 4.17 4.62
(current assets ‐ 1,729,409 2,324,997 1,812,045 2,623,391 3,085,161 3,589,809 4,150,075 4,789,858 inventories) 32,299 23,789 15,788 38,818 41,022 42,943 44,955 47,062 / current liabilities 640,432 634,315 777,866 903,931 932,997 966,152 1,006,106 1,045,880 = quick ratio 2.65 3.63 2.31 2.86 3.26 3.67 4.08 4.53
cash 202,377 635,203 402,122 1,215,817 1,602,037 2,040,571 2,531,653 3,099,036 / current liabilities 640,432 634,315 777,866 903,931 932,997 966,152 1,006,106 1,045,880 = cash ratio 0.32 1.00 0.52 1.35 1.72 2.11 2.52 2.96
Activity or Asset‐Management Ratiosannual sales 2,840,639 3,312,817 4,352,465 4,644,319 4,909,390 5,140,592 5,382,783 5,636,491 / average accounts receievable 580,387 627,852 853,431 1,038,258 1,072,036 1,127,430 1,180,232 1,235,534 = receivable turnover 4.89 5.28 5.10 4.47 4.58 4.56 4.56 4.56
365 365 365 365 365 365 365 365 365 / receivables turnover 4.89 5.28 5.10 4.47 4.58 4.56 4.56 4.56 = average collection period 74.58 69.18 71.57 81.60 79.70 80.05 80.03 80.01
Cost of Goods Sold 514,722 604,377 750,781 874,035 922,395 964,245 1,008,036 1,053,859 / Average inventory 27,990 28,044 19,789 27,303 39,920 41,983 43,949 46,008 = Inventory Turnover 18.39 21.55 37.94 32.01 23.11 22.97 22.94 22.91
365 365 365 365 365 365 365 365 365 / Inventory Turnover 18.39 21.55 37.94 32.01 23.11 22.97 22.94 22.91 = Inventory Period 19.85 16.94 9.62 11.40 15.80 15.89 15.91 15.93
Financial Leverage Ratios(Total Debt 165,824 130,328 605,150 207,724 150,198 90,976 62,245 38,416 + PV of Operating leases) 115,111 119,169 99,082 91,142 96,319 100,829 105,552 110,499 / Total Assets 4,098,364 4,530,565 5,561,984 5,778,084 6,352,845 6,948,209 7,614,471 8,326,539 = Debt Ratio 0.07 0.06 0.13 0.05 0.04 0.03 0.02 0.02
total debt 165,824 130,328 605,150 207,724 150,198 90,976 62,245 38,416 / total equity 3,167,664 3,565,968 3,870,384 4,377,720 4,935,815 5,529,754 6,161,229 6,831,059 = debt to equity ratio 0.05 0.04 0.16 0.05 0.03 0.02 0.01 0.01
Profitability Ratios(Sales ‐ COGS) 2,325,917 2,708,440 3,601,684 3,770,283 3,986,995 4,176,347 4,374,747 4,582,632 / Sales 2,840,639 3,312,817 4,352,465 4,644,319 4,909,390 5,140,592 5,382,783 5,636,491 = gross profit margin 81.88% 81.76% 82.75% 81.18% 81.21% 81.24% 81.27% 81.30%
Net income 398,354 525,433 539,362 655,018 705,777 741,621 779,158 817,512 / sales 2,840,639 3,312,817 4,352,465 4,644,319 4,909,390 5,140,592 5,382,783 5,636,491 = net profit margin 14.02% 15.86% 12.39% 14.10% 14.38% 14.43% 14.48% 14.50%
Net income 398,354 525,433 539,362 655,018 705,777 741,621 779,158 817,512 / average total assets 3,901,416 4,314,465 5,046,275 5,670,034 6,065,465 6,650,527 7,281,340 7,970,505 = return on assets 10.21% 12.18% 10.69% 11.55% 11.64% 11.15% 10.70% 10.26%
Net income 398,354 525,433 539,362 655,018 705,777 741,621 779,158 817,512 / average total equity 3,000,657 3,366,816 3,718,176 4,124,052 4,656,767 5,232,784 5,845,491 6,496,144 = return on equity 13.28% 15.61% 14.51% 15.88% 15.16% 14.17% 13.33% 12.58%

Present Value of Operating Lease Obligations (2015) Present Value of Operating Lease Obligations (2014) Present Value of Operating Lease Obligations (2013)
Operating Operating Operating
Fiscal Years Ending 42371 Leases Fiscal Years Ending 42371 Leases Fiscal Years Ending Leases
2016 26436 2015 23525 2014 20488
2017 25076 2016 21693 2015 19485
2018 20290 2017 21467 2016 17819
2019 15390 2018 19294 2017 17234
2020 9757 2019 14984 2018 14691
Thereafter 15875 Thereafter 39607 Thereafter 48381
Total Minimum Payments 112824 Total Minimum Payments 140570 Total Minimum Payments 138098
Less: Interest 13742 Less: Interest 21401 Less: Interest 22987
PV of Minimum Payments 99082 PV of Minimum Payments 119169 PV of Minimum Payments 115111
Capitalization of Operating Leases Capitalization of Operating Leases Capitalization of Operating Leases
Pre‐Tax Cost of Debt 4.40% Pre‐Tax Cost of Debt 4.40% Pre‐Tax Cost of Debt 4.40%
Number Years Implied by Year 6 Payment 1.6 Number Years Implied by Year 6 Payment 2.6 Number Years Implied by Year 6 Payment 3.3
Lease PV Lease Lease PV Lease Lease PV Lease
Year Commitment Payment Year Commitment Payment Year Commitment Payment
1 26436 25322.1 1 23525 22533.7 1 20488 19624.7
2 25076 23007.3 2 21693 19903.4 2 19485 17877.5
3 20290 17831.7 3 21467 18866.1 3 17819 15660.1
4 15390 12955.5 4 19294 16241.9 4 17234 14507.8
5 9757 7867.5 5 14984 12082.2 5 14691 11845.9
6 & beyond 9757 12098.4 6 & beyond 14984 29541.5 6 & beyond 14691 35595.0
PV of Minimum Payments 99082.5 PV of Minimum Payments 119168.9 PV of Minimum Payments 115111.1

Effects of ESOP Exercise and Share Repurchases on Common Stock Balance Sheet Account and Number of Shares Outstanding
Number of Options Outstanding (shares): 24,267
Average Time to Maturity (years): 5.96
Expected Annual Number of Options Exercised: 4,072
Current Average Strike Price: 34.46$
Cost of Equity: 7.56%
Current Stock Price: $54.08
2016E 2017E 2018E 2019E 2020E 2021E
Increase in Shares Outstanding: 4,072 4,072 4,072 4,072 4,072 3,909
Average Strike Price: 34.46$ 34.46$ 34.46$ 34.46$ 34.46$ 34.46$
Increase in Common Stock Account: 140,309 140,309 140,309 140,309 140,309 134,697
Change in Treasury Stock 287,991 287,991 287,991 287,991 287,991 287,991
Expected Price of Repurchased Shares: 54.08$ 58.17$ 62.57$ 67.30$ 72.38$ 77.86$
Number of Shares Repurchased: 5,325 4,951 4,603 4,279 3,979 3,699
Shares Outstanding (beginning of the year) 343,178 341,924 341,045 340,514 340,306 340,399
Plus: Shares Issued Through ESOP 4,072 4,072 4,072 4,072 4,072 3,909
Less: Shares Repurchased in Treasury 5,325 4,951 4,603 4,279 3,979 3,699
Shares Outstanding (end of the year) 341,924 341,045 340,514 340,306 340,399 340,609

VALUATION OF OPTIONS GRANTED IN ESOP
Ticker Symbol CERN
Current Stock Price $54.08
Risk Free Rate 2.62%
Current Dividend Yield 0.00%
Annualized St. Dev. of Stock Returns 28.25% yearly average from bloomber
Average Average B‐S Value
Range of Number Exercise Remaining Option of Options
Outstanding Options of Shares Price Life (yrs) Price Granted
Range 1 24,267 34.46 5.96 27.37$ 664,140$
Total 24,267 34.46$ 5.96 27.37$ 664,140$
WACC
50.91$ 0.06 0.06 0.07 0.07 0.08 0.08 0.09 0.091.50% 46.90 41.79 37.63 34.17 31.24 28.75 26.59 24.702.00% 51.37 45.20 40.29 36.28 32.95 30.14 27.74 25.66
CV Growth 2.50% 57.14 49.47 43.55 38.82 34.97 31.77 29.07 26.763.00% 64.88 55.00 47.64 41.94 37.40 33.70 30.62 28.033.50% 75.83 62.42 52.92 45.85 40.38 36.02 32.47 29.514.00% 92.47 72.90 60.02 50.91 44.12 38.87 34.68 31.274.50% 120.84 88.84 70.05 57.70 48.96 42.45 37.40 33.395.00% 180.04 116.00 85.31 67.30 55.45 47.07 40.82 35.985.50% 380.20 172.69 111.31 81.89 64.62 53.27 45.23 39.246.00% -1921.63 364.37 165.57 106.76 78.58 62.03 51.15 43.44
Marginal Tax Rate50.91$ 14.49% 19.49% 24.49% 29.49% 34.49% 39.49% 44.49% 49.49%
CV ROIC 24.10% 59.96 56.66 53.36 50.06 46.75 43.45 40.15 36.8524.60% 60.19 56.87 53.56 50.24 46.93 43.61 40.30 36.9825.10% 60.40 57.07 53.75 50.42 47.09 43.77 40.44 37.1125.60% 60.61 57.27 53.93 50.59 47.25 43.92 40.58 37.2426.10% 60.80 57.45 54.11 50.76 47.41 44.06 40.71 37.3626.60% 60.99 57.63 54.27 50.91 47.55 44.20 40.84 37.4827.10% 61.18 57.81 54.44 51.07 47.70 44.33 40.96 37.5927.60% 61.35 57.97 54.59 51.21 47.83 44.45 41.07 37.6928.10% 61.52 58.13 54.75 51.36 47.97 44.58 41.19 37.8028.60% 61.69 58.29 54.89 51.49 48.09 44.70 41.30 37.9029.10% 61.85 58.44 55.03 51.63 48.22 44.81 41.40 38.00
WACC50.91$ 5.92% 6.42% 6.92% 7.42% 7.92% 8.42% 8.92% 9.42%
system sales 3.50% 91.85 72.41 59.63 50.58 43.84 38.62 34.47 31.08growth 4.00% 91.97 72.51 59.71 50.65 43.90 38.67 34.51 31.11
4.50% 92.10 72.60 59.79 50.71 43.95 38.72 34.55 31.155.00% 92.22 72.70 59.86 50.78 44.01 38.77 34.60 31.195.50% 92.35 72.80 59.94 50.85 44.07 38.82 34.64 31.236.00% 92.47 72.90 60.02 50.91 44.12 38.87 34.68 31.276.50% 92.60 72.99 60.10 50.98 44.18 38.92 34.73 31.317.00% 92.72 73.09 60.18 51.04 44.24 38.97 34.77 31.357.50% 92.85 73.19 60.26 51.11 44.29 39.02 34.82 31.398.00% 92.97 73.29 60.34 51.18 44.35 39.07 34.86 31.438.50% 93.10 73.38 60.42 51.24 44.41 39.12 34.90 31.46
CV Growth50.91$ 2.50% 3.00% 3.50% 4.00% 4.50% 5.00% 5.50% 6.00%
Service sales 4.50% 38.21 41.27 45.12 50.08 56.75 66.18 80.52 104.95growth 5.00% 38.33 41.40 45.26 50.25 56.94 66.40 80.79 105.31
5.50% 38.45 41.54 45.41 50.42 57.13 66.63 81.07 105.686.00% 38.58 41.67 45.56 50.58 57.32 66.85 81.34 106.046.50% 38.70 41.81 45.71 50.75 57.51 67.07 81.62 106.407.00% 38.82 41.94 45.85 50.91 57.70 67.30 81.89 106.767.50% 38.95 42.07 46.00 51.08 57.89 67.52 82.17 107.128.00% 39.07 42.21 46.15 51.24 58.08 67.74 82.44 107.498.50% 39.19 42.34 46.30 51.41 58.27 67.97 82.72 107.859.00% 39.31 42.48 46.44 51.57 58.46 68.19 82.99 108.219.50% 39.44 42.61 46.59 51.74 58.65 68.41 83.26 108.57