investment concept fundamentals
DESCRIPTION
Investment Concept Fundamentals. Concord, California January 12, 2011. California Debt and Investment Advisory Commission. Brian Perry, CFA. VP, Investment Strategist. Table of Contents. Basics of Fixed Income Investing. Framework for Investing. Types of Securities. Analyzing Securities. - PowerPoint PPT PresentationTRANSCRIPT
6225 Lusk Boulevard | San Diego, CA 92121 | Phone 800.317.4747 | Fax 858.546.3741 | www.chandlerasset.com
CHANDLER ASSET MANAGEMENT
Investment Concept Fundamentals
Concord, California
January 12, 2011
California Debt and Investment Advisory Commission
Brian Perry, CFA
VP, Investment Strategist

SECTION 1
SECTION 2
SECTION 3
SECTION 4
SECTION 5
Table of Contents
Basics of Fixed Income Investing
Framework for Investing
Types of Securities
Analyzing Securities
Portfolio Management Concepts
2
SECTION 1
Basics of Fixed Income Investing
3
IntroductionBond Market Overview
Key TermsPricing Bonds
Introduction
■ Broad overview of important topics
■ Develop better understanding of portfolio management process
■ Learn enough to know what questions to ask
■ Focus on the key takeaways
4

Bond Market Overview
■ Bond market exists to help governments, corporations, and other borrowers intersect with capital providers.
■ Bonds are considered safer than stocks or many other assets.
■ Bonds are a science, stocks are an art.
■ Bonds trade over the counter - no central exchange.
■ Bond markets lack transparency.
■ Largely dominated by institutional investors.
5
Key Terms
■ Bond characteristics
■ Issuer
■ Maturity
■ Coupon
■ Rating
■ Price
■ Yield
■ Callable or non-callable (bullet)?
■ Basis point (1/100 of 1%)
6
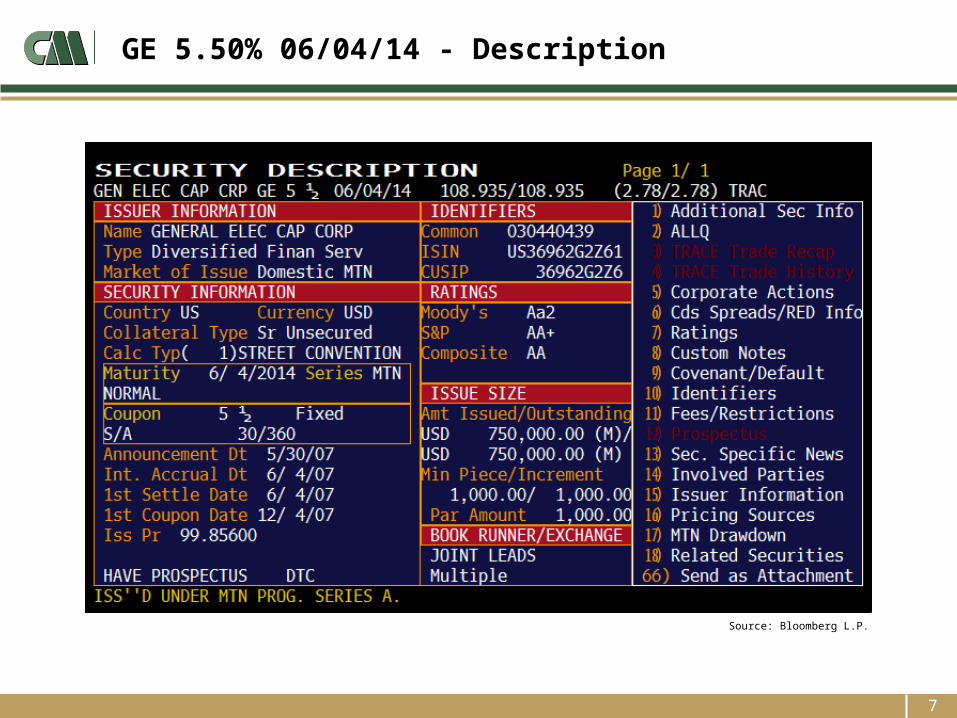
GE 5.50% 06/04/14 - Description
7
Source: Bloomberg L.P.

Yield & Price Inversely Related
8
Fixed Coupon Rate
% $
5.50%
SECTION 2
Framework for Investing
9
Objectives: SLYInvestment Policy
Cash Flow ForecastsEconomic Analysis
Interest Rate Forecasts
Local Agency Investment Objectives
■ Primary objectives of local agency investing
■ Safety
■ Protect principle
■ Liquidity
■ Meet anticipated cash flow requirements
■ Since all possible demands cannot be anticipated, hold securities that have active secondary markets
■ Yield / Rate of Return
■ Earn a reasonable return relative to the risk being assumed
10

Why an Investment Policy?
■ Defines the investment program
■ Legal & permitted activities
■ Who’s responsible for the portfolio
■ Measurement of results
■ Provides structure to investment program
■ Dynamic process - can evolve over time
11
Why Prepare a Cash Flow Forecast?
■ Projection of anticipated receipts & disbursements
■ Ensures liquidity for disbursements
■ Warns of impending budget problems
■ Identifies short-term cash deficits
■ Estimate of investable cash balances
■ Liquid funds
■ Core funds
12
Economic Analysis
■ The direction of the economy dictates the actions of the Federal Reserve
■ The Federal Reserve decides the course of short term interest rates
■ Understanding economic trends can help you understand why interest rates are at a general level and where they might be headed
■ Understanding economic trends can help in more accurate budgeting and forecasting
■ Economic indicators are the signposts of the nations economic health
■ Frequently the signs point in different directions
■ Economic forecasts to lead to tactical changes
13

Beware Interest Rate Forecasts
■ Excerpts from presentation on July 19, 2007
■ Most forecasters believe that the first quarter of 2007 saw a low point in the current economic cycle.
■ The general consensus is for continued moderate growth with moderate inflation, and a Fed on hold for most of this year.
14
“The only function of economic forecasting is to make astrology look respectable.”
- John Kenneth Galbraith, Economist
SECTION 3
Types of Securities
15
Treasury SecuritiesAgency Securities
Corporate Securities Pooled Investment Funds
Structured SecuritiesCallable Securities

Treasury Securities
■ Explicitly guaranteed by the United States government
■ Safest and most liquid securities in the world
■ Form a core component of high-quality fixed income portfolios
■ Used as a benchmark against which other securities are compared
■ Wide range of maturities available
16

Agency Securities
■ Supported by the United States government - AAA rated
■ Considered very safe and liquid
■ Include FNMA, FHLMC, FHLB, FFCB, TVA
■ Available as callable or non-callable securities
■ Available in a range of maturities and structures
■ Discount notes
17

Corporate Securities
■ Issued by corporations of varying credit quality
■ Commercial paper short-term less than 270 days
■ Corporate bonds have maturities as long as 30 years
■ Generally lower credit quality than Treasury or agency securities and less liquid
■ Provide higher yields over time
■ Require independent credit research and continuous monitoring
18
Pooled Investment Funds
■ Examples include local government investment pools (LAIF) and money market mutual funds
■ Many local agencies use pooled investment funds for liquidity needs
■ Easy to use and provide instant diversification
■ One drawback: you don’t actually know what securities you own
19

Structured Securities
■ Mortgage-backed securities
■ Asset backed securities
■ Floating-rate securities
■ Callable bonds
■ Investor sells option to redeem bonds early to issuer
20
Callable Securities
■ When interest rates fall, callable securities tend to be called away by the issuer
■ Resulting in reinvestment at lower interest rates
■ When interest rates fall, the duration of callable securities tends to decline
■ But longer duration portfolios perform better in falling rate environments
■ When rates rise, callable securities are generally not called
■ Resulting in no opportunity for reinvestment at higher rates
■ When rates rise, the duration of callables extends
■ Resulting in greater portfolio market value decline
■ When rates are stable callable bonds tend to outperform non-callable structures
21

Reinvestment Risk—Callable Securities
22
In a period of falling rates, bullet securities, with higher duration and positive convexity, provide more growth than callables.
But when rates are stable, or rise, callables, with their generally higher coupons, tend to outperform bullets.
SECTION 4
Analyzing Securities
23
Investment Risks & RewardsMeasuring Yield Spread Measures

Portfolio Management is Risk Management
The greater an investor’s exposure to properly diversified risk, the higher the expected return over time
The greater an investor’s exposure to risk, the higher the volatility of return from period to period
The objective of “safety” requires establishing risk constraints
Risk is something to be managed not avoided
24
Different Types of Risks
■ Market Risk
■ Liquidity risk
■ Reinvestment risk
■ Credit risk
25
Market Risk
■ Market risk
■ Also called interest rate risk
■ Securities prices change as interest rates change—in the opposite direction
Modified duration measures the percent change in price of a security for a 1 percent change in yields
We can’t predict interest rates, but, using duration, we can calculate approximately how much the portfolio market value will change with a given, instantaneous change in interest rates
The higher the duration, the greater the exposure to market risk
26
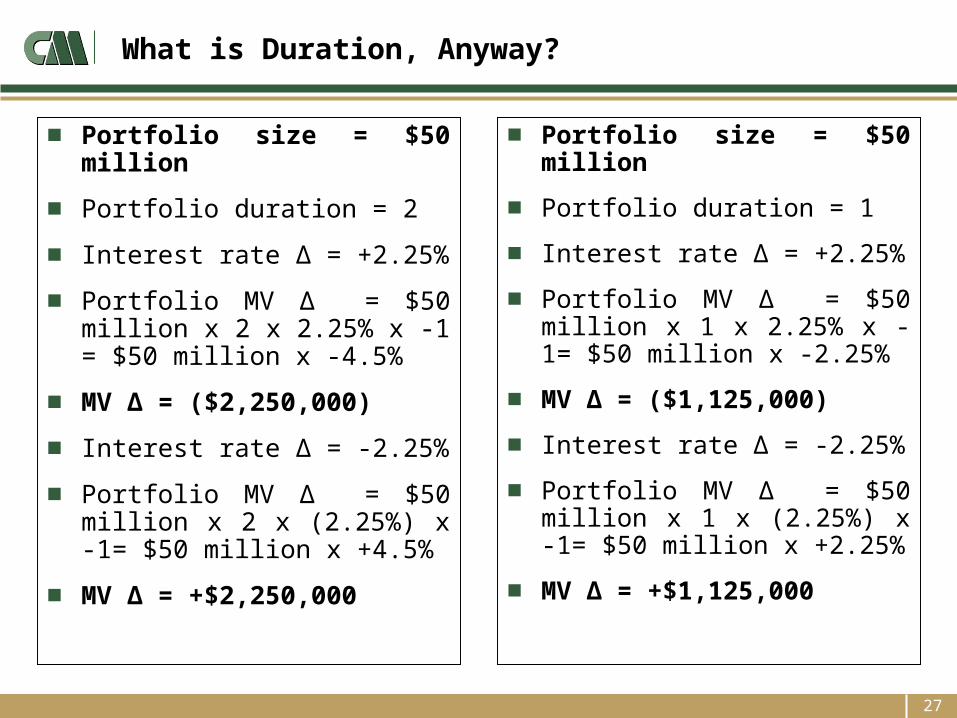
What is Duration, Anyway?
■ Portfolio size = $50 million
■ Portfolio duration = 2
■ Interest rate Δ = +2.25%
■ Portfolio MV Δ = $50 million x 2 x 2.25% x -1 = $50 million x -4.5%
■ MV Δ = ($2,250,000)
■ Interest rate Δ = -2.25%
■ Portfolio MV Δ = $50 million x 2 x (2.25%) x -1= $50 million x +4.5%
■ MV Δ = +$2,250,000
■ Portfolio size = $50 million
■ Portfolio duration = 1
■ Interest rate Δ = +2.25%
■ Portfolio MV Δ = $50 million x 1 x 2.25% x -1= $50 million x -2.25%
■ MV Δ = ($1,125,000)
■ Interest rate Δ = -2.25%
■ Portfolio MV Δ = $50 million x 1 x (2.25%) x -1= $50 million x +2.25%
■ MV Δ = +$1,125,000
27

Greater Risk = Higher Returns
28

Greater Risk = Higher Volatility
Higher Duration Portfolios Have Greater Volatility of Return
29
Choosing the Portfolio’s Target Duration
■ Some considerations regarding exposure to market risk
■ Maintain short-term investments sufficient to meet cash needs
■ Analyze need for portfolio income and growth
■ Consider appetite for market value fluctuations (GASB 40 considerations)
■ Incorporate statutory and policy considerations
■ Highest duration possible given risk tolerance and liquidity needs
30
Liquidity Risk
■ Liquidity risk
■ The risk that the portfolio won’t provide adequate cash flow for the agency
■ The risk that a security can’t be sold, if necessary, at a good price
■ Measured by such factors as the difference between bid and ask
■ Number of market makers for the issue
■ Usually, the larger the issue size, the greater the liquidity.
■ Liquidity risk can be minimized by maintaining appropriate balances of short-term securities in the portfolio
31

Reinvestment Risk
■ Reinvestment risk: cash flows from a bond must be reinvested at the market rate at the time the cash flow occurs
■ Interest payments
■ Principal paid at maturity
■ Paydowns from mortgage securities
■ Principal from called bonds
32
Credit Risk
■ Investors receive higher yields when they purchase riskier securities
■ Agencies vs. Treasuries
■ Corporates vs. Agencies
■ “A” vs. “AAA” Corporates
■ Credit ratings change over time
■ Yield spreads vary over time
33

Credit Risk — The Opportunity
Assuming additional credit risk should result in higher returns over time
With a similar pattern of volatility of return
34

Managing Credit Risk
■ Assuming credit risk requires that additional resources be devoted to the investment program
■ Moody’s/S&P ratings, watch lists, outlook
■ At time of purchase and
■ On a regular basis
■ Supplemented by
■ Third party sources
■ Internally generated credit research
35

Measuring Yield
■ The yield on any investment is the interest rate that will make the present value of the cash flows from the investment equal to the price (or cost) of the investment
■ Calculating yield requires a trial and error process to find the correct interest rate
■ Fortunately financial calculators, computers, or Bloomberg terminals can do this for us
■ Many different types of yields
■ Make sure we compare apples to apples
36
Basic Yield Spread Measures
■ Most securities in the bond market are priced on a “spread”
■ The spread represents the additional compensation necessary for holding a risky asset
■ Risky securities are generally compared to Treasuries so the spread is the additional yield over a Treasury with a comparable maturity – this is known as a nominal spread
■ Limitation: the nominal spread only measures one point on the Treasury curve
37
Advanced Spread Measures
■ The zero-volatility spread (Z-spread) takes into account the entire yield curve and is more accurate than the nominal spread.
■ Option-adjusted spread (OAS) is a model that takes into account the future volatility of interest rates.
■ The OAS measure is appropriate for bonds with embedded options such as callable agency bonds or mortgage-backed bonds.
■ The OAS can be used to compare the relative merits of a callable and a non-callable bond.
■ All spread models are very sensitive to the underlying assumptions of the model and the inputs to the model.
38
SECTION 5
39
Portfolio Management Concepts
StrategyBenchmarks
Measuring Performance Summary

Strategy
■ The objectives of the investment program are to achieve safety, liquidity and yield
■ The investment policy serves as the framework for implementing the investment program
■ The investment strategy manages the portfolio with the proper risk profile
■ The investment strategy is reflected in the choice of an appropriate benchmark
■ Once chosen, the portfolio strategy should seldom change
■ Tactical changes are made within the broader framework of the portfolio strategy
40
What is a Benchmark?
■ An unmanaged portfolio that includes similar securities and maturities to those that are permitted in the investment policy
■ Examples
■ S&P 500 Index for stocks
■ LAIF
■ Index of 1-3 year government notes
■ Index of 1-5 year government and corporate securities rated “A” or higher
41

What Makes a Good Benchmark?
Constructed in a disciplined and objective manner
Representative of assets in which the fund may invest
Exhibit similar risk characteristics as the investment objectives
Formulated from publicly available information
Known in advance
The information derived from both the benchmark and the portfolio should use the same calculation methods
42
43
Why Use a Benchmark?
■ Monitor and maintain appropriate risk profile
■ Duration management within defined band (e.g. +/- 10%)
■ Imparts discipline on the investment process
■ Helps measure the performance of the investment program during a given period
■ Identifies why a portfolio performed better or worse than the broader market
Measuring Performance
■ Yield = income from current investments + projection of reinvestment income
■ Used to forecast income for line item in next year budget
■ And often, to compare portfolio return to a yield benchmark
■ Realized return: Adds realized gains and losses
■ No realized return benchmark
■ Return information can be distorted
■ Total rate of return
■ Incorporates all elements of return – income, realized and unrealized gains and losses, reinvestment of cash flows
■ Can be used to provide comparable results in a consistent format
44

45
Summary
■ Have a plan and stick to the plan throughout market cycles
■ Avoid interest rate forecasts and market timing
■ Duration accounts for 80% of portfolio returns
■ Conduct independent credit research and be aware of risks in your portfolio
■ Information is an investors best friend

Resources: Websites
■ Market information
■ www.bloomberg.com
■ www.cnbc.com
■ www.wsj.com
■ www.investinginbonds.com
■ Research
■ www.muninetguide.com
■ www.moodys.com
■ www.standardandpoors.com
■ www.federalreserve.gov
46
47
Biographical Information
Brian Perry, CFAVP, Investment Strategist
Brian Perry joined Chandler Asset Management in 2005 and currently serves as the firm’s investment strategist. In that role, Mr. Perry analyzes economic developments, conducts research on financial topics, and helps formulate investment strategy. He was also instrumental in creating a new quantitative corporate credit analysis program and in developing the firm’s capital market forecasts and asset allocation models. He serves as the head of the Interest Rate and Capital Market Expectations Committees.
In addition to his investment responsibilities, Mr. Perry is responsible for Chandler’s client education activities. He edits the monthly Chandler Bond Market Review, has contributed numerous articles to investment industry publications, and is a frequent speaker at investment conferences and charity events. He has appeared on NBC news to discuss the financial markets and is the author of From Piggybank to Portfolio, an investment guidebook scheduled for publication in 2010.
Prior to joining Chandler, Mr. Perry worked as a fixed income trader for an investment bank where he was responsible for trading government, corporate and emerging market securities.
Mr. Perry earned his B.S. in finance from Villanova University, an M.B.A. in international business from National University, and an M.A. in international affairs from The Fletcher School at Tufts University. He is a member of the San Diego Financial Analyst Society and holds the designation of Chartered Financial Analyst.