investment directions - blackrock have updated the format for investment directions to be more...
TRANSCRIPT
WINTER 2018
LATAM & IBERIA
VERSION
blackrock.com/latamiberia
Investment directionsGreat expectations
WINTER 2018
The best of times?The recent burst of volatility has been unnerving, but it is important to remember that the macro environment of synchronized economic growth and muted macro risks remains solid, although some are concerned about potential inflation and higher interest rates. Indeed, that backdrop supports our recent upgrade of U.S. equities to overweight.
Equities to yield curve: You talkin’ to me?The shape of the yield curve can be a barometer for future growth, but its shape depends on a number of factors. Last year, it was relatively flat—often a sign of impending recession, but instead a result of higher short-term rates with expectations of Federal Reserve tightening. The curve began steepening later with expectations of stronger growth, underscoring our preference for cyclicals, namely financials and technology.
The specter of trade wars What is the greatest risk to the markets right now? We would argue it is the potential for increased protectionism, which mostly just took the form of rhetoric in 2017. Investors may be discounting the risk that will change—and should evaluate whether their portfolios are exposed to risks from rising protectionism, particularly with respect to NAFTA and China.
Emerging markets: Commodity vs. non-commodity producers During this recent market sell-off, EMs have held up relatively well—actually outperforming U.S. equities during this leg lower. Within EM, we are monitoring an interesting development. The rise in commodity prices in recent months historically would have resulted in a rally in EM commodity producers. This time, however, non-commodity producers have outperformed their commodity producing counterparts, as domestic growth and reform efforts are prevailing.
Taking a look at mortgagesIt’s a tough environment for fixed income generally, but investors still need bonds in their portfolio for income and as a diversifier. One potential solution: consider agency mortgage-backed securities, which offer value relative to other high grade securities.
Reframing the volatility and correlations trendsVolatility and correlations have been relatively low, but that creates some challenges in finding the right blend of risk assets and stable diversification. Factor investing may be one solution, offering the potential for more consistent correlations.
Chris Dhanraj Head, U.S. ETF
Investment Strategy
Grant Dechert
Jasmine Fan
Thomas Logan
Dhruv Nagrath
Tushar Yadava
Contributors Stephen Laipply is Product
Strategist for BlackRock’s Model-Based Fixed Income Portfolio
Management group
Matt Tucker, CFA, is the Head of North American Fixed Income
iShares Strategy within BlackRock’s Fixed Income
Portfolio Management team
Editor David Kurapka
MKTG0418L-464977-1466225

2 BLACKROCK INVESTMENT DIRECTIONS
Overview We are overweight U.S. equities and specifically favor the financials and technology sectors. Higher interest rates and deregulation should benefit the former, while technology stocks appear most insulated from yield curve shifts.
Developed marketsEquities to yield curve: “You talkin’ to me?”
Key points • We believe the shape of the yield curve indicates continued economicexpansion. The U.S. Treasury yield curve is steepening. We believe thatthis is a reflection of a stronger U.S. and global economy and a rise inthe market’s inflation expectations.
• Don’t shy away from sector rotation. The dispersion of U.S. equityoutcomes across yield curve regimes over the last 20 years highlights theimportance of rotating sectors over the course of the business cycle.
• We are overweight U.S. stocks and like cyclicals, specifically financialsand technology. We think yield curve steepening will feed bankprofitability, and the sector stands to benefit from deregulation.Meanwhile, technology stocks appear most insulated from yield curveshifts, while also being supported by longer-term structural drivers.
Market pulseThe yield curve flattened for much of 2017, primarily due to a rise in short-term yields. While a flattening yield curve can signal slower growth, rising short-term yields in 2017 showed greater market confidence in the growth and inflation outlook, as well as the Federal Reserve (the Fed) continuing to raise interest rates. In recent weeks, however, the yield curve has steepened as bonds sold off and the market viewed the tax overhaul and prospects of increased government spending as harbingers of stronger growth and inflation, and a promising environment for a continuation of the bull market.
What’s notable about the rally in U.S. equities is what is powering it: While the gains of 2013-2017 were typified by multiple expansion, the past year has been all about corporate earnings.
Figure 1: S&P 500 sources of total return
-20
-40
60%
20
40
Total return
-60
2017 2018201620152014201320122011201020092008
■ Dividends ■ Earnings ■ Multiple Expansion
12-m
ont
h to
tal r
etur
n
0
Sources: Thomson Reuters Datastream, S&P Dow Jones Indices and BlackRock Investment Institute, February 1, 2018. The bars show the breakdown of the S&P 500’s 12-month return into dividends, earnings growth and multiple expansion. Earnings growth is based on the 12-month change in 12-month forward I/B/E/S earnings estimates. Returns are based on the S&P 500 Index. Index performance is for illustrative purposes only. Index performance does not reflect any management fees, transaction costs or expenses. Indexes are unmanaged and one cannot invest directly in an index. Past performance does not guarantee future results.
MKTG0418L-464977-1466225

This underscores how, although the shape of the yield curve can be a barometer for future economic growth, it depends on a multitude of factors. Analysis of different yield curve regimes can then offer some insights into what equity sectors have historically outperformed in those different regimes.
We studied a range of regimes and concluded that the current one—“bear steepening” led by longer-term rates rising more than short-term rates—suggests stronger conviction around the growth and inflation outlook. However, the dispersion of subsector outcomes in the ‘worst’ performing yield curve regime—bull steepening—highlights the importance of sector rotation over the course of the business cycle.
Figure 2: Sector returns and yield curve regimesAverage 6-month return
Yield curve regimeRisk on Risk off
Bear steepener Bear flattener Bull flattener Bull steepener
S&P 500 10.9 5.8 5.6 (5.5)
Technology 14.9 12.1 9.0 (9.3)
Energy 12.3 8.8 1.4 (2.3)
Real estate 7.6 6.5 7.1 (9.7)
Industrials 14.7 5.2 4.6 (4.9)
Consumer discretionary 16.2 5.0 6.2 (6.3)
Materials 15.7 4.6 1.1 (3.8)
Financials 13.3 4.1 5.2 (5.9)
Health care 9.1 3.5 8.0 0.7
Consumer staples 6.3 2.9 5.8 1.4
Utilities 3.6 2.8 7.3 (4.2)
Telecommunication 6.0 1.0 6.7 (8.2)
Equity sector breadth
% of positive returning sectors 100% 93% 93% 25%
% of negative returning sectors 0% 7% 7% 74%
Source: Thomson Reuters, as of November 29, 2017. Data covers 150 S&P 500 subsectors since 1995. Average returns are measured over 6 months for consistency with the lookback window to classify yield curve regimes. It is not possible to invest directly in an index. Past performance is no indication of future results.
Cyclical sectors have historically performed well in a risk-on environment. We like financials as yield curve steepening should boost bank lending margins, while the prospect of far-reaching financial sector reforms is encouraging. We also favor the technology sector as it appears less impacted by yield curve shifts. We further consider that investors tend to underestimate its long-term potential: Disruption and transformation across the tech universe are creating attractive long-term investment opportunities for both growth and income seekers.
A tale of flows2017 saw U.S. equity ETPs hit a new annual record of $196.1 billion, including $97.2 billion into large caps. Cyclical sector funds added $22.4 billion, led by financials with $9.3 billion and technology with $6.9 billion. U.S. equity ETFs have gathered approximately $46 billion year-to-date; an explosive start driven by broad risk-on flows continuing last year’s trend. Investors making more specific sector calls have also favored cyclicals this month: Industrials have taken in $3 billion, followed by information technology and energy with approximately $1.4 billion apiece.
WINTER 2018 3
MKTG0418L-464977-1466225

4 BLACKROCK INVESTMENT DIRECTIONS
Overview The market impact of geopolitical shocks is typically short-lived when the economic outlook is strong. That changes when the risk calls into question this very outlook. Protectionist actions could do just that.
The specter of trade wars
Key points • The BlackRock Investment Institute has identified potential increasedprotectionism as one of the major risks to the market. Investors maybe discounting the impact.
• Two areas to watch: NAFTA negotiations and ongoing trade tensions withChina. The administration’s rhetoric on trade and immigration catalyzeda sell-off of the peso. A full-blown trade war with China is not our basecase, but events warrant monitoring since the impact could be significant.
• Low inflation is still a concern. We view the European Central Bank’sdecision to extend its asset purchases, while halving the monthly netamount starting in January, as another potential positive catalyst for themarkets. To be sure, the reason for that move—still-low inflation—troubles us.
• We encourage investors to evaluate whether their portfolios areexposed to risks from protectionism.
Market pulseWhile investors continue to enjoy relatively low volatility and muted macro risks, they might be discounting the potential impact of greater American protectionism on global markets. Since his campaign in 2016, President Donald Trump has pledged to modify U.S. trade agreements. The world first got a taste of the transition from rhetoric to action as the Trump administration withdrew the United States from the Trans-Pacific Partnership in 2017. More recently, the administration imposed tariffs on imported solar panels and washing machines that were particularly felt by Chinese and South Korean producers. The material impact of these developments has not moved the dial on global trade, but it is crucial to determine how these precedents and upcoming resolutions of current trade disputes will impact world trade.
We encourage investors to evaluate whether their portfolios are exposed to trade protectionism risks, specifically with respect to NAFTA negotiations and ongoing investigations into China’s intellectual property practices and steel/aluminum industries.
On Mexico, Trump’s rhetoric on both trade and immigration catalyzed a 2016 sell off of the peso as the country exports 81% of its goods to the United States. The peso declined 17% to an all-time low against the dollar—roughly 22 pesos to one dollar. This weakness later subsided in 2017 as synchronized global growth and U.S. political uncertainty helped push the peso up 11% against the dollar. However, with the peso up against the dollar on a 12-month basis, the broad trade-weighted dollar at multi-year lows, and the seventh round of NAFTA negotiations expected to be completed sometime in February ahead of the March 31 resolution deadline, further FX risks are skewed to the downside for Mexican assets.
MKTG0418L-464977-1466225
China has also faced fierce criticism from the Trump administration. But a tarnished trade relationship between the two nations could have global ramifications as the world’s two largest economies share a goods and services trade estimated at $700 billion. The Office of the United States Trade Representative is investigating Chinese intellectual property acts and the country’s policies and practices in regard to theft and technological innovation. Additionally, the Commerce Department is to provide an analysis on whether U.S. import volumes of steel and aluminum harm national security. We see little risk of a Chinese equity market sell-off in response to limited intellectual property action against China, plans for which have been well telegraphed. But any unexpectedly harsh conclusions from these investigations could have multi-asset implications on a Chinese equity market that increased more than 50% in 2017, as well as global commodity prices.
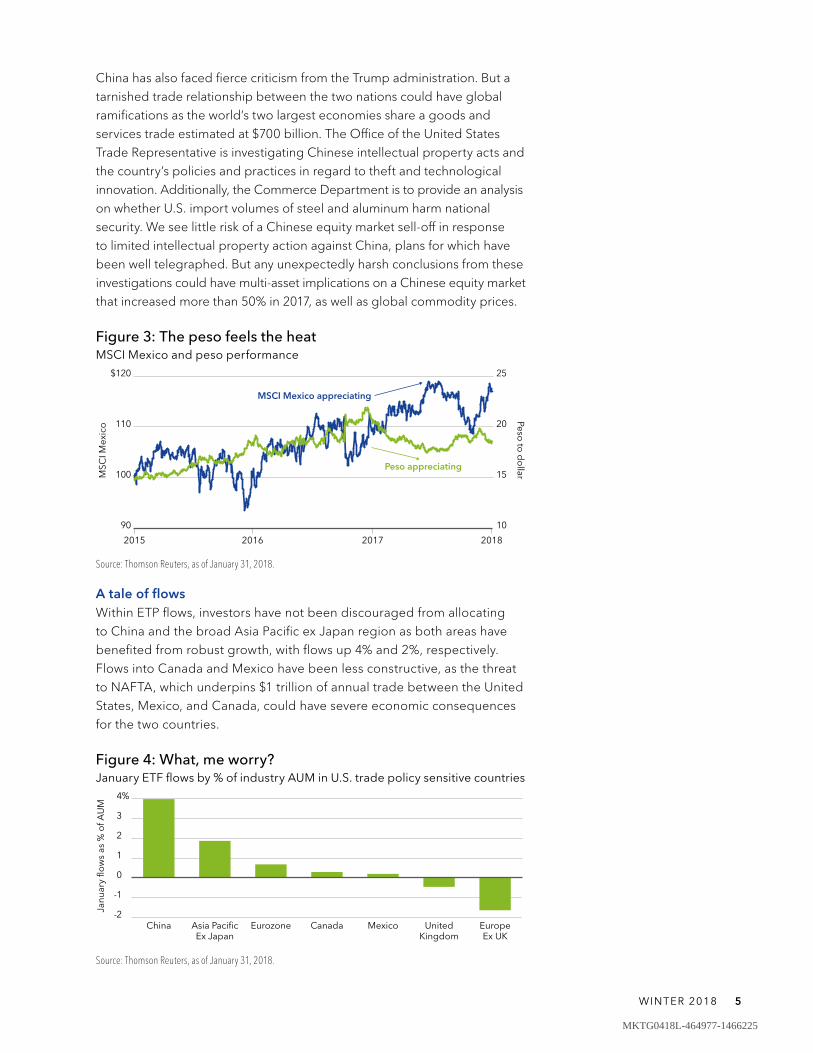
Figure 3: The peso feels the heatMSCI Mexico and peso performance
MSCI Mexico appreciating
Peso appreciating100
$120
110
90
15
25
20
10
2018201720162015
MSC
I Mex
ico
Peso to
do
llar
Source: Thomson Reuters, as of January 31, 2018.
A tale of flowsWithin ETP flows, investors have not been discouraged from allocating to China and the broad Asia Pacific ex Japan region as both areas have benefited from robust growth, with flows up 4% and 2%, respectively. Flows into Canada and Mexico have been less constructive, as the threat to NAFTA, which underpins $1 trillion of annual trade between the United States, Mexico, and Canada, could have severe economic consequences for the two countries.
Figure 4: What, me worry? January ETF flows by % of industry AUM in U.S. trade policy sensitive countries
4%
2
3
-2
-1
Mexico EuropeEx UK
UnitedKingdom
CanadaAsia PacificEx Japan
EurozoneChina
Janu
ary
flow
s as
% o
f AU
M
1
0
Source: Thomson Reuters, as of January 31, 2018.
WINTER 2018 5
MKTG0418L-464977-1466225

6 BLACKROCK INVESTMENT DIRECTIONS
Overview The broad outlook appears positive for emerging markets, and we believe the recent outperformance is the start of a longer trend. Our favored markets include China, India, Indonesia and Brazil.
Emerging marketsEM: Commodity vs. non-commodity producers
Key points • Emerging market (EM) equities have enjoyed a strong rally over thelast year, and we believe they still have room to run on the back ofsynchronized global growth. Unlike past rallies, however, today’sgrowth drivers are different.
• Growth and tighter oil inventories have also led to higher commodityprices. However, commodity producing EMs have underperformed non-commodity producers. One reason: investors suspect price increasesare a temporary phenomenon.
• Equity prices in EM non-commodity countries are largely driven bystructural advances in technology, and by domestic growth stories.We continue to favor EM equities, with a preference for China, India,Indonesia and Brazil. Only the latter is a commodity producer.
Market pulseEmerging market assets have rallied over the past year, outperforming developed markets (DM), on the back of strong earnings growth and synchronized, above-trend global growth. However, unlike the 2003-2007 bull market, when the global economy was similarly in sync and EM assets were outperforming DM assets, today’s growth drivers are dramatically different. China’s insatiable commodity demand from the mid-2000s has rapidly declined as China’s growth continues to slow while the economy has pivoted away from commodity intensive industries and toward tech and consumer-focused areas. Meanwhile, supply-side technological advances, most notably horizontal shale drilling, have weighed on commodities.
Despite these secular challenges, robust global growth and tighter oil inventories have provided a lift to commodity prices, although there has been a pullback recently. However, EM commodity countries have failed to rally in concert with higher commodity prices. Although EM overall has performed well, the non-commodity producing countries have outperformed the commodity producers (see “The new EM”).
The commodity term structure is helpful in understanding the emerging disconnect. Oil, for example, has seen a 50% rally in spot prices since June 2017. However, longer-dated futures prices are unchanged and remain well below historical levels. This shows that commodity markets believe price increases are only a temporary phenomenon and ultimately will move lower. In other words, the markets expect cyclical pricing dynamics to fade over the next several years.
In contrast, equity prices in EM non-commodity countries are largely driven by structural advances in technology, such as in Korea, Taiwan, and China itself, and by domestic growth stories, such as in India and Indonesia. We continue to favor EM equities, with a preference for China, India, Indonesia and Brazil. Only the latter is a commodity producer.
MKTG0418L-464977-1466225

Figure 5: The new EMUSD returns
EM commodity countries
EM non-commodity countries400
300
200
100
0
800
600
700
20172015201320112009200720052003
Reb
ased
per
form
ance
500
Figure 6: Where’s my upside?Commodity prices vs. EM “commodity alpha”
S&P GSCI
EM commodity alpha
95
90
85
80
115
105
110
1/1811/179/177/175/173/171/17
Reb
ased
per
form
ance
100
Source: Thomson Reuters, as of January 30, 2018. Commodity countries include Brazil, Chile, Colombia, Malaysia, Mexico, Peru, Russia, South Africa. Non-commodity countries include China, India, Indonesia, South Korea, Philippines, Poland, Taiwan, Thailand, Turkey. “EM Commodity Alpha” denotes the relative return between EM commodity countries and EM non-commodity countries. All returns measured in U.S. dollars using respective MSCI country indices. Index performance is for illustrative purposes only. Index performance does not reflect any management fees, transaction costs or expenses. Indexes are unmanaged and one cannot invest directly in an index. Past performance does not guarantee future results.
A tale of flowsFlows into exchange traded products appear to show a degree of mistrust in the commodity market’s rally. In the United States, dedicated energy flows were essentially flat in the third quarter of 2017, while fourth quarter 2017—already three months into the oil rally—took in $1.0 billion in ETP flows. In EM, Brazil, China and India continue to dominate single-country inflows, and even here there is a distinct preference for dedicated Chinese tech-focused products. Although Brazil is considered a commodity country here, the inflows are driven by the improving macro backdrop and reform agenda and not as an “EM commodity play”.
WINTER 2018 7
MKTG0418L-464977-1466225

8 BLACKROCK INVESTMENT DIRECTIONS
Overview It’s a difficult environment for bonds, but we believe that agency mortgage-backed securities offer value relative to other high grade securities such as Treasuries and investment grade credit.
Fixed incomeTaking a look at mortgages
Key points • Yields have been steadily rising in recent weeks, but we believe thatrates will grind, not spike, higher.
• It’s a difficult environment for bonds, but we believe that agencymortgage-backed securities offer value relative to other high gradesecurities such as Treasuries and investment grade credit.
• We prefer physical agency MBS pools, which tend to have lessprepayment and duration extension risk relative to the more liquidTBA contracts (agency MBS forward contracts).
Market pulseInterest rates have been steadily rising, with the yield on the 10-year Treasury now above 2.80%. However, the increase has been fairly gradual and we believe that rates will grind higher, not gallop. Accordingly, we believe that agency mortgage-backed securities offer value relative to other high grade securities such as Treasuries and investment grade credit.
Despite the risk of rising interest rates, investors still need diversification and ballast in their portfolios. Agency MBS have been highly correlated with Treasuries and negatively correlated with equities. While investment grade credit spreads are approaching pre-crisis levels, agency MBS are currently trading at yield levels in excess of 70 basis points relative to comparable duration U.S. Treasuries.
True, rising rates are a concern for most fixed income asset classes. However, the Bloomberg Barclays U.S. MBS Index has outperformed the similar duration Bloomberg Barclays U.S. Treasury 3-7 Year Index by 130 basis points since rates began rising last September (though both indexes did experience losses over this period).
That said, the form of MBS exposure matters. Given the current Fed tightening cycle and balance sheet normalization, the highly liquid MBS TBA market (the forward market for MBS) is coming under pressure, with implied financing levels exceeding the return on cash (see accompanying figure) and contract deliverables becoming more adverse given the Fed’s reduced buying activity of these more “cuspy” securities—current coupon MBS that have worse prepayment characteristics. Accordingly, we prefer physical agency MBS pools, which tend to have less prepayment and duration extension risk.
MKTG0418L-464977-1466225
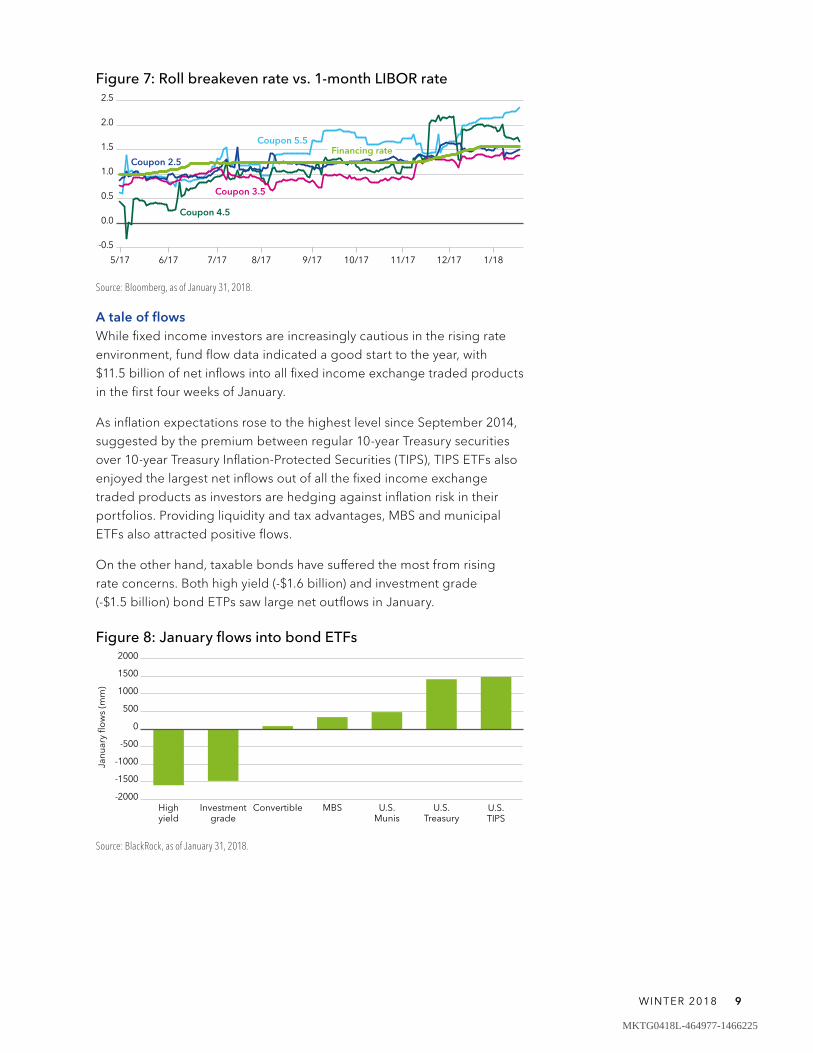
Figure 7: Roll breakeven rate vs. 1-month LIBOR rate
Coupon 2.5
Coupon 3.5
Coupon 4.5
Coupon 5.5Financing rate
1.0
0.5
0.0
-0.5
2.0
2.5
1/1810/17 11/17 12/179/178/177/176/175/17
1.5
Source: Bloomberg, as of January 31, 2018.
A tale of flowsWhile fixed income investors are increasingly cautious in the rising rateenvironment, fund flow data indicated a good start to the year, with$11.5 billion of net inflows into all fixed income exchange traded productsin the first four weeks of January.
As inflation expectations rose to the highest level since September 2014,suggested by the premium between regular 10-year Treasury securitiesover 10-year Treasury Inflation-Protected Securities (TIPS), TIPS ETFs alsoenjoyed the largest net inflows out of all the fixed income exchangetraded products as investors are hedging against inflation risk in theirportfolios. Providing liquidity and tax advantages, MBS and municipalETFs also attracted positive flows.
On the other hand, taxable bonds have suffered the most from risingrate concerns. Both high yield (-$1.6 billion) and investment grade(-$1.5 billion) bond ETPs saw large net outflows in January.
Figure 8: January flows into bond ETFs2000
1000
1500
-2000
-500
-1000
-1500
U.S.Munis
U.S.TIPS
U.S.Treasury
MBSInvestmentgrade
ConvertibleHighyield
Janu
ary
flow
s (m
m)
500
0
Source: BlackRock, as of January 31, 2018.
WINTER 2018 9
MKTG0418L-464977-1466225
10 BLACKROCK INVESTMENT DIRECTIONS
Multi-asset insightsReframing the volatility and correlations trends
Key points • The recent burst of volatility is worth examining against a longer-termtrend of volatility drifting lower across most asset classes. While wedo not expect the ultra-low volatility of 2017 to be the norm goingforward, neither do we expect a regime shift.
• The market backdrop remains favorable to risk assets, but even afterthe sell-off valuations are at the higher ends of the range. Thanks tothe growth environment, investors can still consider risky assets likeemerging markets, but should similarly consider exposures that havelonger-term stable correlations that are less prone to snap-backs.
• Factor investing strategies may offer more stable diversificationbenefits since they have historically had relatively low correlationswith one another and lower than between sectors or single stocks.This stability could be useful in forecasting risk budgets in 2018.
Market pulseLast year, volatility and correlations drifted lower across most asset classes against a backdrop of a synchronized acceleration of global growth. The sustainability of this “drift lower” came into question when global equity markets suffered sharp reversals recently. Still, periodic outbreaks of higher volatility can happen even within low-volatility market regimes. These regimes can be incredibly persistent, and occasional spikes do not suggest the sustainability of such a low volatility regime has ended, given the current growth backdrop. However, as the cycle advances and central bank normalization continues, it also does not necessarily imply markets will return to the unusually low volatility levels seen in 2017. A market regime change would typically require a deterioration in the economy and be accompanied by rising macro volatility. We don’t see that shift at this point.
Although we find the market backdrop to be favorable for risk assets in 2018, the low volatility/correlation environment has pushed valuations toward all-time highs. Even following a brief correction,* they remain closer to fully valued than “cheap” in some areas, including the United States. Investors concerned with elevated valuation levels seen in the current environment should consider diversifying by considering factor strategies, which historically have had relatively low correlations between the different factors, and lower than between sectors and single stocks. This stability could be useful in forecasting risk budgets in 2018.
Overview The low volatility and correlation environment has created challenges for portfolio construction. Historically, factors have offered lower, more consistent correlations and may provide more stable diversification benefits.
* To learn more about the recent volatility and ETFs we encourage readers to read Martin Small’s contributions to the BlackRock blog: https://www.blackrockblog.com/2018/02/07/leveraged-etps-vs-etfs/
MKTG0418L-464977-1466225

Figure 9: A spike, not a change in regimeVolatility Feb 2016 - Feb 2018
CBOE VIX20
15
10
5
0
40
30
35
2/188/172/178/162/16
CB
OE
VIX 25
200 day moving average
Source: Thomson Reuters, as of February 6, 2018.
Let us know…
How do you use this market commentary and do you find it useful? Please share your feedback and any questions or concerns you have at [email protected].
You also can find the latest market commentary from the ETF Investment Strategies & Insights group at blackrock.com/ latamiberia.
Our View and OutlookGlobal Region underweight neutral overweight
Developed markets
North America
United States
Canada
Europe
Eurozone
United Kingdom
Asia Pacific
Japan
Emerging Markets
Asia Pacific
China
India
South Korea
Latin America
Brazil
Mexico
Fixed Income Sector underweight neutral overweight
U.S. Treasuries
U.S. TIPS
U.S. Investment Grade Credit
U.S. High Yield Credit
U.S. Municipals
U.S. Mortgage-Backed Securities
Non-U.S. Developed Markets
Emerging Markets
underweight neutral overweight
Gold
underweight outlook slightly underweight outlook current neutral outlook slightly overweight outlook overweight outlook
Underweight: Potentially decrease allocation
Neutral: Consider benchmark allocation
Overweight: Potentially increase allocation
WINTER 2018 11
MKTG0418L-464977-1466225

Not FDIC Insured • May Lose Value • No Bank Guarantee
Lit. No. MKT-ID-0218 18459-0218
This material represents an assessment of the market environment as of the date indicated; is subject to change; and is not intended to be a forecast of future events or a guarantee of future results. This information should not be relied upon by the reader as research or investment advice regarding the funds or any issuer or security in particular. The strategies discussed are strictly for illustrative and educational purposes and should not be construed as a recommendation to purchase or sell, or an offer to sell or a solicitation of an offer to buy any security. There is no guarantee that any strategies discussed will be effective.The information presented does not take into consideration commissions, tax implications, or other transactions costs, which may significantly affect the economic consequences of a given strategy or investment decision. This document contains general information only and does not take into account an individual’s financial circumstances. An assessment should be made as to whether the information is appropriate in individual circumstances and consideration should be given to talking to a financial advisor before making an investment decision.Carefully consider the Funds’ investment objectives, risk factors, and charges and expenses before investing. This and other information can be found in the Funds’ prospectuses or, if available, the summary prospectuses which may be obtained by visiting iShares.com or BlackRock.com. Read the prospectus carefully before investing.Investing involves risk, including possible loss of principal.International investing involves risks, including risks related to foreign currency, limited liquidity, less government regulation and the possibility of substantial volatility due to adverse political, economic or other developments. These risks often are heightened for investments in emerging/developing markets, in concentrations of single countries or smaller capital markets. Frontier markets involve heightened risks related to the same factors and may be subject to a greater risk of loss than investments in more developed and emerging markets. There is no guarantee that any fund will pay dividends.Fixed income risks include interest-rate and credit risk. Typically, when interest rates rise, there is a corresponding decline in bond values. Mortgage-backed securities (“MBS”) and commercial mortgage-backed securities (“CMBS”) are subject to prepayment and extension risk and therefore react differently to changes in interest rates than other bonds. Small movements in interest rates may quickly and significantly reduce the value of certain mortgage-backed securities.An investment in the Fund(s) is not insured or guaranteed by the Federal Deposit Insurance Corporation or any other government agency and its return and yield will fluctuate with market conditions.There can be no assurance that performance will be enhanced or risk reduced for funds that seek to provide exposure to certain quantitative investment characteristics (“factors”). Exposure to such investment factors may detract from performance in some market environments, perhaps for extended periods. In such circumstances, a fund may seek to maintain exposure to the targeted investment factors and not adjust to target different factors, which could result in losses. The iShares Minimum Volatility ETFs may experience more than minimum volatility as there is no guarantee that the underlying index’s strategy of seeking to lower volatility will be successful.Funds that concentrate investments in specific industries, sectors, markets or asset classes may underperform or be more volatile than other industries, sectors, markets or asset classes and than the general securities market. Technology companies may be subject to severe competition and product obsolescence. The iShares Funds are not sponsored, endorsed, issued, sold or promoted by MSCI Inc., nor does this company make any representation regarding the advisability of investing in the Funds. BlackRock is not affiliated with the company listed above. The iShares funds that are registered with the U.S. Securities and Exchange Commission under the Investment Company Act of 1940 (“Funds”) are distributed in the U.S. by BlackRock Investments, LLC (together with its affiliates, “BlackRock”).This material is solely for educational purposes and does not constitute an offer or solicitation to sell or a solicitation of an offer to buy any shares of any fund (nor shall any such shares be offered or sold to any person) in any jurisdiction in which an offer, solicitation, purchase or sale would be unlawful under the securities law of that jurisdiction.In Latin America, for Institutional and Professional Investors Only (Not for Public Distribution):It is possible that some or all of the funds mentioned or inferred to in this material have not been registered with the securities regulator of Brazil, Chile, Colombia, Mexico, Peru, Uruguay or any other securities regulator in any Latin American country, and thus, might not be publicly offered within any such country. The securities regulators of such countries have not confirmed the accuracy of any information contained herein. No information discussed herein can be provided to the general public in Latin America. In Hong Kong, this information is issued by BlackRock Asset Management North Asia Limited. This material is for distribution to “Professional Investors” (as defined in the Securities and Futures Ordinance (Cap.571 of the laws of Hong Kong)) and should not be relied upon by any other persons. In Singapore, this document is issued by BlackRock (Singapore) Limited (company registration number: 200010143N) for institutional investors only. For distribution in Korea and Taiwan for Institutional Investors only (or “professional clients,” as such term may apply in local jurisdictions). This document is for distribution to professional and institutional
investors only and should not be relied upon by any other persons. This document is provided for informational purposes only and does not constitute a solicitation of any securities or BlackRock funds in any jurisdiction in which such solicitation is unlawful or to any person to whom it is unlawful. Moreover, it neither constitutes an offer to enter into an investment agreement with the recipient of this document nor an invitation to respond to it by making an offer to enter into an investment agreement. Past performance is not a guide to future performance. There are risks associated with investing, including loss of principal. Changes in the rates of exchange between currencies may cause the value of investments to fluctuate. This document is for informational purposes only and does not constitute an offer or invitation to anyone to invest in any BlackRock fund and has not been prepared in connection with any such offer. Any research in this document has been procured and may have been acted on by BlackRock for its own purpose. The results of such research are being made available only incidentally. The views expressed do not constitute investment or any other advice and are subject to change. They do not necessarily reflect the views of any company in the BlackRock Group or any part thereof and no assurances are made as to their accuracy. This document contains general information only and does not take into account an individual’s circumstances and consideration should be given to talking to a financial or other professional adviser before making an investment decision. You are reminded to refer to the relevant prospectus for specific risk considerations which are available from BlackRock websites. BlackRock® is a registered trademark of BlackRock, Inc., or its subsidiaries in the United States and elsewhere. All other trademarks, servicemarks or registered trademarks are the property of their respective owners. © 2018 BlackRock Inc. All rights reserved.Notice to residents in Australia:FOR WHOLESALE CLIENTS AND PROFESSIONAL INVESTORS ONLY – NOT FOR PUBLIC DISTRIBUTIONIssued in Australia by BlackRock Investment Management (Australia) Limited ABN 13 006 165 975, AFSL 230523 (“BlackRock”). This information is provided for ‘wholesale clients’ and ‘professional investors’ only. Before investing in an iShares exchange traded fund, you should carefully consider whether such products are appropriate for you, read the applicable prospectus or product disclosure statement available at iShares.com.au and consult an investment adviser. Past performance is not a reliable indicator of future performance. Investing involves risk including loss of principal. No guarantee as to the capital value of investments nor future returns is made by BlackRock or any company in the BlackRock group. Recipients of this document must not distribute copies of the document to third parties. This information is indicative, subject to change, and has been prepared for informational or educational purposes only. No warranty of accuracy or reliability is given and no responsibility arising in any way for errors or omissions (including responsibility to any person by reason of negligence) is accepted by BlackRock. No representation or guarantee whatsoever, express or implied, is made to any person regarding this information. This information is general in nature and has been prepared without taking into account any individual’s objectives, financial situation, or needs. You should seek independent professional legal, financial, taxation, and/or other professional advice before making an investment decision regarding the iShares funds. An iShares fund is not sponsored, endorsed, issued, sold or promoted by the provider of the index which a particular iShares fund seeks to track. No index provider makes any representation regarding the advisability of investing in the iShares funds.Notice to investors in New Zealand: FOR WHOLESALE CLIENTS ONLY – NOT FOR PUBLIC DISTRIBUTIONThis material is being distributed in New Zealand by BlackRock Investment Management (Australia) Limited ABN 13 006 165 975, AFSL 230523 ("BlackRock"). In New Zealand, this information is provided for registered financial service providers and other wholesale clients only in that capacity, and is not provided for New Zealand retail clients as defined under the Financial Advisers Act 2008. BlackRock does not offer interests in iShares to the public in New Zealand, and this material does not constitute or relate to such an offer. Before investing in an iShares exchange traded fund, you should carefully consider whether such products are appropriate for you, read the applicable prospectus or product disclosure statement available at iShares.com.au and consult an investment adviser. Past performance is not a reliable indicator of future performance. Investing involves risk including loss of principal. No guarantee as to the capital value of investments nor future returns is made by BlackRock or any company in the BlackRock group. Recipients of this document must not distribute copies of the document to third parties. This information is indicative, subject to change, and has been prepared for informational or educational purposes only. No warranty of accuracy or reliability is given and no responsibility arising in any way for errors or omissions (including responsibility to any person by reason of negligence) is accepted by BlackRock. No representation or guarantee whatsoever, express or implied, is made to any person regarding this information. This information is general in nature and has been prepared without taking into account any individual’s objectives, financial situation, or needs. You should seek independent professional legal, financial, taxation, and/or other professional advice before making an investment decision regarding the iShares funds. An iShares fund is not sponsored, endorsed, issued, sold or promoted by the provider of the index which a particular iShares fund seeks to track. No index provider makes any representation regarding the advisability of investing in the iShares funds.©2018 BlackRock, Inc. All rights reserved. BLACKROCK, iSHARES, iBONDS and SO WHAT DO I DO WITH MY MONEY are registered trademarks of BlackRock, Inc. in the United States and elsewhere. All other marks are the property of their respective owners.
MKTG0418L-464977-1466225