investment management cost & volatility analysis model
TRANSCRIPT

YOU MAKE STRATEGIC INVESTMENT DECISIONS WITH SOLID DATA AND ANALYTICS. WHY NOT USE THE SAME TO PURCHASE INSURANCE?
TIMES ARE CHANGING - REGULATORY SCRUTINY & ENFORCEMENT ACTIONS ARE INCREASING
In recent years, the U.S. Securities & Exchange Commission (SEC) and other regulatory and governmental bodies have devoted significant resources to uncover and correct wrongdoing in the asset management industry. According to its most recent annual report, the SEC levied a record number of enforcement actions, fines, and penalties against investment advisers. (To see the 2016 enforcement results, click here). High ranking officials at the SEC indicate that this trend will continue.
The result? Increased regulatory scrutiny and enforcement activities are forcing investment managers to incur substantial costs responding to regulatory activities and defending against related litigation.
Investment managers are consulting with outside legal counsel and other service providers to help them prevent, mitigate, or transfer regulatory and litigation risk.
PREPARING FOR ENFORCEMENT ACTIONSJLT SPECIALTY USA | NOVEMBER 2016 | AN INVESTMENT MANAGEMENT PERSPECTIVE
Traditional methods of assessing insurance needs are inadequate, and go against the very data-driven nature of investment managers.
JLT has developed an industry disrupting analysis tool that guides insurance decisions based on claims and loss history from 10,000 investment management D&O/E&O policies going back to 2009.
Our model guides you in making insurance decisions based on YOUR firm’s true risks and exposures, not someone else’s.

INVESTMENT MANAGEMENT PERSPECTIVEJLT SPECIALTY USA |
PROTECTING AGAINST LITIGATION: ARE YOU APPROPRIATELY COVERED?
One tool to help protect corporate assets, fund assets, and the personal assets of partners, officers and other executives is management and professional liability insurance (a.k.a. directors’ and officers’ liability (D&O) and errors and omissions (E&O) insurance). A well-constructed D&O/E&O policy can transfer regulatory and litigation risk to an insurance company by covering the costs to defend and/or settle such matters.
One key element of this process is determining if you have sufficient D&O/E&O insurance coverage to respond to an action, defend against litigation, and protect corporate, fund, and personal assets. Since these events may take years to defend and the costs may extend into the millions of dollars for defense, if you’re not adequately covered, are you prepared to pay these bills when D&O/E&O insurance could have covered them?
SELECTING INSURANCE LIMITS: IS BENCHMARKING RELIABLE?
To help determine appropriate D&O/E&O coverage limits, asset managers have historically asked their insurance specialists what coverage limits are purchased by their peers. The specialist would provide anonymous limit data from other investment managers’ insurance programs (called benchmark data) arranged by total assets under management, investment objective, or another comparable risk parameter.
At one time, benchmarking against peer data may have been the only tool investment managers had to determine D&O/E&O limits, and it is imperfect. Each investment manager has different risk exposures, risk tolerances, opinions, and insurance purchasing habits. If your peers are more risk tolerant or more risk averse than you, the limits they purchase may be irrelevant and incomparable to your needs and risk exposures.
In other words, using peer benchmarking data to determine your D&O/E&O limits is like buying yourself a pair of shoes based on what size your neighbor wears. It makes more sense to use your firm’s own risk parameters and risk tolerance levels to select an appropriate D&O/E&O insurance limit.
The 2016 enforcement results include new highs for Foreign Corrupt Practices Act-related enforcement actions (21) and new highs for awards distributed to whistleblowers ($57M).
The 2016 enforcement results include the most ever independent cases involving investment advisers or investment companies (98).
On average, 5% of investment managers notify their primary D&O/E&O insurer of a claim each year, ranging from 9% (2009) to 3% (2013 / 2014).
The insurer data provided shows average loss per claim made to primary insurers varied from $1.027M to $1.745M since 2009.
2

INVESTMENT MANAGEMENT PERSPECTIVEJLT SPECIALTY USA |
In today’s regulated and litigious environment, selecting insurance the same way you make investment decisions – by using real, analytical data – is ideal, and it best positions asset managers to achieve optimal results.
There has never been a tool to help you do this – until now.
NEW JLT APPROACH IS UNPRECEDENTED IN THE INDUSTRY
JLT Specialty USA’s approach to selecting D&O/E&O insurance limits is unprecedented in the industry for two reasons.
Following a customized simulation, the frequency and severity of various types of events can be determined.
In the sample output shown below, there is a 2.5% chance this company will experience an investor litigation loss event.
SELECTED SAMPLE MODEL OUTPUTS ($ IN M)Events Frequency Avg. Severity 1 in 100 Severity 1 in 250 Severity
Controlling Shareholder Litigation 1.66% $2.6M $20.1M $29.7MInvestor Litigation 2.50% $2.8M $23.2M $36.0MRegulatory 5.16% $2.9M $22.4M $33.2MCost of Correction 0.50% $0.4M $2.8M $4.0MInvestment Management E & O 4.49% $3.7M $29.8M $44.1M
Proprietary Investment Management Model
First, we have developed a proprietary Investment Management Cost & Volatility Analysis (CVA) Model that - when combined with our experienced brokerage and claims teams - will help you identify your true risks and exposures.
Second, our Investment Management CVA Model was built on portfolio-wide claims and loss data provided by five leading investment management D&O/E&O insurance carriers. The data includes actual claims and loss history from nearly 10,000 investment management D&O/E&O policies going back to 2009. Our CVA Model uses this data to provide valuable insight on where recently paid D&O/E&O claims have come from and where they might go in today’s evolving business and regulatory environment.
Our Investment Management CVA Model analyzes various investment management loss scenarios, including investor/shareholder litigation, regulatory enforcement actions and investigations, controlling shareholder litigation, cost of correction losses, and other asset management D&O/E&O-related losses.
Risk factors considered in the model include total assets under management, number/type of investors, investment strategies, and number of trades per day, among others.
Once risk factors are determined, we model your exposure through thousands of simulations over a five-year period and then provide the Net Present Value (NPV) view of the results. The five-year horizon is unique in the industry and allows us to change risk factors over time to account for anticipated changes.
3
INVESTMENT MANAGEMENT PERSPECTIVE 4JLT SPECIALTY USA |
Limits based on actual claims data
After we measure your risk exposures, we review various D&O/E&O limits and retentions to identify the most efficient financial protection strategy. Our data-driven analysis answers questions such as “Is my program effectively reducing my exposure to material loss events?” or “Is there a better limit and retention strategy for me?”
The Investment Management CVA model is unprecedented in the industry – it was built on portfolio-wide claims and loss data provided to us by five of the leading investment management D&O/E&O insurance carriers. The data includes claims and loss history from almost 10,000 investment management D&O/E&O policies going back to 2009. It provides valuable insight on where recently paid D&O/E&O claims have come from and where they might go in today’s changing business and regulatory environment.
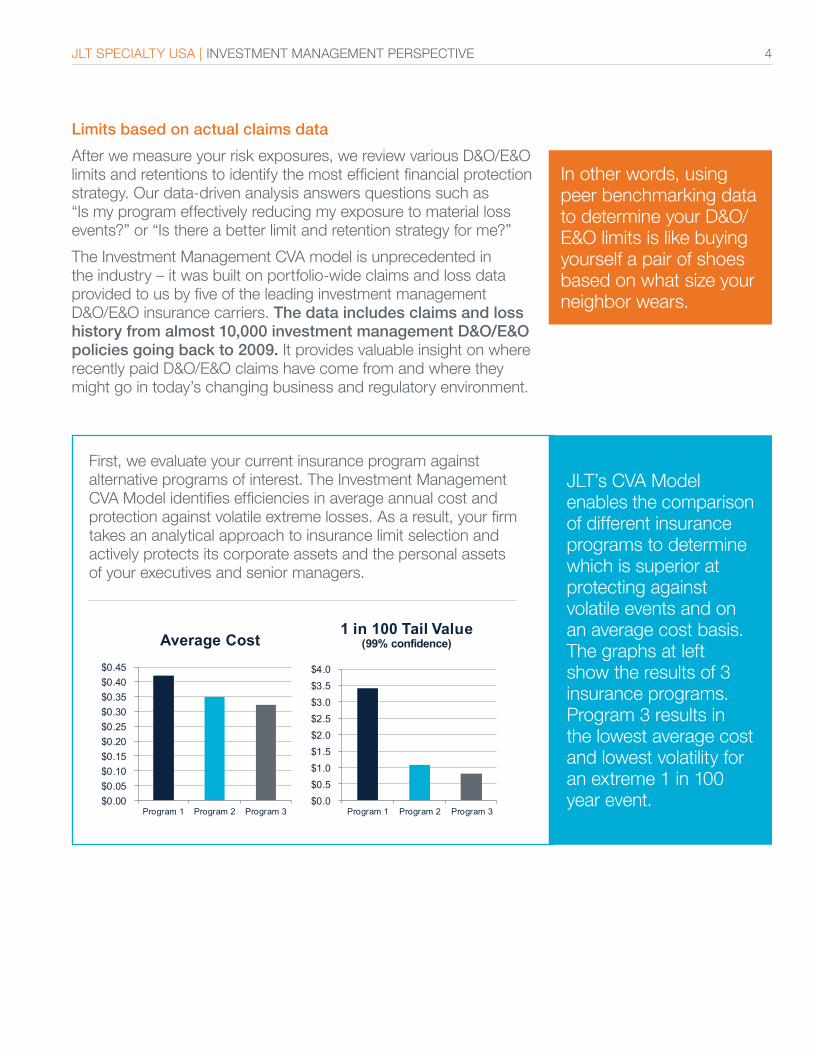
$0.00$0.05$0.10$0.15$0.20$0.25$0.30$0.35$0.40$0.45
Program 1 Program 2 Program 3
Average Cost
$0.0$0.5$1.0$1.5$2.0$2.5$3.0$3.5$4.0
Program 1 Program 2 Program 3
1 in 100 Tail Value(99% confidence)
JLT’s CVA Model enables the comparison of different insurance programs to determine which is superior at protecting against volatile events and on an average cost basis. The graphs at left show the results of 3 insurance programs. Program 3 results in the lowest average cost and lowest volatility for an extreme 1 in 100 year event.
First, we evaluate your current insurance program against alternative programs of interest. The Investment Management CVA Model identifies efficiencies in average annual cost and protection against volatile extreme losses. As a result, your firm takes an analytical approach to insurance limit selection and actively protects its corporate assets and the personal assets of your executives and senior managers.
In other words, using peer benchmarking data to determine your D&O/E&O limits is like buying yourself a pair of shoes based on what size your neighbor wears.
ABOUT JLT
JLT Specialty USA is the U.S. platform of the leading specialty business advisory firm, Jardine Lloyd Thompson Group. Our experts have deep industry and product experience serving leading U.S. and global firms. Our key to client success is our freedom to be creative, collaborative, and analytical while challenging conventions, redefining problems, creating new analytical insights, and exploring new boundaries to deliver solutions for each client’s unique business and risks.
JLT is one of the world’s leading providers of insurance, reinsurance and employee benefits related advice, brokerage and associated services. We are specialists. Our deep expertise and entrepreneurial culture give us the insights, creative freedom and tenacity to go beyond the routine and deliver better results for our clients. At JLT, clients come first. JLT owns offices in 40 territories and has more than 10,600 colleagues. Supported by the JLT International Network, we service clients in over 135 countries.
© 2016 JLT Specialty USA www.jltus.com
TO DISCUSS YOUR SPECIFIC INVESTMENT MANAGEMENT NEEDS, PLEASE CONTACT:
MARK FLIPPEN
Senior Vice President Financial Institutions Practice
C 917.991.4655 E [email protected]
RYAN FARNSWORTH, ARM
Vice President Financial Lines Group
T 415.930.9009 C 917.207.1392 E [email protected]
CHRIS NAJIM, PHD, FCAS, MAAA
Senior Vice President Analytics and Consulting
T 312.637.6124 C 312.785.3606 E [email protected]
DOES BENCHMARKING DATA STILL HAVE A ROLE TO PLAY?
While peer benchmarking data may continue to be used to help determine limits of liability for D&O/E&O coverages, the Investment Management CVA model fills in the critical gaps benchmarking leaves behind. Our CVA model offers investment managers the most accurate method of selecting D&O/E&O program structures, limits, and retentions based on actual risk exposures and risk tolerance.
JLT’s Investment Management CVA Model provides just one important component of a thorough D&O/E&O insurance program assessment. If you’d like to discuss how your firm can incorporate data analytics into the selection and placement of D&O/E&O insurance, please contact us for a complimentary CVA Model analysis and assessment of your D&O/E&O insurance program.
5