investment outlook may 2017 - seb group · pdf filein this issue of investment outlook, we...
TRANSCRIPT

Investment Outlook May 2017

2 Investment OutlOOk - maY 2017

3Investment OutlOOk - maY 2017
In this issue: Optimistic, with an eye on risks
Introduction 3
Market view – summary 4-5
Market view – macro 6-8Clear acceleration on a winding path
Global equities 9-10Positive reports strengthenmarket upturn
Theme – Emerging markets 11-12Robust global economy putsEMs in the spotlight
Nordic equities 13-15Earnings growth leads to cautiously optimistic market view
Fixed income 16-17 Expansionary monetary policy, but changing risks
Alternative investments 18-19 Divergent signals from stock and fixed income markets
Currencies 20-21 Trendless foreign exchange market
Theme – The big digital shift 22-24 Old truths challenged by strong innovative forces
This report was published on May 23, 2017. Its contents are based on information and analysis available before May 17, 2017.
We have emerged from a series of political ordeals while global growth has accelerated and broadened, with a number of sectors and regions improving simultaneously. First quarter corporate reports confirm strong conditions; both sales and earnings are rising in a way we have not experienced for many years. This has had a major impact on capital markets, with the global stock market continuing to climb at an impressive pace amid very low volatility. In the fixed income market, yields seem to have bot-tomed out while credit spreads (the difference between govern-ment bond and corporate bond yields) remain narrow.
Does this imply that investors see no obstacles ahead? Or is the market trend a continued effect of central bank stimulus meas-ures, including record-low key interest rates and purchases of fixed income instruments, which “force” investors searching for returns to maintain high risk in their portfolios?
There are definitely potential threats – such as valuation levels and high global debt combined with record-low interest rates – that may lead to headwinds if interest rates rise. Central banks also have limited potential to act in case of any crisis situation.
In this issue of Investment Outlook, we present our view of how investors should balance these positive and negative forces via a suitable allocation among various assets. Is it time to apply the brakes in terms of risk exposure? What is the probability that we can expect continued strong capital markets ahead? We answer these questions and analyse the underlying potential of various asset classes.
The issue includes two in-depth theme articles. The first focuses on emerging markets, which have bounced back strongly this past year after a lengthy period of problems connected to the commodities sector. We describe conditions now that the situa-tion has improved.
Our second theme article deals with digital shifts and changed consumer behaviour, with a growing percentage of the global population regarding commerce via computers or telephones as the smartest and most convenient alternative. More and more consumer goods are thus being delivered straight home to the customer. Technical solutions and rational behaviour underlie these changes, which are having a big impact on the corporate sector.
Wishing you enjoyable reading,
FREDRIK ÖBERGChief Investment Officer,
Investment Strategy

4 Investment OutlOOk - maY 2017
Market view Summary
ASSET WEIGHT
TACTICAL EXPECTATION (12-MONTH)
RETURN RISK
EQUITIES
Global equities 1 2 3 4 5 6 7 5.7% 13.9%
Emerging market (EM) equities 1 2 3 4 5 6 7 6.7% 16.5%
Swedish equities 1 2 3 4 5 6 7 8.8% 13.7%
FIXED INCOME
Government bonds 1 2 3 4 5 6 7 -1.7% 2.0%
Corporate bonds, investment grade (IG) 1 2 3 4 5 6 7 0.4% 3.6%
Corporate bonds, high yield (HY) 1 2 3 4 5 6 7 2.4% 6.3%
Emerging market (EM) debt 1 2 3 4 5 6 7 5.8% 13.1%
ALTERNATIVE INVESTMENTS
Hedge funds 1 2 3 4 5 6 7 N/A N/A
Commodities 1 2 3 4 5 6 7 N/A N/A
CURRENCIES
Currency Pairs forecast on may 11, 2017
Q2 2017 Q3 2017
EUR/USD 1.09 1.09 1.10
EUR/SEK 9.65 9.50 9.45
USD/SEK 8.88 8.72 8.59
“Weight” shows how we currently view the asset type as part of a portfolio. These weights are changed continuously, based on our tacti-cal market view, and may thus diverge from our long-term strategic view. Tactical expected return is based on the SEB House View as of May 11, 2017. Index/basis for estimates: Global equities – MSCI All Country World Index in local currencies. Emerging markets – MSCI EM TR in local currencies. Swedish equities − SIX Portfolio Return Index in SEK. Government bonds − OMRX T-bonds in SEK. Corporate bonds (IG and HY), IBOXX Investment Grade Index in USD and IBOXX High Yield Index in USD. EM debt − JP Morgan Emerging Markets Bond Index in local currencies. Hedge funds − HFRX Global Hedge Fund Index in USD.
We maintained an aggressive market view during 2016 and early 2017, arguing that an accelerating economic growth rate would generate an earnings upswing in the corporate sector and that political risks would generate only tempo-rary volatility. This analysis was correct and has borne fruit, but the question now is whether it still applies.
We are sticking to our positive view of global economic and earnings growth ahead. Nor do we see the risk situation as troubling when it comes to factors that have historically put an end to long recoveries – in other words recessions, bank-ing crises or overstretched asset valuations.
Yet our optimism needs to be nuanced when we know that valuations are on the high side and that the investor com-munity has a fair amount of risky assets in its portfolios.
This definitely limits our risk appetite. Also waiting around the corner are interest rate hikes by the US Federal Reserve (Fed). Other central banks should gradually follow suit. It is also possible that the same central banks will then begin to shrink their balance sheets by not reinvesting all bond hold-ings as they mature. This would give us a mechanism that raises interest rates in the system and slows liquidity at the same time. If so, this process will occur gradually and cau-tiously since everyone is aware of the risk of adverse effects in a highly indebted economic system.
After a very strong period, we have now chosen to adjust the risk in our portfolios downward towards a normal situ-ation – in order to reflect lower, but still positive, expected future returns. We also do not believe that today’s extremely low volatility will last.

5Investment OutlOOk - maY 2017
IN THE LAST ISSUE OF Investment Outlook (published in February 2017), we recommended an overweighting of risk in our portfolios. After that we adjusted our risk even higher, since we had received signals confirming strong earnings generation among companies. In the final phase of the quar-terly report season, however, we chose to adjust our port-folios downward towards a neutral position. This is because the capital market had discounted very positive outcomes, thereby reducing expected return while risk is intact.
The following is a review of a number of important factors that now justify our neutral stance towards risk assets and our view of how they may influence future developments.
Central banks: Continued low interest rates and stimulative securities purchases, except in the US, where the Federal Reserve is planning three key interest rate hikes yearly and possibly shrinking its balance sheet during 2017-2018. Over-all, monetary policies will become gradually less stimulative.
Growth and earnings: Clearly improved conditions for rising growth and inflation will create the potential for stronger earnings in most corporate sectors. There are hopes that active fiscal policy may contribute positively, offsetting gradually diminishing monetary policy support.
Valuations: Compared to historical valuations, current levels are high. In relation to valuations of government bonds or risk-free interest rates, valuations of equities and corporate credits are more normal, provided that economic growth persists.
Risk appetite and positioning: Both risk appetite and positioning have reached levels that are beginning to signal caution, and the proportion of risk assets such as equities is large in many investors’ portfolios. Because of this factor, we are holding back our risk exposure, even though risk appetite is not yet at historical peaks.
Expected returns: We continue to expect positive returns from most asset classes over the next 12 months. These expected returns are lower than historical averages, while risk is intact. The reasons are higher valuations and expecta-tions of continued interest rate increases, which among other things will undermine bond yields.
Examples of risks: Valuation levels, high global debt, signals of increasing protectionism, the potentially negative effects of rising inflation, interest rates and bond yields as well as central banks that gradually normalise their key interest rates and balance sheets. Finally, the economic recovery and stock market upturn have been under way since 2009, making them increasingly sensitive even though the current level of activity is higher than for a long time.
We have neutralised our previous overweighting of equities (Swedish and global). In fixed income investments, we prefer corporate credits with relatively short maturities. Our portfo-lio of alternative investments maintains a broad diversifica-tion among various hedge fund strategies in order to create a defensive character.
OUR PORTFOLIO MANAGEMENT– ASSET ALLOCATION
GLOBAL EQUITIES
FIXED INCOME
ALTERNATIVE INVESTMENTS
NORDIC EQUITIES
• We have neutralised our asset allocation after a period of substantial overweighting of equities and underweighting of fixed income investments.
• In global equities we continue under-weighting the US to some extent while overweighting other regions.
• We favour corporate credits with short maturities in our fixed income portfolios, while our alternative investments are characterised by defensive hedge funds.
• Positive forces: The global growth rate and earnings generation, central banks in the short term, relative valuations.
• Negative forces: Global debt, absolute valuations, central banks in the medium term, Fed rate hikes in the near term and a period of strong performance behind us.
• We prioritise stock markets in regions that will benefit from higher global growth and low valuations, such as Europe, Japan and emerging markets.
• Value shares should perform better than growth shares, thanks to strong cyclical signals.
• A synchronised global economic recovery suggests that earnings forecasts will be re-alised, but valuations of earnings multiples are high in a historical perspective. The world index is valued at a price/earnings ratio of 16.5 based on 12-month forecasts.
• First quarter 2017 reports were surprisingly strong.
• Upward revisions make optimistic forecasts credible.
• Low interest rates and bond yields con-tinue to sustain the stock market.
• High valuations limit potential.
• In Sweden, Riksbank rate hikes will be delayed despite strong economic growth.
• The European Central Bank (ECB) will con-tinue its stimulus measures but take steps in September to start phasing them out.
• The Federal Reserve will both hike its key rate and shrink its balance sheet.
• Strong stock markets despite a lack of action by President Trump.
• Continued depressed government bond yields signal some uncertainty.
• Decreased correlations within and between asset types.
• Hedge funds have delivered positive returns while the commodity segment has struggled.

6 Investment OutlOOk - maY 2017
Record-strong forward-looking indicators and a clear surge in growth are providing a bright economic picture. We are raising our global growth forecasts, mainly driven by higher capital spending and good private consumption – especially in Europe and emerging market (EM) economies. Yet our upgrades are modest, due to restraining factors such as high capacity utilisation, weak demographics and productivity growth as well as large debts.
Market view – macroClear acceleration on a winding path
Despite some acceleration in US wages and salaries, which we expect to continue, pay increases are surprisingly low. We expect this situation, which is favourable to inflation and corporate earnings, to persist for another while.
LOW PAY INCREASES
Source: Macrobond
Previously positive forward-looking indicators have become even more positive since our last Investment Outlook (Febru-ary 2017). Both corporate purchasing managers’ indices (PMIs) and consumer confidence indices are at very high levels. We are now also seeing a clear upturn in economic data, though (as usual) with a weak first quarter in the United States as the exception. Although actual growth is accelerating, there is a persistent and historically wide gap between this and the more optimistic indicators. These in-dicators are normally good forecasting instruments, but for some time they have signalled stronger growth than actual outcomes. Our forecasts thus assume that growth will speed up, but not as fast as the indicators suggest. If indicator data should again prove accurate, growth may thus exceed our forecast. Our main scenario is that indicators like PMIs and consumer confidence will fall from today’s peaks and that growth will improve a bit.
There are two reasons to be optimistic about the current economic acceleration. First, it is broad-based and is occur-ring both in different regions and economic sectors. Second, it is being driven by the “right” forces: capital spending and private consumption. These key elements of final demand provide more balanced, sustainable growth than large government stimulus programmes, for example. We expect the pace of growth to remain healthy at least during 2018, but there is reason to keep an eye on the risks created by the great length of the current upturn (nearly 8 years). This
means that the economy no longer has as much room to grow as it did early in the recovery, when capacity utilisa-tion was low. On the contrary, this is a common reason why recoveries end – because bottlenecks drive up inflation and interest rates, thus diminishing capital spending and consumption – but we are not there yet. Another common reason for downturns is burst financial market bubbles, something we do not foresee today either, but a clear risk if ultra-low interest rates continue.
There is no shortage of challenges and worries, however. Ageing populations are more inclined to build up their sav-ings, leaving less room for consumption, while weak produc-tivity growth creates supply-side constraints. Add to this the large debts and related imbalances that must be addressed one day, and the underlying growth picture will be subdued. In the near term, political worries have partly dissipated this spring due to European election results and gentler signals than feared from the White House about US trade policy. But there are still major political challenges on both sides of the Atlantic. Given strong labour markets – especially in the US – it is almost remarkable that wage and salary inflation is not surging. If this should occur at too rapid a pace, it may spell the beginning of the end of the long recovery period, but so far the picture is dominated by a healthy acceleration in growth coupled with modest pay increases and benign inflation of 1-2 per cent – almost the best of all worlds, at least from the perspective of companies.

7Investment OutlOOk - maY 2017
Despite great optimism, private consumption growth fell surprisingly dur-ing the first quarter of 2017. Warmer weather probably explains this in part, but we expect a clear acceleration during the next few quarters.
TEMPORARY DIP IN AMERICAN CONSUMPTION
Source: Bureau of Labor Statistics
In the euro zone, as in many other places, we are seeing a clear upturn in purchasing managers’ indices (PMIs). Healthy corporate earnings during the first quarter confirm our picture of an ongoing acceleration in growth, though not as powerful as sentiment indicators suggest.
INDICATORS SIGNAL FASTER EURO ZONE GROWTH
Source: Eurostat, Markit
US – Short-lived slowdown In almost traditional fashion, first quarter GDP growth was surprisingly weak. Weather effects have been cited as an explanation. In any event, financial markets reacted calmly to the figure. Nor do we expect any major fiscal stimulus this year. The Trump administration is having obvious difficulties pushing through its policies, but we expect some tax cuts to contribute marginally to growth next year. Still, continued labour market improvement and a much brighter capital spending outlook suggest that growth will speed up again, along with continued very strong forward-looking indicators. Looking ahead, these indicators are likely to fall somewhat, but given the strong labour market and relatively high savings ratio, households – which have so far defied consumption forecasts – should open their wallets. Together with strong capital investments and industrial activity, this will lead to healthy growth over the next couple of years.
Euro zone – Growth is acceleratingConditions for growth have continued to improve in recent months. Rising employment is contributing to more opti-mistic households while a faster pace of business activity is pushing capacity utilisation higher, triggering investments that are driving growth. Forward-looking indicators are also continuing to provide a highly positive picture, while the relatively weak euro is helping to sustain exports. We also expect support from weakly stimulative fiscal policies, but on the other hand these measures are also needed to meet demographic challenges such as ageing populations and refugee inflows. Political uncertainty has diminished due to election outcomes in the Netherlands and France. While the euro zone still faces substantial political challenges in the next few years, we do not expect these to have any crucial near-term impact on the economy.
In the United Kingdom, the Brexit process (British with-drawal from the European Union) has not yet clearly affected economic growth; the weak pound has probably offset this. However, we expect political uncertainty to have a clear decelerating effect in 2017-2018.
Japan – Uphill with the handbrake onDemographic headwinds and structural problems continue to hamper Japan’s growth. The short-term picture shows bright spots: fiscal stimulus packages and a weak yen. But given major underlying problems, this only suffices to bring growth a bit above zero, though companies – especially exporters – are clearly benefiting from global growth and the currency situation.
EM sphere – Wheels spinning fasterThe outlook for emerging market (EM) countries has recently improved. Although there are still risks of pro-tectionism, world trade is increasing again. This benefits EM economies, which are often export-oriented. Add in a continued stabilisation of commodity prices and improved current account balances in the most vulnerable countries, and the general picture looks better than for a long time.
Among major EM countries, India remains the shining star in terms of growth. Last year’s problematic currency reform slowed the economy less than feared. Meanwhile India has implemented several important economic reforms, especially the national goods and services tax launched this year, which will favourably impact growth starting in 2018. Both Russia and Brazil have emerged from recession, but due to major structural problems growth will be weak in the next couple of years.
China – Economic surge, policy tighteningChina’s growth was robust early in 2017. Aside from an al-ready strong service sector, there was a clear industrial up-swing, thanks to stronger exports and more construction. Unlike recent years, when authorities needed to stimulate the economy to avoid potential rapid deceleration, we expect a policy reversal this year aimed at decreasing risks in the economy and thereby slowing growth. We anticipate tighter monetary policy and credit restrictions, but there is little risk that Beijing will overdo these measures, since this is a politically important year. Much of China’s top leadership will be replaced this autumn, so authorities will
8 Investment OutlOOk - maY 2017
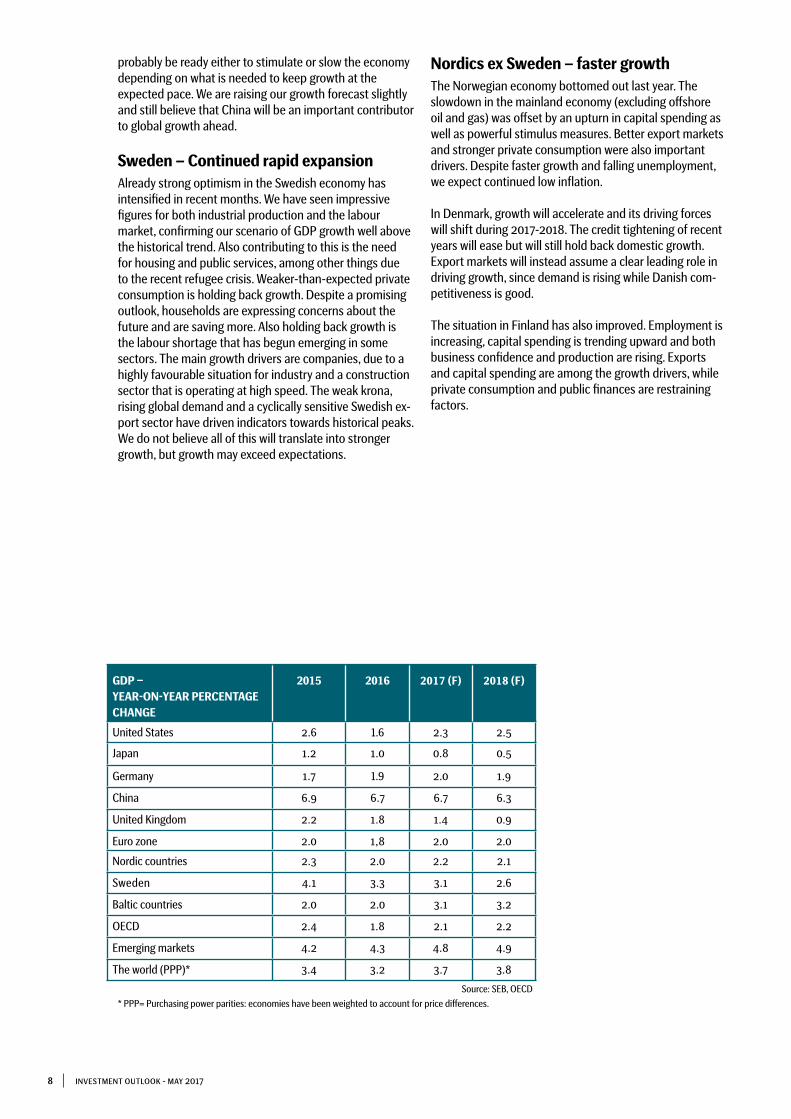
GDP – YEAR-ON-YEAR PERCENTAGE CHANGE
2015 2016 2017 (F) 2018 (F)
United States 2.6 1.6 2.3 2.5
Japan 1.2 1.0 0.8 0.5
Germany 1.7 1.9 2.0 1.9
China 6.9 6.7 6.7 6.3
United Kingdom 2.2 1.8 1.4 0.9
Euro zone 2.0 1,8 2.0 2.0
Nordic countries 2.3 2.0 2.2 2.1
Sweden 4.1 3.3 3.1 2.6
Baltic countries 2.0 2.0 3.1 3.2
OECD 2.4 1.8 2.1 2.2
Emerging markets 4.2 4.3 4.8 4.9
The world (PPP)* 3.4 3.2 3.7 3.8
* PPP= Purchasing power parities: economies have been weighted to account for price differences.
Source: SEB, OECD
probably be ready either to stimulate or slow the economy depending on what is needed to keep growth at the expected pace. We are raising our growth forecast slightly and still believe that China will be an important contributor to global growth ahead.
Sweden – Continued rapid expansion Already strong optimism in the Swedish economy has intensified in recent months. We have seen impressive figures for both industrial production and the labour market, confirming our scenario of GDP growth well above the historical trend. Also contributing to this is the need for housing and public services, among other things due to the recent refugee crisis. Weaker-than-expected private consumption is holding back growth. Despite a promising outlook, households are expressing concerns about the future and are saving more. Also holding back growth is the labour shortage that has begun emerging in some sectors. The main growth drivers are companies, due to a highly favourable situation for industry and a construction sector that is operating at high speed. The weak krona, rising global demand and a cyclically sensitive Swedish ex-port sector have driven indicators towards historical peaks. We do not believe all of this will translate into stronger growth, but growth may exceed expectations.
Nordics ex Sweden – faster growth The Norwegian economy bottomed out last year. The slowdown in the mainland economy (excluding offshore oil and gas) was offset by an upturn in capital spending as well as powerful stimulus measures. Better export markets and stronger private consumption were also important drivers. Despite faster growth and falling unemployment, we expect continued low inflation.
In Denmark, growth will accelerate and its driving forces will shift during 2017-2018. The credit tightening of recent years will ease but will still hold back domestic growth. Export markets will instead assume a clear leading role in driving growth, since demand is rising while Danish com-petitiveness is good.
The situation in Finland has also improved. Employment is increasing, capital spending is trending upward and both business confidence and production are rising. Exports and capital spending are among the growth drivers, while private consumption and public finances are restraining factors.
9Investment OutlOOk - mAY 2017
Global equities Positive reports strengthen market upturn
The first quarter report period has mainly provided upside surprises so far. It has been customary to gradually adjust overly positive earnings forecasts down-ward early in the year. This time the opposite is true. Cyclical sectors are showing good earnings and sales growth. Order bookings have also provided upside surprises, an indica-tion of future sales increases. This is mainly being driven by sectors that have been underinvested for a number of years but are now seeing demand increase. This is clearest in the energy and mining sectors, but also among industrials. Volume increases in cyclical industrials also lead to better margins. The demand situation is stable and equivalent in the US, Europe and parts of Asia, while it is levelling off in countries that have struggled with falling GDP, such as Brazil and Rus-sia. The banking sector is showing generally strong reports in the US and Europe, with varying share price reactions. American banks saw their share valuations rise sharply late in 2016 on hopes of deregulation and tax cuts. Good Q1 2017 earnings were enough to defend their 2016 price up-turn, but no more. European banks mostly provided upside surprises, though from low levels, and have seen their share prices climb 10 per cent this year. The most crucial factor behind the upturn for European banks has not been their quarterly reports, however, but the outcome of the French presidential election. French and German banks such as BNP Paribas, Société Général and Deutsche Bank saw their share prices surge by 8-10 per cent the day after the first presidential round in late April.
The high-flying technology sector has generally delivered above expectations. Companies like Amazon, which is partly a tech company, Alphabet (as Google is called in the stock market) and Apple published strong reports. Although Apple’s shares lost a few per cent right after its report, they have still gained 25 per cent this year. Together, these three companies are worth about 192 times as much as Swedish-based construction giant Skanska, or four times Sweden’s annual GDP. It is easy to draw the conclusion that the tech sector is overvalued, given the share price increases of the past decade, but in fact at the aggregate level their valuations are not especially high. Many tech and Internet companies like Facebook, Apple and Google have actually become cheaper as their share prices have climbed. In other words, their earnings have grown faster than their share prices. What deserves our respect among tech companies is instead the speed of their strategy shifts and product cycles. If these companies shift in the wrong direction, events often unfold quickly, with devastating consequences for share prices.
Regional allocationWe continue to have a cautious attitude towards the Ameri-can stock market, since valuations are high and margins are at peak levels. The US is ahead of the rest of the world in
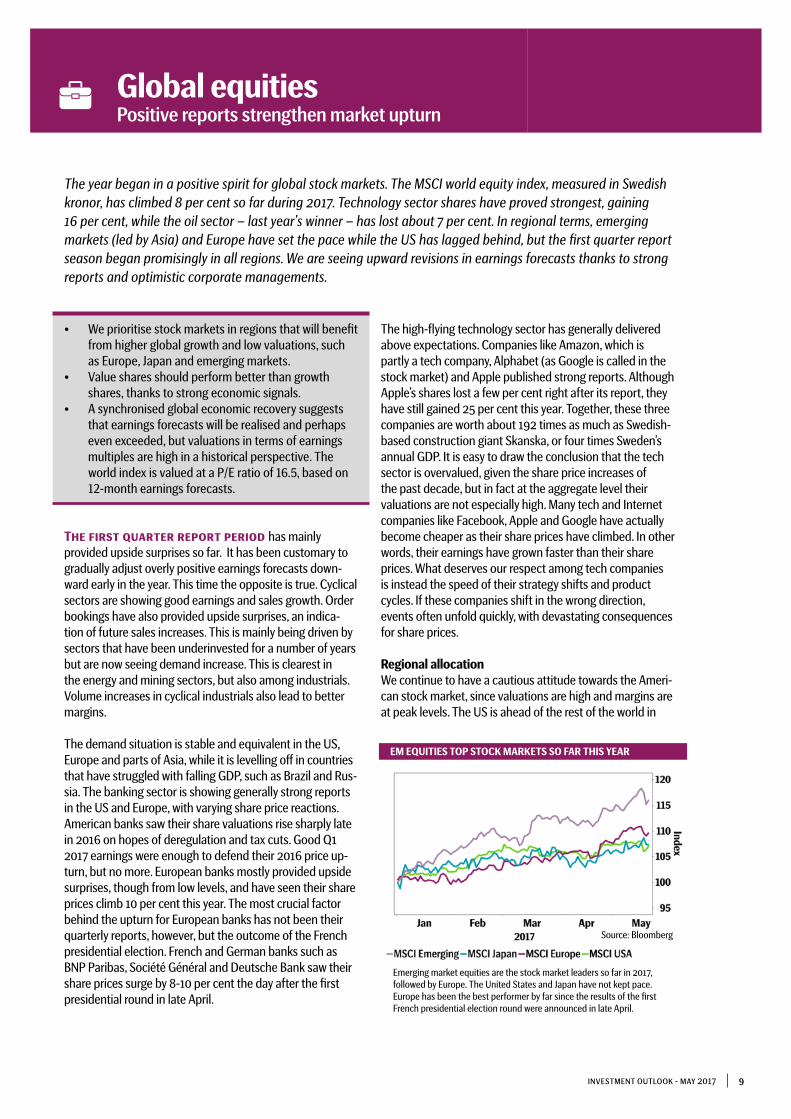
EM EQUITIES TOP STOCK MARKETS SO FAR THIS YEAR
Emerging market equities are the stock market leaders so far in 2017, followed by Europe. The United States and Japan have not kept pace. Europe has been the best performer by far since the results of the first French presidential election round were announced in late April.
The year began in a positive spirit for global stock markets. The MSCI world equity index, measured in Swedish kronor, has climbed 8 per cent so far during 2017. Technology sector shares have proved strongest, gaining 16 per cent, while the oil sector – last year’s winner – has lost about 7 per cent. In regional terms, emerging markets (led by Asia) and Europe have set the pace while the US has lagged behind, but the first quarter report season began promisingly in all regions. We are seeing upward revisions in earnings forecasts thanks to strong reports and optimistic corporate managements.
Source: Bloomberg
• We prioritise stock markets in regions that will benefit from higher global growth and low valuations, such as Europe, Japan and emerging markets.
• Value shares should perform better than growth shares, thanks to strong economic signals.
• A synchronised global economic recovery suggests that earnings forecasts will be realised and perhaps even exceeded, but valuations in terms of earnings multiples are high in a historical perspective. The world index is valued at a P/E ratio of 16.5, based on 12-month earnings forecasts.

10 Investment OutlOOk - maY 2017
the economic cycle and will have to struggle to maintain its good margins. In spite of this, we cannot deny that we want exposure to portions of the US market that are difficult to find elsewhere in the world. Many large, successful compa-nies in the consumer, tech and internet sectors are found across the Atlantic. In a diversified portfolio, we want to own these success stories. At the aggregate level, however, we are underweighted in the US for valuation reasons.
Europe − which we are most optimistic about − has a very attractive profile in the current macroeconomic environ-ment. The region has lower valuations than the US and is also later in the economic cycle. We are now seeing improved profit margins as growth takes off, thanks to high operational leveraging (each additional euro in sales contributes more to earnings). The European banking sector is undervalued and we are seeing an acceleration in lending, which promises better earnings in the sector while providing an indication that the economy as a whole is growing. When the European Central Bank starts hiking its key interest rate, we can look forward to a normalisation of euro zone banking sector valuations.
The Japanese stock market is extremely cyclical, with a large element of industrials and tech companies as well as low-valued banks. Among major stock markets, Japanese corporate earnings have the highest correlation with global industrial production due to their highly cyclical nature. Japanese shares should thus perform better than the Tokyo Stock Exchange has done so far this year. The yen began 2017 by appreciating, which explains why the stock market is lagging this year, but global growth suggests that Japan will catch up.
We now have a more favourable view of emerging markets than before, since the US dollar seems to have run out of room to appreciate further against other currencies. Mean-while the global economy is accelerating. There is also a wide valuation gap between EM equities and those in the US and other Western countries, while EM earnings forecasts
are being revised upward. This is a good combination of reasons for investing in EM equities.
ValuationsSince January 2012, the MSCI world equity index in local currencies has risen by about 97 per cent. Earnings have not climbed to the same extent. Valuations have thus become higher. As 2012 began, we had just gone through a euro zone crisis. Valuations were thus low and equities were depressed. The price/earnings (P/E) ratio was 11, which is low in a historical perspective. The P/E ratio has now risen to 16.5 based on 12-month earnings forecasts. This is instead high by historical standards. If we look at the ratio between equity capital and returns, it is also at the high end. However, there are extenuating circumstances with regard to valua-tions: A number of sectors (banking, commodities, energy and industrials) that have been depressed for a number of years are showing strong earnings growth. Return on equity should thus climb to substantially higher levels, making current valuations defensible. This presupposes a continued strong economic expansion, which is our main scenario.
We continue to overweight non-US markets − for valuation reasons and because we believe good economic growth will continue. At present we are most positive towards Europe, since we foresee various macroeconomic factors improving from low levels, while the banking sector is being recapi-talised and lending increases. Poorer performance so far this year in Japan’s stock market promises a rebound from current levels, for the same reasons as in European markets. We have changed our moderate view of emerging markets to a positive view due to low valuations, optimism about economic performance and a US dollar that is no longer ap-preciating against other currencies. Growth companies have experienced a good share price upturn this year compared to firms with high net asset values and low stock market valuations, but in the future these value “companies” should perform comparatively better as the economic situation improves.
STRONGER ECONOMIC CONDITIONS WILL IMPROVE PROFITABILITY
Global stock market valuations have climbed. The P/E ratio is 16.5, based on 12-month earnings forecasts. Profitability defined as re-turn on equity (dark red line) should improve as the economy gains further strength.
Source: Bloomberg

11Investment OutlOOk - mAY 2017
Emerging markets account for a steadily increasing propor-tion of global GDP, in purchasing power-adjusted terms. They now account for about 62 per cent. The economic growth rate in these countries is about 2-3 percentage points higher than in mature economies, so their share of GDP will continue to increase. Meanwhile these countries have a weight of only 11 per cent in MSCI world equity indices. China weighs heaviest in the MSCI Emerging Market Index at 27 per cent, followed by South Korea at 15, Taiwan at 12 and India at 8 per cent. In all, Asia accounts for 70 per cent of the EM Index. As commodity prices have fallen, the stock markets of com-modity producing countries such as Brazil and Russia have declined in importance. At the same time, technological development, which has favoured Asian stock exchanges, has accelerated during the past ten years. China is the country that has grown most in stock market capitalisation over the past decade. Many of its initial public offerings have been extremely successful. One example is Internet giant Tencent, which obtained its listing in 2004. Since then its shares have multiplied in value by 380 times, and it now has a market capitalisation of about USD 300 billion.
Chinese dominance of the EM index will continue to in-crease as A-shares listed in Shanghai and Shenzhen (which can only be purchased by Chinese citizens and selected foreign investors with special licences) will gradually be incorporated into MSCI, the world’s dominant equity index provider, probably starting in June this year. If A-shares were included today, China’s proportion would increase by about 8-9 percentage points and the country would then account for 36 per cent of the EM index.
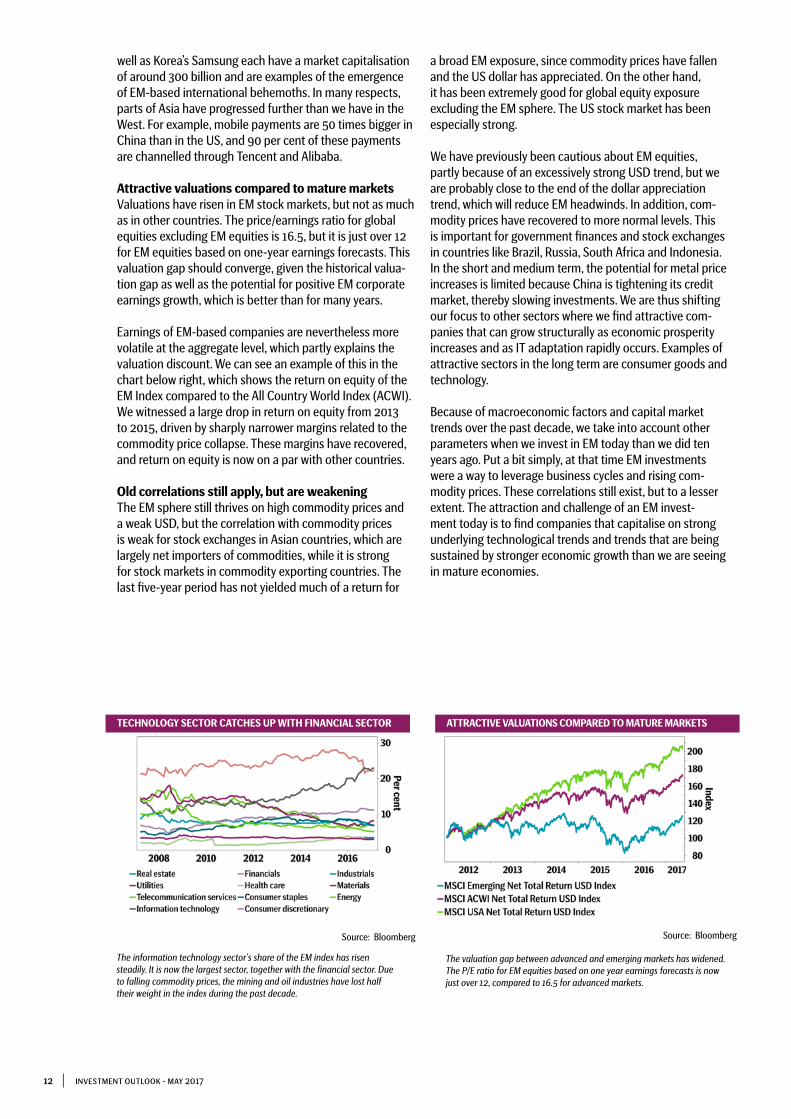
In the left-hand chart on page 12, we can see how sectoral weights have shifted over the past ten years. The informa-tion technology sector’s share of the EM Index has risen steadily. It is now the largest sector, together with the financial sector. Together these two sectors represent 45 per cent of the total index. Consumer discretionary goods also account for a larger proportion of the total, while the sectors we associate most with the EM sphere such as the mining and oil industries have lost half their importance and now represent only 15 per cent. Of course falling commodity prices have contributed to this trend, but so has a higher level of prosperity, which drives expansion in consumer goods and services. Technology, e-commerce and Internet giants like China’s Tencent and Alibaba as
EMERGING MARKETS’ STEADILY RISING SHARE OF GLOBAL GDP
In purchasing power-adjusted terms, emerging markets account for a steadily growing proportion of global GDP: currently about 62 per cent.
Theme: Emerging markets Robust global economy puts EMs in the spotlight
From 2011 until mid-2016, global economic growth was anaemic, the inflation rate sagged and metal prices fell – not a good combination for emerging market (EM) equities, which underperformed during this period. As the global economy has begun to strengthen, emerging markets have returned to the spotlight. The search for undervalued assets with cyclical exposure and structurally expanding companies in fast-growing regions has caused investors to increase their exposure to the EM sphere.
Source: Bloomberg
CHINA’S GROWING DOMINANCE AMONG EMERGING MARKETS
China weighs heaviest in the Emerging Market Index at 27 per cent, followed by South Korea at 15, Taiwan at 12 and India at 8 per cent. In all, Asia accounts for 70 per cent of the EM Index. As oil prices have fallen, the percentage accounted for by commodity producing countries such as Brazil and Russia has declined.
Source: Bloomberg
12 Investment OutlOOk - maY 2017
well as Korea’s Samsung each have a market capitalisation of around 300 billion and are examples of the emergence of EM-based international behemoths. In many respects, parts of Asia have progressed further than we have in the West. For example, mobile payments are 50 times bigger in China than in the US, and 90 per cent of these payments are channelled through Tencent and Alibaba.
Attractive valuations compared to mature marketsValuations have risen in EM stock markets, but not as much as in other countries. The price/earnings ratio for global equities excluding EM equities is 16.5, but it is just over 12 for EM equities based on one-year earnings forecasts. This valuation gap should converge, given the historical valua-tion gap as well as the potential for positive EM corporate earnings growth, which is better than for many years.
Earnings of EM-based companies are nevertheless more volatile at the aggregate level, which partly explains the valuation discount. We can see an example of this in the chart below right, which shows the return on equity of the EM Index compared to the All Country World Index (ACWI). We witnessed a large drop in return on equity from 2013 to 2015, driven by sharply narrower margins related to the commodity price collapse. These margins have recovered, and return on equity is now on a par with other countries.
Old correlations still apply, but are weakeningThe EM sphere still thrives on high commodity prices and a weak USD, but the correlation with commodity prices is weak for stock exchanges in Asian countries, which are largely net importers of commodities, while it is strong for stock markets in commodity exporting countries. The last five-year period has not yielded much of a return for
a broad EM exposure, since commodity prices have fallen and the US dollar has appreciated. On the other hand, it has been extremely good for global equity exposure excluding the EM sphere. The US stock market has been especially strong.
We have previously been cautious about EM equities, partly because of an excessively strong USD trend, but we are probably close to the end of the dollar appreciation trend, which will reduce EM headwinds. In addition, com-modity prices have recovered to more normal levels. This is important for government finances and stock exchanges in countries like Brazil, Russia, South Africa and Indonesia. In the short and medium term, the potential for metal price increases is limited because China is tightening its credit market, thereby slowing investments. We are thus shifting our focus to other sectors where we find attractive com-panies that can grow structurally as economic prosperity increases and as IT adaptation rapidly occurs. Examples of attractive sectors in the long term are consumer goods and technology.
Because of macroeconomic factors and capital market trends over the past decade, we take into account other parameters when we invest in EM today than we did ten years ago. Put a bit simply, at that time EM investments were a way to leverage business cycles and rising com-modity prices. These correlations still exist, but to a lesser extent. The attraction and challenge of an EM invest-ment today is to find companies that capitalise on strong underlying technological trends and trends that are being sustained by stronger economic growth than we are seeing in mature economies.
TECHNOLOGY SECTOR CATCHES UP WITH FINANCIAL SECTOR
The information technology sector’s share of the EM index has risen steadily. It is now the largest sector, together with the financial sector. Due to falling commodity prices, the mining and oil industries have lost half their weight in the index during the past decade.
Source: Bloomberg
ATTRACTIVE VALUATIONS COMPARED TO MATURE MARKETS
The valuation gap between advanced and emerging markets has widened. The P/E ratio for EM equities based on one year earnings forecasts is now just over 12, compared to 16.5 for advanced markets.
Source: Bloomberg
13Investment OutlOOk - mAY 2017
Nordic equities Earnings growth leads to cautious optimism
• First quarter earnings reports were surprisingly strong, boosting hopes for the rest of the year.
• Upward forecast revisions give credence to this optimism.
• Low interest rates continue to buoy the stock market.• Political uncertainty persists, but there is less risk of
extreme effects on earnings performance.• High valuations limit potential.
First quarter corporate earnings reports have made for unusually pleasant reading, with upside surprises from 70 per cent of the Nordic listed companies we follow and average pre-tax earnings exceeding forecasts by 16 per cent.
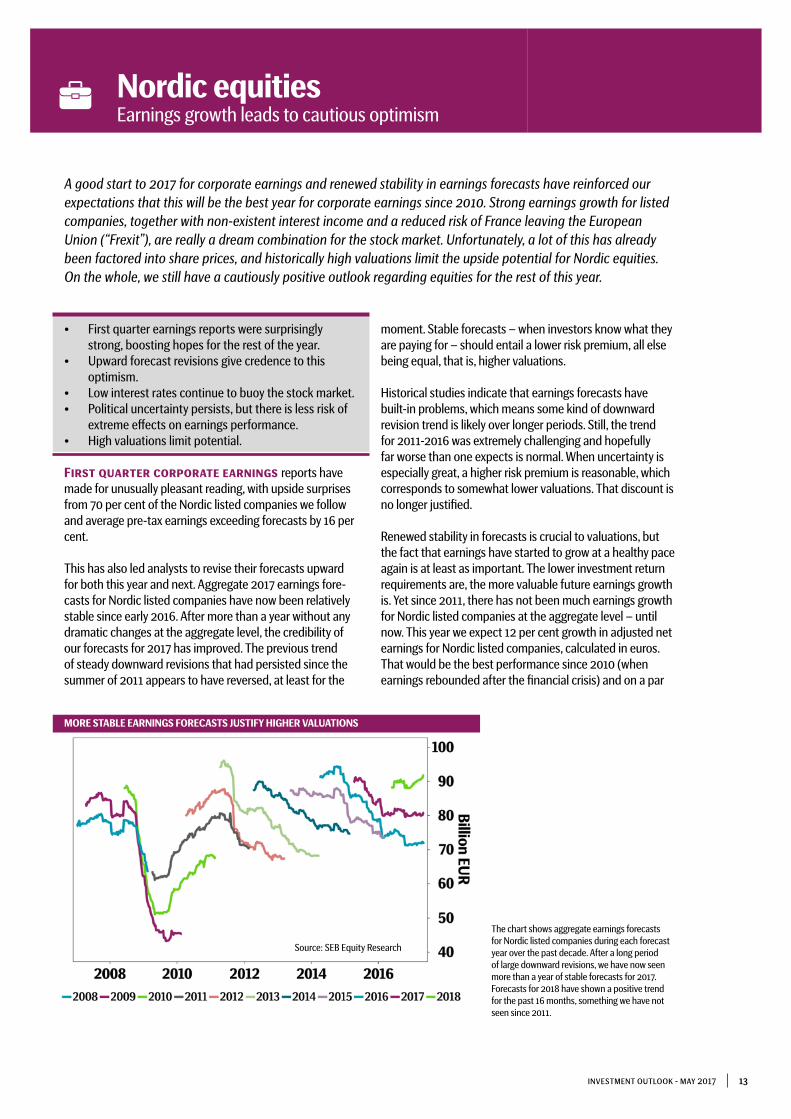
This has also led analysts to revise their forecasts upward for both this year and next. Aggregate 2017 earnings fore-casts for Nordic listed companies have now been relatively stable since early 2016. After more than a year without any dramatic changes at the aggregate level, the credibility of our forecasts for 2017 has improved. The previous trend of steady downward revisions that had persisted since the summer of 2011 appears to have reversed, at least for the
moment. Stable forecasts – when investors know what they are paying for – should entail a lower risk premium, all else being equal, that is, higher valuations. Historical studies indicate that earnings forecasts have built-in problems, which means some kind of downward revision trend is likely over longer periods. Still, the trend for 2011-2016 was extremely challenging and hopefully far worse than one expects is normal. When uncertainty is especially great, a higher risk premium is reasonable, which corresponds to somewhat lower valuations. That discount is no longer justified.
Renewed stability in forecasts is crucial to valuations, but the fact that earnings have started to grow at a healthy pace again is at least as important. The lower investment return requirements are, the more valuable future earnings growth is. Yet since 2011, there has not been much earnings growth for Nordic listed companies at the aggregate level – until now. This year we expect 12 per cent growth in adjusted net earnings for Nordic listed companies, calculated in euros. That would be the best performance since 2010 (when earnings rebounded after the financial crisis) and on a par
A good start to 2017 for corporate earnings and renewed stability in earnings forecasts have reinforced our expectations that this will be the best year for corporate earnings since 2010. Strong earnings growth for listed companies, together with non-existent interest income and a reduced risk of France leaving the European Union (“Frexit”), are really a dream combination for the stock market. Unfortunately, a lot of this has already been factored into share prices, and historically high valuations limit the upside potential for Nordic equities. On the whole, we still have a cautiously positive outlook regarding equities for the rest of this year.
MORE STABLE EARNINGS FORECASTS JUSTIFY HIGHER VALUATIONS
The chart shows aggregate earnings forecasts for Nordic listed companies during each forecast year over the past decade. After a long period of large downward revisions, we have now seen more than a year of stable forecasts for 2017. Forecasts for 2018 have shown a positive trend for the past 16 months, something we have not seen since 2011.
Source: SEB Equity Research

14 Investment OutlOOk - maY 2017
with 2005-2007, which were good years. Forecasts for next year indicate 14 per cent earnings growth, and this figure has even been revised upward over the past year. Although the most aggressive growth forecasts are for Norway and the oil sector, we foresee a broad upswing, with high earn-ings growth in all four Nordic countries we follow as well as a good performance in almost every important sector, both in 2017 and 2018. The only exception is the health care sector in 2017, which is explained entirely by an expected 10 per cent earnings decrease for the AstraZeneca pharmaceuticals group.
Commodities market again volatileAlthough our main scenario is positive, one cloud on the horizon worth considering is the recent weakening in the commodities market. The commodity and energy sec-tors were drivers of both the 2015 decline and last year’s recovery of the entire industrials sector. Improved demand from mines and the oil sector, for instance, was crucial to the good performance of major Swedish industrial companies. The stabilisation in important emerging markets such as Brazil is also a function of the recovery in energy and com-modity prices.
Recently prices have slumped for a number of key com-modities. Despite extensive intervention by the Organisation of the Petroleum Exporting Countries (OPEC) to boost oil prices, they are now back at the same levels as in April 2016, though still well above the lows of February this year, which put great stress on the entire financial system. In early May, the change in oil prices on a rolling twelve-month basis was again negative as a result. Iron ore prices have fallen by a third from their peaks just two months ago and are now back to the levels seen in the summer of 2016 and spring of 2015. Most base metals have declined substantially since mid-February, and nickel prices are almost back to the lows seen in early 2016.
Given the effects of the commodity and energy sectors, which were apparent in 2016, we believe it is important to monitor the future trend in this area – not just for companies and shares with direct exposure but for the entire stock mar-ket. Nonetheless, we are probably in a short-term downturn right now.
Reduced political risk Although we did not consider a French electoral victory for right-wing populist Marine Le Pen especially likely, her loss to centrist Emmanuel Macron means that one potential risk el-ement for the financial market has been eliminated. Le Pen’s promises to work for “Frexit” could have been the beginning of the end for the euro project, causing great disarray in the financial market.
Another potential risk element that admittedly never left a visible impact on share prices but which, after Donald Trump’s not especially spectacular first 100 days in office, must be regarded as lower is the risk of a US-led global trade war. During his election campaign, Trump was highly critical of free trade. While that rhetoric persists to some extent and protectionist measures to benefit American production of steel and sawn wood products, for instance, have been an-nounced, the outlook for world trade is far from bleak. The fact that Trump backed away from his previous description of China as a currency manipulator gives hope to everyone who thinks that a more extreme US approach to trade policy would have hurt economic and corporate earnings growth.
There is still a long list of political worries around the world, such as euro zone imbalances, North Korea’s threats of military aggression against its neighbours and the risk that political prestige will make Brexit negotiations unnecessarily costly. However, investors are much more relaxed about this kind of risk than they were six years ago, and we believe this marginally pushed market performance in a positive direc-tion recently as a result of Le Pen’s election loss.
HIGH PRICE/EARNINGS RATIOS FOR LISTED COMPANIES
The chart shows the price/earnings ratio for the Nordic stock market, based on consensus forecasts for the next calendar year.
Source: Bloomberg
The chart shows annual earnings growth for Nordic listed companies since 2005, calculated in euros and adjusted for non-recurring items, plus our forecasts for 2017 and 2018. After five lean years, an increase of 12 per cent in 2017 and 14 per cent in 2018 is expected.
Source: SEB Equity Research
STRONG EARNINGS GROWTH IN 2017 AND 2018

15Investment OutlOOk - maY 2017
Dream combinationAfter five years of stagnation, clear signs of significant earnings growth are now apparent, while earnings forecasts should be considered more reliable and some major political risks have been eliminated. Furthermore, monetary policy is still expansionary and interest rates are ultra-low from a historical perspective. For the stock market, this is as close to an ideal combination as can be, if only so much of this had not already been priced into the market. Unfortunately, the extremely favourable combination of double-digit earnings growth and interest rates close to zero is also reflected in higher valuations.
High valuations limit potentialAfter eight years of a fairly steady upturn in share prices, though with significant corrections in 2011 and 2016, Nordic listed companies are now trading at a price/earnings ratio of
17.0, which is about 20 per cent higher than the average over the past decade. Book equity has more than doubled from its lows of 2008/2009 but is still 22 per cent lower than its peak in 2007. However, it should be noted that return on equity was 15.2 per cent in 2007, compared to 12.5 per cent in our forecast for 2017.
All in all, it is difficult not to be optimistic about equities when good earnings prospects are coupled with ultra-low interest rates, but high valuations limit the potential and we are there-fore sticking to our cautiously positive outlook.
DOUBLING OF EQUITY VALUES SINCE 2009 LOWS
The chart shows price-to-book value for Nordic listed companies. Despite a 110 per cent increase in equity capital values from the lows seen in 2009, there is still a 28 per cent upside potential compared to the highs reached in 2007.
Source: Bloomberg
WORTH KEEPING AN EYE ON VOLATILE COMMODITIES MARKET
The chart shows iron ore prices on the Dalian Commodity Exchange in China and the price of West Texas Intermediate crude oil. Higher energy and commod-ity prices have been an important driver in the manufacturing sector’s recovery over the past year, but oil prices are lower today than a year ago and iron ore prices have fallen by a third from their February 2017 highs.
Source: Bloomberg

16 Investment OutlOOk - mAY 2017
• Sweden’s Riksbank will delay its interest rate hike despite strong growth.
• The European Central Bank (ECB) will continue to stimulate the market but will ease up on its stimulus again in September.
• The US Federal Reserve (Fed) will raise its key interest rate and shrink its balance sheet.
HIGH INFLATION THIS YEAR, DRIVEN BY TEMPORARY EFFECTS
After weakening in March, Swedish inflation (excluding interest rate changes) rose to 2 per cent in April. Late in 2017 we expect inflation to fall again as temporary effects due to earlier energy price increases and krona deprecia-tion fade from 12-month figures. The faster pay increases we foresee in 2018 are probably not enough to push inflation back up to 2 per cent.
Fixed income investments Expansionary monetary policy, but changing risks
Government bonds (excl emerging markets) As expected, Sweden’s Riksbank left its key interest rate unchanged at -0.5 per cent at its April meeting, but it also made a surprise announcement. Government bond purchases will be increased by 15 billion kronor during the second half of 2017, and the repo rate is not expected to be raised until mid-2018. The reasons given for this more expansionary monetary policy are the need to provide further support for inflation, as well as political risks in other countries. The Riksbank revised its growth forecasts upward; its inflation forecast for 2017 was also raised, but it was lowered slightly in the longer term. We no longer expect a December 2017 repo rate hike but believe the Riksbank will start raising rates somewhat earlier than indicated (April 2018) since its monetary policy runs counter to the general economic trend. Our forecast is that the repo rate will be 0 per cent in late 2018. The yield gap between 10-year Swedish and German government bonds has trended flat over the past six months. The Swedish National Debt Office reduced its bond issues in February, and further reductions in June are likely, which puts pressure on Swedish interest rates and yields. Meanwhile it is increasingly difficult for the Riksbank to find sellers in its bond-buying programme, which will continue during the second half of the year. In the short term, these factors will narrow the spreads to German yields. In the slightly longer term, analysts expect that Swedish key interest rates will be raised, which could help Swedish long-term yields rise more than their German counterparts. Ten-year Swedish government bond yields are expected to increase from 0.56 per cent today to 0.80 in late 2017 and to nearly 1.50 per cent in 2018.
Unlike the Riksbank, the ECB left both its interest rates and planned bond purchases unchanged at the April meet-ing of its Governing Council. ECB President Mario Draghi expressed increased optimism about economic growth.
Central banks have long pursued an expansionary monetary policy, but it is increasingly difficult to argue in favour of today’s extreme measures, in the form of negative interest rates and bond purchases. Although some central banks are struggling with the challenge of achieving their inflation targets, the deflation risk has decreased. Meanwhile economic growth has recovered, as a number of central banks confirm.
Source: Riksbank, SEB
Several factors point to the ECB taking steps to further ease up on its stimulus as early as this year. Economic prospects have gradually improved while political risks have abated to some extent. The ECB is sticking to its higher forecast for inflation: holding steady at around 1.75 per cent with gradually rising core inflation, making it easier to argue in favour of somewhat less expansionary monetary policy. We expect the ECB will now wait until its September meeting to 1) hike its deposit rate for banks to -0.25 per cent, 2) reduce its monthly bond purchases to 40 billion euros starting in January 2018 and 3) extend its bond-buying programme to the first half of 2018.
One alternative scenario could be that the September meeting will bring reduced bond purchases as soon as early October 2017, with the programme then coming to an end during the spring of 2018, to be followed by the ECB’s first deposit rate hike.
The US Federal Reserve has communicated clearly that it will combine expected rate hikes with a shrinking of its balance sheet. These two tools, which are independent of one another, potentially provide a number of combinations to continue its normalisation. Our main scenario is that the Fed’s key interest rate will be raised in June and September and its balance sheet will be reduced starting in December this year. The central bank made it clear in a statement

17Investment OutlOOk - maY 2017
after the Federal Open Market Committee’s May meeting that “the slowing in growth during the first quarter [in the US was]… likely to be transitory”. Wage growth has seen an upward trend for about two years, and inflation is now close to the 2 per cent target. In 2018, we expect three more rate hikes, in line with the Fed’s own forecasts. As a result, the federal funds rate would be 2.00–2.25 per cent at year-end 2018. The Fed’s plans to gradually start shrinking its balance sheet late in 2017 could lead to upward pressure on long-term yields. However, we believe this will have a limited effect – equivalent to 0.10 percentage points per year – since the Fed is probably aiming at a larger balance sheet than before the 2007 financial crisis, and it will take its time to avoid putting unnecessary upward pressure on long-term yields. Our forecast is that 10-year US Treasury yields will increase to 2.65 per cent in late 2017 and 3.00 per cent in 2018. Equivalent 10-year German bonds will trade at 0.60 per cent in late 2017 and 1.15 per cent in 2018.
Emerging market (EM) debtThe more positive picture for emerging markets looks set to continue, with sustained good economic growth. Asia stands out, but even troubled countries such as Russia and Brazil are seeing brighter prospects. Risks include political uncertainty and protectionism, but fears about the effects of President Donald Trump’s policies have subsided somewhat. The fact that the Fed’s interest rate hikes have been clearly communicated also helps prevent market turbulence to a large extent in emerging markets, which are otherwise sensitive to tightening US monetary policy. Fed hikes usually have a negative effect on many EM economies that have borrowings in USD, but those dollar liabilities have fallen and are low in most of these countries. Meanwhile current account deficits have narrowed and foreign exchange reserves have increased. In our view, over the next year, yields will be higher in emerging markets than in developed countries for both
government and corporate bonds (investment grade and high yield). Stronger EM currencies and higher interest rates are contributing factors. In choosing between invest-ments in USD and local currencies, we foresee advantages for investments in local currencies since there should be continued potential for EM currencies to appreciate.
Corporate bonds – Investment grade and high yieldThe corporate bond market continues to be a competitive funding source for companies, while investor risk appetite for this kind of investment remains high. Bonds in the high yield segment include issues from large stable operations as well as small fast-growing companies. In Sweden, the biggest bond supply previously came from the financial and property sectors, but recently we have also seen bond issues from companies in other industries, such as retail.
Investment grade bonds have benefited from central bank monetary policy in general and central bank bond pur-chases in particular, but as these buybacks are reduced, their impact will wane. Lower bond purchases and rising interest rates are somewhat of an uncertainty factor for investment grade bonds, which are more sensitive to interest rates than high yield (HY) bonds. However, HY bonds entail a bigger credit risk – the risk that a company will default – and are less sensitive to rising interest rates. Given that we foresee strength in the underlying economy followed by higher interest rates, we see potential for HY bonds. The performance of an individual HY bond is closely linked to the gearing and creditworthiness of the issuing company. Gearing looks set to fall in 2017 as a re-sult of improved corporate earnings, while the default rate is expected to decrease significantly during the year.
“Weight” indicates how we currently view each asset type as part of a portfolio. Level 4 is a neutral stance. These weights change continuously depending on our tactical market outlook and may therefore differ from our long-term strategic outlook for the asset type* Returns in local currencies. Source: SEB
ASSET TYPE WEIGHT TACTICAL EXPECTED YEARLY RETURN
RISK
SEK EUR USD SEK EUR USD
Cash 1 2 3 4 5 6 7 -0.7% -0.7% 1.1% 0.1% 0.1% 0.1%
Government bonds 1 2 3 4 5 6 7 -1.7% -1.8% -0.4% 2.0% 2.0% 2.0%
Investment grade (IG) corporate bonds 1 2 3 4 5 6 7
0.4% 0.5% 1.2% 3.6% 3.6% 3.6%
High yield (HY) corporate bonds 1 2 3 4 5 6 7
2.4% 2.5% 2.7% 6.3% 6.3% 6.3%
Emerging market debt* 1 2 3 4 5 6 7 5.8% 5.8% 5.8% 13.1% 13.1% 13.1%

18 Investment OutlOOk - maY 2017
Alternative investments Divergent signals from stock & fixed income markets
• Strong stock markets despite President Trump’s failure to deliver.
• Continued downward pressure on government bond yields signals some degree of uncertainty.
• Reduced correlation within and between asset classes.
STOCK MARKET HAS BOLSTERED EQUITY HEDGE FUNDS
Partly due to underlying strength in global stock markets during the past year, equity hedge and event-driven strategies performed well. The some-what higher correlation between these strategies and equities, along with a growing number of investment opportunities in a volatile environment, are contributing factors.
Hedge funds For the stock market, a number of factors support the ever-higher risk appetite that we saw at the start of the year. Stable macroeconomic data combined with contin-ued favourable monetary policy underlie this strong trend. Meanwhile strong first-quarter corporate earnings reports along with market-friendly election outcomes have further boosted investor sentiment. However, in the fixed income market the picture is slightly different. Corporate credits have performed well, in line with equities, but government bonds have lost their lustre and are trading at the same levels as just after the US presidential election. Indirectly, this has also created movements in the foreign exchange market, which in some cases have been unexpected. All in all, this has created uncorrelated movements between asset classes. Some hedge funds have benefited from this, while others have found it a challenging environment.
Equity long/short Given equities’ relatively strong performance early in the year, the fundamentals for this strategy have been favour-able. Differences in returns between funds with this strategy are mostly due to some funds having constant net exposure to the stock market, which has been an advantage com-pared to those that are entirely market-neutral. As always, choosing the right sectors and equities is crucial, and given large differences in returns between various equities and sectors, this factor has had a major impact on performance. The underlying conditions for this strategy are still in place, although there may be reason to look at market-neutral strategies if valuations reach more challenging levels.
Credit long/short Conditions have been favourable for this strategy too, given more stable oil prices, stronger corporate earnings – with lower gearing as a result – and a lower default rate. Due to the
Underlying positive sentiment dominated financial markets during the first few months of 2017, although President Donald Trump’s promised stimulus and tax cuts are still mostly talk and no action. The basis for this growing optimism can instead be partly attributed to the absence of the political turmoil that had been feared at the start of the year. Yet despite a feeling of confidence, the stock market and the fixed income market are sending divergent signals about the strength of the economic recovery.
lower risk of credit events, yield gaps are narrower between corporate credits and government bonds, which has had a positive impact on corporate bond prices. Stable macro-economic conditions should contribute to continued good performance. Be aware that any indications of a higher default rate and higher oil prices could hurt high-priced bonds.
Event-driven Depending on how the various event-driven strategies chose to manage their risk exposure, return has varied significantly between funds during the year. The three most common sub-strategies – merger arbitrage, special situations and distressed credits – have all performed well in 2017, although distressed credits have done best. The merger arbitrage market continues to show strong potential and good global deal volume, although there is still some uncertainty about what implications Trump’s policies may have. Distressed credits have recovered sub-stantially from their lows, and there is room for upswings going forward, though at a calmer pace.
Macro/CTA Pure macro funds fared rather well at the start of the year, even though the government bond and foreign exchange markets in some cases interpreted underly-
Source: Bloomberg
19Investment OutlOOk - maY 2017
ing economic trends somewhat differently than the stock market. We still see potential for this strategy, which is largely uncorrelated with the stock market. Trend-following CTA strategies had a rougher start to the year. Exposure to the stock market has provided some contribution recently, but it has been tough going for funds with exposure to cur-rencies and fixed income, and the duration of trends has not been favourable.
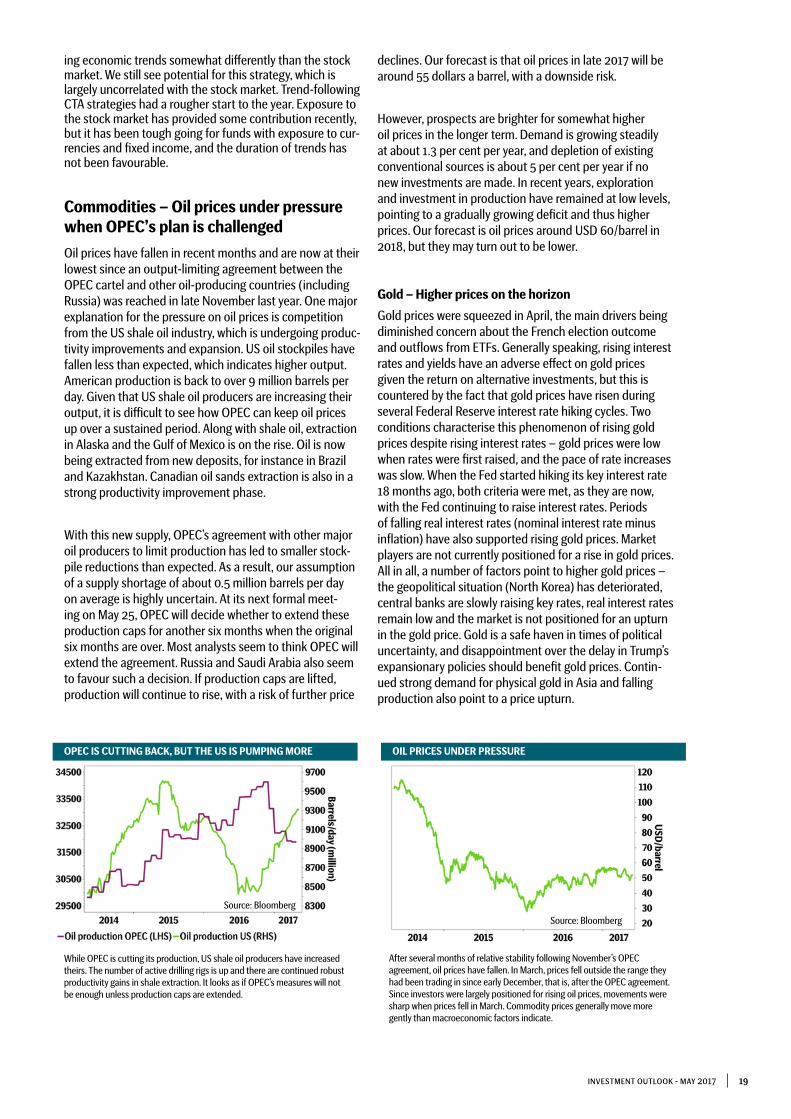
Commodities – Oil prices under pressure when OPEC’s plan is challenged Oil prices have fallen in recent months and are now at their lowest since an output-limiting agreement between the OPEC cartel and other oil-producing countries (including Russia) was reached in late November last year. One major explanation for the pressure on oil prices is competition from the US shale oil industry, which is undergoing produc-tivity improvements and expansion. US oil stockpiles have fallen less than expected, which indicates higher output. American production is back to over 9 million barrels per day. Given that US shale oil producers are increasing their output, it is difficult to see how OPEC can keep oil prices up over a sustained period. Along with shale oil, extraction in Alaska and the Gulf of Mexico is on the rise. Oil is now being extracted from new deposits, for instance in Brazil and Kazakhstan. Canadian oil sands extraction is also in a strong productivity improvement phase.
With this new supply, OPEC’s agreement with other major oil producers to limit production has led to smaller stock-pile reductions than expected. As a result, our assumption of a supply shortage of about 0.5 million barrels per day on average is highly uncertain. At its next formal meet-ing on May 25, OPEC will decide whether to extend these production caps for another six months when the original six months are over. Most analysts seem to think OPEC will extend the agreement. Russia and Saudi Arabia also seem to favour such a decision. If production caps are lifted, production will continue to rise, with a risk of further price
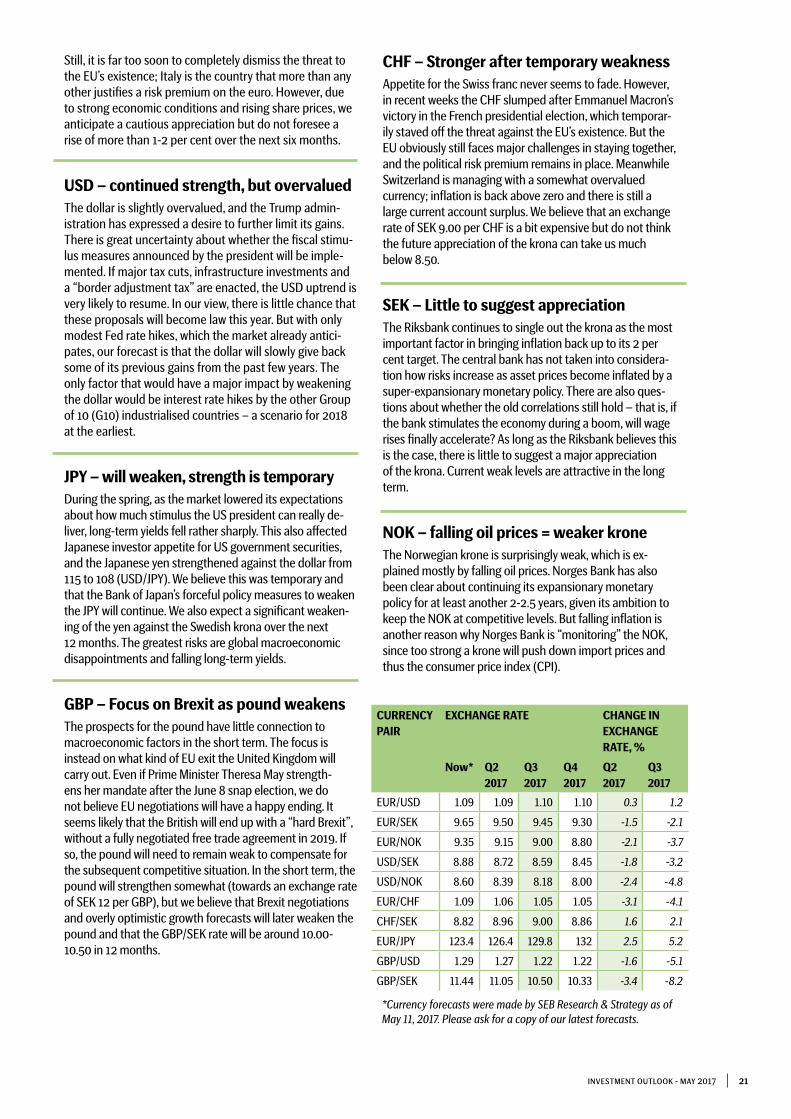
declines. Our forecast is that oil prices in late 2017 will be around 55 dollars a barrel, with a downside risk.
However, prospects are brighter for somewhat higher oil prices in the longer term. Demand is growing steadily at about 1.3 per cent per year, and depletion of existing conventional sources is about 5 per cent per year if no new investments are made. In recent years, exploration and investment in production have remained at low levels, pointing to a gradually growing deficit and thus higher prices. Our forecast is oil prices around USD 60/barrel in 2018, but they may turn out to be lower.
Gold – Higher prices on the horizon
Gold prices were squeezed in April, the main drivers being diminished concern about the French election outcome and outflows from ETFs. Generally speaking, rising interest rates and yields have an adverse effect on gold prices given the return on alternative investments, but this is countered by the fact that gold prices have risen during several Federal Reserve interest rate hiking cycles. Two conditions characterise this phenomenon of rising gold prices despite rising interest rates – gold prices were low when rates were first raised, and the pace of rate increases was slow. When the Fed started hiking its key interest rate 18 months ago, both criteria were met, as they are now, with the Fed continuing to raise interest rates. Periods of falling real interest rates (nominal interest rate minus inflation) have also supported rising gold prices. Market players are not currently positioned for a rise in gold prices. All in all, a number of factors point to higher gold prices – the geopolitical situation (North Korea) has deteriorated, central banks are slowly raising key rates, real interest rates remain low and the market is not positioned for an upturn in the gold price. Gold is a safe haven in times of political uncertainty, and disappointment over the delay in Trump’s expansionary policies should benefit gold prices. Contin-ued strong demand for physical gold in Asia and falling production also point to a price upturn.
OIL PRICES UNDER PRESSURE
After several months of relative stability following November’s OPEC agreement, oil prices have fallen. In March, prices fell outside the range they had been trading in since early December, that is, after the OPEC agreement. Since investors were largely positioned for rising oil prices, movements were sharp when prices fell in March. Commodity prices generally move more gently than macroeconomic factors indicate.
Source: Bloomberg
OPEC IS CUTTING BACK, BUT THE US IS PUMPING MORE
While OPEC is cutting its production, US shale oil producers have increased theirs. The number of active drilling rigs is up and there are continued robust productivity gains in shale extraction. It looks as if OPEC’s measures will not be enough unless production caps are extended.
Source: Bloomberg

20 Investment OutlOOk - mAY 2017
ently been delayed or defeated. Expectations of faster Fed rate hikes have also been revised. All in all, this has helped tone down expectations of a substantially stronger dollar. Meanwhile some of the political risk premium associated with the euro seems to have faded from market pricing. We also expect the ECB to phase out a bit more of its stimulus measures later in the year, a move that has tended to push the euro higher. Many factors thus point to a continued flat dollar trend. We expect the EUR/USD exchange rate to fluctuate around 1.10.
EUR – political risks justify a discountThe big 2017 election year has not caused the escala-tion in political risks that had been feared after the UK’s Brexit referendum and Donald Trump’s election. Instead, European voters – most recently in France – have elected politicians with a positive view of the European Union.
Currencies Trendless foreign exchange market
• EUR – Somewhat stronger, but continued political risks still justify a discount.
• USD – Previously benefited from Trump’s promises, will fall in the long term.
• JPY – Temporary strength, will fall against the krona in 2017.
• GBP – Depressing growth prospects, GBP/SEK exchange rate will fall towards 10.50 in the next 12 months.
• CHF – Temporary weakness, will strengthen this year when the political focus shifts to Italy.
• SEK – Close to the bottom, but no rapid upswing.• NOK – Good potential against the euro over the next
6 months.
EUR/USD STUCK IN RANGE TRADING
Hopes of forceful fiscal stimulus measures have faded, and expectations of aggressive Fed rate hikes have eased. All in all, we believe the outcome will be a continued flat trend, with the EUR/USD exchange rate fluctuating around 1.10 in 2017, before then moving higher.
The lack of strong trends, combined with narrow interest rate and yield spreads between many currencies, makes it difficult to generate returns in the FX market. The reason for this is probably connected to central bank actions. Monetary policy and central banks have long dominated FX market performance, with a weakening of a country’s currency being an important component in the fight against low global inflation. As a result, a number of central banks (including Sweden’s Riksbank) have ended up in a situation with negative interest rates and substantial bond holdings on their balance sheets, in part to counter an unwelcome appreciation of their country’s currency. During 2014-2015, the US Federal Reserve (Fed) also experienced the conse-quences of trying to diverge from other central banks’ mon-etary policies. This helped to limit the pace of Fed efforts to tighten monetary policy.
Prospects for the US dollar improved when Trump was elected president last year. Hopes of far more expansionary fiscal measures combined with promises of lower corporate taxation and a so-called border adjustment tax to promote exports (and discourage imports) all pointed towards a stronger dollar. In recent months, hopes that Trump’s poli-cies will be enacted have dimmed significantly, and many of the pro-dollar proposals put forth earlier have appar-
Major trends usually dominate the foreign exchange (FX) market’s performance, but in the past year such trends have increasingly been replaced by directionless trading, as currencies instead fluctuate within a wide range. One clear example is the exchange rate between the two largest currencies, the euro and the US dollar; the dollar’s sharp 2014 appreciation has been replaced by a flat trend now under way for more than two years. However, this is not unique to these currencies but is instead a broader phenomenon. Only major divergences in central bank policies and/or major macroeconomic shocks such as higher inflation can shake this up. In the near term, we will see few such catalysts, and the market will remain in this low-volatility environment. The market’s focus on the “carry” trade – borrowing in low-interest currencies and investing in high-interest ones − is unfavourable for the krona, given negative Swedish interest rates.
Source: Macrobond
21Investment OutlOOk - maY 2017
CHF – Stronger after temporary weaknessAppetite for the Swiss franc never seems to fade. However, in recent weeks the CHF slumped after Emmanuel Macron’s victory in the French presidential election, which temporar-ily staved off the threat against the EU’s existence. But the EU obviously still faces major challenges in staying together, and the political risk premium remains in place. Meanwhile Switzerland is managing with a somewhat overvalued currency; inflation is back above zero and there is still a large current account surplus. We believe that an exchange rate of SEK 9.00 per CHF is a bit expensive but do not think the future appreciation of the krona can take us much below 8.50.
SEK – Little to suggest appreciationThe Riksbank continues to single out the krona as the most important factor in bringing inflation back up to its 2 per cent target. The central bank has not taken into considera-tion how risks increase as asset prices become inflated by a super-expansionary monetary policy. There are also ques-tions about whether the old correlations still hold – that is, if the bank stimulates the economy during a boom, will wage rises finally accelerate? As long as the Riksbank believes this is the case, there is little to suggest a major appreciation of the krona. Current weak levels are attractive in the long term.
NOK – falling oil prices = weaker kroneThe Norwegian krone is surprisingly weak, which is ex-plained mostly by falling oil prices. Norges Bank has also been clear about continuing its expansionary monetary policy for at least another 2-2.5 years, given its ambition to keep the NOK at competitive levels. But falling inflation is another reason why Norges Bank is “monitoring” the NOK, since too strong a krone will push down import prices and thus the consumer price index (CPI).
CURRENCY PAIR
EXCHANGE RATE CHANGE IN EXCHANGE RATE, %
Now* Q2 2017
Q3 2017
Q4 2017
Q2 2017
Q3 2017
EUR/USD 1.09 1.09 1.10 1.10 0.3 1.2
EUR/SEK 9.65 9.50 9.45 9.30 -1.5 -2.1
EUR/NOK 9.35 9.15 9.00 8.80 -2.1 -3.7
USD/SEK 8.88 8.72 8.59 8.45 -1.8 -3.2
USD/NOK 8.60 8.39 8.18 8.00 -2.4 -4.8
EUR/CHF 1.09 1.06 1.05 1.05 -3.1 -4.1
CHF/SEK 8.82 8.96 9.00 8.86 1.6 2.1
EUR/JPY 123.4 126.4 129.8 132 2.5 5.2
GBP/USD 1.29 1.27 1.22 1.22 -1.6 -5.1
GBP/SEK 11.44 11.05 10.50 10.33 -3.4 -8.2
*Currency forecasts were made by SEB Research & Strategy as of May 11, 2017. Please ask for a copy of our latest forecasts.
Still, it is far too soon to completely dismiss the threat to the EU’s existence; Italy is the country that more than any other justifies a risk premium on the euro. However, due to strong economic conditions and rising share prices, we anticipate a cautious appreciation but do not foresee a rise of more than 1-2 per cent over the next six months.
USD – continued strength, but overvaluedThe dollar is slightly overvalued, and the Trump admin-istration has expressed a desire to further limit its gains. There is great uncertainty about whether the fiscal stimu-lus measures announced by the president will be imple-mented. If major tax cuts, infrastructure investments and a “border adjustment tax” are enacted, the USD uptrend is very likely to resume. In our view, there is little chance that these proposals will become law this year. But with only modest Fed rate hikes, which the market already antici-pates, our forecast is that the dollar will slowly give back some of its previous gains from the past few years. The only factor that would have a major impact by weakening the dollar would be interest rate hikes by the other Group of 10 (G10) industrialised countries − a scenario for 2018 at the earliest.
JPY – will weaken, strength is temporaryDuring the spring, as the market lowered its expectations about how much stimulus the US president can really de-liver, long-term yields fell rather sharply. This also affected Japanese investor appetite for US government securities, and the Japanese yen strengthened against the dollar from 115 to 108 (USD/JPY). We believe this was temporary and that the Bank of Japan’s forceful policy measures to weaken the JPY will continue. We also expect a significant weaken-ing of the yen against the Swedish krona over the next 12 months. The greatest risks are global macroeconomic disappointments and falling long-term yields.
GBP – Focus on Brexit as pound weakensThe prospects for the pound have little connection to macroeconomic factors in the short term. The focus is instead on what kind of EU exit the United Kingdom will carry out. Even if Prime Minister Theresa May strength-ens her mandate after the June 8 snap election, we do not believe EU negotiations will have a happy ending. It seems likely that the British will end up with a “hard Brexit”, without a fully negotiated free trade agreement in 2019. If so, the pound will need to remain weak to compensate for the subsequent competitive situation. In the short term, the pound will strengthen somewhat (towards an exchange rate of SEK 12 per GBP), but we believe that Brexit negotiations and overly optimistic growth forecasts will later weaken the pound and that the GBP/SEK rate will be around 10.00-10.50 in 12 months.

22 Investment OutlOOk - maY 2017
The retail trade today is completely different from a decade ago. A growing share of the global population thinks that buying clothes, electronics or white goods on their computer or mobile phone is the smartest, most convenient option. Online sales are expected to increase 14 per cent in Europe in 2017, while sales in physical stores are expected to decline 1 per cent. As a result, e-commerce will account for about 9 per cent of retail sales. In the long term, a share of more than 20 per cent is not inconceivable. Online retailers are currently taking substantial market share from traditional retailers.
Theme: The great digital shift
In last December’s issue of Investment Outlook, we dis-cussed the big IT companies in Silicon Valley and how their enormous digital innovativeness has caused disruption among traditional companies. The catchphrase then was the software revolution. In this issue, we take a closer look at companies that focus on offering physical products like those sold by traditional retail chains – but online. People want to have their clothes and furniture, read their books, build their patios, watch their TVs, eat their food and of course give flowers to their loved ones. In December’s Investment Outlook, we focused on digital services that can be provided to consumers or companies with the click of a button, such as music, videos, information, travel or games. Now the focus is on physical products.
Since the mid-1990s, there have been pioneers in online sales of physical products. The big trailblazer was the US retailer Amazon, but MercadoLibre (Latin America) and Alibaba (China) have become giants in their respective geographic areas and segments. Since then, thousands of companies have tried to enter the digital distribution channel for consumers. Until now, most have not focused on this channel, having instead been far too busy estab-lishing their presence in more regions – with great success,
it should be added. Others have focused on improving their product for customers, analysing emerging changes in behaviour and developing the physical infrastructure needed to transport their products to customers via an online shopping channel.
E-commerce is expanding globallyIn Sweden, online retail sales represent almost 9 per cent of total sales, up from 3 per cent a decade ago. Average online retail sales for the whole of Europe are expected to reach 8.8 per cent of retail in 2017, including almost 18 per cent in the UK and only 3 per cent in Italy. European online shopping is expected to grow 14 per cent annually in 2017 and 2018 compared to last year’s growth of 16 per cent. The clear driver is the use of smartphones, which increased 47 per cent in 2016 and now accounts for more than half of all online shopping. The dominant countries in Europe are the UK, Germany and France, which together account for 75 per cent of European online shopping. In 2017, retail sales in physical stores are expected to fall nearly 1 per cent compared to last year, with the biggest shift now under way in the three countries above, but also in Sweden, where the decrease is expected to be 1.5 per cent.
The chart shows global retail over the past few years, both the large volume of in-store sales and the volume of sales ordered and distributed using digital tools (e-commerce). Industry forecasts for 2017 to 2020.
GLOBAL RETAIL IS GROWING, ESPECIALLY ONLINE
Source: eMarketer
ONLINE RETAIL GROWING AS SHARE OF GLOBAL RETAIL
The chart shows the percentage of global retail over the past few years and forecasts (by industry experts) for the next few years. Online sales are gaining an ever-larger share of total retail sales, whereas in-store sales are falling as a percentage.
Source: eMarketer
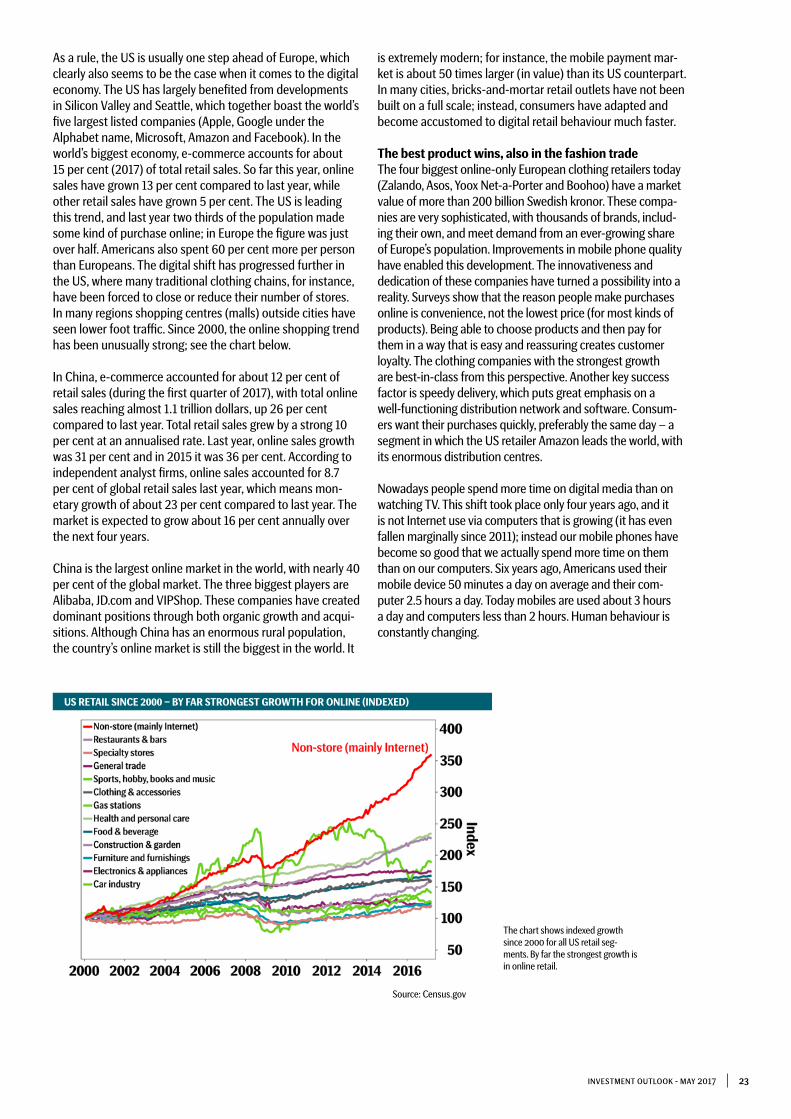
23Investment OutlOOk - maY 2017
As a rule, the US is usually one step ahead of Europe, which clearly also seems to be the case when it comes to the digital economy. The US has largely benefited from developments in Silicon Valley and Seattle, which together boast the world’s five largest listed companies (Apple, Google under the Alphabet name, Microsoft, Amazon and Facebook). In the world’s biggest economy, e-commerce accounts for about 15 per cent (2017) of total retail sales. So far this year, online sales have grown 13 per cent compared to last year, while other retail sales have grown 5 per cent. The US is leading this trend, and last year two thirds of the population made some kind of purchase online; in Europe the figure was just over half. Americans also spent 60 per cent more per person than Europeans. The digital shift has progressed further in the US, where many traditional clothing chains, for instance, have been forced to close or reduce their number of stores. In many regions shopping centres (malls) outside cities have seen lower foot traffic. Since 2000, the online shopping trend has been unusually strong; see the chart below.
In China, e-commerce accounted for about 12 per cent of retail sales (during the first quarter of 2017), with total online sales reaching almost 1.1 trillion dollars, up 26 per cent compared to last year. Total retail sales grew by a strong 10 per cent at an annualised rate. Last year, online sales growth was 31 per cent and in 2015 it was 36 per cent. According to independent analyst firms, online sales accounted for 8.7 per cent of global retail sales last year, which means mon-etary growth of about 23 per cent compared to last year. The market is expected to grow about 16 per cent annually over the next four years.
China is the largest online market in the world, with nearly 40 per cent of the global market. The three biggest players are Alibaba, JD.com and VIPShop. These companies have created dominant positions through both organic growth and acqui-sitions. Although China has an enormous rural population, the country’s online market is still the biggest in the world. It
is extremely modern; for instance, the mobile payment mar-ket is about 50 times larger (in value) than its US counterpart. In many cities, bricks-and-mortar retail outlets have not been built on a full scale; instead, consumers have adapted and become accustomed to digital retail behaviour much faster.
The best product wins, also in the fashion tradeThe four biggest online-only European clothing retailers today (Zalando, Asos, Yoox Net-a-Porter and Boohoo) have a market value of more than 200 billion Swedish kronor. These compa-nies are very sophisticated, with thousands of brands, includ-ing their own, and meet demand from an ever-growing share of Europe’s population. Improvements in mobile phone quality have enabled this development. The innovativeness and dedication of these companies have turned a possibility into a reality. Surveys show that the reason people make purchases online is convenience, not the lowest price (for most kinds of products). Being able to choose products and then pay for them in a way that is easy and reassuring creates customer loyalty. The clothing companies with the strongest growth are best-in-class from this perspective. Another key success factor is speedy delivery, which puts great emphasis on a well-functioning distribution network and software. Consum-ers want their purchases quickly, preferably the same day – a segment in which the US retailer Amazon leads the world, with its enormous distribution centres.
Nowadays people spend more time on digital media than on watching TV. This shift took place only four years ago, and it is not Internet use via computers that is growing (it has even fallen marginally since 2011); instead our mobile phones have become so good that we actually spend more time on them than on our computers. Six years ago, Americans used their mobile device 50 minutes a day on average and their com-puter 2.5 hours a day. Today mobiles are used about 3 hours a day and computers less than 2 hours. Human behaviour is constantly changing.
US RETAIL SINCE 2000 – BY FAR STRONGEST GROWTH FOR ONLINE (INDEXED)
The chart shows indexed growth since 2000 for all US retail seg-ments. By far the strongest growth is in online retail.
Source: Census.gov
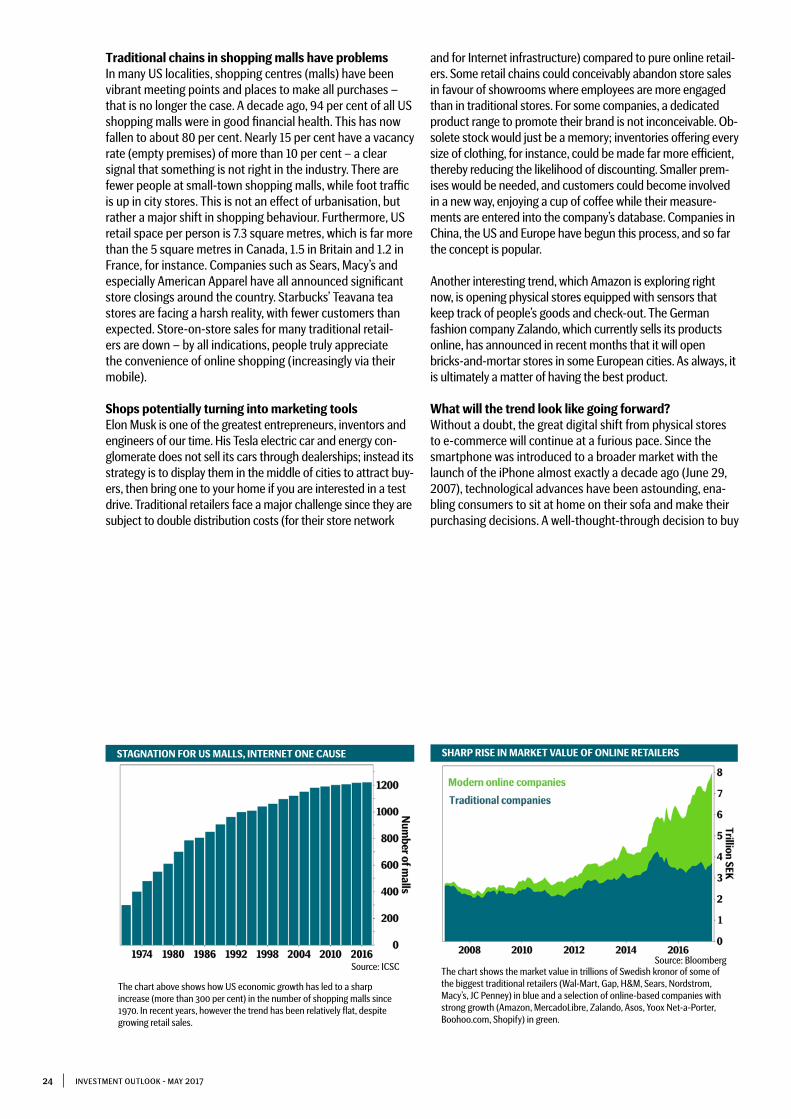
24 Investment OutlOOk - maY 2017
Traditional chains in shopping malls have problemsIn many US localities, shopping centres (malls) have been vibrant meeting points and places to make all purchases – that is no longer the case. A decade ago, 94 per cent of all US shopping malls were in good financial health. This has now fallen to about 80 per cent. Nearly 15 per cent have a vacancy rate (empty premises) of more than 10 per cent − a clear signal that something is not right in the industry. There are fewer people at small-town shopping malls, while foot traffic is up in city stores. This is not an effect of urbanisation, but rather a major shift in shopping behaviour. Furthermore, US retail space per person is 7.3 square metres, which is far more than the 5 square metres in Canada, 1.5 in Britain and 1.2 in France, for instance. Companies such as Sears, Macy’s and especially American Apparel have all announced significant store closings around the country. Starbucks’ Teavana tea stores are facing a harsh reality, with fewer customers than expected. Store-on-store sales for many traditional retail-ers are down – by all indications, people truly appreciate the convenience of online shopping (increasingly via their mobile).
Shops potentially turning into marketing toolsElon Musk is one of the greatest entrepreneurs, inventors and engineers of our time. His Tesla electric car and energy con-glomerate does not sell its cars through dealerships; instead its strategy is to display them in the middle of cities to attract buy-ers, then bring one to your home if you are interested in a test drive. Traditional retailers face a major challenge since they are subject to double distribution costs (for their store network
and for Internet infrastructure) compared to pure online retail-ers. Some retail chains could conceivably abandon store sales in favour of showrooms where employees are more engaged than in traditional stores. For some companies, a dedicated product range to promote their brand is not inconceivable. Ob-solete stock would just be a memory; inventories offering every size of clothing, for instance, could be made far more efficient, thereby reducing the likelihood of discounting. Smaller prem-ises would be needed, and customers could become involved in a new way, enjoying a cup of coffee while their measure-ments are entered into the company’s database. Companies in China, the US and Europe have begun this process, and so far the concept is popular.
Another interesting trend, which Amazon is exploring right now, is opening physical stores equipped with sensors that keep track of people’s goods and check-out. The German fashion company Zalando, which currently sells its products online, has announced in recent months that it will open bricks-and-mortar stores in some European cities. As always, it is ultimately a matter of having the best product.
What will the trend look like going forward?Without a doubt, the great digital shift from physical stores to e-commerce will continue at a furious pace. Since the smartphone was introduced to a broader market with the launch of the iPhone almost exactly a decade ago (June 29, 2007), technological advances have been astounding, ena-bling consumers to sit at home on their sofa and make their purchasing decisions. A well-thought-through decision to buy
The chart above shows how US economic growth has led to a sharp increase (more than 300 per cent) in the number of shopping malls since 1970. In recent years, however the trend has been relatively flat, despite growing retail sales.
Source: ICSC
SHARP RISE IN MARKET VALUE OF ONLINE RETAILERSSTAGNATION FOR US MALLS, INTERNET ONE CAUSE
The chart shows the market value in trillions of Swedish kronor of some of the biggest traditional retailers (Wal-Mart, Gap, H&M, Sears, Nordstrom, Macy’s, JC Penney) in blue and a selection of online-based companies with strong growth (Amazon, MercadoLibre, Zalando, Asos, Yoox Net-a-Porter, Boohoo.com, Shopify) in green.
Source: Bloomberg

25Investment OutlOOk - maY 2017
The chart to the left shows the percentage of online retail sales in different countries and regions. With the first half of 2017 almost over, it is clear that this shift has been very rapid. In our view, the UK is leading the way for the rest of the world in online shopping.
Source: RetailResearch
PERCENTAGE OF PEOPLE WHO EVER SHOPPED ONLINE – BY PRODUCT CATEGORY
The bars indicate what percentage of consumers has ever purchased products online, by product category. Consumer discretionary goods have clearly made more gains than consumer staples – but we believe the latter have exceptional growth potential going forward.Source: Nielsen
UK A GLOBAL ROLE MODEL IN ONLINE SHOPPING
a new refrigerator, dress or vacuum cleaner, made without stress in a relaxed discussion with the family, now competes intensely with an in-store buying experience. People will always choose the most convenient option if the product is competitive enough overall. Our advanced mobile phones provide us with a digital, innovative option.
It is no longer possible to rely on old truths. Every company must ask itself: Do we have the best product in the market and is it easily accessible? There will probably be a growing number of showrooms, which will enhance the customer experience and product familiarity. Traditional companies have an opportunity to defend themselves by changing their concept and/or expanding their product range into other segments. Consumption is generally cyclical, but the great digital shift we are seeing will continue for many years ahead. The most innovative online companies have robust platforms for growth, which is why their prospects are very bright.
Below are two charts that convey important messages. The top chart illustrates the expansion in online retail now under way in a number of countries, with the United King-dom clearly leading the rest of the world. The bottom chart highlights the differences in the online retail trade by product category – what percentage of average consumers globally has (ever) purchased products in the various categories on-line. Consumer discretionary goods such as clothing, books, event tickets and consumer electronics have come much further than fresh groceries, pet food, flowers or restaurant deliveries. However, we believe the share of consumer sta-ples will increase going forward. In our view, home delivery of restaurant-prepared food is a segment with particularly strong growth potential, but the same is true of groceries in general.
26 Investment OutlOOk - maY 2017
Fredrik Öberg Chief Investment Officer [email protected]
Esbjörn LundevallEquity Strategist [email protected]
Louise Lundberg [email protected]
Cecilia KohonenInvestment Communication [email protected]
Pernilla Busch Investment Communication [email protected]
Henrik Larsson Portfolio Manager [email protected]
Kai SvenssonPortfolio Manager [email protected]
Christopher LyrhemEquity [email protected]
Johan [email protected]
Carl HammerChief Currency [email protected]
This document produced by SEB contains general marketing information about its investment products. SEB is the global brand name of Skandinaviska Enskilda Banken AB (publ) and its subsidiaries and branches. Neither the material nor the products described herein are intended for distribution or sale in the United States of America or to persons resident in the United States of America, so-called US persons, and any such distribution may be unlawful. Although the content is based on sources judged to be reliable, SEB will not be li- able for any omissions or inaccuracies, or for any loss whatsoever which arises from reliance on it. If investment research is referred to, you should if possible read the full report and the disclosures contained within it, or read the disclosures relating to specific companies found on www.seb.se/mb/disclaimers. Information relating to taxes may become outdated and may not fit your individual circumstances. Investment products produce a return linked to risk. Their value may fall as well as rise, and historic returns are no guarantee of future re-turns; in some cases, losses can exceed the initial amount invested. Where either the underlying funds or you invest in funds or securities denominated in a foreign currency, changes in exchange rates can impact the return. You alone are responsible for your investment deci-sions and you should always obtain detailed information before taking them. For more information please see inter alia the Key Investor Information Document for funds and the information brochure for funds and for structured products, available at www.seb.se. If neces-sary, you should seek advice tailored to your individual circumstances from your SEB advisor.
Information about taxation: As a customer of our International Private Banking offices in Luxembourg and Singapore you are obliged to keep yourself informed of the tax rules applicable in the countries of your citizenship, residence or domicile with respect to bank accounts and financial transactions. SEB does not provide any tax reporting to foreign countries, which means that you must yourself provide con-cerned authorities with information as and when required.
Contributors to this issue of Investment Outlook