investor and analyst update - banpu mongolia coal 0.2gw 29.4mt • lower s/rs at indominco,...
TRANSCRIPT

lt 2013 results investor and analyst updateinvestor and analyst update
27th February 2014

DISCLAIMER
The views expressed here contain information derived from publicly available sources that have not been independently verified. No representation or warranty ismade as to the accuracy, completeness or reliability of the information. Any forward looking information in this presentation has been prepared on the basis of anumber of assumptions which may prove to be incorrect. This presentation should not be relied upon as a recommendation or forecast by Banpu Public CompanyLi it d N thi i thi l h ld b t d ith ff t ll li it ti f ff t b ll h i j i di tiLimited. Nothing in this release should be construed as either an offer to sell or a solicitation of an offer to buy or sell shares in any jurisdiction.
2

Coal marketingCoal operationsStrategic review
321
Financial summaryPower business
54
3

2013 s mmar strengthening o r core2013 summary: strengthening our core
Indonesia coal• Record output at • Tsant Uul: good
China, Mongolia coal
0.2GW
• Record output at 29.4Mt• Lower S/Rs at
Indominco, Trubaindoand Bharinto
• Tsant Uul: good outcome from coal to chemical testing• Gaohe: 6Mt (above
target 1Mt); rail spur 6Mt
1.2Mt
Power
• Reduction in total costs by 11%• IPCC trial commenced
in Dec 2013
bridge development• Hebi: steady output
1.8GW
29.4Mt1.4GW
Australia coal
• Annual output records: Myuna, Angus Place, Charbon and Clarence
• BIC: record profit• Hongsa: 78% complete• BLCP: equity income up
13% to $82M
13.8Mt
Charbon and Clarence• Strong domestic sales;
new 24Mt, 8-year contract• New equipment at
Corporate• Group OHs down 10%• Coal marketing, sales
and trading office New equipment at Mandalong, Springvale and Myuna should boost productivity• Logistics and
i f i i d
and trading office established in Singapore• Financial management
focus: debt service, share restructuring and
Mines
Power plant
4
infrastructure optimisedderivatives
Note : Output on 100% basis (except Australia ROM output is stated on an equity basis)
Power project
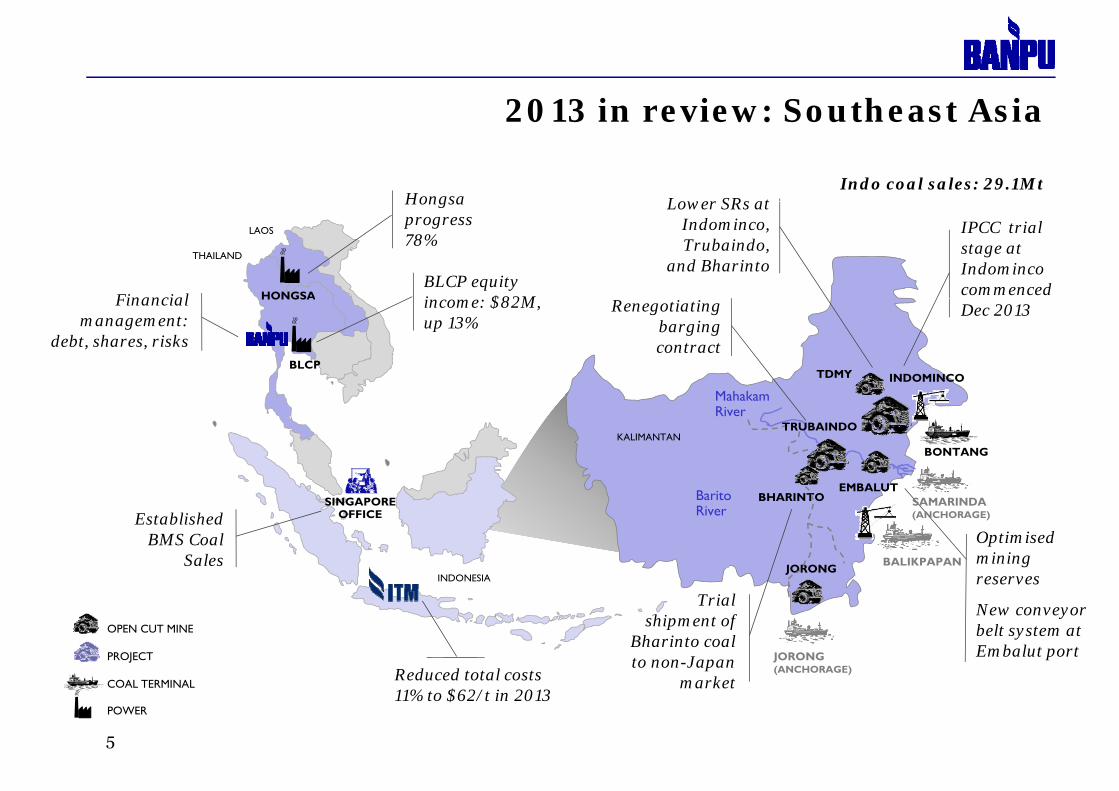
2013 in re ie So theast Asia2013 in review: Southeast Asia
Hongsa Lower SRs at Indo coal sales: 29.1Mt
THAILAND
LAOS
HONGSABLCP equity i $82M Financial
Hongsaprogress 78%
IPCC trial stage at Indominco commenced
Lower SRs at Indominco, Trubaindo,
and Bharinto
Mahakam INDOMINCOTDMY
BLCP
HONGSA income: $82M, up 13%
Financial management:
debt, shares, risks
Dec 2013Renegotiating barging contract
Mahakam River
B itEMBALUT
BONTANG
TRUBAINDOKALIMANTAN
INDONESIA
BaritoRiver
BALIKPAPAN JORONG
BHARINTOSINGAPOREOFFICEEstablished
BMS Coal Sales
Optimisedmining reserves
SAMARINDA(ANCHORAGE)
JORONG(ANCHORAGE) Reduced total costs
OPEN CUT MINE
PROJECT
COAL TERMINAL
Trial shipment of
Bharinto coal to non-Japan
market
New conveyor belt system at Embalut port
5
11% to $62/t in 2013COAL TERMINAL
POWER
market

2013 in re ie A stralia
NORTHERN
2013 in review: AustraliaCost reduction and productivity improvementFour annual production recordsRationalised capex
WESTERN AUSTRALIA
QUEENSLAND
NORTHERNTERRITORY
NSW
SOUTHAUSTRALIA
Rationalised capexSales contract with major power station at long-term export parity
Mandalong -Introduced 3x S d ik MB6
VICTORIA
CHARBONINGLENOOK
NORTHERN OPERATIONSWESTERN
OPERATIONS
Sandvik MB650 CM, with resultant record development
Myuna re equipped Airly re-evaluation
NEWSTANMANDALONG
MYUNA
INGLENOOK
AIRLY
ANGUS PLACE
SPRINGVALE
NEUBECK
IVANHOENewcastle
New state-of-the-t l ll t
Myuna re-equipped, and delivered record production
yof mine plan for re-
opening
Sydney
Wollongong
MANNERINGCLARENCE
OPEN CUT MINE
art longwall at Springvale Improved coordination
between rail, ports and domestic customersRelinquished tonnage
UNDERGROUND MINE
PROJECT
PORT
ROADMannering transfers operating risk through
Relinquished tonnage at PWCS(T4)
6
RAIL
operating risk through 3rd party production sharing arrangement

2013 in re ie China and Mongolia2013 in review: China and Mongolia
MONGOLIA Studying potential
Xinjiang
Heilongjiang
Jilin
Liaoning
Taiwan
Tibet
Sichuan
Yunnan Guangdong
Fujian
Shandong
Hubei
Hunan Jiangxi
Inner Mongolia
NingxiaQinghai
Hebei
Shanxi
Henan
Anhui
Zhejiang
JiangsuShaanxi
Guizhou
MONGOLIA
ALTAI NUURS
Studying potential of CHP in Mongolia
UNST KHUDAGTaiwanYunnan
Guangxi Guangdong
Hainan
TSANT UUL
Tsant Uul: small pilot test with encouraging LUANNANBIC record net
Altai Nuurs :exploration and feasibility study to b l t d i
test with encouraging results on a coal to coal tar, off-gas and semi coke plantHebei
Shanxi
GAOHEZHENGDING
Gaohe: 6 Mt ( b l
profit: $24M contribution
be completed in 2014
Shandong
Shanxi ZHENGDING
ZOUPING
(above plan of 5 Mt)
HenanHEBI
Hebi: 1.2 Mt OPEN CUT MINE
PROJECT
POWER
CHINA
7
CHINA

2014 and be ond Indonesia cost str ct re red ctionCOMMENTS
2014 and beyond: Indonesia cost structure reductionIN-PIT CRUSHING AND CONVEYING (IPCC)
● IPCC trial commenced in December 2013 at Indominco East Block
OB l it
Mine depth without IPCCMine depth with IPCC
ILLUSTRATIVE ONLY
SPREADER
IPCC WASTE DUMPNON-IPCC
WASTE DUMP
● OB removal capacity: 14 MBcm per year
● Using power from Indominco coal-fired
PIT BENCHES
IN-PIT CONVEYORS
BACKHOE EXCAVATOR
TRUCKC.120 M
power plant
● Estimated cost savings around 10% of OB costs
C.80 MIN-PIT
CRUSHERDEEPER
TONNAGES
IPCC WASTE
● Facilitates access to deeper coal reserves
● More environmentally friendly: less dust less friendly: less dust, less noise, lower emissions
8

2014 and be ond f rther Indonesia cost plansMID-TERM: ELECTRIFICATION
2014 and beyond: further Indonesia cost plansDIESEL SUBSTITUTION
ILLUSTRATIVE ONLYILLUSTRATIVE ONLY
● Completed study for trucks to partially replace ● Electric overland conveyors being studied to d l t t t t b th I d i
Test unitwith LNG tank
diesel with LNG or other alternative fuels
● Currently at trial stage for coal transport at Indominco-Bontang
P hi i h d i i
reduce coal transport cost at both Indomincoand adjacent operations and Trubaindo-Bharinto
● Would enhance efficiency of coal transport while reducing operating costs
● Partnership with contractor under negotiation
● Possible implementation at Trubaindo-Bharinto
g p g
● Proven technology widely used in Europe, USA and Australia
● Possible medium term implementation
9

2014 and be ond A stralia optimisation programme2014 and beyond: Australia optimisation programme
COST MANAGEMENT REVENUE OPTIMISATION
Improving production volume
Logistics optimisation Sales contract pricing Balance customer diversification
• Lidsdale siding upgrade, completion due May 14
• Optimisation of rail and port capacity
• Target increased production from Springvale, Mandalongand Myuna, following new equipment
• New domestic sales contracts to be priced at long-term export parity price, providing a natural hedge against A$/US$
• Balance coal sales and revenues from domestic and export business
• Reduce customer i i k• Improved coordination
between rail, ports and domestic customers
new equipment installation in 2013
• Reduced longwallchangeover time
• ‘Step Change’
hedge against A$/US$ volatility concentration risk
• Step Change productivity programmecommenced
10

2014 and be ond po er b siness gro thNOTE: COMPARATIVE ECONOMICS
2014 and beyond: power business growthINVESTMENT OPPORTUNITIES IN POWER
Value creationValue creation
CURRENT PROJECTS NEW PROJECTS Capex($/kW)
Non-fuel O&M ($/kW)
Capacity factor
Constructiontime
Nuclear 74,500 1 2 3 85%
BLCP18 year lifetime
??
??
Brownfield?
Greenfield?
Hongsa
Coal supercritical
Gas CCGT 3
5
700
1,500
2 5
6 0
60%
80%
Lifecycle
78% progressWind
Solar 1.5
1.5
3,500
1,600 2 1
na
22%
na
● Fossil fuel like thermal coal and gas remains a primary source for power generation
● Renewable energy growing due to supportive li i d l
● Hongsa project in Laos: 78%-progress; COD in 2H2015 and in 1H2016
● Potential for brownfield growth around existing ? government policies toward cleaner energy
● Japan and China aimed to significantly expand power capacity from wind and solar: short construction time of 1.5 years
power assets ?● Banpu exploring potential for new investment in
coal-fired power and potentially also in renewable power businesses in Asia-Pacific
11 Source: IEA Note : capital costs include interest during construction, engineering, procurement , construction and legal expenses

Long term Asia Pacific po er demand to 2035Long term Asia Pacific power demand to 2035
China 1 193 1,258
Japan9,542
CAGR5% CAGR
Power demand in Asia-Pacific forecast to China 1,174 1,193 , 58
IndiaKorea
616514 5553,437
5,462
6,467
CAGR
2%
8%
CAGR
-3%
0%
2%
forecast to increase 76% by 2035 including 66% increase in coal-fired power
i l 514 555
1,855
1 374
2015 2020 20352015 2020 2035
6%
3%
6%
2%2%
-2%
1%
1%
equivalent to 2.1 billion tonnesincremental coal demand*
Vietnam
Thailand
761
1,102
670220353
187
128 174
410
1,374
2015 2020 2035 201 2020 203
2015 2020 20355%
CAGR
%
CAGR16%2%5%8%
Other Asia Pacific
CAGR0%4%Philippines
Indonesia
6701872015 2020 2035
2015 2020 2035
2015 2020 2035
Coal
Gas
2%6%
2015 2020 2035
4%
1%
10483187 CAGR
6%
2015 2020 2035
Australia221 286
607
311290 353
Unit: TWh
Hydro
Others*
2015 2020 2035CAGR1%6%3%
6%CAGR
6%1%EIA assumption
12 *Note: ‘Others’* include power generation from oil, nuclear, geothermal and non-hydro renewablesSource : Energy outlook for Asia and the Pacific report, October 2013, ADB and APEC
2015 2020 2035
2015 2020 2035 5%2%
1,870 KWh = 1 tonne coal1 TWh = 0.54 million tonnes coal

B i i it t t i h iBanpu examining its strategic horizonsfi
c*ra
ns-
Pac
if
?
Tr
AUSTRALIA ?
ia-P
acif
ic COAL
CHINACHINA COAL
?
As CHINA
POWER
?
BONTANG
INDONESIA COAL
COALHUNNU
C l i i Coal power/oil New energy**
BLCPHONGSAILLUSTRATIVE ONLY
13
Coal-mining
* The Trans-Pacific Partnership (‘TPP’) is currently under negotiation between countries of Asia-Pacific and the America to foster trans-Pacific trade and investment growth
Coal-power/oil New energy**
* New energy technologies: renewable energy, unconventional energy extraction, alternative fuels…

Coal marketingCoal operationsStrategic review
321
Financial summaryPower business
54
14

A stralia Coal operational and financial s mmarAustralia Coal: operational and financial summary2013 OUTPUT (ROM EQUITY BASIS) KEY UPDATES
Production ASP Production● Equity ROM 3.7Mt (up 21%
YoY), with all three LWs* in full production during 4Q13
● Equity ROM of 13.8 Mt (2012 14 6 Mt ) l t
ASP ● 4Q13: A$68/t ● Sales volume down 5% YoY● Domestic: export split
62%:38% (2012: 56%:44%)Newcastle (2012: 14.6 Mt ); placement
of Airly and Mannering into C&M in 4Q12
● Focus on productivity resulted in four annual
d ti d
● Improved domestic margins helping to sustain ASP
● 2013 ASP c. A$70/t
Charbon
Airly
Neubeck Angus Place
Mandalong Myuna
Newstan Extension
PWCS
Newcastle
InglenookNCIG
M i
2013 YoY 4Q13 QoQ
production records*LW: longwall
FINANCIAL SUMMARY
Place
Clarence
SpringvaleNORTHERN OPERATIONS:
7.0 Mt
Mannering
Sales revenue A$966m ▼ 12% A$259m ▲ 10%
EBITDA (pre FX) A$160m ▼53% A$49m 0%
PBT (pre FX) A$(11)m n.a. A$1m n.a.
Unrealised FX3 A$(56)m n a A$(5)m n.a.
Sydney
Open-cut mine
WESTERN OPERATIONS: 6.8 Mt
Unrealised FX A$(56)m n.a. A$(5)m n.a.
NPAT A$(47)m n.a. A$(2)m n.a.
Gearing(Net debt to net debt + book value of equity)
36% 36%
Wollongong
PKCT
Open cut mine
ProjectUnderground mine
PortPower station
RoadRail
CAPEX4 A$174 ▼58% A$48 ▼5%
15Note 1: Airly and Mannering mines placed on “Care & Maintenance” November 2012.Note 2: NCIG = Newcastle Coal Infrastructure Group; PWCS = Port Waratah Coal Services; PKCT = Port Kembla Coal Terminal.Note 3: Pre tax impact of A$ translation of US$ denominated net debt. A$ depreciated 14% in 2013.Note 4: Plant & Equipment

A stralia Coal Northern Operations q arterl o tp tNEWSTAN EXTENSIONMANDALONG OTHER OPERATIONS
Australia Coal: Northern Operations quarterly output
COAL OUTPUT (Mt)*
CV: 6,700 kcal/kg**
COAL OUTPUT (Mt)*
CV: 6,700 kcal/kg**
COAL OUTPUT (Mt)*
CV: 6,700 kcal/kg**
1.1 0.8
1.9
0.7
1.5 1.4
4Q12 1Q13 2Q13 3Q13 4Q13 1Q14e
0.6 0.5 0.6 0.5 0.5 0.7
4Q12 1Q13 2Q13 3Q13 4Q13 1Q14e 4Q12 1Q13 2Q13 3Q13 4Q13 1Q14e
Completion date extended
LW MOVE SCHEDULE
Mth 16
k
● Mandalong Annual production down 10% YoY:
d d h
LW MOVE SCHEDULE
Mth 1
COMMENT
3Mth 1
Mth 2
Mth 3 4 wks
wks two extended changeovers, LW outperformance; installation road failure 3x new development units achieving
record performance
Mth 2
Mth 3
7 wks
3wks
4Q12 1Q13 2Q13 3Q13 4Q13 1Q14e 2Q14e
● Myuna: 2013 annual production record of 1.6 Mt, 10% up on 2012
● Newstan: continues as CM mine while expansion opportunities assessed ventilation shaft completed
4Q12 1Q13 2Q13 3Q13 4Q13 1Q14e
16
ventilation shaft completed
Note: *ROM output on an equity basis**CV figures are air-dried basis

A stralia Coal Western Operations q arterl o tp tOTHER OPERATIONSANGUS PLACE SPRINGVALE
Australia Coal: Western Operations quarterly output
0 9 1 0 1 0 8
COAL OUTPUT (Mt)*
CV: 6,700 kcal/kg**
COAL OUTPUT (Mt)*
CV: 6,700 kcal/kg**
COAL OUTPUT (Mt)*
CV: 6,700 kcal/kg**
0.9 0.7 1.0 1.0 0.7 0.8
4Q12 1Q13 2Q13 3Q13 4Q13 1Q14e
0.4 0.3 0.2 0.4 0.5 0.50.2 0.5 0.5 0.5 0.5 0.4
4Q12 1Q13 2Q13 3Q13 4Q13 1Q14e4Q12 1Q13 2Q13 3Q13 4Q13 1Q14e
COMMENT
● Angus Place: above plan performance: record c.4.0 Mt (100%)
● Charbon and Clarence: Strong performances resulted in record
LW MOVE SCHEDULELW MOVE SCHEDULE
2 pannual output of 1.5 Mt and 2.4 Mt respectively (100%)
● Springvale: challenging mining conditions and ageing equipment for much of 2013; new LW commissioned
Mth 1
Mth 2
Mth 3
Mth 1
Mth 2
Mth 3
6 wks
2 wks
1 4 much of 2013; new LW commissioned during 4Q13, now full production
● Bushfires 4Q: Lost 5-days output at Clarence and Springvale; rail network affected for two weeks
Mth 3
4Q12 1Q13 2Q13 3Q13 4Q13 1Q14e 2Q14e
Mth 3
4Q12 1Q13 2Q13 3Q13 4Q13 1Q14e 2Q14e
1 wk
4wks
17 Note: *ROM output on an equity basis: Angus Place and Springvale 50%, Clarence 85% & Charbon 95% **CV figures are air-dried basis

A stralia Coal operating costsCOMMENTS
Australia Coal: operating costsINDICATIVE AVERAGE PRODUCTION COSTS*
60
● Strong 4Q13 performance delivered lowest quarterly cost for year
● Focus on cost control and d ti it d li d i d $52
$59A$/t$58
$52$55
$53
Planned cost reduction 2012 achieved
$ $
40
50productivity delivered improved costs YoY
● A$100m removed from 2013 cost base compared to 2012 (including Coal handling & preparation
Open-cut contractor cost
Depreciation
$52 $5
$47
$51 $51 $50
30
p ( gone-off redundancy costs in 4Q13)
● Group productivity improved c.9%, leading to four annual production records
General expenses
g p p
Repairs & maintenance
Cash overhead
10
20records
● One-off costs due to bushfires and further restructuring impacted 4Q13 by c. $1/tonne
Stores & supplies
Labour
0
● Continuing focus on improving operating costs and productivity: FY14 costs expected to improve further
Labour
1Q 2Q 3Q 4Q2012
Full year2012
1Q Full year20132013
2Q 3Q 4Q
18
further* These figures do not include selling, distribution and royalty costs** Based on ‘sold’ production
2012 32013

A t li C l f th ti i tiLOGISTICS
Australia Coal: further optimisationPRODUCTIVITY
● Lidsdale Siding: Western load point upgrade to ● Springvale: new generation high productivity g p pg8 Mt will complete May 2014
● Rail efficiency improving, with longer trains driving lower costs
p g g g p yLW in full production
● Mandalong: 3x New generation LW Development CMs delivering + 20% improvement in development rates ● Improved coordination between rail, ports and
domestic customers
improvement in development rates
● Myuna: completely re-equipped
● “Step Change” productivity programmecommenced across all mines
19
commenced across all mines

I d i l ti l d fi i l KEY UPDATES
Indonesia coal: operational and financial summaryOUTPUT 2014 (100% BASIS, SALEABLE COAL)
2014 target: 29 5 Mt Production ASP
East Kalimantan
Indominco
KitadinTandung Mayang1.8 Mt
2014 target: 29.5 Mt Production
• 2013: record output of 29.4mt (slightly lower than plan), up 7% YoY
Q d %
ASP
• 2013: $74.9/t (down 17% YoY)
• 4Q13: $71.0/t (down 2% Q Q)
Bunyut Port
15.2 Mt
Trubanindo7 3 Mt
Bontang Coal Terminal
Captive coal-fired power
project
• 4Q13: 7.4mt, down 7% YoY
• 2013 production slightly lower than target due to weather condition
QoQ)
• Weak coal market throughout 2013 impacted ASP
FINANCIAL SUMMARY
2013 YoY 4Q13 QoQ
BalikpapanCentral Kalimantan
Kitadin -Embalut
1.0 Mt
7.3 Mt
Bharinto3.0 Mt
Samarinda weather condition
2013 YoY 4Q13 QoQ
Sales revenue $2,179m ▼ 11% $546m ▲ 1%
EBITDA $401m ▼ 35% $102m ▼ 11%
Palangkaraya
Banjarmasin
South Kalimantan
NPAT $230m ▼ 47% $46m ▼25%
Gearing(Net debt to Net debt + book value of equity)
n.a. n.a.
CAPEX $44m $4m
Jorong1.2 Mt
Jorong Port
OperationProject
OperationProject
POWER
COAL
20
CAPEX $44m $4m

Indonesia coal q arterl o tp tEMBALUT AND JORONGINDOMINCO - BONTANG TRUBAINDO - BHARINTO
Indonesia coal: quarterly output
COAL OUTPUT (Mt)* COAL OUTPUT (Mt)* COAL OUTPUT (Mt)*
0.3 0.2 0.3 0.20.4 0.30.4
80.6 0.7
0 5
4.9
4.3 4.14.6 4.7
4.3
COAL OUTPUT (Mt)*
CV: 6050 - 6500 kcal/kg**
MY
COAL OUTPUT (Mt)*
CV: 6250 - 7200 kcal/kg**
TO
COAL OUTPUT (Mt)*CV: 5750 kcal/kg**
EM
BA
LUT
NG
0.50.2 0.5
3.4
2.01.1 1.1
1.3 1.0 0.40.8 0.5 0.5
TDM
WB
LOCK
ND
OB
HA
RIN
T
2.4 2.3
CV: 5300 kcal/kg**
4Q12 1Q13 2Q13 3Q13 4Q13 1Q14e2.6 2.52.2
0.32.1
0.3 0.3 0.3 0.3 0.3 0.3JOR
ON
2.1 2.0 2.0 2.0 1.9 1.72.5 2.4 2.5 2.7 3.0 3.4
4Q12 1Q13 2Q13 3Q13 4Q13 1Q14e
E B
LOC
K
TRU
BA
IN
4Q12 1Q13 2Q13 3Q13 4Q13 1Q14e 4Q12 1Q13 2Q13 3Q13 4Q13 1Q14e
15.1 15.1 15.1 15.1 15.117.9
STRIP RATIOS (bcm/t)
TDM
Y
STRIP RATIOS (bcm/t)
BH
AR
INTO
6.9 6.9
STRIP RATIOS (bcm/t)
10.611.5
MB
ALU
T
6
11.510.9 10.6
7.5
9.2
7.57.8
7.2
16.9
IND
OM
INC
O
13.919.1
9.3
16.8
7.2
TRU
BA
IND
O
10.312.2 10.9 10.9 11.18.6 6.0JO
RO
NG
EM
8.6
6.0
8.6 8.6
10.9
8.6
10.6
9.0 9.311.2
EA
STW
EST 19.1 17.1
8.3
21 Note: *Output figures are 100% basis**CV figures are air-dried basis
4Q12 1Q13 2Q13 3Q13 4Q13 1Q14e 4Q12 1Q13 2Q13 3Q13 4Q13 1Q14e 4Q12 1Q13 2Q13 3Q13 4Q13 1Q14e

Indonesia Coal total costsCOMMENTS
Indonesia Coal: total costs4Q13 AND FY13 AVERAGE TOTAL COSTS
● Achieved lower total costs of $61/tonne in 4Q13 down from $67/tonne in 4Q12
ITM ti t d 70
80$74
$72$68
$65
$/t
$67$70
$64 ● ITM continue to reduce average strip ratios in 2013 to cope with lower coal price trend50
60
$65
SG&A expenses
Royalty
$62$64
$59 $61
● Continue to focus on cost reductions including implementation of cost reduction program such as 30
40 Other production costs*
Dep. & Amortisation
p gIPCC, renegotiate barging contract, fuel substitute, etc.
● IPCC will lower usage of diesel truck and shovel and use more 10
20
3
Mining and contractor cost
truck and shovel and use more electricity from owned power plant0
10
1Q 2Q 3Q 4Q Full year 1Q Full year2012 2012 2013 2013
2Q 3Q 4Q
22
* Coal transportations, repair and maintenance, salaries and allowance, etc.

China Coal gro ing coal o tp tCHINA COAL 2013 PRODUCTION TARGETS*
China Coal: growing coal outputOPERATIONAL UPDATES
Gaohe (45%),
GAOHE
● 2013 production 6Mt (above target 5Mt)
● Mining bolter was installed underground in Dec’13
BEIJING
Hebi
(45%),Shanxi 6.0 Mt
Summary 3Q13 4Q13 2012 2013Sales (Mt) 1.2 1.8 4.0 5.5ASP (RMB/t) 505 527 616 561Revenue (US$ M) 101 157 388 341COGS (RMB/t) 357 297 458 417Hebi
(40%),Henan1.2 Mt
OperationProjectOperationProject
POWERCOAL
HEBI
V il i h f i id i D b d
COGS (RMB/t) 357 297 458 417EBITDA (US$ M) 13 32 145 181
1.2 1.4 1.3 1.22.1 1.6
4Q12 – 4Q13 COAL OUTPUT (Mt ROM)● Ventilation shaft incident in December caused stoppage
to one LW unit; shaft was repaired; LW back to fullproduction since Jan’14
● Improvements to mine safety and planning withcontinued introduction of hazard mapping and geologic
4Q12 1Q13 2Q13 3Q13 4Q13 1Q14e
GaoheCV 6 8 K l/k **
HebiCV 68 K l/k **
0.3 0.3 0.3 0.3 0.3 0.3
4Q12 1Q13 2Q13 3Q13 4Q13 1Q14e
continued introduction of hazard mapping and geologicmodeling
● Degas improvement trials showed promising results forwater flushing and under-seam protection mining (UPM)
23
CV: 6500-8000 Kcal/kg** CV: 5300-6800 Kcal/kg**
Note: *Output figures are ROM output (100% basis)
**CV figures are air-dried basis

Mongolia Coal project de elopmentALTAI NUURS AND UNST KHUDAG PROJECTS
Mongolia Coal: project developmentTSANT UUL PROJECT
● Altai Nuurs Project:
Completed drilling test and plan to complete the PEA (Preliminary Economic Analysis) and PFS (Preliminary Feasibility Study) in 2014
COAL TAR
DIESELREFINER
COAL TO SEMI-COKE AND COAL TAR PILOT STUDY
(Preliminary Feasibility Study) in 2014OVENCOAL SEMI-
COKE
OFF GAS
COKING/ STEEL MAKING PLANT
CAPTIVE POWER PLANT
STEELOVEN
● Completed mine development
POWER PLANT
GRID?
● Completed mine development
● Completed small pilot tests with encouraging results on a potential coal to coal tar, off-gas and semi-coke plant
● Focus on larger scale test plants and product testing, i i d l M l h i l • Unst Khudag Project
Completed the updated Geological and Mining Models
aiming to develop c.0.5 Mtpa coal-to-chemicals commercial scale plant by 2015
● Currently testing the market in China; some trial lots have been sent to customers
24

Coal marketingCoal operationsStrategic review
321
Financial summaryPower business
54
25

N i th l t d f 2014
E i l USA i i
New emerging thermal trends for 2014SUPPLY TRENDS DEMAND TRENDS
Europe Continue power plant retirement, strong clean-dark spreads keep coal burn high
China Slower demand growth,
USA Continue retracting to domestic and HS bigger share of export
Colombia Drummond export ban in Q1,
-3 Mt +1-5 Mt
gpolitical / environmental issues, low quality coal import ban (?), high competition from domestic suppliers.
I di Hi h l i i d d
p Qpolitical, social/environmental issues continue
South Africa
Higher rail efficiencyContinuing political social
+5 Mt
+2 Mt
+1-5 Mt
India High electricity demand growth, insufficient domestic coal supply, focus LCV
Other Continue nuclear stoppage in
Africa Continuing political, social issues. Expand or not debatable
Indonesia Debating policies: export level, price levels tax levels DMO
+2 Mt
+15 Mt
+12 Mt
Other NorthAsia
Continue nuclear stoppage in Japan, coal still competitive in all north Asian countries
price levels, tax levels, DMO, losing market share for LCV, offshore loading, trading oversightConsiderable expansion (more
/ l )
+1-5 Mt
Others Other Asian and South Americas drive demand growth
LCV / less HCV)
Australia Encouraged by exchange rate Discouraged by prices and challenges for higher ash
d bl
+10 Mt +10 Mt
Considerable expansion
26

B ASP th l l b h k iBanpu ASPs vs thermal coal benchmark pricesBANPU ASP VS BENCHMARK PRICES COMMENTS
• Declines in ITM ASP are combination of continued market easing and product mixes
Unit: $/t
160
180
200
Monthly NEX
Quarterly ITM ASP
Q l C i l ASP • Tonnages remain high for shipment, protecting total revenues
• Centennial concluded sales of 3.7 Mt in 100
120
140
160 Quarterly Centennial ASP
4Q13 at ASP of A$71/t, down 4% QoQ in line with easing export prices and more domestic deliveries
40
60
80
100
• Reduced demurrage cost of Indonesia coal from $0.9/t in 2012 to $0.7/t in 2013, down 35%
ITM ASP US$ /
0
20
40
n-07
r-07
ul-07
ct-07
n-08
r-08
ul-08
ct-08
n-09
r-09
ul-09
ct-09
n-10
r-10
ul-10
ct-10
n-11
r-11
ul-11
ct-11
n-12
r-12
ul-12
ct-12
n-13
r-13
ul-13
ct-13
n-14
• ITM ASP 2013 US$75/t
• CEY ASP 2013 A$70/tITM ASP 4Q13 $71.0 (-2% QoQ)
CEY ASP 4Q13 A$70.6 (-3% QoQ)
Jan
Ap Ju Oc
Jan
Ap Ju Oc
Jan
Ap Ju Oc
Jan
Ap Ju Oc
Jan
Ap Ju Oc
Jan
Ap Ju Oc
Jan
Ap Ju Oc
Jan
27 * The Newcastle Export Index (previously known as the Barlow Jonker Index – BJI)
NEX* February 20, 2014 $77.0
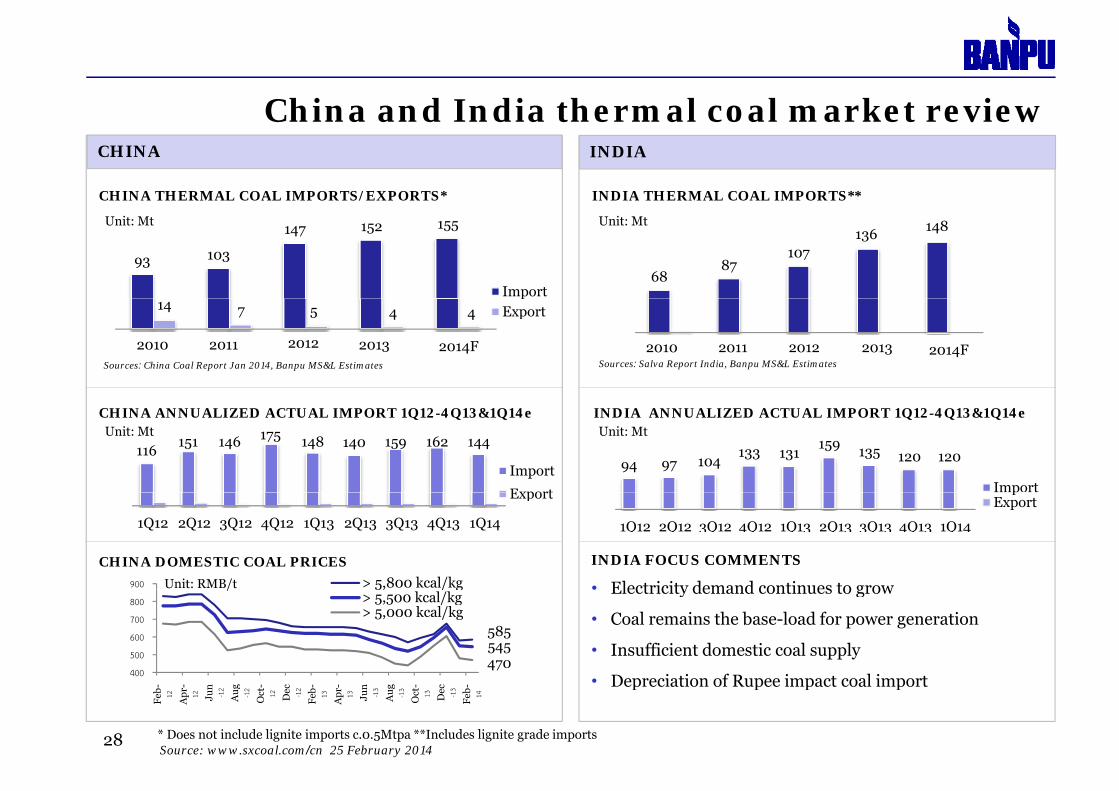
China and India thermal coal market re ieChina and India thermal coal market review
CHINA THERMAL COAL IMPORTS/EXPORTS* INDIA THERMAL COAL IMPORTS**
CHINA INDIA
/
93 103
147 155
Import
Unit: Mt 152 155
6887
107
148 136 148Unit: Mt
14 7 5 4 4
2010 2011 2012 2013 2014F
pExport
Sources: China Coal Report Jan 2014, Banpu MS&L Estimates
2010 2011 2012 2013 2010 2011 2012 2013 2014FSources: Salva Report India, Banpu MS&L Estimates
2010 2011 2012 2013
CHINA ANNUALIZED ACTUAL IMPORT 1Q12-4Q13&1Q14e INDIA ANNUALIZED ACTUAL IMPORT 1Q12-4Q13&1Q14e
116 151 146 148 140 159 162 144
Import
Export
94 97 104133 131
159 135 120 120
Import
Unit: Mt Unit: Mt175
CHINA DOMESTIC COAL PRICES
1Q12 2Q12 3Q12 4Q12 1Q13 2Q13 3Q13 4Q13 1Q14
Export
1Q12 2Q12 3Q12 4Q12 1Q13 2Q13 3Q13 4Q13 1Q14
pExport
900 > 5,800 kcal/kgUnit: RMB/t
INDIA FOCUS COMMENTS
• Electricity demand continues to grow
400
500
600
700
800
- - n g - c - - n g - c -
5, / g> 5,500 kcal/kg> 5,000 kcal/kg
/
585545470
• Electricity demand continues to grow
• Coal remains the base-load for power generation
• Insufficient domestic coal supply
• Depreciation of Rupee impact coal import
28
Feb- 12
Apr
-12 Ju
n-12
Au g -12
Oct
-12 De c -12
Feb - 13
Apr
-13 Ju
n-13
Au g -13
Oct
-13 De c -13
Feb - 14
Source: www.sxcoal.com/cn 25 February 2014
Depreciation of Rupee impact coal import
* Does not include lignite imports c.0.5Mtpa **Includes lignite grade imports

Banp gro p coal sales 2013 and 2014eBanpu group coal sales 2013 and 2014eCOAL SALES(1) 2013 : 45.7 Mt(2) COAL SALES(1) 2014e : 48.2 Mt(2)
2.90.1USA0.6 Mt
24%
6%
1%
Indonesia Coal
Australia Coal
China Coal
% of total sales 3.20.1
USA0.7 Mt
%
21%1%
JAPAN
S KOREA2.9 Mt
CHINA11.1 Mt
ITALY0.8 Mt
1.8
4.6
8.1 0.72.2
14%
8%
6%2%
JAPAN
S KOREA3.2 Mt
CHINA10.1 Mt
ITALY0.7 Mt
1.8
5.2
6.8 1.12.1
5%
7% 15%1%
6.4 Mt
THAILAND1.9 Mt
INDIA2.5 Mt
OTHERS0.8 Mt
HK0.3 Mt
TAIWAN3.7 Mt
2.01.7
0.30.5
5%
5%
5%1%
1%
7.0 Mt
THAILAND2.3 Mt
INDIA3.0 Mt
OTHERS1.9 Mt
HK0.4 Mt
TAIWAN2.6 Mt
1.80.8
1.50.4
6%5%
1%
5
4%
4%
PHILIPPINES2.2 Mt
INDONESIA3.2 Mt
9
MALAYSIA0.8 Mt
19%7%2% PHILIPPINES1.8 Mt
INDONESIA3.7 Mt
3
MALAYSIA0.7 Mt
1% 8% 21%
AUSTRALIA8.5 Mt
Total: 45.7 Mt (Sales from Indonesia are included on 100% basis,
l f A t li d Chi i l d d it b i )
AUSTRALIA10.1 Mt
Total: 48.2 Mt (Sales from Indonesia are included on 100% basis,
29(1) Excluding Mongolia coal
(2) Sales from Indonesia are included on 100% basis, sales from Australia and China are included on equity basis
sales from Australia and China are included on equity basis ) sales from Australia and China are included on equity basis )

Indicati e 2014 Banp coal sales pricing stat sIndicative 2014 Banpu coal sales pricing statusINDONESIA COALAUSTRALIA COAL
7% 9%
UnsoldIndexed
11%Domestic:
LegacyUnpriced1
Unsold 21%
Fixed 47%Unpriced
Fixed
53%
13%
7%
Fixed ExportDomestic: long-term
export parity Indexed20%
12%
TARGET SALES 2014 (equity basis): c.15.3 Mt b
TARGET SALES 2014: c. 30.7 MtA t F b As at 25 Feb 2014
Note:1JPU contracts comprise 10% of 11% of unpriced sales.
As at 25 Feb 2014
30

Coal marketingCoal operationsStrategic review
321
Financial summaryPower business
54
31

Thailand Po er BLCP in 2013Thailand Power: BLCP in 2013USD million
Q-Q : -40.4%Y Y %
Q-Q : -52.2 %Y Y 10 7%
Q-Q: -68.3%Y-Y : -13.1%Y-Y : -10.7%
Y-Y: +12.6%
7536
263 235
95
605 526
160
Availability Payment (AP)
Q-Q : -87.6%Y-Y : -15.8%
Total revenue
Q-Q : -31.8%Y-Y : -14.9%
73FX gain
823Q13 4Q13 2012 20132012 2013
310
3Q13 4Q13 2012 20132012 20137
Y Y : 15.8%
27
78 53
3Q13 4Q13
3264
7
3Q13 4Q13 2012 2013
176148
56
1
7581
9684
96 93
Energy Payment (EP)
Q-Q : -67.2 %Y-Y : -7.3%
EBIT8
FX
FX gain
3Q13 4Q13 2012 20132012 2013 3Q13 4Q13 2012 20132012 2013
26
3
1
5
884
3Q13 4Q13 2012 2013 Equity income
FX Loss
2012 2013
2012 20133Q13 4Q1324
3Q13 4Q13 2012 20132012 2013
244227
73
-8
3Q13 4Q13 2012 2013
32
Dispatch (%) EBITDA Based on Banpu’s 50% interest Equity income3 3Q13 4Q13 0 0 32012 2013

Th il d P H j t i LPROGRESS UPDATES 4Q13
Thailand Power: Hongsa project in LaosPROGRESS UPDATES 4Q12PROGRESS UPDATES 4Q12
115 COOLING TOWER 1ST115 COOLING TOWER 1S
UNIT 115 KV TRANSMISSION LINE
33Note: *Banpu’s equity injection US$340M from 2014-2016
Overall progress approx. 78% completeOverall progress approx. 40% complete

Hongsa project constr ction progressHongsa project: construction progress
COAL STOCKYARD BELT CONVEYOR COAL MINE
SUB-STATION PHASE SHIFT TRANSFORMER TRANSMISSION LINE
34

China Po er BIC* in 2013 (100% basis)Sales**
(USD m)
EBITDA
(USD m)
Utilization
(hours)
Power tariff
(RMB/kwh)
Coal price***
(RMB/t)BIC*
China Power: BIC* in 2013 (100% basis)
LuannanHebei Province
Power 100MW;
( ) ( ) ( ) ( / ) ( / )
0.44 0.43
511 498
1,54110.112.3
4.6
47.8
9.5
15.55,879 5,911
0.44 0.44
676515
48.7
Power 100MW;
Steam 128tph
(Banpu 100% )
Zhengding
1,2513.3 4.6
16.87 752
7,948630
3Q13 4Q13 2012 2013 3Q13 4Q13 2012 2013 3Q13 4Q13 2012 2013 3Q13 4Q13 2012 2013 3Q13 4Q13 2012 2013
ZhengdingHebei Province
Power 48MW;
Steam 180tph 1,748
2,311 0.41 0.408.3 13.8
2.45.5
484 465
45.7 13.7 7,752
0.40 0.40
630504
45.7
(100%)
Zouping
4
655 630
97.9
18.6
25.07,245
7,761 833
65293.7
3Q13 4Q13 2012 2013 3Q13 4Q13 2012 2013 3Q13 4Q13 2012 2013 3Q13 4Q13 2012 2013 3Q13 4Q13 2012 2013
p gShandong Province
Power 100MW;
Steam 430tph
(70%)
22.526.3 4.8 6.6
1,7872,162
0.43 0.42
18.6
0.44 0.43
Note: *BIC = Banpu Investment China (formerly BPIC),** Unaudited figures, *** Including transportation
(70%)
3Q13 4Q13 2012 201335
3Q13 4Q13 2012 2013 3Q13 4Q13 2012 2013 3Q13 4Q13 2012 2013 3Q13 4Q13 2012 2013 3Q13 4Q13 2012 2013

Coal marketingCoal operationsStrategic review
321
Financial summaryPower business
54
36

Ke e ternal and corporate e entsKey external and corporate eventsTony Abbot won the election to be new Australian prime minister
Moody’s and Fitch
Anti-government protest in Thailand
VE
NT
S
IND
IRE
CT U.S.
government shutdown
ADB lower
World Bank announced limits
lending for coal-fired
Syria chemical weapon threat
FED not to reduce QE
ywarned a potential credit downgrade if political unrest prolongs
THB falls
SET fell by 68 points and Baht
China’s dimmed GDP forecast (7.4%), reforms may slow growth to the lowest
XT
ER
NA
L
EV
T
Thailand’s 2013 economic growth to 3.8% from 4.9%
lending for coal fired power plants
• Positive economic Thermal coal dipped to 4-year
THB falls to 32/USD
and Baht weakened
Japanese power utilities agree to buy coal at $89/t
BHP cut 230 jobs at
Australian coal mine
the lowest since 1990
EX
DIR
EC
T
China increases export taxes on coking coal to 10%
Bushfire in Australia
impacts coal rail network
Positive economic data from China •Moody’s upgrade
US coal sector to STABLE
India to defer coal import
from Indonesia as Rupee falls
dipped to 4-year lows at $77/t
coal at $89/t (lowest since 2009)
coal mine
Indonesia to cap coal
output to 400 mt in 2014
EV
EN
TS
3Q13 Result announcement
2Q13 Result announcement
3Q13 4Q13 1Q14
4Q13 Result announcement
OR
PO
RA
TE
E announcement
3Q13 Analyst
meeting
3Q13 SET Opportunity Day
Bt5/share interim dividend paymentEnd of share
buy-back program of 5% ( illi
Share split announced EGM to
approve the share split
2Q13 Analyst
meeting
2Q13 SET Opportunity Day Banpu
Filing to the SEC; write-off of 135.6m shares between Mar 15-Sep 14, 2013
4Q13 Analyst meeting
Decrease in
announcement
Announced Bt0.70/share 2H dividend
4Q13 SET Opportunity Day
37
CO Change in par value
from Bt 10 to Bt 1(13.6million shares)
Announced Bt5/share interim
dividend
roadshow in Singapore
Decrease in Paid-up Capital
announced

Banp gro p Q Q re en e anal sis coal operationsBanpu group Q-Q revenue analysis: coal operationsIndonesia Coal (ITM)
SALES (Mt)Domestic 100% basis
China Coal
SALES (Mt) Equity basisDomestic
Australia Coal (Centennial)
SALES (Mt) Equity basisDomestic
7.6 6.5 6.1 6.7 6.8
6.6 7.1 6.9 7.5 7.6
Q Q Q Q Q
Export
0.7 0.7 0.7 0.7 0.9
Q Q Q Q Q
Export
1.7 1.6 2.5 1.8 2.5
3.3 2.9 3.8 3.2 3.7
Q Q Q Q Q
Export
4Q12 1Q13 2Q13 3Q13 4Q13
AVERAGE SELLING PRICE (US$/t)
NE
X*
86 93 86 78 84
AVERAGE SELLING PRICE (US$/t) excl. VAT
4Q12 1Q13 2Q13 3Q13 4Q13
NE
X*
86 93 86 78 84
4Q12 1Q13 2Q13 3Q13 4Q13
AVERAGE SELLING PRICE (A$/t)
NE
X*
86 93 86 78 84
REVENUE ($M)
ASP 81 80 77 73 71
4Q12 1Q13 2Q13 3Q13 4Q13
REVENUE ($M)
ASP 101 106 90 81 88
4Q12 1Q13 2Q13 3Q13 4Q13
78
REVENUE (A$M)
ASP 74 65 70 73 70
4Q12 1Q13 2Q13 3Q13 4Q13
78
REVENUE ($M)
653 563 527 543 545
100% basis REVENUE ($M)
154 161 133 126 186
100% basisREVENUE (A$M)
244 202 271 234 259
Equity basis
Note: ITM and Centennial revenues are consolidated in Banpu income statement.Australia Coal – Third party coal sales included.
4Q12 1Q13 2Q13 3Q13 4Q13
Note: ‘$’ in this presentation denotes US dollar only, otherwise stated
*NEX = Newcastle Export Index (formerly Barlow Jonker Index or BJI)
Note: Hebi and Gaohe revenues are not consolidated in Banpu income statement.
4Q12 1Q13 2Q13 3Q13 4Q134Q12 1Q13 2Q13 3Q13 4Q13
38
NEX Newcastle Export Index (formerly Barlow Jonker Index or BJI) It is relevant but not linked to China Coal’s ASP

Banp consolidated sales re en esBanpu consolidated sales revenuesUSD million
3,775
USD million
Power+5% Y Y
-11% Y –Y 3,351-13% Y –Y
+5% Q – Q 183
191 +5% Y - Y
Coal Australia-15% Y - Y
1,079
913
984Power+29% Q - Q+4% Y Y
Coal Indonesia
984809
Power
C l A t li
854
-11 % Y - YCoal Australia+12% Q - Q-4% Y - Y
+4% Y - Y2,513
2,247248
214 239
51 41 53
Coal Australia
Coal IndonesiaCoal Indonesia+1% Q- Q-18 % Y - Y
685 554 562
2012 2013
39 Note: Revenue from other is included in Coal.
4Q12 3Q13 4Q13 2012 20132012 2013

Banp consolidated coal gross margin 2013 32%Coal gross margin (weighted average) 4Q13: 32% Coal gross margin (weighted average) 2013: 32%
Banpu consolidated coal gross margin 2013 : 32%
USD million USD million
Indonesia gross margin: 35%Indonesia Coal
672
Australia gross margin: 25%Australia Coal
Indonesia gross margin: 36%Indonesia Coal
Australia gross margin: 23%Australia Coal
7
5455402,476
2,182
38%38%
248 239214
43%
1,079913
4Q12 3Q13 4Q13
35%38%
4Q12 3Q13 4Q13
25%29%27%
2012 2013
36%43%
2012 2013
23%30%
2012 2013 2012 2013
40 Coal sales Gross margin
4Q 3Q 3 4Q 3 4Q 3Q 3 4Q 3 2012 2013 2012 20132012 2013 2012 2013

Banp consolidated EBITDABanpu consolidated EBITDAUSD million USD million
68
974-16% Q –Q -20% Y –Y
-28% Y –Y
29
226
103
Power
Coal Australia
697+52% Y-Y
27
146 Coal China
Power -7% Y-Y+26% Q-Q
-35% Y-Y
651
42011 49
43 54
11 35 9
Coal Indonesia -35% Y-Y213
203Coal - Australia
Coal - China 171
+200% Q-Q
+26% Q-Q +10% Y-Y
Q Q+10% Y-Y
142 122 99
11 3 9 43 54
Q * Q Q *
Coal - Indonesia
-30% Y-Y
-18% Y-Y
-19% Q-Q
+200% Q Q
2012* 20134Q12* 3Q13 4Q13 2012* 2013
41 Power Coal Australia Coal China Coal Indonesia * Reflects new TFRS accounting policies
2012 2013

Banp consolidated NPATBanpu consolidated NPATUSD million
272USD million
8
26
42272
-32% Q –Q -71% Y –Y
103
-62% Y –Y
28
21
66FX• FX gains (Banpu)
+U$30M
Power
Coal China
103
+57% Y-Y
25% Y Y
81
202
110
7
3
21
2323
+U$30M• FX losses (CEY)
-U$7M
Coal Indonesia -46% Y-Y
7130
Coal Indonesia
Coal China
+0% Y-Y20 +133% Q-Q
-25% Y-Y
3967
-6 -18 -13
-67 -9
-2-2 -16
23
-27 Coal Australia
Coal Indonesia
Power
-93% Y-YCoal Australia +43% Q-Q
-85% Q-Q
+117% Y-Y n.m.
-27
4Q12* 3Q13 4Q13 2012* 2013
Power n.m. FX
• FX gains (Banpu) +U$25M• FX losses (CEY) -U$52M
2012* 20134Q 3Q 3 4Q 3 3
42 Power Coal Australia Coal China Coal Indonesia * Reflects new TFRS accounting policiesFX and derivative
3

Banp gearing and foreign e change str ct reGEARING RATIOS
Banpu gearing and foreign exchange structureDEBT FX STRUCTURE
Net debt / Equity1 (x)
THB Float2%
0.74 0.791.07
Net debt / Equity (x)
AUD Fixed
4%
2% THB Fixed14%
Net market gearing2 (%)
USD Float53%
USD Fixed27%
42% 45%52%
27%
Net debt / EBITDA (x)
3.99
TOTAL DEBT: $3.24 billionAs at 31 January 2014
2.052.52
3.99
2011 2012 20132011 2012 2013
43 Note: 1 Net debt to book value of shareholders' equity2 Net debt to enterprise value (enterprise value = net debt + market capitalization as at 31 December 2013)
2011 2012 20132011 2012 2013

Cape o tlook 2012 2015Capex outlook : 2012-20151,273340(1)USD million
1 00
200779
1 97
427 10037
1 23
269230
Capex FY12 13
Capex FY14-15494
Australia Total capexLaosIndonesia
146
MongoliaChina
Capex FY12-13
IPCC, BoCTexpansion, BunyutExpansion, etc
Newstan and Angus Place extension
China Power (BIC)
Tsant Uuldevelopment and Altai Nuurs
l ti
Capex from Hongsaproject in 2014-2016
44 * Capex figures exclude maintenance capex Disclaimer: all capex figures are indicative only and are subject to change(1) Includes 2016 Hongsa equity injection
exploration

Change in acco nting standard Indonesia coalCOMMENTS
Change in accounting standard: Indonesia coal
1 Cash basis
4. IFRIC 20/ISAK29IFRIC 20 : MINING COSTCURRENT PRACTICESBased on LOM S/R, production and reservesS/R ILLUSTRATIVE ONLY
● IFRIC 20 – Stripping costs in the production phase of a surface mining
● Stripping costs, which
1. Cash basis*New practice to be applied for all ITM mines
8.0 8.4 8.2 8.7 4.2 S/R7.0
11.8
3.5
8.09.0
Avg. 8.0
Stripping costs, which provides an improved access benefit to ore/ coal is recognized as an asset
● Effective date: January 1
2. Life of mineBased on LOM S/R
Avg. 8.0
121 2.5 3.5ROM
8.0 8.0 8.0 8.0 8.0S/R
● Effective date: January 1, 2014
● Compulsory for all mining companies with surface
i
Amort.(year 1)
Amort.(year 2)
• Jorong
Avg. 8.0
S/R
mines● Change in accounting
policy (retroactive and require restatement)• Capitalized O/B if there is future benefit
2.01.0 2.5 1.03.53. Betterment
ROM
Based on S/R attributable to coal inventory
8.9 7.5 7.9 4.011.6S/R
• Td.Mayang
ROM
● First result will be shown in 1Q14 statements
Capitalized O/B if there is future benefit (e.g. access to coal)
• O/B above LOM avg. is capitalized• Capitalized O/B is amortized according to
production and remaining reserves by pit• Indominco
• Trubaindo
• Embalut
coal inventory
45 Note: charts not drawn to scale. IFRIC stands for International Financial Reporting Accounting Interpretation Committee, ISAK stands for Interpretation of Financial Accounting Standard
• Bharinto ROM

Change in acco nting standard BLCPCOMMENTS
Change in accounting standard: BLCPTFRIC4 ADJUSTMENTS FOR BLCP INCOME
● TFRIC 4 – Determining whether an arrangement contains a lease
● Effective date: January 1 2014APR1: Availability Payment for investment cost
Adjustment :
APR
EXISTING REVENUE
TARIFF BASED INCOME
TFRIC 4
LEASE BASED INCOME
● Effective date: January 1,2014
● PPA is considered as a lease
● Treats capacity utilization as a ‘lease rental’
1
- APR1
+ Interest income
+ Depreciation
+/ Gain(loss) on FX lease rental
● Potential impact:
o Smooths revenue and net income curve over long
APR2: Availability Payment for power plant maintenance2 No adjustment
+/- Gain(loss) on FX
term
o No change to cash flows and tax treatment
EP :
Energy payment for fuel cost3 No adjustment
VOM :
Variable operating and maintenance
4 No adjustment
46

A diAppendices
47

Banp gro p indicati e fi e ear plan o tp t targetsINDONESIA COAL: SALEABLE COAL 100% BASIS
Banpu group indicative five-year plan output targetsAUSTRALIA COAL: SALEABLE EQUITY BASIS
25
30
35
Bharinto JorongEmbalut
* **
Mt
25
30
35Mt
10
15
20 Trubaindo
Others - WestSpringvale (50%)Angus Place (50%)Others - North
10
15
20
0
5
2012 2013 2014 2015 2016
Indominco
* Tandung Mayang
Others - NorthNewstan Ext (100%)Mandalong (100%)
0
5
2012 2013 2014 2015 20162012 2013 2014 2015 2016 2012 2013 2014 2015 2016
MONGOLIA COAL: SALEABLE 100%BASISCHINA COAL: SALEABLE COAL EQUITY BASIS
Tandung Mayang
10 10
MtMt
0
5
2012 2013 2014 2015 2016
Gaohe (45%)Hebi (40%)
0
5
2012 2013 2014 2015 20162012 2013 2014 2015 20162012 2013 2014 2015 2016
48 Disclaimer: These output targets are indicative only and are subject to change.
2012 2013 2014 2015 20162012 2013 2014 2015 20162012 2013 2014 2015 2016

Indonesia Coal gross margin 4Q13 35%Indonesia Coal gross margin 4Q13 : 35%USD million
672
545333
672
540
259258
228
38%
179160
35%38%
38%
40%37%
37%
34%
36%
31%
53%
29% 25%19 14 16 52% 20
54% 32% 34%
28 1717
52
47%
48%52%
53
37%40%
51%38 39
25
34%
4Q12 3Q13 4Q13
Indonesia Coal
4Q12 3Q13 4Q13
Indominco
4Q12 3Q13 4Q13
34 31%
Trubaindo
4Q12 3Q13 4Q13
Jorong
29% 30% 25%
4Q12 3Q13 4Q13
3 34
Kitadin
4Q12 3Q13 4Q13
Bharinto
48%
4Q12 3Q13 4Q13
TandungMayang
34%
49
g Mayang

B EBITDA b kdBanpu group EBITDA breakdown
& holding companies
Unit: $M 148 175 203 171
-3 -3 -3 -399 88 114 102
Power & New energy
companies
65%AACI OVERHEAD
100%
1162 43 43 -2 -2 -3 -2
Unit: AUD Mil
1Q13 2Q13 3Q13 4Q13
46 43 34 5851 46 21 65
58 72 7324
50%
45%
Gaohe
BLCP
IndomincoAll figures are 100% basis except for Centennial
1Q13 2Q13 3Q13 4Q13 1Q13 2Q13 3Q13 4Q13 1Q13 2Q13 3Q13 4Q13 1Q13 2Q13 3Q13 4Q13
1Q13 2Q13 3Q13 4Q13
1Q13 2Q13 3Q13 4Q13
18 19 12 16 -4 -2 -1 -4
2 0
-2
1
40%
40%
Hebi
HONGSATrubaindo
which is equity basis
Bharinto
Q 3 Q 3 3Q 3 4Q 31Q13 2Q13 3Q13 4Q13
1Q13 2Q13 3Q13 4Q13
1Q13 2Q13 3Q13 4Q131Q13 2Q13 3Q13 4Q13
9 10 12 0
70%
BIC*
Kitadin
17 13 10 14
Bharinto
1Q13 2Q13 3Q13 4Q13
1Q13 2Q13 3Q13 4Q13
2
1
1 1
19 16 13 20
Jorong
N ll hi % l h i h
Zouping
7 6 5 7
Zhengding
6 3 2 6
Luannan
4 3 3 5
1Q13 2Q13 3Q13 4Q13
1Q13 2Q13 3Q13 4Q13 1Q13 2Q13 3Q13 4Q13 1Q13 2Q13 3Q13 4Q13
50
-1 Note: all ownership 100% unless otherwise shown.*BIC = Banpu Investment China (formerly BPIC) Consolidated NOT consolidated
1Q13 2Q13 3Q13 4Q13

Banp gro p net debt breakdo nBanpu group net debt breakdown
2,484 2,469 2,482 2,500 Unit: $M
& holding companies
1Q13 2Q13 3Q13 4Q13
AUSTRALIA COAL INDONESIA COAL CHINA COAL MONGOLIA COAL100% 65% 45% 40% 100%
318 224 192 155
4Q131Q13 2Q13 3Q13
Gaohe Hebi
548 631 687 667-496 -400 -418 -289
-40 -24 -18 -19 -5 -5 -7 -5Unit: AUD Mil
4Q131Q13 2Q13 3Q13 4Q131Q13 2Q13 3Q13 4Q131Q13 2Q13 3Q13 4Q131Q13 2Q13 3Q134Q131Q13 2Q13 3Q13
THAILAND POWER LAOS POWER CHINA POWER
HONGSABLCP BIC*
50% 40% 100%
4Q131Q13 2Q13 3Q13 4Q131Q13 2Q13 3Q13 4Q131Q13 2Q13 3Q13 4Q131Q13 2Q13 3Q13
1201 1286 1472 1686
HONGSABLCP BIC*Consolidated
NOT consolidatedNet debt
Net cash
574 557 506 490 -4
1 3
-15
4Q131Q13 2Q13 3Q13 4Q131Q13 2Q13 3Q13 4Q131Q13 2Q13 3Q13
51 Note: all ownership 100% unless otherwise shown.*BIC = Banpu Investment China (formerly BPIC)
Net cash

B lid t d ti fitBanpu consolidated : operating profit
Units: USD million YoY%
-11%Total sales revenues*
2013
3,351
2012
3,775
Sales revenues – Power (BIC)
Cost of sales
Sales revenues – Coal -12%
5%191
(2,276)
3,128
183
(2,332)
3,555
Gross profit* -25%
Gross profit - Coal -27%
Gross profit – Power (BIC) 67%
1,075
1,008
52
1,443
1,387
31
GPM
p ( )
GPM P (BIC)
GPM - Coal
7
32%
5
%
32%
38%
3
%
39%
GPM – Power (BIC) 27% 17%
52 Note: * Including other business

B lid t d ti fitBanpu consolidated: operating profit
Units: USD million
Gross profit -25%GPM
YoY%
1,07532%
2013
1,44338%
2012
GPM
SG&ARoyalty
Income from associates
32%
(402)(325)
95
38%
(448)(383)
86Other income
EBIT 36%
Income from associates
Other expenses - Operations57
471
95
(30)
63
740
86
(21)EBIT -36%
EBITDA 28%
EBIT - Coal -45%EBIT - Power 72%
471
697
38091
740
974
68753
EBITDA -28%
EBITDA - Coal -34%EBITDA - Power 51%
697
594103
974
90668
53

B lid t d t fitBanpu consolidated : net profit
Units: USD million
EBIT -36%
YoY%
471
2013
740
2012
Interest expensesFinancial expenses
Mi itiIncome tax (core business)
(116)(11)
( )(104)
(112)(11)
( )(183)
Minorities
Non-recurring items*
I ( b i )
Net profit before extra items(85)
(39)
155 -45%(152)
0
283
Income tax (non - core business) (21)
Net profit before FX -57%130
Deferred tax income (expenses) 35(14)
298
30
FX translations
Net Profit -62%
(27)
103
EPS (USD/share) 0.04
(27)
272
1.00
54 Note: * Income from non-core assets and other non-operating expenses
( / ) 4

B lid t d ti fitBanpu consolidated : operating profit
Units: USD million
Total sales revenues*
YoY%
-13%
3Q13
809
4Q12
983
QoQ%
5%
4Q13
854
Sales revenues – Power (BIC)
Cost of sales
Sales revenues – Coal -14%
4%41
(526)
760
51
(648)
920 4%
29%53
(580)
793
Gross profit*
Gross profit - Coal
Gross profit – Power (BIC)
-18%
-21%
69%
284
271
9
336
321
9
-4%
-6%
71%
274
255
15
GPM
p ( )
GPM P (BIC)
GPM - Coal
9
35%
9
%
36%
34%
9
8%
35%
7
32%
5
%
32%
GPM – Power (BIC) 22% 18%29%
55 Note: * Including other business

B lid t d ti fitBanpu consolidated: operating profit
Units: USD million
Gross profitGPM
-18%
YoY%
28435%
3Q13
33634%
4Q12
27432%
4Q13
-4%
QoQ%
GPM
SG&ARoyaltyIncome from associates
35%
(93)(81)
29
34%
(122)(105)
17
32%
(97)(82)
7 Other income
EBIT
Income from associates
26%
Other expenses - Operations13
144
29
(7)28
143
17
(10)
11
105
7
(7)
27%EBIT
EBITDA
EBIT - CoalEBIT - Power
-26%
20%
-27%-17%
144
203
11727
143
213
1376
105
171
1005
-27%
16%
-15%-81%
EBITDA
EBITDA - CoalEBITDA - Power
-20%
-20%-18%
203
16835
213
20211
171
1629
-16%
-4%-74%
56

B lid t d t fitBanpu consolidated : net profit
Units: USD million
EBIT -26%
YoY%
144
3Q13
143
4Q12
105
4Q13
-27%
QoQ%
Interest expensesFinancial expenses
Mi itiIncome tax (core business)
(30)(3)
( )(29)
(29)(2)
( )(33)
(30)(3)
( )(24)
Minorities
Non-recurring items*
I ( b i )
Net profit before extra items -46%(22)
(20)
60(23)
(17)
57
(17)
(31)
31 -48%
Income tax (non - core business)
Net profit before FX -104%
Deferred tax income (expenses)
-
40
0
-
73
32
(8)
(3)
(6)
-108%
FX translations
Net Profit
EPS (USD/share)
-71%
(10)
30
0 012
(2)
71
0 26
23
20
0 008
-32%
57 Note: * Income from non-core assets and other non-operating expenses
EPS (USD/share) 0.012 0.260.008

C t i l I St t tUnits: USD million 2013 YoY%
S l l ( )
2012
Centennial : Income Statement
Cost of sales
-5%
Sales revenue
Sales volume (Mt)
-15%(751.25)
14.30
1,079.03(699.42)
13.59
913.38
Gross profit -35%GPM SG&A -17%
327.7830%
( )(186.44)
213.9723%
( )(155.56)
Royalty -21%
%EBIT
Other income 30%
(75.01)
68 8
22.98(58.96)
( 8 )
29.84Other expenses (20.46)(30.16) 47%
-101%EBIT
Interest expensesFinancial expenses
68.85
(25.56)
(5.80)
(0.87)
(26.33)
(5.76)Gain (loss) on exchange rate 5 34(52 40)Gain (loss) on exchange rate 5.34(52.40)
Corporate income tax 0.55-Gain (loss) on derivative 57.9518.38
Deferred tax -17.69 Net profit -149%101.33(49.30)
58
7 69

C t i l I St t tUnits: USD million
S l l ( )
4Q12
Centennial : Income StatementYoY%QoQ%4Q13 3Q13
Cost of sales
G fi
Sales revenue
Sales volume (Mt)
(179.87)
3.297
248.05
11%
-4%
14%
12%(180.50)
3.659
239.29(153.21)
3.214
214.37
Gross profit GPM
R ltSG&A
68.1827%
(17 03)(48.06)
-14%
-26%10%
-4%
-6%%
58.7825%
(15 33)(35.56)
61.1529%
(14 37)(37.75)
Royalty
EBIT
Other income(17.03)
2 05
Other expenses
-10%
464%
19%
-29%
9.19
(10.23)
7%
70%
131%
4%
(15.33)
11 56
10.91
(7.24)
(14.37)
6 81
4.73
(6.96)EBIT
Interest expensesFinancial expenses
G i (l ) h t
2.05
(6.50)
(2.13)
(1 43)
464%70%11.56
(6.57)
(1.62)
(6 58)
6.81
(6.40)
(1.34)
0 99Gain (loss) on exchange rate
fi
Gain (loss) on derivative
(1.43)
18.23
Deferred tax income -
(6.58)
0.33
0.45
0.99
0.29
-
Net profit 10.24
59
n.m.n.m.(2.44) 0.36

A stralia Coal q arterl eq it ROM o tp t Australia Coal: quarterly equity ROM output
Total equity ROM (Mt)ACTUAL PLANNED (INDICATIVE ONLY)
8
4.2
3.13.7 3.6
3.3
4.4
3.63.54.04.55.0
ACTUAL PLANNED (INDICATIVE ONLY)
ER
N
1 9 1 6
1.3
2.51.2 2.0 2.1 1.7
2.71.9
2.83
1 01.52.02.53.03 5
TER
NN
OR
THE
R
1.5 1.7 1.9 1.7 1.5 1.6 1.7 1.7
0.00.51.0
1Q13 2Q13 3Q13 4Q13 1Q14 2Q14 3Q14 4Q14
WE
ST
6 wks
7 wks 3
2013 2014
6 ks
3
Normal production Bolt-up/commissioning LW relocation
6 wks
5 wks
60 Note: Bar width is indicative of the equity production contributions to CentennialNote 2: Production generally responds to the timing of longwall changeovers (i.e. lower production results during a longwall changeover period)