investor highlights march 2021
TRANSCRIPT
Investor HighlightsMarch 2021
Legal Disclosures
2
Forward-Looking Statements
Various statements contained in this presentation, including those that express a belief, expectation or intention, as well as those that are not statements of historical fact, are
forward-looking statements. These forward-looking statements may include projections and estimates concerning the timing and success of our strategies, plans or intentions.
Forward-looking statements are generally accompanied by words such as “estimate,” “project,” “predict,” “believe,” “expect,” “intend,” “anticipate,” “potential,” “plan,” “goal,”
“guidance,” “outlook” or other words that convey the uncertainty of future events or outcomes. Examples of forward-looking statements contained in this presentation include,
among others, our 2021 Guidance, our expectations with respect to the impacts of the COVID-19 pandemic, our belief that our acquisition and homebuilding programs will result
in continued growth and the estimated timing of our development deliveries. We have based these forward-looking statements on our current expectations and assumptions
about future events. These assumptions include, among others, our projections and expectations regarding: market trends in the single-family home rental industry and in the
local markets where we operate, our ability to institutionalize a historically fragmented business model, our business strengths, our ideal tenant profile, the quality and location of
our properties in attractive neighborhoods, the scale advantage of our national platform and the superiority of our operational infrastructure, the effectiveness of our investment
philosophy and diversified acquisition strategy, our ability to expand our development program, our ability to grow our portfolio and to create a cash flow opportunity with
attractive current yields and upside from increasing rents and cost efficiencies and our understanding of our competition and general economic, demographic, regulatory and real
estate conditions that may impact our business. While we consider these expectations and assumptions to be reasonable, they are inherently subject to significant business,
economic, competitive, regulatory and other risks, contingencies and uncertainties, most of which are difficult to predict and many of which are beyond our control and could
cause actual results to differ materially from any future results, performance or achievements expressed or implied by these forward-looking statements. Investors should not place
undue reliance on these forward-looking statements, which speak only as of the date of this presentation, March 5, 2021. We undertake no obligation to update any forward-
looking statements to conform to actual results or changes in our expectations, unless required by applicable law. Currently, one of the most significant factors that could cause
actual outcomes to differ materially from our forward-looking statements is the adverse effect of the COVID-19 pandemic on us, our tenants, the economy and financial markets.
The extent to which the COVID-19 pandemic continues to impact us and our tenants will depend on future developments, which are highly uncertain and cannot be predicted with
confidence, including the scope, severity and duration of the pandemic, including resurgences, impact of government regulations, the speed and effectiveness of vaccine
distribution and the direct and indirect economic effects of the pandemic and containment measures, among others. For a further description of the risks and uncertainties that
could cause actual results to differ from those expressed in these forward-looking statements, as well as risks relating to the business of the Company in general, see the “Risk
Factors” disclosed in the Company’s Annual Report on Form 10-K for the year ended December 31, 2020, and in the Company’s subsequent filings with the Securities and
Exchange Commission.
Non-GAAP Financial Measures
This presentation includes certain financial measures that were not prepared in accordance with U.S. generally accepted accounting principles (GAAP) because we believe they help
investors understand our performance. Any non-GAAP financial measures presented are not, and should not be viewed as, substitutes for financial measures required by U.S. GAAP
and may not be comparable to the calculation of similar measures of other companies. Definitions of these non-GAAP financial measures and a reconciliation of these measures
to GAAP is included in the Defined Terms and Non-GAAP Reconciliations section of this presentation, as well as the 4Q20 Supplemental Information Package available on our
website at www.americanhomes4rent.com under “For Investors.”
About American Homes 4 Rent
American Homes 4 Rent (NYSE: AMH) is a leader in the single-family home rental industry and “American Homes 4 Rent” is fast becoming a nationally recognized brand for rental
homes, known for high-quality, good value and tenant satisfaction. We are an internally managed Maryland real estate investment trust, or REIT, focused on acquiring, developing,
renovating, leasing, and operating attractive, single-family homes as rental properties. As of December 31, 2020 we owned 53,584 single-family properties in selected submarkets
in 22 states.
Contacts
American Homes 4 Rent Investor Relations
Phone: (855) 794-2447 / Email: [email protected]
American Homes 4 Rent Media Relations
Phone: (805) 413-5088 / Email: [email protected]
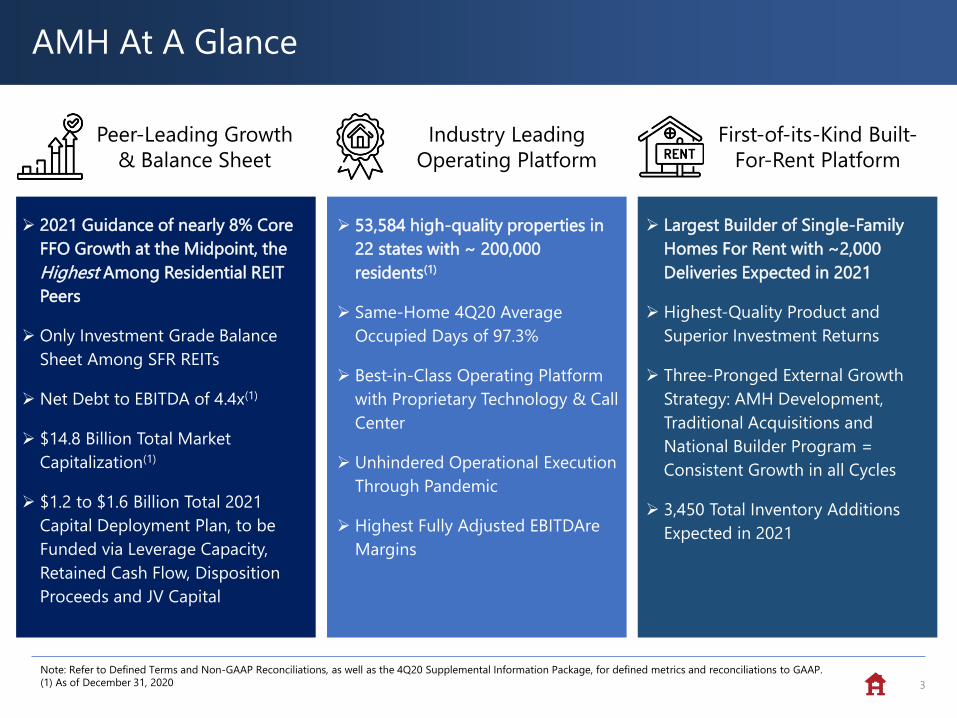
AMH At A Glance
3
Industry Leading
Operating Platform
Peer-Leading Growth
& Balance Sheet
First-of-its-Kind Built-
For-Rent Platform
➢ 2021 Guidance of nearly 8% Core
FFO Growth at the Midpoint, the
Highest Among Residential REIT
Peers
➢ Only Investment Grade Balance
Sheet Among SFR REITs
➢ Net Debt to EBITDA of 4.4x(1)
➢ $14.8 Billion Total Market
Capitalization(1)
➢ $1.2 to $1.6 Billion Total 2021
Capital Deployment Plan, to be
Funded via Leverage Capacity,
Retained Cash Flow, Disposition
Proceeds and JV Capital
➢ 53,584 high-quality properties in
22 states with ~ 200,000
residents(1)
➢ Same-Home 4Q20 Average
Occupied Days of 97.3%
➢ Best-in-Class Operating Platform
with Proprietary Technology & Call
Center
➢ Unhindered Operational Execution
Through Pandemic
➢ Highest Fully Adjusted EBITDAre
Margins
➢ Largest Builder of Single-Family
Homes For Rent with ~2,000
Deliveries Expected in 2021
➢ Highest-Quality Product and
Superior Investment Returns
➢ Three-Pronged External Growth
Strategy: AMH Development,
Traditional Acquisitions and
National Builder Program =
Consistent Growth in all Cycles
➢ 3,450 Total Inventory Additions
Expected in 2021
Note: Refer to Defined Terms and Non-GAAP Reconciliations, as well as the 4Q20 Supplemental Information Package, for defined metrics and reconciliations to GAAP.
(1) As of December 31, 2020
4
AMH Today
The Market Opportunity
AMH’s Strategy to Drive Shareholder Value
AMH Strong Governance Practices
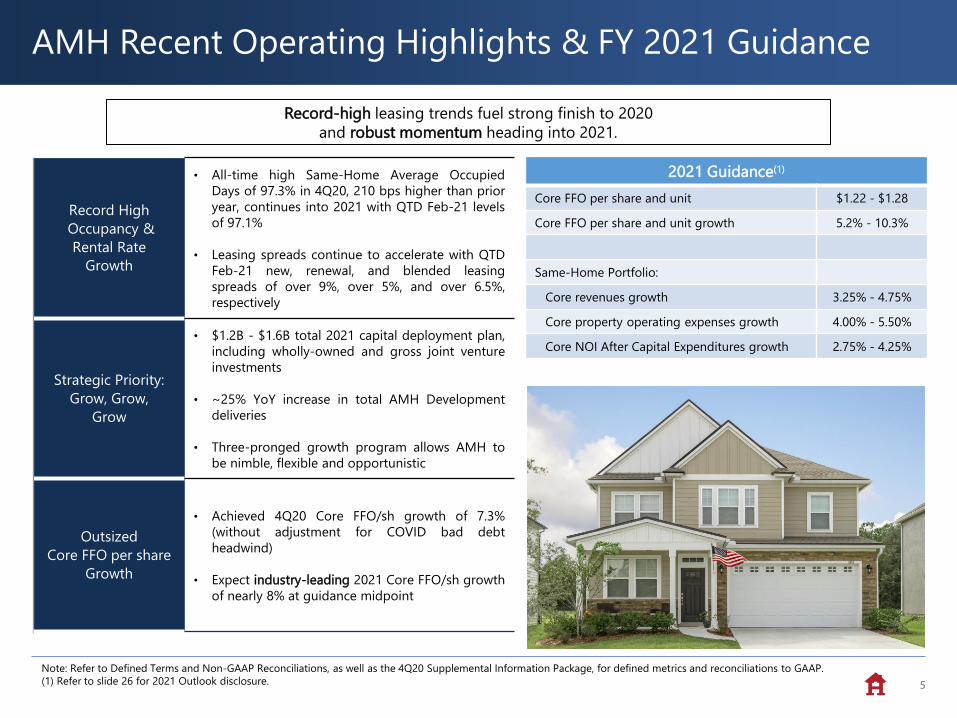
AMH Recent Operating Highlights & FY 2021 Guidance
55
Note: Refer to Defined Terms and Non-GAAP Reconciliations, as well as the 4Q20 Supplemental Information Package, for defined metrics and reconciliations to GAAP.
(1) Refer to slide 26 for 2021 Outlook disclosure.
Record High
Occupancy &
Rental Rate
Growth
• All-time high Same-Home Average Occupied
Days of 97.3% in 4Q20, 210 bps higher than prior
year, continues into 2021 with QTD Feb-21 levels
of 97.1%
• Leasing spreads continue to accelerate with QTD
Feb-21 new, renewal, and blended leasing
spreads of over 9%, over 5%, and over 6.5%,
respectively
Strategic Priority:
Grow, Grow,
Grow
• $1.2B - $1.6B total 2021 capital deployment plan,
including wholly-owned and gross joint venture
investments
• ~25% YoY increase in total AMH Development
deliveries
• Three-pronged growth program allows AMH to
be nimble, flexible and opportunistic
Outsized
Core FFO per share
Growth
• Achieved 4Q20 Core FFO/sh growth of 7.3%
(without adjustment for COVID bad debt
headwind)
• Expect industry-leading 2021 Core FFO/sh growth
of nearly 8% at guidance midpoint
Record-high leasing trends fuel strong finish to 2020
and robust momentum heading into 2021.
2021 Guidance(1)
Core FFO per share and unit $1.22 - $1.28
Core FFO per share and unit growth 5.2% - 10.3%
Same-Home Portfolio:
Core revenues growth 3.25% - 4.75%
Core property operating expenses growth 4.00% - 5.50%
Core NOI After Capital Expenditures growth 2.75% - 4.25%
6
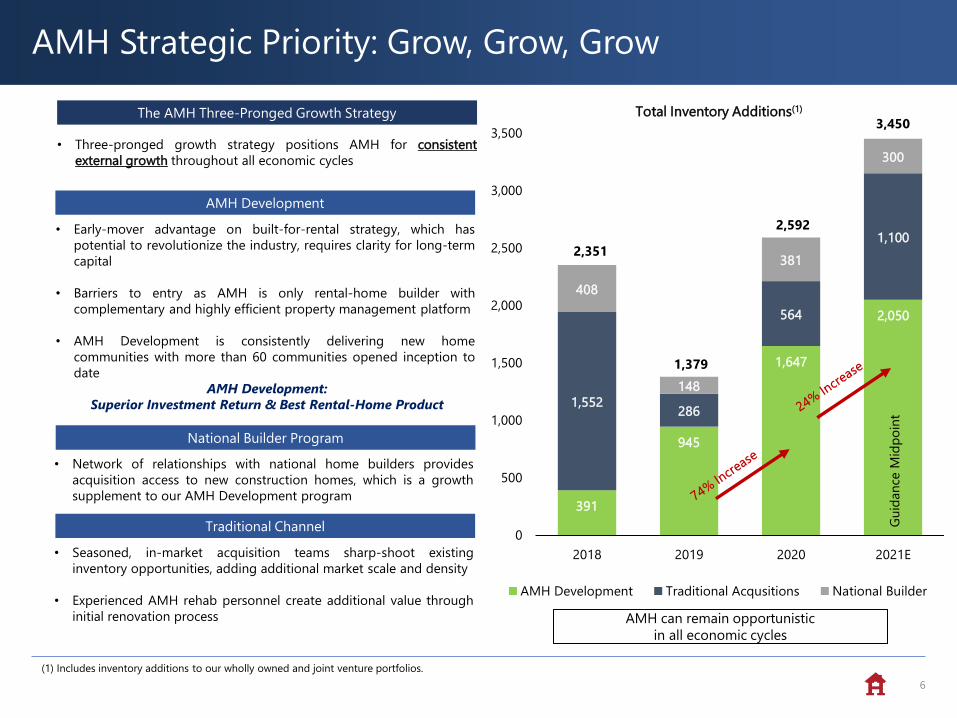
AMH Strategic Priority: Grow, Grow, Grow
AMH Development
National Builder Program
Traditional Channel
The AMH Three-Pronged Growth Strategy
• Early-mover advantage on built-for-rental strategy, which has
potential to revolutionize the industry, requires clarity for long-term
capital
• Barriers to entry as AMH is only rental-home builder with
complementary and highly efficient property management platform
• AMH Development is consistently delivering new home
communities with more than 60 communities opened inception to
date
• Network of relationships with national home builders provides
acquisition access to new construction homes, which is a growth
supplement to our AMH Development program
• Seasoned, in-market acquisition teams sharp-shoot existing
inventory opportunities, adding additional market scale and density
• Experienced AMH rehab personnel create additional value through
initial renovation processBelmont Glen, Ruskin, FL
• Three-pronged growth strategy positions AMH for consistent
external growth throughout all economic cycles
AMH can remain opportunistic
in all economic cycles
AMH Development:
Superior Investment Return & Best Rental-Home Product
Total Inventory Additions(1)
(1) Includes inventory additions to our wholly owned and joint venture portfolios.
391
945
1,647
2,050
1,552286
564
1,100
408
148
381
300
0
500
1,000
1,500
2,000
2,500
3,000
3,500
2018 2019 2020 2021E
AMH Development Traditional Acqusitions National Builder
Gu
idan
ce M
idp
oin
t
2,351
1,379
2,592
3,450
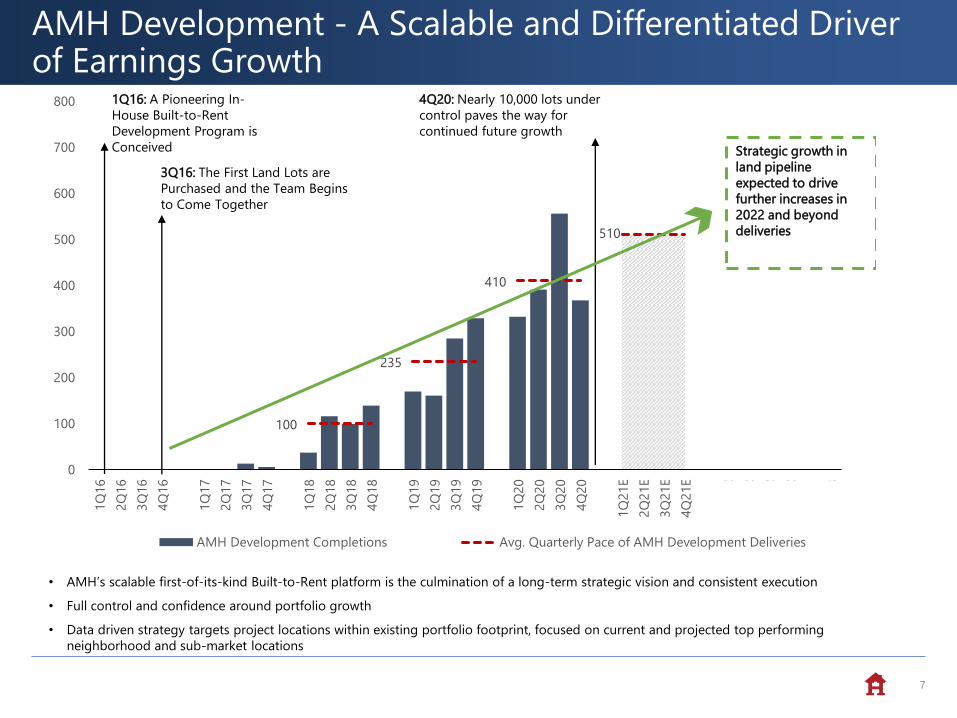
AMH Development - A Scalable and Differentiated Driver of Earnings Growth
7
• AMH’s scalable first-of-its-kind Built-to-Rent platform is the culmination of a long-term strategic vision and consistent execution
• Full control and confidence around portfolio growth
• Data driven strategy targets project locations within existing portfolio footprint, focused on current and projected top performing
neighborhood and sub-market locations
100
235
410
510
0
100
200
300
400
500
600
700
8001Q
16
2Q
16
3Q
16
4Q
16
1Q
17
2Q
17
3Q
17
4Q
17
1Q
18
2Q
18
3Q
18
4Q
18
1Q
19
2Q
19
3Q
19
4Q
19
1Q
20
2Q
20
3Q
20
4Q
20
1Q
21E
2Q
21E
3Q
21E
4Q
21E
1Q
22
2Q
22
3Q
22
4Q
22
1Q
23
AMH Development Completions Avg. Quarterly Pace of AMH Development Deliveries
1Q16: A Pioneering In-
House Built-to-Rent
Development Program is
Conceived
3Q16: The First Land Lots are
Purchased and the Team Begins
to Come Together
4Q20: Nearly 10,000 lots under
control paves the way for
continued future growth
Strategic growth in
land pipeline
expected to drive
further increases in
2022 and beyond
deliveries
8
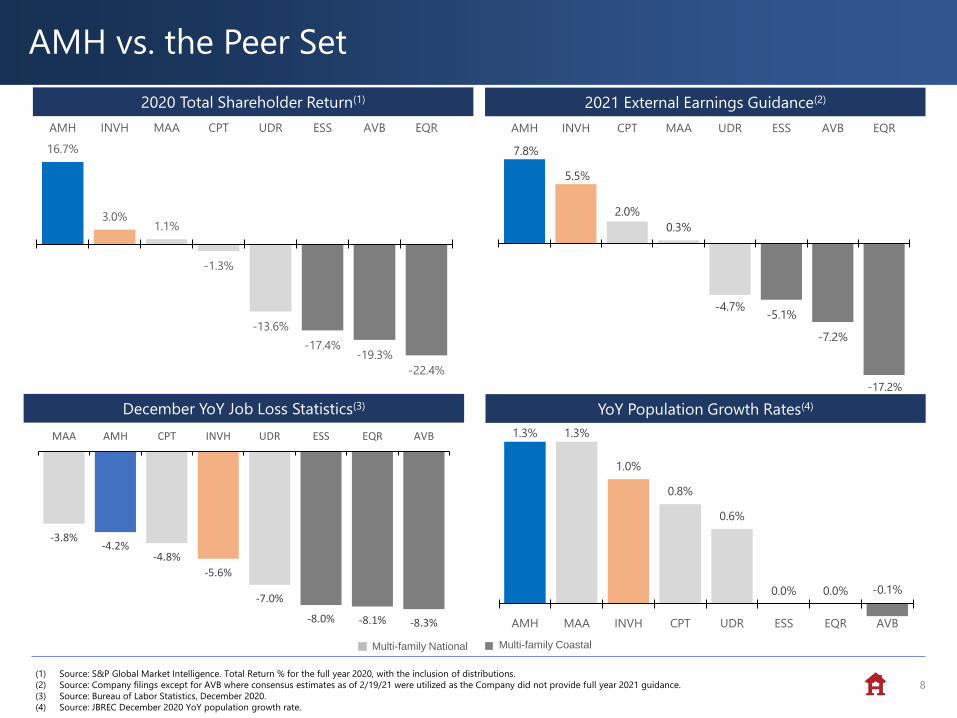
2020 Total Shareholder Return(1)
AMH vs. the Peer Set
(1) Source: S&P Global Market Intelligence. Total Return % for the full year 2020, with the inclusion of distributions.
(2) Source: Company filings except for AVB where consensus estimates as of 2/19/21 were utilized as the Company did not provide full year 2021 guidance.
(3) Source: Bureau of Labor Statistics, December 2020.
(4) Source: JBREC December 2020 YoY population growth rate.
YoY Population Growth Rates(4)
Multi-family CoastalMulti-family National
2021 External Earnings Guidance(2)
16.7%
3.0%1.1%
-1.3%
-13.6%
-17.4%-19.3%
-22.4%
AMH INVH MAA CPT UDR ESS AVB EQR
December YoY Job Loss Statistics(3)
7.8%
5.5%
2.0%
0.3%
-4.7%-5.1%
-7.2%
AMH INVH CPT MAA UDR ESS AVB EQR
-17.2%
-3.8%-4.2%
-4.8%
-5.6%
-7.0%
-8.0% -8.1% -8.3%
MAA AMH CPT INVH UDR ESS EQR AVB 1.3% 1.3%
1.0%
0.8%
0.6%
0.0% 0.0% -0.1%
AMH MAA INVH CPT UDR ESS EQR AVB
9
AMH Today
The Market Opportunity
AMH’s Strategy to Drive Shareholder Value
AMH Strong Governance Practices
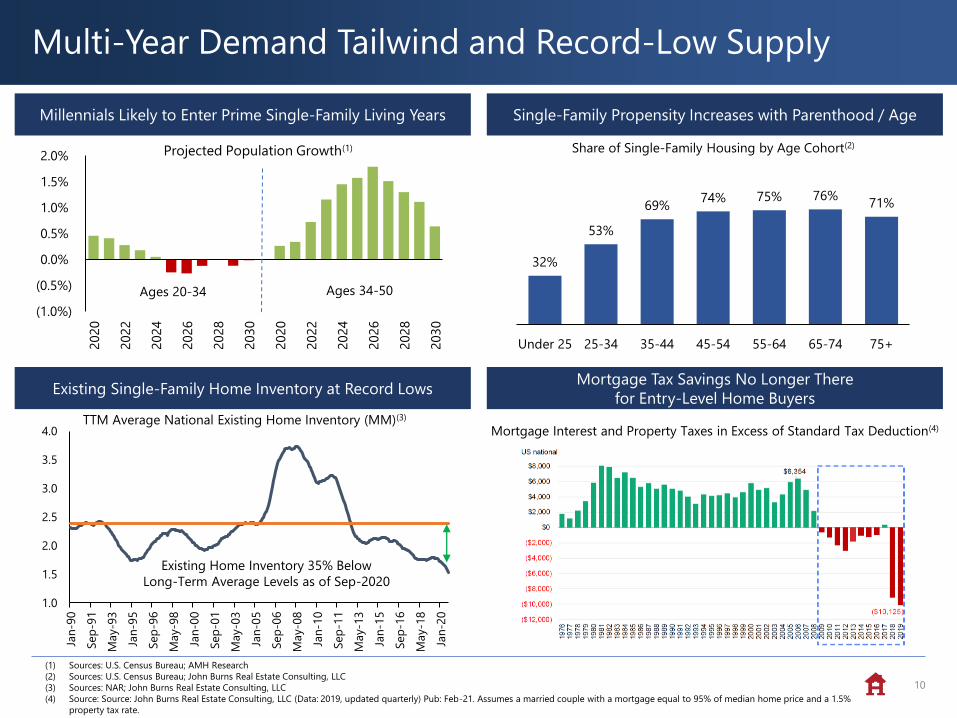
Multi-Year Demand Tailwind and Record-Low Supply
10
(1) Sources: U.S. Census Bureau; AMH Research
(2) Sources: U.S. Census Bureau; John Burns Real Estate Consulting, LLC
(3) Sources: NAR; John Burns Real Estate Consulting, LLC
(4) Source: Source: John Burns Real Estate Consulting, LLC (Data: 2019, updated quarterly) Pub: Feb-21. Assumes a married couple with a mortgage equal to 95% of median home price and a 1.5%
property tax rate.
Single-Family Propensity Increases with Parenthood / AgeMillennials Likely to Enter Prime Single-Family Living Years
Existing Single-Family Home Inventory at Record LowsMortgage Tax Savings No Longer There
for Entry-Level Home Buyers
Mortgage Interest and Property Taxes in Excess of Standard Tax Deduction(4)
(1.0%)
(0.5%)
0.0%
0.5%
1.0%
1.5%
2.0%
2020
2022
2024
2026
2028
2030
2020
2022
2024
2026
2028
2030
Projected Population Growth(1)
Ages 34-50Ages 20-34
32%
53%
69%74% 75% 76%
71%
Under 25 25-34 35-44 45-54 55-64 65-74 75+
Share of Single-Family Housing by Age Cohort(2)
1.0
1.5
2.0
2.5
3.0
3.5
4.0
Jan
-90
Sep
-91
May-9
3
Jan
-95
Sep
-96
May-9
8
Jan
-00
Sep
-01
May-0
3
Jan
-05
Sep
-06
May-0
8
Jan
-10
Sep
-11
May-1
3
Jan
-15
Sep
-16
May-1
8
Jan
-20
TTM Average National Existing Home Inventory (MM)(3)
Existing Home Inventory 35% Below
Long-Term Average Levels as of Sep-2020
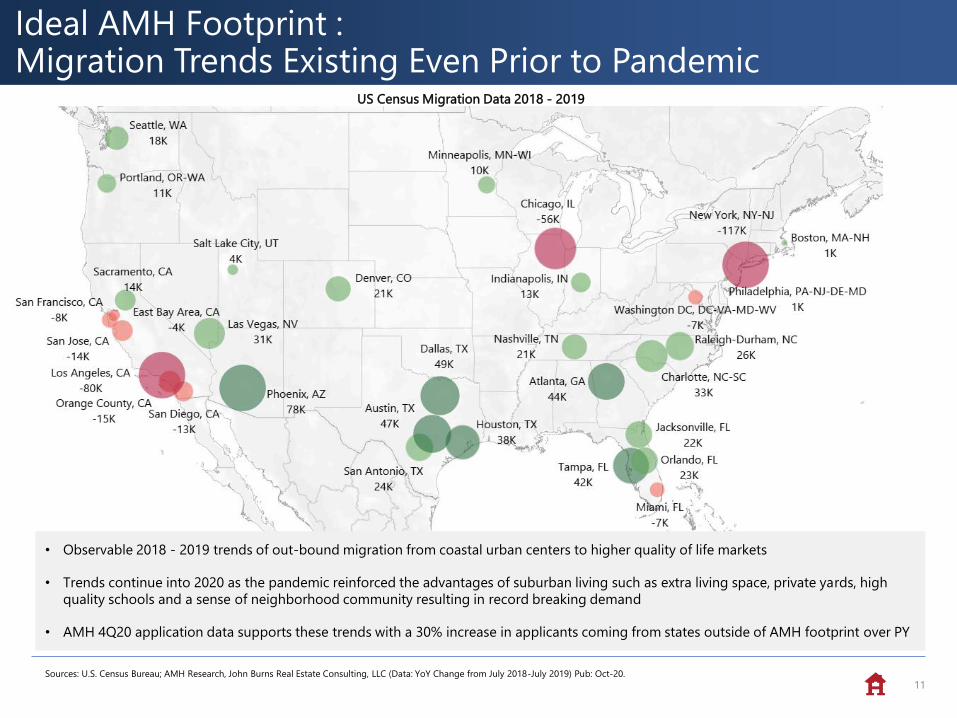
Ideal AMH Footprint : Migration Trends Existing Even Prior to Pandemic
11Sources: U.S. Census Bureau; AMH Research, John Burns Real Estate Consulting, LLC (Data: YoY Change from July 2018-July 2019) Pub: Oct-20.
US Census Migration Data 2018 - 2019
• Observable 2018 - 2019 trends of out-bound migration from coastal urban centers to higher quality of life markets
• Trends continue into 2020 as the pandemic reinforced the advantages of suburban living such as extra living space, private yards, high
quality schools and a sense of neighborhood community resulting in record breaking demand
• AMH 4Q20 application data supports these trends with a 30% increase in applicants coming from states outside of AMH footprint over PY
12
AMH Today
The Market Opportunity
AMH’s Strategy to Drive Shareholder Value
AMH Strong Governance Practices
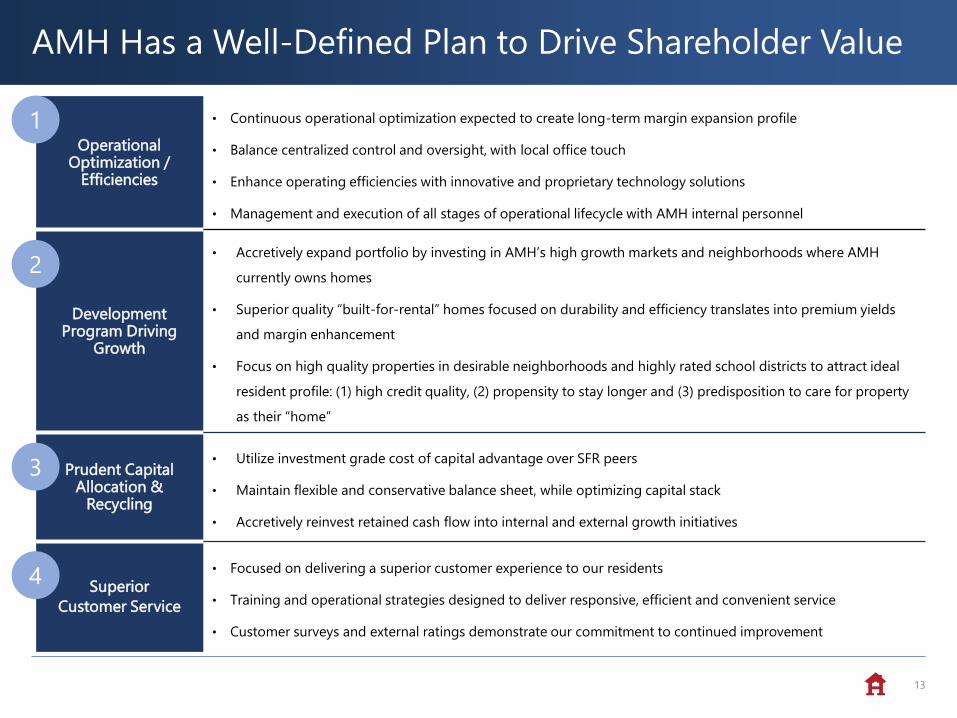
AMH Has a Well-Defined Plan to Drive Shareholder Value
13
Operational Optimization /
Efficiencies
• Continuous operational optimization expected to create long-term margin expansion profile
• Balance centralized control and oversight, with local office touch
• Enhance operating efficiencies with innovative and proprietary technology solutions
• Management and execution of all stages of operational lifecycle with AMH internal personnel
Development Program Driving
Growth
• Accretively expand portfolio by investing in AMH’s high growth markets and neighborhoods where AMH
currently owns homes
• Superior quality “built-for-rental” homes focused on durability and efficiency translates into premium yields
and margin enhancement
• Focus on high quality properties in desirable neighborhoods and highly rated school districts to attract ideal
resident profile: (1) high credit quality, (2) propensity to stay longer and (3) predisposition to care for property
as their “home”
Prudent Capital Allocation &
Recycling
• Utilize investment grade cost of capital advantage over SFR peers
• Maintain flexible and conservative balance sheet, while optimizing capital stack
• Accretively reinvest retained cash flow into internal and external growth initiatives
Superior
Customer Service
• Focused on delivering a superior customer experience to our residents
• Training and operational strategies designed to deliver responsive, efficient and convenient service
• Customer surveys and external ratings demonstrate our commitment to continued improvement
1
2
3
4
14
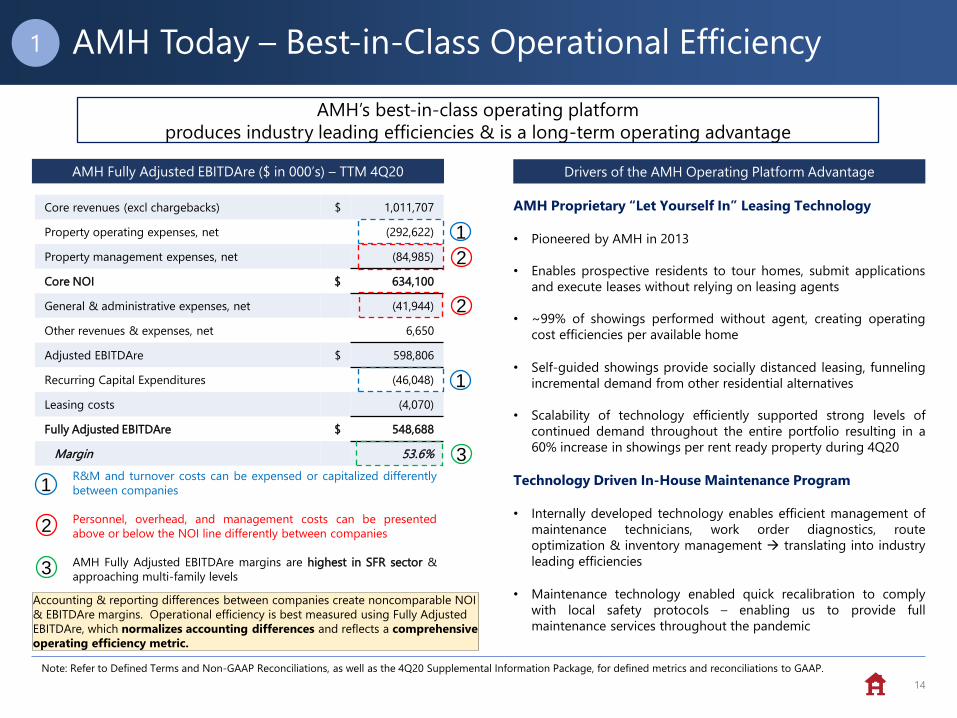
AMH Today – Best-in-Class Operational Efficiency
Core revenues (excl chargebacks) $ 1,011,707
Property operating expenses, net (292,622)
Property management expenses, net (84,985)
Core NOI $ 634,100
General & administrative expenses, net (41,944)
Other revenues & expenses, net 6,650
Adjusted EBITDAre $ 598,806
Recurring Capital Expenditures (46,048)
Leasing costs (4,070)
Fully Adjusted EBITDAre $ 548,688
Margin 53.6%
AMH Fully Adjusted EBITDAre ($ in 000’s) – TTM 4Q20
AMH’s best-in-class operating platform
produces industry leading efficiencies & is a long-term operating advantage
Drivers of the AMH Operating Platform Advantage
AMH Proprietary “Let Yourself In” Leasing Technology
• Pioneered by AMH in 2013
• Enables prospective residents to tour homes, submit applications
and execute leases without relying on leasing agents
• ~99% of showings performed without agent, creating operating
cost efficiencies per available home
• Self-guided showings provide socially distanced leasing, funneling
incremental demand from other residential alternatives
• Scalability of technology efficiently supported strong levels of
continued demand throughout the entire portfolio resulting in a
60% increase in showings per rent ready property during 4Q20
Technology Driven In-House Maintenance Program
• Internally developed technology enables efficient management of
maintenance technicians, work order diagnostics, route
optimization & inventory management → translating into industry
leading efficiencies
• Maintenance technology enabled quick recalibration to comply
with local safety protocols – enabling us to provide full
maintenance services throughout the pandemic
1
1
2
2
3R&M and turnover costs can be expensed or capitalized differently
between companies
Personnel, overhead, and management costs can be presented
above or below the NOI line differently between companies
AMH Fully Adjusted EBITDAre margins are highest in SFR sector &
approaching multi-family levels
1
2
3
Accounting & reporting differences between companies create noncomparable NOI
& EBITDAre margins. Operational efficiency is best measured using Fully Adjusted
EBITDAre, which normalizes accounting differences and reflects a comprehensive
operating efficiency metric.
Note: Refer to Defined Terms and Non-GAAP Reconciliations, as well as the 4Q20 Supplemental Information Package, for defined metrics and reconciliations to GAAP.
1
15
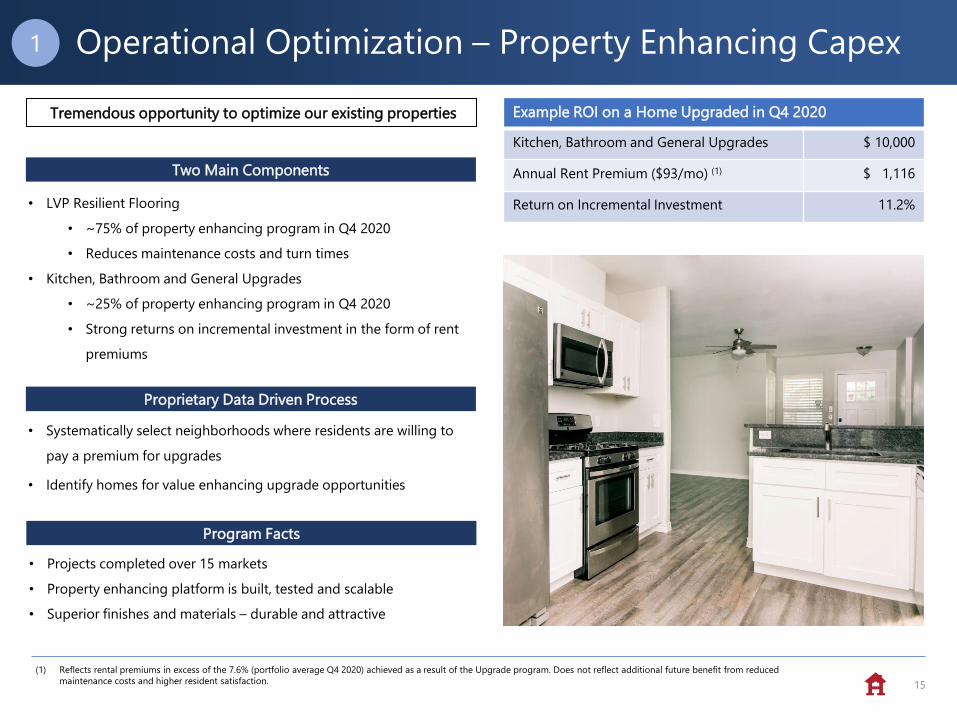
Example ROI on a Home Upgraded in Q4 2020
Kitchen, Bathroom and General Upgrades $ 10,000
Annual Rent Premium ($93/mo) (1) $ 1,116
Return on Incremental Investment 11.2%
1
(1) Reflects rental premiums in excess of the 7.6% (portfolio average Q4 2020) achieved as a result of the Upgrade program. Does not reflect additional future benefit from reduced
maintenance costs and higher resident satisfaction.
Operational Optimization – Property Enhancing Capex
Two Main Components
Program Facts
Proprietary Data Driven Process
• LVP Resilient Flooring
• ~75% of property enhancing program in Q4 2020
• Reduces maintenance costs and turn times
• Kitchen, Bathroom and General Upgrades
• ~25% of property enhancing program in Q4 2020
• Strong returns on incremental investment in the form of rent
premiums
• Systematically select neighborhoods where residents are willing to
pay a premium for upgrades
• Identify homes for value enhancing upgrade opportunities
• Projects completed over 15 markets
• Property enhancing platform is built, tested and scalable
• Superior finishes and materials – durable and attractive
Tremendous opportunity to optimize our existing properties
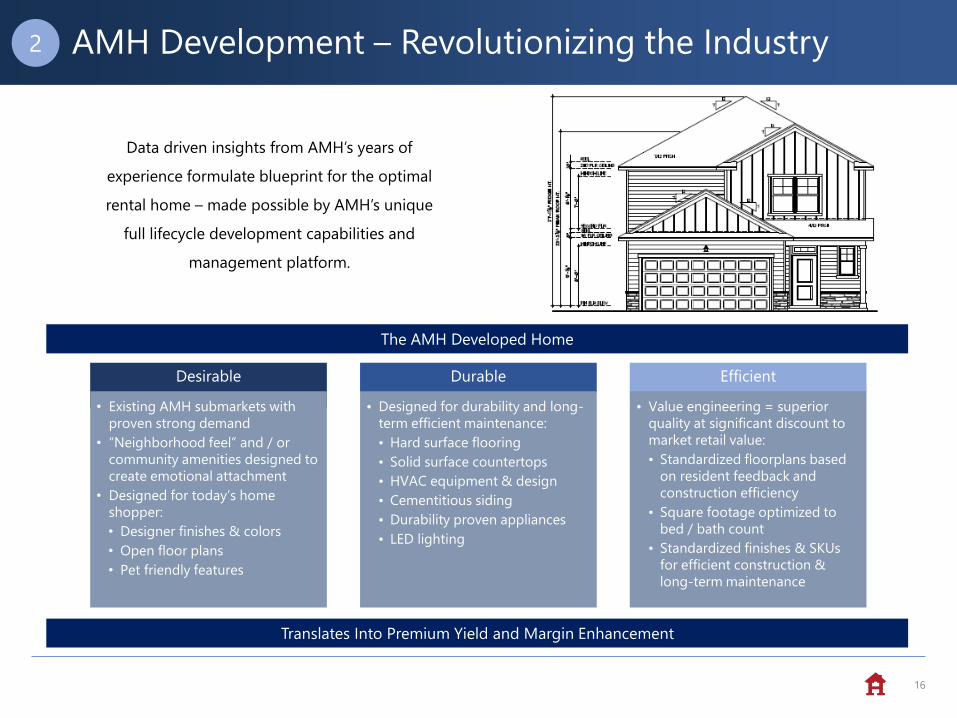
AMH Development – Revolutionizing the Industry
16
Data driven insights from AMH’s years of
experience formulate blueprint for the optimal
rental home – made possible by AMH’s unique
full lifecycle development capabilities and
management platform.
The AMH Developed Home
Desirable
• Existing AMH submarkets with
proven strong demand
• “Neighborhood feel” and / or
community amenities designed to
create emotional attachment
• Designed for today’s home
shopper:
• Designer finishes & colors
• Open floor plans
• Pet friendly features
Durable
• Designed for durability and long-
term efficient maintenance:
• Hard surface flooring
• Solid surface countertops
• HVAC equipment & design
• Cementitious siding
• Durability proven appliances
• LED lighting
Efficient
• Value engineering = superior
quality at significant discount to
market retail value:
• Standardized floorplans based
on resident feedback and
construction efficiency
• Square footage optimized to
bed / bath count
• Standardized finishes & SKUs
for efficient construction &
long-term maintenance
2
Translates Into Premium Yield and Margin Enhancement
17
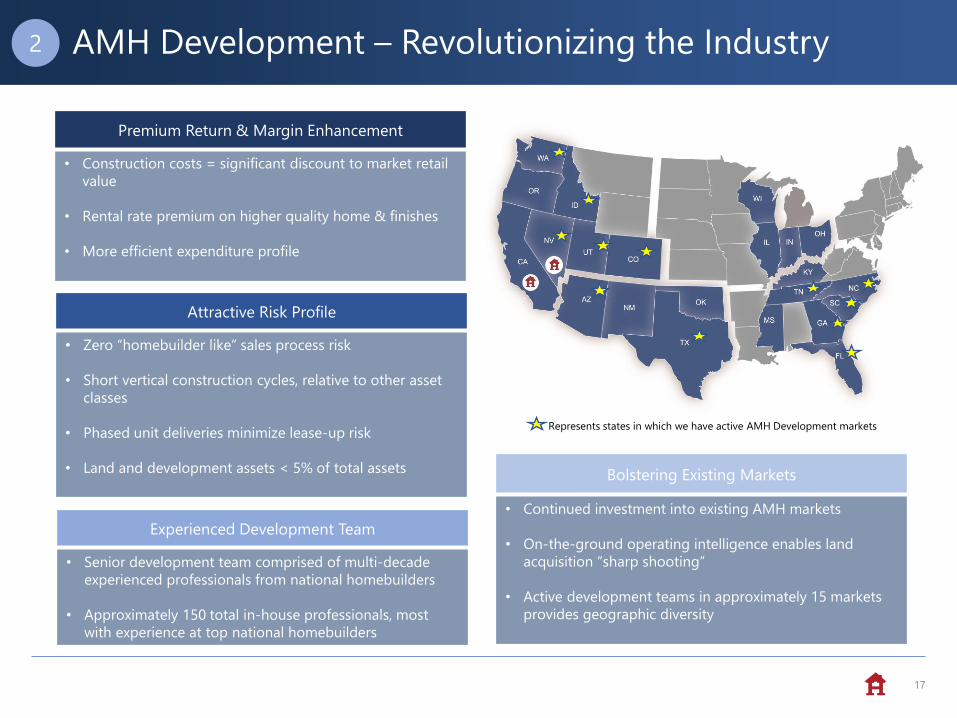
Premium Return & Margin Enhancement
• Construction costs = significant discount to market retail
value
• Rental rate premium on higher quality home & finishes
• More efficient expenditure profile
Attractive Risk Profile
• Zero “homebuilder like” sales process risk
• Short vertical construction cycles, relative to other asset
classes
• Phased unit deliveries minimize lease-up risk
• Land and development assets < 5% of total assets Bolstering Existing Markets
• Continued investment into existing AMH markets
• On-the-ground operating intelligence enables land
acquisition “sharp shooting”
• Active development teams in approximately 15 markets
provides geographic diversity
Experienced Development Team
• Senior development team comprised of multi-decade
experienced professionals from national homebuilders
• Approximately 150 total in-house professionals, most
with experience at top national homebuilders
AMH Development – Revolutionizing the Industry2
Represents states in which we have active AMH Development markets
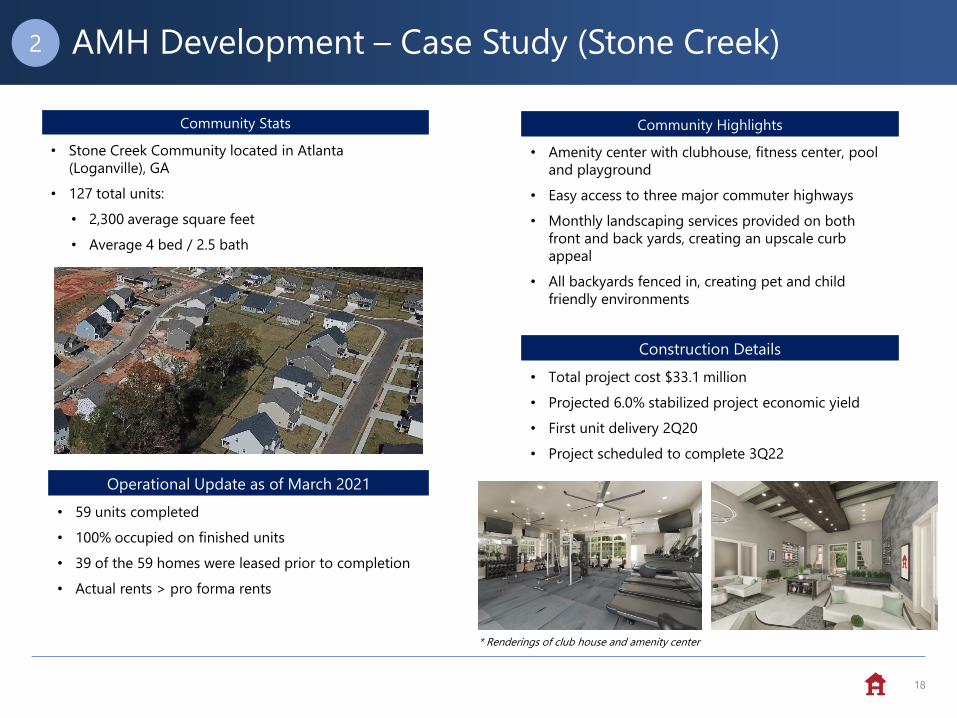
Community Stats
• Stone Creek Community located in Atlanta
(Loganville), GA
• 127 total units:
• 2,300 average square feet
• Average 4 bed / 2.5 bath
AMH Development – Case Study (Stone Creek)
18
2
Construction Details
• Total project cost $33.1 million
• Projected 6.0% stabilized project economic yield
• First unit delivery 2Q20
• Project scheduled to complete 3Q22
Operational Update as of March 2021
• 59 units completed
• 100% occupied on finished units
• 39 of the 59 homes were leased prior to completion
• Actual rents > pro forma rents
* Renderings of club house and amenity center
Community Highlights
• Amenity center with clubhouse, fitness center, pool
and playground
• Easy access to three major commuter highways
• Monthly landscaping services provided on both
front and back yards, creating an upscale curb
appeal
• All backyards fenced in, creating pet and child
friendly environments
19
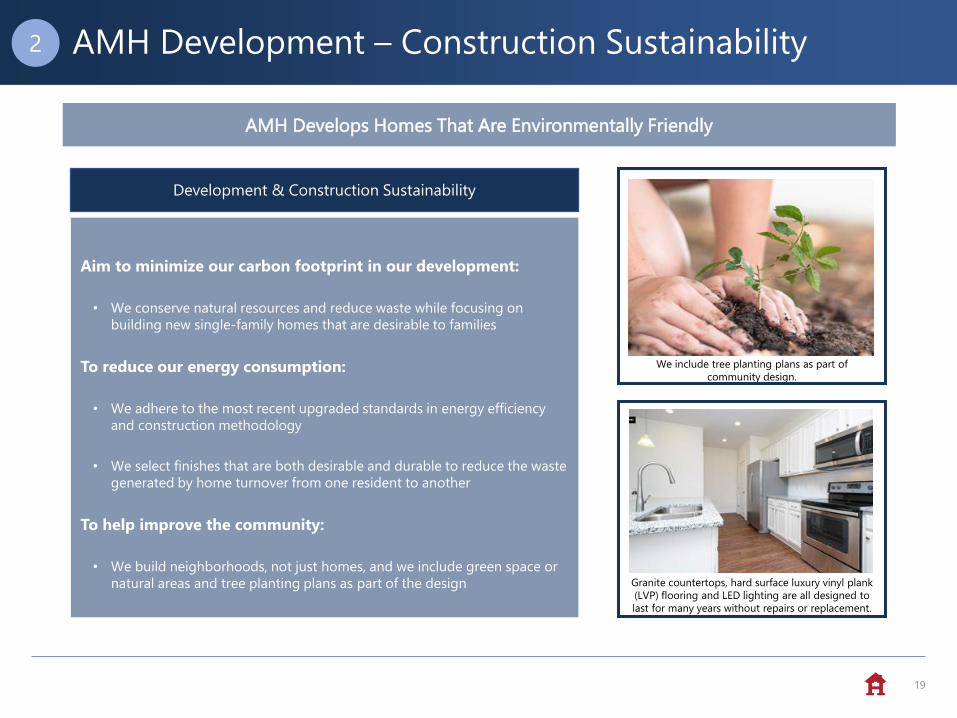
Granite countertops, hard surface luxury vinyl plank
(LVP) flooring and LED lighting are all designed to
last for many years without repairs or replacement.
We include tree planting plans as part of
community design.
AMH Develops Homes That Are Environmentally Friendly
Development & Construction Sustainability
Aim to minimize our carbon footprint in our development:
• We conserve natural resources and reduce waste while focusing on
building new single-family homes that are desirable to families
To reduce our energy consumption:
• We adhere to the most recent upgraded standards in energy efficiency
and construction methodology
• We select finishes that are both desirable and durable to reduce the waste
generated by home turnover from one resident to another
To help improve the community:
• We build neighborhoods, not just homes, and we include green space or
natural areas and tree planting plans as part of the design
AMH Development – Construction Sustainability2
20
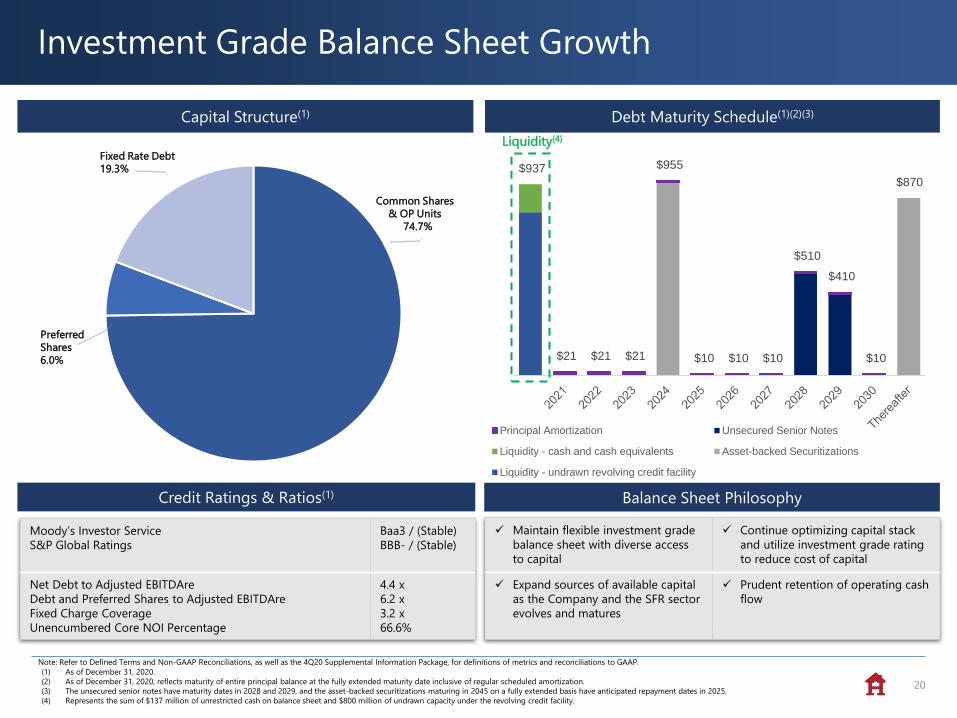
Capital Structure(1) Debt Maturity Schedule(1)(2)(3)
Fixed Rate Debt
19.3%
Preferred
Shares
6.0%
Common Shares
& OP Units
74.7%
Balance Sheet Philosophy
✓ Maintain flexible investment grade
balance sheet with diverse access
to capital
✓ Continue optimizing capital stack
and utilize investment grade rating
to reduce cost of capital
✓ Expand sources of available capital
as the Company and the SFR sector
evolves and matures
✓ Prudent retention of operating cash
flow
Credit Ratings & Ratios(1)
Moody’s Investor Service
S&P Global Ratings
Baa3 / (Stable)
BBB- / (Stable)
Net Debt to Adjusted EBITDAre
Debt and Preferred Shares to Adjusted EBITDAre
Fixed Charge Coverage
Unencumbered Core NOI Percentage
4.4 x
6.2 x
3.2 x
66.6%
(1) As of December 31, 2020.
(2) As of December 31, 2020, reflects maturity of entire principal balance at the fully extended maturity date inclusive of regular scheduled amortization.
(3) The unsecured senior notes have maturity dates in 2028 and 2029, and the asset-backed securitizations maturing in 2045 on a fully extended basis have anticipated repayment dates in 2025.
(4) Represents the sum of $137 million of unrestricted cash on balance sheet and $800 million of undrawn capacity under the revolving credit facility.
Note: Refer to Defined Terms and Non-GAAP Reconciliations, as well as the 4Q20 Supplemental Information Package, for definitions of metrics and reconciliations to GAAP.
Investment Grade Balance Sheet Growth
$937
$21 $21 $21
$955
$10 $10 $10
$510
$410
$10
$870
Principal Amortization Unsecured Senior Notes
Liquidity - cash and cash equivalents Asset-backed Securitizations
Liquidity - undrawn revolving credit facility
Liquidity(4)
21
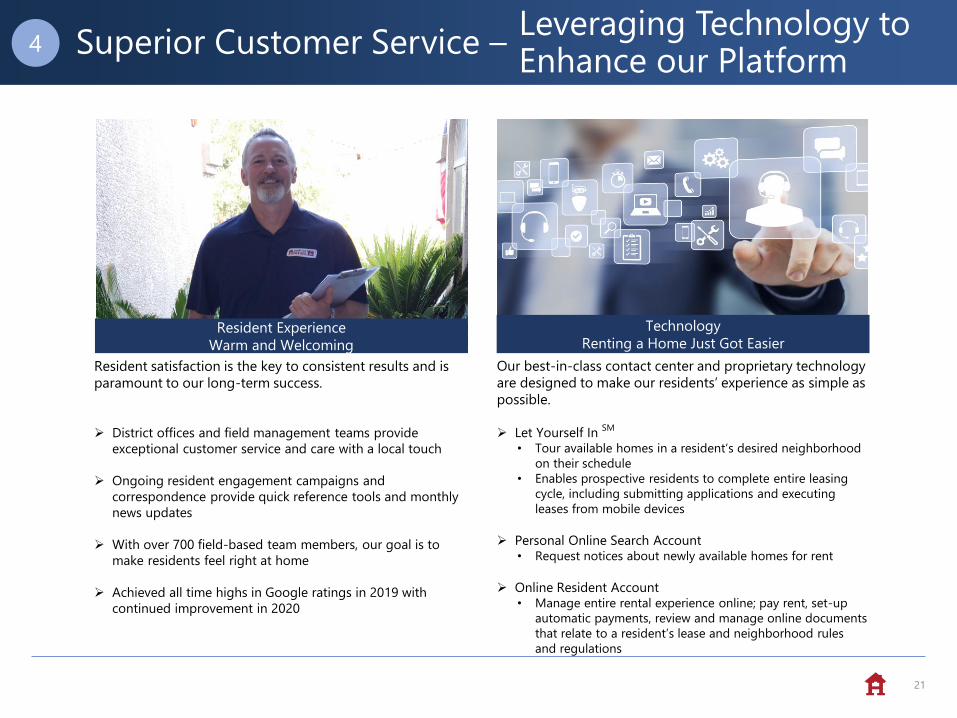
4 Superior Customer Service –Leveraging Technology toEnhance our Platform
Resident satisfaction is the key to consistent results and is
paramount to our long-term success.
➢ District offices and field management teams provide
exceptional customer service and care with a local touch
➢ Ongoing resident engagement campaigns and
correspondence provide quick reference tools and monthly
news updates
➢ With over 700 field-based team members, our goal is to
make residents feel right at home
➢ Achieved all time highs in Google ratings in 2019 with
continued improvement in 2020
Technology
Renting a Home Just Got Easier
Our best-in-class contact center and proprietary technology
are designed to make our residents’ experience as simple as
possible.
➢ Let Yourself In SM
• Tour available homes in a resident’s desired neighborhood
on their schedule
• Enables prospective residents to complete entire leasing
cycle, including submitting applications and executing
leases from mobile devices
➢ Personal Online Search Account• Request notices about newly available homes for rent
➢ Online Resident Account• Manage entire rental experience online; pay rent, set-up
automatic payments, review and manage online documents
that relate to a resident’s lease and neighborhood rules
and regulations
Resident Experience
Warm and Welcoming
22
AMH Today
The Market Opportunity
AMH’s Strategy to Drive Shareholder Value
AMH Strong Governance Practices
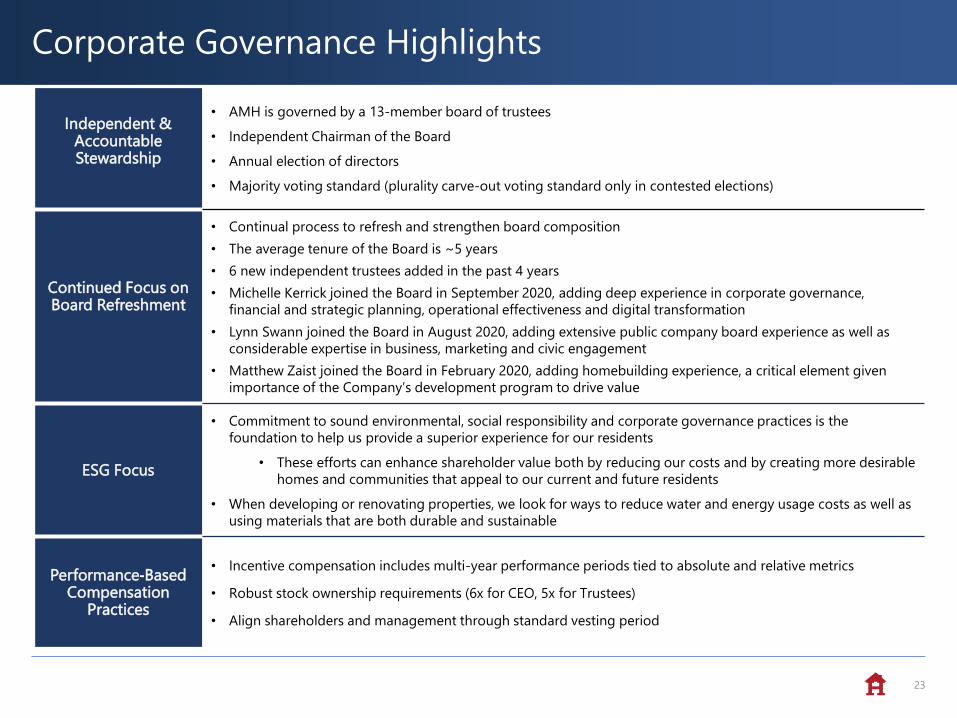
Corporate Governance Highlights
23
Independent & Accountable Stewardship
• AMH is governed by a 13‐member board of trustees
• Independent Chairman of the Board
• Annual election of directors
• Majority voting standard (plurality carve‐out voting standard only in contested elections)
Continued Focus on Board Refreshment
• Continual process to refresh and strengthen board composition
• The average tenure of the Board is ~5 years
• 6 new independent trustees added in the past 4 years
• Michelle Kerrick joined the Board in September 2020, adding deep experience in corporate governance,
financial and strategic planning, operational effectiveness and digital transformation
• Lynn Swann joined the Board in August 2020, adding extensive public company board experience as well as
considerable expertise in business, marketing and civic engagement
• Matthew Zaist joined the Board in February 2020, adding homebuilding experience, a critical element given
importance of the Company’s development program to drive value
ESG Focus
• Commitment to sound environmental, social responsibility and corporate governance practices is the
foundation to help us provide a superior experience for our residents
• These efforts can enhance shareholder value both by reducing our costs and by creating more desirable
homes and communities that appeal to our current and future residents
• When developing or renovating properties, we look for ways to reduce water and energy usage costs as well as
using materials that are both durable and sustainable
Performance-BasedCompensation
Practices
• Incentive compensation includes multi-year performance periods tied to absolute and relative metrics
• Robust stock ownership requirements (6x for CEO, 5x for Trustees)
• Align shareholders and management through standard vesting period
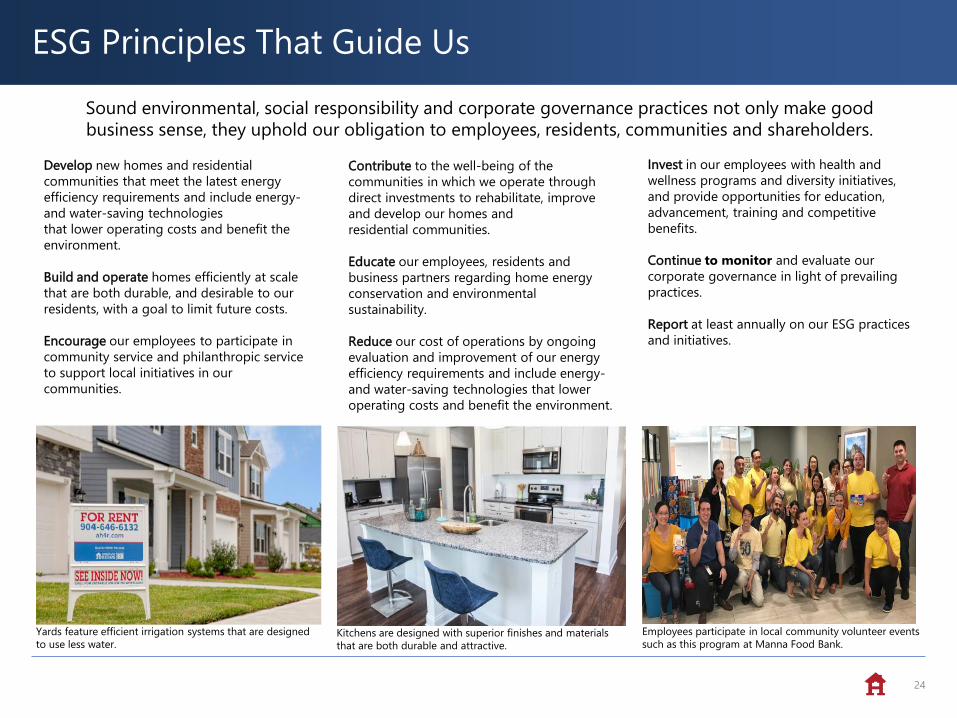
ESG Principles That Guide Us
24
Sound environmental, social responsibility and corporate governance practices not only make good
business sense, they uphold our obligation to employees, residents, communities and shareholders.
Contribute to the well-being of the
communities in which we operate through
direct investments to rehabilitate, improve
and develop our homes and
residential communities.
Educate our employees, residents and
business partners regarding home energy
conservation and environmental
sustainability.
Reduce our cost of operations by ongoing
evaluation and improvement of our energy
efficiency requirements and include energy-
and water-saving technologies that lower
operating costs and benefit the environment.
Develop new homes and residential
communities that meet the latest energy
efficiency requirements and include energy-
and water-saving technologies
that lower operating costs and benefit the
environment.
Build and operate homes efficiently at scale
that are both durable, and desirable to our
residents, with a goal to limit future costs.
Encourage our employees to participate in
community service and philanthropic service
to support local initiatives in our
communities.
Invest in our employees with health and
wellness programs and diversity initiatives,
and provide opportunities for education,
advancement, training and competitive
benefits.
Continue to monitor and evaluate our
corporate governance in light of prevailing
practices.
Report at least annually on our ESG practices
and initiatives.
Employees participate in local community volunteer events
such as this program at Manna Food Bank.
Yards feature efficient irrigation systems that are designed
to use less water.Kitchens are designed with superior finishes and materials
that are both durable and attractive.
APPENDIX
25
Defined Terms and Non-GAAP Reconciliations
26
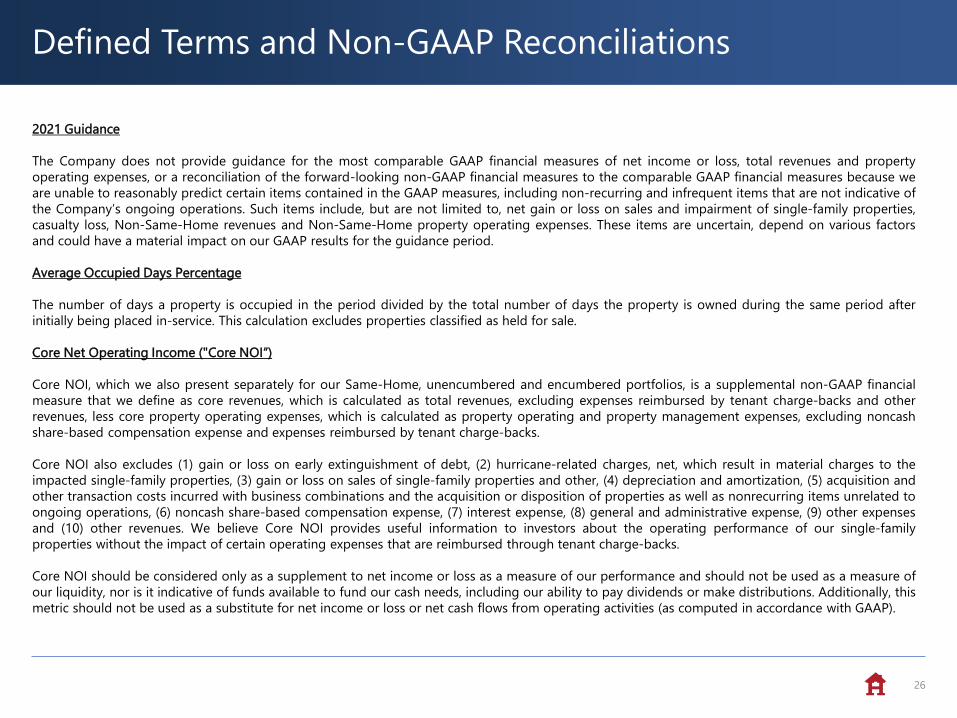
2021 Guidance
The Company does not provide guidance for the most comparable GAAP financial measures of net income or loss, total revenues and property
operating expenses, or a reconciliation of the forward-looking non-GAAP financial measures to the comparable GAAP financial measures because we
are unable to reasonably predict certain items contained in the GAAP measures, including non-recurring and infrequent items that are not indicative of
the Company’s ongoing operations. Such items include, but are not limited to, net gain or loss on sales and impairment of single-family properties,
casualty loss, Non-Same-Home revenues and Non-Same-Home property operating expenses. These items are uncertain, depend on various factors
and could have a material impact on our GAAP results for the guidance period.
Average Occupied Days Percentage
The number of days a property is occupied in the period divided by the total number of days the property is owned during the same period after
initially being placed in-service. This calculation excludes properties classified as held for sale.
Core Net Operating Income ("Core NOI“)
Core NOI, which we also present separately for our Same-Home, unencumbered and encumbered portfolios, is a supplemental non-GAAP financial
measure that we define as core revenues, which is calculated as total revenues, excluding expenses reimbursed by tenant charge-backs and other
revenues, less core property operating expenses, which is calculated as property operating and property management expenses, excluding noncash
share-based compensation expense and expenses reimbursed by tenant charge-backs.
Core NOI also excludes (1) gain or loss on early extinguishment of debt, (2) hurricane-related charges, net, which result in material charges to the
impacted single-family properties, (3) gain or loss on sales of single-family properties and other, (4) depreciation and amortization, (5) acquisition and
other transaction costs incurred with business combinations and the acquisition or disposition of properties as well as nonrecurring items unrelated to
ongoing operations, (6) noncash share-based compensation expense, (7) interest expense, (8) general and administrative expense, (9) other expenses
and (10) other revenues. We believe Core NOI provides useful information to investors about the operating performance of our single-family
properties without the impact of certain operating expenses that are reimbursed through tenant charge-backs.
Core NOI should be considered only as a supplement to net income or loss as a measure of our performance and should not be used as a measure of
our liquidity, nor is it indicative of funds available to fund our cash needs, including our ability to pay dividends or make distributions. Additionally, this
metric should not be used as a substitute for net income or loss or net cash flows from operating activities (as computed in accordance with GAAP).
Defined Terms and Non-GAAP Reconciliations
27
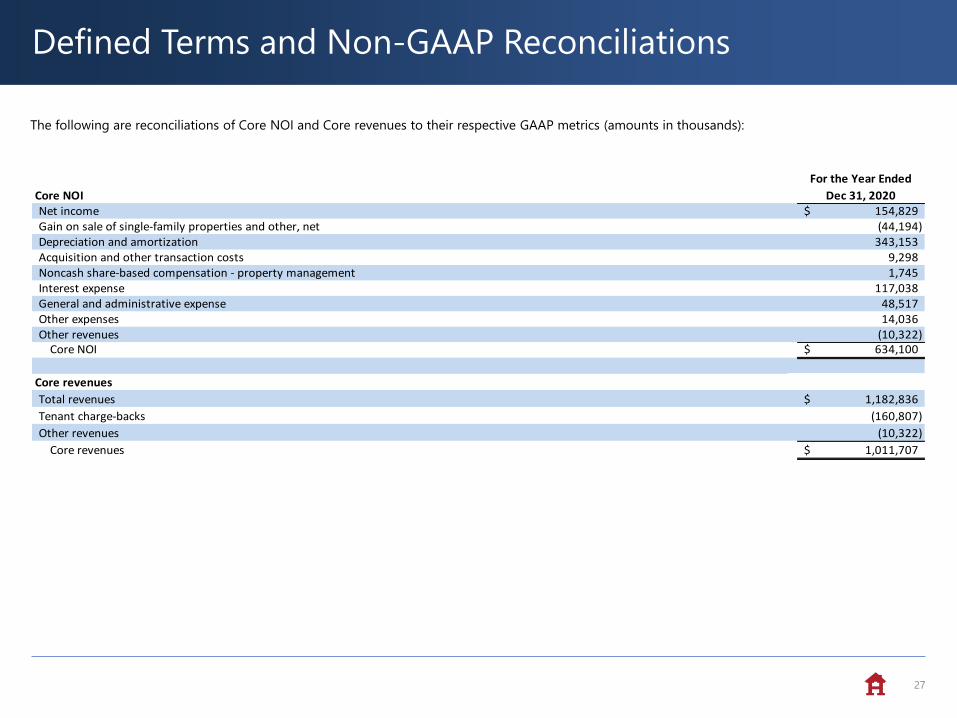
Core NOI
For the Year Ended
Dec 31, 2020Net income 154,829$ Gain on sale of single-family properties and other, net (44,194) Depreciation and amortization 343,153 Acquisition and other transaction costs 9,298 Noncash share-based compensation - property management 1,745 Interest expense 117,038 General and administrative expense 48,517 Other expenses 14,036 Other revenues (10,322)
Core NOI 634,100$
Core revenues
Total revenues 1,182,836$
Tenant charge-backs (160,807)
Other revenues (10,322)
Core revenues 1,011,707$
The following are reconciliations of Core NOI and Core revenues to their respective GAAP metrics (amounts in thousands):
Defined Terms and Non-GAAP Reconciliations
28
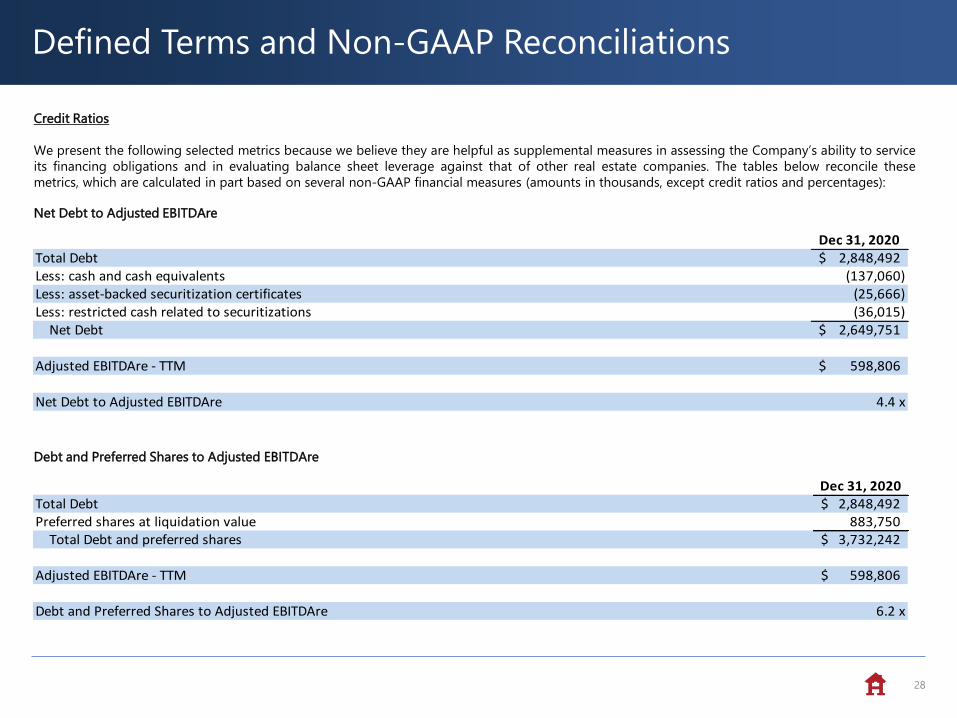
Credit Ratios
We present the following selected metrics because we believe they are helpful as supplemental measures in assessing the Company’s ability to service
its financing obligations and in evaluating balance sheet leverage against that of other real estate companies. The tables below reconcile these
metrics, which are calculated in part based on several non-GAAP financial measures (amounts in thousands, except credit ratios and percentages):
Debt and Preferred Shares to Adjusted EBITDAre
Net Debt to Adjusted EBITDAre
Dec 31, 2020Total Debt 2,848,492$ Preferred shares at liquidation value 883,750 Total Debt and preferred shares 3,732,242$
Adjusted EBITDAre - TTM 598,806$
Debt and Preferred Shares to Adjusted EBITDAre 6.2 x
Dec 31, 2020Total Debt 2,848,492$ Less: cash and cash equivalents (137,060) Less: asset-backed securitization certificates (25,666) Less: restricted cash related to securitizations (36,015) Net Debt 2,649,751$
Adjusted EBITDAre - TTM 598,806$
Net Debt to Adjusted EBITDAre 4.4 x
Defined Terms and Non-GAAP Reconciliations
29
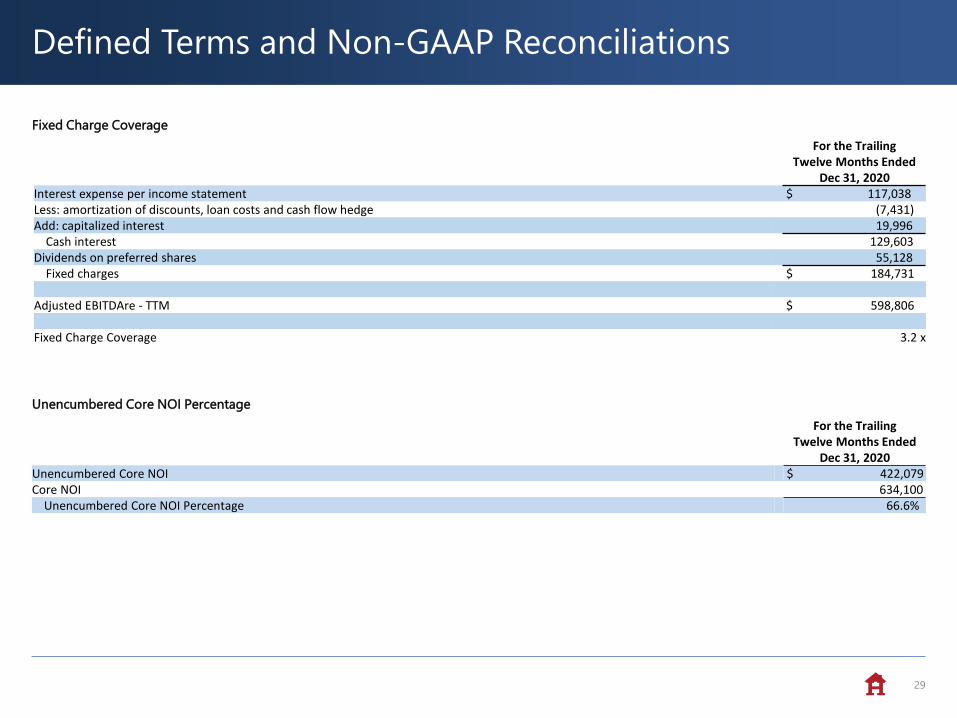
Unencumbered Core NOI Percentage
For the Trailing Twelve Months Ended
Dec 31, 2020Unencumbered Core NOI $ 422,079Core NOI 634,100
Unencumbered Core NOI Percentage 66.6%
Fixed Charge Coverage
For the Trailing Twelve Months Ended
Dec 31, 2020Interest expense per income statement $ 117,038Less: amortization of discounts, loan costs and cash flow hedge (7,431)Add: capitalized interest 19,996
Cash interest 129,603 Dividends on preferred shares 55,128
Fixed charges $ 184,731
Adjusted EBITDAre - TTM $ 598,806
Fixed Charge Coverage 3.2 x
Defined Terms and Non-GAAP Reconciliations
30
EBITDA / EBITDAre / Adjusted EBITDAre / Fully Adjusted EBITDAre / Fully Adjusted EBITDAre Margin
EBITDA is defined as earnings before interest, taxes, depreciation and amortization. EBITDA is a non-GAAP financial measure and is used by us and
others as a supplemental measure of performance. EBITDAre is a supplemental non-GAAP financial measure, which we calculate in accordance with
the definition approved by the National Association of Real Estate Investment Trusts (“NAREIT”) by adjusting EBITDA for the net gain or loss on sales /
impairment of single-family properties and other and adjusting for unconsolidated partnerships and joint ventures on the same basis. Adjusted
EBITDAre is a supplemental non-GAAP financial measure calculated by adjusting EBITDAre for (1) acquisition and other transaction costs incurred with
business combinations and the acquisition or disposition of properties as well as nonrecurring items unrelated to ongoing operations, (2) noncash
share-based compensation expense, (3) hurricane-related charges, net, which result in material charges to the impacted single-family properties, and
(4) gain or loss on early extinguishment of debt. Fully Adjusted EBITDAre is a supplemental non-GAAP financial measure calculated by adjusting
Adjusted EBITDAre for (1) Recurring Capital Expenditures and (2) leasing costs. Fully Adjusted EBITDAre Margin is a supplemental non-GAAP financial
measure calculated as Fully Adjusted EBITDAre divided by total revenues, net of tenant charge-backs and adjusted for unconsolidated joint ventures.
We believe these metrics provide useful information to investors because they exclude the impact of various income and expense items that are not
indicative of operating performance.
Defined Terms and Non-GAAP Reconciliations
31
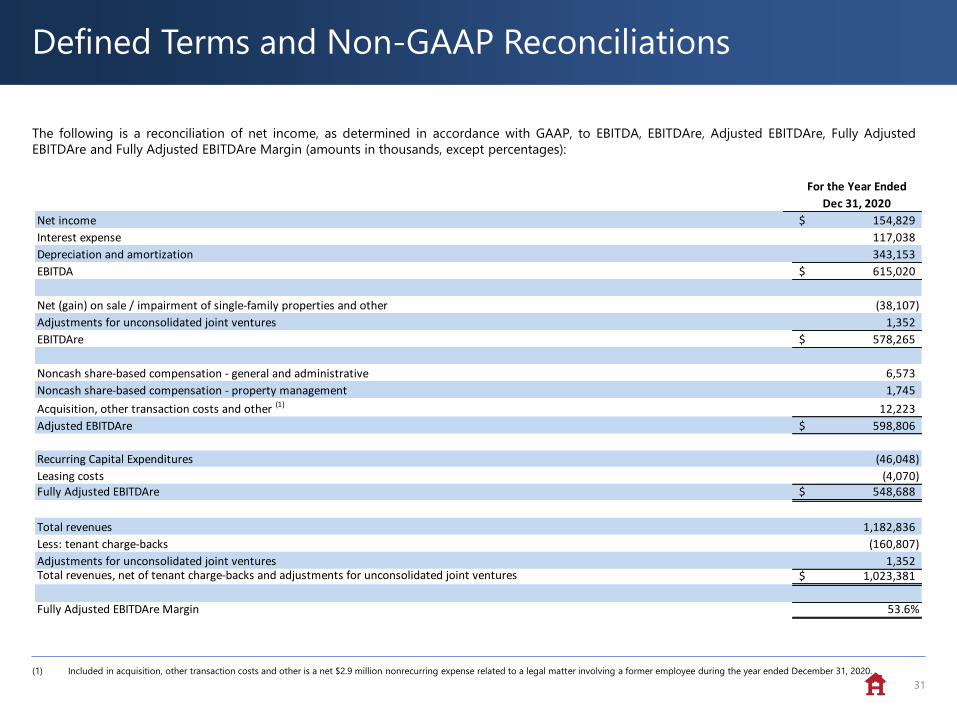
The following is a reconciliation of net income, as determined in accordance with GAAP, to EBITDA, EBITDAre, Adjusted EBITDAre, Fully Adjusted
EBITDAre and Fully Adjusted EBITDAre Margin (amounts in thousands, except percentages):
For the Year Ended
Dec 31, 2020
Net income 154,829$
Interest expense 117,038
Depreciation and amortization 343,153
EBITDA 615,020$
Net (gain) on sale / impairment of single-family properties and other (38,107)
Adjustments for unconsolidated joint ventures 1,352
EBITDAre 578,265$
Noncash share-based compensation - general and administrative 6,573
Noncash share-based compensation - property management 1,745
Acquisition, other transaction costs and other (1) 12,223
Adjusted EBITDAre 598,806$
Recurring Capital Expenditures (46,048)
Leasing costs (4,070) Fully Adjusted EBITDAre 548,688$
Total revenues 1,182,836
Less: tenant charge-backs (160,807)
Adjustments for unconsolidated joint ventures 1,352 Total revenues, net of tenant charge-backs and adjustments for unconsolidated joint ventures 1,023,381$
Fully Adjusted EBITDAre Margin 53.6%
(1) Included in acquisition, other transaction costs and other is a net $2.9 million nonrecurring expense related to a legal matter involving a former employee during the year ended December 31, 2020.
Defined Terms and Non-GAAP Reconciliations
32
FFO / Core FFO / Adjusted FFO attributable to common share and unit holders
FFO attributable to common share and unit holders is a non-GAAP financial measure that we calculate in accordance with the definition approved by
NAREIT, which defines FFO as net income or loss calculated in accordance with GAAP, excluding gains and losses from sales or impairment of real estate,
plus real estate-related depreciation and amortization (excluding amortization of deferred financing costs and depreciation of non-real estate assets),
and after adjustments for unconsolidated partnerships and joint ventures to reflect FFO on the same basis.
Core FFO attributable to common share and unit holders is a non-GAAP financial measure that we use as a supplemental measure of our performance.
We compute this metric by adjusting FFO attributable to common share and unit holders for (1) acquisition and other transaction costs incurred with
business combinations and the acquisition or disposition of properties as well as nonrecurring items unrelated to ongoing operations, (2) noncash
share-based compensation expense, (3) hurricane-related charges, net, which result in material charges to the impacted single-family properties, and (4)
gain or loss on early extinguishment of debt.
Adjusted FFO attributable to common share and unit holders is a non-GAAP financial measure that we use as a supplemental measure of our
performance. We compute this metric by adjusting Core FFO attributable to common share and unit holders for (1) Recurring Capital Expenditures that
are necessary to help preserve the value and maintain functionality of our properties and (2) capitalized leasing costs incurred during the period. As a
portion of our homes are recently developed, acquired and/or renovated, we estimate Recurring Capital Expenditures for our entire portfolio by
multiplying (a) current period actual Recurring Capital Expenditures per Same-Home Property by (b) our total number of properties, excluding newly
acquired non-stabilized properties and properties classified as held for sale.
We present FFO attributable to common share and unit holders, as well as on a per FFO share and unit basis, because we consider this metric to be an
important measure of the performance of real estate companies, as do many investors and analysts in evaluating the Company. We believe that FFO
attributable to common share and unit holders provides useful information to investors because this metric excludes depreciation, which is included in
computing net income and assumes the value of real estate diminishes predictably over time. We believe that real estate values fluctuate due to market
conditions and in response to inflation. We also believe that Core FFO and Adjusted FFO attributable to common share and unit holders, as well as on a
per FFO share and unit basis, provide useful information to investors because they allow investors to compare our operating performance to prior
reporting periods without the effect of certain items that, by nature, are not comparable from period to period.
FFO, Core FFO and Adjusted FFO attributable to common share and unit holders are not a substitute for net income or net cash provided by operating
activities, each as determined in accordance with GAAP, as a measure of our operating performance, liquidity or ability to pay dividends. These metrics
also are not necessarily indicative of cash available to fund future cash needs. Because other REITs may not compute these measures in the same
manner, they may not be comparable among REITs.
Defined Terms and Non-GAAP Reconciliations
33
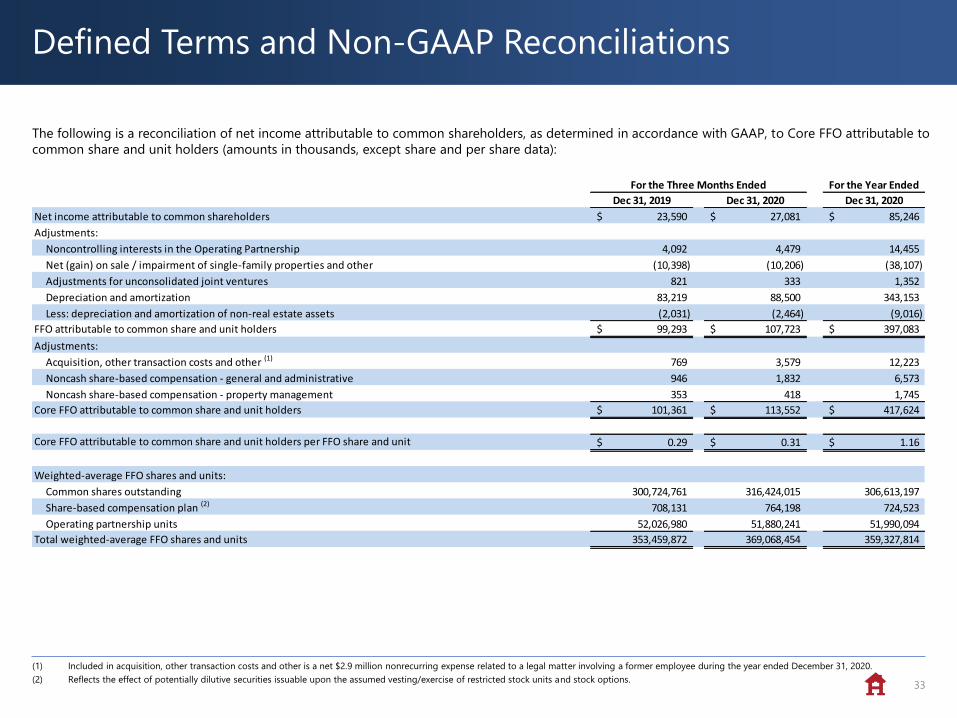
The following is a reconciliation of net income attributable to common shareholders, as determined in accordance with GAAP, to Core FFO attributable to
common share and unit holders (amounts in thousands, except share and per share data):
(1) Included in acquisition, other transaction costs and other is a net $2.9 million nonrecurring expense related to a legal matter involving a former employee during the year ended December 31, 2020.
(2) Reflects the effect of potentially dilutive securities issuable upon the assumed vesting/exercise of restricted stock units and stock options.
For the Year Ended
Dec 31, 2019 Dec 31, 2020 Dec 31, 2020
Net income attributable to common shareholders 23,590$ 27,081$ 85,246$
Adjustments:
Noncontrolling interests in the Operating Partnership 4,092 4,479 14,455
Net (gain) on sale / impairment of single-family properties and other (10,398) (10,206) (38,107)
Adjustments for unconsolidated joint ventures 821 333 1,352
Depreciation and amortization 83,219 88,500 343,153
Less: depreciation and amortization of non-real estate assets (2,031) (2,464) (9,016)
FFO attributable to common share and unit holders 99,293$ 107,723$ 397,083$
Adjustments:
Acquisition, other transaction costs and other (1) 769 3,579 12,223
Noncash share-based compensation - general and administrative 946 1,832 6,573
Noncash share-based compensation - property management 353 418 1,745
Core FFO attributable to common share and unit holders 101,361$ 113,552$ 417,624$
Core FFO attributable to common share and unit holders per FFO share and unit 0.29$ 0.31$ 1.16$
Weighted-average FFO shares and units:
Common shares outstanding 300,724,761 316,424,015 306,613,197
Share-based compensation plan (2) 708,131 764,198 724,523
Operating partnership units 52,026,980 51,880,241 51,990,094
Total weighted-average FFO shares and units 353,459,872 369,068,454 359,327,814
For the Three Months Ended
Defined Terms and Non-GAAP Reconciliations
34
Property Enhancing Capex
Includes elective capital expenditures to enhance the operating profile of a property, such as investments to increase future revenues or reduce
maintenance expenditures.
Recurring Capital Expenditures
For our Same-Home portfolio, Recurring Capital Expenditures includes replacement costs and other capital expenditures recorded during the period
that are necessary to help preserve the value and maintain functionality of our properties. For our total portfolio, we calculate Recurring Capital
Expenditures by multiplying (a) current period actual Recurring Capital Expenditures per Same-Home property by (b) our total number of properties,
excluding newly acquired non-stabilized properties and properties classified as held for sale.
Retained Cash Flow
Retained Cash Flow is a non-GAAP financial measure that we believe is helpful as a supplemental measure in assessing the Company’s liquidity. This
metric is computed by reducing Adjusted FFO attributable to common share and unit holders by common distributions.
Same-Home Property
A property is classified as Same-Home if it has been stabilized longer than 90 days prior to the beginning of the earliest period presented under
comparison. A property is removed from Same-Home if it has been classified as held for sale or has been taken out of service as a result of a casualty
loss.
Stabilized Property
A property acquired individually (i.e., not through a bulk purchase) is classified as stabilized once it has been renovated by the Company or newly
constructed and then initially leased or available for rent for a period greater than 90 days. Properties acquired through a bulk purchase are first
considered non-stabilized, as an entire group, until (1) we have owned them for an adequate period of time to allow for complete on-boarding to our
operating platform, and (2) a substantial portion of the properties have experienced tenant turnover at least once under our ownership, providing the
opportunity for renovations and improvements to meet our property standards. After such time has passed, properties acquired through a bulk
purchase are then evaluated on an individual property basis under our standard stabilization criteria.
Defined Terms and Non-GAAP Reconciliations
35
Total Debt
Includes principal balances on asset-backed securitizations, unsecured senior notes and borrowings outstanding under our revolving credit facility as
of period end, and excludes unamortized discounts and unamortized deferred financing costs.
Total Market Capitalization
Includes the market value of all outstanding common shares and operating partnership units (based on the NYSE AMH Class A common share closing
price as of period end), the current liquidation value of preferred shares as of period end and Total Debt.