fund investor 2021 2021
TRANSCRIPT

000
111
222
222F U N D I N V E S T O R
01/21
Where to Invest in 2021 and Beyond
Opportunities are still out there for people open to them. Keep moving ahead even through the uncertainty.
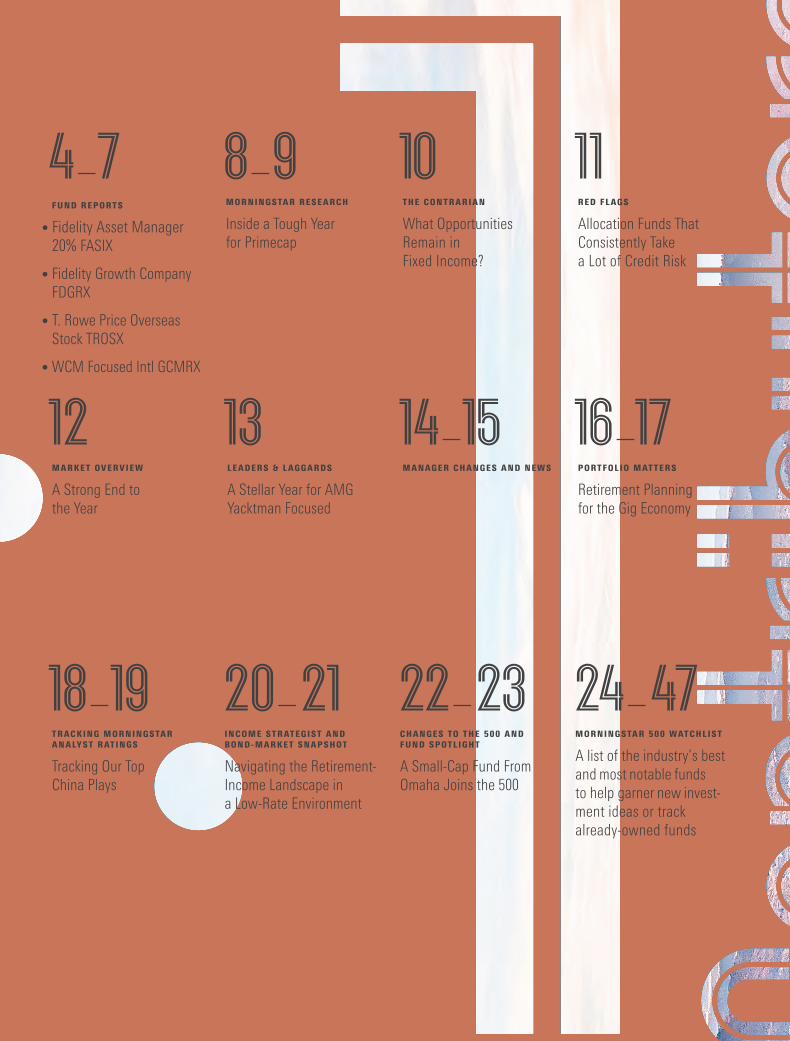
4-7 8-9 10 11FUND REPORTS
• Fidelity Asset Manager 20% FASIX
• Fidelity Growth Company FDGRX
• T. Rowe Price Overseas Stock TROSX
• WCM Focused Intl GCMRX
MORNINGSTAR RESEARCH
Inside a Tough Year for Primecap
THE CONTRARIAN
What Opportunities Remain in Fixed Income?
RED FLAGS
Allocation Funds That Consistently Take a Lot of Credit Risk
12 13 14-15 16-17MARKET OVERVIEW
A Strong End to the Year
LEADERS & LAGGARDS
A Stellar Year for AMG Yacktman Focused
MANAGER CHANGES AND NEWS PORTFOLIO MATTERS
Retirement Planning for the Gig Economy
18-19 20-21 22-23 24-47TRACKING MORNINGSTAR ANALYST RATINGS
Tracking Our Top China Plays
INCOME STRATEGIST AND BOND-MARKET SNAPSHOT
Navigating the Retirement- Income Landscape in a Low-Rate Environment
CHANGES TO THE 500 AND FUND SPOTLIGHT
A Small-Cap Fund From Omaha Joins the 500
MORNINGSTAR 500 WATCHLIST
A list of the industry’s best and most notable funds to help garner new invest-ment ideas or track already-owned funds
Good riddance 2020! I’m still trying to make sense of that awful year, but let’s pause to sum up the markets and the economy at this point.
As I write this, unemployment is still worse than it ever got in the 2008–09 recession. And with hospitals at capacity, it’s quite likely that the jobs picture is going to get worse this winter before it gets better.
But vaccines are coming, and that means the economy should recover as the nation’s health recovers. Exactly how fast America will get vaccinated and how long it will take to stop the spread of the coronavirus is unclear even if the trend is positive.
After a decade of growth stocks beating value, we got treated in 2020 to growth stocks absolutely crushing value to a degree not seen since 1999. The typical mid-cap growth fund gained 39%, while the typical mid-cap value fund is up a mere 1%. The story is similar for large caps and small caps, though not quite as extreme.
With a severe recession that came out of the blue, it’s quite logical that value stocks would be hurting, as they are more economically sensitive than growth. And it also is logical that growth companies that help us in this new reality would surge. Zoom ZM helps people work from home, Amazon.com AMZN helps people shop from home, and so on. But many other growth stocks came along for the ride in the rally, and we’re left with a massive divide between growth and value. The Fed’s extreme accommodation in the face of the reces-sion naturally underpinned stocks across the board.
Meanwhile, bonds actually behaved logically. High quality rallied in the face of a shrinking economy while high yield (low quality) sold off sharply and then rebounded. The upshot, though, is fairly low yields and therefore low return prospects.
With that background, I think caution is in order, but it makes sense to stay on your plan and pick your spots for adding equity funds.
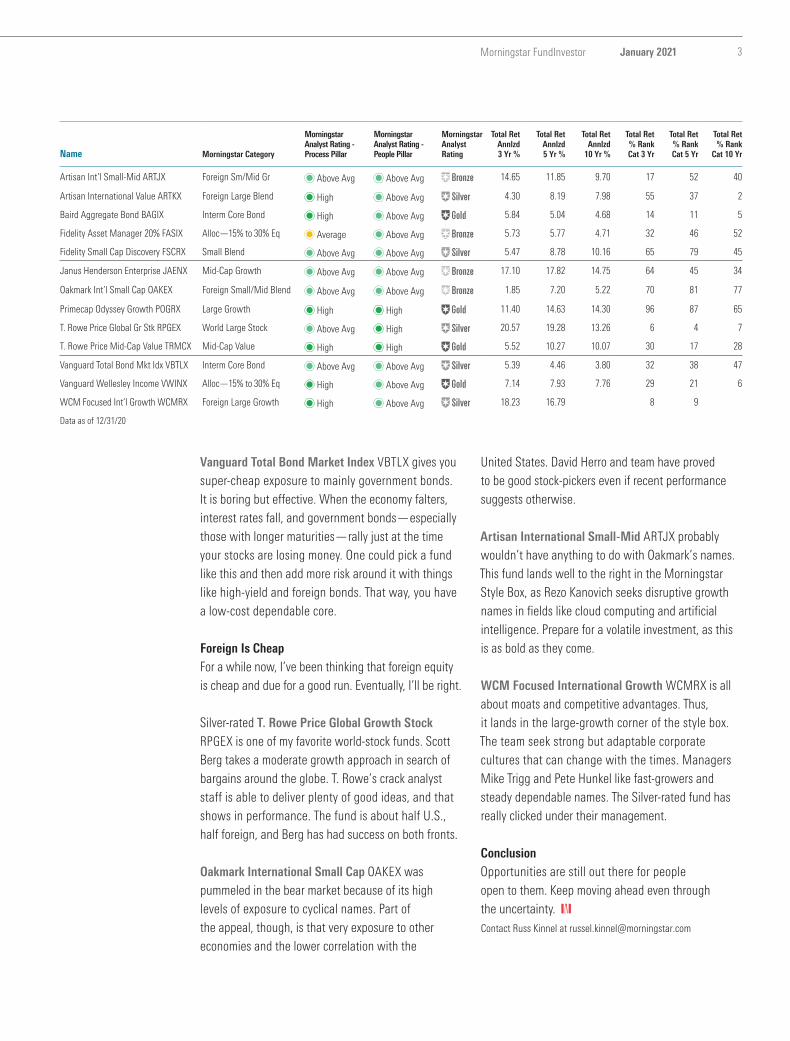
Reopened Morningstar MedalistsLet’s start with one of my favorite hunting grounds: reopened funds.
Closed funds typically reopen because outflows have brought asset levels down to where management thinks it can reopen and even grow without impeding performance. Secondarily, they sometimes reopen in hopes of stemming the tide of outflows, because outflows can be detrimental to performance.
Either way, when medalist funds reopen, it is an appealing contrary indicator. It tells me that the fund’s strategy is out of favor, but the medalist rating tells me that the fundamentals remain strong. As it happens, four medalists reopened in 2020. Let’s review, starting with the highest-rated and moving down from there.
T. Rowe Price Mid-Cap Value TRMCX manager David Wallack seeks stocks trading on cheap multiples but insists on healthy balance sheets and good management. Over time, that’s worked well, but there’s not a lot of interest in the meager returns generated in mid-value these days even at funds with
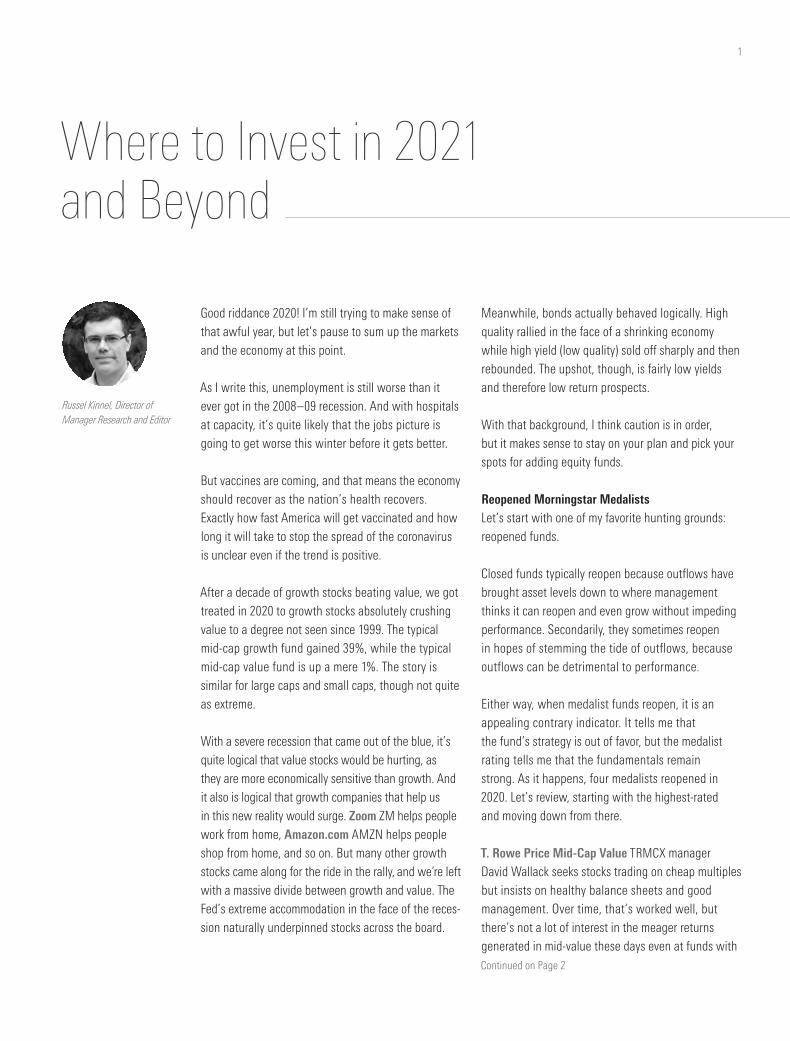
Russel Kinnel, Director of Manager Research and Editor
Continued on Page 2
Where to Invest in 2021 and Beyond
1
2
Morningstar Analyst Ratings of Gold, like this one. The fund hasn’t had a year of net inflows since 2010, partly because value was out of favor and partly because the fund was closed for most of that time. But that’s music to my ears. An excellent fund with a seasoned manager whose style is unloved? Yes, please.
There are some similarities with Artisan International Value ARTKX, which reopened in March 2020. David Samra is also a skilled, seasoned manager with a great track record. The fund did have net inflows as recently as 2017, however, and Samra runs a more focused portfolio. A bevy of financials limited the fund to a tiny 1% gain in 2020, but we’re not reading too much into a poor year.
Fidelity Small Cap Discovery FSCRX is a value-leaning small-cap blend fund, so it’s no surprise why it’s getting the cold shoulder from investors. Derek Janssen emphasizes durable business models with predictable earnings. Turnover of 34% is consistent with that emphasis on long-term stability. The fund reopened after assets dipped under $2 billion from a peak of $7 billion in 2013.
Janus Henderson Enterprise JAENX is still a big fund, but it reopened on Dec. 21, 2020, three years after it closed. I assume that this is a case of wanting to stem outflows rather than actually wanting more assets to manage. The fund has had $3.3 billion in net outflows in 2020. Its total returns in 2020 were much better than the above fund, but its relative performance was much worse. This mid-growth fund’s 19.2% gain in 2020 was only half that of peers and benchmark. Brian Demain and Cody Wheaton were more inter-ested in insurance companies than red-hot names like Tesla TSLA and Zoom. Needless to say, that was the wrong call—for 2020 at least. They did hold technology and healthcare weightings as large as their typical peer’s, but it was those super-fast growers that powered returns in 2020. The next few years may suit this strategy better.
My Favorites Do a PratfallAs longtime readers know, Primecap funds are among the ones I recommend most frequently. And they had a dismal 2020 owing to a lack of FAANG stocks (Facebook FB, Amazon.com, Apple AAPL, Netflix NFLX, and Google GOOG [aka Alphabet]) and owning some travel stocks that got absolutely hammered. But I’m still a believer even as I’m cautious about growth. See the next article for my case for Primecap.
An Ounce of PreventionAfter a crazy year like 2020, it’s a good idea to make sure your defensive side holds up. One option that still has upside is an allocation fund that is mostly bonds.
Fidelity Asset Manager 20% FASIX is, as the name suggests, 20% equities, with the rest run by Fidelity’s taxable-bond side. Fidelity’s fixed-income team is topnotch. It is strong pretty much across the board. The modest equity kicker gives it a bit of increased return potential without too much additional risk.
Vanguard Wellesley Income VWINX is an allocation stalwart. Its value leanings make it feel a bit contrarian, too, at this point. Some have drawn parallels with 1999, but I don’t buy that too much. But I would point out that value was cheap then because growth stocks took all the oxygen in the room, and as a result, value held up beautifully in the ensuing bear market. I’m sure we won’t have an exact repeat, but value does seem pretty cheap.
High-quality bonds are another defensive staple. Long Treasuries were the champs of the COVID-19 bear market, but even moving beyond them into high-quality mortgages and corporate bonds can provide some defense.
Baird Aggregate Bond BAGIX, led by Mary Ellen Stanek, takes a disciplined approach that you can depend on. The fund sticks mainly to high-quality corporates and securitized debt. It avoids big bets on single issuers and most forms of big risk-taking, yet it consistently beats its peers.
Where to Invest in 2021 and Beyond Continued from Page 1
3Morningstar FundInvestor January 2021
Vanguard Total Bond Market Index VBTLX gives you super-cheap exposure to mainly government bonds. It is boring but effective. When the economy falters, interest rates fall, and government bonds—especially those with longer maturities—rally just at the time your stocks are losing money. One could pick a fund like this and then add more risk around it with things like high-yield and foreign bonds. That way, you have a low-cost dependable core.
Foreign Is Cheap For a while now, I’ve been thinking that foreign equity is cheap and due for a good run. Eventually, I’ll be right.
Silver-rated T. Rowe Price Global Growth Stock RPGEX is one of my favorite world-stock funds. Scott Berg takes a moderate growth approach in search of bargains around the globe. T. Rowe’s crack analyst staff is able to deliver plenty of good ideas, and that shows in performance. The fund is about half U.S., half foreign, and Berg has had success on both fronts.
Oakmark International Small Cap OAKEX was pummeled in the bear market because of its high levels of exposure to cyclical names. Part of the appeal, though, is that very exposure to other economies and the lower correlation with the
United States. David Herro and team have proved to be good stock-pickers even if recent performance suggests otherwise.
Artisan International Small-Mid ARTJX probably wouldn’t have anything to do with Oakmark’s names. This fund lands well to the right in the Morningstar Style Box, as Rezo Kanovich seeks disruptive growth names in fields like cloud computing and artificial intelligence. Prepare for a volatile investment, as this is as bold as they come.
WCM Focused International Growth WCMRX is all about moats and competitive advantages. Thus, it lands in the large-growth corner of the style box. The team seek strong but adaptable corporate cultures that can change with the times. Managers Mike Trigg and Pete Hunkel like fast-growers and steady dependable names. The Silver-rated fund has really clicked under their management.
ConclusionOpportunities are still out there for people open to them. Keep moving ahead even through the uncertainty. KContact Russ Kinnel at [email protected]
Name Morningstar Category
Morningstar Analyst Rating - Process Pillar
Morningstar Analyst Rating - People Pillar
Morningstar Analyst Rating
Total Ret Annlzd 3 Yr %
Total Ret Annlzd 5 Yr %
Total Ret Annlzd
10 Yr %
Total Ret % Rank Cat 3 Yr
Total Ret % Rank Cat 5 Yr
Total Ret % Rank
Cat 10 Yr
Artisan Int’l Small-Mid ARTJX Foreign Sm/Mid Gr Above Avg Above Avg ´ 14.65 11.85 9.70 17 52 40
Artisan International Value ARTKX Foreign Large Blend High Above Avg • 4.30 8.19 7.98 55 37 2
Baird Aggregate Bond BAGIX Interm Core Bond High Above Avg Π5.84 5.04 4.68 14 11 5
Fidelity Asset Manager 20% FASIX Alloc—15% to 30% Eq Average Above Avg ´ 5.73 5.77 4.71 32 46 52
Fidelity Small Cap Discovery FSCRX Small Blend Above Avg Above Avg • 5.47 8.78 10.16 65 79 45
Janus Henderson Enterprise JAENX Mid-Cap Growth Above Avg Above Avg ´ 17.10 17.82 14.75 64 45 34
Oakmark Int’l Small Cap OAKEX Foreign Small/Mid Blend Above Avg Above Avg ´ 1.85 7.20 5.22 70 81 77
Primecap Odyssey Growth POGRX Large Growth High High Π11.40 14.63 14.30 96 87 65
T. Rowe Price Global Gr Stk RPGEX World Large Stock Above Avg High • 20.57 19.28 13.26 6 4 7
T. Rowe Price Mid-Cap Value TRMCX Mid-Cap Value High High Π5.52 10.27 10.07 30 17 28
Vanguard Total Bond Mkt Idx VBTLX Interm Core Bond Above Avg Above Avg • 5.39 4.46 3.80 32 38 47
Vanguard Wellesley Income VWINX Alloc—15% to 30% Eq High Above Avg Œ 7.14 7.93 7.76 29 21 6
WCM Focused Int’l Growth WCMRX Foreign Large Growth High Above Avg • 18.23 16.79 8 9
Data as of 12/31/20
4
Data through December 31, 2020 FINRA members: For internal or institutional use only.
Fidelity Asset Manager® 20% TickerFASIX
Yield1.3%
Total Assets$6,049 mil
Mstar CategoryAllocation--15% to 30%Equity
Benchmark 1: Morningstar Con Tgt Risk TR USDBenchmark 2: Morningstar Mod Tgt Risk TR USD
Morningstar Analyst Rating 11-05-20
´Morningstar Pillars
Process AveragePerformance —People Above AverageParent Above AveragePrice —
Morningstar Analyst RatingMorningstar evaluates mutual funds based on five key pillars, which itsanalysts believe lead to funds that are more likely to outperform overthe long term on a risk-adjusted basis.
Analyst Rating Spectrum
Œ „ ´ ‰ Á
Pillar Spectrum
Low Below Average Average Above Average High
10.0
12.0
14.0
16.0
Historical ProfileReturnRiskRating
AverageBelow AvgQQQNeutral
7 7 4 7 4 4 4 4 Investment StyleEquity
Growth of $10,000
Investment Values ofFundInvestment Values ofBenchmark 1
( * ( * * & ( * & ( *Performance Quartile(within Category)
2010 2011 2012 2013 2014 2015 2016 2017 2018 2019 12-20 History12.79 12.73 13.13 13.32 13.24 12.70 13.01 13.43 12.69 13.62 14.47 NAV8.92 2.63 6.83 5.16 4.11 -0.30 4.70 6.98 -1.64 10.64 8.62 Total Return %1.85 -1.74 -0.52 2.19 0.73 0.62 0.03 -0.02 -0.44 -0.58 -1.13 +/- Bmark 1
-3.41 2.04 -5.21 -9.15 -0.78 1.49 -3.87 -7.68 3.12 -8.38 -4.20 +/- Bmark 21.96 1.88 1.57 1.36 1.53 1.77 1.74 1.63 2.09 2.27 1.44 Income Return %6.96 0.75 5.26 3.80 2.58 -2.07 2.97 5.35 -3.73 8.38 7.18 Capital Return %
58 33 73 37 39 20 59 49 19 60 40 Total Rtn % Rank Cat0.23 0.24 0.20 0.18 0.20 0.23 0.22 0.21 0.28 0.29 0.20 Income $0.02 0.16 0.27 0.30 0.42 0.27 0.07 0.27 0.24 0.13 0.12 Capital Gains $0.56 0.55 0.54 0.53 0.53 0.53 0.52 0.52 0.52 0.51 0.50 Expense Ratio %2.08 1.82 1.65 1.32 1.46 1.63 1.78 1.52 1.81 2.29 1.66 Income Ratio %
18 19 23 27 13 20 19 22 24 41 25 Turnover Rate %3,276 3,806 4,736 4,752 4,945 4,641 4,728 4,955 4,672 5,283 5,889 Net Assets $mil
Performance 12-31-201st Qtr 2nd Qtr 3rd Qtr 4th Qtr Total
2016 1.72 2.00 1.81 -0.87 4.702017 2.10 1.51 1.62 1.57 6.982018 -0.63 0.66 1.07 -2.70 -1.642019 4.38 2.22 1.38 2.29 10.642020 -5.41 7.54 2.15 4.53 8.62
Trailing TotalReturn%
+/- Bmark1
+/- Bmark2
%RankCat
Growth of$10,000
3 Mo 4.53 0.29 -5.71 60 10,4536 Mo 6.78 0.12 -8.76 69 10,6781 Yr 8.62 -1.13 -4.20 40 10,8623 Yr Avg 5.73 -0.71 -2.81 31 11,8215 Yr Avg 5.77 -0.43 -3.97 47 13,24010 Yr Avg 4.71 -0.08 -3.06 52 15,84615 Yr Avg 4.70 -0.29 -2.30 36 19,906
Tax Analysis Tax Adj Rtn% %Rank Cat Tax-Cost Rat %Rank Cat3 Yr (estimated) 4.59 24 1.08 315 Yr (estimated) 4.65 39 1.06 3410 Yr (estimated) 3.56 46 1.10 36
Potential Capital Gain Exposure: 9% of assets
Rating and RiskTimePeriod
Load-AdjReturn %
MorningstarRtn vs Cat
MorningstarRisk vs Cat
MorningstarRisk-Adj Rating
1 Yr 8.623 Yr 5.73 +Avg -Avg QQQQ5 Yr 5.77 Avg -Avg QQQ10 Yr 4.71 Avg -Avg QQQIncept 5.98
Other Measures Standard Index Best Fit Index
Alpha 0.9 -1.2Beta 0.45 1.11R-Squared 90 96
Standard Deviation 5.49Mean 5.73Sharpe Ratio 0.76
Portfolio Analysis 09-30-20Total Stocks: 1088Share change since 06-30-20 Sector YTD Ret % % AssetsYFidelity Revere Str Tr — — 19.28YFidelity Revere Str Tr — — 3.77TFidelity Cent Invt Portfo — — 1.48YApple Inc Technology 81.85 0.95TMicrosoft Corp Technology 42.37 0.89TAlphabet Inc A Comm Svcs 30.85 0.47RFidelity Hanover Str Tr — — 0.46YAmazon.com Inc Cnsmr Cyc 76.26 0.40
Total Fixed Income: 2562Date of
Maturity Amount 000Value$000
%Assets
United States Treasury 02-15-49 91,846 125,549 2.23United States Treasury 02-15-29 101,342 118,348 2.10Fannie Mae 3.5% 30 Year — 76,005 81,038 1.44United States Treasury 05-15-50 80,703 76,478 1.36Fannie Mae 4% 30 Year — 53,310 57,614 1.02Fannie Mae 3% 30 Year — 47,860 50,839 0.90Freddie Mac 3.5% 30 Yea — 45,337 48,483 0.86Ginnie Mae 4% 30 Year — 42,168 45,539 0.81Freddie Mac 4% 30 Year — 26,558 28,916 0.51
Equity StyleStyle: BlendSize: Large-Cap
Fixed-Income StyleDuration: LimitedQuality: Medium
Value Measures Rel CategoryPrice/Earnings 21.88 1.12Price/Book 2.30 1.02Price/Sales 1.92 1.01Price/Cash Flow 9.37 0.89Dividend Yield % 2.00 0.77Growth Measures % Rel Category
Long-Term Erngs 9.90 1.13Book Value 7.17 1.40Sales -57.04 20.71Cash Flow 2.90 0.47Historical Erngs 8.50 1.50Market Cap %Giant 41.7 Small 5.4Large 31.4 Micro 0.2Mid 21.3 Avg
$mil:61,575
Composition - Net
Cash 23.4Stocks 22.1Bonds 51.6Other 2.8Foreign 34.5(% of Stock)
Avg Eff Duration1 3.7Avg Eff Maturity —Avg Credit Quality BBBAvg Wtd Coupon 3.37%1 figure provided by fund as of 09-30-20
SectorWeightings
% ofStocks
RelBmark 1
h Cyclical 32.96 0.84r BasicMat 3.32 0.65t CnsmrCyc 11.43 1.12y FinanSvcs 13.22 0.87u Real Est 4.99 0.57
j Sensitive 43.63 1.20i CommSrvs 10.26 1.53o Energy 2.58 0.75p Industrl 7.95 0.67a Technlgy 22.84 1.58
k Defensive 23.40 0.96s CnsmrDef 7.78 0.91d Hlthcare 13.11 1.05f Utilities 2.51 0.73
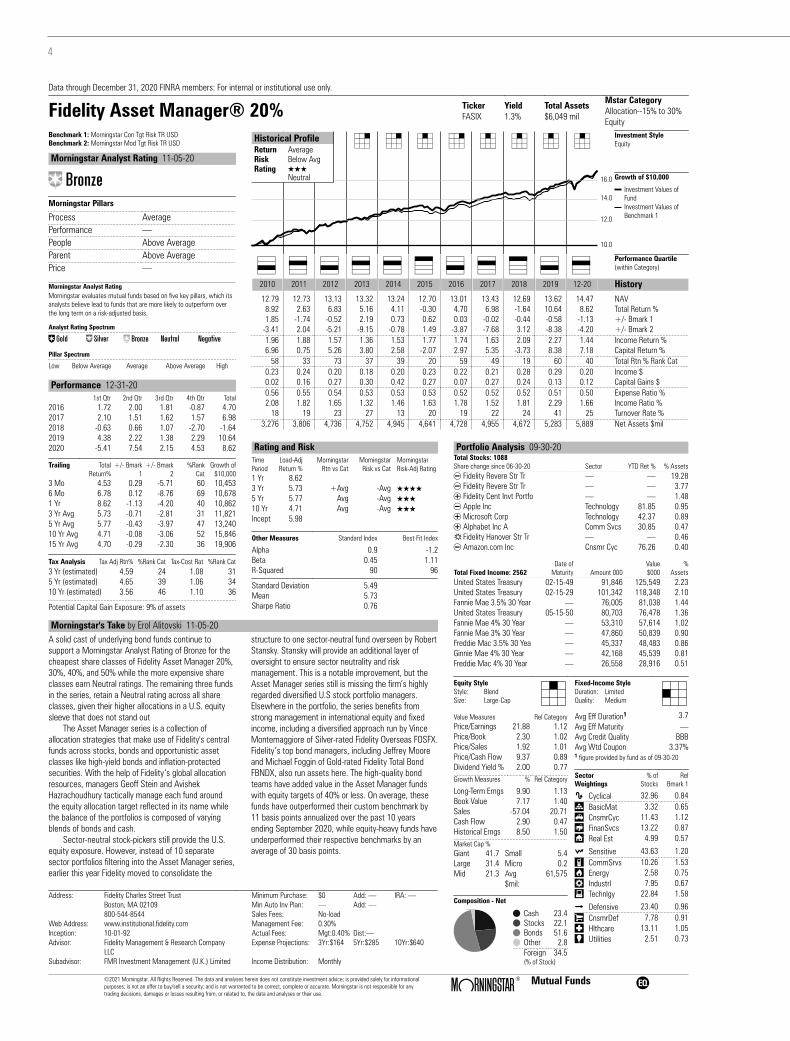
Morningstar's Take by Erol Alitovski 11-05-20A solid cast of underlying bond funds continue tosupport a Morningstar Analyst Rating of Bronze for thecheapest share classes of Fidelity Asset Manager 20%,30%, 40%, and 50% while the more expensive shareclasses earn Neutral ratings. The remaining three fundsin the series, retain a Neutral rating across all shareclasses, given their higher allocations in a U.S. equitysleeve that does not stand out
The Asset Manager series is a collection ofallocation strategies that make use of Fidelity's centralfunds across stocks, bonds and opportunistic assetclasses like high-yield bonds and inflation-protectedsecurities. With the help of Fidelity’s global allocationresources, managers Geoff Stein and AvishekHazrachoudhury tactically manage each fund aroundthe equity allocation target reflected in its name whilethe balance of the portfolios is composed of varyingblends of bonds and cash.
Sector-neutral stock-pickers still provide the U.S.equity exposure. However, instead of 10 separatesector portfolios filtering into the Asset Manager series,earlier this year Fidelity moved to consolidate the
structure to one sector-neutral fund overseen by RobertStansky. Stansky will provide an additional layer ofoversight to ensure sector neutrality and riskmanagement. This is a notable improvement, but theAsset Manager series still is missing the firm’s highlyregarded diversified U.S stock portfolio managers.Elsewhere in the portfolio, the series benefits fromstrong management in international equity and fixedincome, including a diversified approach run by VinceMontemaggiore of Silver-rated Fidelity Overseas FOSFX.Fidelity’s top bond managers, including Jeffrey Mooreand Michael Foggin of Gold-rated Fidelity Total BondFBNDX, also run assets here. The high-quality bondteams have added value in the Asset Manager fundswith equity targets of 40% or less. On average, thesefunds have outperformed their custom benchmark by11 basis points annualized over the past 10 yearsending September 2020, while equity-heavy funds haveunderperformed their respective benchmarks by anaverage of 30 basis points.
Address: Fidelity Charles Street Trust Minimum Purchase: $0 Add: — IRA: —Boston, MA 02109 Min Auto Inv Plan: — Add: —800-544-8544 Sales Fees: No-load
Web Address: www.institutional.fidelity.com Management Fee: 0.30%Inception: 10-01-92 Actual Fees: Mgt:0.40% Dist:—Advisor: Fidelity Management & Research Company
LLCExpense Projections: 3Yr:$164 5Yr:$285 10Yr:$640
Subadvisor: FMR Investment Management (U.K.) Limited Income Distribution: Monthly
©2021 Morningstar. All Rights Reserved. The data and analyses herein does not constitute investment advice; is provided solely for informationalpurposes; is not an offer to buy/sell a security; and is not warranted to be correct, complete or accurate. Morningstar is not responsible for anytrading decisions, damages or losses resulting from, or related to, the data and analyses or their use.
ß® Mutual Funds A
5Morningstar FundInvestor January 2021
Data through December 31, 2020 FINRA members: For internal or institutional use only.
Fidelity® Growth Company TickerFDGRX
Yield0.0%
Total Assets$63,712 mil
Mstar CategoryLarge Growth
Benchmark 1: Russell 1000 Growth TR USDBenchmark 2: S&P 500 TR USD
Morningstar Analyst Rating 12-14-20
„Morningstar Pillars
Process Above AveragePerformance —People HighParent Above AveragePrice —
Morningstar Analyst RatingMorningstar evaluates mutual funds based on five key pillars, which itsanalysts believe lead to funds that are more likely to outperform overthe long term on a risk-adjusted basis.
Analyst Rating Spectrum
Œ „ ´ ‰ Á
Pillar Spectrum
Low Below Average Average Above Average High
10.0
30.0
50.0
70.0
Historical ProfileReturnRiskRating
HighHighQQQQQHighest
7 7 7 7 7 7 7 7 Investment StyleEquity
Growth of $10,000
Investment Values ofFundInvestment Values ofBenchmark 1
& & & & & & * & ( & &Performance Quartile(within Category)
2010 2011 2012 2013 2014 2015 2016 2017 2018 2019 12-20 History8.32 8.09 9.34 11.99 13.19 13.69 13.68 17.87 16.02 21.36 32.87 NAV
20.55 0.67 18.52 37.61 14.44 7.83 6.01 36.76 -4.53 38.42 67.51 Total Return %3.84 -1.97 3.26 4.12 1.39 2.16 -1.07 6.55 -3.01 2.03 29.01 +/- Bmark 15.48 -1.44 2.52 5.22 0.75 6.45 -5.95 14.93 -0.14 6.94 49.11 +/- Bmark 20.00 0.06 0.24 0.22 0.11 0.00 0.07 0.00 0.00 0.00 0.00 Income Return %
20.54 0.61 18.28 37.38 14.33 7.83 5.94 36.76 -4.53 38.42 67.51 Capital Return %12 24 17 17 7 17 29 5 73 8 5 Total Rtn % Rank Cat
0.00 0.01 0.02 0.02 0.01 0.00 0.01 0.00 0.00 0.00 0.00 Income $0.00 0.27 0.23 0.81 0.51 0.54 0.84 0.85 1.02 0.82 2.91 Capital Gains $0.89 0.84 0.90 0.83 0.82 0.88 0.77 0.85 0.85 0.83 0.85 Expense Ratio %0.02 0.10 0.16 0.27 0.12 -0.01 0.07 -0.04 -0.07 -0.20 -0.33 Income Ratio %
36 36 33 26 12 18 25 16 18 16 . Turnover Rate %28,622 23,529 22,700 23,381 24,026 23,246 21,284 25,357 23,478 29,523 44,678 Net Assets $mil
Performance 12-31-201st Qtr 2nd Qtr 3rd Qtr 4th Qtr Total
2016 -5.73 0.89 9.36 1.93 6.012017 10.28 7.85 7.57 6.89 36.762018 5.23 5.77 8.38 -20.85 -4.532019 19.54 2.35 -1.33 14.66 38.422020 -11.84 40.57 17.72 14.82 67.51
Trailing TotalReturn%
+/- Bmark1
+/- Bmark2
%RankCat
Growth of$10,000
3 Mo 14.82 3.43 2.68 24 11,4826 Mo 35.17 9.05 13.01 9 13,5171 Yr 67.51 29.02 49.11 5 16,7513 Yr Avg 30.33 7.34 16.15 6 22,1375 Yr Avg 26.27 5.27 11.05 4 32,09410 Yr Avg 20.59 3.38 6.70 2 65,02415 Yr Avg 15.42 2.88 5.53 3 85,888
Tax Analysis Tax Adj Rtn% %Rank Cat Tax-Cost Rat %Rank Cat3 Yr (estimated) 28.48 5 1.42 425 Yr (estimated) 24.57 4 1.34 3810 Yr (estimated) 19.26 3 1.10 31
Potential Capital Gain Exposure: 62% of assets
Rating and RiskTimePeriod
Load-AdjReturn %
MorningstarRtn vs Cat
MorningstarRisk vs Cat
MorningstarRisk-Adj Rating
1 Yr 67.513 Yr 30.33 High High QQQQQ5 Yr 26.27 High High QQQQQ10 Yr 20.59 High High QQQQQIncept 14.83
Other Measures Standard Index Best Fit Index
Alpha 12.0 3.8Beta 1.18 1.15R-Squared 87 96
Standard Deviation 23.76Mean 30.33Sharpe Ratio 1.17
Portfolio Analysis 11-30-20Total Stocks: 392Share change since 10-31-20 Sector YTD Ret % % AssetsYNVIDIA Corp Technology 122.20 7.40YApple Inc Technology 81.85 6.77
Amazon.com Inc Cnsmr Cyc 76.26 6.59YMicrosoft Corp Technology 42.37 4.02YLululemon Athletica Inc Cnsmr Cyc 50.23 3.78YModerna Inc Hlth Care 434.10 3.38YAlphabet Inc A Comm Svcs 30.85 3.27YSalesforce.com Inc Technology 36.82 2.92YShopify Inc A Technology — 2.77YTesla Inc Cnsmr Cyc 743.44 2.49YAlphabet Inc Class C Comm Svcs 31.03 1.94YFacebook Inc A Comm Svcs 33.09 1.74TWayfair Inc Class A Cnsmr Cyc 149.87 1.66YRoku Inc Class A Comm Svcs 147.96 1.47YPayPal Holdings Inc Finan Svcs 116.51 1.46YAdvanced Micro Devices In Technology 99.98 1.01Y10x Genomics Inc Ordinary Hlth Care 85.70 0.97YVisa Inc Class A Finan Svcs 17.06 0.96YAlnylam Pharmaceuticals I Hlth Care 12.85 0.88YMastercard Inc A Finan Svcs 20.08 0.87
Current Investment Style
LargeM
idSm
all
Value Blend Growth Market Cap %Giant 53.3Large 24.2Mid 14.7Small 6.1Micro 1.7Avg $mil:130,046
Value Measures Rel Category
Price/Earnings 37.54 1.11Price/Book 7.29 1.11Price/Sales 4.89 1.08Price/Cash Flow 23.62 1.11Dividend Yield % 0.38 0.48
Growth Measures % Rel Category
Long-Term Erngs 15.45 1.13Book Value 11.09 0.87Sales 12.25 1.05Cash Flow 9.36 0.69Historical Erngs 12.65 0.77
Profitability %
Return on Equity 15.97Return on Assets 4.04Net Margin 10.18
SectorWeightings
% ofStocks
RelBmark 1
h Cyclical 28.23 1.08r BasicMat 0.59 0.89t CnsmrCyc 23.01 1.39y FinanSvcs 4.40 0.62u Real Est 0.23 0.13
j Sensitive 50.50 0.91i CommSrvs 11.76 1.02o Energy 0.47 5.88p Industrl 3.91 0.86a Technlgy 34.36 0.88
k Defensive 21.27 1.15s CnsmrDef 2.95 0.59d Hlthcare 18.32 1.36f Utilities 0.00 0.00
Composition - Net
Cash 0.1Stocks 98.2Bonds 0.0Other 1.7Foreign 9.1(% of Stock)
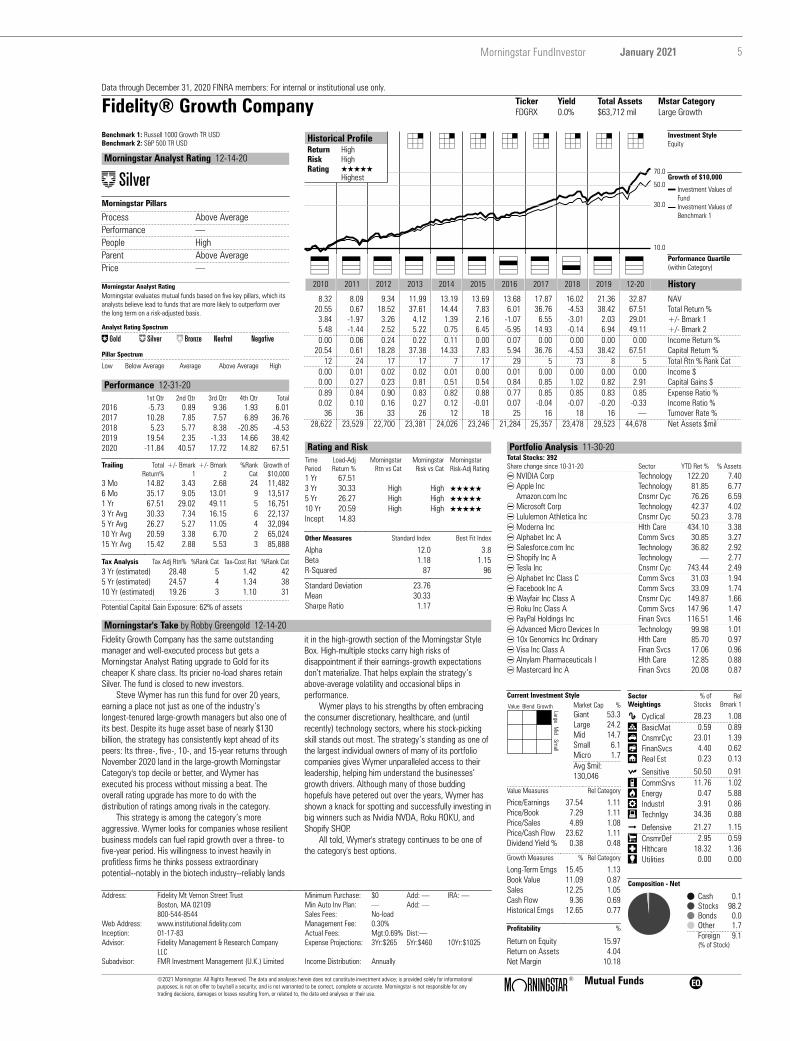
Morningstar's Take by Robby Greengold 12-14-20Fidelity Growth Company has the same outstandingmanager and well-executed process but gets aMorningstar Analyst Rating upgrade to Gold for itscheaper K share class. Its pricier no-load shares retainSilver. The fund is closed to new investors.
Steve Wymer has run this fund for over 20 years,earning a place not just as one of the industry’slongest-tenured large-growth managers but also one ofits best. Despite its huge asset base of nearly $130billion, the strategy has consistently kept ahead of itspeers: Its three-, five-, 10-, and 15-year returns throughNovember 2020 land in the large-growth MorningstarCategory's top decile or better, and Wymer hasexecuted his process without missing a beat. Theoverall rating upgrade has more to do with thedistribution of ratings among rivals in the category.
This strategy is among the category’s moreaggressive. Wymer looks for companies whose resilientbusiness models can fuel rapid growth over a three- tofive-year period. His willingness to invest heavily inprofitless firms he thinks possess extraordinarypotential--notably in the biotech industry--reliably lands
it in the high-growth section of the Morningstar StyleBox. High-multiple stocks carry high risks ofdisappointment if their earnings-growth expectationsdon’t materialize. That helps explain the strategy’sabove-average volatility and occasional blips inperformance.
Wymer plays to his strengths by often embracingthe consumer discretionary, healthcare, and (untilrecently) technology sectors, where his stock-pickingskill stands out most. The strategy’s standing as one ofthe largest individual owners of many of its portfoliocompanies gives Wymer unparalleled access to theirleadership, helping him understand the businesses’growth drivers. Although many of those buddinghopefuls have petered out over the years, Wymer hasshown a knack for spotting and successfully investing inbig winners such as Nvidia NVDA, Roku ROKU, andShopify SHOP.
All told, Wymer's strategy continues to be one ofthe category's best options.
Address: Fidelity Mt Vernon Street Trust Minimum Purchase: $0 Add: — IRA: —Boston, MA 02109 Min Auto Inv Plan: — Add: —800-544-8544 Sales Fees: No-load
Web Address: www.institutional.fidelity.com Management Fee: 0.30%Inception: 01-17-83 Actual Fees: Mgt:0.69% Dist:—Advisor: Fidelity Management & Research Company
LLCExpense Projections: 3Yr:$265 5Yr:$460 10Yr:$1025
Subadvisor: FMR Investment Management (U.K.) Limited Income Distribution: Annually
©2021 Morningstar. All Rights Reserved. The data and analyses herein does not constitute investment advice; is provided solely for informationalpurposes; is not an offer to buy/sell a security; and is not warranted to be correct, complete or accurate. Morningstar is not responsible for anytrading decisions, damages or losses resulting from, or related to, the data and analyses or their use.
ß® Mutual Funds A
6
Data through December 31, 2020 FINRA members: For internal or institutional use only.
T. Rowe Price Overseas Stock TickerTROSX
Yield1.4%
Total Assets$20,016 mil
Mstar CategoryForeign Large Blend
Benchmark 1: MSCI ACWI Ex USA NR USDBenchmark 2: MSCI ACWI Ex USA NR USD
Morningstar Analyst Rating 12-18-20
„Morningstar Pillars
Process Above AveragePerformance —People Above AverageParent HighPrice —
Morningstar Analyst RatingMorningstar evaluates mutual funds based on five key pillars, which itsanalysts believe lead to funds that are more likely to outperform overthe long term on a risk-adjusted basis.
Analyst Rating Spectrum
Œ „ ´ ‰ Á
Pillar Spectrum
Low Below Average Average Above Average High
10.0
12.0
14.0
16.0
18.020.0
Historical ProfileReturnRiskRating
Above AvgAbove AvgQQQQAbove Avg
4 4 4 4 4 4 4 1 Investment StyleEquity
Growth of $10,000
Investment Values ofFundInvestment Values ofBenchmark 1
* & * * * ( & * ( * *Performance Quartile(within Category)
2010 2011 2012 2013 2014 2015 2016 2017 2018 2019 12-20 History8.34 7.32 8.50 10.15 9.42 8.99 9.07 11.31 9.30 11.19 12.05 NAV
10.57 -10.12 18.59 21.75 -4.49 -2.56 2.90 27.02 -15.05 22.91 9.23 Total Return %-0.58 3.59 1.76 6.46 -0.62 3.11 -1.60 -0.17 -0.86 1.40 -1.42 +/- Bmark 1-0.58 3.59 1.76 6.46 -0.62 3.11 -1.60 -0.17 -0.86 1.40 -1.42 +/- Bmark 21.95 2.04 2.32 2.24 2.66 2.02 2.00 2.32 1.86 2.58 1.52 Income Return %8.62 -12.16 16.27 19.52 -7.15 -4.57 0.89 24.71 -16.91 20.33 7.71 Capital Return %
45 12 41 27 39 69 25 29 59 30 46 Total Rtn % Rank Cat0.15 0.17 0.17 0.19 0.27 0.19 0.18 0.21 0.21 0.24 0.17 Income $0.00 0.00 0.01 0.00 0.00 0.00 0.00 0.00 0.10 0.00 0.00 Capital Gains $0.90 0.88 0.87 0.86 0.84 0.84 0.84 0.83 0.81 0.81 0.80 Expense Ratio %2.07 2.27 2.46 2.10 3.14 2.03 2.20 2.02 2.30 2.53 1.57 Income Ratio %
25 17 14 15 8 13 14 13 14 18 13 Turnover Rate %2,544 3,649 5,444 7,474 9,367 10,951 10,666 11,652 9,664 11,218 4,665 Net Assets $mil
Performance 12-31-201st Qtr 2nd Qtr 3rd Qtr 4th Qtr Total
2016 -1.33 -1.58 6.76 -0.75 2.902017 8.27 6.82 6.58 3.05 27.022018 -0.27 -1.60 0.27 -13.68 -15.052019 9.89 1.96 0.00 9.70 22.912020 -24.75 17.70 5.85 16.52 9.23
Trailing TotalReturn%
+/- Bmark1
+/- Bmark2
%RankCat
Growth of$10,000
3 Mo 16.52 -0.49 -0.49 37 11,6526 Mo 23.34 -0.99 -0.99 43 12,3341 Yr 9.23 -1.42 -1.42 46 10,9233 Yr Avg 4.48 -0.40 -0.40 50 11,4045 Yr Avg 8.31 -0.62 -0.61 34 14,90610 Yr Avg 6.06 1.14 1.14 22 18,00315 Yr Avg — — — — —
Tax Analysis Tax Adj Rtn% %Rank Cat Tax-Cost Rat %Rank Cat3 Yr (estimated) 3.58 42 0.86 425 Yr (estimated) 7.48 28 0.77 3710 Yr (estimated) 5.22 18 0.79 49
Potential Capital Gain Exposure: -2% of assets
Rating and RiskTimePeriod
Load-AdjReturn %
MorningstarRtn vs Cat
MorningstarRisk vs Cat
MorningstarRisk-Adj Rating
1 Yr 9.233 Yr 4.48 Avg +Avg QQQ5 Yr 8.31 Avg +Avg QQQ10 Yr 6.06 +Avg Avg QQQQIncept 3.58
Other Measures Standard Index Best Fit Index
Alpha -0.4 -1.1Beta 1.06 1.05R-Squared 98 98
Standard Deviation 19.47Mean 4.48Sharpe Ratio 0.24
Portfolio Analysis 09-30-20Total Stocks: 160Share change since 06-30-20 Sector Country % AssetsYNestle SA Cnsmr Def Switzerland 3.61YUnilever PLC Cnsmr Def United Kingdom 2.40YRoche Holding AG Dividend Hlth Care Switzerland 2.04YSiemens AG Industrl Germany 2.04YNovartis AG Hlth Care Switzerland 2.00
Taiwan Semiconductor Manu Technology Taiwan 1.93TRoyal Philips NV Hlth Care Netherlands 1.79TNippon Telegraph & Teleph Comm Svcs Japan 1.54TSanofi SA Hlth Care France 1.46TAstellas Pharma Inc Hlth Care Japan 1.45
Samsung Electronics Co Lt Technology South Korea 1.40TMunchener Ruckversicherun Finan Svcs Germany 1.33YSAP SE Technology Germany 1.28YToyota Motor Corp Cnsmr Cyc Japan 1.20YASML Holding NV Technology Netherlands 1.12TAXA SA Finan Svcs France 1.10YL'Oreal SA Cnsmr Def France 1.06YBayer AG Hlth Care Germany 1.02YTelefonaktiebolaget L M E Technology Sweden 1.01YASOS PLC Cnsmr Cyc United Kingdom 0.99
Current Investment Style
LargeM
idSm
all
Value Blend Growth Market Cap %Giant 42.0Large 38.8Mid 17.6Small 1.6Micro 0.0Avg $mil:36,581
Value Measures Rel Category
Price/Earnings 17.20 0.98Price/Book 1.42 0.81Price/Sales 1.04 0.74Price/Cash Flow 7.35 0.78Dividend Yield % 3.82 1.32
Growth Measures % Rel Category
Long-Term Erngs 8.45 0.93Book Value 4.60 0.85Sales 3.93 1.40Cash Flow 3.62 0.64Historical Erngs -2.80 -10.59
Composition - NetCash 0.5 Bonds 0.0Stocks 99.5 Other 0.0
Foreign (% of Stock) 98.9
SectorWeightings
% ofStocks
RelBmark 1
h Cyclical 35.34 0.86r BasicMat 6.23 0.77t CnsmrCyc 11.52 0.95y FinanSvcs 16.20 0.90u Real Est 1.39 0.52
j Sensitive 35.90 0.98i CommSrvs 6.23 0.79o Energy 2.79 0.63p Industrl 13.06 1.15a Technlgy 13.82 1.06
k Defensive 28.75 1.29s CnsmrDef 10.38 1.14d Hlthcare 16.24 1.65f Utilities 2.13 0.64
Regional Exposure % Stock
UK/W. Europe 59 N. America 4Japan 22 Latn America 0Asia X Japan 14 Other 0
Country Exposure % Stock
Japan 22UK 15Germany 11
Switzerland 10France 10
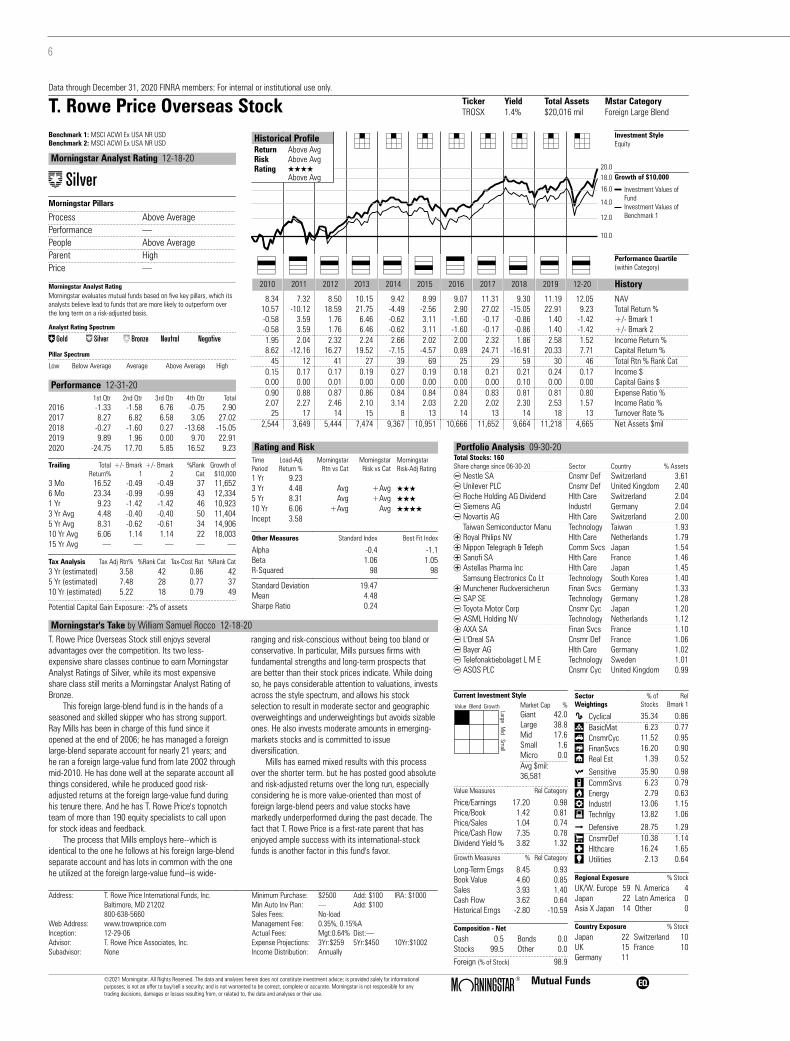
Morningstar's Take by William Samuel Rocco 12-18-20T. Rowe Price Overseas Stock still enjoys severaladvantages over the competition. Its two less-expensive share classes continue to earn MorningstarAnalyst Ratings of Silver, while its most expensiveshare class still merits a Morningstar Analyst Rating ofBronze.
This foreign large-blend fund is in the hands of aseasoned and skilled skipper who has strong support.Ray Mills has been in charge of this fund since itopened at the end of 2006; he has managed a foreignlarge-blend separate account for nearly 21 years; andhe ran a foreign large-value fund from late 2002 throughmid-2010. He has done well at the separate account allthings considered, while he produced good risk-adjusted returns at the foreign large-value fund duringhis tenure there. And he has T. Rowe Price's topnotchteam of more than 190 equity specialists to call uponfor stock ideas and feedback.
The process that Mills employs here--which isidentical to the one he follows at his foreign large-blendseparate account and has lots in common with the onehe utilized at the foreign large-value fund--is wide-
ranging and risk-conscious without being too bland orconservative. In particular, Mills pursues firms withfundamental strengths and long-term prospects thatare better than their stock prices indicate. While doingso, he pays considerable attention to valuations, investsacross the style spectrum, and allows his stockselection to result in moderate sector and geographicoverweightings and underweightings but avoids sizableones. He also invests moderate amounts in emerging-markets stocks and is committed to issuediversification.
Mills has earned mixed results with this processover the shorter term. but he has posted good absoluteand risk-adjusted returns over the long run, especiallyconsidering he is more value-oriented than most offoreign large-blend peers and value stocks havemarkedly underperformed during the past decade. Thefact that T. Rowe Price is a first-rate parent that hasenjoyed ample success with its international-stockfunds is another factor in this fund's favor.
Address: T. Rowe Price International Funds, Inc. Minimum Purchase: $2500 Add: $100 IRA: $1000Baltimore, MD 21202 Min Auto Inv Plan: — Add: $100800-638-5660 Sales Fees: No-load
Web Address: www.troweprice.com Management Fee: 0.35%, 0.15%AInception: 12-29-06 Actual Fees: Mgt:0.64% Dist:—Advisor: T. Rowe Price Associates, Inc. Expense Projections: 3Yr:$259 5Yr:$450 10Yr:$1002Subadvisor: None Income Distribution: Annually
©2021 Morningstar. All Rights Reserved. The data and analyses herein does not constitute investment advice; is provided solely for informationalpurposes; is not an offer to buy/sell a security; and is not warranted to be correct, complete or accurate. Morningstar is not responsible for anytrading decisions, damages or losses resulting from, or related to, the data and analyses or their use.
ß® Mutual Funds A
Morningstar FundInvestor 7January 2021
Data through December 31, 2020 FINRA members: For internal or institutional use only.
WCM Focused International Growth Inv TickerWCMRX
Yield0.0%
Total Assets$21,674 mil
Mstar CategoryForeign Large Growth
Benchmark 1: MSCI ACWI Ex USA Growth NR USDBenchmark 2: MSCI ACWI Ex USA NR USD
Morningstar Analyst Rating 12-16-20
„Morningstar Pillars
Process HighPerformance —People Above AverageParent Above AveragePrice —
Morningstar Analyst RatingMorningstar evaluates mutual funds based on five key pillars, which itsanalysts believe lead to funds that are more likely to outperform overthe long term on a risk-adjusted basis.
Analyst Rating Spectrum
Œ „ ´ ‰ Á
Pillar Spectrum
Low Below Average Average Above Average High
10.0
15.0
20.0
25.0
Historical ProfileReturnRiskRating
HighAverageQQQQQHighest
7 7 7 7 7 7 7 7 Investment StyleEquity
Growth of $10,000
Investment Values ofFundInvestment Values ofBenchmark 1
) * & & * * & & &Performance Quartile(within Category)
2010 2011 2012 2013 2014 2015 2016 2017 2018 2019 12-20 History
. 8.74 9.75 11.77 11.66 12.19 12.02 15.69 13.97 18.85 24.60 NAV
. . 12.19 21.57 -0.60 5.51 0.47 30.89 -7.57 35.02 32.42 Total Return %
. . -4.47 6.08 2.05 6.76 0.34 -1.13 6.85 7.68 10.22 +/- Bmark 1
. . -4.64 6.28 3.27 11.17 -4.03 3.69 6.62 13.51 21.77 +/- Bmark 2
. . 0.30 0.01 0.03 0.04 0.30 0.33 0.08 0.09 0.06 Income Return %
. . 11.89 21.56 -0.62 5.47 0.17 30.55 -7.66 34.94 32.37 Capital Return %
. . 89 31 16 8 26 46 5 8 16 Total Rtn % Rank Cat
. . 0.03 0.00 0.00 0.00 0.04 0.04 0.01 0.01 0.01 Income $
. . 0.03 0.08 0.04 0.11 0.19 0.00 0.53 0.00 0.34 Capital Gains $
. . 1.75 1.40 1.33 1.29 1.28 1.27 1.30 1.24 1.26 Expense Ratio %
. . 1.49 0.39 0.22 0.38 0.40 0.41 0.21 0.17 -0.01 Income Ratio %
. . 27 30 36 26 26 21 26 21 20 Turnover Rate %
. 0 7 24 64 62 91 181 160 260 1,447 Net Assets $mil
Performance 12-31-201st Qtr 2nd Qtr 3rd Qtr 4th Qtr Total
2016 0.25 3.03 4.61 -7.01 0.472017 10.48 8.13 4.25 5.09 30.892018 1.72 0.81 2.98 -12.48 -7.572019 12.81 9.90 -0.64 9.60 35.022020 -16.87 25.53 8.64 16.81 32.42
Trailing TotalReturn%
+/- Bmark1
+/- Bmark2
%RankCat
Growth of$10,000
3 Mo 16.81 2.89 -0.20 23 11,6816 Mo 26.90 1.41 2.58 38 12,6901 Yr 32.42 10.22 21.77 16 13,2423 Yr Avg 18.23 8.21 13.35 8 16,5275 Yr Avg 16.79 4.82 7.87 9 21,73210 Yr Avg — — — — —15 Yr Avg — — — — —
Tax Analysis Tax Adj Rtn% %Rank Cat Tax-Cost Rat %Rank Cat3 Yr (estimated) 17.72 7 0.43 295 Yr (estimated) 16.36 8 0.37 1910 Yr (estimated) — — — —
Potential Capital Gain Exposure: 14% of assets
Rating and RiskTimePeriod
Load-AdjReturn %
MorningstarRtn vs Cat
MorningstarRisk vs Cat
MorningstarRisk-Adj Rating
1 Yr 32.423 Yr 18.23 High Avg QQQQQ5 Yr 16.79 High Avg QQQQQ10 Yr — — — —Incept 12.18
Other Measures Standard Index Best Fit Index
Alpha 12.6 4.6Beta 0.86 2.20R-Squared 85 91
Standard Deviation 16.86Mean 18.23Sharpe Ratio 0.99
Portfolio Analysis 10-31-20Total Stocks: 32Share change since 07-31-20 Sector Country % AssetsTMercadoLibre Inc Cnsmr Cyc Brazil 5.26TTaiwan Semiconductor Manu Technology Taiwan 4.81TDSV Panalpina AS Industrl Denmark 4.65TTencent Holdings Ltd Comm Svcs China 4.47YUmb Money Mkt — United States 4.39TCSL Ltd Hlth Care Australia 4.26TCanadian Pacific Railway Industrl Canada 4.05TExperian PLC Industrl United States 3.77TResMed Inc Hlth Care United States 3.71TAccenture PLC Class A Technology United States 3.68THDFC Bank Ltd ADR Finan Svcs India 3.64TLVMH Moet Hennessy Louis Cnsmr Cyc France 3.54TAIA Group Ltd Finan Svcs Hong Kong 3.48YLululemon Athletica Inc Cnsmr Cyc United States 3.24TKeyence Corp Technology Japan 3.22TASML Holding NV ADR Technology Netherlands 3.19TSika AG Registered Shares Basic Mat Switzerland 3.11TLonza Group Ltd Hlth Care Switzerland 3.06TNestle SA Cnsmr Def Switzerland 3.05YShopify Inc A Technology Canada 2.99
Current Investment Style
LargeM
idSm
all
Value Blend Growth Market Cap %Giant 53.6Large 35.7Mid 10.7Small 0.0Micro 0.0Avg $mil:69,741
Value Measures Rel Category
Price/Earnings 30.81 1.11Price/Book 5.67 1.52Price/Sales 5.42 1.74Price/Cash Flow 24.30 1.42Dividend Yield % 0.96 0.62
Growth Measures % Rel Category
Long-Term Erngs 11.89 1.06Book Value 17.27 1.70Sales 8.25 1.26Cash Flow 9.81 1.18Historical Erngs 9.98 1.80
Composition - NetCash 4.4 Bonds 0.0Stocks 96.2 Other -0.5
Foreign (% of Stock) 77.0
SectorWeightings
% ofStocks
RelBmark 1
h Cyclical 27.00 0.85r BasicMat 3.23 0.45t CnsmrCyc 14.50 0.93y FinanSvcs 9.27 1.22u Real Est 0.00 0.00
j Sensitive 43.13 1.01i CommSrvs 4.65 0.56o Energy 0.00 0.00p Industrl 16.46 1.29a Technlgy 22.02 1.12
k Defensive 29.87 1.16s CnsmrDef 5.22 0.50d Hlthcare 24.65 1.76f Utilities 0.00 0.00
Regional Exposure % Stock
UK/W. Europe 39 N. America 30Japan 3 Latn America 5Asia X Japan 22 Other 0
Country Exposure % Stock
United States 23Switzerland 12Canada 7
France 7Brazil 5
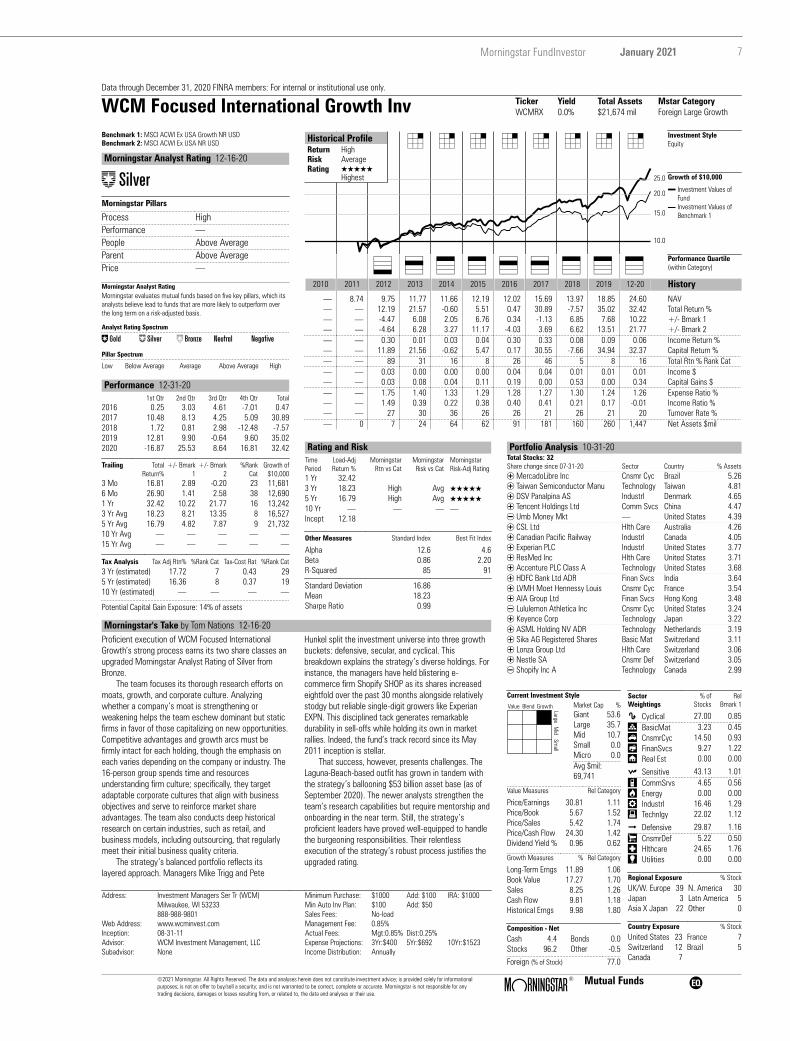
Morningstar's Take by Tom Nations 12-16-20Proficient execution of WCM Focused InternationalGrowth’s strong process earns its two share classes anupgraded Morningstar Analyst Rating of Silver fromBronze.
The team focuses its thorough research efforts onmoats, growth, and corporate culture. Analyzingwhether a company’s moat is strengthening orweakening helps the team eschew dominant but staticfirms in favor of those capitalizing on new opportunities.Competitive advantages and growth arcs must befirmly intact for each holding, though the emphasis oneach varies depending on the company or industry. The16-person group spends time and resourcesunderstanding firm culture; specifically, they targetadaptable corporate cultures that align with businessobjectives and serve to reinforce market shareadvantages. The team also conducts deep historicalresearch on certain industries, such as retail, andbusiness models, including outsourcing, that regularlymeet their initial business quality criteria.
The strategy’s balanced portfolio reflects itslayered approach. Managers Mike Trigg and Pete
Hunkel split the investment universe into three growthbuckets: defensive, secular, and cyclical. Thisbreakdown explains the strategy’s diverse holdings. Forinstance, the managers have held blistering e-commerce firm Shopify SHOP as its shares increasedeightfold over the past 30 months alongside relativelystodgy but reliable single-digit growers like ExperianEXPN. This disciplined tack generates remarkabledurability in sell-offs while holding its own in marketrallies. Indeed, the fund’s track record since its May2011 inception is stellar.
That success, however, presents challenges. TheLaguna-Beach-based outfit has grown in tandem withthe strategy’s ballooning $53 billion asset base (as ofSeptember 2020). The newer analysts strengthen theteam’s research capabilities but require mentorship andonboarding in the near term. Still, the strategy’sproficient leaders have proved well-equipped to handlethe burgeoning responsibilities. Their relentlessexecution of the strategy’s robust process justifies theupgraded rating.
Address: Investment Managers Ser Tr (WCM) Minimum Purchase: $1000 Add: $100 IRA: $1000Milwaukee, WI 53233 Min Auto Inv Plan: $100 Add: $50888-988-9801 Sales Fees: No-load
Web Address: www.wcminvest.com Management Fee: 0.85%Inception: 08-31-11 Actual Fees: Mgt:0.85% Dist:0.25%Advisor: WCM Investment Management, LLC Expense Projections: 3Yr:$400 5Yr:$692 10Yr:$1523Subadvisor: None Income Distribution: Annually
©2021 Morningstar. All Rights Reserved. The data and analyses herein does not constitute investment advice; is provided solely for informationalpurposes; is not an offer to buy/sell a security; and is not warranted to be correct, complete or accurate. Morningstar is not responsible for anytrading decisions, damages or losses resulting from, or related to, the data and analyses or their use.
ß® Mutual Funds A
8
Primecap has beaten its peer group handily for much of the past decade and all the way back to when its first fund launched in 1984. For sure, there have been off years, but not many like 2020, when the fund’s 16% gain massively lagged the 37% gain of the average large-growth fund and 39% for the Russell 1000 Growth Index. It was so bad that the fund’s three-, five-, and 10-year returns are now pedestrian relative to peers as well.
Who Is Primecap?Primecap is a Pasadena, California-based firm founded in the 1980s by growth managers who left Capital Group, the firm behind American funds. Its emphasis on deep fundamental research in an area often given over to Wall Street hype has proved remarkably successful. It has a team of managers who select stocks independently of one another and seasoned analysts who are continually ahead of the curve.
The team runs three funds for Vanguard and three under its own Primecap Odyssey label, all of which have Morningstar Analyst Ratings of Gold. They’ve been so successful that only Primecap Odyssey Stock POSKX and Primecap Odyssey Growth POGRX are open to new investors. The basic growth-oriented strategy is the same across the board with two varia-tions. Primecap Odyssey Stock and Vanguard Prime- cap Core VPCCX are slightly more valuation-conscious and thus land in large blend. Primecap Odyssey Aggressive Growth POAGX has more small- and mid-cap exposure and thus lands in mid-growth.
Because of closings and different options in different accounts, I own three: Primecap Odyssey Aggressive Growth, Vanguard Primecap Core, and Vanguard Capital Opportunity VHCOX. In other cases, I usually wouldn’t own three in order to avoid overlap; here, it
underscores my conviction. Management has conviction, too. The three most experienced managers have more than $1 million each in all six funds.
So, What Went Wrong?In 2020, the fastest-growing companies took an overwhelming share of investor attention. Zoom ZM, Tesla TSLA, Square SQ, and most of the FAANGs (Facebook FB, Amazon.com AMZN, Apple AAPL, Netflix NFLX, and Google GOOG [aka Alphabet]) posted stratospheric gains. Primecap did have some of the big winners. It had modest positions in Tesla and Amazon, plus low-tech winner FedEx FDX, which profited from the massive move to online ordering caused by the coronavirus pandemic. (I’m using Vanguard Primecap for illustration purposes, but the story is similar for the rest of the lineup.)
But overall, they were modestly underweight in technology in a year when tech was the only place to be and massively underweight the big winners like Apple and Amazon, which represent 11% and 8%, respectively, of the Russell 1000 Growth Index. Instead, Primecap was overweight more modestly priced names like Adobe ADBE and Intel INTC. Adobe was a winner, but Intel was in the red in 2020.
A second problem was they owned travel stocks that few of their peers owned in a meaningful way. Needless to say, COVID-19 crushed some of their holdings like Southwest Airlines LUV and United Airlines Holdings UAL.
A third weak spot was big biotech names like Biogen BIIB and Amgen AMGN, which have been big winners in the past but lost money in 2020. If you pick out the best years for Primecap performance, they are often years in which biotech fared well, because Primecap has long been a big investor there.
Has It Changed?This is the central question to ask of a good fund that’s had a bad year.
Let’s start with people. Primecap’s MO is to find the smartest people at a school, hire them without much
Inside a Tough Year for PrimecapMorningstar Research | Russel Kinnel
9Morningstar FundInvestor January 2021
regard to background, and then let them work. It is able to do this because the firm is a partnership in which ownership is very lucrative for those successful in the long run. It’s a big part of Primecap’s com- petitive advantage. Sometimes a slump is accompa-nied by or preceded by an exodus of talent.
Good news: The people here haven’t changed. The funds are run by five managers and 14 analysts. Over the past five years, no managers have left. Only three analysts have left, while four have been hired. Management has a good spread of experience levels from co-founder Theo Kolokotrones on down. That’s important because you don’t want to face a cliff edge when a couple of people approach retirement age.
On to process. To see what has changed, two things I look at are historical industry weights and style trail.
The story on industry and sector weights is very much a steady picture, where weightings typically change at a measured pace. They can, however, shift substan-tially during extreme periods. The fund’s preference for technology, healthcare, and industrials stocks has been consistent, but its tech weighting seesawed from the late 1990s to the early 2000s and again more recently. Overall, I see less change than at the typical actively managed fund.
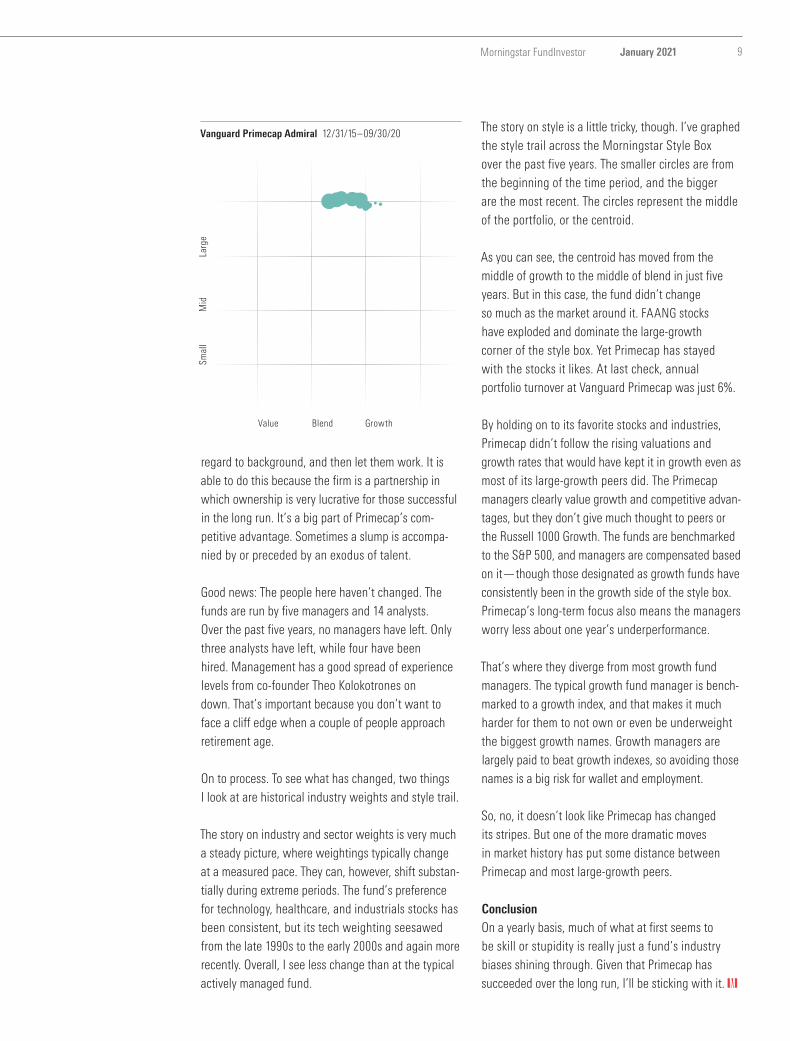
The story on style is a little tricky, though. I’ve graphed the style trail across the Morningstar Style Box over the past five years. The smaller circles are from the beginning of the time period, and the bigger are the most recent. The circles represent the middle of the portfolio, or the centroid.
As you can see, the centroid has moved from the middle of growth to the middle of blend in just five years. But in this case, the fund didn’t change so much as the market around it. FAANG stocks have exploded and dominate the large-growth corner of the style box. Yet Primecap has stayed with the stocks it likes. At last check, annual portfolio turnover at Vanguard Primecap was just 6%.
By holding on to its favorite stocks and industries, Primecap didn’t follow the rising valuations and growth rates that would have kept it in growth even as most of its large-growth peers did. The Primecap managers clearly value growth and competitive advan-tages, but they don’t give much thought to peers or the Russell 1000 Growth. The funds are benchmarked to the S&P 500, and managers are compensated based on it—though those designated as growth funds have consistently been in the growth side of the style box. Primecap’s long-term focus also means the managers worry less about one year’s underperformance.
That’s where they diverge from most growth fund managers. The typical growth fund manager is bench-marked to a growth index, and that makes it much harder for them to not own or even be underweight the biggest growth names. Growth managers are largely paid to beat growth indexes, so avoiding those names is a big risk for wallet and employment.
So, no, it doesn’t look like Primecap has changed its stripes. But one of the more dramatic moves in market history has put some distance between Primecap and most large-growth peers.
ConclusionOn a yearly basis, much of what at first seems to be skill or stupidity is really just a fund’s industry biases shining through. Given that Primecap has succeeded over the long run, I’ll be sticking with it. K
Value Blend Growth
Smal
lM
idLa
rge
Vanguard Primecap Admiral 12/31/15–09/30/20
10
Like financial markets broadly, fixed-income assets went on a wild ride in 2020. Bonds entered the year coming off a hot 2019, with most assets more richly valued than at any other time since the global financial crisis. Of course, that was turned around in March 2020, with most asset types experiencing swift and painful drawdowns.
But since then, markets have rebounded in impressive fashion. From March 24, 2020, through December 2020, high-yield corporate bonds (as measured by the ICE Bank of America U.S. High Yield Index) have gained almost 34%, while investment-grade corporate bonds (measured by the Bloomberg Barclays U.S. Corporate Bond Index) have gained over 22%. Indeed, spreads on both high-yield and investment-grade corporate bonds are below their three-year average and in both cases are approaching the tight levels seen in January 2020, immediately preceding the crisis. Many other fixed-income sectors have experi-enced similar performance patterns this year.
So, where have portfolio managers turned when seeking new opportunities? One area is commercial mortgage-backed securities. This sector is effect- ively a bet on commercial real estate, which has been severely hit by the pandemic and subsequent lock-downs. As a result, the CMBS area has been slower to recover than most other fixed-income sectors and still trades wide relative to its historical average. But in the current world of generally unattractive invest-ment opportunities, this leaves CMBS as one of the few areas of untapped potential. Indeed, many asset managers have noted that the CMBS sector offers attractive yields relative to equivalent-rated corporate bonds, even though many risks remain as the pandemic drags on.
Which managers among the Morningstar 500 have recently increased exposure to this opportunity? Carillon Reams Core Plus Bond SCPYX, which has a Morningstar Analyst Rating of Bronze, is run by an experienced team whose nimble approach has deliv-ered over the long haul. Five comanagers, four of whom have more than 15 years’ tenure at Reams and 25 years or more of industry experience, support lead manager Mark Egan in managing this strategy. Reams worries about permanent loss of capital rather than volatility, and its hallmark is waiting for market sell-offs to appear divorced from fundamentals, and then buying. As CMBS sold off sharply in the pandemic-driven sell-off in early 2020, the team decided to pounce on bargain prices. Its CMBS allocation rose to 15.2% at the end of September, up from just 1.1% at the beginning of the year. Contrarian plays like this have rewarded patient investors over the long haul. Through December 2020, the strategy landed in the top decile for its intermediate core-plus bond Morningstar Category for the trailing 15 years.
Silver-rated PGIM Total Return Bond PDBAX courts volatility but boasts a methodical approach, a strong risk framework, and impressive resources. The strategy is run by an experienced team with more than 20 years of experience and is backed by a group with big research manpower by virtue of a cadre of portfolio managers and roughly 100 analysts, which includes a large staff dedicated to securities, including eight managers and 10-plus analysts. This team focuses on finding issues that have good fundamentals but generate a healthy amount of income. In 2020, the team has focused on high-quality AAA rated CMBS, outside of the hotel sector, which boast 30% credit enhancements, greatly limiting the downside. The team has raised its CMBS allocation to 12.3% as of September 2020, up from 8.5% at the start of 2020. From January 2011 through December 2020, the strategy’s 5.3% annualized return landed it in the top decile of its intermediate core-plus bond category peer group. KContact Mike Mulach at [email protected]
What Opportunities Remain in Fixed Income?The Contrarian | Mike Mulach
Our Contrarian Approach
I go against the grain to
find overlooked funds that may
be ready to rally.
11Morningstar FundInvestor January 2021
Some allocation funds have wide discretion to generate income and/or capital appreciation. Never-theless, long-standing biases can exist. A hefty dose of credit risk, for example, is a feature rather than a bug for some funds that want to pump up yield. Below, we take a closer look at allocation funds that have consistently taken sizable stakes in high-yield bonds and paid dearly for it in early 2020.
Franklin Income FKINX
Income is this fund’s biggest driver of portfolio con- struction. (The fund, which has a Morningstar Analyst Rating of Neutral, has typically generated a 5% 12-month yield.) Bonds often constitute 40% to 50% of the fund’s assets, and high-yield debt has con- sistently made up more than half of that allocation. The high-yield exposure of the fund’s typical allocation—30% to 50% equity Morningstar Category peer has been far lower, often 15% to 20% of the bond portfolio. And the category benchmark, the Morningstar Moderately Conservative Target Risk Index, has typically had less than 5% of its fixed-income exposure rated below investment-grade.
These traits played out as expected in early 2020’s downturn, in which high-yield bonds were hit hard. The fund had 53% of its bond assets in high yield at the end of 2019, and that number didn’t change much prior to the sharp decline in February and March 2020, a big reason why the fund lost 25%— 5.7 percentage points more than its typical peer and 9.0 more than the category benchmark. The fund has underperformed in other major downturns as well, and its persistently large high-yield stake means investors shouldn’t count on the fund for downside protection in the future.
JPMorgan Income Builder JNBAX
A large dose of credit risk has been a bugaboo for this fund as well lately. High-yield bonds have made up roughly 50% to 70% of its bond portfolio since September 2018, according to Morningstar data. (The majority of its high-yield exposure has at least been on the higher-quality end of the junk-bond universe.) As of December 2019, the last disclosed portfolio before the early 2020 downturn had 60% of the bond stake in high-yield bonds, and the fund paid the price for this weighting: It lost 23.5%, 4.2 percentage points more than the allocation—30% to 50% equity category norm and 7.5 more than the category benchmark index, the Morningstar Moderately Conservative Target Risk Index.
While credit ratings data for the fund’s bond stake isn’t available prior to September 2018, the fund hasn’t fared well in other downturns, either. In the 10 years ended November 2020, it lost 21% more than the category average and 39% more than the category index when markets turned south. The fund earns an Above Average Process rating, however, because of its appealing, team-based approach to tactical allocation. Its cheaper share classes earn Bronze ratings, while the pricier ones, like this one, earn Neutral ratings.
Columbia Capital Allocation Moderate ABUAX
This fund, part of a target-risk series, has consistently devoted a larger portion of its bond portfolio to high-yield debt than peers in the allocation—30% to 50% equity category, both before and after Anwiti Bahu-guna became the lead manager in 2018. The fund’s high-yield stake has averaged 23.3% of the bond portfolio over the past five years, while the category average has often been in the mid- to high teens.
This credit risk is one reason the fund lost 22.3%, 3 percentage points more than the category median and 6.4 more than the category benchmark index, the Morningstar Moderately Conservative Target Risk Index, in the early 2020 downturn. A tactical overweighting in equities prior to the decline also hurt. The fund’s Morningstar Risk rating is Above Average over the trailing three, five, and 10 years, and it earns a Neutral rating across its share classes. KContact Greg Carlson at [email protected]
Allocation Funds That Consistently Take a Lot of Credit Risk Red Flags | Greg Carlson
What is Red Flags?
Red Flags is designed to alert
you to funds’ hidden risks. Such
risks can take many forms,
including asset bloat, the
departure of a solid manager, or
a focus on an overhyped asset
class. Not every fund featured
in Red Flags is a sell, and in fact,
some are good long-term
holdings. But investors should
be prepared for a potentially
bumpier ride in the near future.

12
Following a stellar November, global markets continued their ascent in December. The passage of the second coronavirus relief bill and rollout of vaccines strengthened expectations for a swift rebound from the pandemic. Both the S&P 500 and Russell 2000 indexes reached record highs last month—gaining 3.8% and 8.7%, respectively. Each closed out the year with gains just shy of 20%.
The 10-year U.S. Treasury yield—which usually rises in step with investor optimism and falls with more pessimism—continued to reach new highs after its nadir this year in August, but it has been unable to break through the 1% level or prepandemic levels. It rose from 0.84% at the end of November to 0.93% by the end of the year. The short end of the curve stayed put, resulting in a slightly steeper yield curve. This aided financial stocks, which led the way in December, gaining 7.5%, but ended the year in the red, as did real estate. Tech continued its domi- nance, gaining 7.3% to finish the year up 55.9%, about twice as much as the next best performing sector, healthcare.
Growth stocks retook the lead from their value coun-terparts after two months of modest underperform- ance, with the Russell 1000 Growth gaining 9.4% and the Russell 1000 Value gaining 7.9%. Small caps continued to outperform large caps, as the Russell 2000 gained 8.7% versus the Russell 1000’s 4.2%.
The same was true in international equities, with small/mid-caps outperforming large caps. Overall, the broad MSCI ACWI ex USA benchmark gained 5.4%. Emerging markets—Latin America in partic-ular—posted the strongest gains among the regional segments, rising 12.0%, while developed-markets equities gained 4.7%. K Contact Eric Schultz at [email protected]
Total Return % Through A N N U A L I Z E D 12-31-20 1Mo YTD 3Yr 5Yr 10Yr
Benchmark PerformanceA Strong End to the YearMarket Overview | Eric Schultz
Large Growth 4.2 35.9 20.5 18.3 15.1
Large Blend 3.8 15.8 11.9 13.4 12.3
Large Value 3.7 2.9 5.6 9.4 9.7
Mid-Cap Growth 6.5 39.3 19.8 17.8 13.8
Mid-Cap Blend 5.5 12.4 8.3 11.1 10.3
Mid-Cap Value 5.3 2.6 3.9 8.7 9.2
Small Growth 9.0 38.6 18.8 17.8 13.7
Small Blend 7.8 11.0 6.4 10.5 9.8
Small Value 7.4 4.0 2.2 7.9 7.8
Allocation—70% to 85% Equity 4.0 13.5 8.2 9.8 8.3
Allocation—30% to 50% Equity 2.4 8.9 5.9 6.9 6.0
Allocation—50% to 70% Equity 3.3 11.7 7.8 9.0 7.9
Communications 4.3 23.9 11.9 11.9 10.0
Financial 7.5 -1.1 3.0 8.8 9.2
Global Real Estate 3.5 -5.4 3.0 5.1 5.7
Health 5.2 27.6 16.1 11.8 16.0
Real Estate 3.4 -4.5 4.2 5.3 8.1
Technology 7.3 55.9 26.8 25.4 17.8
Utilities 1.7 0.9 8.3 10.5 9.8
S&P 500 3.8 18.4 14.2 15.2 13.9
S&P MidCap 400 6.5 13.7 8.4 12.3 11.5
Russell 2000 8.7 20.0 10.2 13.3 11.2
Diversified Pacific/Asia 5.8 19.8 6.5 11.3 8.6
Diversified Emerging Mkts 7.6 17.9 5.7 11.8 3.6
Europe Stock 5.1 8.0 4.2 7.0 5.9
Foreign Large Blend 5.2 9.3 4.2 7.6 5.3
Foreign Large Growth 5.8 25.5 11.2 11.9 7.9
Foreign Large Value 5.2 0.9 0.4 5.3 3.6
Foreign Small/Mid Growth 7.2 28.4 10.6 13.0 9.4
Foreign Small/Mid Value 7.5 8.6 1.8 7.4 5.2
World Large Stock 4.7 17.7 9.7 11.5 9.0
World Small/Mid Stock 7.9 24.9 10.8 13.2 9.3
MSCI World 4.2 15.9 10.5 12.2 9.9
MSCI Emerging Markets 7.4 18.3 6.2 12.8 3.6
MSCI EAFE 4.6 7.8 4.3 7.4 5.5
MSCI Europe 4.7 5.4 3.6 6.8 5.3
MSCI Latin America 11.9 -13.8 -1.8 8.9 -3.4
MSCI Pacific 4.5 11.9 5.5 8.8 6.0
High Yield Bond 1.8 4.9 4.7 6.8 5.6
Inflation-Protected Bond 1.2 10.0 5.3 4.6 3.2
Intermediate Core Bond 0.3 7.5 5.1 4.3 3.7
Muni National Long 1.0 5.4 4.7 4.0 5.0
World Bond 1.7 8.3 4.0 4.7 2.4
BBgBarc US Agg Bond TR 0.1 7.5 5.3 4.4 3.8
ICE BofA US High Yield TR 1.9 6.2 5.9 8.4 6.6
BBgBarc Municipal TR 0.6 5.2 4.6 3.9 4.6

13Morningstar FundInvestor January 2021
Leaders AMG Yacktman Focused YAFFX
AMG Yacktman Focused, which has a Morningstar Analyst Rating of Silver, outpaced the Russell 1000 Value Index by 14.5% percentage points in 2020 and beat 99% of large-value Morningstar Category peers. The patient and disciplined approach allowed the managers to accumulate cash positions north of 20% of assets in recent years as attractive opportunities were scarce. However, the team feasted on volatility in 2020’s first-quarter bear market, picking up hard- hit small- and mid-cap names at deep discounts, such as Huntsman HUN and MSC Industrial Direct MSM. A multiyear position in Samsung Electronics Co. Ltd.’s preferred shares supplied the biggest boost of the year to the portfolio, though. The eclectic style has done well following other drawdowns, such as in 2008 and 2011. This year was no exception.
Invesco Oppenheimer International Growth OIGAX
Invesco Oppenheimer International Growth’s prefer-ence for tech stocks helped it gain 21.9% in 2020 and beat 95% of foreign large-blend Morningstar Category peers. The Bronze-rated fund’s sizable stakes in companies like semiconductor equipment and mate-rials manufacturer ASML Holding ASMLF, software firm Xero XRO, and scientific instrument manufacturer Keyence KEY were top contributors. The biggest boost came from Taiwan Semiconductor TSM, whose shares rose 75.6% for the year. As of the September 2020 portfolio, the position accounted for 2.86% of assets, making it the fund’s largest holding.
Fidelity Balanced FBALX With a significant overweight to equities, Fidelity Balanced beat 98% of its allocation—50% to 70% equity Morningstar Category peers in 2020. The emphasis on equities isn’t unusual for the Neutral-rated fund. It averaged a 66% weight to equities over lead manager Robert Stansky’s 12-year tenure.
As of the most recent September 2020 portfolio, it had 68% in stocks. The increased risk versus more conservatively allocated peers has typically caused it to underperform in drawdowns, such as 2020’s first quarter, but it benefited in the subsequent rebound.
LaggardsRoyce Premier RYPRX Royce Premier was out of step this year as its modest growth tilt and perennially light healthcare stake—due to its quality hurdles and a lack of expertise in the sector—kept it from catching strong tailwinds among growth and healthcare stocks. The Neutral-rated fund landed in the bottom decile of its small-growth Morningstar Category after gaining just 11.5% versus the Russell 2000 Growth’s 38.7%. Further, its picks in the hot tech sector were lukewarm on balance, returning 20.7% versus the index’s 50.9%.
T. Rowe Price International Disciplined Equity PRCNX T. Rowe Price International Disciplined Equity’s 4.4% gain in 2020 ranked in the bottom quartile of its foreign large-blend Morningstar Category. The Silver-rated fund faced a stylistic headwind. It invests across the style spectrum, but price-conscious lead manager Federico Santilli favored value in 2020. As a result, the fund had 46% of its assets in value stocks (using Morningstar’s definition) versus 33% for its typical peer and 27% for the MSCI EAFE Index, and both foreign and U.S. value stocks underperformed in the past year.
Boston Partners Long/Short Research BPRRX Boston Partners Long/Short Research also suffered from stylistic headwinds. The Neutral-rated fund lost 8.5% in 2020, landing it in the bottom decile of the long-short equity Morningstar Category. The approach relies on valuations returning to historic norms, so value stocks dominate its long holdings while growth stocks constitute most of its short positions, effec-tively doubling down on a value bet. This can lead to prolonged underperformance when value falls out of favor, as it did in 2020. Indeed, the portfolio’s long holdings did worse than its short holdings in the first-quarter bear market. KContact Eric Schultz at [email protected]
10 Worst-Performing Funds
Fund Name YTD Cat Rank %
Artisan International Inv 99
Hennessy Focus Investor 99
IVA International A 99
Fidelity Mortgage Securit 98
Franklin Mutual Shares A 98
Janus Henderson Small Cap 97
Royce Premier Invmt 97
Franklin Mutual Global Di 96
Tweedy, Browne Worldwide 96
Vanguard Shrt-Term Infl-P 96
10 Best-Performing Funds
Fund Name YTD Cat Rank %
AMG Yacktman Focused N 1
Artisan Developing World 1
Fidelity Extended Market 2
Loomis Sayles Global Bond 2
Morgan Stanley Inst Growt 2
Royce Opportunity Invmt 2
Vanguard Extended Market 2
AMG Yacktman I 3
Carillon Reams Core Plus 3
Fidelity Balanced 3
A Stellar Year for AMG Yacktman Focused Leaders & Laggards | Eric Schultz
14
Macquarie Buys Ivy Funds ParentWaddell & Reed WDR, the parent company of Ivy Investments, said on Dec. 2, 2020, that it would sell itself to Macquarie Asset Management and expected the deal to close in mid-2021.
Until the deal closes, Ivy expects to keep its current strategies and portfolio management teams. Then Macquarie will review its lineup and may con- solidate some Ivy funds or shake other things up. Macquarie owns the U.S.-based Delaware Funds, which offers many strategies that overlap with or are like Ivy offerings.
The announcement follows a challenging six years for Ivy. The firm has struggled to get back on its feet since 2014, when an exodus of prominent manage-ment and research team members began. That, along with mediocre fund performance and above-average fees, ignited outflows at the family.
Macquarie Asset Management is a division of Macquarie Group, a global diversified financial firm based in Australia. It earns an Above Average Parent rating. Upon completion of its acquisition of Waddell & Reed, the firm expects its assets under management to climb to over $465 billion.
Loomis Sayles’ Dan Fuss Steps BackLoomis Sayles bond-fund legend Dan Fuss will step away from his portfolio management duties on March 1, 2021, the firm has announced. That date will coincide with his 45th anniversary at the firm.
Fuss, who received Morningstar's Outstanding Port-folio Manager Award in 2019 and who was the Morningstar Fixed-Income Fund Manager of the Year in 2009, is a named manager on nine mutual funds. Of those, Morningstar rates the firm's flagship Loomis Sayles Bond LSBRX, Loomis Sayles Strategic Income NEFZX, Loomis Sayles Multisector Income,
Fund Manager Changes Fund News
Akre Focus AKREX Impact: Negative Date 12/31/2020
Chuck Akre stepped down as comanager of Akre Focus at the end of 2020. Our Take: This was not unexpected
given that Akre is 77 and had already turned day-to-day management of the fund over to John Neff and
Chris Cerrone. As the more senior member of the two, Neff will eventually succeed Akre as the managing
member of the firm. We rate Akre Focus •.
ClearBridge Aggressive Growth SHRAX Impact: Negative Date 12/01/2021
Longtime manager Richie Freeman will be stepping down from day-to-day fund management in December 2021
in order to take a senior advisor role within the firm. In addition, Aram Green will become comanager in March
2021. Our Take: Freeman has run the fund in a very distinctive style since it was launched in 1983. We’ll have
to wait to see if there are changes to the strategy or if some long-held positions are sold. Comanager Evan
Bauman has worked with Freeman for a long time, so there is certainly some continuity through the transition.
ClearBridge Aggressive Growth's Analyst Rating was downgraded to ̌ .
JPMorgan Value Advantage JVAAX Impact: Positive Date: 10/13/2020
J.P. Morgan added Graham Spence as a portfolio manager of JPMorgan Value Advantage. Spence joined the
U.S. equity value team in 2013, and he’s been working on the strategy with Jonathan Simon and Larry Playford
since then, researching several sectors over time. Our Take: His appointment is a natural evolution as the
team starts succession planning around Simon and Playford, who have managed the fund together since 2005.
Spence’s addition to the management roster doesn’t change our ratings.
Loomis Sayles Bond LSBRX Impact: Negative Date 03/31/2021
Bond-fund legend Dan Fuss will step away from his portfolio management duties shortly. That March date will
coincide with his 45th anniversary at the firm. Fuss, who received Morningstar's Outstanding Portfolio
Manager award in 2019 and was the Morningstar Fixed-Income Fund Manager of the Year in 2009, is a named
portfolio manager on nine mutual funds. Of those, Morningstar rates the firm's flagship Loomis Sayles
Bond LSBDX, Loomis Sayles Strategic Income NEFZX, Loomis Sayles Multisector Income, Loomis Sayles High
Income Opportunities LSIOX, and Loomis Sayles Global Allocation LSWWX. As of March 2021, Fuss will
serve as a special advisor to the Loomis Sayles Full Discretion team that manages these strategies and oversaw
$65 billion as of September 2020. Our Take: The team's transition planning has been thoughtful and in motion
for more than a decade. Over the years, Fuss slowly shifted his responsibilities to his comanagers but continued
to make broad portfolio positioning and strategic decisions. Longtime deputies Elaine Stokes, Matthew Eagan,
Brian Kennedy, and Todd Vandam will continue to serve as portfolio managers on the aforementioned strategies.
This news does not impact our view of the Morningstar Analyst Ratings and People Pillar ratings across the
five strategies.
Vanguard International Growth VWIGX Impact : Positive Date 12/22/2020
Vanguard named Lawrence Burns of Baillie Gifford and James Gautrey of Schroders as comanagers of Vanguard
International Growth. Our Take: The moves are unsurprising given that each was already intricately involved
in his firm’s sleeve of the strategy. Burns became deputy chair of Baillie Gifford’s portfolio construction group,
the sleeve’s decision-making body, in July 2019. He has served in the group since 2012. Veteran James
Anderson remains a named manager here but has ceded some of his responsibilities to others including Burns.
Gautrey has similarly played an important role, serving as a comanager on other international equity strate-
gies since 2014, including one resembling Schroders’ sleeve here. These changes reflect the personnel depth
and thoughtful succession planning at the subadvisors that help support the strategy’s continued High
People Pillar rating and its overall Morningstar Analyst Rating of Œ.
15Morningstar FundInvestor January 2021
Loomis Sayles High Income Opportunities LSIOX, and Loomis Sayles Global Allocation LSWWX. As of March 2021, Fuss will serve as a special advisor to the Loomis Sayles Full Discretion team that manages these strategies. He will also remain on the firm's board of directors and retain his executive vice president duties.
Fuss' transition comes after a long and illustrious career, but it is a loss for the Full Discretion team given that he pioneered its benchmark-agnostic and multisector approach. That said, the transition has been in motion for more than a decade. Over the years, Fuss slowly shifted responsibilities to comanagers. Longtime deputies Elaine Stokes, Matthew Eagan, Brian Kennedy, and Todd Vandam will continue to serve as managers on the strategies. The People ratings and Morningstar Analyst Ratings across the five strategies remain unchanged.
BlackRock Target Date Co-Head LeavesBlackRock LifePath Index’s Morningstar Analyst Rating was Under Review following the departure of Matt O’Hara, co-head of BlackRock’s LifePath suite of target-date funds, on Dec. 9, 2020.
O’Hara took his current role in 2016 and became a manager on all the firm’s target-date series at the same time. In 2014, he led the research that resulted in a revamp of all the series’ glide paths to focus more on accumulating wealth in the funds furthest from retirement. The team remains one of the best resourced among target-date strategies, but O’Hara’s departure is significant.
Nicholas Nefouse, LifePath’s other co-head, will oversee a newly formed Retirement Solutions group that replaces the previous LifePath group under the broader Multi-Asset Strategies and Solutions banner. Chris Chung, who was promoted to head of asset allocation within the LifePath team in 2019, has replaced O’Hara as a named manager on the target-date funds. Prior to his current role, Chung was involved in the team’s custom glide-path research. The rest of the management team is unchanged.
Morgan Stanley Sector Fund Manager to RetireMorgan Stanley Institutional U.S. Real Estate's MSUSX Morningstar Analyst Rating dropped to Neutral because of a pending manager retirement.
Ted Bigman, Morgan Stanley's head of global listed real assets, will retire in the first quarter of 2021 after 25 years as the portfolio manager of Morgan Stanley Institutional U.S. Real Estate and 14 years at the helm of Morgan Stanley Institutional Global Real Estate MRLAX. Bigman also manages several infrastructure and real asset mutual funds and the European-sold UCITS funds of the same strategies. To replace him, Morgan Stanley has hired Laurel Durkay, a 13-year veteran of Cohen & Steers who had been comanager of Cohen & Steers Global Realty CSFAX and Cohen & Steers International Realty IRFAX since 2019. Bigman will relinquish portfolio duties on all his funds to Durkay on Dec. 31, 2020, but will stay on into early 2021 to ensure a smooth transition.
Morgan Stanley's U.S. and global real estate funds have been mired in multiyear performance slumps. The fund also lost comanager Bill Grant and longtime analyst Christina Chiu in the spring.
Transamerica Fires Value ManagerRothschild & Co. Asset Management in December replaced Levin Easterly Partners as the sole sub- advisor of Transamerica Large Cap Value TWQAX. Its Morningstar Analyst Rating dropped to Neutral.
The Rothschild team has relevant experience. Lead manager Paul Roukis has been in the industry since 1992 and subadvises three other large-value strategies. Comanager Jeff Agne supports Roukis and has 19 years of relevant experience.
Jack Murphy's contrarian bent will be hard to replace, though. The Levin Easterly manager got off to a blistering start in July 2012, leaning on 31 years of experience and high-conviction picks to lead the strategy to top-decile finishes in the large-value Morningstar Category in 2015 and 2016. But Murphy's selections have worked against him of late, lagging in 2019's market rally and plummeting in 2020's novel coronavirus sell-off. K
16
Changes have been coming fast and furiously for workers in the gig economy. Before the coronavirus pandemic, the number of gig workers—a broad coali-tion that includes delivery and rideshare drivers as well as contract-based knowledge workers—was growing quickly. The number jumped by 15% in the decade through 2019, and 16% of workers at U.S. businesses were independent contractors in 2019.
Enter the pandemic. While the broader trend toward companies hiring fewer permanent employees still appears to be intact, the coronavirus crisis has changed the landscape. Rideshare-driving jobs through once-booming services like Uber UBER and Lyft LYFT disappeared almost overnight, while the number of gig jobs in the food-, grocery-, and package-delivery areas increased. The types of workers seeking these jobs have changed, too: Those who were laid off and furloughed sought to replace their incomes, while some older workers or those with pre-existing health conditions that make them vulner-able to COVID-19 complications have stepped away.
Self-employed individuals have a completely different set of opportunities and challenges, from both a life-style and financial perspective, than those who work full-time for a single employer.
One of the traditional selling points for contractors is the ability to better balance work and family obliga-tions. For some parents during the pandemic, for example, their daytime roles as at-home learning instructors have all but necessitated gig work during nonschool hours. Contract work, especially in special-ized fields such as tech, can be lucrative financially.
At the same time, not having a steady paycheck—not to mention missing out on crucial employee benefits like health insurance—can be a source of financial stress. While the CARES Act extended unemployment
benefits to some self-employed workers and indepen-dent contractors, the threat of periodic income disrup-tions may also make workers with nontraditional employment arrangements less likely or less able to save for long-term goals. If they know they could have a months-long disruption in their paychecks, people might be reticent to park extra funds in a retirement account that carries strictures on premature with-drawals. In fact, just 13% of self-employed individuals surveyed by Pew Research reported saving for their retirements in their current jobs.
Self-employed workers won’t receive employer-provided matching contributions, nor will they be able to take advantage of creature comforts that partici-pants in company-provided 401(k) plans enjoy, such as automatic enrollment and automatic rebalancing.
But self-employed individuals can and should take steps to ensure their retirement security, just as people in conventional work arrangements should. Here are some tips to help them do so.
First Stop | Assess Insurance CoverageBuilding retirement savings is important for contrac-tors and others in nontraditional work arrangements. But before they focus on retirement savings, such workers should first ensure that they’ve adequately protected themselves against shorter-term financial hardships, which can derail their plans to achieve long-term financial goals. If a self-employed person is forced to turn to unattractive forms of financing such as credit cards to defray near-term income needs, the cost of that financing is likely to swamp the long-term returns on any money earmarked for retirement.
Here, lining up adequate insurance coverage is an essential first stop, especially healthcare and disability coverage. Workers participating in a qualifying high-deductible healthcare plan may also contribute to a health savings account, which allows them to build up funds to defray out-of-pocket healthcare costs. Such funds receive extremely attractive tax breaks, making them a no-brainer for workers enrolled in qualifying HDHPs. (If they’re going to be on the hook for any out-of-pocket healthcare expenses at all, they might as well run the money through an HSA and get the tax
Retirement Planning for the Gig Economy Portfolio Matters | Christine Benz
17Morningstar FundInvestor January 2021
breaks.) Health savings accounts can feature layers of fees and may have unattractive investment options. But self-employed folks also have a leg up on workers with employer-provided HSAs, in that the former can shop around for the best low-fee HSA options.
Next Stop | Bulk Up Emergency/Short-Term ReservesIn addition to conducting an insurance fire drill, contract workers should also assess the adequacy of their liquid reserves before earmarking assets for retirement. The main reason to amass a so-called emergency fund is to provide cash flow in case of job loss. And lumpy income streams, as well as periodic income disruptions, are all but facts of life for contrac-tors and other self-employed individuals. Moreover, disability coverage may be cost-prohibitive for self-employed people. All these factors argue for self-employed workers maintaining emergency funds that are larger than the standard three to six months’ worth of living expenses often prescribed by financial planners; I think closer to a year’s worth of living expenses makes sense for self-employed individuals. And if taxes are not being withheld from a contractor’s paycheck, that cash fund can also serve as a recep-tacle for monies earmarked for taxes.
Next Stop | Fund a Basic IRAMoving on to the retirement accounts themselves, contractors and other self-employed individuals have what may seem like an overwhelming array of accounts to choose from.
But a good first stop for any self-employed worker or contractor is to simply fund an IRA to the maximum—in 2020 and 2021, that’s $6,000 for investors under age 50 and $7,000 for those over 50. Such accounts are very easy to set up, and the money can be invested in a huge array of options. Nor will IRA contributions affect a self-employed person’s ability to contribute to a dedicated retirement-savings vehicle for self-employed people, such as a Solo 401(k).
Traditional IRAs offer a tax deduction for those falling below the income thresholds, but Roth IRAs offer attractive features, too: no taxes on qualified with-drawals and no required minimum distributions in retirement. Roth IRAs carry income limits, but they’re
higher than the income limits for traditional deduct-ible IRAs. A Roth IRA can be especially appealing for self-employed workers in that they can withdraw their contributions (not investment earnings) at any time and for any reason without paying taxes or a penalty. Thus, it is a way to multitask—saving short-term reserves for emergencies and investing for retirement.
Next Stop | Find a Way to Save More for RetirementSelf-employed workers contributing to an IRA shouldn’t stop there, because the contribution limits are quite low relative to other retirement-funding vehi-cles. A person assiduously investing $6,000 a year in an IRA for 40 years who enjoyed 6% growth on her money would have a little over $920,000 at the end of the period. That’s nothing to sneeze at—nor is it enough to fund retirement for many households, espe-cially considering the effects inflation will have on purchasing power over that 40-year period.
So, individual self-employed workers looking to amass significant sums for retirement need to look at addi-tional receptacles for retirement savings. Tax and Social Security expert Mike Piper believes that the individual (or Solo) 401(k) is attractive because it offers both high contributions and a Roth option. He notes that, while administrative costs had been a knock against Solo 401(k)s in the past, they’ve come down significantly at some big providers recently.
Next Stop | Invest With an Eye Toward Your Human CapitalSelf-employed workers often have more-volatile income streams than their counterparts who receive fixed, regular paychecks. While it’s never ideal to withdraw retirement funds early, the odds are higher that self-employed workers will need to tap their accounts unexpectedly or prematurely. Thus, self-employed workers’ investment portfolios should argu-ably be managed a bit more conservatively to reflect that possibility. That prospect also argues for self-employed individuals holding some of their retirement assets in discrete conservative holdings, rather than obtaining that same conservative exposure via an all-in-one product like a target-date fund. K
Contact Christine Benz at [email protected]

18
The Chinese market has been a top performer in 2020. The MSCI China Index gained 26% for the year to date through November, versus 16% for the Russell 1000 Index, 5% for the MSCI ACWI ex USA Index, and 10% for the MSCI Emerging Markets Index. Let’s see if our China and China-oriented Morningstar Medalists from Matthews made the most of the rally.
The 21% gain that Matthews China MCHFX has posted since its Morningstar Analyst Rating was raised to Gold from Bronze in June 2020 is in line with the returns of its typical China-region peer and the MSCI China Index. But because of its growth bias and lead manager Andrew Mattock’s strong Internet-related picks, including Alibaba BABA and Tencent, the fund is up 36% for the year to date through November, which is 9 percentage points more than its average peer and 10 percentage points more than the index. The growth tilt and Mattock’s stock selection have also paid off over his full tenure, and the fund has earned a 12.3% annualized gain since he took charge in July 2015, whereas its average peer and the index have posted 8.1% and 8.8% annualized returns, respectively.
Lead manager Yu Zhang of Matthews Asia Dividend MAPIX has executed the fund’s quality-driven, dividend-growth process skillfully and made good Chinese and Japanese picks this year. Thus, the fund posted gains of 12.5% since its Analyst Rating was upgraded to Gold from Silver in August 2020 and 24.8% for the year to date through November versus returns of 11.1% and 13.0% for the average diversified Pacific/Asia fund and 10.1% and 13.1% for the MSCI AC Asia Pacific Index, respectively. Mean-while, Zhang has worked on the fund as a manager or analyst since 2007; the fund has employed the same quality-driven, dividend-growth process throughout its
history; and it has delivered an annualized return of 9.7% since inception versus 5.1% for its typical rival and 5.0% for the index.
Matthews Asian Growth & Income’s MACSX conservative process has held the fund back in 2020 and over the longer term. The fund—which had the Analyst Rating of its no-load class lowered to Bronze from Silver in October, while its institu- tional share class stayed at Silver—returned 9.4% for the year to date through November versus 16.2% for the average Pacific/Asia ex-Japan stock fund and 17.1% for the MSCI AC Asia ex Japan Index. It was stung by its relatively modest China stake and its focus on attractively valued dividend-paying common stocks and convertible bonds in a growth-dominated rally. The fund has struggled for similar reasons since it first became a Morningstar Medalist in March 2014, posting an annualized return of 4.4% versus 7.7% for its typical rival and 8.3% for the index. However, thanks to its reserved traits and the team’s security selection, the fund has regularly outperformed in regional stock sell-offs and earned exceptionally attractive volatility metrics.
Matthews Pacific Tiger MAPTX posted a 17.7% gain for the year to date through November. That gain beat the average Pacific/Asia ex-Japan stock fund’s 16.2% gain and the MSCI Asia ex Japan Index’s 17.1% return. The moderate aspects of lead manager Sharat Shroff’s quality-oriented, valuation-conscious growth discipline have been something of a hindrance since the fund was downgraded to Silver from Gold in September 2015 because of manager turnover. The fund has posted an 11.5% annualized gain over the period, versus 11.8% for its typical rival and 12.5% for the index. But the fund has outgained the index by more than 2 percentage points annualized and outpaced 60% of its rivals since Shroff joined the management team as a co-lead manager in January 2008, and he has used the same process throughout his tenure. KContact Bill Rocco at [email protected]
Tracking Our Top China Plays Tracking Morningstar Analyst Ratings | Bill Rocco
What Are Morningstar
Analyst Ratings?
Our ratings are chosen for long-
term success. Analysts assess
a fund’s competitive advantages
by analyzing people, process,
parent, performance, and price.
They do rigorous analysis and
then submit their ratings to a
committee that vets their work
for thoroughness and consistency.
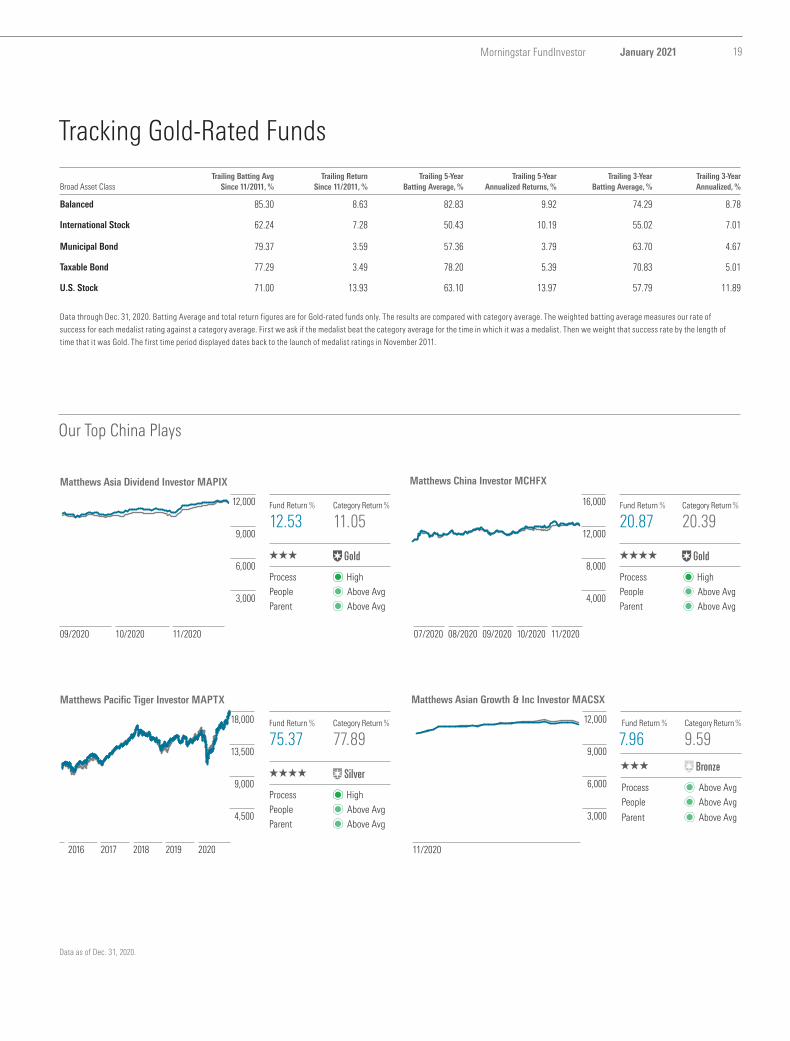
19Morningstar FundInvestor January 2021
Tracking Gold-Rated Funds
Our Top China Plays
0
4000
8000
12000
16000
Matthews China Investor MCHFX
Fund Return % Category Return %
20.87 20.39
QQQQ Œ
Process High
People Above Avg
Parent Above Avg
Fund Return % Category Return %
12.53 11.05
QQQ Œ
Process High
People Above Avg
Parent Above Avg
0
3000
6000
9000
12000Matthews Asia Dividend Investor MAPIX
09/2020 10/2020 11/2020 07/2020 08/2020 09/2020 10/2020 11/2020
2016 2017 2018 2019 2020
Fund Return % Category Return %
75.37 77.89
QQQQ •
Process High
People Above Avg
Parent Above Avg
0
4500
9000
13500
18000Matthews Pacific Tiger Investor MAPTX
Data as of Dec. 31, 2020.
Broad Asset ClassTrailing Batting Avg
Since 11/2011, %Trailing Return
Since 11/2011, %Trailing 5-Year
Batting Average, %Trailing 5-Year
Annualized Returns, % Trailing 3-Year
Batting Average, % Trailing 3-Year Annualized, %
Balanced 85.30 8.63 82.83 9.92 74.29 8.78
International Stock 62.24 7.28 50.43 10.19 55.02 7.01
Municipal Bond 79.37 3.59 57.36 3.79 63.70 4.67
Taxable Bond 77.29 3.49 78.20 5.39 70.83 5.01
U.S. Stock 71.00 13.93 63.10 13.97 57.79 11.89
Data through Dec. 31, 2020. Batting Average and total return figures are for Gold-rated funds only. The results are compared with category average. The weighted batting average measures our rate of
success for each medalist rating against a category average. First we ask if the medalist beat the category average for the time in which it was a medalist. Then we weight that success rate by the length of
time that it was Gold. The first time period displayed dates back to the launch of medalist ratings in November 2011.
12,000
9,000
6,000
3,000
16,000
12,000
8,000
4,000
18,000
13,500
9,000
4,500
11/2020
Fund Return % Category Return %
7.96 9.59
QQQ ´
Process Above Avg
People Above Avg
Parent Above Avg
0
3000
6000
9000
12000Matthews Asian Growth & Inc Investor MACSX
12,000
9,000
6,000
3,000
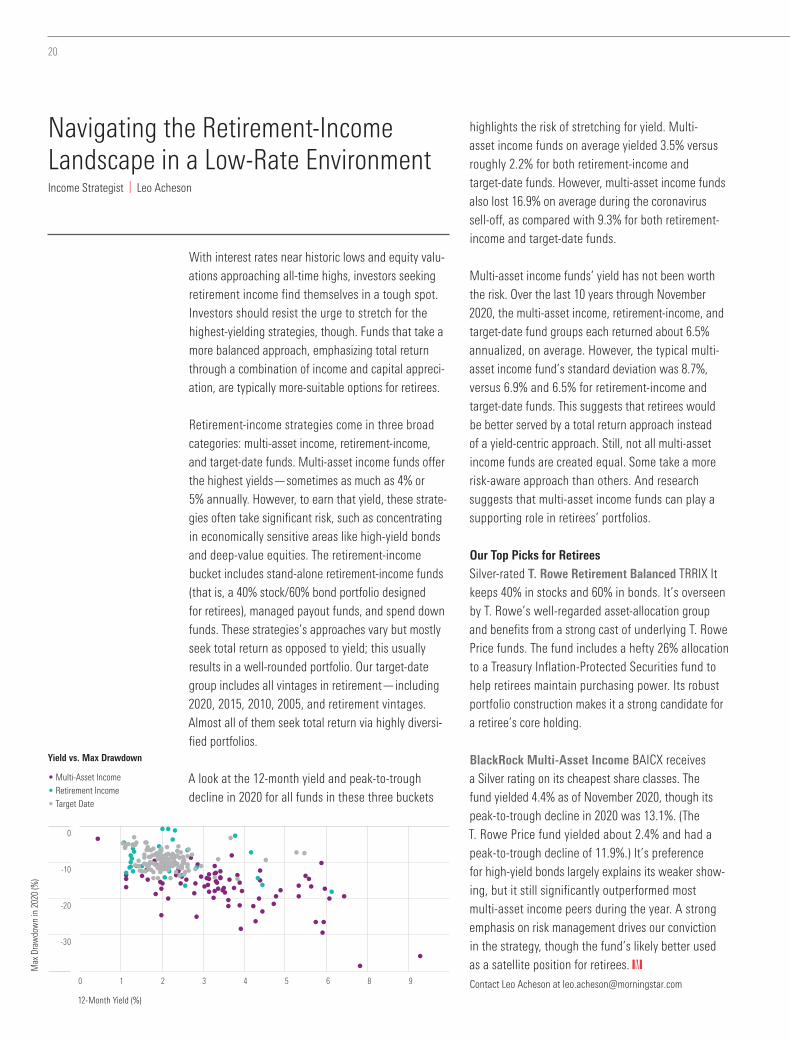
20
0
-10
-20
-30
0 1 2 3 4 5 6 8 9
With interest rates near historic lows and equity valu-ations approaching all-time highs, investors seeking retirement income find themselves in a tough spot. Investors should resist the urge to stretch for the highest-yielding strategies, though. Funds that take a more balanced approach, emphasizing total return through a combination of income and capital appreci-ation, are typically more-suitable options for retirees.
Retirement-income strategies come in three broad categories: multi-asset income, retirement-income, and target-date funds. Multi-asset income funds offer the highest yields—sometimes as much as 4% or 5% annually. However, to earn that yield, these strate-gies often take significant risk, such as concentrating in economically sensitive areas like high-yield bonds and deep-value equities. The retirement-income bucket includes stand-alone retirement-income funds (that is, a 40% stock/60% bond portfolio designed for retirees), managed payout funds, and spend down funds. These strategies’s approaches vary but mostly seek total return as opposed to yield; this usually results in a well-rounded portfolio. Our target-date group includes all vintages in retirement—including 2020, 2015, 2010, 2005, and retirement vintages. Almost all of them seek total return via highly diversi-fied portfolios.
A look at the 12-month yield and peak-to-trough decline in 2020 for all funds in these three buckets
highlights the risk of stretching for yield. Multi- asset income funds on average yielded 3.5% versus roughly 2.2% for both retirement-income and target-date funds. However, multi-asset income funds also lost 16.9% on average during the coronavirus sell-off, as compared with 9.3% for both retirement-income and target-date funds.
Multi-asset income funds’ yield has not been worth the risk. Over the last 10 years through November 2020, the multi-asset income, retirement-income, and target-date fund groups each returned about 6.5% annualized, on average. However, the typical multi-asset income fund’s standard deviation was 8.7%, versus 6.9% and 6.5% for retirement-income and target-date funds. This suggests that retirees would be better served by a total return approach instead of a yield-centric approach. Still, not all multi-asset income funds are created equal. Some take a more risk-aware approach than others. And research suggests that multi-asset income funds can play a supporting role in retirees’ portfolios.
Our Top Picks for RetireesSilver-rated T. Rowe Retirement Balanced TRRIX It keeps 40% in stocks and 60% in bonds. It’s overseen by T. Rowe’s well-regarded asset-allocation group and benefits from a strong cast of underlying T. Rowe Price funds. The fund includes a hefty 26% allocation to a Treasury Inflation-Protected Securities fund to help retirees maintain purchasing power. Its robust portfolio construction makes it a strong candidate for a retiree’s core holding.
BlackRock Multi-Asset Income BAICX receives a Silver rating on its cheapest share classes. The fund yielded 4.4% as of November 2020, though its peak-to-trough decline in 2020 was 13.1%. (The T. Rowe Price fund yielded about 2.4% and had a peak-to-trough decline of 11.9%.) It’s preference for high-yield bonds largely explains its weaker show- ing, but it still significantly outperformed most multi-asset income peers during the year. A strong emphasis on risk management drives our conviction in the strategy, though the fund’s likely better used as a satellite position for retirees. KContact Leo Acheson at [email protected]
Navigating the Retirement-Income Landscape in a Low-Rate EnvironmentIncome Strategist | Leo Acheson
Yield vs. Max Drawdown
• Multi-Asset Income
• Retirement Income
• Target Date
12-Month Yield (%)
Max
Dra
wdo
wn
in 2
020
(%)
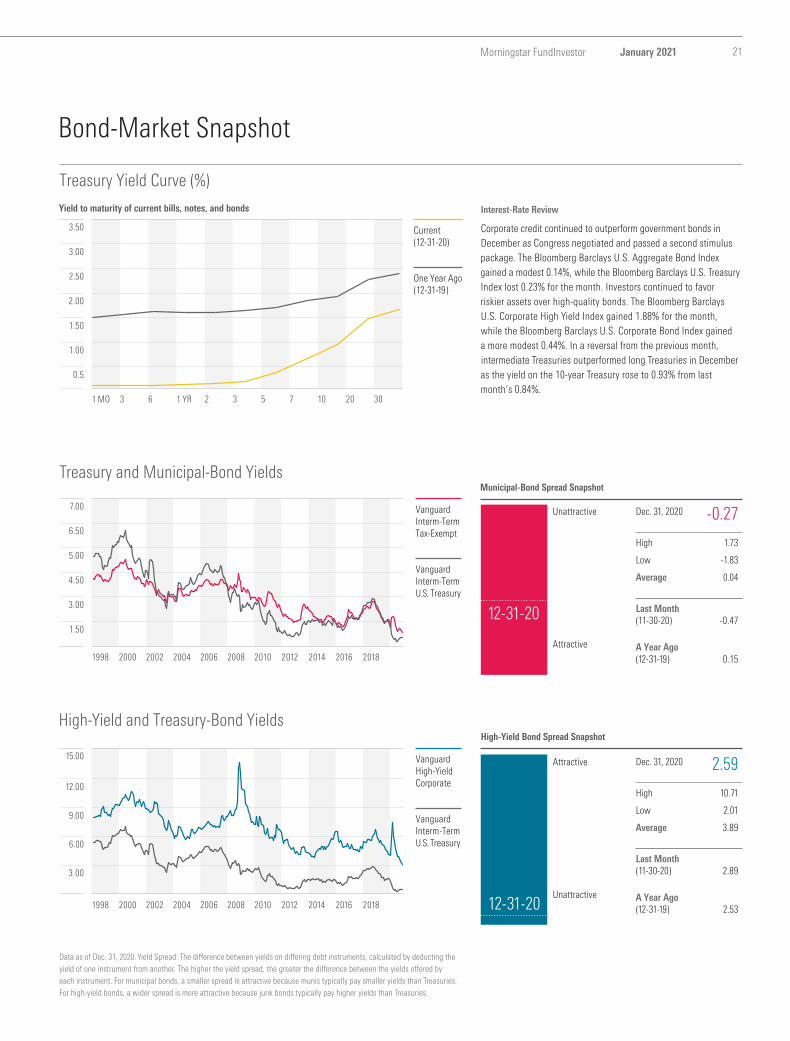
21Morningstar FundInvestor January 2021
15.00
12.00
9.00
6.00
3.00
1998 2000 2002 2004 2006 2008 2010 2012 2014 2016 2018
Bond-Market Snapshot
Interest-Rate Review
Treasury Yield Curve (%)
Yield to maturity of current bills, notes, and bonds
Vanguard High-Yield Corporate
Vanguard Interm-Term U.S. Treasury
Treasury and Municipal-Bond Yields
High-Yield and Treasury-Bond Yields
Municipal-Bond Spread Snapshot
Unattractive
Attractive
High-Yield Bond Spread Snapshot
Attractive
Unattractive
7.00
6.50
5.00
4.50
3.00
1.50
1998 2000 2002 2004 2006 2008 2010 2012 2014 2016 2018
Vanguard Interm-Term Tax-Exempt
Vanguard Interm-Term U.S. Treasury
Data as of Dec. 31, 2020. Yield Spread: The difference between yields on differing debt instruments, calculated by deducting the yield of one instrument from another. The higher the yield spread, the greater the difference between the yields offered by each instrument. For municipal bonds, a smaller spread is attractive because munis typically pay smaller yields than Treasuries. For high-yield bonds, a wider spread is more attractive because junk bonds typically pay higher yields than Treasuries.
Dec. 31, 2020 -0.27
High 1.73
Low -1.83
Average 0.04
Last Month (11-30-20) -0.47
A Year Ago (12-31-19) 0.15
Dec. 31, 2020 2.59
High 10.71
Low 2.01
Average 3.89
Last Month (11-30-20) 2.89
A Year Ago (12-31-19) 2.53
12-31-20
12-31-20
Corporate credit continued to outperform government bonds in December as Congress negotiated and passed a second stimulus package. The Bloomberg Barclays U.S. Aggregate Bond Index gained a modest 0.14%, while the Bloomberg Barclays U.S. Treasury Index lost 0.23% for the month. Investors continued to favor riskier assets over high-quality bonds. The Bloomberg Barclays U.S. Corporate High Yield Index gained 1.88% for the month, while the Bloomberg Barclays U.S. Corporate Bond Index gained a more modest 0.44%. In a reversal from the previous month, intermediate Treasuries outperformed long Treasuries in December as the yield on the 10-year Treasury rose to 0.93% from last month’s 0.84%.
3.50
3.00
2.50
2.00
1.50
1.00
0.5
1 MO 3 6 1 YR 2 3 5 7 10 20 30
Current (12-31-20)
One Year Ago (12-31-19)

22
I’m adding Tributary Small Company FOSCX and MFS Aggressive Growth Allocation MAAGX to the Morningstar 500.
When funds are labeled “aggressive allocation,” it refers mainly to the high equity weighting rather than the strategy on the equity portfolio. MFS Aggressive Allocation Growth is a diffuse portfolio of 22 MFS funds spanning value to growth and U.S. to foreign equities. The fund has about 80% to 90% in equities, with a smattering of commodities, bonds, and cash to round things out.
So, it really is closer in spirit to a target-date fund in that it is meant to be close to a single holding for investors, only in this case the allocation doesn’t gradually dial back risk over the years. The fund, which has a Morningstar Analyst Rating of Bronze, can serve as a good starter fund for a new investor who doesn’t want to spend much time selecting and monitoring investments.
We just started coverage of Tributary Small Company at a Bronze rating. Although it is labeled institutional, you can buy it for no fee and a $2,500 minimum in most No Transaction Fee supermarkets.
Lead manager Mark Wynegar runs the fund, which outlegs its benchmark and peers. Wynegar works with five analysts to find companies with durable sustainable advantages that are trading at modest prices. And, yes, that sounds rather like Warren Buffett for the Omaha-based team.
See the facing page for details.
To make room, I’m cutting Vanguard Managed Allocation VPGDX, which had previously been Vanguard Managed Payout. Also leaving is William Blair Small Cap Growth WBSNX. Both funds lack an Analyst Rating. K
What is Morningstar
FundInvestor 500?
The Morningstar FundInvestor
500 features the industry’s
best and most notable funds.
Use the list to get new in-
vestment ideas and track the
funds you already own.
FundInvestor subscribers have
access to one-page monthly
reports on all 500 funds on
mfi.morningstar.com. Just
type in the name or ticker of
the fund in the search box.
A Small-Cap Fund From Omaha Joins the 500 Changes to the 500 | Russel Kinnel
Summary of Changes
Add Drop
MFS Aggressive Growth Alloc MAAGX Vanguard Managed Alloc VPGDX
Tributary Small Company FOSCX William Blair Sm Cap Gr WBSNX
Rating Change (Upgrades) From To
American Beacon Small Cp Val AVPAX ‰ ´
FMI Large Cap FMIHX • Œ
Vanguard FTSE All-Wld ex-US VFWAX • Œ
WCM Focused Int’l Growth WCMRX ´ •
Rating Change (Downgrades) From To
Boston Partners Lng/Shrt Rsrch BPRRX ´ ‰
ClearBridge Aggressive Growth SHRAX ´ ‰
Transamerica Large Cap Value TWQAX ´ ‰
Vanguard Developed Mkts Idx VTMGX Œ •
Rating Change (New) To
Baron Discovery BDFFX ´
Tributary Small Company FOSCX ´
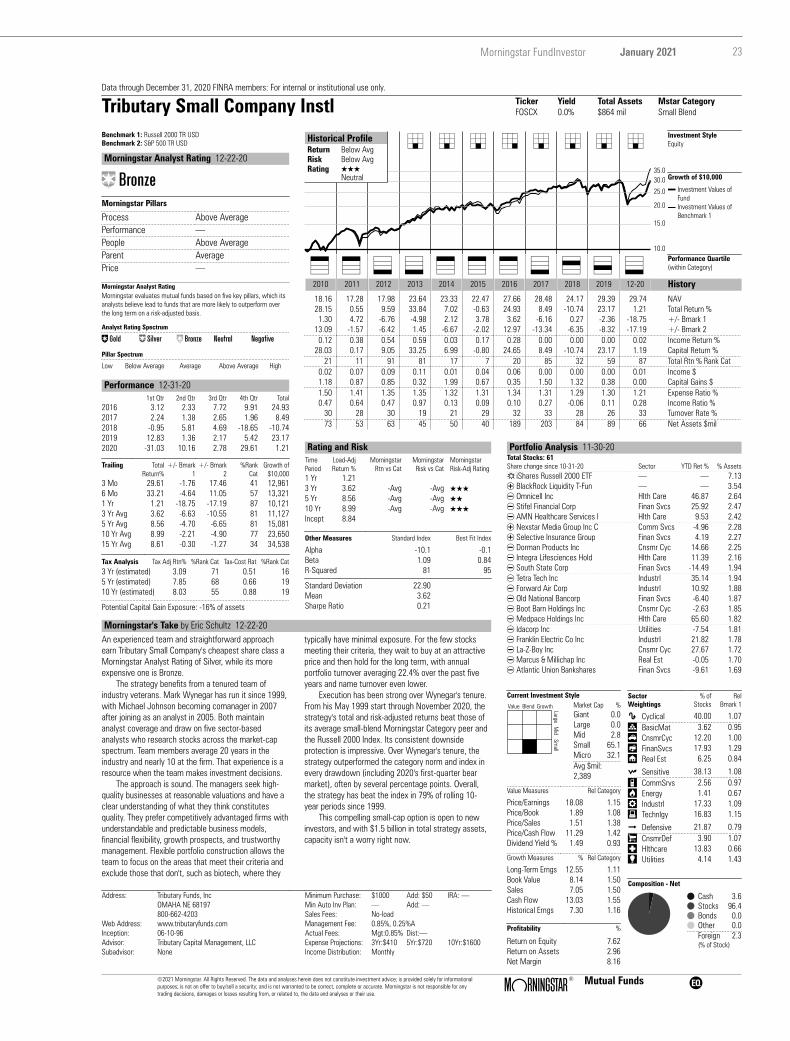
23Morningstar FundInvestor January 2021
Data through December 31, 2020 FINRA members: For internal or institutional use only.
Tributary Small Company Instl TickerFOSCX
Yield0.0%
Total Assets$864 mil
Mstar CategorySmall Blend
Benchmark 1: Russell 2000 TR USDBenchmark 2: S&P 500 TR USD
Morningstar Analyst Rating 12-22-20
´Morningstar Pillars
Process Above AveragePerformance —People Above AverageParent AveragePrice —
Morningstar Analyst RatingMorningstar evaluates mutual funds based on five key pillars, which itsanalysts believe lead to funds that are more likely to outperform overthe long term on a risk-adjusted basis.
Analyst Rating Spectrum
Œ „ ´ ‰ Á
Pillar Spectrum
Low Below Average Average Above Average High
10.0
15.0
20.0
25.0
30.035.0
Historical ProfileReturnRiskRating
Below AvgBelow AvgQQQNeutral
6 6 6 9 6 6 6 6 Investment StyleEquity
Growth of $10,000
Investment Values ofFundInvestment Values ofBenchmark 1
& & ) ) & & & ) * ( )Performance Quartile(within Category)
2010 2011 2012 2013 2014 2015 2016 2017 2018 2019 12-20 History18.16 17.28 17.98 23.64 23.33 22.47 27.66 28.48 24.17 29.39 29.74 NAV28.15 0.55 9.59 33.84 7.02 -0.63 24.93 8.49 -10.74 23.17 1.21 Total Return %1.30 4.72 -6.76 -4.98 2.12 3.78 3.62 -6.16 0.27 -2.36 -18.75 +/- Bmark 1
13.09 -1.57 -6.42 1.45 -6.67 -2.02 12.97 -13.34 -6.35 -8.32 -17.19 +/- Bmark 20.12 0.38 0.54 0.59 0.03 0.17 0.28 0.00 0.00 0.00 0.02 Income Return %
28.03 0.17 9.05 33.25 6.99 -0.80 24.65 8.49 -10.74 23.17 1.19 Capital Return %21 11 91 81 17 7 20 85 32 59 87 Total Rtn % Rank Cat
0.02 0.07 0.09 0.11 0.01 0.04 0.06 0.00 0.00 0.00 0.01 Income $1.18 0.87 0.85 0.32 1.99 0.67 0.35 1.50 1.32 0.38 0.00 Capital Gains $1.50 1.41 1.35 1.35 1.32 1.31 1.34 1.31 1.29 1.30 1.21 Expense Ratio %0.47 0.64 0.47 0.97 0.13 0.09 0.10 0.27 -0.06 0.11 0.28 Income Ratio %
30 28 30 19 21 29 32 33 28 26 33 Turnover Rate %73 53 63 45 50 40 189 203 84 89 66 Net Assets $mil
Performance 12-31-201st Qtr 2nd Qtr 3rd Qtr 4th Qtr Total
2016 3.12 2.33 7.72 9.91 24.932017 2.24 1.38 2.65 1.96 8.492018 -0.95 5.81 4.69 -18.65 -10.742019 12.83 1.36 2.17 5.42 23.172020 -31.03 10.16 2.78 29.61 1.21
Trailing TotalReturn%
+/- Bmark1
+/- Bmark2
%RankCat
Growth of$10,000
3 Mo 29.61 -1.76 17.46 41 12,9616 Mo 33.21 -4.64 11.05 57 13,3211 Yr 1.21 -18.75 -17.19 87 10,1213 Yr Avg 3.62 -6.63 -10.55 81 11,1275 Yr Avg 8.56 -4.70 -6.65 81 15,08110 Yr Avg 8.99 -2.21 -4.90 77 23,65015 Yr Avg 8.61 -0.30 -1.27 34 34,538
Tax Analysis Tax Adj Rtn% %Rank Cat Tax-Cost Rat %Rank Cat3 Yr (estimated) 3.09 71 0.51 165 Yr (estimated) 7.85 68 0.66 1910 Yr (estimated) 8.03 55 0.88 19
Potential Capital Gain Exposure: -16% of assets
Rating and RiskTimePeriod
Load-AdjReturn %
MorningstarRtn vs Cat
MorningstarRisk vs Cat
MorningstarRisk-Adj Rating
1 Yr 1.213 Yr 3.62 -Avg -Avg QQQ5 Yr 8.56 -Avg -Avg QQ10 Yr 8.99 -Avg -Avg QQQIncept 8.84
Other Measures Standard Index Best Fit Index
Alpha -10.1 -0.1Beta 1.09 0.84R-Squared 81 95
Standard Deviation 22.90Mean 3.62Sharpe Ratio 0.21
Portfolio Analysis 11-30-20Total Stocks: 61Share change since 10-31-20 Sector YTD Ret % % AssetsRiShares Russell 2000 ETF — — 7.13TBlackRock Liquidity T-Fun — — 3.54YOmnicell Inc Hlth Care 46.87 2.64YStifel Financial Corp Finan Svcs 25.92 2.47YAMN Healthcare Services I Hlth Care 9.53 2.42TNexstar Media Group Inc C Comm Svcs -4.96 2.28TSelective Insurance Group Finan Svcs 4.19 2.27YDorman Products Inc Cnsmr Cyc 14.66 2.25YIntegra Lifesciences Hold Hlth Care 11.39 2.16YSouth State Corp Finan Svcs -14.49 1.94YTetra Tech Inc Industrl 35.14 1.94YForward Air Corp Industrl 10.92 1.88YOld National Bancorp Finan Svcs -6.40 1.87YBoot Barn Holdings Inc Cnsmr Cyc -2.63 1.85YMedpace Holdings Inc Hlth Care 65.60 1.82YIdacorp Inc Utilities -7.54 1.81YFranklin Electric Co Inc Industrl 21.82 1.78YLa-Z-Boy Inc Cnsmr Cyc 27.67 1.72YMarcus & Millichap Inc Real Est -0.05 1.70YAtlantic Union Bankshares Finan Svcs -9.61 1.69
Current Investment Style
LargeM
idSm
all
Value Blend Growth Market Cap %Giant 0.0Large 0.0Mid 2.8Small 65.1Micro 32.1Avg $mil:2,389
Value Measures Rel Category
Price/Earnings 18.08 1.15Price/Book 1.89 1.08Price/Sales 1.51 1.38Price/Cash Flow 11.29 1.42Dividend Yield % 1.49 0.93
Growth Measures % Rel Category
Long-Term Erngs 12.55 1.11Book Value 8.14 1.50Sales 7.05 1.50Cash Flow 13.03 1.55Historical Erngs 7.30 1.16
Profitability %
Return on Equity 7.62Return on Assets 2.96Net Margin 8.16
SectorWeightings
% ofStocks
RelBmark 1
h Cyclical 40.00 1.07r BasicMat 3.62 0.95t CnsmrCyc 12.20 1.00y FinanSvcs 17.93 1.29u Real Est 6.25 0.84
j Sensitive 38.13 1.08i CommSrvs 2.56 0.97o Energy 1.41 0.67p Industrl 17.33 1.09a Technlgy 16.83 1.15
k Defensive 21.87 0.79s CnsmrDef 3.90 1.07d Hlthcare 13.83 0.66f Utilities 4.14 1.43
Composition - Net
Cash 3.6Stocks 96.4Bonds 0.0Other 0.0Foreign 2.3(% of Stock)
Morningstar's Take by Eric Schultz 12-22-20An experienced team and straightforward approachearn Tributary Small Company's cheapest share class aMorningstar Analyst Rating of Silver, while its moreexpensive one is Bronze.
The strategy benefits from a tenured team ofindustry veterans. Mark Wynegar has run it since 1999,with Michael Johnson becoming comanager in 2007after joining as an analyst in 2005. Both maintainanalyst coverage and draw on five sector-basedanalysts who research stocks across the market-capspectrum. Team members average 20 years in theindustry and nearly 10 at the firm. That experience is aresource when the team makes investment decisions.
The approach is sound. The managers seek high-quality businesses at reasonable valuations and have aclear understanding of what they think constitutesquality. They prefer competitively advantaged firms withunderstandable and predictable business models,financial flexibility, growth prospects, and trustworthymanagement. Flexible portfolio construction allows theteam to focus on the areas that meet their criteria andexclude those that don't, such as biotech, where they
typically have minimal exposure. For the few stocksmeeting their criteria, they wait to buy at an attractiveprice and then hold for the long term, with annualportfolio turnover averaging 22.4% over the past fiveyears and name turnover even lower.
Execution has been strong over Wynegar's tenure.From his May 1999 start through November 2020, thestrategy's total and risk-adjusted returns beat those ofits average small-blend Morningstar Category peer andthe Russell 2000 Index. Its consistent downsideprotection is impressive. Over Wynegar's tenure, thestrategy outperformed the category norm and index inevery drawdown (including 2020's first-quarter bearmarket), often by several percentage points. Overall,the strategy has beat the index in 79% of rolling 10-year periods since 1999.
This compelling small-cap option is open to newinvestors, and with $1.5 billion in total strategy assets,capacity isn't a worry right now.
Address: Tributary Funds, Inc Minimum Purchase: $1000 Add: $50 IRA: —OMAHA NE 68197 Min Auto Inv Plan: — Add: —800-662-4203 Sales Fees: No-load
Web Address: www.tributaryfunds.com Management Fee: 0.85%, 0.25%AInception: 06-10-96 Actual Fees: Mgt:0.85% Dist:—Advisor: Tributary Capital Management, LLC Expense Projections: 3Yr:$410 5Yr:$720 10Yr:$1600Subadvisor: None Income Distribution: Monthly
©2021 Morningstar. All Rights Reserved. The data and analyses herein does not constitute investment advice; is provided solely for informationalpurposes; is not an offer to buy/sell a security; and is not warranted to be correct, complete or accurate. Morningstar is not responsible for anytrading decisions, damages or losses resulting from, or related to, the data and analyses or their use.
ß® Mutual Funds A
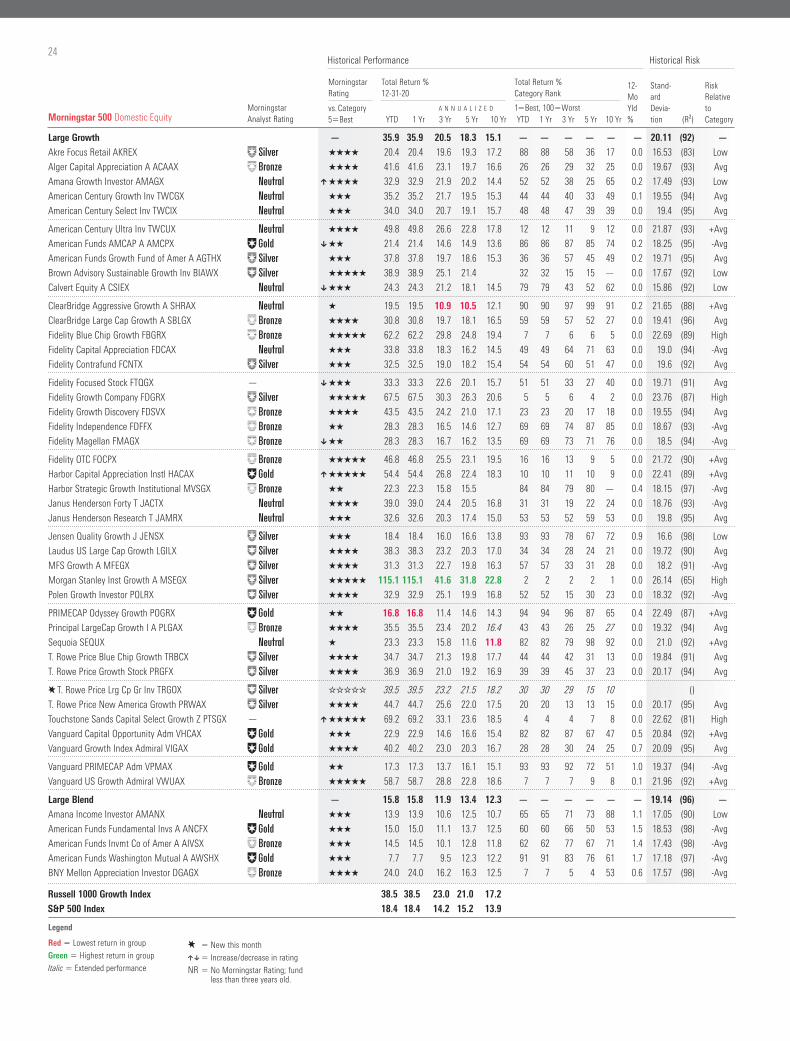
24
Morningstar Analyst Rating
Morningstar Rating
Total Return % 12-31-20
Total Return % Category Rank
12-MoYld %
Stand- ard Devia- tion (R²)
Risk Relative to Category
vs. Category5Best
A N N U A L I Z E D 1Best, 100WorstYTD 1 Yr 3 Yr 5 Yr 10 Yr YTD 1 Yr 3 Yr 5 Yr 10 Yr
Historical Performance Historical Risk
Morningstar 500 Domestic Equity
Large Growth — 35.9 35.9 20.5 18.3 15.1 — — — — — — 20.11 (92) —
Akre Focus Retail AKREX „ QQQQ 20.4 20.4 19.6 19.3 17.2 88 88 58 36 17 0.0 16.53 (83) Low
Alger Capital Appreciation A ACAAX ´ QQQQ 41.6 41.6 23.1 19.7 16.6 26 26 29 32 25 0.0 19.67 (93) Avg
Amana Growth Investor AMAGX ˇ ] QQQQ 32.9 32.9 21.9 20.2 14.4 52 52 38 25 65 0.2 17.49 (93) Low
American Century Growth Inv TWCGX ˇ QQQ 35.2 35.2 21.7 19.5 15.3 44 44 40 33 49 0.1 19.55 (94) Avg
American Century Select Inv TWCIX ˇ QQQ 34.0 34.0 20.7 19.1 15.7 48 48 47 39 39 0.0 19.4 (95) Avg
American Century Ultra Inv TWCUX ˇ QQQQ 49.8 49.8 26.6 22.8 17.8 12 12 11 9 12 0.0 21.87 (93) +Avg
American Funds AMCAP A AMCPX Π[ QQ 21.4 21.4 14.6 14.9 13.6 86 86 87 85 74 0.2 18.25 (95) -Avg
American Funds Growth Fund of Amer A AGTHX „ QQQ 37.8 37.8 19.7 18.6 15.3 36 36 57 45 49 0.2 19.71 (95) Avg
Brown Advisory Sustainable Growth Inv BIAWX „ QQQQQ 38.9 38.9 25.1 21.4 32 32 15 15 — 0.0 17.67 (92) Low
Calvert Equity A CSIEX ˇ [ QQQ 24.3 24.3 21.2 18.1 14.5 79 79 43 52 62 0.0 15.86 (92) Low
ClearBridge Aggressive Growth A SHRAX ˇ Q 19.5 19.5 10.9 10.5 12.1 90 90 97 99 91 0.2 21.65 (88) +Avg
ClearBridge Large Cap Growth A SBLGX ´ QQQQ 30.8 30.8 19.7 18.1 16.5 59 59 57 52 27 0.0 19.41 (96) Avg
Fidelity Blue Chip Growth FBGRX ´ QQQQQ 62.2 62.2 29.8 24.8 19.4 7 7 6 6 5 0.0 22.69 (89) High
Fidelity Capital Appreciation FDCAX ˇ QQQ 33.8 33.8 18.3 16.2 14.5 49 49 64 71 63 0.0 19.0 (94) -Avg
Fidelity Contrafund FCNTX „ QQQ 32.5 32.5 19.0 18.2 15.4 54 54 60 51 47 0.0 19.6 (92) Avg
Fidelity Focused Stock FTQGX — [ QQQ 33.3 33.3 22.6 20.1 15.7 51 51 33 27 40 0.0 19.71 (91) Avg
Fidelity Growth Company FDGRX „ QQQQQ 67.5 67.5 30.3 26.3 20.6 5 5 6 4 2 0.0 23.76 (87) High
Fidelity Growth Discovery FDSVX ´ QQQQ 43.5 43.5 24.2 21.0 17.1 23 23 20 17 18 0.0 19.55 (94) Avg
Fidelity Independence FDFFX ´ QQ 28.3 28.3 16.5 14.6 12.7 69 69 74 87 85 0.0 18.67 (93) -Avg
Fidelity Magellan FMAGX ´ [ QQ 28.3 28.3 16.7 16.2 13.5 69 69 73 71 76 0.0 18.5 (94) -Avg
Fidelity OTC FOCPX ´ QQQQQ 46.8 46.8 25.5 23.1 19.5 16 16 13 9 5 0.0 21.72 (90) +Avg
Harbor Capital Appreciation Instl HACAX Π] QQQQQ 54.4 54.4 26.8 22.4 18.3 10 10 11 10 9 0.0 22.41 (89) +Avg
Harbor Strategic Growth Institutional MVSGX ´ QQ 22.3 22.3 15.8 15.5 84 84 79 80 — 0.4 18.15 (97) -Avg
Janus Henderson Forty T JACTX ˇ QQQQ 39.0 39.0 24.4 20.5 16.8 31 31 19 22 24 0.0 18.76 (93) -Avg
Janus Henderson Research T JAMRX ˇ QQQ 32.6 32.6 20.3 17.4 15.0 53 53 52 59 53 0.0 19.8 (95) Avg
Jensen Quality Growth J JENSX „ QQQ 18.4 18.4 16.0 16.6 13.8 93 93 78 67 72 0.9 16.6 (98) Low
Laudus US Large Cap Growth LGILX „ QQQQ 38.3 38.3 23.2 20.3 17.0 34 34 28 24 21 0.0 19.72 (90) Avg
MFS Growth A MFEGX „ QQQQ 31.3 31.3 22.7 19.8 16.3 57 57 33 31 28 0.0 18.2 (91) -Avg
Morgan Stanley Inst Growth A MSEGX „ QQQQQ 115.1 115.1 41.6 31.8 22.8 2 2 2 2 1 0.0 26.14 (65) High
Polen Growth Investor POLRX „ QQQQ 32.9 32.9 25.1 19.9 16.8 52 52 15 30 23 0.0 18.32 (92) -Avg
PRIMECAP Odyssey Growth POGRX ΠQQ 16.8 16.8 11.4 14.6 14.3 94 94 96 87 65 0.4 22.49 (87) +Avg
Principal LargeCap Growth I A PLGAX ´ QQQQ 35.5 35.5 23.4 20.2 16.4 43 43 26 25 27 0.0 19.32 (94) Avg
Sequoia SEQUX ˇ Q 23.3 23.3 15.8 11.6 11.8 82 82 79 98 92 0.0 21.0 (92) +Avg
T. Rowe Price Blue Chip Growth TRBCX „ QQQQ 34.7 34.7 21.3 19.8 17.7 44 44 42 31 13 0.0 19.84 (91) Avg
T. Rowe Price Growth Stock PRGFX „ QQQQ 36.9 36.9 21.0 19.2 16.9 39 39 45 37 23 0.0 20.17 (94) Avg
ET. Rowe Price Lrg Cp Gr Inv TRGOX „ WWWWW 39.5 39.5 23.2 21.5 18.2 30 30 29 15 10 ()
T. Rowe Price New America Growth PRWAX „ QQQQ 44.7 44.7 25.6 22.0 17.5 20 20 13 13 15 0.0 20.17 (95) Avg
Touchstone Sands Capital Select Growth Z PTSGX — ] QQQQQ 69.2 69.2 33.1 23.6 18.5 4 4 4 7 8 0.0 22.62 (81) High
Vanguard Capital Opportunity Adm VHCAX ΠQQQ 22.9 22.9 14.6 16.6 15.4 82 82 87 67 47 0.5 20.84 (92) +Avg
Vanguard Growth Index Admiral VIGAX ΠQQQQ 40.2 40.2 23.0 20.3 16.7 28 28 30 24 25 0.7 20.09 (95) Avg
Vanguard PRIMECAP Adm VPMAX ΠQQ 17.3 17.3 13.7 16.1 15.1 93 93 92 72 51 1.0 19.37 (94) -Avg
Vanguard US Growth Admiral VWUAX ´ QQQQQ 58.7 58.7 28.8 22.8 18.6 7 7 7 9 8 0.1 21.96 (92) +Avg
Large Blend — 15.8 15.8 11.9 13.4 12.3 — — — — — — 19.14 (96) —
Amana Income Investor AMANX ˇ QQQ 13.9 13.9 10.6 12.5 10.7 65 65 71 73 88 1.1 17.05 (90) Low
American Funds Fundamental Invs A ANCFX ΠQQQ 15.0 15.0 11.1 13.7 12.5 60 60 66 50 53 1.5 18.53 (98) -Avg
American Funds Invmt Co of Amer A AIVSX ´ QQQ 14.5 14.5 10.1 12.8 11.8 62 62 77 67 71 1.4 17.43 (98) -Avg
American Funds Washington Mutual A AWSHX ΠQQQ 7.7 7.7 9.5 12.3 12.2 91 91 83 76 61 1.7 17.18 (97) -Avg
BNY Mellon Appreciation Investor DGAGX ´ QQQQ 24.0 24.0 16.2 16.3 12.5 7 7 5 4 53 0.6 17.57 (98) -Avg
Legend
E New this month
][ Increase/decrease in rating
NR No Morningstar Rating; fund less than three years old.
Red Lowest return in group
Green Highest return in group
Italic Extended performance
Russell 1000 Growth Index 38.5 38.5 23.0 21.0 17.2 36.9 11.7 263,675
S&P 500 Index 18.4 18.4 14.2 15.2 13.9 28.3 4.0 176,727
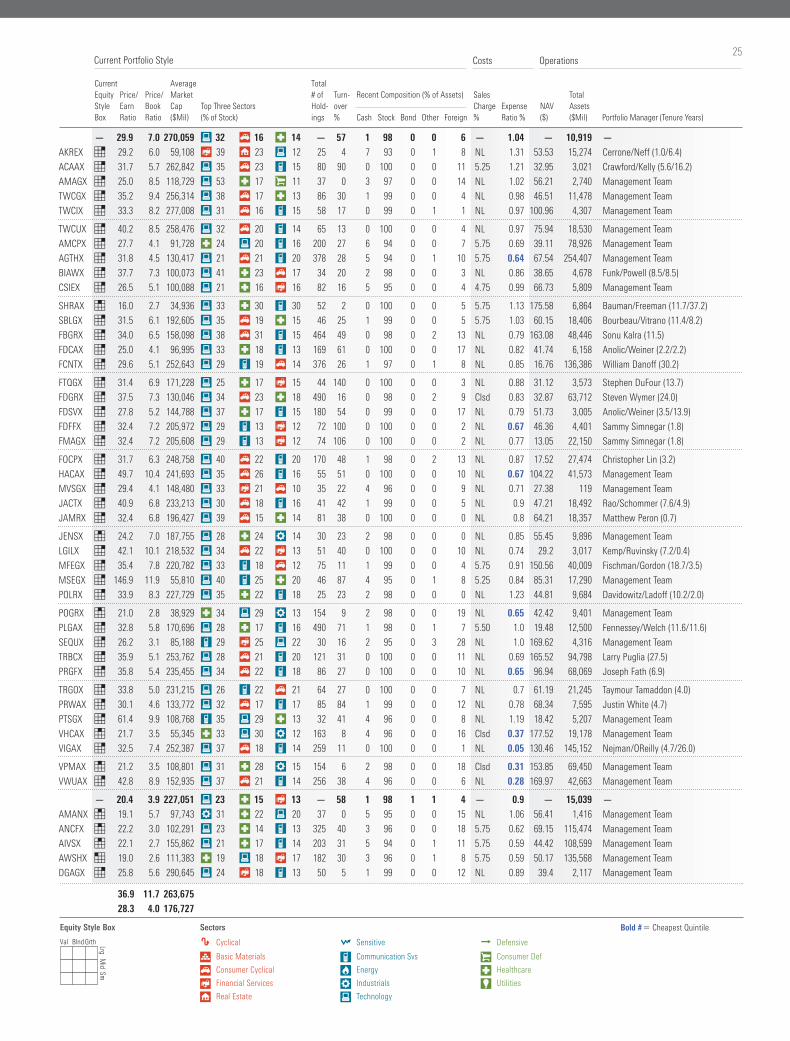
25Costs Operations
Current Equity Style Box
Price/EarnRatio
Price/BookRatio
AverageMarketCap($Mil)
Top Three Sectors (% of Stock)
Total# ofHold-ings
Turn-over%
Recent Composition (% of Assets) Sales
Charge %
Expense Ratio %
NAV ($)
Total Assets ($Mil) Portfolio Manager (Tenure Years)Cash Stock Bond Other Foreign
Current Portfolio Style
— 29.9 7.0 270,059 a 32 t 16 d 14 — 57 1 98 0 0 6 — 1.04 — 10,919 —
AKREX 7 29.2 6.0 59,108 y 39 u 23 a 12 25 4 7 93 0 1 8 NL 1.31 53.53 15,274 Cerrone/Neff (1.0/6.4)
ACAAX 7 31.7 5.7 262,842 a 35 t 23 i 15 80 90 0 100 0 0 11 5.25 1.21 32.95 3,021 Crawford/Kelly (5.6/16.2)
AMAGX 7 25.0 8.5 118,729 a 53 d 17 s 11 37 0 3 97 0 0 14 NL 1.02 56.21 2,740 Management Team
TWCGX 7 35.2 9.4 256,314 a 38 t 17 d 13 86 30 1 99 0 0 4 NL 0.98 46.51 11,478 Management Team
TWCIX 7 33.3 8.2 277,008 a 31 t 16 i 15 58 17 0 99 0 1 1 NL 0.97 100.96 4,307 Management Team
TWCUX 7 40.2 8.5 258,476 a 32 t 20 i 14 65 13 0 100 0 0 4 NL 0.97 75.94 18,530 Management Team
AMCPX 7 27.7 4.1 91,728 d 24 a 20 i 16 200 27 6 94 0 0 7 5.75 0.69 39.11 78,926 Management Team
AGTHX 7 31.8 4.5 130,417 a 21 t 21 i 20 378 28 5 94 0 1 10 5.75 0.64 67.54 254,407 Management Team
BIAWX 7 37.7 7.3 100,073 a 41 d 23 t 17 34 20 2 98 0 0 3 NL 0.86 38.65 4,678 Funk/Powell (8.5/8.5)
CSIEX 7 26.5 5.1 100,088 a 21 d 16 y 16 82 16 5 95 0 0 4 4.75 0.99 66.73 5,809 Management Team
SHRAX 4 16.0 2.7 34,936 a 33 d 30 i 30 52 2 0 100 0 0 5 5.75 1.13 175.58 6,864 Bauman/Freeman (11.7/37.2)
SBLGX 7 31.5 6.1 192,605 a 35 t 19 d 15 46 25 1 99 0 0 5 5.75 1.03 60.15 18,406 Bourbeau/Vitrano (11.4/8.2)
FBGRX 7 34.0 6.5 158,098 a 38 t 31 i 15 464 49 0 98 0 2 13 NL 0.79 163.08 48,446 Sonu Kalra (11.5)
FDCAX 7 25.0 4.1 96,995 a 33 d 18 i 13 169 61 0 100 0 0 17 NL 0.82 41.74 6,158 Anolic/Weiner (2.2/2.2)
FCNTX 7 29.6 5.1 252,643 a 29 i 19 t 14 376 26 1 97 0 1 8 NL 0.85 16.76 136,386 William Danoff (30.2)
FTQGX 7 31.4 6.9 171,228 a 25 d 17 y 15 44 140 0 100 0 0 3 NL 0.88 31.12 3,573 Stephen DuFour (13.7)
FDGRX 7 37.5 7.3 130,046 a 34 t 23 d 18 490 16 0 98 0 2 9 Clsd 0.83 32.87 63,712 Steven Wymer (24.0)
FDSVX 7 27.8 5.2 144,788 a 37 d 17 i 15 180 54 0 99 0 0 17 NL 0.79 51.73 3,005 Anolic/Weiner (3.5/13.9)
FDFFX 7 32.4 7.2 205,972 a 29 i 13 y 12 72 100 0 100 0 0 2 NL 0.67 46.36 4,401 Sammy Simnegar (1.8)
FMAGX 7 32.4 7.2 205,608 a 29 i 13 y 12 74 106 0 100 0 0 2 NL 0.77 13.05 22,150 Sammy Simnegar (1.8)
FOCPX 7 31.7 6.3 248,758 a 40 t 22 i 20 170 48 1 98 0 2 13 NL 0.87 17.52 27,474 Christopher Lin (3.2)
HACAX 7 49.7 10.4 241,693 a 35 t 26 i 16 55 51 0 100 0 0 10 NL 0.67 104.22 41,573 Management Team
MVSGX 7 29.4 4.1 148,480 a 33 y 21 t 10 35 22 4 96 0 0 9 NL 0.71 27.38 119 Management Team
JACTX 7 40.9 6.8 233,213 a 30 t 18 i 16 41 42 1 99 0 0 5 NL 0.9 47.21 18,492 Rao/Schommer (7.6/4.9)
JAMRX 7 32.4 6.8 196,427 a 39 t 15 d 14 81 38 0 100 0 0 0 NL 0.8 64.21 18,357 Matthew Peron (0.7)
JENSX 4 24.2 7.0 187,755 a 28 d 24 p 14 30 23 2 98 0 0 0 NL 0.85 55.45 9,896 Management Team
LGILX 7 42.1 10.1 218,532 a 34 t 22 y 13 51 40 0 100 0 0 10 NL 0.74 29.2 3,017 Kemp/Ruvinsky (7.2/0.4)
MFEGX 7 35.4 7.8 220,782 a 33 i 18 t 12 75 11 1 99 0 0 4 5.75 0.91 150.56 40,009 Fischman/Gordon (18.7/3.5)
MSEGX 7 146.9 11.9 55,810 a 40 i 25 d 20 46 87 4 95 0 1 8 5.25 0.84 85.31 17,290 Management Team
POLRX 7 33.9 8.3 227,729 a 35 d 22 i 18 25 23 2 98 0 0 0 NL 1.23 44.81 9,684 Davidowitz/Ladoff (10.2/2.0)
POGRX 4 21.0 2.8 38,929 d 34 a 29 p 13 154 9 2 98 0 0 19 NL 0.65 42.42 9,401 Management Team
PLGAX 7 32.8 5.8 170,696 a 28 d 17 i 16 490 71 1 98 0 1 7 5.50 1.0 19.48 12,500 Fennessey/Welch (11.6/11.6)
SEQUX 7 26.2 3.1 85,188 i 29 y 25 a 22 30 16 2 95 0 3 28 NL 1.0 169.62 4,316 Management Team
TRBCX 7 35.9 5.1 253,762 a 28 t 21 i 20 121 31 0 100 0 0 11 NL 0.69 165.52 94,798 Larry Puglia (27.5)
PRGFX 7 35.8 5.4 235,455 a 34 t 22 i 18 86 27 0 100 0 0 10 NL 0.65 96.94 68,069 Joseph Fath (6.9)
TRGOX 7 33.8 5.0 231,215 a 26 i 22 t 21 64 27 0 100 0 0 7 NL 0.7 61.19 21,245 Taymour Tamaddon (4.0)
PRWAX 7 30.1 4.6 133,772 a 32 t 17 i 17 85 84 1 99 0 0 12 NL 0.78 68.34 7,595 Justin White (4.7)
PTSGX 7 61.4 9.9 108,768 i 35 a 29 d 13 32 41 4 96 0 0 8 NL 1.19 18.42 5,207 Management Team
VHCAX 4 21.7 3.5 55,345 d 33 a 30 p 12 163 8 4 96 0 0 16 Clsd 0.37 177.52 19,178 Management Team
VIGAX 7 32.5 7.4 252,387 a 37 t 18 i 14 259 11 0 100 0 0 1 NL 0.05 130.46 145,152 Nejman/OReilly (4.7/26.0)
VPMAX 4 21.2 3.5 108,801 a 31 d 28 p 15 154 6 2 98 0 0 18 Clsd 0.31 153.85 69,450 Management Team
VWUAX 7 42.8 8.9 152,935 a 37 t 21 i 14 256 38 4 96 0 0 6 NL 0.28 169.97 42,663 Management Team
— 20.4 3.9 227,051 a 23 d 15 y 13 — 58 1 98 1 1 4 — 0.9 — 15,039 —
AMANX 4 19.1 5.7 97,743 p 31 d 22 a 20 37 0 5 95 0 0 15 NL 1.06 56.41 1,416 Management Team
ANCFX 4 22.2 3.0 102,291 a 23 d 14 i 13 325 40 3 96 0 0 18 5.75 0.62 69.15 115,474 Management Team
AIVSX 4 22.1 2.7 155,862 a 21 d 17 i 14 203 31 5 94 0 1 11 5.75 0.59 44.42 108,599 Management Team
AWSHX 1 19.0 2.6 111,383 d 19 a 18 y 17 182 30 3 96 0 1 8 5.75 0.59 50.17 135,568 Management Team
DGAGX 7 25.8 5.6 290,645 a 24 y 18 i 13 50 5 1 99 0 0 12 NL 0.89 39.4 2,117 Management Team
Bold # Cheapest QuintileEquity Style Box
Val Blnd Grth Lrg Mid Sm
Sectors
h Cyclical
r Basic Materials
t Consumer Cyclical
y Financial Services
u Real Estate
j Sensitive
i Communication Svs
o Energy
p Industrials
a Technology
k Defensive
s Consumer Def
d Healthcare
f Utilities
Russell 1000 Growth Index 38.5 38.5 23.0 21.0 17.2 36.9 11.7 263,675
S&P 500 Index 18.4 18.4 14.2 15.2 13.9 28.3 4.0 176,727
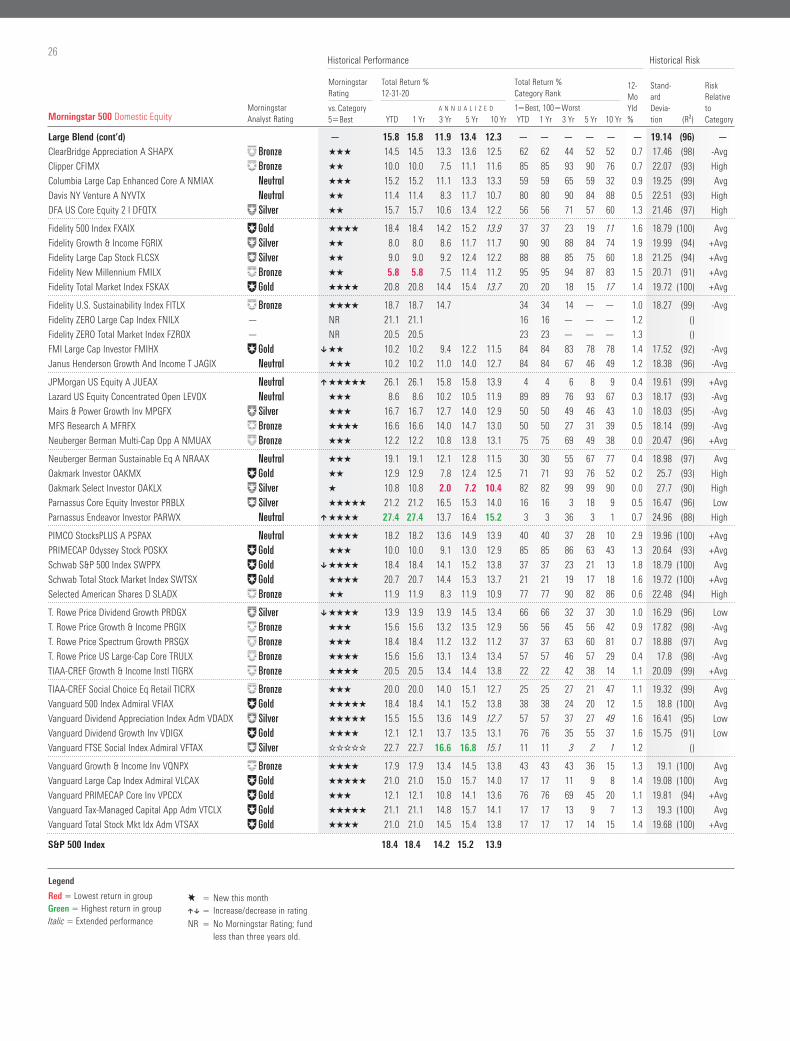
26
Morningstar Analyst Rating
Morningstar Rating
Total Return % 12-31-20
Total Return % Category Rank
12-MoYld %
Stand- ard Devia- tion (R²)
Risk Relative to Category
vs. Category5Best
A N N U A L I Z E D 1Best, 100WorstYTD 1 Yr 3 Yr 5 Yr 10 Yr YTD 1 Yr 3 Yr 5 Yr 10 Yr
Historical Performance Historical Risk
Morningstar 500 Domestic Equity
Large Blend (cont’d) — 15.8 15.8 11.9 13.4 12.3 — — — — — — 19.14 (96) —
ClearBridge Appreciation A SHAPX ´ QQQ 14.5 14.5 13.3 13.6 12.5 62 62 44 52 52 0.7 17.46 (98) -Avg
Clipper CFIMX ´ QQ 10.0 10.0 7.5 11.1 11.6 85 85 93 90 76 0.7 22.07 (93) High
Columbia Large Cap Enhanced Core A NMIAX ˇ QQQ 15.2 15.2 11.1 13.3 13.3 59 59 65 59 32 0.9 19.25 (99) Avg
Davis NY Venture A NYVTX ˇ QQ 11.4 11.4 8.3 11.7 10.7 80 80 90 84 88 0.5 22.51 (93) High
DFA US Core Equity 2 I DFQTX „ QQ 15.7 15.7 10.6 13.4 12.2 56 56 71 57 60 1.3 21.46 (97) High
Fidelity 500 Index FXAIX ΠQQQQ 18.4 18.4 14.2 15.2 13.9 37 37 23 19 11 1.6 18.79 (100) Avg
Fidelity Growth & Income FGRIX „ QQ 8.0 8.0 8.6 11.7 11.7 90 90 88 84 74 1.9 19.99 (94) +Avg
Fidelity Large Cap Stock FLCSX „ QQ 9.0 9.0 9.2 12.4 12.2 88 88 85 75 60 1.8 21.25 (94) +Avg
Fidelity New Millennium FMILX ´ QQ 5.8 5.8 7.5 11.4 11.2 95 95 94 87 83 1.5 20.71 (91) +Avg
Fidelity Total Market Index FSKAX ΠQQQQ 20.8 20.8 14.4 15.4 13.7 20 20 18 15 17 1.4 19.72 (100) +Avg
Fidelity U.S. Sustainability Index FITLX ´ QQQQ 18.7 18.7 14.7 34 34 14 — — 1.0 18.27 (99) -Avg
Fidelity ZERO Large Cap Index FNILX — NR 21.1 21.1 16 16 — — — 1.2 ()
Fidelity ZERO Total Market Index FZROX — NR 20.5 20.5 23 23 — — — 1.3 ()
FMI Large Cap Investor FMIHX Π[ QQ 10.2 10.2 9.4 12.2 11.5 84 84 83 78 78 1.4 17.52 (92) -Avg
Janus Henderson Growth And Income T JAGIX ˇ QQQ 10.2 10.2 11.0 14.0 12.7 84 84 67 46 49 1.2 18.38 (96) -Avg
JPMorgan US Equity A JUEAX ˇ ] QQQQQ 26.1 26.1 15.8 15.8 13.9 4 4 6 8 9 0.4 19.61 (99) +Avg
Lazard US Equity Concentrated Open LEVOX ˇ QQQ 8.6 8.6 10.2 10.5 11.9 89 89 76 93 67 0.3 18.17 (93) -Avg
Mairs & Power Growth Inv MPGFX „ QQQ 16.7 16.7 12.7 14.0 12.9 50 50 49 46 43 1.0 18.03 (95) -Avg
MFS Research A MFRFX ´ QQQQ 16.6 16.6 14.0 14.7 13.0 50 50 27 31 39 0.5 18.14 (99) -Avg
Neuberger Berman Multi-Cap Opp A NMUAX ´ QQQ 12.2 12.2 10.8 13.8 13.1 75 75 69 49 38 0.0 20.47 (96) +Avg
Neuberger Berman Sustainable Eq A NRAAX ˇ QQQ 19.1 19.1 12.1 12.8 11.5 30 30 55 67 77 0.4 18.98 (97) Avg
Oakmark Investor OAKMX ΠQQ 12.9 12.9 7.8 12.4 12.5 71 71 93 76 52 0.2 25.7 (93) High
Oakmark Select Investor OAKLX „ Q 10.8 10.8 2.0 7.2 10.4 82 82 99 99 90 0.0 27.7 (90) High
Parnassus Core Equity Investor PRBLX „ QQQQQ 21.2 21.2 16.5 15.3 14.0 16 16 3 18 9 0.5 16.47 (96) Low
Parnassus Endeavor Investor PARWX ˇ ] QQQQ 27.4 27.4 13.7 16.4 15.2 3 3 36 3 1 0.7 24.96 (88) High
PIMCO StocksPLUS A PSPAX ˇ QQQQ 18.2 18.2 13.6 14.9 13.9 40 40 37 28 10 2.9 19.96 (100) +Avg
PRIMECAP Odyssey Stock POSKX ΠQQQ 10.0 10.0 9.1 13.0 12.9 85 85 86 63 43 1.3 20.64 (93) +Avg
Schwab S&P 500 Index SWPPX Π[ QQQQ 18.4 18.4 14.1 15.2 13.8 37 37 23 21 13 1.8 18.79 (100) Avg
Schwab Total Stock Market Index SWTSX ΠQQQQ 20.7 20.7 14.4 15.3 13.7 21 21 19 17 18 1.6 19.72 (100) +Avg
Selected American Shares D SLADX ´ QQ 11.9 11.9 8.3 11.9 10.9 77 77 90 82 86 0.6 22.48 (94) High
T. Rowe Price Dividend Growth PRDGX „ [ QQQQ 13.9 13.9 13.9 14.5 13.4 66 66 32 37 30 1.0 16.29 (96) Low
T. Rowe Price Growth & Income PRGIX ´ QQQ 15.6 15.6 13.2 13.5 12.9 56 56 45 56 42 0.9 17.82 (98) -Avg
T. Rowe Price Spectrum Growth PRSGX ´ QQQ 18.4 18.4 11.2 13.2 11.2 37 37 63 60 81 0.7 18.88 (97) Avg
T. Rowe Price US Large-Cap Core TRULX ´ QQQQ 15.6 15.6 13.1 13.4 13.4 57 57 46 57 29 0.4 17.8 (98) -Avg
TIAA-CREF Growth & Income Instl TIGRX ´ QQQQ 20.5 20.5 13.4 14.4 13.8 22 22 42 38 14 1.1 20.09 (99) +Avg
TIAA-CREF Social Choice Eq Retail TICRX ´ QQQ 20.0 20.0 14.0 15.1 12.7 25 25 27 21 47 1.1 19.32 (99) Avg
Vanguard 500 Index Admiral VFIAX ΠQQQQQ 18.4 18.4 14.1 15.2 13.8 38 38 24 20 12 1.5 18.8 (100) Avg
Vanguard Dividend Appreciation Index Adm VDADX „ QQQQQ 15.5 15.5 13.6 14.9 12.7 57 57 37 27 49 1.6 16.41 (95) Low
Vanguard Dividend Growth Inv VDIGX ΠQQQQ 12.1 12.1 13.7 13.5 13.1 76 76 35 55 37 1.6 15.75 (91) Low
Vanguard FTSE Social Index Admiral VFTAX „ WWWWW 22.7 22.7 16.6 16.8 15.1 11 11 3 2 1 1.2 ()
Vanguard Growth & Income Inv VQNPX ´ QQQQ 17.9 17.9 13.4 14.5 13.8 43 43 43 36 15 1.3 19.1 (100) Avg
Vanguard Large Cap Index Admiral VLCAX ΠQQQQQ 21.0 21.0 15.0 15.7 14.0 17 17 11 9 8 1.4 19.08 (100) Avg
Vanguard PRIMECAP Core Inv VPCCX ΠQQQ 12.1 12.1 10.8 14.1 13.6 76 76 69 45 20 1.1 19.81 (94) +Avg
Vanguard Tax-Managed Capital App Adm VTCLX ΠQQQQQ 21.1 21.1 14.8 15.7 14.1 17 17 13 9 7 1.3 19.3 (100) Avg
Vanguard Total Stock Mkt Idx Adm VTSAX ΠQQQQ 21.0 21.0 14.5 15.4 13.8 17 17 17 14 15 1.4 19.68 (100) +Avg
S&P 500 Index 18.4 18.4 14.2 15.2 13.9 28.3 4.0 176,727
Legend
E New this month][ Increase/decrease in rating
NR No Morningstar Rating; fund less than three years old.
Red Lowest return in groupGreen Highest return in groupItalic Extended performance
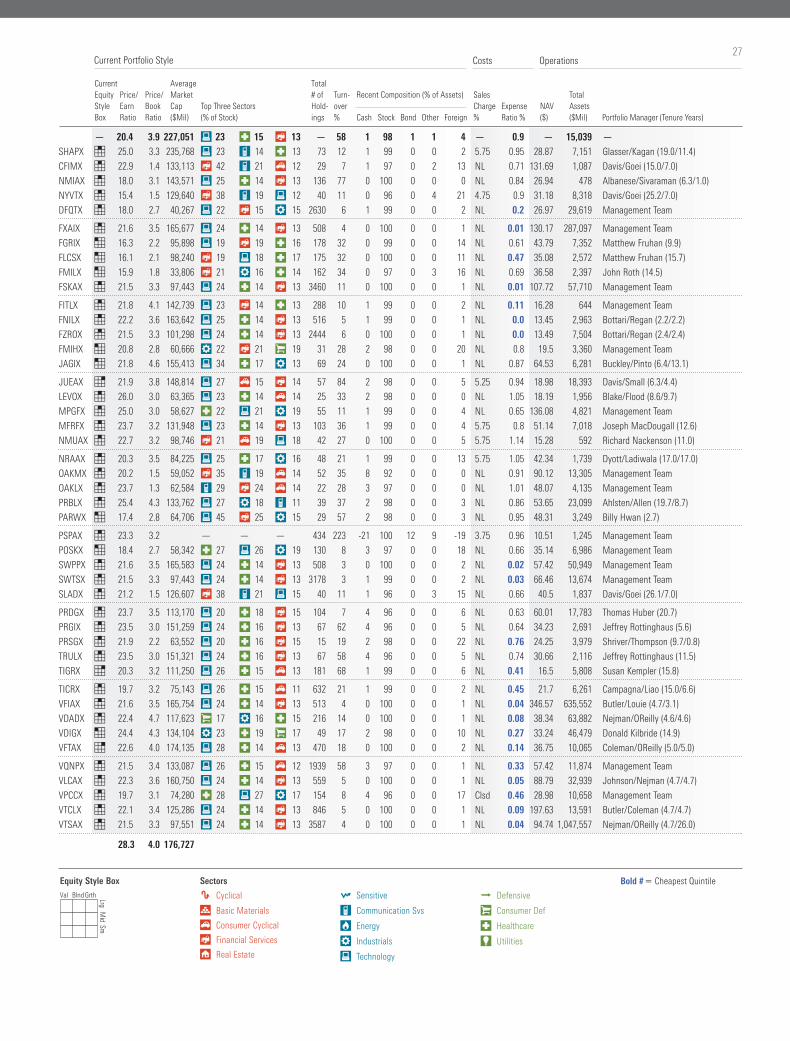
27Costs Operations
Current Equity Style Box
Price/EarnRatio
Price/BookRatio
AverageMarketCap($Mil)
Top Three Sectors (% of Stock)
Total# ofHold-ings
Turn-over%
Recent Composition (% of Assets) Sales
Charge %
Expense Ratio %
NAV ($)
Total Assets ($Mil) Portfolio Manager (Tenure Years)Cash Stock Bond Other Foreign
Current Portfolio Style
— 20.4 3.9 227,051 a 23 d 15 y 13 — 58 1 98 1 1 4 — 0.9 — 15,039 —
SHAPX 4 25.0 3.3 235,768 a 23 i 14 d 13 73 12 1 99 0 0 2 5.75 0.95 28.87 7,151 Glasser/Kagan (19.0/11.4)
CFIMX 4 22.9 1.4 133,113 y 42 i 21 t 12 29 7 1 97 0 2 13 NL 0.71 131.69 1,087 Davis/Goei (15.0/7.0)
NMIAX 4 18.0 3.1 143,571 a 25 d 14 y 13 136 77 0 100 0 0 0 NL 0.84 26.94 478 Albanese/Sivaraman (6.3/1.0)
NYVTX 4 15.4 1.5 129,640 y 38 i 19 a 12 40 11 0 96 0 4 21 4.75 0.9 31.18 8,318 Davis/Goei (25.2/7.0)
DFQTX 4 18.0 2.7 40,267 a 22 y 15 p 15 2630 6 1 99 0 0 2 NL 0.2 26.97 29,619 Management Team
FXAIX 4 21.6 3.5 165,677 a 24 d 14 y 13 508 4 0 100 0 0 1 NL 0.01 130.17 287,097 Management Team
FGRIX 1 16.3 2.2 95,898 a 19 y 19 d 16 178 32 0 99 0 0 14 NL 0.61 43.79 7,352 Matthew Fruhan (9.9)
FLCSX 1 16.1 2.1 98,240 y 19 a 18 d 17 175 32 0 100 0 0 11 NL 0.47 35.08 2,572 Matthew Fruhan (15.7)
FMILX 1 15.9 1.8 33,806 y 21 p 16 d 14 162 34 0 97 0 3 16 NL 0.69 36.58 2,397 John Roth (14.5)
FSKAX 4 21.5 3.3 97,443 a 24 d 14 y 13 3460 11 0 100 0 0 1 NL 0.01 107.72 57,710 Management Team
FITLX 4 21.8 4.1 142,739 a 23 y 14 d 13 288 10 1 99 0 0 2 NL 0.11 16.28 644 Management Team
FNILX 4 22.2 3.6 163,642 a 25 d 14 y 13 516 5 1 99 0 0 1 NL 0.0 13.45 2,963 Bottari/Regan (2.2/2.2)
FZROX 4 21.5 3.3 101,298 a 24 d 14 y 13 2444 6 0 100 0 0 1 NL 0.0 13.49 7,504 Bottari/Regan (2.4/2.4)
FMIHX 1 20.8 2.8 60,666 p 22 y 21 s 19 31 28 2 98 0 0 20 NL 0.8 19.5 3,360 Management Team
JAGIX 1 21.8 4.6 155,413 a 34 d 17 p 13 69 24 0 100 0 0 1 NL 0.87 64.53 6,281 Buckley/Pinto (6.4/13.1)
JUEAX 7 21.9 3.8 148,814 a 27 t 15 y 14 57 84 2 98 0 0 5 5.25 0.94 18.98 18,393 Davis/Small (6.3/4.4)
LEVOX 4 26.0 3.0 63,365 a 23 d 14 t 14 25 33 2 98 0 0 0 NL 1.05 18.19 1,956 Blake/Flood (8.6/9.7)
MPGFX 4 25.0 3.0 58,627 d 22 a 21 p 19 55 11 1 99 0 0 4 NL 0.65 136.08 4,821 Management Team
MFRFX 4 23.7 3.2 131,948 a 23 d 14 y 13 103 36 1 99 0 0 4 5.75 0.8 51.14 7,018 Joseph MacDougall (12.6)
NMUAX 4 22.7 3.2 98,746 y 21 t 19 a 18 42 27 0 100 0 0 5 5.75 1.14 15.28 592 Richard Nackenson (11.0)
NRAAX 4 20.3 3.5 84,225 a 25 d 17 p 16 48 21 1 99 0 0 13 5.75 1.05 42.34 1,739 Dyott/Ladiwala (17.0/17.0)
OAKMX 4 20.2 1.5 59,052 y 35 i 19 t 14 52 35 8 92 0 0 0 NL 0.91 90.12 13,305 Management Team
OAKLX 4 23.7 1.3 62,584 i 29 y 24 t 14 22 28 3 97 0 0 0 NL 1.01 48.07 4,135 Management Team
PRBLX 4 25.4 4.3 133,762 a 27 p 18 i 11 39 37 2 98 0 0 3 NL 0.86 53.65 23,099 Ahlsten/Allen (19.7/8.7)
PARWX 1 17.4 2.8 64,706 a 45 y 25 p 15 29 57 2 98 0 0 3 NL 0.95 48.31 3,249 Billy Hwan (2.7)
PSPAX 4 23.3 3.2 — — — 434 223 -21 100 12 9 -19 3.75 0.96 10.51 1,245 Management Team
POSKX 1 18.4 2.7 58,342 d 27 a 26 p 19 130 8 3 97 0 0 18 NL 0.66 35.14 6,986 Management Team
SWPPX 4 21.6 3.5 165,583 a 24 d 14 y 13 508 3 0 100 0 0 2 NL 0.02 57.42 50,949 Management Team
SWTSX 4 21.5 3.3 97,443 a 24 d 14 y 13 3178 3 1 99 0 0 2 NL 0.03 66.46 13,674 Management Team
SLADX 4 21.2 1.5 126,607 y 38 i 21 a 15 40 11 1 96 0 3 15 NL 0.66 40.5 1,837 Davis/Goei (26.1/7.0)
PRDGX 4 23.7 3.5 113,170 a 20 d 18 y 15 104 7 4 96 0 0 6 NL 0.63 60.01 17,783 Thomas Huber (20.7)
PRGIX 4 23.5 3.0 151,259 a 24 d 16 y 13 67 62 4 96 0 0 5 NL 0.64 34.23 2,691 Jeffrey Rottinghaus (5.6)
PRSGX 4 21.9 2.2 63,552 a 20 d 16 y 15 15 19 2 98 0 0 22 NL 0.76 24.25 3,979 Shriver/Thompson (9.7/0.8)
TRULX 4 23.5 3.0 151,321 a 24 d 16 y 13 67 58 4 96 0 0 5 NL 0.74 30.66 2,116 Jeffrey Rottinghaus (11.5)
TIGRX 7 20.3 3.2 111,250 a 26 d 15 t 13 181 68 1 99 0 0 6 NL 0.41 16.5 5,808 Susan Kempler (15.8)
TICRX 4 19.7 3.2 75,143 a 26 d 15 t 11 632 21 1 99 0 0 2 NL 0.45 21.7 6,261 Campagna/Liao (15.0/6.6)
VFIAX 4 21.6 3.5 165,754 a 24 d 14 y 13 513 4 0 100 0 0 1 NL 0.04 346.57 635,552 Butler/Louie (4.7/3.1)
VDADX 4 22.4 4.7 117,623 s 17 p 16 d 15 216 14 0 100 0 0 1 NL 0.08 38.34 63,882 Nejman/OReilly (4.6/4.6)
VDIGX 1 24.4 4.3 134,104 p 23 d 19 s 17 49 17 2 98 0 0 10 NL 0.27 33.24 46,479 Donald Kilbride (14.9)
VFTAX 7 22.6 4.0 174,135 a 28 d 14 t 13 470 18 0 100 0 0 2 NL 0.14 36.75 10,065 Coleman/OReilly (5.0/5.0)
VQNPX 4 21.5 3.4 133,087 a 26 d 15 t 12 1939 58 3 97 0 0 1 NL 0.33 57.42 11,874 Management Team
VLCAX 4 22.3 3.6 160,750 a 24 d 14 y 13 559 5 0 100 0 0 1 NL 0.05 88.79 32,939 Johnson/Nejman (4.7/4.7)
VPCCX 4 19.7 3.1 74,280 d 28 a 27 p 17 154 8 4 96 0 0 17 Clsd 0.46 28.98 10,658 Management Team
VTCLX 4 22.1 3.4 125,286 a 24 d 14 y 13 846 5 0 100 0 0 1 NL 0.09 197.63 13,591 Butler/Coleman (4.7/4.7)
VTSAX 4 21.5 3.3 97,551 a 24 d 14 y 13 3587 4 0 100 0 0 1 NL 0.04 94.74 1,047,557 Nejman/OReilly (4.7/26.0)
S&P 500 Index 18.4 18.4 14.2 15.2 13.9 28.3 4.0 176,727
Bold # Cheapest QuintileEquity Style BoxVal Blnd Grth Lrg M
id Sm
Sectors
h Cyclical
r Basic Materials
t Consumer Cyclical
y Financial Services
u Real Estate
j Sensitive
i Communication Svs
o Energy
p Industrials
a Technology
k Defensive
s Consumer Def
d Healthcare
f Utilities
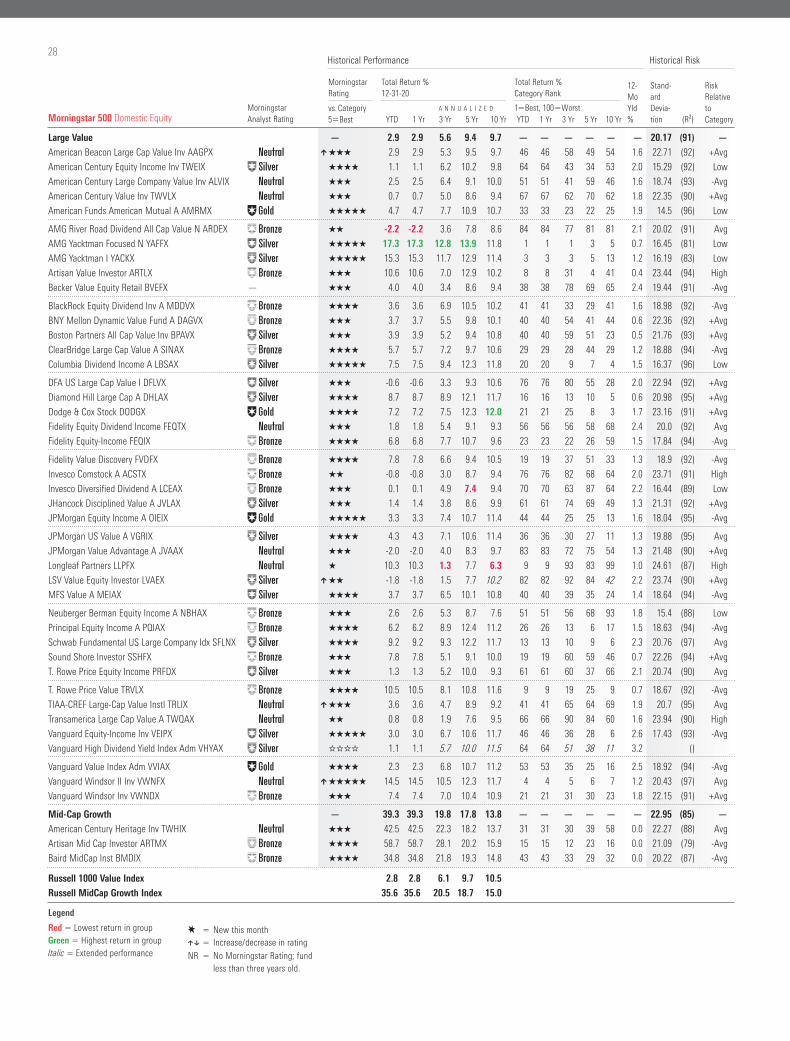
28
Morningstar Analyst Rating
Morningstar Rating
Total Return % 12-31-20
Total Return % Category Rank
12-MoYld %
Stand- ard Devia- tion (R²)
Risk Relative to Category
vs. Category5Best
A N N U A L I Z E D 1Best, 100WorstYTD 1 Yr 3 Yr 5 Yr 10 Yr YTD 1 Yr 3 Yr 5 Yr 10 Yr
Historical Performance Historical Risk
Morningstar 500 Domestic Equity
Large Value — 2.9 2.9 5.6 9.4 9.7 — — — — — — 20.17 (91) —
American Beacon Large Cap Value Inv AAGPX ˇ ] QQQ 2.9 2.9 5.3 9.5 9.7 46 46 58 49 54 1.6 22.71 (92) +Avg
American Century Equity Income Inv TWEIX „ QQQQ 1.1 1.1 6.2 10.2 9.8 64 64 43 34 53 2.0 15.29 (92) Low
American Century Large Company Value Inv ALVIX ˇ QQQ 2.5 2.5 6.4 9.1 10.0 51 51 41 59 46 1.6 18.74 (93) -Avg
American Century Value Inv TWVLX ˇ QQQ 0.7 0.7 5.0 8.6 9.4 67 67 62 70 62 1.8 22.35 (90) +Avg
American Funds American Mutual A AMRMX ΠQQQQQ 4.7 4.7 7.7 10.9 10.7 33 33 23 22 25 1.9 14.5 (96) Low
AMG River Road Dividend All Cap Value N ARDEX ´ QQ -2.2 -2.2 3.6 7.8 8.6 84 84 77 81 81 2.1 20.02 (91) Avg
AMG Yacktman Focused N YAFFX „ QQQQQ 17.3 17.3 12.8 13.9 11.8 1 1 1 3 5 0.7 16.45 (81) Low
AMG Yacktman I YACKX „ QQQQQ 15.3 15.3 11.7 12.9 11.4 3 3 3 5 13 1.2 16.19 (83) Low
Artisan Value Investor ARTLX ´ QQQ 10.6 10.6 7.0 12.9 10.2 8 8 31 4 41 0.4 23.44 (94) High
Becker Value Equity Retail BVEFX — QQQ 4.0 4.0 3.4 8.6 9.4 38 38 78 69 65 2.4 19.44 (91) -Avg
BlackRock Equity Dividend Inv A MDDVX ´ QQQQ 3.6 3.6 6.9 10.5 10.2 41 41 33 29 41 1.6 18.98 (92) -Avg
BNY Mellon Dynamic Value Fund A DAGVX ´ QQQ 3.7 3.7 5.5 9.8 10.1 40 40 54 41 44 0.6 22.36 (92) +Avg
Boston Partners All Cap Value Inv BPAVX „ QQQ 3.9 3.9 5.2 9.4 10.8 40 40 59 51 23 0.5 21.76 (93) +Avg
ClearBridge Large Cap Value A SINAX ´ QQQQ 5.7 5.7 7.2 9.7 10.6 29 29 28 44 29 1.2 18.88 (94) -Avg
Columbia Dividend Income A LBSAX „ QQQQQ 7.5 7.5 9.4 12.3 11.8 20 20 9 7 4 1.5 16.37 (96) Low
DFA US Large Cap Value I DFLVX „ QQQ -0.6 -0.6 3.3 9.3 10.6 76 76 80 55 28 2.0 22.94 (92) +Avg
Diamond Hill Large Cap A DHLAX „ QQQQ 8.7 8.7 8.9 12.1 11.7 16 16 13 10 5 0.6 20.98 (95) +Avg
Dodge & Cox Stock DODGX ΠQQQQ 7.2 7.2 7.5 12.3 12.0 21 21 25 8 3 1.7 23.16 (91) +Avg
Fidelity Equity Dividend Income FEQTX ˇ QQQ 1.8 1.8 5.4 9.1 9.3 56 56 56 58 68 2.4 20.0 (92) Avg
Fidelity Equity-Income FEQIX ´ QQQQ 6.8 6.8 7.7 10.7 9.6 23 23 22 26 59 1.5 17.84 (94) -Avg
Fidelity Value Discovery FVDFX ´ QQQQ 7.8 7.8 6.6 9.4 10.5 19 19 37 51 33 1.3 18.9 (92) -Avg
Invesco Comstock A ACSTX ´ QQ -0.8 -0.8 3.0 8.7 9.4 76 76 82 68 64 2.0 23.71 (91) High
Invesco Diversified Dividend A LCEAX ´ QQQ 0.1 0.1 4.9 7.4 9.4 70 70 63 87 64 2.2 16.44 (89) Low
JHancock Disciplined Value A JVLAX „ QQQ 1.4 1.4 3.8 8.6 9.9 61 61 74 69 49 1.3 21.31 (92) +Avg
JPMorgan Equity Income A OIEIX ΠQQQQQ 3.3 3.3 7.4 10.7 11.4 44 44 25 25 13 1.6 18.04 (95) -Avg
JPMorgan US Value A VGRIX „ QQQQ 4.3 4.3 7.1 10.6 11.4 36 36 30 27 11 1.3 19.88 (95) Avg
JPMorgan Value Advantage A JVAAX ˇ QQQ -2.0 -2.0 4.0 8.3 9.7 83 83 72 75 54 1.3 21.48 (90) +Avg
Longleaf Partners LLPFX ˇ Q 10.3 10.3 1.3 7.7 6.3 9 9 93 83 99 1.0 24.61 (87) High
LSV Value Equity Investor LVAEX „ ] QQ -1.8 -1.8 1.5 7.7 10.2 82 82 92 84 42 2.2 23.74 (90) +Avg
MFS Value A MEIAX „ QQQQ 3.7 3.7 6.5 10.1 10.8 40 40 39 35 24 1.4 18.64 (94) -Avg
Neuberger Berman Equity Income A NBHAX ´ QQQ 2.6 2.6 5.3 8.7 7.6 51 51 56 68 93 1.8 15.4 (88) Low
Principal Equity Income A PQIAX ´ QQQQ 6.2 6.2 8.9 12.4 11.2 26 26 13 6 17 1.5 18.63 (94) -Avg
Schwab Fundamental US Large Company Idx SFLNX „ QQQQ 9.2 9.2 9.3 12.2 11.7 13 13 10 9 6 2.3 20.76 (97) Avg
Sound Shore Investor SSHFX ´ QQQ 7.8 7.8 5.1 9.1 10.0 19 19 60 59 46 0.7 22.26 (94) +Avg
T. Rowe Price Equity Income PRFDX „ QQQ 1.3 1.3 5.2 10.0 9.3 61 61 60 37 66 2.1 20.74 (90) Avg
T. Rowe Price Value TRVLX ´ QQQQ 10.5 10.5 8.1 10.8 11.6 9 9 19 25 9 0.7 18.67 (92) -Avg
TIAA-CREF Large-Cap Value Instl TRLIX ˇ ] QQQ 3.6 3.6 4.7 8.9 9.2 41 41 65 64 69 1.9 20.7 (95) Avg
Transamerica Large Cap Value A TWQAX ˇ QQ 0.8 0.8 1.9 7.6 9.5 66 66 90 84 60 1.6 23.94 (90) High
Vanguard Equity-Income Inv VEIPX „ QQQQQ 3.0 3.0 6.7 10.6 11.7 46 46 36 28 6 2.6 17.43 (93) -Avg
Vanguard High Dividend Yield Index Adm VHYAX „ WWWW 1.1 1.1 5.7 10.0 11.5 64 64 51 38 11 3.2 ()
Vanguard Value Index Adm VVIAX ΠQQQQ 2.3 2.3 6.8 10.7 11.2 53 53 35 25 16 2.5 18.92 (94) -Avg
Vanguard Windsor II Inv VWNFX ˇ ] QQQQQ 14.5 14.5 10.5 12.3 11.7 4 4 5 6 7 1.2 20.43 (97) Avg
Vanguard Windsor Inv VWNDX ´ QQQ 7.4 7.4 7.0 10.4 10.9 21 21 31 30 23 1.8 22.15 (91) +Avg
Mid-Cap Growth — 39.3 39.3 19.8 17.8 13.8 — — — — — — 22.95 (85) —
American Century Heritage Inv TWHIX ˇ QQQ 42.5 42.5 22.3 18.2 13.7 31 31 30 39 58 0.0 22.27 (88) Avg
Artisan Mid Cap Investor ARTMX ´ QQQQ 58.7 58.7 28.1 20.2 15.9 15 15 12 23 16 0.0 21.09 (79) -Avg
Baird MidCap Inst BMDIX ´ QQQQ 34.8 34.8 21.8 19.3 14.8 43 43 33 29 32 0.0 20.22 (87) -Avg
Russell 1000 Value Index 2.8 2.8 6.1 9.7 10.5 22.4 2.3 63,449
Russell MidCap Growth Index 35.6 35.6 20.5 18.7 15.0 36.5 10.4 21,331
Legend
E New this month][ Increase/decrease in rating
NR No Morningstar Rating; fund less than three years old.
Red Lowest return in groupGreen Highest return in groupItalic Extended performance
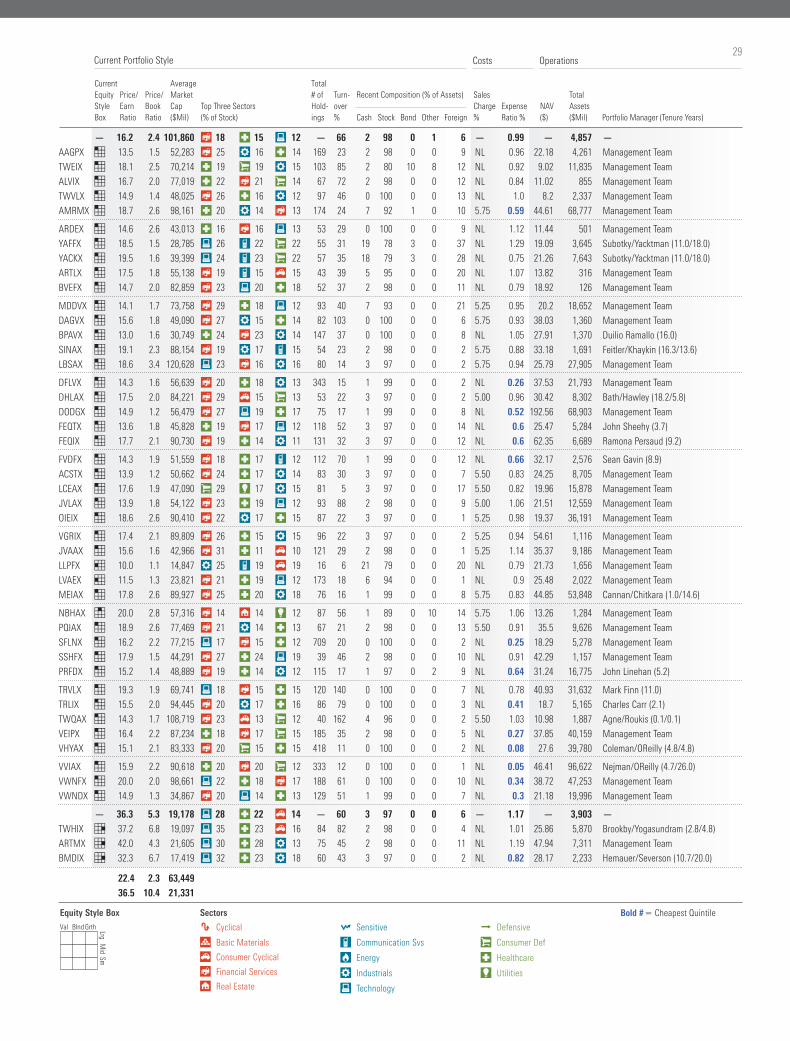
29Costs Operations
Current Equity Style Box
Price/EarnRatio
Price/BookRatio
AverageMarketCap($Mil)
Top Three Sectors (% of Stock)
Total# ofHold-ings
Turn-over%
Recent Composition (% of Assets) Sales
Charge %
Expense Ratio %
NAV ($)
Total Assets ($Mil) Portfolio Manager (Tenure Years)Cash Stock Bond Other Foreign
Current Portfolio Style
— 16.2 2.4 101,860 y 18 d 15 a 12 — 66 2 98 0 1 6 — 0.99 — 4,857 —
AAGPX 1 13.5 1.5 52,283 y 25 p 16 d 14 169 23 2 98 0 0 9 NL 0.96 22.18 4,261 Management Team
TWEIX 1 18.1 2.5 70,214 d 19 s 19 p 15 103 85 2 80 10 8 12 NL 0.92 9.02 11,835 Management Team
ALVIX 1 16.7 2.0 77,019 d 22 y 21 s 14 67 72 2 98 0 0 12 NL 0.84 11.02 855 Management Team
TWVLX 1 14.9 1.4 48,025 y 26 d 16 p 12 97 46 0 100 0 0 13 NL 1.0 8.2 2,337 Management Team
AMRMX 1 18.7 2.6 98,161 d 20 p 14 y 13 174 24 7 92 1 0 10 5.75 0.59 44.61 68,777 Management Team
ARDEX 1 14.6 2.6 43,013 d 16 y 16 a 13 53 29 0 100 0 0 9 NL 1.12 11.44 501 Management Team
YAFFX 1 18.5 1.5 28,785 a 26 i 22 s 22 55 31 19 78 3 0 37 NL 1.29 19.09 3,645 Subotky/Yacktman (11.0/18.0)
YACKX 1 19.5 1.6 39,399 a 24 i 23 s 22 57 35 18 79 3 0 28 NL 0.75 21.26 7,643 Subotky/Yacktman (11.0/18.0)
ARTLX 1 17.5 1.8 55,138 y 19 i 15 t 15 43 39 5 95 0 0 20 NL 1.07 13.82 316 Management Team
BVEFX 1 14.7 2.0 82,859 y 23 a 20 d 18 52 37 2 98 0 0 11 NL 0.79 18.92 126 Management Team
MDDVX 1 14.1 1.7 73,758 y 29 d 18 a 12 93 40 7 93 0 0 21 5.25 0.95 20.2 18,652 Management Team
DAGVX 1 15.6 1.8 49,090 y 27 p 15 d 14 82 103 0 100 0 0 6 5.75 0.93 38.03 1,360 Management Team
BPAVX 1 13.0 1.6 30,749 d 24 y 23 p 14 147 37 0 100 0 0 8 NL 1.05 27.91 1,370 Duilio Ramallo (16.0)
SINAX 1 19.1 2.3 88,154 y 19 p 17 i 15 54 23 2 98 0 0 2 5.75 0.88 33.18 1,691 Feitler/Khaykin (16.3/13.6)
LBSAX 1 18.6 3.4 120,628 a 23 y 16 p 16 80 14 3 97 0 0 2 5.75 0.94 25.79 27,905 Management Team
DFLVX 1 14.3 1.6 56,639 y 20 d 18 p 13 343 15 1 99 0 0 2 NL 0.26 37.53 21,793 Management Team
DHLAX 1 17.5 2.0 84,221 y 29 t 15 s 13 53 22 3 97 0 0 2 5.00 0.96 30.42 8,302 Bath/Hawley (18.2/5.8)
DODGX 1 14.9 1.2 56,479 y 27 a 19 d 17 75 17 1 99 0 0 8 NL 0.52 192.56 68,903 Management Team
FEQTX 1 13.6 1.8 45,828 d 19 y 17 a 12 118 52 3 97 0 0 14 NL 0.6 25.47 5,284 John Sheehy (3.7)
FEQIX 1 17.7 2.1 90,730 y 19 d 14 p 11 131 32 3 97 0 0 12 NL 0.6 62.35 6,689 Ramona Persaud (9.2)
FVDFX 1 14.3 1.9 51,559 y 18 d 17 i 12 112 70 1 99 0 0 12 NL 0.66 32.17 2,576 Sean Gavin (8.9)
ACSTX 1 13.9 1.2 50,662 y 24 d 17 p 14 83 30 3 97 0 0 7 5.50 0.83 24.25 8,705 Management Team
LCEAX 1 17.6 1.9 47,090 s 29 f 17 p 15 81 5 3 97 0 0 17 5.50 0.82 19.96 15,878 Management Team
JVLAX 1 13.9 1.8 54,122 y 23 d 19 a 12 93 88 2 98 0 0 9 5.00 1.06 21.51 12,559 Management Team
OIEIX 1 18.6 2.6 90,410 y 22 p 17 d 15 87 22 3 97 0 0 1 5.25 0.98 19.37 36,191 Management Team
VGRIX 1 17.4 2.1 89,809 y 26 d 15 p 15 96 22 3 97 0 0 2 5.25 0.94 54.61 1,116 Management Team
JVAAX 1 15.6 1.6 42,966 y 31 d 11 t 10 121 29 2 98 0 0 1 5.25 1.14 35.37 9,186 Management Team
LLPFX 2 10.0 1.1 14,847 p 25 i 19 t 19 16 6 21 79 0 0 20 NL 0.79 21.73 1,656 Management Team
LVAEX 2 11.5 1.3 23,821 y 21 d 19 a 12 173 18 6 94 0 0 1 NL 0.9 25.48 2,022 Management Team
MEIAX 1 17.8 2.6 89,927 y 25 d 20 p 18 76 16 1 99 0 0 8 5.75 0.83 44.85 53,848 Cannan/Chitkara (1.0/14.6)
NBHAX 4 20.0 2.8 57,316 y 14 u 14 f 12 87 56 1 89 0 10 14 5.75 1.06 13.26 1,284 Management Team
PQIAX 1 18.9 2.6 77,469 y 21 p 14 d 13 67 21 2 98 0 0 13 5.50 0.91 35.5 9,626 Management Team
SFLNX 1 16.2 2.2 77,215 a 17 y 15 d 12 709 20 0 100 0 0 2 NL 0.25 18.29 5,278 Management Team
SSHFX 1 17.9 1.5 44,291 y 27 d 24 a 19 39 46 2 98 0 0 10 NL 0.91 42.29 1,157 Management Team
PRFDX 1 15.2 1.4 48,889 y 19 d 14 p 12 115 17 1 97 0 2 9 NL 0.64 31.24 16,775 John Linehan (5.2)
TRVLX 1 19.3 1.9 69,741 a 18 y 15 d 15 120 140 0 100 0 0 7 NL 0.78 40.93 31,632 Mark Finn (11.0)
TRLIX 1 15.5 2.0 94,445 y 20 p 17 d 16 86 79 0 100 0 0 3 NL 0.41 18.7 5,165 Charles Carr (2.1)
TWQAX 1 14.3 1.7 108,719 y 23 t 13 s 12 40 162 4 96 0 0 2 5.50 1.03 10.98 1,887 Agne/Roukis (0.1/0.1)
VEIPX 1 16.4 2.2 87,234 d 18 y 17 s 15 185 35 2 98 0 0 5 NL 0.27 37.85 40,159 Management Team
VHYAX 1 15.1 2.1 83,333 y 20 s 15 d 15 418 11 0 100 0 0 2 NL 0.08 27.6 39,780 Coleman/OReilly (4.8/4.8)
VVIAX 1 15.9 2.2 90,618 d 20 y 20 s 12 333 12 0 100 0 0 1 NL 0.05 46.41 96,622 Nejman/OReilly (4.7/26.0)
VWNFX 1 20.0 2.0 98,661 a 22 d 18 y 17 188 61 0 100 0 0 10 NL 0.34 38.72 47,253 Management Team
VWNDX 1 14.9 1.3 34,867 y 20 a 14 d 13 129 51 1 99 0 0 7 NL 0.3 21.18 19,996 Management Team
— 36.3 5.3 19,178 a 28 d 22 t 14 — 60 3 97 0 0 6 — 1.17 — 3,903 —
TWHIX 8 37.2 6.8 19,097 a 35 d 23 t 16 84 82 2 98 0 0 4 NL 1.01 25.86 5,870 Brookby/Yogasundram (2.8/4.8)
ARTMX 8 42.0 4.3 21,605 a 30 d 28 p 13 75 45 2 98 0 0 11 NL 1.19 47.94 7,311 Management Team
BMDIX 8 32.3 6.7 17,419 a 32 d 23 p 18 60 43 3 97 0 0 2 NL 0.82 28.17 2,233 Hemauer/Severson (10.7/20.0)
Russell 1000 Value Index 2.8 2.8 6.1 9.7 10.5 22.4 2.3 63,449
Russell MidCap Growth Index 35.6 35.6 20.5 18.7 15.0 36.5 10.4 21,331
Bold # Cheapest QuintileEquity Style BoxVal Blnd Grth Lrg M
id Sm
Sectors
h Cyclical
r Basic Materials
t Consumer Cyclical
y Financial Services
u Real Estate
j Sensitive
i Communication Svs
o Energy
p Industrials
a Technology
k Defensive
s Consumer Def
d Healthcare
f Utilities
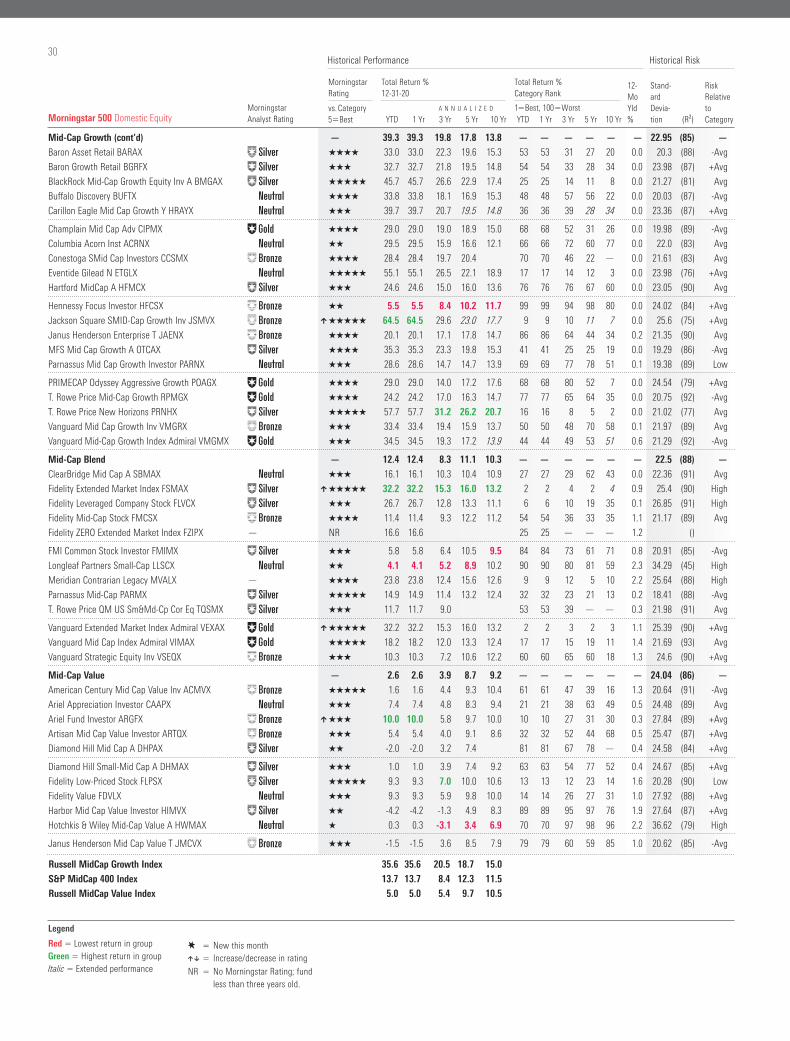
30
Morningstar Analyst Rating
Morningstar Rating
Total Return % 12-31-20
Total Return % Category Rank
12-MoYld %
Stand- ard Devia- tion (R²)
Risk Relative to Category
vs. Category5Best
A N N U A L I Z E D 1Best, 100WorstYTD 1 Yr 3 Yr 5 Yr 10 Yr YTD 1 Yr 3 Yr 5 Yr 10 Yr
Historical Performance Historical Risk
Morningstar 500 Domestic Equity
Mid-Cap Growth (cont’d) — 39.3 39.3 19.8 17.8 13.8 — — — — — — 22.95 (85) —
Baron Asset Retail BARAX „ QQQQ 33.0 33.0 22.3 19.6 15.3 53 53 31 27 20 0.0 20.3 (88) -Avg
Baron Growth Retail BGRFX „ QQQ 32.7 32.7 21.8 19.5 14.8 54 54 33 28 34 0.0 23.98 (87) +Avg
BlackRock Mid-Cap Growth Equity Inv A BMGAX „ QQQQQ 45.7 45.7 26.6 22.9 17.4 25 25 14 11 8 0.0 21.27 (81) Avg
Buffalo Discovery BUFTX ˇ QQQQ 33.8 33.8 18.1 16.9 15.3 48 48 57 56 22 0.0 20.03 (87) -Avg
Carillon Eagle Mid Cap Growth Y HRAYX ˇ QQQ 39.7 39.7 20.7 19.5 14.8 36 36 39 28 34 0.0 23.36 (87) +Avg
Champlain Mid Cap Adv CIPMX ΠQQQQ 29.0 29.0 19.0 18.9 15.0 68 68 52 31 26 0.0 19.98 (89) -Avg
Columbia Acorn Inst ACRNX ˇ QQ 29.5 29.5 15.9 16.6 12.1 66 66 72 60 77 0.0 22.0 (83) Avg
Conestoga SMid Cap Investors CCSMX ´ QQQQ 28.4 28.4 19.7 20.4 70 70 46 22 — 0.0 21.61 (83) Avg
Eventide Gilead N ETGLX ˇ QQQQQ 55.1 55.1 26.5 22.1 18.9 17 17 14 12 3 0.0 23.98 (76) +Avg
Hartford MidCap A HFMCX „ QQQ 24.6 24.6 15.0 16.0 13.6 76 76 76 67 60 0.0 23.05 (90) Avg
Hennessy Focus Investor HFCSX ´ QQ 5.5 5.5 8.4 10.2 11.7 99 99 94 98 80 0.0 24.02 (84) +Avg
Jackson Square SMID-Cap Growth Inv JSMVX ´ ] QQQQQ 64.5 64.5 29.6 23.0 17.7 9 9 10 11 7 0.0 25.6 (75) +Avg
Janus Henderson Enterprise T JAENX ´ QQQQ 20.1 20.1 17.1 17.8 14.7 86 86 64 44 34 0.2 21.35 (90) Avg
MFS Mid Cap Growth A OTCAX „ QQQQ 35.3 35.3 23.3 19.8 15.3 41 41 25 25 19 0.0 19.29 (86) -Avg
Parnassus Mid Cap Growth Investor PARNX ˇ QQQ 28.6 28.6 14.7 14.7 13.9 69 69 77 78 51 0.1 19.38 (89) Low
PRIMECAP Odyssey Aggressive Growth POAGX ΠQQQQ 29.0 29.0 14.0 17.2 17.6 68 68 80 52 7 0.0 24.54 (79) +Avg
T. Rowe Price Mid-Cap Growth RPMGX ΠQQQQ 24.2 24.2 17.0 16.3 14.7 77 77 65 64 35 0.0 20.75 (92) -Avg
T. Rowe Price New Horizons PRNHX „ QQQQQ 57.7 57.7 31.2 26.2 20.7 16 16 8 5 2 0.0 21.02 (77) Avg
Vanguard Mid Cap Growth Inv VMGRX ´ QQQ 33.4 33.4 19.4 15.9 13.7 50 50 48 70 58 0.1 21.97 (89) Avg
Vanguard Mid-Cap Growth Index Admiral VMGMX ΠQQQ 34.5 34.5 19.3 17.2 13.9 44 44 49 53 51 0.6 21.29 (92) -Avg
Mid-Cap Blend — 12.4 12.4 8.3 11.1 10.3 — — — — — — 22.5 (88) —
ClearBridge Mid Cap A SBMAX ˇ QQQ 16.1 16.1 10.3 10.4 10.9 27 27 29 62 43 0.0 22.36 (91) Avg
Fidelity Extended Market Index FSMAX „ ] QQQQQ 32.2 32.2 15.3 16.0 13.2 2 2 4 2 4 0.9 25.4 (90) High
Fidelity Leveraged Company Stock FLVCX „ QQQ 26.7 26.7 12.8 13.3 11.1 6 6 10 19 35 0.1 26.85 (91) High
Fidelity Mid-Cap Stock FMCSX ´ QQQQ 11.4 11.4 9.3 12.2 11.2 54 54 36 33 35 1.1 21.17 (89) Avg
Fidelity ZERO Extended Market Index FZIPX — NR 16.6 16.6 25 25 — — — 1.2 ()
FMI Common Stock Investor FMIMX „ QQQ 5.8 5.8 6.4 10.5 9.5 84 84 73 61 71 0.8 20.91 (85) -Avg
Longleaf Partners Small-Cap LLSCX ˇ QQ 4.1 4.1 5.2 8.9 10.2 90 90 80 81 59 2.3 34.29 (45) High
Meridian Contrarian Legacy MVALX — QQQQ 23.8 23.8 12.4 15.6 12.6 9 9 12 5 10 2.2 25.64 (88) High
Parnassus Mid-Cap PARMX „ QQQQQ 14.9 14.9 11.4 13.2 12.4 32 32 23 21 13 0.2 18.41 (88) -Avg
T. Rowe Price QM US Sm&Md-Cp Cor Eq TQSMX „ QQQ 11.7 11.7 9.0 53 53 39 — — 0.3 21.98 (91) Avg
Vanguard Extended Market Index Admiral VEXAX Π] QQQQQ 32.2 32.2 15.3 16.0 13.2 2 2 3 2 3 1.1 25.39 (90) +Avg
Vanguard Mid Cap Index Admiral VIMAX ΠQQQQQ 18.2 18.2 12.0 13.3 12.4 17 17 15 19 11 1.4 21.69 (93) Avg
Vanguard Strategic Equity Inv VSEQX ´ QQQ 10.3 10.3 7.2 10.6 12.2 60 60 65 60 18 1.3 24.6 (90) +Avg
Mid-Cap Value — 2.6 2.6 3.9 8.7 9.2 — — — — — — 24.04 (86) —
American Century Mid Cap Value Inv ACMVX ´ QQQQQ 1.6 1.6 4.4 9.3 10.4 61 61 47 39 16 1.3 20.64 (91) -Avg
Ariel Appreciation Investor CAAPX ˇ QQQ 7.4 7.4 4.8 8.3 9.4 21 21 38 63 49 0.5 24.48 (89) Avg
Ariel Fund Investor ARGFX ´ ] QQQ 10.0 10.0 5.8 9.7 10.0 10 10 27 31 30 0.3 27.84 (89) +Avg
Artisan Mid Cap Value Investor ARTQX ´ QQQ 5.4 5.4 4.0 9.1 8.6 32 32 52 44 68 0.5 25.47 (87) +Avg
Diamond Hill Mid Cap A DHPAX „ QQ -2.0 -2.0 3.2 7.4 81 81 67 78 — 0.4 24.58 (84) +Avg
Diamond Hill Small-Mid Cap A DHMAX „ QQQ 1.0 1.0 3.9 7.4 9.2 63 63 54 77 52 0.4 24.67 (85) +Avg
Fidelity Low-Priced Stock FLPSX „ QQQQQ 9.3 9.3 7.0 10.0 10.6 13 13 12 23 14 1.6 20.28 (90) Low
Fidelity Value FDVLX ˇ QQQ 9.3 9.3 5.9 9.8 10.0 14 14 26 27 31 1.0 27.92 (88) +Avg
Harbor Mid Cap Value Investor HIMVX „ QQ -4.2 -4.2 -1.3 4.9 8.3 89 89 95 97 76 1.9 27.64 (87) +Avg
Hotchkis & Wiley Mid-Cap Value A HWMAX ˇ Q 0.3 0.3 -3.1 3.4 6.9 70 70 97 98 96 2.2 36.62 (79) High
Janus Henderson Mid Cap Value T JMCVX ´ QQQ -1.5 -1.5 3.6 8.5 7.9 79 79 60 59 85 1.0 20.62 (85) -Avg
Russell MidCap Growth Index 35.6 35.6 20.5 18.7 15.0 36.5 10.4 21,331
S&P MidCap 400 Index 13.7 13.7 8.4 12.3 11.5 25.5 2.4 6,301
Russell MidCap Value Index 5.0 5.0 5.4 9.7 10.5 22.6 2.2 14,788
Legend
E New this month][ Increase/decrease in rating
NR No Morningstar Rating; fund less than three years old.
Red Lowest return in groupGreen Highest return in groupItalic Extended performance
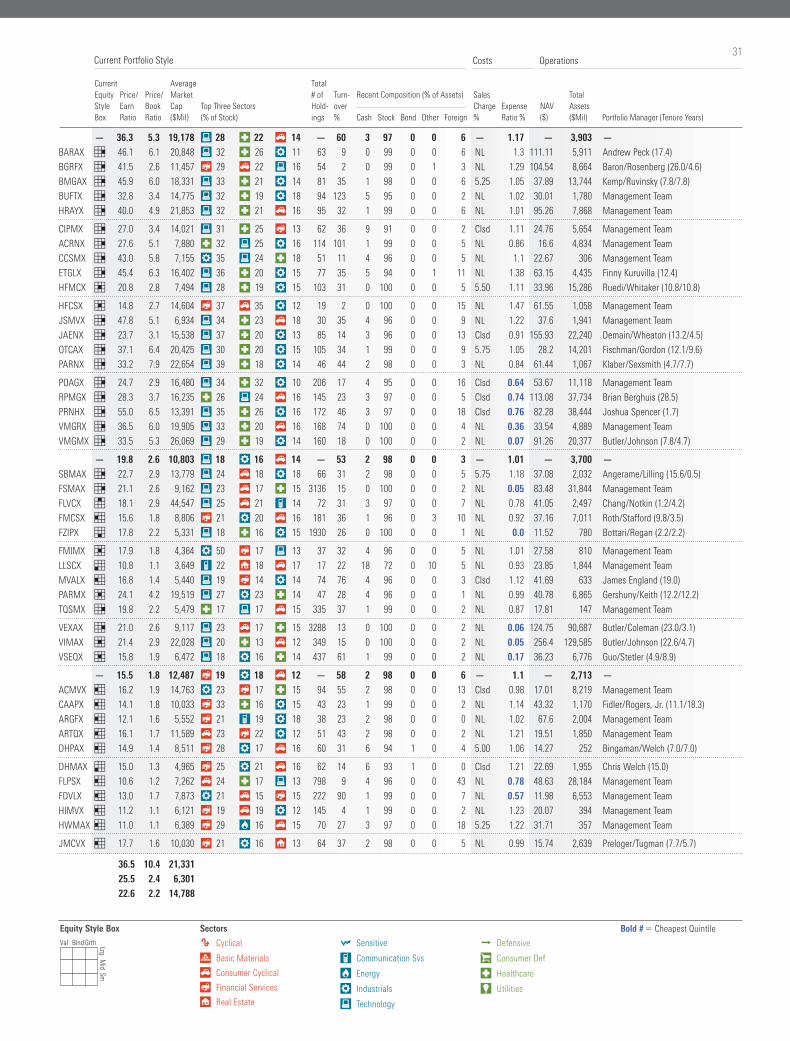
31Costs Operations
Current Equity Style Box
Price/EarnRatio
Price/BookRatio
AverageMarketCap($Mil)
Top Three Sectors (% of Stock)
Total# ofHold-ings
Turn-over%
Recent Composition (% of Assets) Sales
Charge %
Expense Ratio %
NAV ($)
Total Assets ($Mil) Portfolio Manager (Tenure Years)Cash Stock Bond Other Foreign
Current Portfolio Style
— 36.3 5.3 19,178 a 28 d 22 t 14 — 60 3 97 0 0 6 — 1.17 — 3,903 —
BARAX 8 46.1 6.1 20,848 a 32 d 26 p 11 63 9 0 99 0 0 6 NL 1.3 111.11 5,911 Andrew Peck (17.4)
BGRFX 8 41.5 2.6 11,457 y 29 t 22 a 16 54 2 0 99 0 1 3 NL 1.29 104.54 8,664 Baron/Rosenberg (26.0/4.6)
BMGAX 8 45.9 6.0 18,331 a 33 d 21 p 14 81 35 1 98 0 0 6 5.25 1.05 37.89 13,744 Kemp/Ruvinsky (7.8/7.8)
BUFTX 8 32.8 3.4 14,775 a 32 d 19 p 18 94 123 5 95 0 0 2 NL 1.02 30.01 1,780 Management Team
HRAYX 8 40.0 4.9 21,853 a 32 d 21 t 16 95 32 1 99 0 0 6 NL 1.01 95.26 7,868 Management Team
CIPMX 8 27.0 3.4 14,021 a 31 d 25 y 13 62 36 9 91 0 0 2 Clsd 1.11 24.76 5,654 Management Team
ACRNX 8 27.6 5.1 7,880 d 32 a 25 p 16 114 101 1 99 0 0 5 NL 0.86 16.6 4,834 Management Team
CCSMX 8 43.0 5.8 7,155 p 35 a 24 d 18 51 11 4 96 0 0 5 NL 1.1 22.67 306 Management Team
ETGLX 8 45.4 6.3 16,402 a 36 d 20 p 15 77 35 5 94 0 1 11 NL 1.38 63.15 4,435 Finny Kuruvilla (12.4)
HFMCX 5 20.8 2.8 7,494 a 28 d 19 p 15 103 31 0 100 0 0 5 5.50 1.11 33.96 15,286 Ruedi/Whitaker (10.8/10.8)
HFCSX 5 14.8 2.7 14,604 y 37 t 35 p 12 19 2 0 100 0 0 15 NL 1.47 61.55 1,058 Management Team
JSMVX 8 47.8 5.1 6,934 a 34 d 23 t 18 30 35 4 96 0 0 9 NL 1.22 37.6 1,941 Management Team
JAENX 8 23.7 3.1 15,538 a 37 d 20 p 13 85 14 3 96 0 0 13 Clsd 0.91 155.93 22,240 Demain/Wheaton (13.2/4.5)
OTCAX 8 37.1 6.4 20,425 a 30 d 20 p 15 105 34 1 99 0 0 9 5.75 1.05 28.2 14,201 Fischman/Gordon (12.1/9.6)
PARNX 8 33.2 7.9 22,654 a 39 d 18 p 14 46 44 2 98 0 0 3 NL 0.84 61.44 1,067 Klaber/Sexsmith (4.7/7.7)
POAGX 8 24.7 2.9 16,480 a 34 d 32 p 10 206 17 4 95 0 0 16 Clsd 0.64 53.67 11,118 Management Team
RPMGX 8 28.3 3.7 16,235 d 26 a 24 t 16 145 23 3 97 0 0 5 Clsd 0.74 113.08 37,734 Brian Berghuis (28.5)
PRNHX 8 55.0 6.5 13,391 a 35 d 26 p 16 172 46 3 97 0 0 18 Clsd 0.76 82.28 38,444 Joshua Spencer (1.7)
VMGRX 8 36.5 6.0 19,905 a 33 d 20 t 16 168 74 0 100 0 0 4 NL 0.36 33.54 4,889 Management Team
VMGMX 8 33.5 5.3 26,069 a 29 d 19 p 14 160 18 0 100 0 0 2 NL 0.07 91.26 20,377 Butler/Johnson (7.8/4.7)
— 19.8 2.6 10,803 a 18 p 16 t 14 — 53 2 98 0 0 3 — 1.01 — 3,700 —
SBMAX 8 22.7 2.9 13,779 a 24 t 18 p 18 66 31 2 98 0 0 5 5.75 1.18 37.08 2,032 Angerame/Lilling (15.6/0.5)
FSMAX 8 21.1 2.6 9,162 a 23 t 17 d 15 3136 15 0 100 0 0 2 NL 0.05 83.48 31,844 Management Team
FLVCX 4 18.1 2.9 44,547 a 25 t 21 i 14 72 31 3 97 0 0 7 NL 0.78 41.05 2,497 Chang/Notkin (1.2/4.2)
FMCSX 2 15.6 1.8 8,806 y 21 p 20 t 16 181 36 1 96 0 3 10 NL 0.92 37.16 7,011 Roth/Stafford (9.8/3.5)
FZIPX 6 17.8 2.2 5,331 a 18 d 16 p 15 1930 26 0 100 0 0 1 NL 0.0 11.52 780 Bottari/Regan (2.2/2.2)
FMIMX 5 17.9 1.8 4,364 p 50 y 17 a 13 37 32 4 96 0 0 5 NL 1.01 27.58 810 Management Team
LLSCX 3 10.8 1.1 3,649 i 22 u 18 t 17 17 22 18 72 0 10 5 NL 0.93 23.85 1,844 Management Team
MVALX 2 16.8 1.4 5,440 a 19 y 14 p 14 74 76 4 96 0 0 3 Clsd 1.12 41.69 633 James England (19.0)
PARMX 5 24.1 4.2 19,519 a 27 p 23 d 14 47 28 4 96 0 0 1 NL 0.99 40.78 6,865 Gershuny/Keith (12.2/12.2)
TQSMX 8 19.8 2.2 5,479 d 17 a 17 t 15 335 37 1 99 0 0 2 NL 0.87 17.81 147 Management Team
VEXAX 8 21.0 2.6 9,117 a 23 t 17 d 15 3288 13 0 100 0 0 2 NL 0.06 124.75 90,687 Butler/Coleman (23.0/3.1)
VIMAX 5 21.4 2.9 22,028 a 20 d 13 t 12 349 15 0 100 0 0 2 NL 0.05 256.4 129,585 Butler/Johnson (22.6/4.7)
VSEQX 5 15.8 1.9 6,472 a 18 p 16 d 14 437 61 1 99 0 0 2 NL 0.17 36.23 6,776 Guo/Stetler (4.9/8.9)
— 15.5 1.8 12,487 y 19 p 18 t 12 — 58 2 98 0 0 6 — 1.1 — 2,713 —
ACMVX 2 16.2 1.9 14,763 p 23 y 17 d 15 94 55 2 98 0 0 13 Clsd 0.98 17.01 8,219 Management Team
CAAPX 2 14.1 1.8 10,033 y 33 d 16 p 15 43 23 1 99 0 0 2 NL 1.14 43.32 1,170 Fidler/Rogers, Jr. (11.1/18.3)
ARGFX 2 12.1 1.6 5,552 y 21 i 19 p 18 38 23 2 98 0 0 0 NL 1.02 67.6 2,004 Management Team
ARTQX 2 16.1 1.7 11,589 t 23 y 22 p 12 51 43 2 98 0 0 2 NL 1.21 19.51 1,850 Management Team
DHPAX 2 14.9 1.4 8,511 y 28 p 17 t 16 60 31 6 94 1 0 4 5.00 1.06 14.27 252 Bingaman/Welch (7.0/7.0)
DHMAX 3 15.0 1.3 4,965 y 25 p 21 t 16 62 14 6 93 1 0 0 Clsd 1.21 22.69 1,955 Chris Welch (15.0)
FLPSX 2 10.6 1.2 7,262 t 24 d 17 a 13 798 9 4 96 0 0 43 NL 0.78 48.63 28,184 Management Team
FDVLX 2 13.0 1.7 7,873 p 21 t 15 y 15 222 90 1 99 0 0 7 NL 0.57 11.98 6,553 Management Team
HIMVX 2 11.2 1.1 6,121 y 19 t 19 p 12 145 4 1 99 0 0 2 NL 1.23 20.07 394 Management Team
HWMAX 2 11.0 1.1 6,389 y 29 o 16 t 15 70 27 3 97 0 0 18 5.25 1.22 31.71 357 Management Team
JMCVX 2 17.7 1.6 10,030 y 21 p 16 u 13 64 37 2 98 0 0 5 NL 0.99 15.74 2,639 Preloger/Tugman (7.7/5.7)
Russell MidCap Growth Index 35.6 35.6 20.5 18.7 15.0 36.5 10.4 21,331
S&P MidCap 400 Index 13.7 13.7 8.4 12.3 11.5 25.5 2.4 6,301
Russell MidCap Value Index 5.0 5.0 5.4 9.7 10.5 22.6 2.2 14,788
Bold # Cheapest QuintileEquity Style BoxVal Blnd Grth Lrg M
id Sm
Sectors
h Cyclical
r Basic Materials
t Consumer Cyclical
y Financial Services
u Real Estate
j Sensitive
i Communication Svs
o Energy
p Industrials
a Technology
k Defensive
s Consumer Def
d Healthcare
f Utilities

32
Morningstar Analyst Rating
Morningstar Rating
Total Return % 12-31-20
Total Return % Category Rank
12-MoYld %
Stand- ard Devia- tion (R²)
Risk Relative to Category
vs. Category5Best
A N N U A L I Z E D 1Best, 100WorstYTD 1 Yr 3 Yr 5 Yr 10 Yr YTD 1 Yr 3 Yr 5 Yr 10 Yr
Historical Performance Historical Risk
Morningstar 500 Domestic Equity
Mid-Cap Value (cont’d) — 2.6 2.6 3.9 8.7 9.2 — — — — — — 24.04 (86) —
Small-MidCap Dividend Inc A PMDAX ´ QQ -6.6 -6.6 0.2 8.1 94 94 91 67 — 1.1 24.62 (82) Avg
T. Rowe Price Mid-Cap Value TRMCX ΠQQQQ 9.9 9.9 5.5 10.3 10.1 10 10 30 16 28 1.0 22.19 (89) -Avg
Vanguard Mid-Cap Value Index Admiral VMVAX Π[ QQQ 2.5 2.5 4.8 9.2 10.7 55 55 39 43 12 2.4 22.68 (90) Avg
Vanguard Selected Value Inv VASVX ´ QQQ 5.8 5.8 3.2 8.9 10.0 29 29 66 50 33 1.3 27.51 (86) +Avg
Small Growth — 38.6 38.6 18.8 17.8 13.7 — — — — — — 25.25 (81) —
Aberdeen US Small Cap Equity A GSXAX ˇ QQQ 26.9 26.9 11.1 13.4 12.7 73 73 84 81 68 0.0 23.57 (90) -Avg
Alger Small Cap Focus A AOFAX „ QQQQQ 53.2 53.2 29.5 24.8 16.6 23 23 11 10 12 0.0 24.47 (63) Avg
Artisan Small Cap Investor ARTSX ´ QQQQQ 61.0 61.0 32.1 25.3 18.7 14 14 8 9 4 0.0 24.24 (78) Avg
Baron Discovery Retail BDFFX ´ QQQQQ 65.7 65.7 28.1 28.2 9 9 14 5 — 0.0 27.64 (78) High
Baron Small Cap Retail BSCFX „ QQQ 40.3 40.3 20.5 19.6 14.2 38 38 40 33 45 0.0 25.64 (87) +Avg
BlackRock Advantage Small Cap Gr Inv A CSGEX „ QQQ 33.1 33.1 18.9 16.9 13.1 56 56 46 54 64 0.0 25.68 (86) Avg
Brown Capital Mgmt Small Co Inv BCSIX ΠQQQQQ 45.3 45.3 23.1 21.1 17.6 30 30 28 24 6 0.0 25.05 (71) Avg
Champlain Small Company Adv CIPSX ΠQQQ 24.1 24.1 14.5 16.3 13.1 80 80 69 61 63 0.0 22.53 (86) Low
Conestoga Small Cap Investors CCASX „ QQQQ 30.3 30.3 18.0 19.2 15.3 63 63 51 37 26 0.0 21.71 (79) Low
Fidelity Small Cap Growth FCPGX ´ [ QQQQ 36.4 36.4 21.1 20.5 16.0 49 49 35 27 15 0.0 23.44 (82) -Avg
Harbor Small Cap Growth Inv HISGX ´ QQQ 37.8 37.8 20.3 18.0 13.9 44 44 40 45 51 0.0 24.22 (87) Avg
Janus Henderson Triton T JATTX „ QQQQ 28.3 28.3 16.0 16.9 14.7 67 67 60 53 32 0.0 24.62 (87) Avg
Janus Henderson Venture T JAVTX „ QQQQ 31.5 31.5 17.0 16.3 14.7 61 61 54 59 32 0.0 24.25 (87) -Avg
Loomis Sayles Small Cap Growth Retail LCGRX ´ QQQ 33.8 33.8 19.2 17.7 14.4 56 56 44 47 40 0.0 23.92 (84) Avg
Meridian Growth Legacy MERDX ´ QQQ 24.9 24.9 14.1 16.7 12.6 78 78 70 55 68 0.0 24.91 (84) Avg
Meridian Small Cap Growth Investor MISGX ´ QQQ 27.8 27.8 15.2 17.7 70 70 65 47 — 0.0 25.68 (79) Avg
MFS New Discovery A MNDAX ´ QQQQ 44.6 44.6 26.0 22.3 14.2 31 31 19 17 44 0.0 23.76 (84) Avg
Neuberger Berman Genesis Inv NBGNX „ QQQ 24.8 24.8 14.7 15.5 12.5 79 79 69 66 70 0.0 20.65 (87) Low
Royce Premier Invmt RYPRX ˇ QQ 11.5 11.5 10.2 15.3 9.9 97 97 88 69 96 0.9 23.49 (90) -Avg
T. Rowe Price QM US Small-Cap Gr Eq PRDSX ΠQQQQ 23.8 23.8 15.3 15.8 14.4 81 81 64 64 39 0.0 22.22 (90) Low
T. Rowe Price Small-Cap Stock OTCFX „ [ QQQ 25.1 25.1 17.4 17.2 14.0 77 77 53 50 48 0.0 22.02 (86) Low
Vanguard Explorer Inv VEXPX ´ QQQ 31.3 31.3 18.9 18.3 14.1 62 62 46 42 46 0.1 24.88 (88) Avg
Vanguard Small Cap Growth Index Admiral VSGAX ΠQQQ 35.3 35.3 19.2 18.0 14.0 52 52 44 45 47 0.4 24.16 (86) -Avg
Wasatch Core Growth WGROX ΠQQQQ 36.6 36.6 20.6 19.2 15.8 49 49 38 37 18 0.0 24.36 (85) Avg
Wasatch Small Cap Growth Investor WAAEX ΠQQQQ 54.5 54.5 30.9 23.4 16.2 21 21 8 15 14 0.0 26.34 (81) +Avg
Small Blend — 11.0 11.0 6.4 10.5 9.8 — — — — — — 25.48 (84) —
AMG River Road Small Cap Value N ARSVX — QQQQ 1.8 1.8 7.1 11.8 9.5 86 86 45 33 64 0.0 22.5 (83) -Avg
DFA US Micro Cap I DFSCX „ QQQ 6.6 6.6 4.4 9.7 10.1 74 74 75 66 46 0.9 26.03 (84) Avg
DFA US Small Cap I DFSTX „ QQQ 11.2 11.2 5.5 10.1 10.3 52 52 65 61 41 1.1 25.43 (87) Avg
Fidelity Small Cap Discovery FSCRX „ QQQ 6.9 6.9 5.5 8.8 10.2 72 72 65 79 45 0.4 26.57 (86) +Avg
Fidelity Small Cap Stock FSLCX ˇ QQQ 13.8 13.8 9.2 10.9 8.6 38 38 25 46 84 0.0 25.98 (85) +Avg
Fidelity Stock Selector Small Cap FDSCX — QQQQQ 21.7 21.7 13.2 13.4 11.2 8 8 2 9 21 0.0 23.11 (87) -Avg
Harbor Small Cap Value Instl HASCX „ QQQQ 13.1 13.1 7.0 13.0 11.7 41 41 46 16 9 0.4 25.76 (86) Avg
Mairs & Power Small Cap MSCFX „ QQQ 8.8 8.8 7.0 10.9 64 64 46 42 — 0.6 23.92 (85) -Avg
Neuberger Berman Intrinsic Value A NINAX ´ ] QQQQ 26.6 26.6 12.1 12.9 10.4 3 3 5 18 37 0.0 28.09 (81) +Avg
Royce Pennsylvania Mutual Invmt PENNX ´ QQQQ 14.1 14.1 9.3 13.9 9.6 37 37 25 5 61 0.6 24.49 (87) -Avg
Royce Total Return Invmt RYTRX ˇ QQQ 3.8 3.8 3.9 9.9 8.5 79 79 78 64 86 1.9 22.38 (86) Low
T. Rowe Price Small-Cap Value PRSVX „ QQQQ 12.5 12.5 7.8 12.9 10.5 43 43 33 18 34 0.3 23.45 (84) -Avg
ETributary Small Company Instl FOSCX ´ ] QQQ 1.2 1.2 3.6 8.6 9.0 87 87 81 81 77 0.0 22.9 (81) -Avg
Vanguard Explorer Value Inv VEVFX — QQQ 3.3 3.3 4.5 9.3 9.8 81 81 74 73 57 0.9 27.36 (83) +Avg
Vanguard Small Cap Index Adm VSMAX „ QQQQQ 19.1 19.1 11.2 13.6 12.0 21 21 8 6 5 1.1 24.71 (88) Avg
Vanguard Tax-Managed Small Cap Adm VTMSX „ QQQQ 11.1 11.1 7.8 12.2 11.9 52 52 34 26 7 1.1 25.5 (85) Avg
Russell 2000 Growth Index 34.6 34.6 16.2 16.4 13.5 29.5 5.5 3,119
Russell 2000 Index 20.0 20.0 10.2 13.3 11.2 20.3 2.3 2,436
Legend
E New this month][ Increase/decrease in rating
NR No Morningstar Rating; fund less than three years old.
Red Lowest return in groupGreen Highest return in groupItalic Extended performance
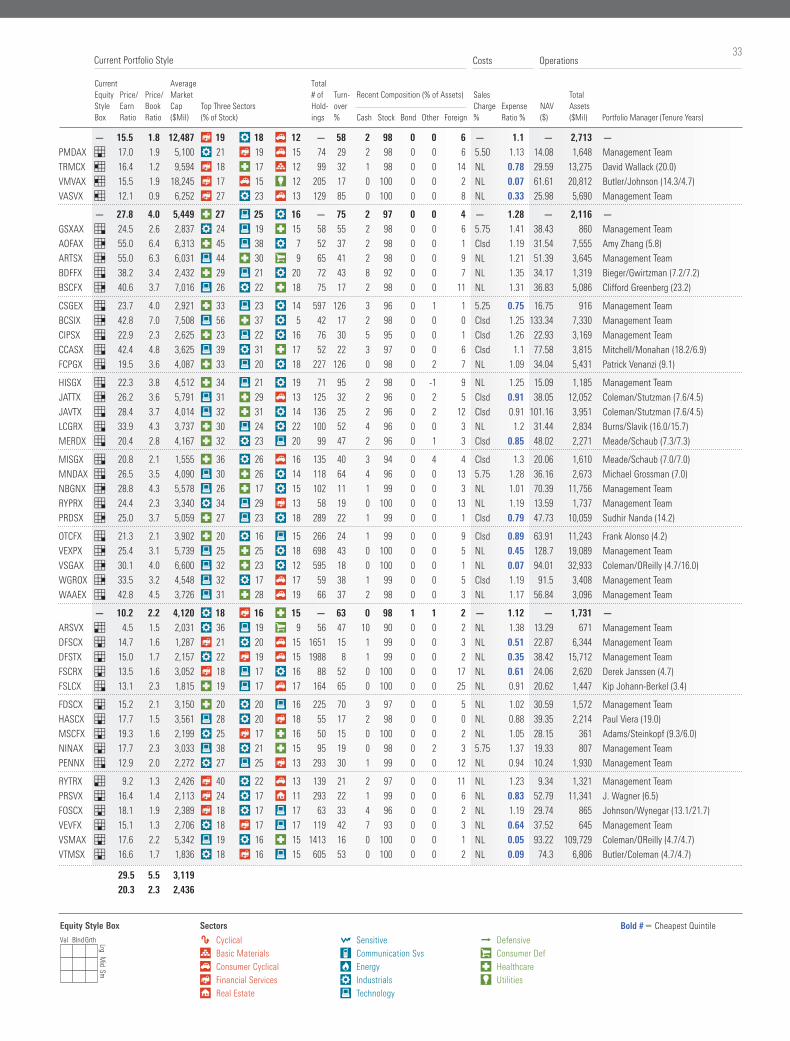
33Costs Operations
Current Equity Style Box
Price/EarnRatio
Price/BookRatio
AverageMarketCap($Mil)
Top Three Sectors (% of Stock)
Total# ofHold-ings
Turn-over%
Recent Composition (% of Assets) Sales
Charge %
Expense Ratio %
NAV ($)
Total Assets ($Mil) Portfolio Manager (Tenure Years)Cash Stock Bond Other Foreign
Current Portfolio Style
— 15.5 1.8 12,487 y 19 p 18 t 12 — 58 2 98 0 0 6 — 1.1 — 2,713 —
PMDAX 6 17.0 1.9 5,100 p 21 y 19 t 15 74 29 2 98 0 0 6 5.50 1.13 14.08 1,648 Management Team
TRMCX 2 16.4 1.2 9,594 y 18 d 17 r 12 99 32 1 98 0 0 14 NL 0.78 29.59 13,275 David Wallack (20.0)
VMVAX 2 15.5 1.9 18,245 y 17 t 15 f 12 205 17 0 100 0 0 2 NL 0.07 61.61 20,812 Butler/Johnson (14.3/4.7)
VASVX 2 12.1 0.9 6,252 y 27 p 23 t 13 129 85 0 100 0 0 8 NL 0.33 25.98 5,690 Management Team
— 27.8 4.0 5,449 d 27 a 25 p 16 — 75 2 97 0 0 4 — 1.28 — 2,116 —
GSXAX 9 24.5 2.6 2,837 p 24 a 19 d 15 58 55 2 98 0 0 6 5.75 1.41 38.43 860 Management Team
AOFAX 8 55.0 6.4 6,313 d 45 a 38 p 7 52 37 2 98 0 0 1 Clsd 1.19 31.54 7,555 Amy Zhang (5.8)
ARTSX 8 55.0 6.3 6,031 a 44 d 30 s 9 65 41 2 98 0 0 9 NL 1.21 51.39 3,645 Management Team
BDFFX 9 38.2 3.4 2,432 d 29 a 21 p 20 72 43 8 92 0 0 7 NL 1.35 34.17 1,319 Bieger/Gwirtzman (7.2/7.2)
BSCFX 8 40.6 3.7 7,016 a 26 p 22 d 18 75 17 2 98 0 0 11 NL 1.31 36.83 5,086 Clifford Greenberg (23.2)
CSGEX 9 23.7 4.0 2,921 d 33 a 23 p 14 597 126 3 96 0 1 1 5.25 0.75 16.75 916 Management Team
BCSIX 8 42.8 7.0 7,508 a 56 d 37 p 5 42 17 2 98 0 0 0 Clsd 1.25 133.34 7,330 Management Team
CIPSX 9 22.9 2.3 2,625 d 23 a 22 p 16 76 30 5 95 0 0 1 Clsd 1.26 22.93 3,169 Management Team
CCASX 9 42.4 4.8 3,625 a 39 p 31 d 17 52 22 3 97 0 0 6 Clsd 1.1 77.58 3,815 Mitchell/Monahan (18.2/6.9)
FCPGX 9 19.5 3.6 4,087 d 33 a 20 p 18 227 126 0 98 0 2 7 NL 1.09 34.04 5,431 Patrick Venanzi (9.1)
HISGX 9 22.3 3.8 4,512 d 34 a 21 p 19 71 95 2 98 0 -1 9 NL 1.25 15.09 1,185 Management Team
JATTX 8 26.2 3.6 5,791 a 31 d 29 t 13 125 32 2 96 0 2 5 Clsd 0.91 38.05 12,052 Coleman/Stutzman (7.6/4.5)
JAVTX 9 28.4 3.7 4,014 a 32 d 31 p 14 136 25 2 96 0 2 12 Clsd 0.91 101.16 3,951 Coleman/Stutzman (7.6/4.5)
LCGRX 9 33.9 4.3 3,737 d 30 a 24 p 22 100 52 4 96 0 0 3 NL 1.2 31.44 2,834 Burns/Slavik (16.0/15.7)
MERDX 9 20.4 2.8 4,167 d 32 p 23 a 20 99 47 2 96 0 1 3 Clsd 0.85 48.02 2,271 Meade/Schaub (7.3/7.3)
MISGX 9 20.8 2.1 1,555 d 36 p 26 t 16 135 40 3 94 0 4 4 Clsd 1.3 20.06 1,610 Meade/Schaub (7.0/7.0)
MNDAX 9 26.5 3.5 4,090 a 30 d 26 p 14 118 64 4 96 0 0 13 5.75 1.28 36.16 2,673 Michael Grossman (7.0)
NBGNX 8 28.8 4.3 5,578 a 26 d 17 p 15 102 11 1 99 0 0 3 NL 1.01 70.39 11,756 Management Team
RYPRX 9 24.4 2.3 3,340 p 34 a 29 y 13 58 19 0 100 0 0 13 NL 1.19 13.59 1,737 Management Team
PRDSX 8 25.0 3.7 5,059 d 27 a 23 p 18 289 22 1 99 0 0 1 Clsd 0.79 47.73 10,059 Sudhir Nanda (14.2)
OTCFX 9 21.3 2.1 3,902 d 20 p 16 a 15 266 24 1 99 0 0 9 Clsd 0.89 63.91 11,243 Frank Alonso (4.2)
VEXPX 8 25.4 3.1 5,739 a 25 d 25 p 18 698 43 0 100 0 0 5 NL 0.45 128.7 19,089 Management Team
VSGAX 8 30.1 4.0 6,600 a 32 d 23 p 12 595 18 0 100 0 0 1 NL 0.07 94.01 32,933 Coleman/OReilly (4.7/16.0)
WGROX 8 33.5 3.2 4,548 a 32 p 17 t 17 59 38 1 99 0 0 5 Clsd 1.19 91.5 3,408 Management Team
WAAEX 9 42.8 4.5 3,726 a 31 d 28 t 19 66 37 2 98 0 0 3 NL 1.17 56.84 3,096 Management Team
— 10.2 2.2 4,120 p 18 y 16 d 15 — 63 0 98 1 1 2 — 1.12 — 1,731 —
ARSVX 3 4.5 1.5 2,031 p 36 a 19 s 9 56 47 10 90 0 0 2 NL 1.38 13.29 671 Management Team
DFSCX 6 14.7 1.6 1,287 y 21 p 20 t 15 1651 15 1 99 0 0 3 NL 0.51 22.87 6,344 Management Team
DFSTX 6 15.0 1.7 2,157 p 22 y 19 t 15 1988 8 1 99 0 0 2 NL 0.35 38.42 15,712 Management Team
FSCRX 6 13.5 1.6 3,052 y 18 a 17 p 16 88 52 0 100 0 0 17 NL 0.61 24.06 2,620 Derek Janssen (4.7)
FSLCX 9 13.1 2.3 1,815 d 19 a 17 t 17 164 65 0 100 0 0 25 NL 0.91 20.62 1,447 Kip Johann-Berkel (3.4)
FDSCX 6 15.2 2.1 3,150 d 20 p 20 a 16 225 70 3 97 0 0 5 NL 1.02 30.59 1,572 Management Team
HASCX 6 17.7 1.5 3,561 a 28 p 20 y 18 55 17 2 98 0 0 0 NL 0.88 39.35 2,214 Paul Viera (19.0)
MSCFX 6 19.3 1.6 2,199 p 25 y 17 d 16 50 15 0 100 0 0 2 NL 1.05 28.15 361 Adams/Steinkopf (9.3/6.0)
NINAX 6 17.7 2.3 3,033 a 38 p 21 d 15 95 19 0 98 0 2 3 5.75 1.37 19.33 807 Management Team
PENNX 9 12.9 2.0 2,272 p 27 a 25 y 13 293 30 1 99 0 0 12 NL 0.94 10.24 1,930 Management Team
RYTRX 3 9.2 1.3 2,426 y 40 p 22 t 13 139 21 2 97 0 0 11 NL 1.23 9.34 1,321 Management Team
PRSVX 6 16.4 1.4 2,113 y 24 p 17 u 11 293 22 1 99 0 0 6 NL 0.83 52.79 11,341 J. Wagner (6.5)
FOSCX 6 18.1 1.9 2,389 y 18 p 17 a 17 63 33 4 96 0 0 2 NL 1.19 29.74 865 Johnson/Wynegar (13.1/21.7)
VEVFX 6 15.1 1.3 2,706 p 18 y 17 a 17 119 42 7 93 0 0 3 NL 0.64 37.52 645 Management Team
VSMAX 6 17.6 2.2 5,342 a 19 p 16 d 15 1413 16 0 100 0 0 1 NL 0.05 93.22 109,729 Coleman/OReilly (4.7/4.7)
VTMSX 6 16.6 1.7 1,836 p 18 y 16 a 15 605 53 0 100 0 0 2 NL 0.09 74.3 6,806 Butler/Coleman (4.7/4.7)
Russell 2000 Growth Index 34.6 34.6 16.2 16.4 13.5 29.5 5.5 3,119
Russell 2000 Index 20.0 20.0 10.2 13.3 11.2 20.3 2.3 2,436
Bold # Cheapest QuintileEquity Style BoxVal Blnd Grth Lrg M
id Sm
Sectors
h Cyclical
r Basic Materials
t Consumer Cyclical
y Financial Services
u Real Estate
j Sensitive
i Communication Svs
o Energy
p Industrials
a Technology
k Defensive
s Consumer Def
d Healthcare
f Utilities
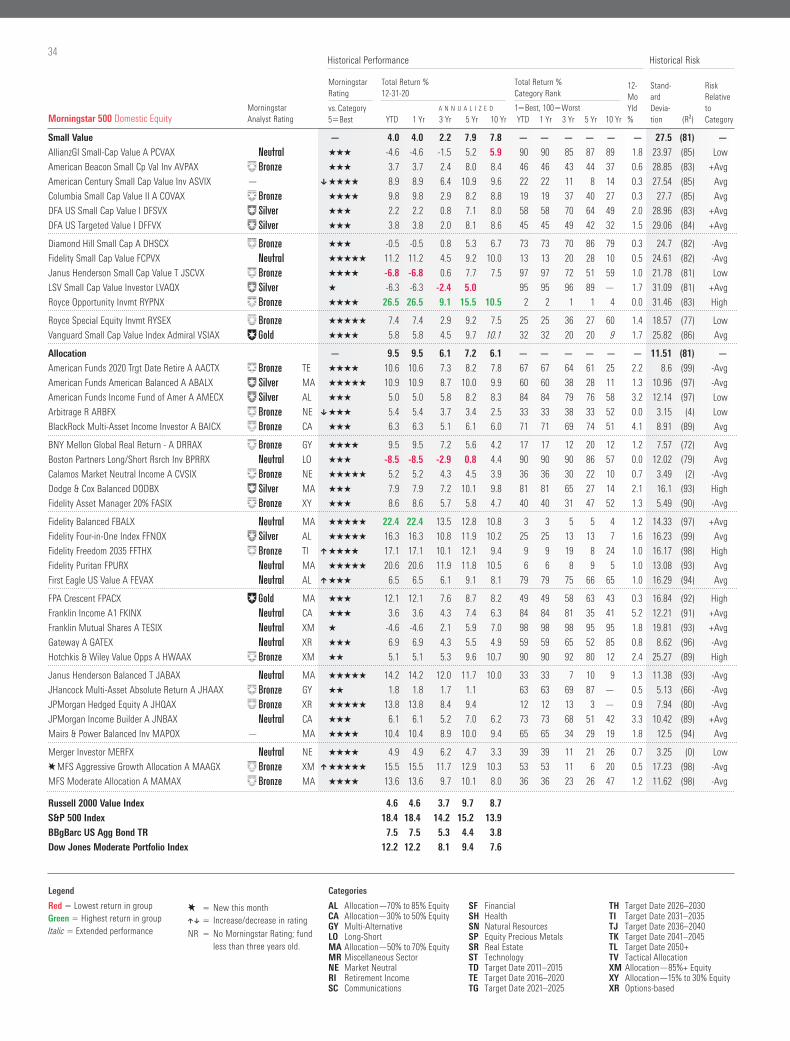
34
Morningstar Analyst Rating
Morningstar Rating
Total Return % 12-31-20
Total Return % Category Rank
12-MoYld %
Stand- ard Devia- tion (R²)
Risk Relative to Category
vs. Category5Best
A N N U A L I Z E D 1Best, 100WorstYTD 1 Yr 3 Yr 5 Yr 10 Yr YTD 1 Yr 3 Yr 5 Yr 10 Yr
Historical Performance Historical Risk
Small Value — 4.0 4.0 2.2 7.9 7.8 — — — — — — 27.5 (81) —
AllianzGI Small-Cap Value A PCVAX ˇ QQQ -4.6 -4.6 -1.5 5.2 5.9 90 90 85 87 89 1.8 23.97 (85) Low
American Beacon Small Cp Val Inv AVPAX ´ QQQ 3.7 3.7 2.4 8.0 8.4 46 46 43 44 37 0.6 28.85 (83) +Avg
American Century Small Cap Value Inv ASVIX — [ QQQQ 8.9 8.9 6.4 10.9 9.6 22 22 11 8 14 0.3 27.54 (85) Avg
Columbia Small Cap Value II A COVAX ´ QQQQ 9.8 9.8 2.9 8.2 8.8 19 19 37 40 27 0.3 27.7 (85) Avg
DFA US Small Cap Value I DFSVX „ QQQ 2.2 2.2 0.8 7.1 8.0 58 58 70 64 49 2.0 28.96 (83) +Avg
DFA US Targeted Value I DFFVX „ QQQ 3.8 3.8 2.0 8.1 8.6 45 45 49 42 32 1.5 29.06 (84) +Avg
Diamond Hill Small Cap A DHSCX ´ QQQ -0.5 -0.5 0.8 5.3 6.7 73 73 70 86 79 0.3 24.7 (82) -Avg
Fidelity Small Cap Value FCPVX ˇ QQQQQ 11.2 11.2 4.5 9.2 10.0 13 13 20 28 10 0.5 24.61 (82) -Avg
Janus Henderson Small Cap Value T JSCVX ´ QQQQ -6.8 -6.8 0.6 7.7 7.5 97 97 72 51 59 1.0 21.78 (81) Low
LSV Small Cap Value Investor LVAQX „ Q -6.3 -6.3 -2.4 5.0 95 95 96 89 — 1.7 31.09 (81) +Avg
Royce Opportunity Invmt RYPNX ´ QQQQ 26.5 26.5 9.1 15.5 10.5 2 2 1 1 4 0.0 31.46 (83) High
Royce Special Equity Invmt RYSEX ´ QQQQQ 7.4 7.4 2.9 9.2 7.5 25 25 36 27 60 1.4 18.57 (77) Low
Vanguard Small Cap Value Index Admiral VSIAX ΠQQQQ 5.8 5.8 4.5 9.7 10.1 32 32 20 20 9 1.7 25.82 (86) Avg
Allocation — 9.5 9.5 6.1 7.2 6.1 — — — — — — 11.51 (81) —
American Funds 2020 Trgt Date Retire A AACTX ´ TE QQQQ 10.6 10.6 7.3 8.2 7.8 67 67 64 61 25 2.2 8.6 (99) -Avg
American Funds American Balanced A ABALX „ MA QQQQQ 10.9 10.9 8.7 10.0 9.9 60 60 38 28 11 1.3 10.96 (97) -Avg
American Funds Income Fund of Amer A AMECX „ AL QQQ 5.0 5.0 5.8 8.2 8.3 84 84 79 76 58 3.2 12.14 (97) Low
Arbitrage R ARBFX ´ NE [ QQQ 5.4 5.4 3.7 3.4 2.5 33 33 38 33 52 0.0 3.15 (4) Low
BlackRock Multi-Asset Income Investor A BAICX ´ CA QQQ 6.3 6.3 5.1 6.1 6.0 71 71 69 74 51 4.1 8.91 (89) Avg
BNY Mellon Global Real Return - A DRRAX ´ GY QQQQ 9.5 9.5 7.2 5.6 4.2 17 17 12 20 12 1.2 7.57 (72) Avg
Boston Partners Long/Short Rsrch Inv BPRRX ˇ LO QQQ -8.5 -8.5 -2.9 0.8 4.4 90 90 90 86 57 0.0 12.02 (79) Avg
Calamos Market Neutral Income A CVSIX ´ NE QQQQQ 5.2 5.2 4.3 4.5 3.9 36 36 30 22 10 0.7 3.49 (2) -Avg
Dodge & Cox Balanced DODBX „ MA QQQ 7.9 7.9 7.2 10.1 9.8 81 81 65 27 14 2.1 16.1 (93) High
Fidelity Asset Manager 20% FASIX ´ XY QQQ 8.6 8.6 5.7 5.8 4.7 40 40 31 47 52 1.3 5.49 (90) -Avg
Fidelity Balanced FBALX ˇ MA QQQQQ 22.4 22.4 13.5 12.8 10.8 3 3 5 5 4 1.2 14.33 (97) +Avg
Fidelity Four-in-One Index FFNOX „ AL QQQQQ 16.3 16.3 10.8 11.9 10.2 25 25 13 13 7 1.6 16.23 (99) Avg
Fidelity Freedom 2035 FFTHX ´ TI ] QQQQ 17.1 17.1 10.1 12.1 9.4 9 9 19 8 24 1.0 16.17 (98) High
Fidelity Puritan FPURX ˇ MA QQQQQ 20.6 20.6 11.9 11.8 10.5 6 6 8 9 5 1.0 13.08 (93) Avg
First Eagle US Value A FEVAX ˇ AL ] QQQ 6.5 6.5 6.1 9.1 8.1 79 79 75 66 65 1.0 16.29 (94) Avg
FPA Crescent FPACX ΠMA QQQ 12.1 12.1 7.6 8.7 8.2 49 49 58 63 43 0.3 16.84 (92) High
Franklin Income A1 FKINX ˇ CA QQQ 3.6 3.6 4.3 7.4 6.3 84 84 81 35 41 5.2 12.21 (91) +Avg
Franklin Mutual Shares A TESIX ˇ XM Q -4.6 -4.6 2.1 5.9 7.0 98 98 98 95 95 1.8 19.81 (93) +Avg
Gateway A GATEX ˇ XR QQQ 6.9 6.9 4.3 5.5 4.9 59 59 65 52 85 0.8 8.62 (96) -Avg
Hotchkis & Wiley Value Opps A HWAAX ´ XM QQ 5.1 5.1 5.3 9.6 10.7 90 90 92 80 12 2.4 25.27 (89) High
Janus Henderson Balanced T JABAX ˇ MA QQQQQ 14.2 14.2 12.0 11.7 10.0 33 33 7 10 9 1.3 11.38 (93) -Avg
JHancock Multi-Asset Absolute Return A JHAAX ´ GY QQ 1.8 1.8 1.7 1.1 63 63 69 87 — 0.5 5.13 (66) -Avg
JPMorgan Hedged Equity A JHQAX ´ XR QQQQQ 13.8 13.8 8.4 9.4 12 12 13 3 — 0.9 7.94 (80) -Avg
JPMorgan Income Builder A JNBAX ˇ CA QQQ 6.1 6.1 5.2 7.0 6.2 73 73 68 51 42 3.3 10.42 (89) +Avg
Mairs & Power Balanced Inv MAPOX — MA QQQQ 10.4 10.4 8.9 10.0 9.4 65 65 34 29 19 1.8 12.5 (94) Avg
Merger Investor MERFX ˇ NE QQQQ 4.9 4.9 6.2 4.7 3.3 39 39 11 21 26 0.7 3.25 (0) Low
EMFS Aggressive Growth Allocation A MAAGX ´ XM ] QQQQQ 15.5 15.5 11.7 12.9 10.3 53 53 11 6 20 0.5 17.23 (98) -Avg
MFS Moderate Allocation A MAMAX ´ MA QQQQ 13.6 13.6 9.7 10.1 8.0 36 36 23 26 47 1.2 11.62 (98) -Avg
Morningstar 500 Domestic Equity
Russell 2000 Value Index 4.6 4.6 3.7 9.7 8.7 15.7 1.4 1,862
S&P 500 Index 18.4 18.4 14.2 15.2 13.9 28.3 4.0 176,727
BBgBarc US Agg Bond TR 7.5 7.5 5.3 4.4 3.8
Dow Jones Moderate Portfolio Index 12.2 12.2 8.1 9.4 7.6 23.7 2.4 71,896
Categories
AL Allocation—70% to 85% Equity CA Allocation—30% to 50% EquityGY Multi-AlternativeLO Long-ShortMA Allocation—50% to 70% Equity MR Miscellaneous Sector NE Market Neutral RI Retirement Income SC Communications
SF FinancialSH HealthSN Natural ResourcesSP Equity Precious MetalsSR Real EstateST TechnologyTD Target Date 2011–2015TE Target Date 2016–2020TG Target Date 2021–2025
TH Target Date 2026–2030TI Target Date 2031–2035TJ Target Date 2036–2040TK Target Date 2041–2045TL Target Date 2050+TV Tactical AllocationXM Allocation—85%+ Equity XY Allocation—15% to 30% EquityXR Options-based
Legend
E New this month][ Increase/decrease in rating
NR No Morningstar Rating; fund less than three years old.
Red Lowest return in groupGreen Highest return in groupItalic Extended performance
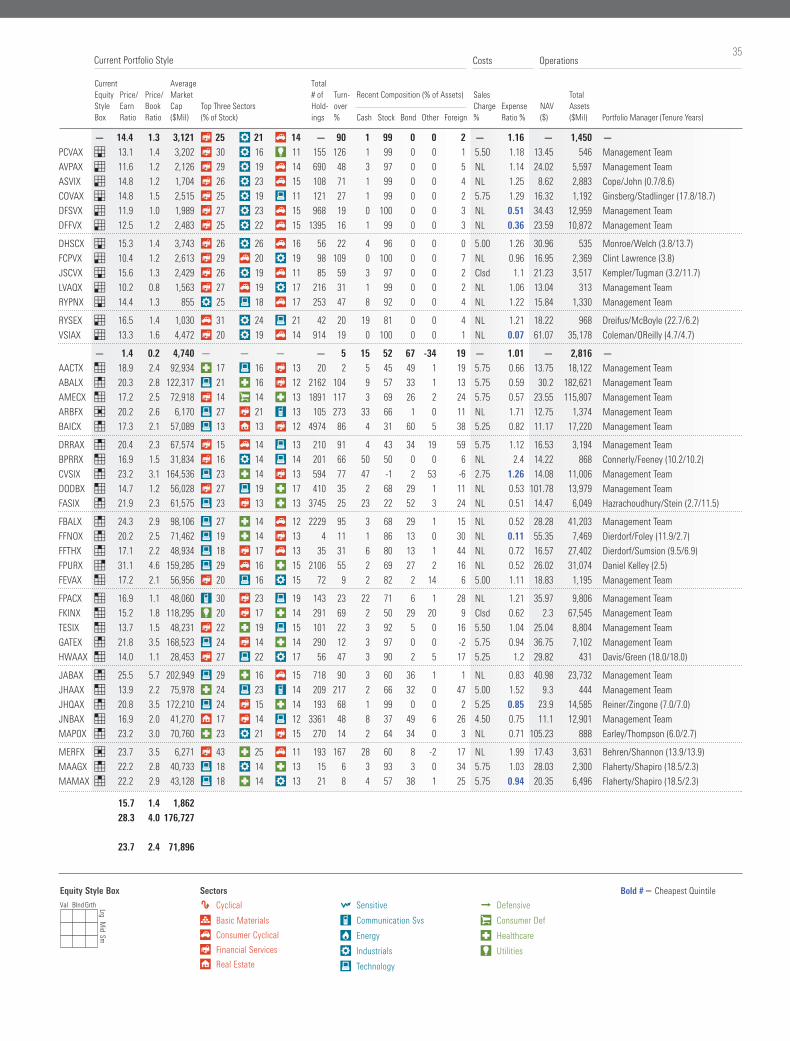
35Costs Operations
Current Equity Style Box
Price/EarnRatio
Price/BookRatio
AverageMarketCap($Mil)
Top Three Sectors (% of Stock)
Total# ofHold-ings
Turn-over%
Recent Composition (% of Assets) Sales
Charge %
Expense Ratio %
NAV ($)
Total Assets ($Mil) Portfolio Manager (Tenure Years)Cash Stock Bond Other Foreign
Current Portfolio Style
— 14.4 1.3 3,121 y 25 p 21 t 14 — 90 1 99 0 0 2 — 1.16 — 1,450 —
PCVAX 6 13.1 1.4 3,202 y 30 p 16 f 11 155 126 1 99 0 0 1 5.50 1.18 13.45 546 Management Team
AVPAX 3 11.6 1.2 2,126 y 29 p 19 t 14 690 48 3 97 0 0 5 NL 1.14 24.02 5,597 Management Team
ASVIX 3 14.8 1.2 1,704 y 26 p 23 t 15 108 71 1 99 0 0 4 NL 1.25 8.62 2,883 Cope/John (0.7/8.6)
COVAX 6 14.8 1.5 2,515 y 25 p 19 a 11 121 27 1 99 0 0 2 5.75 1.29 16.32 1,192 Ginsberg/Stadlinger (17.8/18.7)
DFSVX 3 11.9 1.0 1,989 y 27 p 23 t 15 968 19 0 100 0 0 3 NL 0.51 34.43 12,959 Management Team
DFFVX 3 12.5 1.2 2,483 y 25 p 22 t 15 1395 16 1 99 0 0 3 NL 0.36 23.59 10,872 Management Team
DHSCX 6 15.3 1.4 3,743 y 26 p 26 t 16 56 22 4 96 0 0 0 5.00 1.26 30.96 535 Monroe/Welch (3.8/13.7)
FCPVX 3 10.4 1.2 2,613 y 29 t 20 p 19 98 109 0 100 0 0 7 NL 0.96 16.95 2,369 Clint Lawrence (3.8)
JSCVX 6 15.6 1.3 2,429 y 26 p 19 t 11 85 59 3 97 0 0 2 Clsd 1.1 21.23 3,517 Kempler/Tugman (3.2/11.7)
LVAQX 3 10.2 0.8 1,563 y 27 t 19 p 17 216 31 1 99 0 0 2 NL 1.06 13.04 313 Management Team
RYPNX 6 14.4 1.3 855 p 25 a 18 t 17 253 47 8 92 0 0 4 NL 1.22 15.84 1,330 Management Team
RYSEX 3 16.5 1.4 1,030 t 31 p 24 a 21 42 20 19 81 0 0 4 NL 1.21 18.22 968 Dreifus/McBoyle (22.7/6.2)
VSIAX 3 13.3 1.6 4,472 y 20 p 19 t 14 914 19 0 100 0 0 1 NL 0.07 61.07 35,178 Coleman/OReilly (4.7/4.7)
— 1.4 0.2 4,740 — — — — 5 15 52 67 -34 19 — 1.01 — 2,816 —
AACTX 1 18.9 2.4 92,934 d 17 a 16 y 13 20 2 5 45 49 1 19 5.75 0.66 13.75 18,122 Management Team
ABALX 4 20.3 2.8 122,317 a 21 d 16 y 12 2162 104 9 57 33 1 13 5.75 0.59 30.2 182,621 Management Team
AMECX 1 17.2 2.5 72,918 y 14 s 14 d 13 1891 117 3 69 26 2 24 5.75 0.57 23.55 115,807 Management Team
ARBFX 5 20.2 2.6 6,170 a 27 y 21 i 13 105 273 33 66 1 0 11 NL 1.71 12.75 1,374 Management Team
BAICX 4 17.3 2.1 57,089 a 13 u 13 y 12 4974 86 4 31 60 5 38 5.25 0.82 11.17 17,220 Management Team
DRRAX 4 20.4 2.3 67,574 y 15 t 14 a 13 210 91 4 43 34 19 59 5.75 1.12 16.53 3,194 Management Team
BPRRX 1 16.9 1.5 31,834 y 16 p 14 a 14 201 66 50 50 0 0 6 NL 2.4 14.22 868 Connerly/Feeney (10.2/10.2)
CVSIX 4 23.2 3.1 164,536 a 23 d 14 y 13 594 77 47 -1 2 53 -6 2.75 1.26 14.08 11,006 Management Team
DODBX 1 14.7 1.2 56,028 y 27 a 19 d 17 410 35 2 68 29 1 11 NL 0.53 101.78 13,979 Management Team
FASIX 4 21.9 2.3 61,575 a 23 y 13 d 13 3745 25 23 22 52 3 24 NL 0.51 14.47 6,049 Hazrachoudhury/Stein (2.7/11.5)
FBALX 4 24.3 2.9 98,106 a 27 d 14 t 12 2229 95 3 68 29 1 15 NL 0.52 28.28 41,203 Management Team
FFNOX 4 20.2 2.5 71,462 a 19 d 14 y 13 4 11 1 86 13 0 30 NL 0.11 55.35 7,469 Dierdorf/Foley (11.9/2.7)
FFTHX 4 17.1 2.2 48,934 a 18 y 17 t 13 35 31 6 80 13 1 44 NL 0.72 16.57 27,402 Dierdorf/Sumsion (9.5/6.9)
FPURX 7 31.1 4.6 159,285 a 29 t 16 d 15 2106 55 2 69 27 2 16 NL 0.52 26.02 31,074 Daniel Kelley (2.5)
FEVAX 1 17.2 2.1 56,956 y 20 a 16 p 15 72 9 2 82 2 14 6 5.00 1.11 18.83 1,195 Management Team
FPACX 1 16.9 1.1 48,060 i 30 y 23 a 19 143 23 22 71 6 1 28 NL 1.21 35.97 9,806 Management Team
FKINX 1 15.2 1.8 118,295 f 20 y 17 d 14 291 69 2 50 29 20 9 Clsd 0.62 2.3 67,545 Management Team
TESIX 1 13.7 1.5 48,231 y 22 d 19 a 15 101 22 3 92 5 0 16 5.50 1.04 25.04 8,804 Management Team
GATEX 4 21.8 3.5 168,523 a 24 y 14 d 14 290 12 3 97 0 0 -2 5.75 0.94 36.75 7,102 Management Team
HWAAX 1 14.0 1.1 28,453 y 27 a 22 p 17 56 47 3 90 2 5 17 5.25 1.2 29.82 431 Davis/Green (18.0/18.0)
JABAX 4 25.5 5.7 202,949 a 29 d 16 t 15 718 90 3 60 36 1 1 NL 0.83 40.98 23,732 Management Team
JHAAX 1 13.9 2.2 75,978 d 24 a 23 i 14 209 217 2 66 32 0 47 5.00 1.52 9.3 444 Management Team
JHQAX 4 20.8 3.5 172,210 a 24 y 15 d 14 193 68 1 99 0 0 2 5.25 0.85 23.9 14,585 Reiner/Zingone (7.0/7.0)
JNBAX 1 16.9 2.0 41,270 u 17 y 14 a 12 3361 48 8 37 49 6 26 4.50 0.75 11.1 12,901 Management Team
MAPOX 4 23.2 3.0 70,760 d 23 p 21 y 15 270 14 2 64 34 0 3 NL 0.71 105.23 888 Earley/Thompson (6.0/2.7)
MERFX 5 23.7 3.5 6,271 y 43 d 25 t 11 193 167 28 60 8 -2 17 NL 1.99 17.43 3,631 Behren/Shannon (13.9/13.9)
MAAGX 4 22.2 2.8 40,733 a 18 p 14 d 13 15 6 3 93 3 0 34 5.75 1.03 28.03 2,300 Flaherty/Shapiro (18.5/2.3)
MAMAX 4 22.2 2.9 43,128 a 18 d 14 p 13 21 8 4 57 38 1 25 5.75 0.94 20.35 6,496 Flaherty/Shapiro (18.5/2.3)
Russell 2000 Value Index 4.6 4.6 3.7 9.7 8.7 15.7 1.4 1,862
S&P 500 Index 18.4 18.4 14.2 15.2 13.9 28.3 4.0 176,727
BBgBarc US Agg Bond TR 7.5 7.5 5.3 4.4 3.8
Dow Jones Moderate Portfolio Index 12.2 12.2 8.1 9.4 7.6 23.7 2.4 71,896
Bold # Cheapest QuintileEquity Style BoxVal Blnd Grth Lrg M
id Sm
Sectors
h Cyclical
r Basic Materials
t Consumer Cyclical
y Financial Services
u Real Estate
j Sensitive
i Communication Svs
o Energy
p Industrials
a Technology
k Defensive
s Consumer Def
d Healthcare
f Utilities
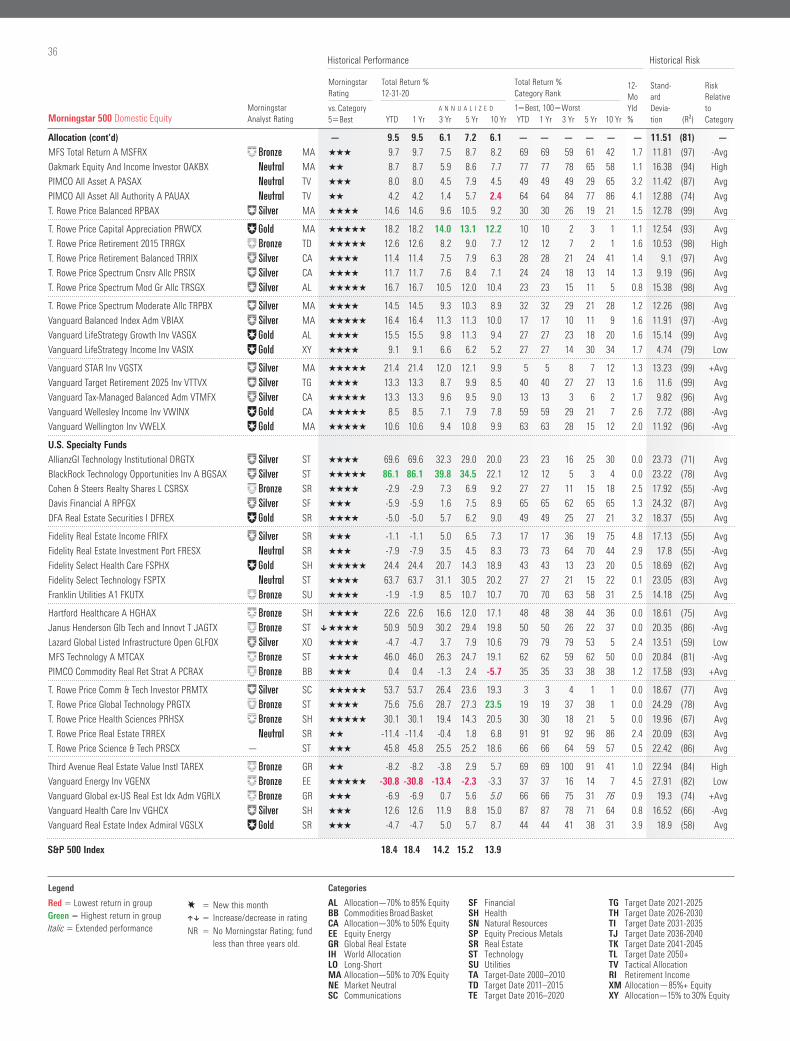
36
Morningstar Analyst Rating
Morningstar Rating
Total Return % 12-31-20
Total Return % Category Rank
12-MoYld %
Stand- ard Devia- tion (R²)
Risk Relative to Category
vs. Category5Best
A N N U A L I Z E D 1Best, 100WorstYTD 1 Yr 3 Yr 5 Yr 10 Yr YTD 1 Yr 3 Yr 5 Yr 10 Yr
Historical Performance Historical Risk
Allocation (cont’d) — 9.5 9.5 6.1 7.2 6.1 — — — — — — 11.51 (81) —
MFS Total Return A MSFRX ´ MA QQQ 9.7 9.7 7.5 8.7 8.2 69 69 59 61 42 1.7 11.81 (97) -Avg
Oakmark Equity And Income Investor OAKBX ˇ MA QQ 8.7 8.7 5.9 8.6 7.7 77 77 78 65 58 1.1 16.38 (94) High
PIMCO All Asset A PASAX ˇ TV QQQ 8.0 8.0 4.5 7.9 4.5 49 49 49 29 65 3.2 11.42 (87) Avg
PIMCO All Asset All Authority A PAUAX ˇ TV QQ 4.2 4.2 1.4 5.7 2.4 64 64 84 77 86 4.1 12.88 (74) Avg
T. Rowe Price Balanced RPBAX „ MA QQQQ 14.6 14.6 9.6 10.5 9.2 30 30 26 19 21 1.5 12.78 (99) Avg
T. Rowe Price Capital Appreciation PRWCX ΠMA QQQQQ 18.2 18.2 14.0 13.1 12.2 10 10 2 3 1 1.1 12.54 (93) Avg
T. Rowe Price Retirement 2015 TRRGX ´ TD QQQQQ 12.6 12.6 8.2 9.0 7.7 12 12 7 2 1 1.6 10.53 (98) High
T. Rowe Price Retirement Balanced TRRIX „ CA QQQQ 11.4 11.4 7.5 7.9 6.3 28 28 21 24 41 1.4 9.1 (97) Avg
T. Rowe Price Spectrum Cnsrv Allc PRSIX „ CA QQQQ 11.7 11.7 7.6 8.4 7.1 24 24 18 13 14 1.3 9.19 (96) Avg
T. Rowe Price Spectrum Mod Gr Allc TRSGX „ AL QQQQQ 16.7 16.7 10.5 12.0 10.4 23 23 15 11 5 0.8 15.38 (98) Avg
T. Rowe Price Spectrum Moderate Allc TRPBX „ MA QQQQ 14.5 14.5 9.3 10.3 8.9 32 32 29 21 28 1.2 12.26 (98) Avg
Vanguard Balanced Index Adm VBIAX „ MA QQQQQ 16.4 16.4 11.3 11.3 10.0 17 17 10 11 9 1.6 11.91 (97) -Avg
Vanguard LifeStrategy Growth Inv VASGX ΠAL QQQQ 15.5 15.5 9.8 11.3 9.4 27 27 23 18 20 1.6 15.14 (99) Avg
Vanguard LifeStrategy Income Inv VASIX ΠXY QQQQ 9.1 9.1 6.6 6.2 5.2 27 27 14 30 34 1.7 4.74 (79) Low
Vanguard STAR Inv VGSTX „ MA QQQQQ 21.4 21.4 12.0 12.1 9.9 5 5 8 7 12 1.3 13.23 (99) +Avg
Vanguard Target Retirement 2025 Inv VTTVX „ TG QQQQ 13.3 13.3 8.7 9.9 8.5 40 40 27 27 13 1.6 11.6 (99) Avg
Vanguard Tax-Managed Balanced Adm VTMFX „ CA QQQQQ 13.3 13.3 9.6 9.5 9.0 13 13 3 6 2 1.7 9.82 (96) Avg
Vanguard Wellesley Income Inv VWINX ΠCA QQQQQ 8.5 8.5 7.1 7.9 7.8 59 59 29 21 7 2.6 7.72 (88) -Avg
Vanguard Wellington Inv VWELX ΠMA QQQQQ 10.6 10.6 9.4 10.8 9.9 63 63 28 15 12 2.0 11.92 (96) -Avg
U.S. Specialty Funds
AllianzGI Technology Institutional DRGTX „ ST QQQQ 69.6 69.6 32.3 29.0 20.0 23 23 16 25 30 0.0 23.73 (71) Avg
BlackRock Technology Opportunities Inv A BGSAX „ ST QQQQQ 86.1 86.1 39.8 34.5 22.1 12 12 5 3 4 0.0 23.22 (78) Avg
Cohen & Steers Realty Shares L CSRSX ´ SR QQQQ -2.9 -2.9 7.3 6.9 9.2 27 27 11 15 18 2.5 17.92 (55) -Avg
Davis Financial A RPFGX „ SF QQQ -5.9 -5.9 1.6 7.5 8.9 65 65 62 65 65 1.3 24.32 (87) Avg
DFA Real Estate Securities I DFREX ΠSR QQQQ -5.0 -5.0 5.7 6.2 9.0 49 49 25 27 21 3.2 18.37 (55) Avg
Fidelity Real Estate Income FRIFX „ SR QQQ -1.1 -1.1 5.0 6.5 7.3 17 17 36 19 75 4.8 17.13 (55) Avg
Fidelity Real Estate Investment Port FRESX ˇ SR QQQ -7.9 -7.9 3.5 4.5 8.3 73 73 64 70 44 2.9 17.8 (55) -Avg
Fidelity Select Health Care FSPHX ΠSH QQQQQ 24.4 24.4 20.7 14.3 18.9 43 43 13 23 20 0.5 18.69 (62) Avg
Fidelity Select Technology FSPTX ˇ ST QQQQ 63.7 63.7 31.1 30.5 20.2 27 27 21 15 22 0.1 23.05 (83) Avg
Franklin Utilities A1 FKUTX ´ SU QQQQ -1.9 -1.9 8.5 10.7 10.7 70 70 63 58 31 2.5 14.18 (25) Avg
Hartford Healthcare A HGHAX ´ SH QQQQ 22.6 22.6 16.6 12.0 17.1 48 48 38 44 36 0.0 18.61 (75) Avg
Janus Henderson Glb Tech and Innovt T JAGTX ´ ST [ QQQQ 50.9 50.9 30.2 29.4 19.8 50 50 26 22 37 0.0 20.35 (86) -Avg
Lazard Global Listed Infrastructure Open GLFOX „ XO QQQQ -4.7 -4.7 3.7 7.9 10.6 79 79 79 53 5 2.4 13.51 (59) Low
MFS Technology A MTCAX ´ ST QQQQ 46.0 46.0 26.3 24.7 19.1 62 62 59 62 50 0.0 20.84 (81) -Avg
PIMCO Commodity Real Ret Strat A PCRAX ´ BB QQQ 0.4 0.4 -1.3 2.4 -5.7 35 35 33 38 38 1.2 17.58 (93) +Avg
T. Rowe Price Comm & Tech Investor PRMTX „ SC QQQQQ 53.7 53.7 26.4 23.6 19.3 3 3 4 1 1 0.0 18.67 (77) Avg
T. Rowe Price Global Technology PRGTX ´ ST QQQQ 75.6 75.6 28.7 27.3 23.5 19 19 37 38 1 0.0 24.29 (78) Avg
T. Rowe Price Health Sciences PRHSX ´ SH QQQQQ 30.1 30.1 19.4 14.3 20.5 30 30 18 21 5 0.0 19.96 (67) Avg
T. Rowe Price Real Estate TRREX ˇ SR QQ -11.4 -11.4 -0.4 1.8 6.8 91 91 92 96 86 2.4 20.09 (63) Avg
T. Rowe Price Science & Tech PRSCX — ST QQQ 45.8 45.8 25.5 25.2 18.6 66 66 64 59 57 0.5 22.42 (86) Avg
Third Avenue Real Estate Value Instl TAREX ´ GR QQ -8.2 -8.2 -3.8 2.9 5.7 69 69 100 91 41 1.0 22.94 (84) High
Vanguard Energy Inv VGENX ´ EE QQQQQ -30.8 -30.8 -13.4 -2.3 -3.3 37 37 16 14 7 4.5 27.91 (82) Low
Vanguard Global ex-US Real Est Idx Adm VGRLX ´ GR QQQ -6.9 -6.9 0.7 5.6 5.0 66 66 75 31 76 0.9 19.3 (74) +Avg
Vanguard Health Care Inv VGHCX „ SH QQQ 12.6 12.6 11.9 8.8 15.0 87 87 78 71 64 0.8 16.52 (66) -Avg
Vanguard Real Estate Index Admiral VGSLX ΠSR QQQ -4.7 -4.7 5.0 5.7 8.7 44 44 41 38 31 3.9 18.9 (58) Avg
Morningstar 500 Domestic Equity
S&P 500 Index 18.4 18.4 14.2 15.2 13.9 28.3 4.0 176,727
AL Allocation—70% to 85% EquityBB Commodities Broad BasketCA Allocation—30% to 50% EquityEE Equity EnergyGR Global Real EstateIH World AllocationLO Long-ShortMA Allocation—50% to 70% EquityNE Market Neutral SC Communications
SF FinancialSH HealthSN Natural ResourcesSP Equity Precious MetalsSR Real EstateST TechnologySU UtilitiesTA Target-Date 2000–2010TD Target Date 2011–2015TE Target Date 2016–2020
TG Target Date 2021-2025TH Target Date 2026-2030 TI Target Date 2031-2035TJ Target Date 2036-2040TK Target Date 2041-2045TL Target Date 2050+TV Tactical AllocationRI Retirement Income XM Allocation—85%+ Equity XY Allocation—15% to 30% Equity
CategoriesLegend
E New this month][ Increase/decrease in rating
NR No Morningstar Rating; fund less than three years old.
Red Lowest return in groupGreen Highest return in groupItalic Extended performance
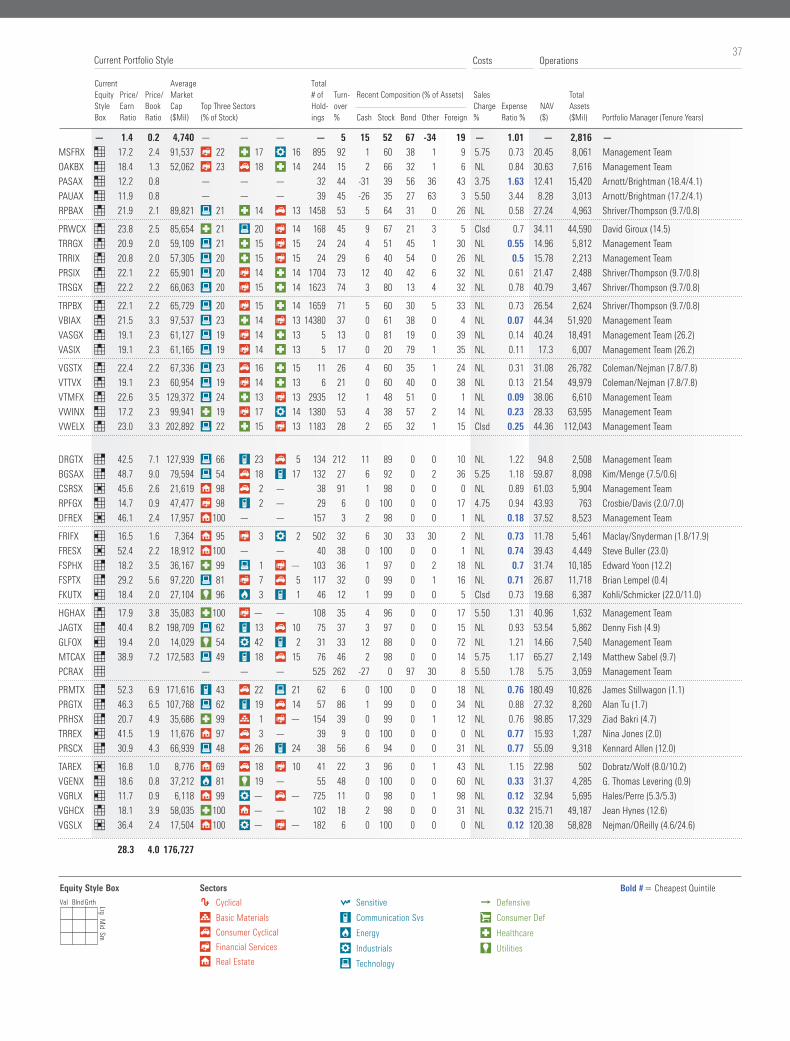
37Costs Operations
Current Equity Style Box
Price/EarnRatio
Price/BookRatio
AverageMarketCap($Mil)
Top Three Sectors (% of Stock)
Total# ofHold-ings
Turn-over%
Recent Composition (% of Assets) Sales
Charge %
Expense Ratio %
NAV ($)
Total Assets ($Mil) Portfolio Manager (Tenure Years)Cash Stock Bond Other Foreign
Current Portfolio Style
S&P 500 Index 18.4 18.4 14.2 15.2 13.9 28.3 4.0 176,727
Bold # Cheapest QuintileEquity Style BoxVal Blnd Grth Lrg M
id Sm
Sectors
h Cyclical
r Basic Materials
t Consumer Cyclical
y Financial Services
u Real Estate
j Sensitive
i Communication Svs
o Energy
p Industrials
a Technology
k Defensive
s Consumer Def
d Healthcare
f Utilities
— 1.4 0.2 4,740 — — — — 5 15 52 67 -34 19 — 1.01 — 2,816 —
MSFRX 1 17.2 2.4 91,537 y 22 d 17 p 16 895 92 1 60 38 1 9 5.75 0.73 20.45 8,061 Management Team
OAKBX 1 18.4 1.3 52,062 y 23 t 18 d 14 244 15 2 66 32 1 6 NL 0.84 30.63 7,616 Management Team
PASAX 1 12.2 0.8 — — — 32 44 -31 39 56 36 43 3.75 1.63 12.41 15,420 Arnott/Brightman (18.4/4.1)
PAUAX 1 11.9 0.8 — — — 39 45 -26 35 27 63 3 5.50 3.44 8.28 3,013 Arnott/Brightman (17.2/4.1)
RPBAX 4 21.9 2.1 89,821 a 21 d 14 t 13 1458 53 5 64 31 0 26 NL 0.58 27.24 4,963 Shriver/Thompson (9.7/0.8)
PRWCX 4 23.8 2.5 85,654 d 21 a 20 y 14 168 45 9 67 21 3 5 Clsd 0.7 34.11 44,590 David Giroux (14.5)
TRRGX 4 20.9 2.0 59,109 a 21 d 15 y 15 24 24 4 51 45 1 30 NL 0.55 14.96 5,812 Management Team
TRRIX 4 20.8 2.0 57,305 a 20 d 15 y 15 24 29 6 40 54 0 26 NL 0.5 15.78 2,213 Management Team
PRSIX 4 22.1 2.2 65,901 a 20 y 14 d 14 1704 73 12 40 42 6 32 NL 0.61 21.47 2,488 Shriver/Thompson (9.7/0.8)
TRSGX 4 22.2 2.2 66,063 a 20 y 15 d 14 1623 74 3 80 13 4 32 NL 0.78 40.79 3,467 Shriver/Thompson (9.7/0.8)
TRPBX 4 22.1 2.2 65,729 a 20 y 15 d 14 1659 71 5 60 30 5 33 NL 0.73 26.54 2,624 Shriver/Thompson (9.7/0.8)
VBIAX 4 21.5 3.3 97,537 a 23 d 14 y 13 14380 37 0 61 38 0 4 NL 0.07 44.34 51,920 Management Team
VASGX 4 19.1 2.3 61,127 a 19 y 14 d 13 5 13 0 81 19 0 39 NL 0.14 40.24 18,491 Management Team (26.2)
VASIX 4 19.1 2.3 61,165 a 19 y 14 d 13 5 17 0 20 79 1 35 NL 0.11 17.3 6,007 Management Team (26.2)
VGSTX 4 22.4 2.2 67,336 a 23 t 16 d 15 11 26 4 60 35 1 24 NL 0.31 31.08 26,782 Coleman/Nejman (7.8/7.8)
VTTVX 4 19.1 2.3 60,954 a 19 y 14 d 13 6 21 0 60 40 0 38 NL 0.13 21.54 49,979 Coleman/Nejman (7.8/7.8)
VTMFX 4 22.6 3.5 129,372 a 24 d 13 y 13 2935 12 1 48 51 0 1 NL 0.09 38.06 6,610 Management Team
VWINX 1 17.2 2.3 99,941 d 19 y 17 p 14 1380 53 4 38 57 2 14 NL 0.23 28.33 63,595 Management Team
VWELX 4 23.0 3.3 202,892 a 22 d 15 y 13 1183 28 2 65 32 1 15 Clsd 0.25 44.36 112,043 Management Team
DRGTX 7 42.5 7.1 127,939 a 66 i 23 t 5 134 212 11 89 0 0 10 NL 1.22 94.8 2,508 Management Team
BGSAX 7 48.7 9.0 79,594 a 54 t 18 i 17 132 27 6 92 0 2 36 5.25 1.18 59.87 8,098 Kim/Menge (7.5/0.6)
CSRSX 5 45.6 2.6 21,619 u 98 t 2 — 38 91 1 98 0 0 0 NL 0.89 61.03 5,904 Management Team
RPFGX 1 14.7 0.9 47,477 y 98 i 2 — 29 6 0 100 0 0 17 4.75 0.94 43.93 763 Crosbie/Davis (2.0/7.0)
DFREX 5 46.1 2.4 17,957 u 100 — — 157 3 2 98 0 0 1 NL 0.18 37.52 8,523 Management Team
FRIFX 2 16.5 1.6 7,364 u 95 y 3 p 2 502 32 6 30 33 30 2 NL 0.73 11.78 5,461 Maclay/Snyderman (1.8/17.9)
FRESX 5 52.4 2.2 18,912 u 100 — — 40 38 0 100 0 0 1 NL 0.74 39.43 4,449 Steve Buller (23.0)
FSPHX 7 18.2 3.5 36,167 d 99 a 1 y — 103 36 1 97 0 2 18 NL 0.7 31.74 10,185 Edward Yoon (12.2)
FSPTX 7 29.2 5.6 97,220 a 81 y 7 t 5 117 32 0 99 0 1 16 NL 0.71 26.87 11,718 Brian Lempel (0.4)
FKUTX 2 18.4 2.0 27,104 f 96 o 3 i 1 46 12 1 99 0 0 5 Clsd 0.73 19.68 6,387 Kohli/Schmicker (22.0/11.0)
HGHAX 4 17.9 3.8 35,083 d 100 y — — 108 35 4 96 0 0 17 5.50 1.31 40.96 1,632 Management Team
JAGTX 7 40.4 8.2 198,709 a 62 i 13 t 10 75 37 3 97 0 0 15 NL 0.93 53.54 5,862 Denny Fish (4.9)
GLFOX 2 19.4 2.0 14,029 f 54 p 42 i 2 31 33 12 88 0 0 72 NL 1.21 14.66 7,540 Management Team
MTCAX 7 38.9 7.2 172,583 a 49 i 18 t 15 76 46 2 98 0 0 14 5.75 1.17 65.27 2,149 Matthew Sabel (9.7)
PCRAX 0 — — — 525 262 -27 0 97 30 8 5.50 1.78 5.75 3,059 Management Team
PRMTX 7 52.3 6.9 171,616 i 43 t 22 a 21 62 6 0 100 0 0 18 NL 0.76 180.49 10,826 James Stillwagon (1.1)
PRGTX 7 46.3 6.5 107,768 a 62 i 19 t 14 57 86 1 99 0 0 34 NL 0.88 27.32 8,260 Alan Tu (1.7)
PRHSX 7 20.7 4.9 35,686 d 99 r 1 y — 154 39 0 99 0 1 12 NL 0.76 98.85 17,329 Ziad Bakri (4.7)
TRREX 2 41.5 1.9 11,676 u 97 t 3 — 39 9 0 100 0 0 0 NL 0.77 15.93 1,287 Nina Jones (2.0)
PRSCX 7 30.9 4.3 66,939 a 48 t 26 i 24 38 56 6 94 0 0 31 NL 0.77 55.09 9,318 Kennard Allen (12.0)
TAREX 5 16.8 1.0 8,776 u 69 t 18 y 10 41 22 3 96 0 1 43 NL 1.15 22.98 502 Dobratz/Wolf (8.0/10.2)
VGENX 1 18.6 0.8 37,212 o 81 f 19 — 55 48 0 100 0 0 60 NL 0.33 31.37 4,285 G. Thomas Levering (0.9)
VGRLX 2 11.7 0.9 6,118 u 99 p — t — 725 11 0 98 0 1 98 NL 0.12 32.94 5,695 Hales/Perre (5.3/5.3)
VGHCX 4 18.1 3.9 58,035 d 100 u — — 102 18 2 98 0 0 31 NL 0.32 215.71 49,187 Jean Hynes (12.6)
VGSLX 5 36.4 2.4 17,504 u 100 p — y — 182 6 0 100 0 0 0 NL 0.12 120.38 58,828 Nejman/OReilly (4.6/24.6)
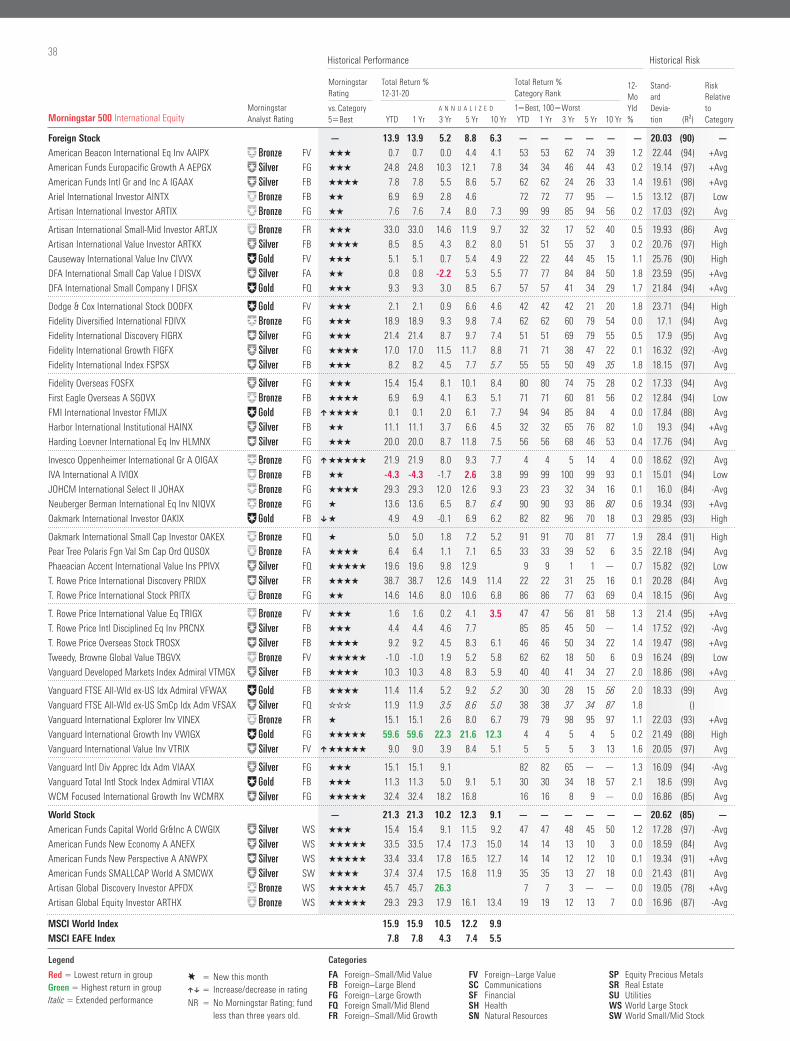
38
Morningstar Analyst Rating
Morningstar Rating
Total Return % 12-31-20
Total Return % Category Rank
12-MoYld %
Stand- ard Devia- tion (R²)
Risk Relative to Category
vs. Category5Best
A N N U A L I Z E D 1Best, 100WorstYTD 1 Yr 3 Yr 5 Yr 10 Yr YTD 1 Yr 3 Yr 5 Yr 10 Yr
Historical Performance Historical Risk
Foreign Stock — 13.9 13.9 5.2 8.8 6.3 — — — — — — 20.03 (90) —
American Beacon International Eq Inv AAIPX ´ FV QQQ 0.7 0.7 0.0 4.4 4.1 53 53 62 74 39 1.2 22.44 (94) +Avg
American Funds Europacific Growth A AEPGX „ FG QQQ 24.8 24.8 10.3 12.1 7.8 34 34 46 44 43 0.2 19.14 (97) +Avg
American Funds Intl Gr and Inc A IGAAX „ FB QQQQ 7.8 7.8 5.5 8.6 5.7 62 62 24 26 33 1.4 19.61 (98) +Avg
Ariel International Investor AINTX ´ FB QQ 6.9 6.9 2.8 4.6 72 72 77 95 — 1.5 13.12 (87) Low
Artisan International Investor ARTIX ´ FG QQ 7.6 7.6 7.4 8.0 7.3 99 99 85 94 56 0.2 17.03 (92) Avg
Artisan International Small-Mid Investor ARTJX ´ FR QQQ 33.0 33.0 14.6 11.9 9.7 32 32 17 52 40 0.5 19.93 (86) Avg
Artisan International Value Investor ARTKX „ FB QQQQ 8.5 8.5 4.3 8.2 8.0 51 51 55 37 3 0.2 20.76 (97) High
Causeway International Value Inv CIVVX ΠFV QQQ 5.1 5.1 0.7 5.4 4.9 22 22 44 45 15 1.1 25.76 (90) High
DFA International Small Cap Value I DISVX „ FA QQ 0.8 0.8 -2.2 5.3 5.5 77 77 84 84 50 1.8 23.59 (95) +Avg
DFA International Small Company I DFISX ΠFQ QQQ 9.3 9.3 3.0 8.5 6.7 57 57 41 34 29 1.7 21.84 (94) +Avg
Dodge & Cox International Stock DODFX ΠFV QQQ 2.1 2.1 0.9 6.6 4.6 42 42 42 21 20 1.8 23.71 (94) High
Fidelity Diversified International FDIVX ´ FG QQQ 18.9 18.9 9.3 9.8 7.4 62 62 60 79 54 0.0 17.1 (94) Avg
Fidelity International Discovery FIGRX „ FG QQQ 21.4 21.4 8.7 9.7 7.4 51 51 69 79 55 0.5 17.9 (95) Avg
Fidelity International Growth FIGFX „ FG QQQQ 17.0 17.0 11.5 11.7 8.8 71 71 38 47 22 0.1 16.32 (92) -Avg
Fidelity International Index FSPSX „ FB QQQ 8.2 8.2 4.5 7.7 5.7 55 55 50 49 35 1.8 18.15 (97) Avg
Fidelity Overseas FOSFX „ FG QQQ 15.4 15.4 8.1 10.1 8.4 80 80 74 75 28 0.2 17.33 (94) Avg
First Eagle Overseas A SGOVX ´ FB QQQQ 6.9 6.9 4.1 6.3 5.1 71 71 60 81 56 0.2 12.84 (94) Low
FMI International Investor FMIJX ΠFB ] QQQQ 0.1 0.1 2.0 6.1 7.7 94 94 85 84 4 0.0 17.84 (88) Avg
Harbor International Institutional HAINX „ FB QQ 11.1 11.1 3.7 6.6 4.5 32 32 65 76 82 1.0 19.3 (94) +Avg
Harding Loevner International Eq Inv HLMNX „ FG QQQ 20.0 20.0 8.7 11.8 7.5 56 56 68 46 53 0.4 17.76 (94) Avg
Invesco Oppenheimer International Gr A OIGAX ´ FG ] QQQQQ 21.9 21.9 8.0 9.3 7.7 4 4 5 14 4 0.0 18.62 (92) Avg
IVA International A IVIOX ´ FB QQ -4.3 -4.3 -1.7 2.6 3.8 99 99 100 99 93 0.1 15.01 (94) Low
JOHCM International Select II JOHAX ´ FG QQQQ 29.3 29.3 12.0 12.6 9.3 23 23 32 34 16 0.1 16.0 (84) -Avg
Neuberger Berman International Eq Inv NIQVX ´ FG Q 13.6 13.6 6.5 8.7 6.4 90 90 93 86 80 0.6 19.34 (93) +Avg
Oakmark International Investor OAKIX ΠFB [ Q 4.9 4.9 -0.1 6.9 6.2 82 82 96 70 18 0.3 29.85 (93) High
Oakmark International Small Cap Investor OAKEX ´ FQ Q 5.0 5.0 1.8 7.2 5.2 91 91 70 81 77 1.9 28.4 (91) High
Pear Tree Polaris Fgn Val Sm Cap Ord QUSOX ´ FA QQQQ 6.4 6.4 1.1 7.1 6.5 33 33 39 52 6 3.5 22.18 (94) Avg
Phaeacian Accent International Value Ins PPIVX „ FQ QQQQQ 19.6 19.6 9.8 12.9 9 9 1 1 — 0.7 15.82 (92) Low
T. Rowe Price International Discovery PRIDX „ FR QQQQ 38.7 38.7 12.6 14.9 11.4 22 22 31 25 16 0.1 20.28 (84) Avg
T. Rowe Price International Stock PRITX ´ FG QQ 14.6 14.6 8.0 10.6 6.8 86 86 77 63 69 0.4 18.15 (96) Avg
T. Rowe Price International Value Eq TRIGX ´ FV QQQ 1.6 1.6 0.2 4.1 3.5 47 47 56 81 58 1.3 21.4 (95) +Avg
T. Rowe Price Intl Disciplined Eq Inv PRCNX „ FB QQQ 4.4 4.4 4.6 7.7 85 85 45 50 — 1.4 17.52 (92) -Avg
T. Rowe Price Overseas Stock TROSX „ FB QQQQ 9.2 9.2 4.5 8.3 6.1 46 46 50 34 22 1.4 19.47 (98) +Avg
Tweedy, Browne Global Value TBGVX ´ FV QQQQQ -1.0 -1.0 1.9 5.2 5.8 62 62 18 50 6 0.9 16.24 (89) Low
Vanguard Developed Markets Index Admiral VTMGX „ FB QQQQ 10.3 10.3 4.8 8.3 5.9 40 40 41 34 27 2.0 18.86 (98) +Avg
Vanguard FTSE All-Wld ex-US Idx Admiral VFWAX ΠFB QQQQ 11.4 11.4 5.2 9.2 5.2 30 30 28 15 56 2.0 18.33 (99) Avg
Vanguard FTSE All-Wld ex-US SmCp Idx Adm VFSAX „ FQ WWW 11.9 11.9 3.5 8.6 5.0 38 38 37 34 87 1.8 ()
Vanguard International Explorer Inv VINEX ´ FR Q 15.1 15.1 2.6 8.0 6.7 79 79 98 95 97 1.1 22.03 (93) +Avg
Vanguard International Growth Inv VWIGX ΠFG QQQQQ 59.6 59.6 22.3 21.6 12.3 4 4 5 4 5 0.2 21.49 (88) High
Vanguard International Value Inv VTRIX „ FV ] QQQQQ 9.0 9.0 3.9 8.4 5.1 5 5 5 3 13 1.6 20.05 (97) Avg
Vanguard Intl Div Apprec Idx Adm VIAAX „ FG QQQ 15.1 15.1 9.1 82 82 65 — — 1.3 16.09 (94) -Avg
Vanguard Total Intl Stock Index Admiral VTIAX ΠFB QQQ 11.3 11.3 5.0 9.1 5.1 30 30 34 18 57 2.1 18.6 (99) Avg
WCM Focused International Growth Inv WCMRX „ FG QQQQQ 32.4 32.4 18.2 16.8 16 16 8 9 — 0.0 16.86 (85) Avg
World Stock — 21.3 21.3 10.2 12.3 9.1 — — — — — — 20.62 (85) —
American Funds Capital World Gr&Inc A CWGIX „ WS QQQ 15.4 15.4 9.1 11.5 9.2 47 47 48 45 50 1.2 17.28 (97) -Avg
American Funds New Economy A ANEFX „ WS QQQQQ 33.5 33.5 17.4 17.3 15.0 14 14 13 10 3 0.0 18.59 (84) Avg
American Funds New Perspective A ANWPX „ WS QQQQQ 33.4 33.4 17.8 16.5 12.7 14 14 12 12 10 0.1 19.34 (91) +Avg
American Funds SMALLCAP World A SMCWX „ SW QQQQ 37.4 37.4 17.5 16.8 11.9 35 35 13 27 18 0.0 21.43 (81) Avg
Artisan Global Discovery Investor APFDX ´ WS QQQQQ 45.7 45.7 26.3 7 7 3 — — 0.0 19.05 (78) +Avg
Artisan Global Equity Investor ARTHX ´ WS QQQQQ 29.3 29.3 17.9 16.1 13.4 19 19 12 13 7 0.0 16.96 (87) -Avg
Morningstar 500 International Equity
MSCI World Index 15.9 15.9 10.5 12.2 9.9
MSCI EAFE Index 7.8 7.8 4.3 7.4 5.5
Categories
FA Foreign–Small/Mid ValueFB Foreign–Large BlendFG Foreign–Large GrowthFQ Foreign Small/Mid BlendFR Foreign–Small/Mid Growth
FV Foreign–Large ValueSC CommunicationsSF Financial SH HealthSN Natural Resources
SP Equity Precious MetalsSR Real EstateSU UtilitiesWS World Large StockSW World Small/Mid Stock
Legend
E New this month][ Increase/decrease in rating
NR No Morningstar Rating; fund less than three years old.
Red Lowest return in groupGreen Highest return in groupItalic Extended performance
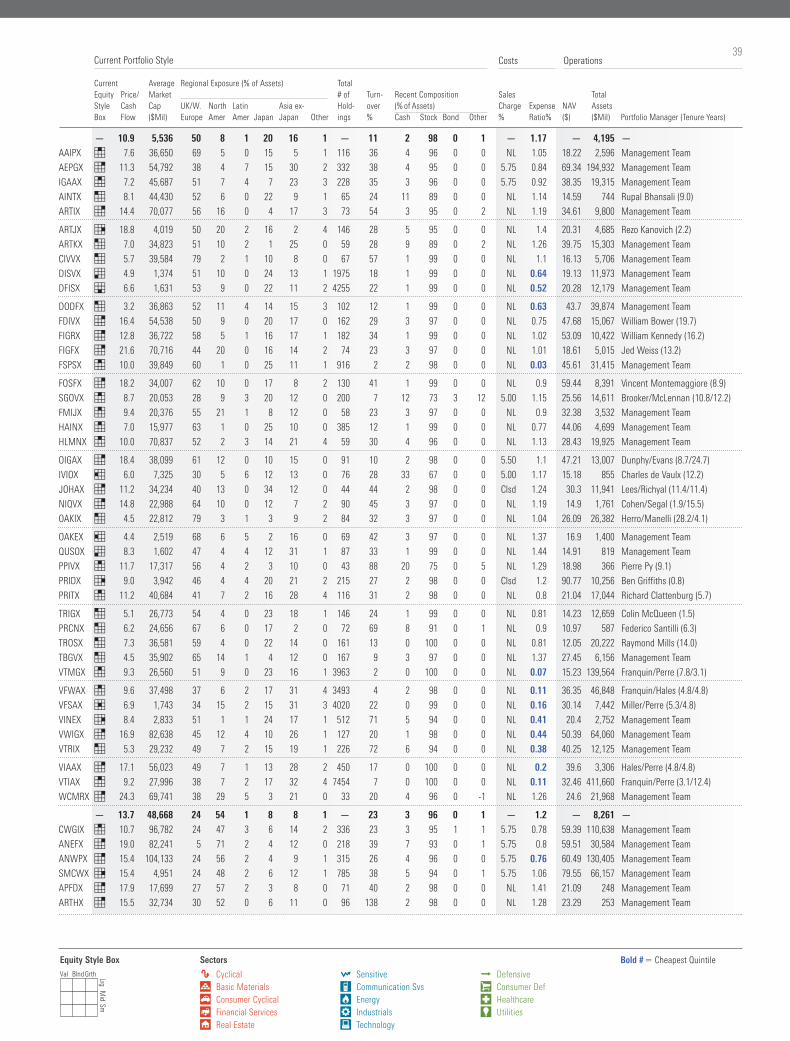
39
Current Average Regional Exposure (% of Assets) Total Equity Price/ Market # of Turn- Recent Composition Sales Total Style Cash Cap UK/W. North Latin Asia ex- Hold- over (% of Assets) Charge Expense NAV Assets Box Flow ($Mil) Europe Amer Amer Japan Japan Other ings % Cash Stock Bond Other % Ratio% ($) ($Mil) Portfolio Manager (Tenure Years)
Costs OperationsCurrent Portfolio Style
MSCI World Index 15.9 15.9 10.5 12.2 9.9
MSCI EAFE Index 7.8 7.8 4.3 7.4 5.5
— 10.9 5,536 50 8 1 20 16 1 — 11 2 98 0 1 — 1.17 — 4,195 —
AAIPX 4 7.6 36,650 69 5 0 15 5 1 116 36 4 96 0 0 NL 1.05 18.22 2,596 Management Team
AEPGX 7 11.3 54,792 38 4 7 15 30 2 332 38 4 95 0 0 5.75 0.84 69.34 194,932 Management Team
IGAAX 4 7.2 45,687 51 7 4 7 23 3 228 35 3 96 0 0 5.75 0.92 38.35 19,315 Management Team
AINTX 1 8.1 44,430 52 6 0 22 9 1 65 24 11 89 0 0 NL 1.14 14.59 744 Rupal Bhansali (9.0)
ARTIX 7 14.4 70,077 56 16 0 4 17 3 73 54 3 95 0 2 NL 1.19 34.61 9,800 Management Team
ARTJX 8 18.8 4,019 50 20 2 16 2 4 146 28 5 95 0 0 NL 1.4 20.31 4,685 Rezo Kanovich (2.2)
ARTKX 1 7.0 34,823 51 10 2 1 25 0 59 28 9 89 0 2 NL 1.26 39.75 15,303 Management Team
CIVVX 1 5.7 39,584 79 2 1 10 8 0 67 57 1 99 0 0 NL 1.1 16.13 5,706 Management Team
DISVX 3 4.9 1,374 51 10 0 24 13 1 1975 18 1 99 0 0 NL 0.64 19.13 11,973 Management Team
DFISX 6 6.6 1,631 53 9 0 22 11 2 4255 22 1 99 0 0 NL 0.52 20.28 12,179 Management Team
DODFX 1 3.2 36,863 52 11 4 14 15 3 102 12 1 99 0 0 NL 0.63 43.7 39,874 Management Team
FDIVX 7 16.4 54,538 50 9 0 20 17 0 162 29 3 97 0 0 NL 0.75 47.68 15,067 William Bower (19.7)
FIGRX 7 12.8 36,722 58 5 1 16 17 1 182 34 1 99 0 0 NL 1.02 53.09 10,422 William Kennedy (16.2)
FIGFX 7 21.6 70,716 44 20 0 16 14 2 74 23 3 97 0 0 NL 1.01 18.61 5,015 Jed Weiss (13.2)
FSPSX 4 10.0 39,849 60 1 0 25 11 1 916 2 2 98 0 0 NL 0.03 45.61 31,415 Management Team
FOSFX 7 18.2 34,007 62 10 0 17 8 2 130 41 1 99 0 0 NL 0.9 59.44 8,391 Vincent Montemaggiore (8.9)
SGOVX 4 8.7 20,053 28 9 3 20 12 0 200 7 12 73 3 12 5.00 1.15 25.56 14,611 Brooker/McLennan (10.8/12.2)
FMIJX 4 9.4 20,376 55 21 1 8 12 0 58 23 3 97 0 0 NL 0.9 32.38 3,532 Management Team
HAINX 4 7.0 15,977 63 1 0 25 10 0 385 12 1 99 0 0 NL 0.77 44.06 4,699 Management Team
HLMNX 4 10.0 70,837 52 2 3 14 21 4 59 30 4 96 0 0 NL 1.13 28.43 19,925 Management Team
OIGAX 7 18.4 38,099 61 12 0 10 15 0 91 10 2 98 0 0 5.50 1.1 47.21 13,007 Dunphy/Evans (8.7/24.7)
IVIOX 2 6.0 7,325 30 5 6 12 13 0 76 28 33 67 0 0 5.00 1.17 15.18 855 Charles de Vaulx (12.2)
JOHAX 7 11.2 34,234 40 13 0 34 12 0 44 44 2 98 0 0 Clsd 1.24 30.3 11,941 Lees/Richyal (11.4/11.4)
NIQVX 7 14.8 22,988 64 10 0 12 7 2 90 45 3 97 0 0 NL 1.19 14.9 1,761 Cohen/Segal (1.9/15.5)
OAKIX 1 4.5 22,812 79 3 1 3 9 2 84 32 3 97 0 0 NL 1.04 26.09 26,382 Herro/Manelli (28.2/4.1)
OAKEX 2 4.4 2,519 68 6 5 2 16 0 69 42 3 97 0 0 NL 1.37 16.9 1,400 Management Team
QUSOX 3 8.3 1,602 47 4 4 12 31 1 87 33 1 99 0 0 NL 1.44 14.91 819 Management Team
PPIVX 4 11.7 17,317 56 4 2 3 10 0 43 88 20 75 0 5 NL 1.29 18.98 366 Pierre Py (9.1)
PRIDX 8 9.0 3,942 46 4 4 20 21 2 215 27 2 98 0 0 Clsd 1.2 90.77 10,256 Ben Griffiths (0.8)
PRITX 4 11.2 40,684 41 7 2 16 28 4 116 31 2 98 0 0 NL 0.8 21.04 17,044 Richard Clattenburg (5.7)
TRIGX 1 5.1 26,773 54 4 0 23 18 1 146 24 1 99 0 0 NL 0.81 14.23 12,659 Colin McQueen (1.5)
PRCNX 1 6.2 24,656 67 6 0 17 2 0 72 69 8 91 0 1 NL 0.9 10.97 587 Federico Santilli (6.3)
TROSX 1 7.3 36,581 59 4 0 22 14 0 161 13 0 100 0 0 NL 0.81 12.05 20,222 Raymond Mills (14.0)
TBGVX 1 4.5 35,902 65 14 1 4 12 0 167 9 3 97 0 0 NL 1.37 27.45 6,156 Management Team
VTMGX 4 9.3 26,560 51 9 0 23 16 1 3963 2 0 100 0 0 NL 0.07 15.23 139,564 Franquin/Perre (7.8/3.1)
VFWAX 4 9.6 37,498 37 6 2 17 31 4 3493 4 2 98 0 0 NL 0.11 36.35 46,848 Franquin/Hales (4.8/4.8)
VFSAX 5 6.9 1,743 34 15 2 15 31 3 4020 22 0 99 0 0 NL 0.16 30.14 7,442 Miller/Perre (5.3/4.8)
VINEX 8 8.4 2,833 51 1 1 24 17 1 512 71 5 94 0 0 NL 0.41 20.4 2,752 Management Team
VWIGX 7 16.9 82,638 45 12 4 10 26 1 127 20 1 98 0 0 NL 0.44 50.39 64,060 Management Team
VTRIX 1 5.3 29,232 49 7 2 15 19 1 226 72 6 94 0 0 NL 0.38 40.25 12,125 Management Team
VIAAX 7 17.1 56,023 49 7 1 13 28 2 450 17 0 100 0 0 NL 0.2 39.6 3,306 Hales/Perre (4.8/4.8)
VTIAX 4 9.2 27,996 38 7 2 17 32 4 7454 7 0 100 0 0 NL 0.11 32.46 411,660 Franquin/Perre (3.1/12.4)
WCMRX 7 24.3 69,741 38 29 5 3 21 0 33 20 4 96 0 -1 NL 1.26 24.6 21,968 Management Team
— 13.7 48,668 24 54 1 8 8 1 — 23 3 96 0 1 — 1.2 — 8,261 —
CWGIX 4 10.7 96,782 24 47 3 6 14 2 336 23 3 95 1 1 5.75 0.78 59.39 110,638 Management Team
ANEFX 7 19.0 82,241 5 71 2 4 12 0 218 39 7 93 0 1 5.75 0.8 59.51 30,584 Management Team
ANWPX 7 15.4 104,133 24 56 2 4 9 1 315 26 4 96 0 0 5.75 0.76 60.49 130,405 Management Team
SMCWX 8 15.4 4,951 24 48 2 6 12 1 785 38 5 94 0 1 5.75 1.06 79.55 66,157 Management Team
APFDX 7 17.9 17,699 27 57 2 3 8 0 71 40 2 98 0 0 NL 1.41 21.09 248 Management Team
ARTHX 7 15.5 32,734 30 52 0 6 11 0 96 138 2 98 0 0 NL 1.28 23.29 253 Management Team
Bold # Cheapest QuintileEquity Style BoxVal Blnd Grth Lrg M
id Sm
Sectors
h Cyclicalr Basic Materialst Consumer Cyclicaly Financial Servicesu Real Estate
j Sensitive
i Communication Svs o Energy
p Industrials
a Technology
k Defensive
s Consumer Defd Healthcaref Utilities
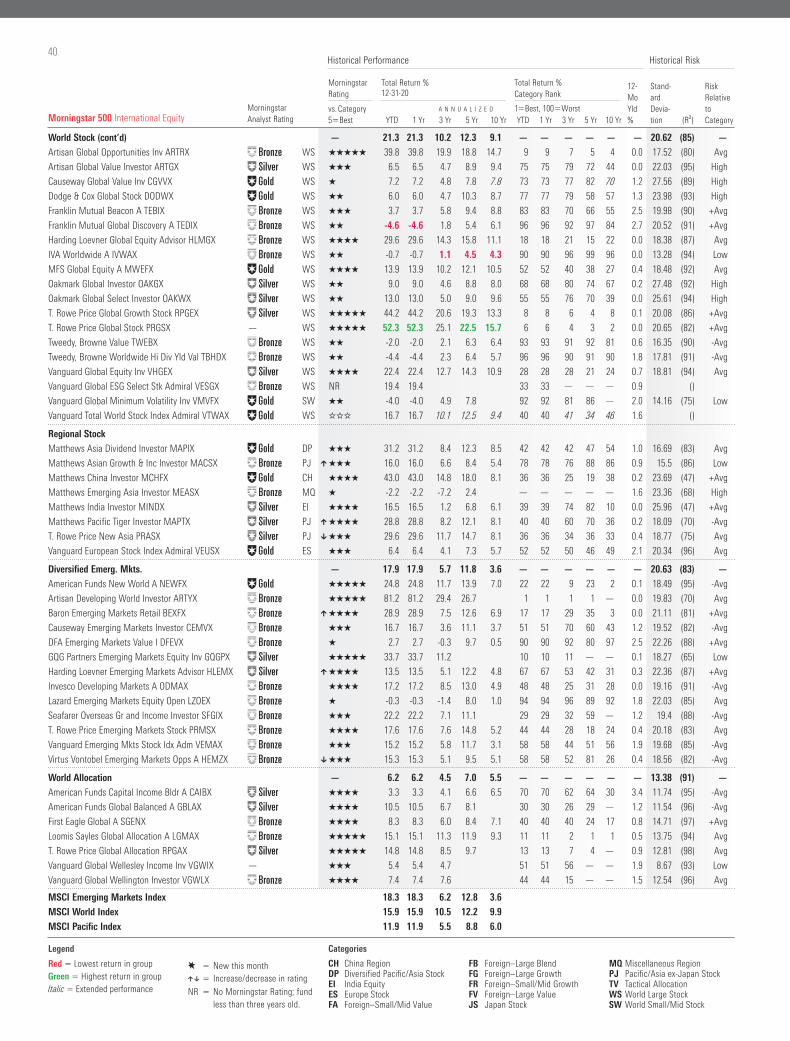
40
Morningstar Analyst Rating
Morningstar Rating
Total Return % 12-31-20
Total Return % Category Rank
12-MoYld %
Stand- ard Devia- tion (R²)
Risk Relative to Category
vs. Category5Best
A N N U A L I Z E D 1Best, 100WorstYTD 1 Yr 3 Yr 5 Yr 10 Yr YTD 1 Yr 3 Yr 5 Yr 10 Yr
Historical Performance Historical Risk
World Stock (cont’d) — 21.3 21.3 10.2 12.3 9.1 — — — — — — 20.62 (85) —
Artisan Global Opportunities Inv ARTRX ´ WS QQQQQ 39.8 39.8 19.9 18.8 14.7 9 9 7 5 4 0.0 17.52 (80) Avg
Artisan Global Value Investor ARTGX „ WS QQQ 6.5 6.5 4.7 8.9 9.4 75 75 79 72 44 0.0 22.03 (95) High
Causeway Global Value Inv CGVVX ΠWS Q 7.2 7.2 4.8 7.8 7.8 73 73 77 82 70 1.2 27.56 (89) High
Dodge & Cox Global Stock DODWX ΠWS QQ 6.0 6.0 4.7 10.3 8.7 77 77 79 58 57 1.3 23.98 (93) High
Franklin Mutual Beacon A TEBIX ´ WS QQQ 3.7 3.7 5.8 9.4 8.8 83 83 70 66 55 2.5 19.98 (90) +Avg
Franklin Mutual Global Discovery A TEDIX ´ WS QQ -4.6 -4.6 1.8 5.4 6.1 96 96 92 97 84 2.7 20.52 (91) +Avg
Harding Loevner Global Equity Advisor HLMGX ´ WS QQQQ 29.6 29.6 14.3 15.8 11.1 18 18 21 15 22 0.0 18.38 (87) Avg
IVA Worldwide A IVWAX ´ WS QQ -0.7 -0.7 1.1 4.5 4.3 90 90 96 99 96 0.0 13.28 (94) Low
MFS Global Equity A MWEFX ΠWS QQQQ 13.9 13.9 10.2 12.1 10.5 52 52 40 38 27 0.4 18.48 (92) Avg
Oakmark Global Investor OAKGX „ WS QQ 9.0 9.0 4.6 8.8 8.0 68 68 80 74 67 0.2 27.48 (92) High
Oakmark Global Select Investor OAKWX „ WS QQ 13.0 13.0 5.0 9.0 9.6 55 55 76 70 39 0.0 25.61 (94) High
T. Rowe Price Global Growth Stock RPGEX „ WS QQQQQ 44.2 44.2 20.6 19.3 13.3 8 8 6 4 8 0.1 20.08 (86) +Avg
T. Rowe Price Global Stock PRGSX — WS QQQQQ 52.3 52.3 25.1 22.5 15.7 6 6 4 3 2 0.0 20.65 (82) +Avg
Tweedy, Browne Value TWEBX ´ WS QQ -2.0 -2.0 2.1 6.3 6.4 93 93 91 92 81 0.6 16.35 (90) -Avg
Tweedy, Browne Worldwide Hi Div Yld Val TBHDX ´ WS QQ -4.4 -4.4 2.3 6.4 5.7 96 96 90 91 90 1.8 17.81 (91) -Avg
Vanguard Global Equity Inv VHGEX „ WS QQQQ 22.4 22.4 12.7 14.3 10.9 28 28 28 21 24 0.7 18.81 (94) Avg
Vanguard Global ESG Select Stk Admiral VESGX ´ WS NR 19.4 19.4 33 33 — — — 0.9 ()
Vanguard Global Minimum Volatility Inv VMVFX Œ SW QQ -4.0 -4.0 4.9 7.8 92 92 81 86 — 2.0 14.16 (75) Low
Vanguard Total World Stock Index Admiral VTWAX ΠWS WWW 16.7 16.7 10.1 12.5 9.4 40 40 41 34 46 1.6 ()
Regional Stock
Matthews Asia Dividend Investor MAPIX ΠDP QQQ 31.2 31.2 8.4 12.3 8.5 42 42 42 47 54 1.0 16.69 (83) Avg
Matthews Asian Growth & Inc Investor MACSX ´ PJ ] QQQ 16.0 16.0 6.6 8.4 5.4 78 78 76 88 86 0.9 15.5 (86) Low
Matthews China Investor MCHFX ΠCH QQQQ 43.0 43.0 14.8 18.0 8.1 36 36 25 19 38 0.2 23.69 (47) +Avg
Matthews Emerging Asia Investor MEASX ´ MQ Q -2.2 -2.2 -7.2 2.4 — — — — — 1.6 23.36 (68) High
Matthews India Investor MINDX „ EI QQQQ 16.5 16.5 1.2 6.8 6.1 39 39 74 82 10 0.0 25.96 (47) +Avg
Matthews Pacific Tiger Investor MAPTX „ PJ ] QQQQ 28.8 28.8 8.2 12.1 8.1 40 40 60 70 36 0.2 18.09 (70) -Avg
T. Rowe Price New Asia PRASX „ PJ [ QQQ 29.6 29.6 11.7 14.7 8.1 36 36 34 36 33 0.4 18.77 (75) Avg
Vanguard European Stock Index Admiral VEUSX ΠES QQQ 6.4 6.4 4.1 7.3 5.7 52 52 50 46 49 2.1 20.34 (96) Avg
Diversified Emerg. Mkts. — 17.9 17.9 5.7 11.8 3.6 — — — — — — 20.63 (83) —
American Funds New World A NEWFX ΠQQQQQ 24.8 24.8 11.7 13.9 7.0 22 22 9 23 2 0.1 18.49 (95) -Avg
Artisan Developing World Investor ARTYX ´ QQQQQ 81.2 81.2 29.4 26.7 1 1 1 1 — 0.0 19.83 (70) Avg
Baron Emerging Markets Retail BEXFX ´ ] QQQQ 28.9 28.9 7.5 12.6 6.9 17 17 29 35 3 0.0 21.11 (81) +Avg
Causeway Emerging Markets Investor CEMVX ´ QQQ 16.7 16.7 3.6 11.1 3.7 51 51 70 60 43 1.2 19.52 (82) -Avg
DFA Emerging Markets Value I DFEVX ´ Q 2.7 2.7 -0.3 9.7 0.5 90 90 92 80 97 2.5 22.26 (88) +Avg
GQG Partners Emerging Markets Equity Inv GQGPX „ QQQQQ 33.7 33.7 11.2 10 10 11 — — 0.1 18.27 (65) Low
Harding Loevner Emerging Markets Advisor HLEMX „ ] QQQQ 13.5 13.5 5.1 12.2 4.8 67 67 53 42 31 0.3 22.36 (87) +Avg
Invesco Developing Markets A ODMAX ´ QQQQ 17.2 17.2 8.5 13.0 4.9 48 48 25 31 28 0.0 19.16 (91) -Avg
Lazard Emerging Markets Equity Open LZOEX ´ Q -0.3 -0.3 -1.4 8.0 1.0 94 94 96 89 92 1.8 22.03 (85) Avg
Seafarer Overseas Gr and Income Investor SFGIX ´ QQQ 22.2 22.2 7.1 11.1 29 29 32 59 — 1.2 19.4 (88) -Avg
T. Rowe Price Emerging Markets Stock PRMSX ´ QQQQ 17.6 17.6 7.6 14.8 5.2 44 44 28 18 24 0.4 20.18 (83) Avg
Vanguard Emerging Mkts Stock Idx Adm VEMAX ´ QQQ 15.2 15.2 5.8 11.7 3.1 58 58 44 51 56 1.9 19.68 (85) -Avg
Virtus Vontobel Emerging Markets Opps A HEMZX ´ [ QQQ 15.3 15.3 5.1 9.5 5.1 58 58 52 81 26 0.4 18.56 (82) -Avg
World Allocation — 6.2 6.2 4.5 7.0 5.5 — — — — — — 13.38 (91) —
American Funds Capital Income Bldr A CAIBX „ QQQQ 3.3 3.3 4.1 6.6 6.5 70 70 62 64 30 3.4 11.74 (95) -Avg
American Funds Global Balanced A GBLAX „ QQQQ 10.5 10.5 6.7 8.1 30 30 26 29 — 1.2 11.54 (96) -Avg
First Eagle Global A SGENX ´ QQQQ 8.3 8.3 6.0 8.4 7.1 40 40 40 24 17 0.8 14.71 (97) +Avg
Loomis Sayles Global Allocation A LGMAX ´ QQQQQ 15.1 15.1 11.3 11.9 9.3 11 11 2 1 1 0.5 13.75 (94) Avg
T. Rowe Price Global Allocation RPGAX „ QQQQQ 14.8 14.8 8.5 9.7 13 13 7 4 — 0.9 12.81 (98) Avg
Vanguard Global Wellesley Income Inv VGWIX — QQQ 5.4 5.4 4.7 51 51 56 — — 1.9 8.67 (93) Low
Vanguard Global Wellington Investor VGWLX ´ QQQQ 7.4 7.4 7.6 44 44 15 — — 1.5 12.54 (96) Avg
Morningstar 500 International Equity
MSCI Emerging Markets Index 18.3 18.3 6.2 12.8 3.6
MSCI World Index 15.9 15.9 10.5 12.2 9.9
MSCI Pacific Index 11.9 11.9 5.5 8.8 6.0
Categories
CH China Region DP Diversified Pacific/Asia StockEI India Equity ES Europe Stock FA Foreign–Small/Mid Value
FB Foreign–Large BlendFG Foreign–Large GrowthFR Foreign–Small/Mid GrowthFV Foreign–Large ValueJS Japan Stock
MQ Miscellaneous Region PJ Pacific/Asia ex-Japan StockTV Tactical AllocationWS World Large StockSW World Small/Mid Stock
Legend
E New this month][ Increase/decrease in rating
NR No Morningstar Rating; fund less than three years old.
Red Lowest return in groupGreen Highest return in groupItalic Extended performance
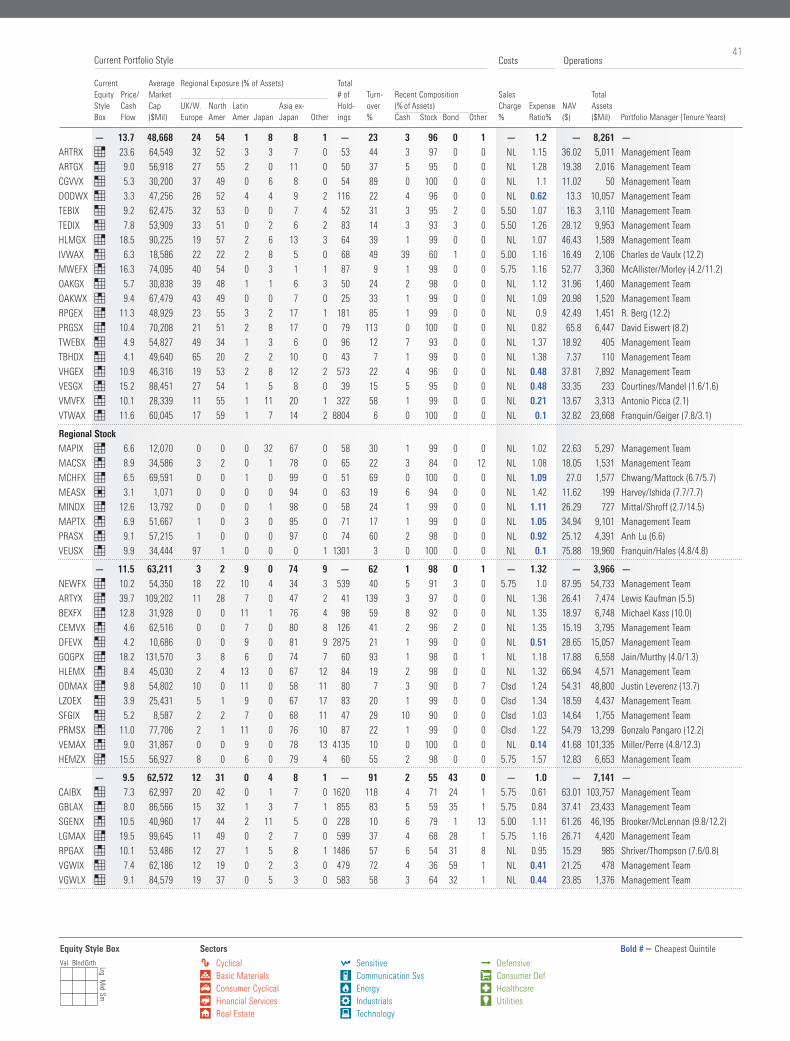
41
Current Average Regional Exposure (% of Assets) Total Equity Price/ Market # of Turn- Recent Composition Sales Total Style Cash Cap UK/W. North Latin Asia ex- Hold- over (% of Assets) Charge Expense NAV Assets Box Flow ($Mil) Europe Amer Amer Japan Japan Other ings % Cash Stock Bond Other % Ratio% ($) ($Mil) Portfolio Manager (Tenure Years)
Costs OperationsCurrent Portfolio Style
— 13.7 48,668 24 54 1 8 8 1 — 23 3 96 0 1 — 1.2 — 8,261 —
ARTRX 7 23.6 64,549 32 52 3 3 7 0 53 44 3 97 0 0 NL 1.15 36.02 5,011 Management Team
ARTGX 1 9.0 56,918 27 55 2 0 11 0 50 37 5 95 0 0 NL 1.28 19.38 2,016 Management Team
CGVVX 1 5.3 30,200 37 49 0 6 8 0 54 89 0 100 0 0 NL 1.1 11.02 50 Management Team
DODWX 1 3.3 47,256 26 52 4 4 9 2 116 22 4 96 0 0 NL 0.62 13.3 10,057 Management Team
TEBIX 1 9.2 62,475 32 53 0 0 7 4 52 31 3 95 2 0 5.50 1.07 16.3 3,110 Management Team
TEDIX 1 7.8 53,909 33 51 0 2 6 2 83 14 3 93 3 0 5.50 1.26 28.12 9,953 Management Team
HLMGX 7 18.5 90,225 19 57 2 6 13 3 64 39 1 99 0 0 NL 1.07 46.43 1,589 Management Team
IVWAX 1 6.3 18,586 22 22 2 8 5 0 68 49 39 60 1 0 5.00 1.16 16.49 2,106 Charles de Vaulx (12.2)
MWEFX 4 16.3 74,095 40 54 0 3 1 1 87 9 1 99 0 0 5.75 1.16 52.77 3,360 McAllister/Morley (4.2/11.2)
OAKGX 1 5.7 30,838 39 48 1 1 6 3 50 24 2 98 0 0 NL 1.12 31.96 1,460 Management Team
OAKWX 4 9.4 67,479 43 49 0 0 7 0 25 33 1 99 0 0 NL 1.09 20.98 1,520 Management Team
RPGEX 7 11.3 48,929 23 55 3 2 17 1 181 85 1 99 0 0 NL 0.9 42.49 1,451 R. Berg (12.2)
PRGSX 7 10.4 70,208 21 51 2 8 17 0 79 113 0 100 0 0 NL 0.82 65.8 6,447 David Eiswert (8.2)
TWEBX 1 4.9 54,827 49 34 1 3 6 0 96 12 7 93 0 0 NL 1.37 18.92 405 Management Team
TBHDX 1 4.1 49,640 65 20 2 2 10 0 43 7 1 99 0 0 NL 1.38 7.37 110 Management Team
VHGEX 4 10.9 46,316 19 53 2 8 12 2 573 22 4 96 0 0 NL 0.48 37.81 7,892 Management Team
VESGX 4 15.2 88,451 27 54 1 5 8 0 39 15 5 95 0 0 NL 0.48 33.35 233 Courtines/Mandel (1.6/1.6)
VMVFX 4 10.1 28,339 11 55 1 11 20 1 322 58 1 99 0 0 NL 0.21 13.67 3,313 Antonio Picca (2.1)
VTWAX 4 11.6 60,045 17 59 1 7 14 2 8804 6 0 100 0 0 NL 0.1 32.82 23,668 Franquin/Geiger (7.8/3.1)
Regional Stock
MAPIX 7 6.6 12,070 0 0 0 32 67 0 58 30 1 99 0 0 NL 1.02 22.63 5,297 Management Team
MACSX 4 8.9 34,586 3 2 0 1 78 0 65 22 3 84 0 12 NL 1.08 18.05 1,531 Management Team
MCHFX 7 6.5 69,591 0 0 1 0 99 0 51 69 0 100 0 0 NL 1.09 27.0 1,577 Chwang/Mattock (6.7/5.7)
MEASX 5 3.1 1,071 0 0 0 0 94 0 63 19 6 94 0 0 NL 1.42 11.62 199 Harvey/Ishida (7.7/7.7)
MINDX 7 12.6 13,792 0 0 0 1 98 0 58 24 1 99 0 0 NL 1.11 26.29 727 Mittal/Shroff (2.7/14.5)
MAPTX 4 6.9 51,667 1 0 3 0 95 0 71 17 1 99 0 0 NL 1.05 34.94 9,101 Management Team
PRASX 4 9.1 57,215 1 0 0 0 97 0 74 60 2 98 0 0 NL 0.92 25.12 4,391 Anh Lu (6.6)
VEUSX 4 9.9 34,444 97 1 0 0 0 1 1301 3 0 100 0 0 NL 0.1 75.88 19,960 Franquin/Hales (4.8/4.8)
— 11.5 63,211 3 2 9 0 74 9 — 62 1 98 0 1 — 1.32 — 3,966 —
NEWFX 7 10.2 54,350 18 22 10 4 34 3 539 40 5 91 3 0 5.75 1.0 87.95 54,733 Management Team
ARTYX 7 39.7 109,202 11 28 7 0 47 2 41 139 3 97 0 0 NL 1.36 26.41 7,474 Lewis Kaufman (5.5)
BEXFX 7 12.8 31,928 0 0 11 1 76 4 98 59 8 92 0 0 NL 1.35 18.97 6,748 Michael Kass (10.0)
CEMVX 4 4.6 62,516 0 0 7 0 80 8 126 41 2 96 2 0 NL 1.35 15.19 3,795 Management Team
DFEVX 1 4.2 10,686 0 0 9 0 81 9 2875 21 1 99 0 0 NL 0.51 28.65 15,057 Management Team
GQGPX 7 18.2 131,570 3 8 6 0 74 7 60 93 1 98 0 1 NL 1.18 17.88 6,558 Jain/Murthy (4.0/1.3)
HLEMX 4 8.4 45,030 2 4 13 0 67 12 84 19 2 98 0 0 NL 1.32 66.94 4,571 Management Team
ODMAX 7 9.8 54,802 10 0 11 0 58 11 80 7 3 90 0 7 Clsd 1.24 54.31 48,800 Justin Leverenz (13.7)
LZOEX 1 3.9 25,431 5 1 9 0 67 17 83 20 1 99 0 0 Clsd 1.34 18.59 4,437 Management Team
SFGIX 1 5.2 8,587 2 2 7 0 68 11 47 29 10 90 0 0 Clsd 1.03 14.64 1,755 Management Team
PRMSX 4 11.0 77,706 2 1 11 0 76 10 87 22 1 99 0 0 Clsd 1.22 54.79 13,299 Gonzalo Pangaro (12.2)
VEMAX 4 9.0 31,867 0 0 9 0 78 13 4135 10 0 100 0 0 NL 0.14 41.68 101,335 Miller/Perre (4.8/12.3)
HEMZX 7 15.5 56,927 8 0 6 0 79 4 60 55 2 98 0 0 5.75 1.57 12.83 6,653 Management Team
— 9.5 62,572 12 31 0 4 8 1 — 91 2 55 43 0 — 1.0 — 7,141 —
CAIBX 1 7.3 62,997 20 42 0 1 7 0 1620 118 4 71 24 1 5.75 0.61 63.01 103,757 Management Team
GBLAX 4 8.0 86,566 15 32 1 3 7 1 855 83 5 59 35 1 5.75 0.84 37.41 23,433 Management Team
SGENX 4 10.5 40,960 17 44 2 11 5 0 228 10 6 79 1 13 5.00 1.11 61.26 46,195 Brooker/McLennan (9.8/12.2)
LGMAX 7 19.5 99,645 11 49 0 2 7 0 599 37 4 68 28 1 5.75 1.16 26.71 4,420 Management Team
RPGAX 4 10.1 53,486 12 27 1 5 8 1 1486 57 6 54 31 8 NL 0.95 15.29 985 Shriver/Thompson (7.6/0.8)
VGWIX 1 7.4 62,186 12 19 0 2 3 0 479 72 4 36 59 1 NL 0.41 21.25 478 Management Team
VGWLX 1 9.1 84,579 19 37 0 5 3 0 583 58 3 64 32 1 NL 0.44 23.85 1,376 Management Team
Bold # Cheapest QuintileEquity Style BoxVal Blnd Grth Lrg M
id Sm
Sectors
h Cyclicalr Basic Materialst Consumer Cyclicaly Financial Servicesu Real Estate
j Sensitive
i Communication Svs o Energy
p Industrials
a Technology
k Defensive
s Consumer Defd Healthcaref Utilities
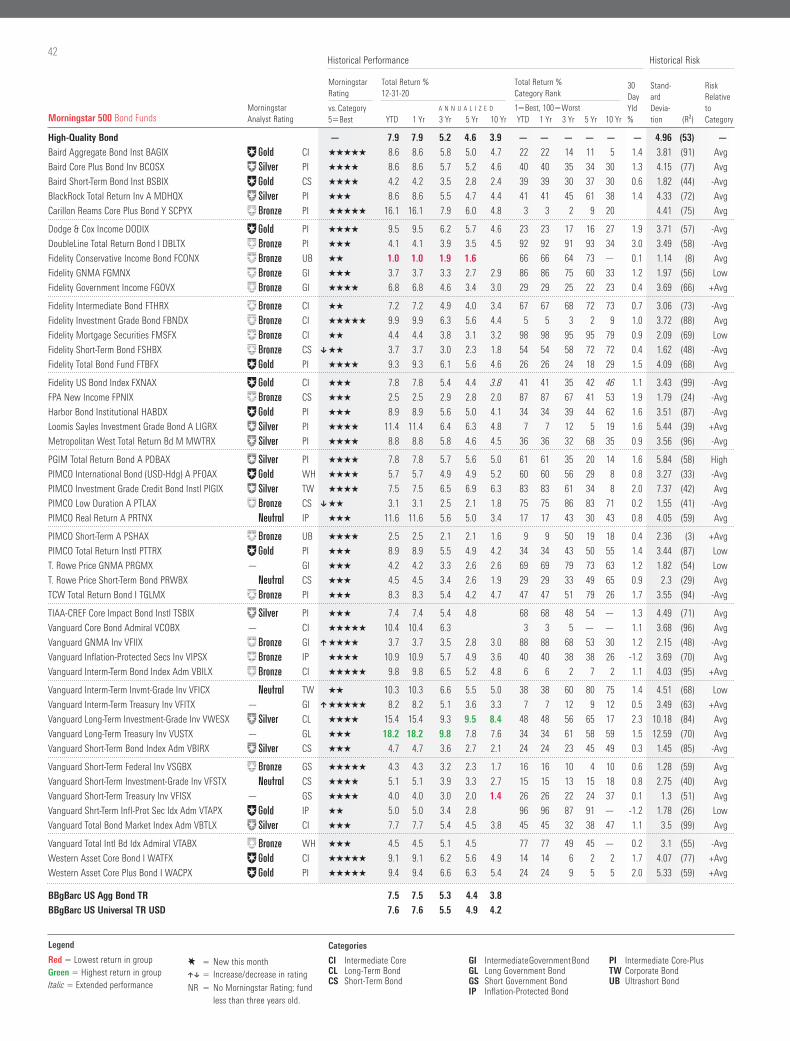
42
Morningstar Analyst Rating
Morningstar Rating
Total Return % 12-31-20
Total Return % Category Rank
30DayYld %
Stand- ard Devia- tion (R²)
Risk Relative to Category
vs. Category5Best
A N N U A L I Z E D 1Best, 100WorstYTD 1 Yr 3 Yr 5 Yr 10 Yr YTD 1 Yr 3 Yr 5 Yr 10 Yr
Historical Performance Historical Risk
Morningstar 500 Bond Funds
High-Quality Bond — 7.9 7.9 5.2 4.6 3.9 — — — — — — 4.96 (53) —
Baird Aggregate Bond Inst BAGIX ΠCI QQQQQ 8.6 8.6 5.8 5.0 4.7 22 22 14 11 5 1.4 3.81 (91) Avg
Baird Core Plus Bond Inv BCOSX „ PI QQQQ 8.6 8.6 5.7 5.2 4.6 40 40 35 34 30 1.3 4.15 (77) Avg
Baird Short-Term Bond Inst BSBIX ΠCS QQQQ 4.2 4.2 3.5 2.8 2.4 39 39 30 37 30 0.6 1.82 (44) -Avg
BlackRock Total Return Inv A MDHQX „ PI QQQ 8.6 8.6 5.5 4.7 4.4 41 41 45 61 38 1.4 4.33 (72) Avg
Carillon Reams Core Plus Bond Y SCPYX ´ PI QQQQQ 16.1 16.1 7.9 6.0 4.8 3 3 2 9 20 4.41 (75) Avg
Dodge & Cox Income DODIX ΠPI QQQQ 9.5 9.5 6.2 5.7 4.6 23 23 17 16 27 1.9 3.71 (57) -Avg
DoubleLine Total Return Bond I DBLTX ´ PI QQQ 4.1 4.1 3.9 3.5 4.5 92 92 91 93 34 3.0 3.49 (58) -Avg
Fidelity Conservative Income Bond FCONX ´ UB QQ 1.0 1.0 1.9 1.6 66 66 64 73 — 0.1 1.14 (8) Avg
Fidelity GNMA FGMNX ´ GI QQQ 3.7 3.7 3.3 2.7 2.9 86 86 75 60 33 1.2 1.97 (56) Low
Fidelity Government Income FGOVX ´ GI QQQQ 6.8 6.8 4.6 3.4 3.0 29 29 25 22 23 0.4 3.69 (66) +Avg
Fidelity Intermediate Bond FTHRX ´ CI QQ 7.2 7.2 4.9 4.0 3.4 67 67 68 72 73 0.7 3.06 (73) -Avg
Fidelity Investment Grade Bond FBNDX ´ CI QQQQQ 9.9 9.9 6.3 5.6 4.4 5 5 3 2 9 1.0 3.72 (88) Avg
Fidelity Mortgage Securities FMSFX ´ CI QQ 4.4 4.4 3.8 3.1 3.2 98 98 95 95 79 0.9 2.09 (69) Low
Fidelity Short-Term Bond FSHBX ´ CS [ QQ 3.7 3.7 3.0 2.3 1.8 54 54 58 72 72 0.4 1.62 (48) -Avg
Fidelity Total Bond Fund FTBFX ΠPI QQQQ 9.3 9.3 6.1 5.6 4.6 26 26 24 18 29 1.5 4.09 (68) Avg
Fidelity US Bond Index FXNAX ΠCI QQQ 7.8 7.8 5.4 4.4 3.8 41 41 35 42 46 1.1 3.43 (99) -Avg
FPA New Income FPNIX ´ CS QQQ 2.5 2.5 2.9 2.8 2.0 87 87 67 41 53 1.9 1.79 (24) -Avg
Harbor Bond Institutional HABDX ΠPI QQQ 8.9 8.9 5.6 5.0 4.1 34 34 39 44 62 1.6 3.51 (87) -Avg
Loomis Sayles Investment Grade Bond A LIGRX „ PI QQQQ 11.4 11.4 6.4 6.3 4.8 7 7 12 5 19 1.6 5.44 (39) +Avg
Metropolitan West Total Return Bd M MWTRX „ PI QQQQ 8.8 8.8 5.8 4.6 4.5 36 36 32 68 35 0.9 3.56 (96) -Avg
PGIM Total Return Bond A PDBAX „ PI QQQQ 7.8 7.8 5.7 5.6 5.0 61 61 35 20 14 1.6 5.84 (58) High
PIMCO International Bond (USD-Hdg) A PFOAX ΠWH QQQQ 5.7 5.7 4.9 4.9 5.2 60 60 56 29 8 0.8 3.27 (33) -Avg
PIMCO Investment Grade Credit Bond Instl PIGIX „ TW QQQQ 7.5 7.5 6.5 6.9 6.3 83 83 61 34 8 2.0 7.37 (42) Avg
PIMCO Low Duration A PTLAX ´ CS [ QQ 3.1 3.1 2.5 2.1 1.8 75 75 86 83 71 0.2 1.55 (41) -Avg
PIMCO Real Return A PRTNX ˇ IP QQQ 11.6 11.6 5.6 5.0 3.4 17 17 43 30 43 0.8 4.05 (59) Avg
PIMCO Short-Term A PSHAX ´ UB QQQQ 2.5 2.5 2.1 2.1 1.6 9 9 50 19 18 0.4 2.36 (3) +Avg
PIMCO Total Return Instl PTTRX ΠPI QQQ 8.9 8.9 5.5 4.9 4.2 34 34 43 50 55 1.4 3.44 (87) Low
T. Rowe Price GNMA PRGMX — GI QQQ 4.2 4.2 3.3 2.6 2.6 69 69 79 73 63 1.2 1.82 (54) Low
T. Rowe Price Short-Term Bond PRWBX ˇ CS QQQ 4.5 4.5 3.4 2.6 1.9 29 29 33 49 65 0.9 2.3 (29) Avg
TCW Total Return Bond I TGLMX ´ PI QQQ 8.3 8.3 5.4 4.2 4.7 47 47 51 79 26 1.7 3.55 (94) -Avg
TIAA-CREF Core Impact Bond Instl TSBIX „ PI QQQ 7.4 7.4 5.4 4.8 68 68 48 54 — 1.3 4.49 (71) Avg
Vanguard Core Bond Admiral VCOBX — CI QQQQQ 10.4 10.4 6.3 3 3 5 — — 1.1 3.68 (96) Avg
Vanguard GNMA Inv VFIIX ´ GI ] QQQQ 3.7 3.7 3.5 2.8 3.0 88 88 68 53 30 1.2 2.15 (48) -Avg
Vanguard Inflation-Protected Secs Inv VIPSX ´ IP QQQQ 10.9 10.9 5.7 4.9 3.6 40 40 38 38 26 -1.2 3.69 (70) Avg
Vanguard Interm-Term Bond Index Adm VBILX ´ CI QQQQQ 9.8 9.8 6.5 5.2 4.8 6 6 2 7 2 1.1 4.03 (95) +Avg
Vanguard Interm-Term Invmt-Grade Inv VFICX ˇ TW QQ 10.3 10.3 6.6 5.5 5.0 38 38 60 80 75 1.4 4.51 (68) Low
Vanguard Interm-Term Treasury Inv VFITX — GI ] QQQQQ 8.2 8.2 5.1 3.6 3.3 7 7 12 9 12 0.5 3.49 (63) +Avg
Vanguard Long-Term Investment-Grade Inv VWESX „ CL QQQQ 15.4 15.4 9.3 9.5 8.4 48 48 56 65 17 2.3 10.18 (84) Avg
Vanguard Long-Term Treasury Inv VUSTX — GL QQQ 18.2 18.2 9.8 7.8 7.6 34 34 61 58 59 1.5 12.59 (70) Avg
Vanguard Short-Term Bond Index Adm VBIRX „ CS QQQ 4.7 4.7 3.6 2.7 2.1 24 24 23 45 49 0.3 1.45 (85) -Avg
Vanguard Short-Term Federal Inv VSGBX ´ GS QQQQQ 4.3 4.3 3.2 2.3 1.7 16 16 10 4 10 0.6 1.28 (59) Avg
Vanguard Short-Term Investment-Grade Inv VFSTX ˇ CS QQQQ 5.1 5.1 3.9 3.3 2.7 15 15 13 15 18 0.8 2.75 (40) Avg
Vanguard Short-Term Treasury Inv VFISX — GS QQQQ 4.0 4.0 3.0 2.0 1.4 26 26 22 24 37 0.1 1.3 (51) Avg
Vanguard Shrt-Term Infl-Prot Sec Idx Adm VTAPX Œ IP QQ 5.0 5.0 3.4 2.8 96 96 87 91 — -1.2 1.78 (26) Low
Vanguard Total Bond Market Index Adm VBTLX „ CI QQQ 7.7 7.7 5.4 4.5 3.8 45 45 32 38 47 1.1 3.5 (99) Avg
Vanguard Total Intl Bd Idx Admiral VTABX ´ WH QQQ 4.5 4.5 5.1 4.5 77 77 49 45 — 0.2 3.1 (55) -Avg
Western Asset Core Bond I WATFX ΠCI QQQQQ 9.1 9.1 6.2 5.6 4.9 14 14 6 2 2 1.7 4.07 (77) +Avg
Western Asset Core Plus Bond I WACPX ΠPI QQQQQ 9.4 9.4 6.6 6.3 5.4 24 24 9 5 5 2.0 5.33 (59) +Avg
BBgBarc US Agg Bond TR 7.5 7.5 5.3 4.4 3.8
BBgBarc US Universal TR USD 7.6 7.6 5.5 4.9 4.2
Categories
CI Intermediate Core CL Long-Term Bond CS Short-Term Bond
GI Intermediate Government BondGL Long Government BondGS Short Government BondIP Inflation-Protected Bond
PI Intermediate Core-PlusTW Corporate Bond UB Ultrashort Bond
Legend
E New this month][ Increase/decrease in rating
NR No Morningstar Rating; fund less than three years old.
Red Lowest return in groupGreen Highest return in groupItalic Extended performance
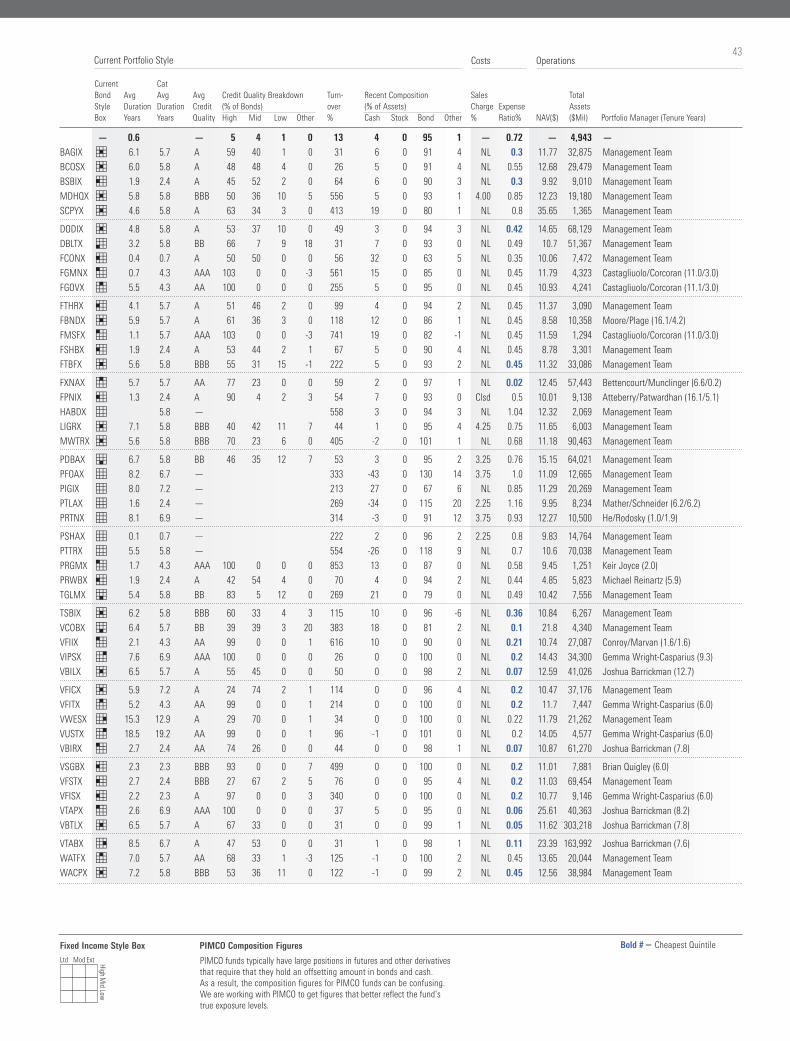
43
Current Cat Bond Avg Avg Avg Credit Quality Breakdown Turn- Recent Composition Sales TotalStyle Duration Duration Credit (% of Bonds) over (% of Assets) Charge Expense AssetsBox Years Years Quality High Mid Low Other % Cash Stock Bond Other % Ratio% NAV($) ($Mil) Portfolio Manager (Tenure Years)
Costs OperationsCurrent Portfolio Style
BBgBarc US Agg Bond TR 7.5 7.5 5.3 4.4 3.8
BBgBarc US Universal TR USD 7.6 7.6 5.5 4.9 4.2
— 0.6 — 5 4 1 0 13 4 0 95 1 — 0.72 — 4,943 —
BAGIX 5 6.1 5.7 A 59 40 1 0 31 6 0 91 4 NL 0.3 11.77 32,875 Management Team
BCOSX 5 6.0 5.8 A 48 48 4 0 26 5 0 91 4 NL 0.55 12.68 29,479 Management Team
BSBIX 2 1.9 2.4 A 45 52 2 0 64 6 0 90 3 NL 0.3 9.92 9,010 Management Team
MDHQX 5 5.8 5.8 BBB 50 36 10 5 556 5 0 93 1 4.00 0.85 12.23 19,180 Management Team
SCPYX 5 4.6 5.8 A 63 34 3 0 413 19 0 80 1 NL 0.8 35.65 1,365 Management Team
DODIX 5 4.8 5.8 A 53 37 10 0 49 3 0 94 3 NL 0.42 14.65 68,129 Management Team
DBLTX 3 3.2 5.8 BB 66 7 9 18 31 7 0 93 0 NL 0.49 10.7 51,367 Management Team
FCONX 2 0.4 0.7 A 50 50 0 0 56 32 0 63 5 NL 0.35 10.06 7,472 Management Team
FGMNX 1 0.7 4.3 AAA 103 0 0 -3 561 15 0 85 0 NL 0.45 11.79 4,323 Castagliuolo/Corcoran (11.0/3.0)
FGOVX 4 5.5 4.3 AA 100 0 0 0 255 5 0 95 0 NL 0.45 10.93 4,241 Castagliuolo/Corcoran (11.1/3.0)
FTHRX 2 4.1 5.7 A 51 46 2 0 99 4 0 94 2 NL 0.45 11.37 3,090 Management Team
FBNDX 5 5.9 5.7 A 61 36 3 0 118 12 0 86 1 NL 0.45 8.58 10,358 Moore/Plage (16.1/4.2)
FMSFX 1 1.1 5.7 AAA 103 0 0 -3 741 19 0 82 -1 NL 0.45 11.59 1,294 Castagliuolo/Corcoran (11.0/3.0)
FSHBX 2 1.9 2.4 A 53 44 2 1 67 5 0 90 4 NL 0.45 8.78 3,301 Management Team
FTBFX 5 5.6 5.8 BBB 55 31 15 -1 222 5 0 93 2 NL 0.45 11.32 33,086 Management Team
FXNAX 4 5.7 5.7 AA 77 23 0 0 59 2 0 97 1 NL 0.02 12.45 57,443 Bettencourt/Munclinger (6.6/0.2)
FPNIX 2 1.3 2.4 A 90 4 2 3 54 7 0 93 0 Clsd 0.5 10.01 9,138 Atteberry/Patwardhan (16.1/5.1)
HABDX 0 5.8 — 558 3 0 94 3 NL 1.04 12.32 2,069 Management Team
LIGRX 5 7.1 5.8 BBB 40 42 11 7 44 1 0 95 4 4.25 0.75 11.65 6,003 Management Team
MWTRX 5 5.6 5.8 BBB 70 23 6 0 405 -2 0 101 1 NL 0.68 11.18 90,463 Management Team
PDBAX 6 6.7 5.8 BB 46 35 12 7 53 3 0 95 2 3.25 0.76 15.15 64,021 Management Team
PFOAX 0 8.2 6.7 — 333 -43 0 130 14 3.75 1.0 11.09 12,665 Management Team
PIGIX 0 8.0 7.2 — 213 27 0 67 6 NL 0.85 11.29 20,269 Management Team
PTLAX 0 1.6 2.4 — 269 -34 0 115 20 2.25 1.16 9.95 8,234 Mather/Schneider (6.2/6.2)
PRTNX 0 8.1 6.9 — 314 -3 0 91 12 3.75 0.93 12.27 10,500 He/Rodosky (1.0/1.9)
PSHAX 0 0.1 0.7 — 222 2 0 96 2 2.25 0.8 9.83 14,764 Management Team
PTTRX 0 5.5 5.8 — 554 -26 0 118 9 NL 0.7 10.6 70,038 Management Team
PRGMX 1 1.7 4.3 AAA 100 0 0 0 853 13 0 87 0 NL 0.58 9.45 1,251 Keir Joyce (2.0)
PRWBX 2 1.9 2.4 A 42 54 4 0 70 4 0 94 2 NL 0.44 4.85 5,823 Michael Reinartz (5.9)
TGLMX 6 5.4 5.8 BB 83 5 12 0 269 21 0 79 0 NL 0.49 10.42 7,556 Management Team
TSBIX 5 6.2 5.8 BBB 60 33 4 3 115 10 0 96 -6 NL 0.36 10.84 6,267 Management Team
VCOBX 6 6.4 5.7 BB 39 39 3 20 383 18 0 81 2 NL 0.1 21.8 4,340 Management Team
VFIIX 1 2.1 4.3 AA 99 0 0 1 616 10 0 90 0 NL 0.21 10.74 27,087 Conroy/Marvan (1.6/1.6)
VIPSX 7 7.6 6.9 AAA 100 0 0 0 26 0 0 100 0 NL 0.2 14.43 34,300 Gemma Wright-Casparius (9.3)
VBILX 5 6.5 5.7 A 55 45 0 0 50 0 0 98 2 NL 0.07 12.59 41,026 Joshua Barrickman (12.7)
VFICX 5 5.9 7.2 A 24 74 2 1 114 0 0 96 4 NL 0.2 10.47 37,176 Management Team
VFITX 4 5.2 4.3 AA 99 0 0 1 214 0 0 100 0 NL 0.2 11.7 7,447 Gemma Wright-Casparius (6.0)
VWESX 8 15.3 12.9 A 29 70 0 1 34 0 0 100 0 NL 0.22 11.79 21,262 Management Team
VUSTX 7 18.5 19.2 AA 99 0 0 1 96 -1 0 101 0 NL 0.2 14.05 4,577 Gemma Wright-Casparius (6.0)
VBIRX 1 2.7 2.4 AA 74 26 0 0 44 0 0 98 1 NL 0.07 10.87 61,270 Joshua Barrickman (7.8)
VSGBX 2 2.3 2.3 BBB 93 0 0 7 499 0 0 100 0 NL 0.2 11.01 7,881 Brian Quigley (6.0)
VFSTX 2 2.7 2.4 BBB 27 67 2 5 76 0 0 95 4 NL 0.2 11.03 69,454 Management Team
VFISX 2 2.2 2.3 A 97 0 0 3 340 0 0 100 0 NL 0.2 10.77 9,146 Gemma Wright-Casparius (6.0)
VTAPX 1 2.6 6.9 AAA 100 0 0 0 37 5 0 95 0 NL 0.06 25.61 40,363 Joshua Barrickman (8.2)
VBTLX 5 6.5 5.7 A 67 33 0 0 31 0 0 99 1 NL 0.05 11.62 303,218 Joshua Barrickman (7.8)
VTABX 8 8.5 6.7 A 47 53 0 0 31 1 0 98 1 NL 0.11 23.39 163,992 Joshua Barrickman (7.6)
WATFX 4 7.0 5.7 AA 68 33 1 -3 125 -1 0 100 2 NL 0.45 13.65 20,044 Management Team
WACPX 5 7.2 5.8 BBB 53 36 11 0 122 -1 0 99 2 NL 0.45 12.56 38,984 Management Team
PIMCO funds typically have large positions in futures and other derivatives that require that they hold an offsetting amount in bonds and cash. As a result, the composition figures for PIMCO funds can be confusing. We are working with PIMCO to get figures that better reflect the fund’s true exposure levels.
PIMCO Composition FiguresFixed Income Style BoxLtd Mod Ext High M
id Low
Bold # Cheapest Quintile
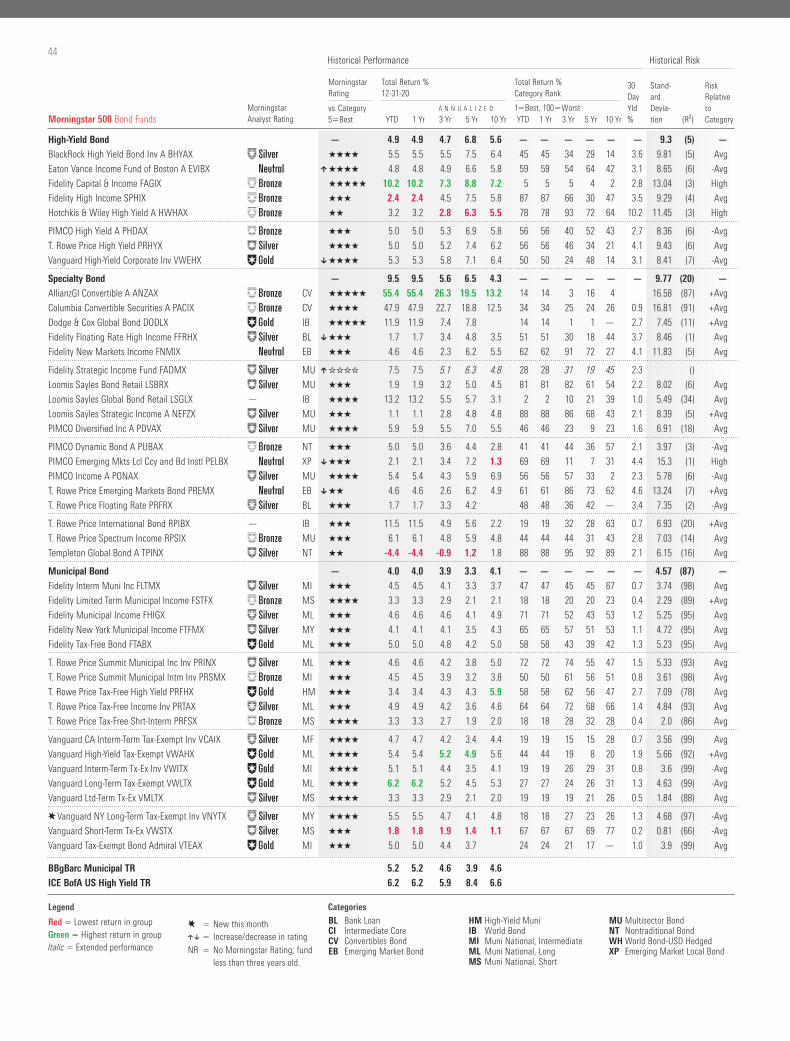
44
Morningstar Analyst Rating
Morningstar Rating
Total Return % 12-31-20
Total Return % Category Rank
30DayYld %
Stand- ard Devia- tion (R²)
Risk Relative to Category
vs. Category5Best
A N N U A L I Z E D 1Best, 100WorstYTD 1 Yr 3 Yr 5 Yr 10 Yr YTD 1 Yr 3 Yr 5 Yr 10 Yr
Historical Performance Historical Risk
High-Yield Bond — 4.9 4.9 4.7 6.8 5.6 — — — — — — 9.3 (5) —
BlackRock High Yield Bond Inv A BHYAX „ QQQQ 5.5 5.5 5.5 7.5 6.4 45 45 34 29 14 3.6 9.81 (5) Avg
Eaton Vance Income Fund of Boston A EVIBX ˇ ] QQQQ 4.8 4.8 4.9 6.6 5.8 59 59 54 64 42 3.1 8.65 (6) -Avg
Fidelity Capital & Income FAGIX ´ QQQQQ 10.2 10.2 7.3 8.8 7.2 5 5 5 4 2 2.8 13.04 (3) High
Fidelity High Income SPHIX ´ QQQ 2.4 2.4 4.5 7.5 5.8 87 87 66 30 47 3.5 9.29 (4) Avg
Hotchkis & Wiley High Yield A HWHAX ´ QQ 3.2 3.2 2.8 6.3 5.5 78 78 93 72 64 10.2 11.45 (3) High
PIMCO High Yield A PHDAX ´ QQQ 5.0 5.0 5.3 6.9 5.8 56 56 40 52 43 2.7 8.36 (6) -Avg
T. Rowe Price High Yield PRHYX „ QQQQ 5.0 5.0 5.2 7.4 6.2 56 56 46 34 21 4.1 9.43 (6) Avg
Vanguard High-Yield Corporate Inv VWEHX Π[ QQQQ 5.3 5.3 5.8 7.1 6.4 50 50 24 48 14 3.1 8.41 (7) -Avg
Specialty Bond — 9.5 9.5 5.6 6.5 4.3 — — — — — — 9.77 (20) —
AllianzGI Convertible A ANZAX ´ CV QQQQQ 55.4 55.4 26.3 19.5 13.2 14 14 3 16 4 16.58 (87) +Avg
Columbia Convertible Securities A PACIX ´ CV QQQQ 47.9 47.9 22.7 18.8 12.5 34 34 25 24 26 0.9 16.81 (91) +Avg
Dodge & Cox Global Bond DODLX Œ IB QQQQQ 11.9 11.9 7.4 7.8 14 14 1 1 — 2.7 7.45 (11) +Avg
Fidelity Floating Rate High Income FFRHX „ BL [ QQQ 1.7 1.7 3.4 4.8 3.5 51 51 30 18 44 3.7 8.46 (1) Avg
Fidelity New Markets Income FNMIX ˇ EB QQQ 4.6 4.6 2.3 6.2 5.5 62 62 91 72 27 4.1 11.83 (5) Avg
Fidelity Strategic Income Fund FADMX „ MU ] WWWW 7.5 7.5 5.1 6.3 4.8 28 28 31 19 45 2.3 ()
Loomis Sayles Bond Retail LSBRX „ MU QQQ 1.9 1.9 3.2 5.0 4.5 81 81 82 61 54 2.2 8.02 (6) Avg
Loomis Sayles Global Bond Retail LSGLX — IB QQQQ 13.2 13.2 5.5 5.7 3.1 2 2 10 21 39 1.0 5.49 (34) Avg
Loomis Sayles Strategic Income A NEFZX „ MU QQQ 1.1 1.1 2.8 4.8 4.8 88 88 86 68 43 2.1 8.39 (5) +Avg
PIMCO Diversified Inc A PDVAX „ MU QQQQ 5.9 5.9 5.5 7.0 5.5 46 46 23 9 23 1.6 6.91 (18) Avg
PIMCO Dynamic Bond A PUBAX ´ NT QQQ 5.0 5.0 3.6 4.4 2.8 41 41 44 36 57 2.1 3.97 (3) -Avg
PIMCO Emerging Mkts Lcl Ccy and Bd Instl PELBX ˇ XP [ QQQ 2.1 2.1 3.4 7.2 1.3 69 69 11 7 31 4.4 15.3 (1) High
PIMCO Income A PONAX „ MU QQQQ 5.4 5.4 4.3 5.9 6.9 56 56 57 33 2 2.3 5.78 (6) -Avg
T. Rowe Price Emerging Markets Bond PREMX ˇ EB [ QQ 4.6 4.6 2.6 6.2 4.9 61 61 86 73 62 4.6 13.24 (7) +Avg
T. Rowe Price Floating Rate PRFRX „ BL QQQ 1.7 1.7 3.3 4.2 48 48 36 42 — 3.4 7.35 (2) -Avg
T. Rowe Price International Bond RPIBX — IB QQQ 11.5 11.5 4.9 5.6 2.2 19 19 32 28 63 0.7 6.93 (20) +Avg
T. Rowe Price Spectrum Income RPSIX ´ MU QQQ 6.1 6.1 4.8 5.9 4.8 44 44 44 31 43 2.8 7.03 (14) Avg
Templeton Global Bond A TPINX „ NT QQ -4.4 -4.4 -0.9 1.2 1.8 88 88 95 92 89 2.1 6.15 (16) Avg
Municipal Bond — 4.0 4.0 3.9 3.3 4.1 — — — — — — 4.57 (87) —
Fidelity Interm Muni Inc FLTMX „ MI QQQ 4.5 4.5 4.1 3.3 3.7 47 47 45 45 67 0.7 3.74 (98) Avg
Fidelity Limited Term Municipal Income FSTFX ´ MS QQQQ 3.3 3.3 2.9 2.1 2.1 18 18 20 20 23 0.4 2.29 (89) +Avg
Fidelity Municipal Income FHIGX „ ML QQQ 4.6 4.6 4.6 4.1 4.9 71 71 52 43 53 1.2 5.25 (95) Avg
Fidelity New York Municipal Income FTFMX „ MY QQQ 4.1 4.1 4.1 3.5 4.3 65 65 57 51 53 1.1 4.72 (95) Avg
Fidelity Tax-Free Bond FTABX ΠML QQQ 5.0 5.0 4.8 4.2 5.0 58 58 43 39 42 1.3 5.23 (95) Avg
T. Rowe Price Summit Municipal Inc Inv PRINX „ ML QQQ 4.6 4.6 4.2 3.8 5.0 72 72 74 55 47 1.5 5.33 (93) Avg
T. Rowe Price Summit Municipal Intm Inv PRSMX ´ MI QQQ 4.5 4.5 3.9 3.2 3.8 50 50 61 56 51 0.8 3.61 (98) Avg
T. Rowe Price Tax-Free High Yield PRFHX ΠHM QQQ 3.4 3.4 4.3 4.3 5.9 58 58 62 56 47 2.7 7.09 (78) Avg
T. Rowe Price Tax-Free Income Inv PRTAX „ ML QQQ 4.9 4.9 4.2 3.6 4.6 64 64 72 68 66 1.4 4.84 (93) Avg
T. Rowe Price Tax-Free Shrt-Interm PRFSX ´ MS QQQQ 3.3 3.3 2.7 1.9 2.0 18 18 28 32 28 0.4 2.0 (86) Avg
Vanguard CA Interm-Term Tax-Exempt Inv VCAIX „ MF QQQQ 4.7 4.7 4.2 3.4 4.4 19 19 15 15 28 0.7 3.56 (99) Avg
Vanguard High-Yield Tax-Exempt VWAHX ΠML QQQQ 5.4 5.4 5.2 4.9 5.6 44 44 19 8 20 1.9 5.66 (92) +Avg
Vanguard Interm-Term Tx-Ex Inv VWITX ΠMI QQQQ 5.1 5.1 4.4 3.5 4.1 19 19 26 29 31 0.8 3.6 (99) -Avg
Vanguard Long-Term Tax-Exempt VWLTX ΠML QQQQ 6.2 6.2 5.2 4.5 5.3 27 27 24 26 31 1.3 4.63 (99) -Avg
Vanguard Ltd-Term Tx-Ex VMLTX „ MS QQQQ 3.3 3.3 2.9 2.1 2.0 19 19 19 21 26 0.5 1.84 (88) Avg
EVanguard NY Long-Term Tax-Exempt Inv VNYTX „ MY QQQQ 5.5 5.5 4.7 4.1 4.8 18 18 27 23 26 1.3 4.68 (97) -Avg
Vanguard Short-Term Tx-Ex VWSTX „ MS QQQ 1.8 1.8 1.9 1.4 1.1 67 67 67 69 77 0.2 0.81 (66) -Avg
Vanguard Tax-Exempt Bond Admiral VTEAX Œ MI QQQ 5.0 5.0 4.4 3.7 24 24 21 17 — 1.0 3.9 (99) Avg
Morningstar 500 Bond Funds
BBgBarc Municipal TR 5.2 5.2 4.6 3.9 4.6
ICE BofA US High Yield TR 6.2 6.2 5.9 8.4 6.6
CategoriesBL Bank LoanCI Intermediate Core CV Convertibles BondEB Emerging Market Bond
HM High-Yield MuniIB World BondMI Muni National, IntermediateML Muni National, LongMS Muni National, Short
MU Multisector Bond NT Nontraditional BondWH World Bond-USD Hedged XP Emerging Market Local Bond
Legend
E New this month][ Increase/decrease in rating
NR No Morningstar Rating; fund less than three years old.
Red Lowest return in groupGreen Highest return in groupItalic Extended performance
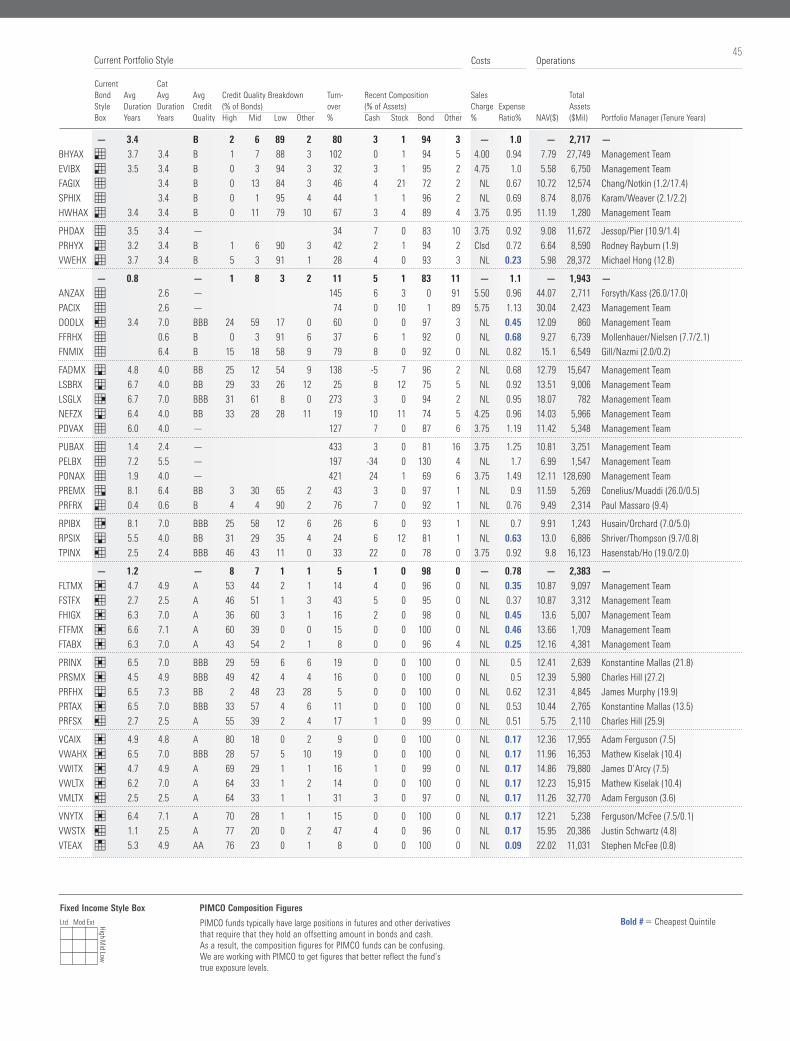
45
Current Cat Bond Avg Avg Avg Credit Quality Breakdown Turn- Recent Composition Sales TotalStyle Duration Duration Credit (% of Bonds) over (% of Assets) Charge Expense AssetsBox Years Years Quality High Mid Low Other % Cash Stock Bond Other % Ratio% NAV($) ($Mil) Portfolio Manager (Tenure Years)
Costs OperationsCurrent Portfolio Style
— 3.4 B 2 6 89 2 80 3 1 94 3 — 1.0 — 2,717 —
BHYAX 3 3.7 3.4 B 1 7 88 3 102 0 1 94 5 4.00 0.94 7.79 27,749 Management Team
EVIBX 3 3.5 3.4 B 0 3 94 3 32 3 1 95 2 4.75 1.0 5.58 6,750 Management Team
FAGIX 0 3.4 B 0 13 84 3 46 4 21 72 2 NL 0.67 10.72 12,574 Chang/Notkin (1.2/17.4)
SPHIX 0 3.4 B 0 1 95 4 44 1 1 96 2 NL 0.69 8.74 8,076 Karam/Weaver (2.1/2.2)
HWHAX 3 3.4 3.4 B 0 11 79 10 67 3 4 89 4 3.75 0.95 11.19 1,280 Management Team
PHDAX 0 3.5 3.4 — 34 7 0 83 10 3.75 0.92 9.08 11,672 Jessop/Pier (10.9/1.4)
PRHYX 3 3.2 3.4 B 1 6 90 3 42 2 1 94 2 Clsd 0.72 6.64 8,590 Rodney Rayburn (1.9)
VWEHX 3 3.7 3.4 B 5 3 91 1 28 4 0 93 3 NL 0.23 5.98 28,372 Michael Hong (12.8)
— 0.8 — 1 8 3 2 11 5 1 83 11 — 1.1 — 1,943 —
ANZAX 0 2.6 — 145 6 3 0 91 5.50 0.96 44.07 2,711 Forsyth/Kass (26.0/17.0)
PACIX 0 2.6 — 74 0 10 1 89 5.75 1.13 30.04 2,423 Management Team
DODLX 2 3.4 7.0 BBB 24 59 17 0 60 0 0 97 3 NL 0.45 12.09 860 Management Team
FFRHX 0 0.6 B 0 3 91 6 37 6 1 92 0 NL 0.68 9.27 6,739 Mollenhauer/Nielsen (7.7/2.1)
FNMIX 0 6.4 B 15 18 58 9 79 8 0 92 0 NL 0.82 15.1 6,549 Gill/Nazmi (2.0/0.2)
FADMX 6 4.8 4.0 BB 25 12 54 9 138 -5 7 96 2 NL 0.68 12.79 15,647 Management Team
LSBRX 6 6.7 4.0 BB 29 33 26 12 25 8 12 75 5 NL 0.92 13.51 9,006 Management Team
LSGLX 8 6.7 7.0 BBB 31 61 8 0 273 3 0 94 2 NL 0.95 18.07 782 Management Team
NEFZX 6 6.4 4.0 BB 33 28 28 11 19 10 11 74 5 4.25 0.96 14.03 5,966 Management Team
PDVAX 0 6.0 4.0 — 127 7 0 87 6 3.75 1.19 11.42 5,348 Management Team
PUBAX 0 1.4 2.4 — 433 3 0 81 16 3.75 1.25 10.81 3,251 Management Team
PELBX 0 7.2 5.5 — 197 -34 0 130 4 NL 1.7 6.99 1,547 Management Team
PONAX 0 1.9 4.0 — 421 24 1 69 6 3.75 1.49 12.11 128,690 Management Team
PREMX 9 8.1 6.4 BB 3 30 65 2 43 3 0 97 1 NL 0.9 11.59 5,269 Conelius/Muaddi (26.0/0.5)
PRFRX 3 0.4 0.6 B 4 4 90 2 76 7 0 92 1 NL 0.76 9.49 2,314 Paul Massaro (9.4)
RPIBX 8 8.1 7.0 BBB 25 58 12 6 26 6 0 93 1 NL 0.7 9.91 1,243 Husain/Orchard (7.0/5.0)
RPSIX 6 5.5 4.0 BB 31 29 35 4 24 6 12 81 1 NL 0.63 13.0 6,886 Shriver/Thompson (9.7/0.8)
TPINX 2 2.5 2.4 BBB 46 43 11 0 33 22 0 78 0 3.75 0.92 9.8 16,123 Hasenstab/Ho (19.0/2.0)
— 1.2 — 8 7 1 1 5 1 0 98 0 — 0.78 — 2,383 —
FLTMX 5 4.7 4.9 A 53 44 2 1 14 4 0 96 0 NL 0.35 10.87 9,097 Management Team
FSTFX 2 2.7 2.5 A 46 51 1 3 43 5 0 95 0 NL 0.37 10.87 3,312 Management Team
FHIGX 5 6.3 7.0 A 36 60 3 1 16 2 0 98 0 NL 0.45 13.6 5,007 Management Team
FTFMX 5 6.6 7.1 A 60 39 0 0 15 0 0 100 0 NL 0.46 13.66 1,709 Management Team
FTABX 5 6.3 7.0 A 43 54 2 1 8 0 0 96 4 NL 0.25 12.16 4,381 Management Team
PRINX 5 6.5 7.0 BBB 29 59 6 6 19 0 0 100 0 NL 0.5 12.41 2,639 Konstantine Mallas (21.8)
PRSMX 5 4.5 4.9 BBB 49 42 4 4 16 0 0 100 0 NL 0.5 12.39 5,980 Charles Hill (27.2)
PRFHX 6 6.5 7.3 BB 2 48 23 28 5 0 0 100 0 NL 0.62 12.31 4,845 James Murphy (19.9)
PRTAX 5 6.5 7.0 BBB 33 57 4 6 11 0 0 100 0 NL 0.53 10.44 2,765 Konstantine Mallas (13.5)
PRFSX 2 2.7 2.5 A 55 39 2 4 17 1 0 99 0 NL 0.51 5.75 2,110 Charles Hill (25.9)
VCAIX 5 4.9 4.8 A 80 18 0 2 9 0 0 100 0 NL 0.17 12.36 17,955 Adam Ferguson (7.5)
VWAHX 5 6.5 7.0 BBB 28 57 5 10 19 0 0 100 0 NL 0.17 11.96 16,353 Mathew Kiselak (10.4)
VWITX 5 4.7 4.9 A 69 29 1 1 16 1 0 99 0 NL 0.17 14.86 79,880 James D’Arcy (7.5)
VWLTX 5 6.2 7.0 A 64 33 1 2 14 0 0 100 0 NL 0.17 12.23 15,915 Mathew Kiselak (10.4)
VMLTX 2 2.5 2.5 A 64 33 1 1 31 3 0 97 0 NL 0.17 11.26 32,770 Adam Ferguson (3.6)
VNYTX 5 6.4 7.1 A 70 28 1 1 15 0 0 100 0 NL 0.17 12.21 5,238 Ferguson/McFee (7.5/0.1)
VWSTX 2 1.1 2.5 A 77 20 0 2 47 4 0 96 0 NL 0.17 15.95 20,386 Justin Schwartz (4.8)
VTEAX 4 5.3 4.9 AA 76 23 0 1 8 0 0 100 0 NL 0.09 22.02 11,031 Stephen McFee (0.8)
BBgBarc Municipal TR 5.2 5.2 4.6 3.9 4.6
ICE BofA US High Yield TR 6.2 6.2 5.9 8.4 6.6
PIMCO funds typically have large positions in futures and other derivatives that require that they hold an offsetting amount in bonds and cash. As a result, the composition figures for PIMCO funds can be confusing. We are working with PIMCO to get figures that better reflect the fund’s true exposure levels.
PIMCO Composition FiguresFixed Income Style BoxLtd Mod Ext High M
id Low
Bold # Cheapest Quintile
46
AMG Funds 548-4539 AMG River Road Dividend All Cap Value ARDEX 28 AMG River Road Small Cap Value N ARSVX 32 AMG Yacktman Focused N YAFFX 28 AMG Yacktman I YACKX 28Aberdeen US Small Cap Eq 866-667-9231 GSXAX 32Akre Focus Retail 877-862-9556 AKREX 24Alger 992-3863 Alger Capital Appreciation A ACAAX 24 Alger Small Cap Focus A AOFAX 32Allianz Global Investors 988-8380 AllianzGI Convertible A ANZAX 44 AllianzGI Small-Cap Value A PCVAX 34 AllianzGI Technology Institutional DRGTX 36Amana 888-732-6262 Amana Growth Investor AMAGX 24 Amana Income Investor AMANX 24American Beacon 658-5811 American Beacon International Eq Inv AAIPX 38 American Beacon Large Cap Value Inv AAGPX 28 American Beacon Small Cp Val Inv AVPAX 34American Century Investments 345-2021 American Century Equity Income Inv TWEIX 28 American Century Growth Inv TWCGX 24 American Century Heritage Inv TWHIX 28 American Century Large Company Value ALVIX 28 American Century Mid Cap Value Inv ACMVX 30 American Century Select Inv TWCIX 24 American Century Small Cap Value Inv ASVIX 34 American Century Ultra Inv TWCUX 24 American Century Value Inv TWVLX 28American Funds 421-4225 American Funds 2020 Trgt Date Retire A AACTX 34 American Funds AMCAP A AMCPX 24 American Funds American Balanced A ABALX 34 American Funds American Mutual A AMRMX 28 American Funds Capital Income Bldr A CAIBX 40 American Funds Capital World Gr&Inc A CWGIX 38 American Funds Europacific Growth A AEPGX 38 American Funds Fundamental Invs A ANCFX 24 American Funds Global Balanced A GBLAX 40 American Funds Growth Fund of Amer AGTHX 24 American Funds Income Fund of Amer AMECX 34 American Funds Intl Gr and Inc A IGAAX 38 American Funds Invmt Co of Amer A AIVSX 24 American Funds New Economy A ANEFX 38 American Funds New Perspective A ANWPX 38 American Funds New World A NEWFX 40 American Funds SMALLCAP World A SMCWX 38 American Funds Washington Mutual A AWSHX 24Arbitrage R 295-4485 ARBFX 34Ariel Investments 292-7435 Ariel Appreciation Investor CAAPX 30 Ariel Fund Investor ARGFX 30 Ariel International Investor AINTX 38Artisan 344-1770 Artisan Developing World Investor ARTYX 40 Artisan Global Discovery Investor APFDX 38 Artisan Global Equity Investor ARTHX 38 Artisan Global Opportunities Inv ARTRX 40 Artisan Global Value Investor ARTGX 40 Artisan International Investor ARTIX 38 Artisan International Small-Mid Investor ARTJX 38 Artisan International Value Investor ARTKX 38 Artisan Mid Cap Investor ARTMX 28 Artisan Mid Cap Value Investor ARTQX 30 Artisan Small Cap Investor ARTSX 32 Artisan Value Investor ARTLX 28
BNY Mellon 373-9387 BNY Mellon Appreciation Investor DGAGX 24 BNY Mellon Dynamic Value Fund A DAGVX 28 BNY Mellon Global Real Return - A DRRAX 34Baird 866-442-2473 Baird Aggregate Bond Inst BAGIX 42 Baird Core Plus Bond Inv BCOSX 42 Baird MidCap Inst BMDIX 28 Baird Short-Term Bond Inst BSBIX 42Baron Capital Group 992-2766 Baron Asset Retail BARAX 30 Baron Discovery Retail BDFFX 32 Baron Emerging Markets Retail BEXFX 40 Baron Growth Retail BGRFX 30 Baron Small Cap Retail BSCFX 32Becker Value Equity Retail 551-3998 BVEFX 28BlackRock 441-7762 BlackRock Advantage Small Cap Gr Inv CSGEX 32 BlackRock Equity Dividend Inv A MDDVX 28 BlackRock High Yield Bond Inv A BHYAX 44 BlackRock Mid-Cap Growth Equity Inv BMGAX 30 BlackRock Multi-Asset Income Investor BAICX 34 BlackRock Technology Opportunities Inv BGSAX 36 BlackRock Total Return Inv A MDHQX 42Boston Partners 888-261-4073 Boston Partners All Cap Value Inv BPAVX 28 Boston Partners Long/Short Rsrch Inv BPRRX 34Brown Advisory Sustainable Gr 540-6807 BIAWX 24Brown Capital Mgmt Sm Co 877-892-4226 BCSIX 32Buffalo Discovery 492-8332 BUFTX 30
Calamos Market Neutral Inc 582-6959 CVSIX 34Calvert Equity A 368-2745 CSIEX 24Carillon Family of Funds 421-4184 Carillon Eagle Mid Cap Growth Y HRAYX 30 Carillon Reams Core Plus Bond Y SCPYX 42Causeway 866-947-7000 Causeway Emerging Markets Investor CEMVX 40 Causeway Global Value Inv CGVVX 40 Causeway International Value Inv CIVVX 38Champlain Funds 866-773-3238 Champlain Mid Cap Adv CIPMX 30 Champlain Small Company Adv CIPSX 32Clipper 432-2504 CFIMX 26Cohen & Steers Realty Shares L 437-9912 CSRSX 36Columbia Threadneedle 345-6611 Columbia Acorn Inst ACRNX 30 Columbia Convertible Securities A PACIX 44 Columbia Dividend Income A LBSAX 28 Columbia Large Cap Enhanced Core A NMIAX 26 Columbia Small Cap Value II A COVAX 34Conestoga Capital Advisors 494-2755 Conestoga SMid Cap Investors CCSMX 30 Conestoga Small Cap Investors CCASX 32
Davis Funds 279-0279 Davis Financial A RPFGX 36 Davis NY Venture A NYVTX 26Diamond Hill Funds 888-226-5595 Diamond Hill Large Cap A DHLAX 28 Diamond Hill Mid Cap A DHPAX 30 Diamond Hill Small Cap A DHSCX 34 Diamond Hill Small-Mid Cap A DHMAX 30Dimensional Fund Advisors 888-576-1167 DFA Emerging Markets Value I DFEVX 40 DFA International Small Cap Value I DISVX 38 DFA International Small Company I DFISX 38 DFA Real Estate Securities I DFREX 36 DFA US Core Equity 2 I DFQTX 26 DFA US Large Cap Value I DFLVX 28 DFA US Micro Cap I DFSCX 32 DFA US Small Cap I DFSTX 32 DFA US Small Cap Value I DFSVX 34 DFA US Targeted Value I DFFVX 34Dodge & Cox 621-3979 Dodge & Cox Balanced DODBX 34 Dodge & Cox Global Bond DODLX 44 Dodge & Cox Global Stock DODWX 40 Dodge & Cox Income DODIX 42 Dodge & Cox International Stock DODFX 38 Dodge & Cox Stock DODGX 28DoubleLine Total Return Bd I 877-354-6311 DBLTX 42
Eaton Vance Inc Fund of Boston 262-1122 EVIBX 44Eventide Gilead N 877-771-3836 ETGLX 30
FMI Funds 811-5311 FMI Common Stock Investor FMIMX 30 FMI International Investor FMIJX 38 FMI Large Cap Investor FMIHX 26FPA 982-4372 FPA Crescent FPACX 34 FPA New Income FPNIX 42Fidelity Investments 835-5092 Fidelity 500 Index FXAIX 26 Fidelity Asset Manager 20% FASIX 34 Fidelity Balanced FBALX 34 Fidelity Blue Chip Growth FBGRX 24 Fidelity Capital & Income FAGIX 44 Fidelity Capital Appreciation FDCAX 24 Fidelity Conservative Income Bond FCONX 42 Fidelity Contrafund FCNTX 24 Fidelity Diversified International FDIVX 38 Fidelity Equity Dividend Income FEQTX 28 Fidelity Equity-Income FEQIX 28 Fidelity Extended Market Index FSMAX 30 Fidelity Floating Rate High Income FFRHX 44 Fidelity Focused Stock FTQGX 24 Fidelity Four-in-One Index FFNOX 34 Fidelity Freedom 2035 FFTHX 34 Fidelity GNMA FGMNX 42 Fidelity Government Income FGOVX 42 Fidelity Growth & Income FGRIX 26 Fidelity Growth Company FDGRX 24 Fidelity Growth Discovery FDSVX 24 Fidelity High Income SPHIX 44 Fidelity Independence FDFFX 24 Fidelity Interm Muni Inc FLTMX 44 Fidelity Intermediate Bond FTHRX 42 Fidelity International Discovery FIGRX 38 Fidelity International Growth FIGFX 38 Fidelity International Index FSPSX 38 Fidelity Investment Grade Bond FBNDX 42 Fidelity Large Cap Stock FLCSX 26 Fidelity Leveraged Company Stock FLVCX 30 Fidelity Limited Term Municipal Income FSTFX 44 Fidelity Low-Priced Stock FLPSX 30 Fidelity Magellan FMAGX 24 Fidelity Mid-Cap Stock FMCSX 30 Fidelity Mortgage Securities FMSFX 42 Fidelity Municipal Income FHIGX 44 Fidelity New Markets Income FNMIX 44 Fidelity New Millennium FMILX 26 Fidelity New York Municipal Income FTFMX 44 Fidelity OTC FOCPX 24 Fidelity Overseas FOSFX 38 Fidelity Puritan FPURX 34 Fidelity Real Estate Income FRIFX 36 Fidelity Real Estate Investment Port FRESX 36 Fidelity Select Health Care FSPHX 36 Fidelity Select Technology FSPTX 36 Fidelity Short-Term Bond FSHBX 42 Fidelity Small Cap Discovery FSCRX 32 Fidelity Small Cap Growth FCPGX 32 Fidelity Small Cap Stock FSLCX 32 Fidelity Small Cap Value FCPVX 34 Fidelity Stock Selector Small Cap FDSCX 32
Fidelity Strategic Income Fund FADMX 44 Fidelity Tax-Free Bond FTABX 44 Fidelity Total Bond Fund FTBFX 42 Fidelity Total Market Index FSKAX 26 Fidelity U.S. Sustainability Index FITLX 26 Fidelity US Bond Index FXNAX 42 Fidelity Value FDVLX 30 Fidelity Value Discovery FVDFX 28 Fidelity ZERO Extended Market Index FZIPX 30 Fidelity ZERO Large Cap Index FNILX 26 Fidelity ZERO Total Market Index FZROX 26First Eagle 334-2143 First Eagle Global A SGENX 40 First Eagle Overseas A SGOVX 38 First Eagle US Value A FEVAX 34Franklin Templeton Investments 877-721-1926 ClearBridge Aggressive Growth A SHRAX 24 ClearBridge Appreciation A SHAPX 26 ClearBridge Large Cap Growth A SBLGX 24 ClearBridge Large Cap Value A SINAX 28 ClearBridge Mid Cap A SBMAX 30 Franklin Income A1 FKINX 34 Franklin Mutual Beacon A TEBIX 40 Franklin Mutual Global Discovery A TEDIX 40 Franklin Mutual Shares A TESIX 34 Franklin Utilities A1 FKUTX 36 Royce Opportunity Invmt RYPNX 34 Royce Pennsylvania Mutual Invmt PENNX 32 Royce Premier Invmt RYPRX 32 Royce Special Equity Invmt RYSEX 34 Royce Total Return Invmt RYTRX 32 Templeton Global Bond A TPINX 44 Western Asset Core Bond I WATFX 42 Western Asset Core Plus Bond I WACPX 42
GQG Partners Emrg Mkts Eq 866-362-8333 GQGPX 40
Harbor 422-1050 Harbor Bond Institutional HABDX 42 Harbor Capital Appreciation Instl HACAX 24 Harbor International Institutional HAINX 38 Harbor Mid Cap Value Investor HIMVX 30 Harbor Small Cap Growth Inv HISGX 32 Harbor Small Cap Value Instl HASCX 32 Harbor Strategic Growth Institutional MVSGX 24Harding Loevner 877-435-8105 Harding Loevner Emerging Markets Ad HLEMX 40 Harding Loevner Global Equity Advisor HLMGX 40 Harding Loevner International Eq Inv HLMNX 38Hartford Mutual Funds 888-843-7824 Hartford Healthcare A HGHAX 36 Hartford MidCap A HFMCX 30Hennessy Focus Investor 966-4354 HFCSX 30Hotchkis & Wiley 866-493-8637 Hotchkis & Wiley High Yield A HWHAX 44 Hotchkis & Wiley Mid-Cap Value A HWMAX 30 Hotchkis & Wiley Value Opps A HWAAX 34
IVA Funds 866-941-4482 IVA International A IVIOX 38 IVA Worldwide A IVWAX 40Invesco 959-4246 Invesco Comstock A ACSTX 28 Invesco Developing Markets A ODMAX 40 Invesco Diversified Dividend A LCEAX 28 Invesco Oppenheimer International Gr A OIGAX 38
JOHCM Int’l Select II 866-260-9549 JOHAX 38JPMorgan 480-4111 JPMorgan Equity Income A OIEIX 28 JPMorgan Hedged Equity A JHQAX 34 JPMorgan Income Builder A JNBAX 34 JPMorgan US Equity A JUEAX 26 JPMorgan US Value A VGRIX 28 JPMorgan Value Advantage A JVAAX 28Jackson Square SMID-Cap 844-577-3863 JSMVX 30
Area code is 800 unless otherwise indicated
47Morningstar FundInvestor January 2021
Janus Henderson 877-335-2687 Janus Henderson Balanced T JABAX 34 Janus Henderson Enterprise T JAENX 30 Janus Henderson Forty T JACTX 24 Janus Henderson Glb Tech and Innovt T JAGTX 36 Janus Henderson Growth And Income T JAGIX 26 Janus Henderson Mid Cap Value T JMCVX 30 Janus Henderson Research T JAMRX 24 Janus Henderson Small Cap Value T JSCVX 34 Janus Henderson Triton T JATTX 32 Janus Henderson Venture T JAVTX 32Jensen Quality Growth J 992-4144 JENSX 24John Hancock 225-5291 JHancock Disciplined Value A JVLAX 28 JHancock Multi-Asset Absolute Return JHAAX 34
LSV Fund 888-386-3578 LSV Small Cap Value Investor LVAQX 34 LSV Value Equity Investor LVAEX 28Laudus US Large Cap Growth 877-824-5615 LGILX 24Lazard 823-6300 Lazard Emerging Markets Equity Open LZOEX 40 Lazard Global Listed Infrastructure Open GLFOX 36 Lazard US Equity Concentrated Open LEVOX 26Longleaf Partners 445-9469 Longleaf Partners LLPFX 28 Longleaf Partners Small-Cap LLSCX 30Loomis Sayles Funds 633-3330 Loomis Sayles Bond Retail LSBRX 44 Loomis Sayles Global Bond Retail LSGLX 44 Loomis Sayles Small Cap Growth Retail LCGRX 32
MFS 225-2606 MFS Aggressive Growth Allocation MAAGX 34 MFS Global Equity A MWEFX 40 MFS Growth A MFEGX 24 MFS Mid Cap Growth A OTCAX 30 MFS Moderate Allocation A MAMAX 34 MFS New Discovery A MNDAX 32 MFS Research A MFRFX 26 MFS Technology A MTCAX 36 MFS Total Return A MSFRX 36 MFS Value A MEIAX 28Mairs & Power 304-7404 Mairs & Power Balanced Inv MAPOX 34 Mairs & Power Growth Inv MPGFX 26 Mairs & Power Small Cap MSCFX 32Matthews Asia Funds 789-2742 Matthews Asia Dividend Investor MAPIX 40 Matthews Asian Growth & Inc Investor MACSX 40 Matthews China Investor MCHFX 40 Matthews Emerging Asia Investor MEASX 40 Matthews India Investor MINDX 40 Matthews Pacific Tiger Investor MAPTX 40Merger Investor 343-8959 MERFX 34Meridian 446-6662 Meridian Contrarian Legacy MVALX 30 Meridian Growth Legacy MERDX 32 Meridian Small Cap Growth Investor MISGX 32Metropolitan West Tot Ret Bd 241-4671 MWTRX 42Morgan Stanley Inst Growth A 548-7786 MSEGX 24
Natixis Funds 225-5478 Gateway A GATEX 34 Loomis Sayles Global Allocation A LGMAX 40 Loomis Sayles Investment Grade Bond A LIGRX 42 Loomis Sayles Strategic Income A NEFZX 44Neuberger Berman 877-628-2583 Neuberger Berman Equity Income A NBHAX 28 Neuberger Berman Genesis Inv NBGNX 32 Neuberger Berman International Eq Inv NIQVX 38 Neuberger Berman Intrinsic Value A NINAX 32 Neuberger Berman Multi-Cap Opp A NMUAX 26 Neuberger Berman Sustainable Eq A NRAAX 26
Oakmark 625-6275 Oakmark Equity And Income Investor OAKBX 36 Oakmark Global Investor OAKGX 40 Oakmark Global Select Investor OAKWX 40 Oakmark International Investor OAKIX 38 Oakmark International Small Cap Inv OAKEX 38 Oakmark Investor OAKMX 26 Oakmark Select Investor OAKLX 26
PGIM Total Return Bond A 225-1852 PDBAX 42PIMCO 888-877-4626 PIMCO All Asset A PASAX 36 PIMCO All Asset All Authority A PAUAX 36 PIMCO Commodity Real Ret Strat A PCRAX 36 PIMCO Diversified Inc A PDVAX 44 PIMCO Dynamic Bond A PUBAX 44 PIMCO Emerging Mkts Lcl Ccy and Bd PELBX 44 PIMCO High Yield A PHDAX 44 PIMCO Income A PONAX 44 PIMCO International Bond (USD-Hdg) A PFOAX 42 PIMCO Invstmnt Grade Credit Bond Instl PIGIX 42 PIMCO Low Duration A PTLAX 42 PIMCO Real Return A PRTNX 42 PIMCO Short-Term A PSHAX 42 PIMCO StocksPLUS A PSPAX 26 PIMCO Total Return Instl PTTRX 42PRIMECAP Odyssey Funds 729-2307 PRIMECAP Odyssey Aggressive Growth POAGX 30 PRIMECAP Odyssey Growth POGRX 24 PRIMECAP Odyssey Stock POSKX 26Parnassus 999-3505 Parnassus Core Equity Investor PRBLX 26 Parnassus Endeavor Investor PARWX 26 Parnassus Mid Cap Growth Investor PARNX 30 Parnassus Mid-Cap PARMX 30Pear Tree Polaris F Val Sm Cp Or 326-2151 QUSOX 38Phaeacian Accent Int’l Val Ins 982-4372 PPIVX 38Polen Growth Investor 888-678-6024 POLRX 24Principal Funds 222-5852 Principal Equity Income A PQIAX 28 Principal LargeCap Growth I A PLGAX 24 Principal Small-MidCap Dividend Inc A PMDAX 32
Schwab Funds 877-824-5615 Schwab Fundamental US Lg Company Idx SFLNX 28 Schwab S&P 500 Index SWPPX 26 Schwab Total Stock Market Index SWTSX 26Seafarer Overseas Gr & Inc 855-732-9220 SFGIX 40Selected American Shares D 243-1575 SLADX 26Sequoia 686-6884 SEQUX 24Sound Shore Investor 551-1980 SSHFX 28
T. Rowe Price 638-5660 T. Rowe Price Balanced RPBAX 36 T. Rowe Price Blue Chip Growth TRBCX 24 T. Rowe Price Capital Appreciation PRWCX 36 T. Rowe Price Comm & Tech Investor PRMTX 36 T. Rowe Price Dividend Growth PRDGX 26 T. Rowe Price Emerging Markets Bond PREMX 44 T. Rowe Price Emerging Markets Stock PRMSX 40 T. Rowe Price Equity Income PRFDX 28 T. Rowe Price Floating Rate PRFRX 44 T. Rowe Price GNMA PRGMX 42 T. Rowe Price Global Allocation RPGAX 40 T. Rowe Price Global Growth Stock RPGEX 40 T. Rowe Price Global Stock PRGSX 40 T. Rowe Price Global Technology PRGTX 36 T. Rowe Price Growth & Income PRGIX 26 T. Rowe Price Growth Stock PRGFX 24 T. Rowe Price Health Sciences PRHSX 36 T. Rowe Price High Yield PRHYX 44 T. Rowe Price International Bond RPIBX 44 T. Rowe Price International Discovery PRIDX 38 T. Rowe Price International Stock PRITX 38 T. Rowe Price International Value Eq TRIGX 38 T. Rowe Price Intl Disciplined Eq Inv PRCNX 38 T. Rowe Price Lrg Cp Gr Inv TRGOX 24 T. Rowe Price Mid-Cap Growth RPMGX 30 T. Rowe Price Mid-Cap Value TRMCX 32 T. Rowe Price New America Growth PRWAX 24 T. Rowe Price New Asia PRASX 40 T. Rowe Price New Horizons PRNHX 30
T. Rowe Price Overseas Stock TROSX 38 T. Rowe Price QM US Sm&Md-Cp Cor TQSMX 30 T. Rowe Price QM US Small-Cap Gr Eq PRDSX 32 T. Rowe Price Real Estate TRREX 36 T. Rowe Price Retirement 2015 TRRGX 36 T. Rowe Price Retirement Balanced TRRIX 36 T. Rowe Price Science & Tech PRSCX 36 T. Rowe Price Short-Term Bond PRWBX 42 T. Rowe Price Small-Cap Stock OTCFX 32 T. Rowe Price Small-Cap Value PRSVX 32 T. Rowe Price Spectrum Cnsrv Allc PRSIX 36 T. Rowe Price Spectrum Growth PRSGX 26 T. Rowe Price Spectrum Income RPSIX 44 T. Rowe Price Spectrum Mod Gr Allc TRSGX 36 T. Rowe Price Spectrum Moderate Allc TRPBX 36 T. Rowe Price Summit Municipal Inc Inv PRINX 44 T. Rowe Price Summit Municipal Intm PRSMX 44 T. Rowe Price Tax-Free High Yield PRFHX 44 T. Rowe Price Tax-Free Income Inv PRTAX 44 T. Rowe Price Tax-Free Shrt-Interm PRFSX 44 T. Rowe Price US Large-Cap Core TRULX 26 T. Rowe Price Value TRVLX 28TCW Total Return Bond I 386-3829 TGLMX 42TIAA Investments 877-518-9161 TIAA-CREF Core Impact Bond Instl TSBIX 42 TIAA-CREF Growth & Income Instl TIGRX 26 TIAA-CREF Large-Cap Value Instl TRLIX 28 TIAA-CREF Social Choice Eq Retail TICRX 26Third Avenue Real Estate Val 443-1021 TAREX 36Touchstone Sands Cap Select Gr 543-0407 PTSGX 24Transamerica Lrg Cap Val 888-233-4339 TWQAX 28Tributary Small Company FOSCX 32 Tweedy, Browne 432-4789 Tweedy, Browne Global Value TBGVX 38 Tweedy, Browne Value TWEBX 40 Tweedy, Browne Worldwide Hi Div Yld TBHDX 40
Vanguard 662-7447 Vanguard 500 Index Admiral VFIAX 26 Vanguard Balanced Index Adm VBIAX 36 Vanguard CA Interm-Term Tax-Exempt VCAIX 44 Vanguard Capital Opportunity Adm VHCAX 24 Vanguard Core Bond Admiral VCOBX 42 Vanguard Developed Markets Idx Adm VTMGX 38 Vanguard Dividend Appreciation Idx Ad VDADX 26 Vanguard Dividend Growth Inv VDIGX 26 Vanguard Emerging Mkts Stock Idx Ad VEMAX 40 Vanguard Energy Inv VGENX 36 Vanguard Equity-Income Inv VEIPX 28 Vanguard European Stock Index Adm VEUSX 40 Vanguard Explorer Inv VEXPX 32 Vanguard Explorer Value Inv VEVFX 32 Vanguard Extended Market Index Adm VEXAX 30 Vanguard FTSE All-Wld ex-US Idx Adm VFWAX 38 Vanguard FTSE All-Wld ex-US SmCp Idx VFSAX 38 Vanguard FTSE Social Index Admiral VFTAX 26 Vanguard GNMA Inv VFIIX 42 Vanguard Global ESG Select Stk Adm VESGX 40 Vanguard Global Equity Inv VHGEX 40 Vanguard Global Minimum Volatility VMVFX 40
Vanguard Global Wellesley Income Inv VGWIX 40 Vanguard Global Wellington Investor VGWLX 40 Vanguard Global ex-US Real Est Idx Ad VGRLX 36 Vanguard Growth & Income Inv VQNPX 26 Vanguard Growth Index Admiral VIGAX 24 Vanguard Health Care Inv VGHCX 36 Vanguard High Dividend Yield Index Ad VHYAX 28 Vanguard High-Yield Corporate Inv VWEHX 44 Vanguard High-Yield Tax-Exempt VWAHX 44 Vanguard Inflation-Protected Secs Inv VIPSX 42 Vanguard Interm-Term Bond Index Adm VBILX 42 Vanguard Interm-Term Invmt-Grade Inv VFICX 42 Vanguard Interm-Term Treasury Inv VFITX 42 Vanguard Interm-Term Tx-Ex Inv VWITX 44 Vanguard International Explorer Inv VINEX 38 Vanguard International Growth Inv VWIGX 38 Vanguard International Value Inv VTRIX 38 Vanguard Intl Div Apprec Idx Adm VIAAX 38 Vanguard Large Cap Index Admiral VLCAX 26 Vanguard LifeStrategy Growth Inv VASGX 36 Vanguard LifeStrategy Income Inv VASIX 36 Vanguard Long-Term Investment-Grade VWESX 42 Vanguard Long-Term Tax-Exempt VWLTX 44 Vanguard Long-Term Treasury Inv VUSTX 42 Vanguard Ltd-Term Tx-Ex VMLTX 44 Vanguard Mid Cap Growth Inv VMGRX 30 Vanguard Mid Cap Index Admiral VIMAX 30 Vanguard Mid-Cap Growth Index Adm VMGMX 30 Vanguard Mid-Cap Value Index Adm VMVAX 32 Vanguard NY Long-Term Tax-Exempt Inv VNYTX 44 Vanguard PRIMECAP Adm VPMAX 24 Vanguard PRIMECAP Core Inv VPCCX 26 Vanguard Real Estate Index Admiral VGSLX 36 Vanguard STAR Inv VGSTX 36 Vanguard Selected Value Inv VASVX 32 Vanguard Short-Term Bond Index Adm VBIRX 42 Vanguard Short-Term Federal Inv VSGBX 42 Vanguard Short-Term Investment-Grade VFSTX 42 Vanguard Short-Term Treasury Inv VFISX 42 Vanguard Short-Term Tx-Ex VWSTX 44 Vanguard Shrt-Term Infl-Prot Sec Idx Ad VTAPX 42 Vanguard Small Cap Growth Index Adm VSGAX 32 Vanguard Small Cap Index Adm VSMAX 32 Vanguard Small Cap Value Index Adm VSIAX 34 Vanguard Strategic Equity Inv VSEQX 30 Vanguard Target Retirement 2025 Inv VTTVX 36 Vanguard Tax-Exempt Bond Admiral VTEAX 44 Vanguard Tax-Managed Balanced Adm VTMFX 36 Vanguard Tax-Managed Capital App Ad VTCLX 26 Vanguard Tax-Managed Small Cap Ad VTMSX 32 Vanguard Total Bond Market Index Adm VBTLX 42 Vanguard Total Intl Bd Idx Admiral VTABX 42 Vanguard Total Intl Stock Index Admiral VTIAX 38 Vanguard Total Stock Mkt Idx Adm VTSAX 26 Vanguard Total World Stock Index Adm VTWAX 40 Vanguard US Growth Admiral VWUAX 24 Vanguard Value Index Adm VVIAX 28 Vanguard Wellesley Income Inv VWINX 36 Vanguard Wellington Inv VWELX 36 Vanguard Windsor II Inv VWNFX 28 Vanguard Windsor Inv VWNDX 28Virtus Vontobel Emrg Mkt Opps 243-1574 HEMZX 40
WCM Focused Int’l Gr 888-988-9801 WCMRX 38Wasatch 551-1700 Wasatch Core Growth WGROX 32 Wasatch Small Cap Growth Investor WAAEX 32

Morningstar ® ETFInvestorSM is a newsletter published by Morningstar, Inc. Investment research is produced and issued by subsidiaries of Morningstar, Inc. including, but not limited to, Morningstar Research Services LLC, which is registered with and governed by the U.S. Securities and Exchange Commission. Morningstar Investment Management LLC is not associated with the ETFInvestor newsletter or its content.E T F I N V E S T O R
Morningstar ETFInvestor Special Rate for Loyal Newsletter Subscribers One-Year SubscriptionPrint | $219 $179
Call Now to Save $40 1-866-608-9570(Mention code: ETFSAVE80)
There is a lot of noise floating around about how anyone can beat the markets trading ETFs. For most investors, ETFs are used to obtain passive exposures to the market. Forget about the supposed benefits of being able to dart in and out of the markets. That’s one way to lose money. For most, sensible ETF investing is about keeping costs down, tax efficiency, and diversification.
Not exciting, but such things rarely are. Morningstar ETFInvestor can help you learn more about this strategy.
At $40 off, and with Morningstar’s money-back guarantee on the subscription, there’s no reason to delay! Subscribe today and save.
It’s more straightforward than you think.

DIRECTOR OF MANAGER RESEARCH AND EDITOR
Russel Kinnel
MORNINGSTAR INC.
CONTRIBUTING ANALYSTS Leo Acheson Greg Carlson Mike Mulach
Bill RoccoEric Schultz
COPY EDITORS
Tori BrovetEdward CavanaughJennifer Ferone GieratKari Greczek
QUALITY ASSURANCE
Yan Zhang
DESIGNER
Claudia Olariu
PUBLISHER
Peggy Seemann
DIRECTOR OF MANAGER RESEARCH ACTIVE STRATEGIES—NORTH AMERICA
Sarah Bush
DIRECTOR OF PERSONAL F INANCE
Christine Benz
HEAD OF RESEARCH PRODUCTS
Marc DeMoss
HEAD OF GLOBAL RESEARCH
Haywood Kelly, CFA
PHOTOGRAPHY
Claudia Olariu
©2020 Morningstar, Inc. All rights reserved. Reproduction by any means is prohibited. While data contained in this report are gathered from reliable sources, accuracy and completeness cannot be guaranteed. The publisher does not give investment advice or act as an investment advisor. All data, information, and opinions are subject to change without notice.
Reprints of articles and information appearing in this publication are available in quantity. Please contact [email protected] about your subscription? [email protected]
Please address all correspondence to Peggy Seemann, Morningstar, Inc., 22 W. Washington Street, Chicago, IL 60602.
Morningstar FundInvestor (ISSN 1099-0402) is published monthly by Morningstar, Inc., 22 W. Washington Street, Chicago, IL 60602. For address changes, please call our product support line at 312-424-4288. For subscriptions call: toll-free 866-608-9570.
Periodicals postage paid at Chicago, IL and at additional mailing offices. POSTMASTER: Send address changes to Morningstar FundInvestor, 22 W. Washington Street, Chicago, IL 60602.
MFI202101
Morningstar FundInvestorVolume 29, Number 5
Get the latest issue and more on FundInvestor’s website
mfi.morningstar.com
Volume Number Month/Year
29 05 01/2021
Research and recommendations for the serious fund investor
Morningstar FundInvestor22 W. Washington StreetChicago, Illinois 60602
ADDRESS SERVICE REQUESTED
Periodicals Postage P a i dChicago, Illinois and additional offices