investor seminar 2021 - slides
TRANSCRIPT

Investor SeminarPerformance, strategic direction and shareholder returns20 October 2021
Gobi desert, Mongolia

©2021, Rio Tinto, All Rights Reserved 2
Cautionary and supporting statementsThis presentation has been prepared by Rio Tinto plc and Rio Tinto Limited (together with their subsidiaries, “Rio Tinto”). By accessing/attending this presentation you acknowledge that you have read and understood the following statement. Forward-looking statementsThis presentation includes “forward-looking statements” within the meaning of the Private Securities Litigation Reform Act of 1995. All statements other than statements of historical facts included in this report, including, without limitation, those regarding Rio Tinto’s financial position, business strategy, plans and objectives of management for future operations (including development plans and objectives relating to Rio Tinto’s products, production forecasts and reserve and resource positions), are forward-looking statements. The words “intend”, “aim”, “project”, “anticipate”, “estimate”, “plan”, “believes”, “expects”, “may”, “should”, “will”, “target”, “set to” or similar expressions, commonly identify such forward-looking statements.Such forward-looking statements involve known and unknown risks, uncertainties and other factors which may cause the actual results, performance or achievements of Rio Tinto, or industry results, to be materially different from any future results, performance or achievements expressed or implied by such forward-looking statements. Such forward-looking statements are based on numerous assumptions regarding Rio Tinto’s present and future business strategies and the environment in which Rio Tinto will operate in the future. Among the important factors that could cause Rio Tinto’s actual results, performance or achievements to differ materially from those in the forward-looking statements include, but are not limited to: an inability to live up to Rio Tinto’s values and any resultant damage to its reputation; the impacts of geopolitics on trade and investment; the impacts of climate change and the transition to a low-carbon future; an inability to successfully execute and/or realise value from acquisitions and divestments; the level of new ore resources, including the results of exploration programmes and/or acquisitions; disruption to strategic partnerships that play a material role in delivering growth, production, cash or market positioning; damage to Rio Tinto’s relationships with communities and governments; an inability to attract and retain requisite skilled people; declines in commodity prices and adverse exchange rate movements; an inability to raise sufficient funds for capital investment; inadequate estimates of ore resources and reserves; delays or overruns of large and complex projects; changes in tax regulation; safety incidents or major hazard events; cyber breaches; physical impacts from climate change; the impacts of water scarcity; natural disasters; an inability to successfully manage the closure, reclamation and rehabilitation of sites; the impacts of civil unrest; the impacts of the Covid-19 pandemic; breaches of Rio Tinto’s policies, standard and procedures, laws or regulations; trade tensions between the world’s major economies; increasing societal and investor expectations, in particular with regard to environmental, social and governance considerations; the impacts of technological advancements; and such other risks identified in Rio Tinto’s most recent Annual Report and accounts in Australia and the United Kingdom and the most recent Annual Report on Form 20-F filed with the United States Securities and Exchange Commission (the “SEC”) or Form 6-Ks furnished to, or filed with, the SEC. Forward-looking statements should, therefore, be construed in light of such risk factors and undue reliance should not be placed on forward-looking statements. These forward-looking statements speak only as of the date of this report. Rio Tinto expressly disclaims any obligation or undertaking (except as required by applicable law, the UK Listing Rules, the Disclosure Guidance and Transparency Rules of the Financial Conduct Authority and the Listing Rules of the Australian Securities Exchange) to release publicly any updates or revisions to any forward-looking statement contained herein to reflect any change in Rio Tinto’s expectations with regard thereto or any change in events, conditions or circumstances on which any such statement is based.Nothing in this presentation should be interpreted to mean that future earnings per share of Rio Tinto plc or Rio Tinto Limited will necessarily match or exceed its historical published earnings per share.DisclaimerNeither this presentation, nor the question and answer session, nor any part thereof, may be recorded, transcribed, distributed, published or reproduced in any form, except as permitted by Rio Tinto. By accessing/ attending this presentation, you agree with the foregoing and, upon request, you will promptly return any records or transcripts at the presentation without retaining any copies.This presentation contains a number of non-IFRS financial measures. Rio Tinto management considers these to be key financial performance indicators of the business and they are defined and/or reconciled in Rio Tinto’s annual results press release, Annual Report and accounts in Australia and the United Kingdom and/or the most recent Annual Report on Form 20-F filed with the SEC or Form 6-Ks furnished to, or filed with, the SEC.Reference to consensus figures are not based on Rio Tinto’s own opinions, estimates or forecasts and are compiled and published without comment from, or endorsement or verification by, Rio Tinto. The consensus figures do not necessarily reflect guidance provided from time to time by Rio Tinto where given in relation to equivalent metrics, which to the extent available can be found on the Rio Tinto website.By referencing consensus figures, Rio Tinto does not imply that it endorses, confirms or expresses a view on the consensus figures. The consensus figures are provided for informational purposes only and are not intended to, nor do they, constitute investment advice or any solicitation to buy, hold or sell securities or other financial instruments. No warranty or representation, either express or implied, is made by Rio Tinto or its affiliates, or their respective directors, officers and employees, in relation to the accuracy, completeness or achievability of the consensus figures and, to the fullest extent permitted by law, no responsibility or liability is accepted by any of those persons in respect of those matters. Rio Tinto assumes no obligation to update, revise or supplement the consensus figures to reflect circumstances existing after the date hereof.
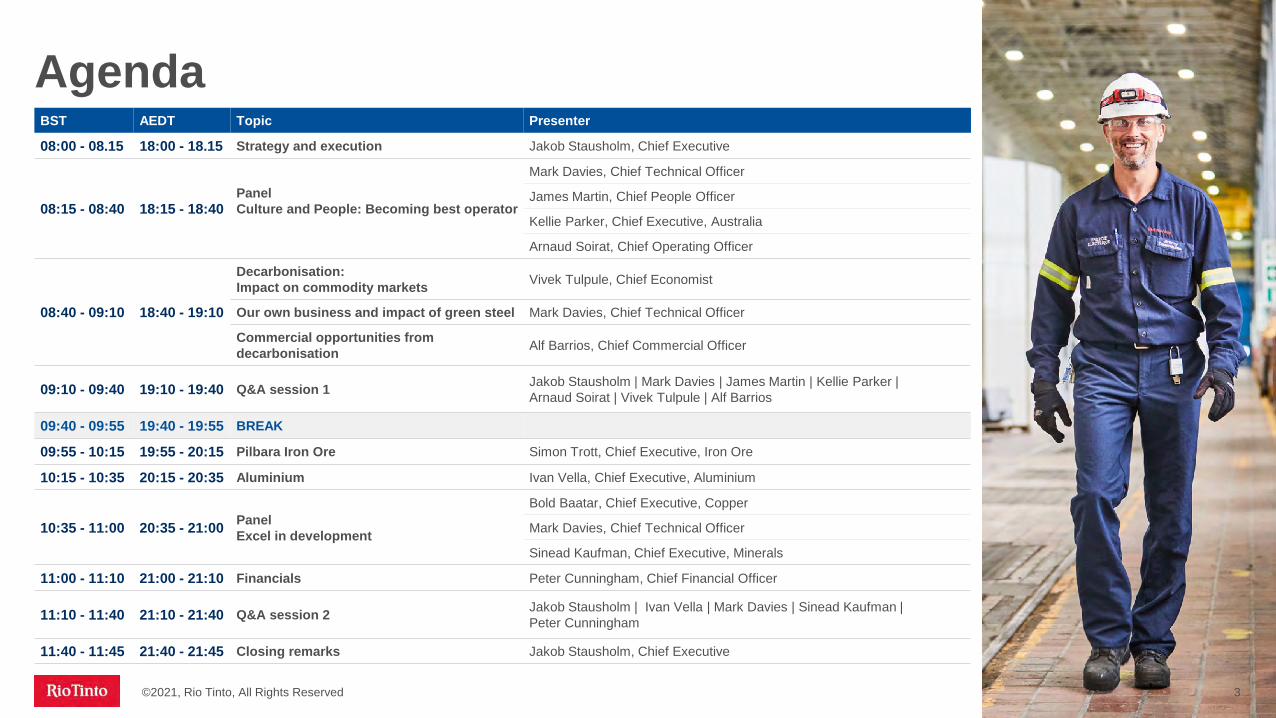
Agenda
©2021, Rio Tinto, All Rights Reserved 3
BST AEDT Topic Presenter
08:00 - 08.15 18:00 - 18.15 Strategy and execution Jakob Stausholm, Chief Executive
08:15 - 08:40 18:15 - 18:40PanelCulture and People: Becoming best operator
Mark Davies, Chief Technical Officer
James Martin, Chief People Officer
Kellie Parker, Chief Executive, Australia
Arnaud Soirat, Chief Operating Officer
08:40 - 09:10 18:40 - 19:10
Decarbonisation:Impact on commodity markets Vivek Tulpule, Chief Economist
Our own business and impact of green steel Mark Davies, Chief Technical Officer
Commercial opportunities from decarbonisation Alf Barrios, Chief Commercial Officer
09:10 - 09:40 19:10 - 19:40 Q&A session 1 Jakob Stausholm | Mark Davies | James Martin | Kellie Parker | Arnaud Soirat | Vivek Tulpule | Alf Barrios
09:40 - 09:55 19:40 - 19:55 BREAK
09:55 - 10:15 19:55 - 20:15 Pilbara Iron Ore Simon Trott, Chief Executive, Iron Ore
10:15 - 10:35 20:15 - 20:35 Aluminium Ivan Vella, Chief Executive, Aluminium
10:35 - 11:00 20:35 - 21:00 PanelExcel in development
Bold Baatar, Chief Executive, Copper
Mark Davies, Chief Technical Officer
Sinead Kaufman, Chief Executive, Minerals
11:00 - 11:10 21:00 - 21:10 Financials Peter Cunningham, Chief Financial Officer
11:10 - 11:40 21:10 - 21:40 Q&A session 2 Jakob Stausholm | Ivan Vella | Mark Davies | Sinead Kaufman | Peter Cunningham
11:40 - 11:45 21:40 - 21:45 Closing remarks Jakob Stausholm, Chief Executive
Jakob StausholmStrategy and execution
Rainbow Bridge. Tokyo, Japan
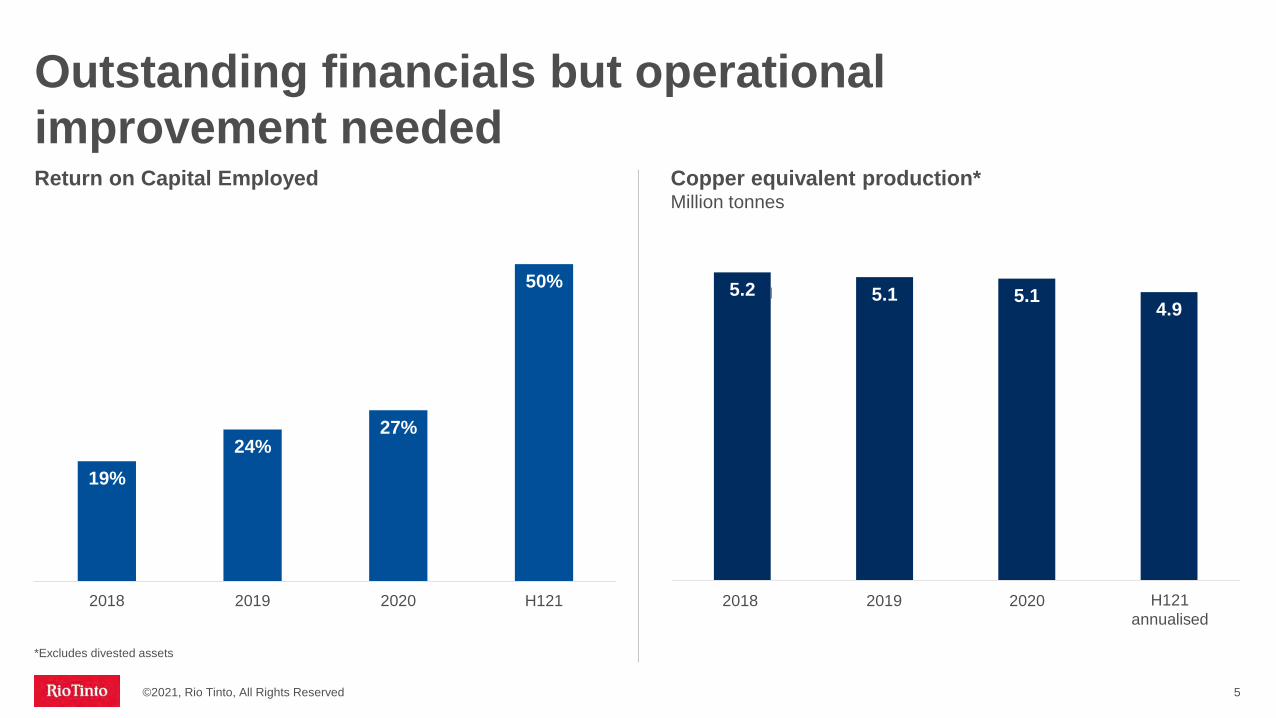
Outstanding financials but operationalimprovement needed
©2021, Rio Tinto, All Rights Reserved 5
Copper equivalent production* Million tonnes
Return on Capital Employed
5.2 5.1 5.14.9
2018 2019 2020 H121 annualised
19%24%
27%
50%
2018 2019 2020 H121
*Excludes divested assets
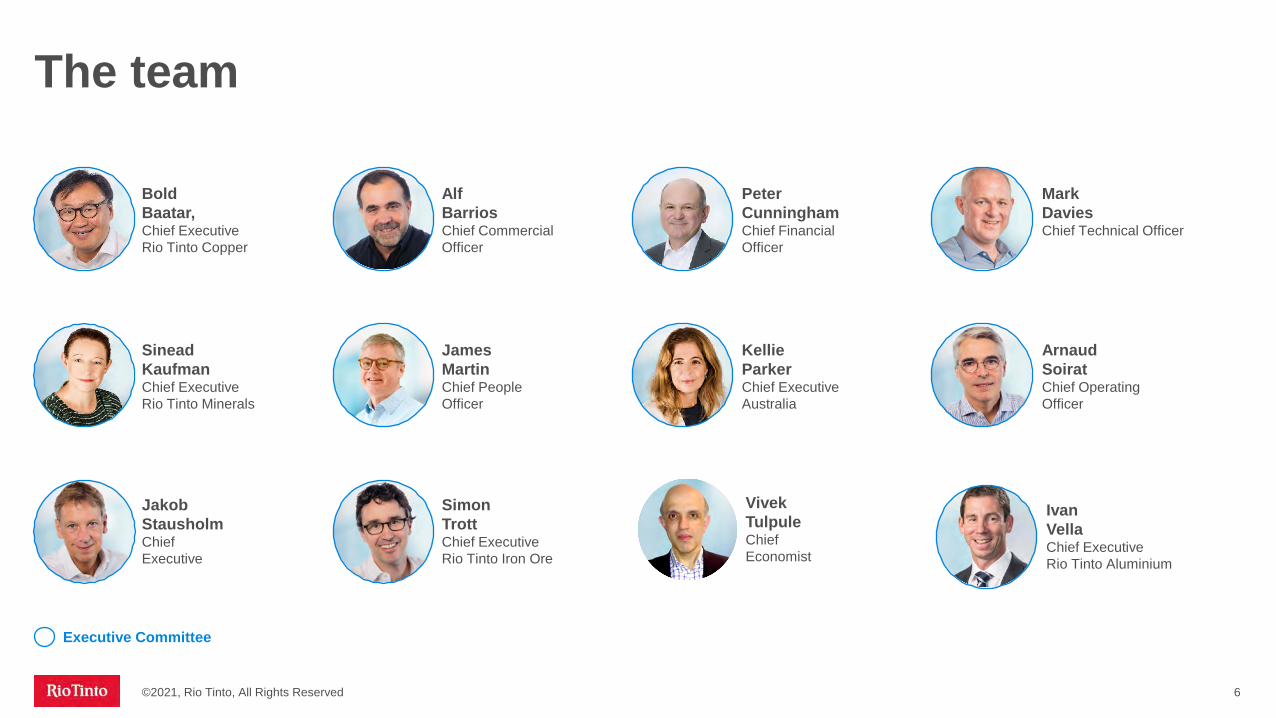
The team
©2021, Rio Tinto, All Rights Reserved 6
Alf BarriosChief Commercial Officer
Simon TrottChief ExecutiveRio Tinto Iron Ore
Ivan VellaChief ExecutiveRio Tinto Aluminium
Sinead KaufmanChief Executive Rio Tinto Minerals
Kellie ParkerChief Executive Australia
Arnaud SoiratChief Operating Officer
James MartinChief People Officer
Peter CunninghamChief Financial Officer
Jakob StausholmChief Executive
Mark DaviesChief Technical Officer
Bold Baatar, Chief Executive Rio Tinto Copper
Vivek TulpuleChief Economist
Executive Committee

Four areas of immediate focus
©2021, Rio Tinto, All Rights Reserved 7
Care for− People’s safety− Communities− Planet
Courage to− Try new things− Speak up− Do what’s right
Curiosity fosters− Collaboration− Learning− Innovation
Best operator
Expand capability and leadership
Impeccable ESG credentials
Strengthen track record and
transparency
Excel in development
Deliver organic & inorganic growth
Social LicenceEarn trust by building meaningful relationships and partnerships
Our Values

The world faces a major challenge
8
Annual global GHG emissions* Limited action so far. The world has more than doubled cumulative GHG emissions since the early ’90’s
Momentum changing. Countries are setting ambitious targets and enacting policies
China, the world’s largest consumer and a significant producer of commodities, has set clear objectives
©2021, Rio Tinto, All Rights Reserved
*The source of the historic data is: Trends in global CO2 and total greenhouse gas emissions: 2020 report. Netherlands Environmental Assessment Agency. The annual decline rate is an illustrative straight-line rate and not a forecast or scenario. | **Nationally Determined Contributions
0
10
20
30
40
50
60
70
1990 2000 2010 2020 2030 2040 2050
Gt CO2e
+1.3% p.a.~7% p.a. reductionto achieve net zero agreed under Paris Agreement
NDCs**

Global commodity value chain carbon emissions and intensities
A large carbon footprint today
©2021, Rio Tinto, All Rights Reserved 9
Our 2020 Scope 1 and 2 emissions by operations (equity basis)Total CO2e
Our 2020 Scope 3 emissions Total CO2eAluminium
(Pacific)
Bauxite & Alumina
Aluminium (Atlantic)
Copper
6.4
10.1
3.6
5.3
Minerals**
2.73.0
Iron Ore
27Other
116
363
Bauxite & Alumina
IOC iron ore
13
Pilbara iron ore
Global CO2 emissions Production CO2 intensity
Copper* 86 Mt 21 Mt 4 tCO2/t
Aluminium* ~1.0 Gt 66 Mt 15 tCO2/t
Crude Steel ~3.3 Gt 1,850 Mt 1.8 tCO2/t
*Primary production | **Iron Ore Company of Canada (IOC) included in Minerals
31.5Mt 519Mt
CuCopper
29
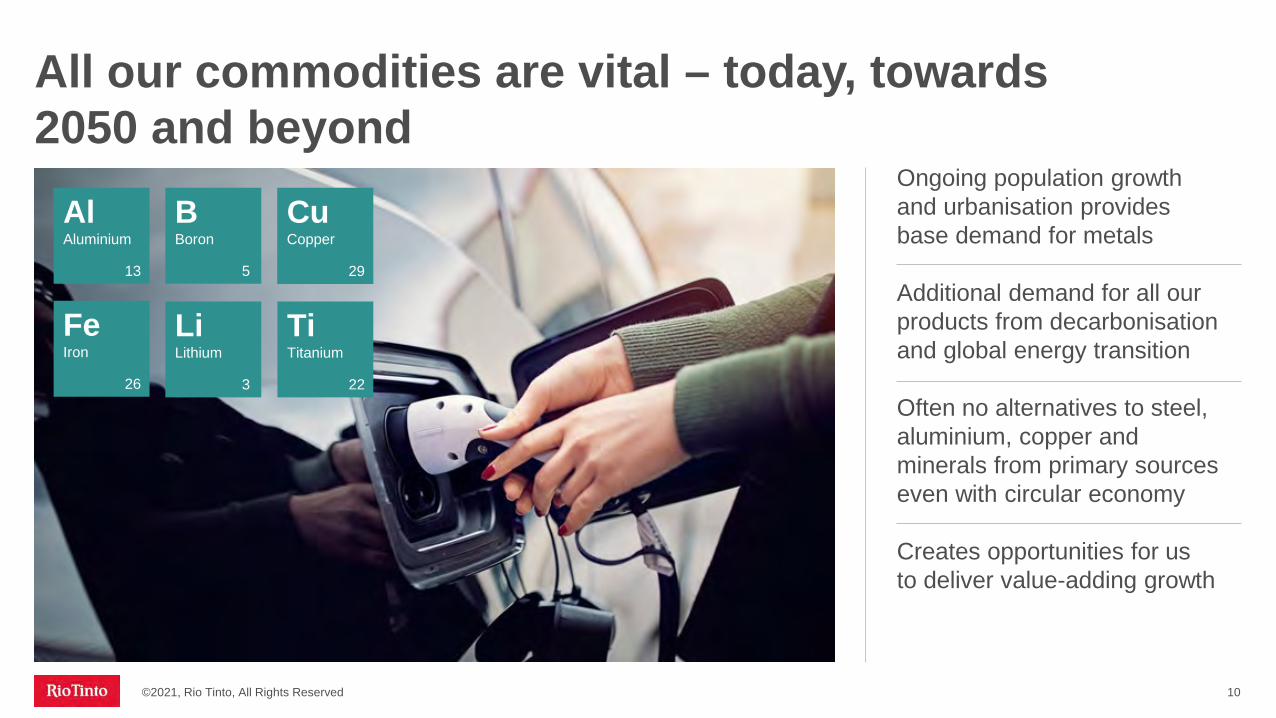
All our commodities are vital – today, towards 2050 and beyond
10
AlAluminium
13
FeIron
26
TiTitanium
22
LiLithium
3
BBoron
5
Ongoing population growth and urbanisation provides base demand for metals
Additional demand for all our products from decarbonisation and global energy transition
Often no alternatives to steel, aluminium, copper and minerals from primary sources even with circular economy
Creates opportunities for us to deliver value-adding growth
©2021, Rio Tinto, All Rights Reserved

Delivering our strategy
©2021, Rio Tinto, All Rights Reserved 11
3 9 4
184
2848
13
275
CopperNickel (Class 1)
Lithium Cobalt
50% reduction in our emissionsby 2030
Ambition to double investment in growth
Accelerate R&Dand beyond
- Advantaged renewables position
- Accelerate R&D
- ELYSISTM
- Studying Canadian DRI
- High-quality iron ore
- Partnerships
- Crack the code on Pilbara iron ore
- Delivering our Scope 3 goals
Market Size ($bn)
Growth to 2030 (multiple of current size)**
20202030
New targets for our Scope 1 & 2 emissions(Mt CO2e equity basis)
10 5.5 3.8 1.5
Double growth capex up to $3bnper year from 2023~$7.5bn*** investment in decarbonisation from 2022-2030 plus indirect expenditure
*2018 Scope 1 & 2 emissions baseline has been adjusted for divestments. **Market size is for primary market only. Recycling is expected to take a larger share of total demand in the future for most commodities. ***Conceptual view of capital requirements at October 2021. Marginal Abatement Cost Curves (MACC) will be updated on an annual basis. Sources: Rio Tinto Market Analysis, UBS, CPM Group | DRI = Direct Reduction Iron
32.6
16.3
2025
-15%
2030
-50%
2018*

Well placed to deliver
©2021, Rio Tinto, All Rights Reserved 12
Advantaged positionsLarge power producer and consumer. Uniquely positioned in advantaged green energy locations – Pilbara, Quebec and Queensland
TechnologyMetallurgy, geology, mining equipment, processing, energy
Cash flow and balance sheetDisciplined capital allocation. Cash flow through cycle. Ability to invest and pay an attractive dividend – in line with our policy
We operate in three out of the eleven advantageous regions for renewable energy
Ideal for wind Ideal for solar and wind RES* endowed regionExisting major hydropowerIdeal for solar
Assets and peopleLong-life orebodies with superior orebody knowledge. Talented workforce
*RES = Renewable Energy System

Vivek TulpuleDecarbonisation: Impact on commodity markets

Low-carbon policiesNet zero by 20501
Net zero by 20502
Carbon neutral by 20603
Cannibalises some demand for primary material
Transitioning towards net zero emissions
©2021, Rio Tinto, All Rights Reserved 14
Electrification2.5x electrification growth from now to 2050 in net zero scenarioAverage per capita electricity demand will more than double
RenewablesRenewable energy from 10% to 70% of energy mix by 2050
16x wind increase30x solar increase
Power storageBattery capacity additions for electric vehicles will grow over 30x by 2050Stationary storage will grow with intermittent renewable generation
HydrogenA critical part of the fuel mix in industry and heavy transport6% of final energy mix by 2050Scrap use
teel1-3%Al
4-6%Steel1-3%
Cu3-4%
1 EU Updated Nationally Determined Contribution (NDC), Dec 2020, United Nations Framework Convention on Climate Change (UNFCCC) | 2 As per section 4.a(ii).b, The United States of America Nationally Determined Contribution, April 21 2021 | 3 Official Statement in 75th Session of The UN General Assembly, Sep 2020 Source: Net zero statistics from International Energy Association (IEA)
Annual growth to 2040

Green aluminium lowers carbon input
Green steel supporting low-carbon urbanisation
Copper supports rapid renewable electrification
Lithium is an essential battery technology mineral
All our commodities are vital – today, towards 2050 and beyond
©2021, Rio Tinto, All Rights Reserved 15
CuCopper
29
AlAluminium
13
FeIron
26
TiTitanium
22
LiLithium
3
BBoron
5
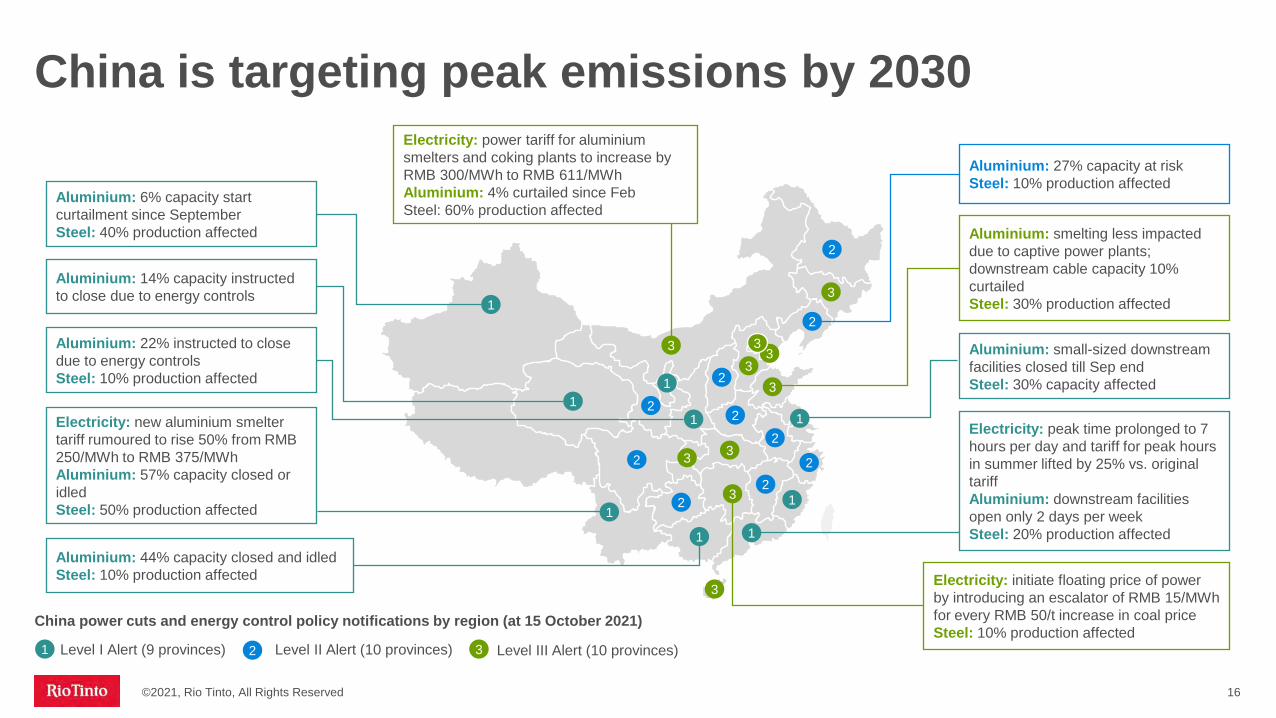
China is targeting peak emissions by 2030
©2021, Rio Tinto, All Rights Reserved 16
Aluminium: 27% capacity at riskSteel: 10% production affected
Aluminium: smelting less impacted due to captive power plants; downstream cable capacity 10% curtailedSteel: 30% production affected
Aluminium: small-sized downstream facilities closed till Sep endSteel: 30% capacity affected
Aluminium: 6% capacity start curtailment since SeptemberSteel: 40% production affected
Aluminium: 22% instructed to close due to energy controlsSteel: 10% production affected
Aluminium: 14% capacity instructed to close due to energy controls
Electricity: new aluminium smelter tariff rumoured to rise 50% from RMB 250/MWh to RMB 375/MWhAluminium: 57% capacity closed or idledSteel: 50% production affected
Aluminium: 44% capacity closed and idledSteel: 10% production affected Electricity: initiate floating price of power
by introducing an escalator of RMB 15/MWh for every RMB 50/t increase in coal priceSteel: 10% production affected
1
Electricity: power tariff for aluminium smelters and coking plants to increase by RMB 300/MWh to RMB 611/MWhAluminium: 4% curtailed since FebSteel: 60% production affected
1
1
1
1 1
Electricity: peak time prolonged to 7 hours per day and tariff for peak hours in summer lifted by 25% vs. original tariffAluminium: downstream facilities open only 2 days per weekSteel: 20% production affected
1
3
3
3
2
1
1
3
33
3
3 32
2
2
2
2
2
22
2
3
Level I Alert (9 provinces) Level II Alert (10 provinces) Level III Alert (10 provinces)321
China power cuts and energy control policy notifications by region (at 15 October 2021)
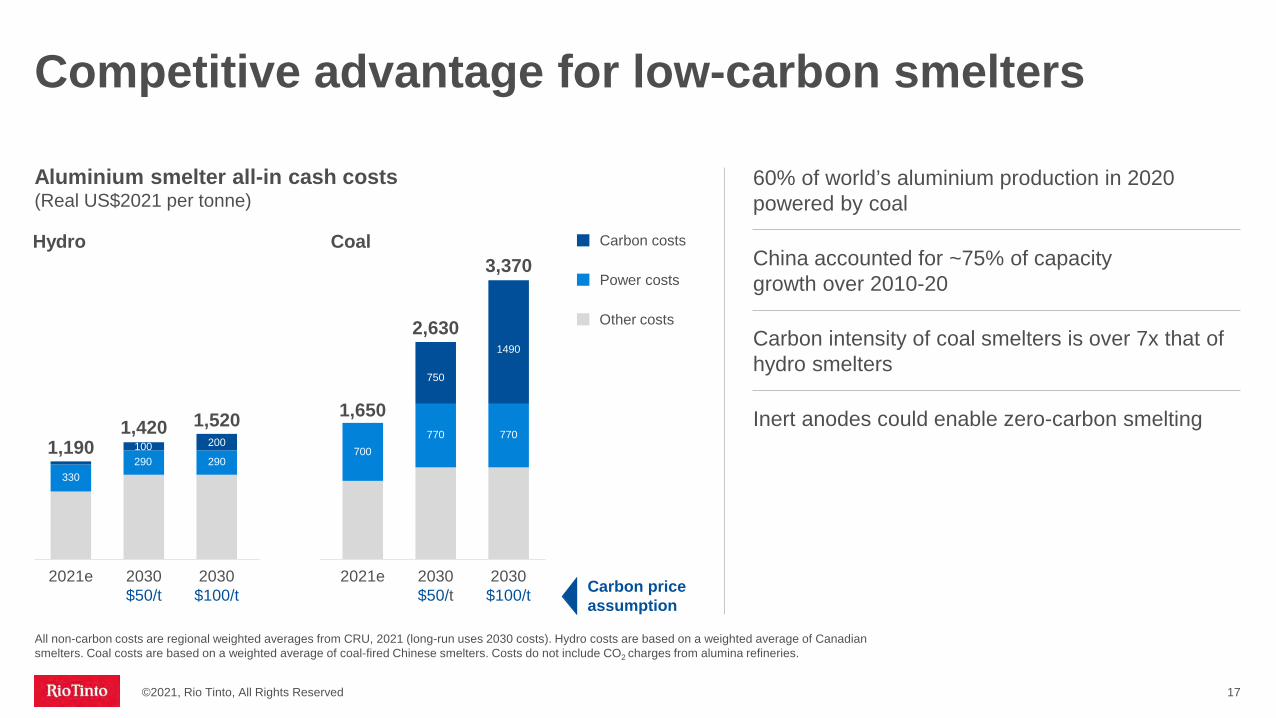
Aluminium smelter all-in cash costs (Real US$2021 per tonne)
Hydro
60% of world’s aluminium production in 2020 powered by coal
China accounted for ~75% of capacity growth over 2010-20
Carbon intensity of coal smelters is over 7x that of hydro smelters
Inert anodes could enable zero-carbon smelting
Coal
All non-carbon costs are regional weighted averages from CRU, 2021 (long-run uses 2030 costs). Hydro costs are based on a weighted average of Canadian smelters. Coal costs are based on a weighted average of coal-fired Chinese smelters. Costs do not include CO2 charges from alumina refineries.
©2021, Rio Tinto, All Rights Reserved 17
1,420
2030$50/t
330
2021e
200100290 290
2030$100/t
700
2021e
750
770
2030$50/t
1490
770
2030$100/t
1,1901,520 1,650
2,630
3,370
Other costs
Power costs
Carbon costs
Carbon priceassumption
Competitive advantage for low-carbon smelters
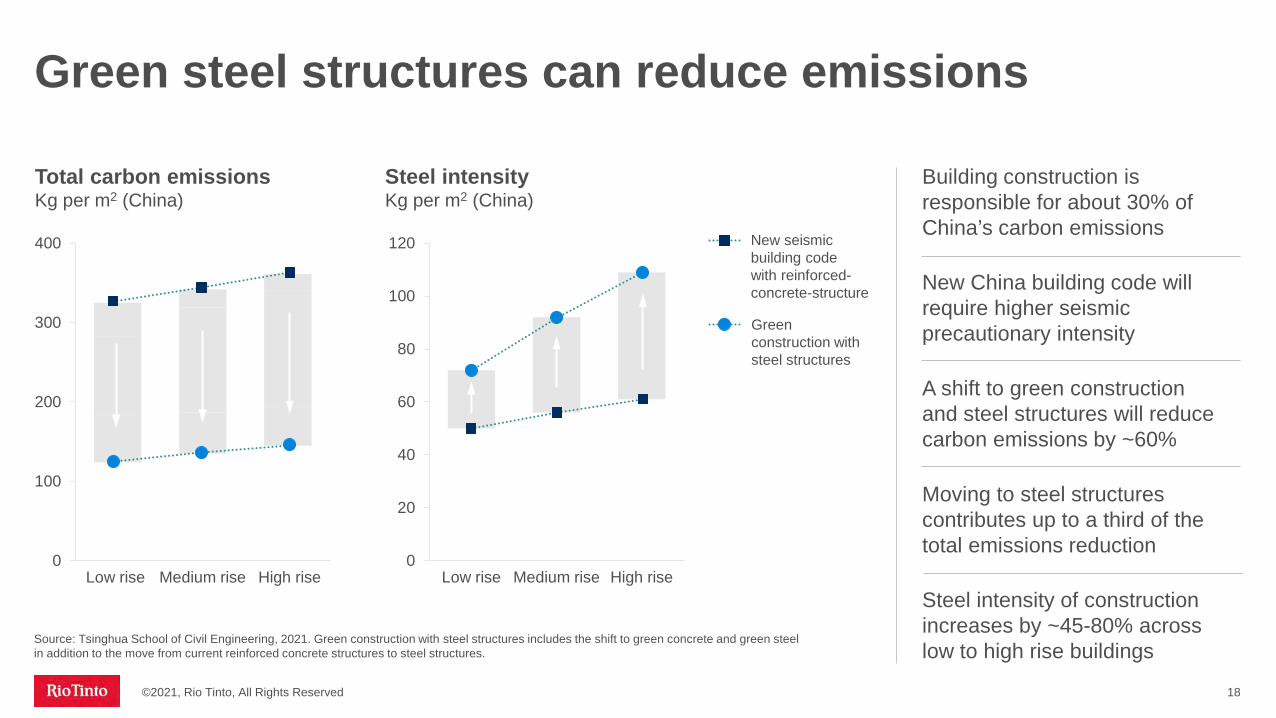
Building construction is responsible for about 30% of China’s carbon emissions
New China building code will require higher seismic precautionary intensity
A shift to green construction and steel structures will reduce carbon emissions by ~60%
Moving to steel structures contributes up to a third of the total emissions reduction
Steel intensity of construction increases by ~45-80% across low to high rise buildings
©2021, Rio Tinto, All Rights Reserved 18
Total carbon emissionsKg per m2 (China)
Steel intensityKg per m2 (China)
New seismic building code with reinforced-concrete-structure
0
100
200
300
400
Low rise High riseMedium rise0
20
40
60
80
100
120
Low rise Medium rise High rise
Green construction with steel structures
Green steel structures can reduce emissions
Source: Tsinghua School of Civil Engineering, 2021. Green construction with steel structures includes the shift to green concrete and green steel in addition to the move from current reinforced concrete structures to steel structures.

Additional green demand expected to account for over one quarter of total demand in the net zero carbon scenario
Rapid electrification of grid adds ~5Mt in copper demand by 2050
Solar and wind generation consume ~3-6 tonnes of copper per MW respectively vs ~1 tonne per MW for thermal power
Electric vehicles contain ~80kg of copper vs 20kg in an internal combustion engine
Decarbonisation is a big driver of copper demand
©2021, Rio Tinto, All Rights Reserved 19
0
5
15
10
20Mt
20502020 2025 2030 2035 2040 2045
EV Charging Station
Renewable power
EVs
Power Storage
Renewables for hydrogen
Grid demand from electrification
Efficient Electric Motors
Heat Pumps
Net additional demand* in a net zero carbon scenario
Net demand after deducting copper consumption using traditional technologies in these segments. Net zero carbon scenario is an internal based view where developed countries reach net zero emissions by 2050, large emerging markets, including China, by 2060 and all other countries by 2070. Average intensity data from International Copper Association (ICA). *Global semis
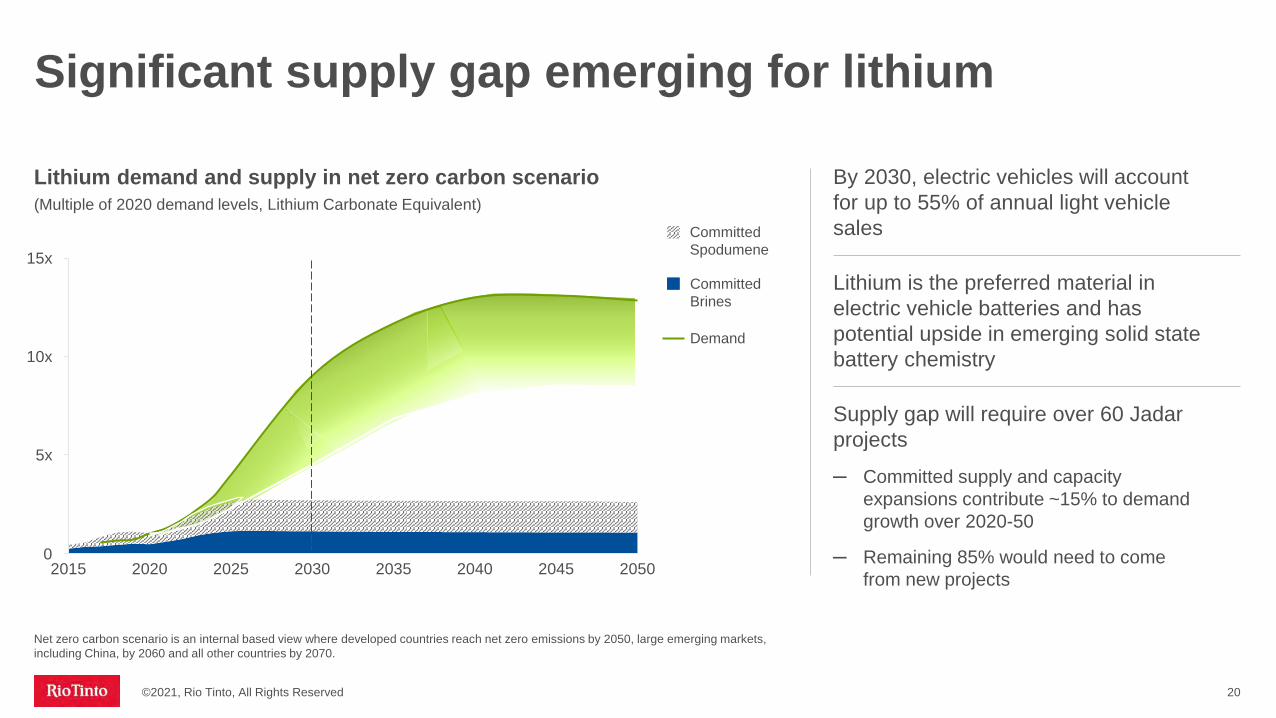
Significant supply gap emerging for lithium
Lithium demand and supply in net zero carbon scenario(Multiple of 2020 demand levels, Lithium Carbonate Equivalent)
By 2030, electric vehicles will account for up to 55% of annual light vehicle sales
Lithium is the preferred material in electric vehicle batteries and has potential upside in emerging solid state battery chemistry
Supply gap will require over 60 Jadarprojects
─ Committed supply and capacity expansions contribute ~15% to demand growth over 2020-50
─ Remaining 85% would need to come from new projects
©2021, Rio Tinto, All Rights Reserved 20
Net zero carbon scenario is an internal based view where developed countries reach net zero emissions by 2050, large emerging markets,including China, by 2060 and all other countries by 2070.
Demand
Committed Spodumene
Committed Brines
2025 2050
5x
204520352015 20302020 20400
10x
15x

Energy and industrial transition drives demand for our products
©2021, Rio Tinto, All Rights Reserved 21
Limiting the impact of climate change requires a green revolution
This social-industrial change will profoundly shift the energy and industrial landscape
Green metals and minerals will be key enablers
CuCopper
29
AlAluminium
13
FeIron
26
TiTitanium
22
LiLithium
3
BBoron
5

Mark DaviesDecarbonising our own business and the impactof green steel
ISAL Aluminium smelter, Iceland

Our Scope 1 & 2 carbon footprint today
23
DieselElectricity
(purchased and generated)Process
heat
Aluminium
MineralsBauxite & Alumina
Iron oreCopperOther
2020equity basis
31.5 Mt CO2e
8.5Mt CO2e
4.4Mt CO2e
2.2Mt
CO2e
6.0Mt CO2e
45% 25% 12%18%% of total
©2021, Rio Tinto, All Rights Reserved
Anodes and reductants

Taking actions to address our emissions
©2021, Rio Tinto, All Rights Reserved 24
ElectricityGrowing renewables from 75%1
− Gudai-Darri (34MW), QMM (20MW) and Weipa (4MW)− Large scale (1GW) Pilbara renewables− Switching Boyne Island and Tomago smelters to renewables− Signed statement of cooperation with Queensland
Government
Anodes & ReductantsDeveloping technologies− Construction of first
ELYSISTM commercial-scale cell at Alma
− Increasing R&D
Process heatRedesigning processes
− Yarwun hydrogen calcination pilot− Plasma torches trials
DieselPartnering with industry
− Komatsu and Caterpillar zero-emission truck partnerships
− Charge On Innovation Challenge
Offsets
Building capacity and capability including new technology partnerships
1Share of renewables in 2020 across our managed operations

Raising our decarbonisation target from 15% to 50% by 2030
©2021, Rio Tinto, All Rights Reserved 25
Accelerate delivery of existing 15% emissions reduction target to 2025
2030 target from 15% to 50% reduction
Increase decarbonisation investment of our own assets to ~$1.5bn over next three years and total investment of ~$7.5bn from 2022 to 2030***
Incentivise MACC projects with internal carbon price of $75/t CO2 initially
Our Scope 1 & 2 emissions (Mt CO2e equity basis)
0
5
10
15
20
25
30
35
2018 2030
32.6
16.3
-50%
Business-as-usual
Pilbara renewables
Pacific Aluminium Operations repowering
MACC**projects
Other****
*2018 Scope 1 & 2 emissions baseline has been adjusted for divestments. | **Marginal abatement cost curve, see slide 28 | ***Conceptual view of capital requirements at October 2021. MAC curves will be updated on an annual basis | ****Includes energy efficiencies, ELYSISTM and carbon offsets
*

0
500
1000
1500
2000
2500
3000
First Gigawatt Full electrification
Switching the Pilbara to renewables
©2021, Rio Tinto, All Rights Reserved
To replace gas power and early electrification
Fully displace diesel in rail and mobile fleet
MW installed renewables
Rapid deployment of ~1GW solar and wind renewables, supported by storage
Abates ~1Mt CO2 Scope 1 emissions, mostly from gas-based power for fixed plants
Full electrification and decarbonisation of Pilbara system require further deployment of renewables at scale
Exploring development partnerships
Natural gas repowering
Diesel repowering
26

Progressing renewable power options for Australian smelters
©2021, Rio Tinto, All Rights Reserved 27
Assets in coal-based grids OwnershipPower
(100% basis) Contract expiry
Tomagosmelter 51.6% 960MW
(demand) 2028
Boyne Islandsmelter 59.4% 810MW
(demand) 2029
Gladstone power station 42.1% 1,680MW
(capacity)
Catalyst for regional renewable energy deployment and development of industry
Signed Statement of Cooperation with Queensland Government
Requires deployment of 5GW+1
of solar and wind power with robust firming solution
1 Equity share
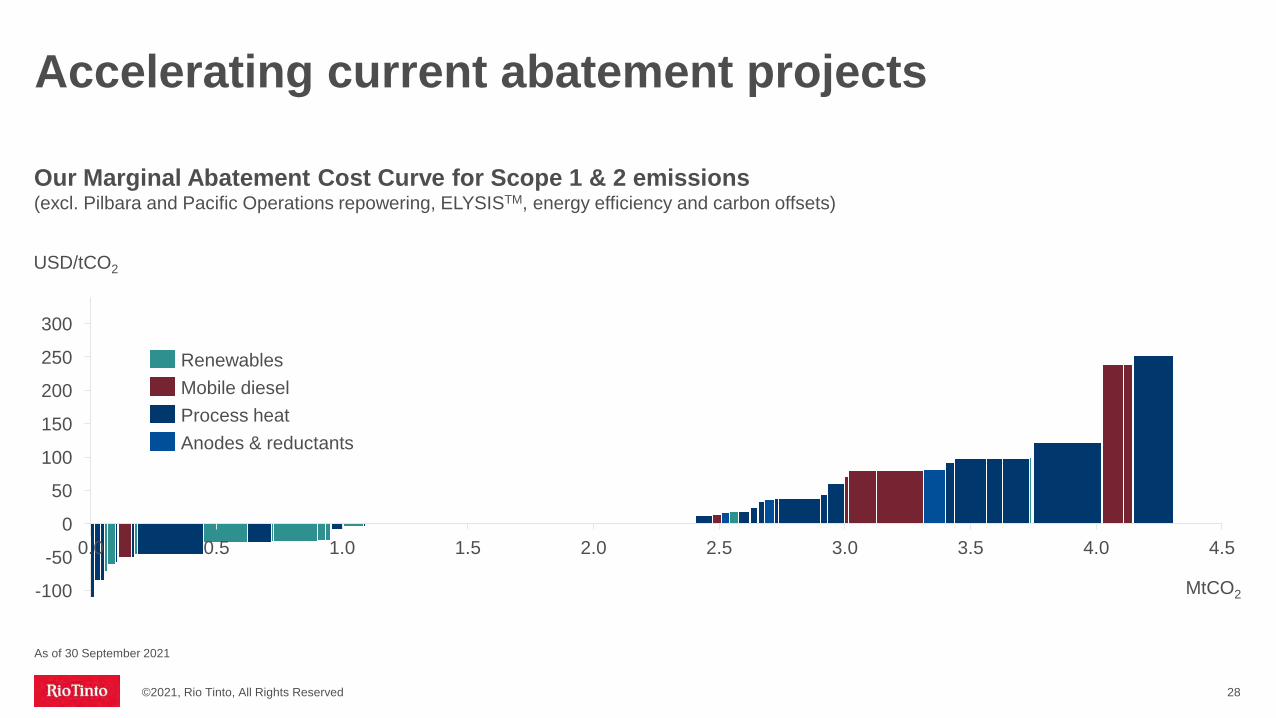
Accelerating current abatement projects
©2021, Rio Tinto, All Rights Reserved 28
Our Marginal Abatement Cost Curve for Scope 1 & 2 emissions(excl. Pilbara and Pacific Operations repowering, ELYSISTM, energy efficiency and carbon offsets)
As of 30 September 2021
USD/tCO2
2.51.0 1.50.00
4.54.03.53.0
250
300
2.00.5
-100
-50
50
100
200
150
MtCO2
RenewablesMobile dieselProcess heatAnodes & reductants

©2021, Rio Tinto, All Rights Reserved 29
Developing green products for our customers
Scope 3 goals
Technology for reductions in steelmaking carbon intensity of at least 30% from 2030
Breakthrough technologies to deliver carbon neutral steelmaking pathways by 2050
Anticipate that ELYSISTM technologywill reach commercial maturity in 2024
Net zero emissions from shipping our products by 2050
1
2
3
4
519Mt CO2e
519Mt CO2e
By source MtCO2e
Pilbara iron ore 363IOC iron ore 13
Bauxite and alumina 116
Other 27
By region MtCO2e
China 390
Japan 44
South Korea 17
EU 8
Other 61

Direct Smelting
New iron and steelmaking
electric furnace
Electrolysis
30
A shift to greener steelmaking technologies
BF / BOF
DR / EAF
Short-term / partial decarbonisation Medium / Long-term / net-zero potential
Hydrogen (H2) injection
Lump / pellet high-grade
iron ore
Green H2direct
reduction1
Biomasspig iron1
Natural gas direct
reductionScrap
New technologies
Optimisation New technologies
Driving need for high-quality iron ore
©2021, Rio Tinto, All Rights Reserved
BF optimisation
+ CCUS
Our areas of focus
Green H2direct
reduction + melter1
1 These products can be used in an EAF or BOF | BF = Blast furnace, BOF = Basic oxygen furnace, DR = Direct reduction, EAF = Electric arc furnace, CCUS = carbon capture, utilisation and storage

Multiple projects
CSIRO / Universities
Pilbara pathway 1
Pilbara pathway 2
High-quality iron ore
Project –study phase
Our focus areas for iron and steel decarbonisation
Blast furnace optimisation
Pilbara beneficiation
Low-carbon research project
H2 DRI and melter
Simandou H2 DRI Canada
1 2 4 5 63
Customer partnershipsWe have a dedicated steel decarbonisation team
©2021, Rio Tinto, All Rights Reserved 31
Future pathways for Pilbara iron ore
DRI = Direct reduction iron, CSIRO = Commonwealth Scientific and Industrial Research
Amrun, Queensland
Alf Barrios Commercial opportunities from decarbonisation

Leveraging insights across the value chain
Sustainable future across the value chain
Communities
Assets
Suppliers
Customers
Markets
©2021, Rio Tinto, All Rights Reserved 33
Partnering with our suppliers and developing sustainable supply chains1
2 Working together with our customers to provide products & services for a more sustainable future
3 Innovating with our customers to enable them to decarbonise
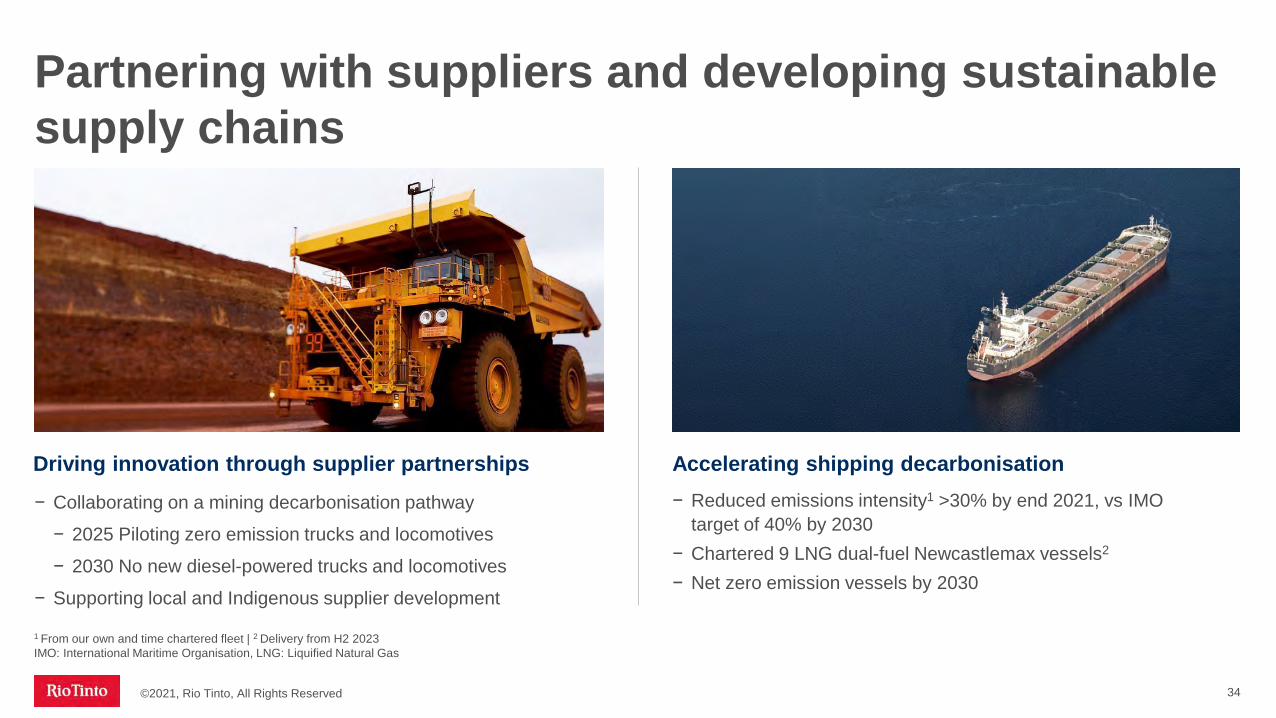
Partnering with suppliers and developing sustainable supply chains
Driving innovation through supplier partnerships Accelerating shipping decarbonisation− Collaborating on a mining decarbonisation pathway
− 2025 Piloting zero emission trucks and locomotives
− 2030 No new diesel-powered trucks and locomotives
− Supporting local and Indigenous supplier development
− Reduced emissions intensity1 >30% by end 2021, vs IMO target of 40% by 2030
− Chartered 9 LNG dual-fuel Newcastlemax vessels2
− Net zero emission vessels by 2030
34
1 From our own and time chartered fleet | 2 Delivery from H2 2023 IMO: International Maritime Organisation, LNG: Liquified Natural Gas
©2021, Rio Tinto, All Rights Reserved

Working with customers to meet societal demands
ESG transparency through START
− Transparency and traceability from mine to market
− Secure platform, built on blockchain
− Enabling consumers to make ESG-informed decisions, beyond carbon
©2021, Rio Tinto, All Rights Reserved 35
Government policyand markets responding to end-user demand

Solutions for a more sustainable future
Products for a greener world − Aluminium alloys for giga-casting in electric
vehicle manufacturing− Collaborating with InoBat across the full lithium
lifecycle, from mining through to recycling
Circular solutions to reduce emissions− Partnering with ABInbev to reduce emissions from packaging− Multi-product collaboration with Schneider Electric for
infrastructure and electric vehicles− Optimising market placement for critical minerals
(Li, Sc, Te, Se) extracted from our waste streams
©2021, Rio Tinto, All Rights Reserved 36
Li = Lithium, Sc = Scandium, Te = Tellurium, Se = Selenium
Simon TrottIron Ore
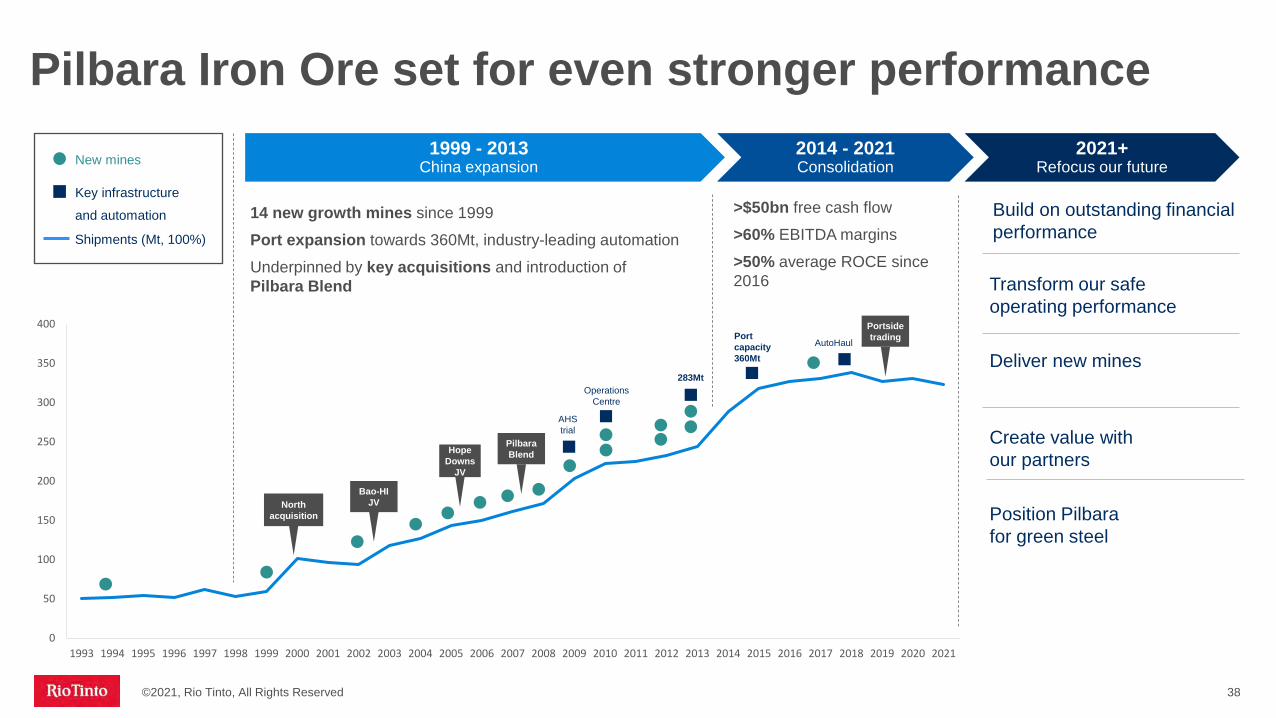
Pilbara Iron Ore set for even stronger performance
©2021, Rio Tinto, All Rights Reserved 38
0
50
100
150
200
250
300
350
400
1993 1994 1995 1996 1997 1998 1999 2000 2001 2002 2003 2004 2005 2006 2007 2008 2009 2010 2011 2012 2013 2014 2015 2016 2017 2018 2019 2020 2021
OperationsCentre
283Mt
AutoHaulPort capacity 360Mt
AHStrial
New mines
Key infrastructure
and automation
North acquisition
Bao-HI JV
Hope Downs
JV
Pilbara Blend
Portside trading
14 new growth mines since 1999 Port expansion towards 360Mt, industry-leading automation Underpinned by key acquisitions and introduction of Pilbara Blend Transform our safe
operating performance
Deliver new mines
Create value with our partners
Position Pilbarafor green steel
1999 - 2013China expansion
2014 - 2021Consolidation
2021+Refocus our future
>$50bn free cash flow>60% EBITDA margins>50% average ROCE since 2016
Shipments (Mt, 100%)
Build on outstanding financial performance

Raising our system capacity
©2021, Rio Tinto, All Rights Reserved 39
System capacity will be delivered by:- Rio Tinto Safe Production System driving
improved productivity- Improved interface efficiencies across mine,
plant, rail and ports- Modest capital investment, including two
additional rail consists
Requires commissioning of replacement mines, including Western Range, Bedded Hill Top and Hope Downs 2 and Brockman Syncline 1 to reach and sustain capacity
Max annualMt
338
338
338
338
Prior best performance
System
Ports
Rail
Mine
Mid term**Mt
345-360
350-360
360+
345-360
Estimated Capacity
Max month*Mt
370
362
393
362
Max quarter*Mt
349
351
357
351
*Annualised rates | ** Mid-term defined as upon completion of the next tranche of new and replacement mines

Mine productivity to mitigate higher work index
©2021, Rio Tinto, All Rights Reserved
Material movement (Bt)
The work index of our mining operations is increasing
1.01.2 1.4
2018 2021F 2024F
x
Effective flat haul* (km)
1114 15
2018 2021F 2024F
Work index (Bt.km)
36%42%
33%
2018 2021F 2024F
=
Below water table mining (%)
1217
21
2018 2021F 2024F
+
Initial gains in productivity – targeting further improvement
Truck EU (Index 2018 = 100)
100 105 115
2018 2021F 2024F
Payload (Index 2018 = 100) Digger MTBF (Index 2018 = 100)
100126 135
2018 2021F 2024F
Dewatering** (Index 2018 = 100)
100 109 117
2018 2021F 2024F*Average haul distance travelled by each truck – adjusted for gradient | ** Dewatering volumes increase as pit deepens | EU = Effective utilisation, MTBF = Meantime between failure
100 105 106
2018 2021F 2024F
40

Adjusting our operating practices to protect heritage
©2021, Rio Tinto, All Rights Reserved 41
Heritage site
Heritage site example Responding to new information
Shortest Route
New Haul Route
Removed from mine plan
A. 70 metre exclusion zone | B. 200 metre blast management zone | C. 350 metre blast management zone
A
B
C

Improving plant performance
©2021, Rio Tinto, All Rights Reserved
Increased plannedshutdownsHours, Index 2019 = 100
100 97
114
2019 2020 2021
Maintenance impacted by labour constraintsHours, Index 2019 = 100
Stabilising and addressing maintenance backlogOutstanding hours, Index 2019 = 100
100 117 120
2019 2020 2021
Focus areas to address maintenance backlog:- Shutdown alignment across system - Improved maintenance tactics and simplified maintenance schedules - Improved conveyor reliability though better rock breaking and targeted asset
improvementsCompleting the brownfield mine tie-ins will further improve plant performance
10080
98
2019 2020 2021
- COVID-19 restrictions impacted available labour in 2020 reducing maintenance hours
- 2021 labour availability improved but still constrained
42
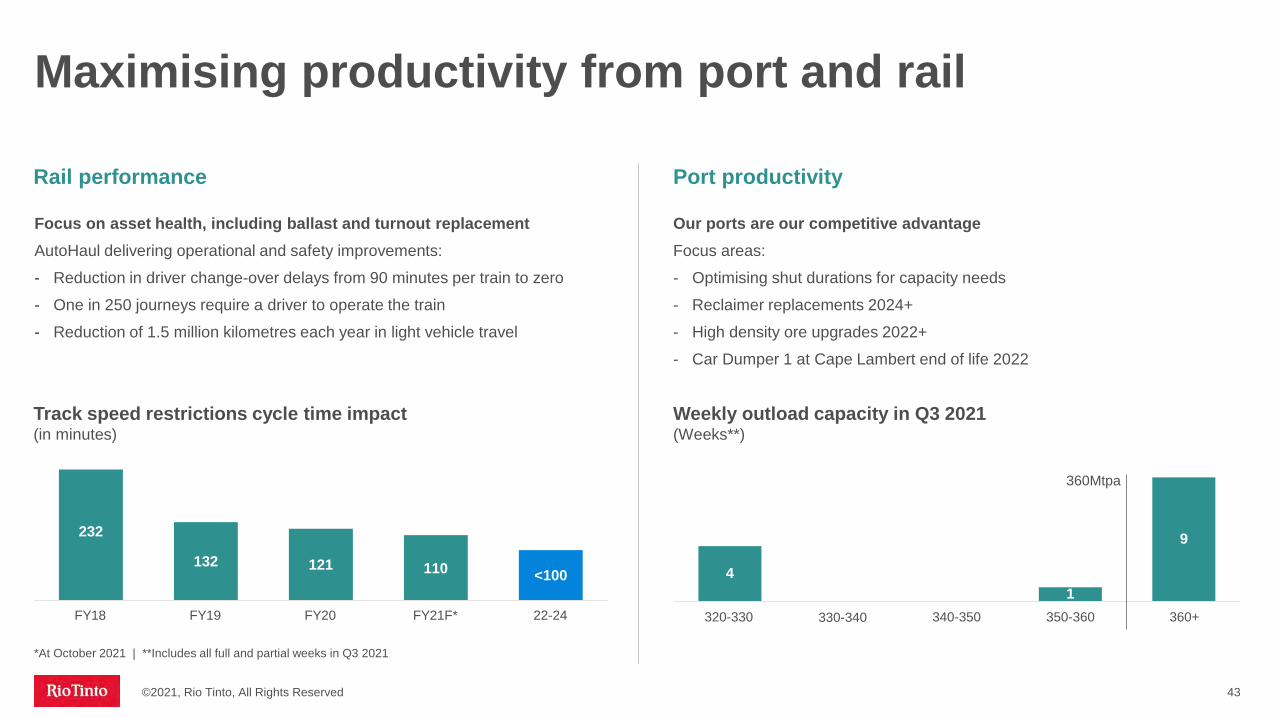
Focus on asset health, including ballast and turnout replacementAutoHaul delivering operational and safety improvements:- Reduction in driver change-over delays from 90 minutes per train to zero- One in 250 journeys require a driver to operate the train - Reduction of 1.5 million kilometres each year in light vehicle travel
Maximising productivity from port and rail
©2021, Rio Tinto, All Rights Reserved 43
Track speed restrictions cycle time impact (in minutes)
232
132 121 110 <100
FY20 22-24FY21F*FY18 FY19
Our ports are our competitive advantageFocus areas:- Optimising shut durations for capacity needs - Reclaimer replacements 2024+- High density ore upgrades 2022+- Car Dumper 1 at Cape Lambert end of life 2022
Rail performance Port productivity
41
9
340-350320-330 330-340 350-360 360+
360Mtpa
Weekly outload capacity in Q3 2021(Weeks**)
*At October 2021 | **Includes all full and partial weeks in Q3 2021

How we are improving our business
©2021, Rio Tinto, All Rights Reserved
Operational Readiness Rio Tinto Safe Production System
Commission and ramp up new assets
Reduce wait for feed at the crusher
Reduce materials handling losses
Reduce fixed plant unscheduled loss
Improve rail capacity and resilience
Dewatering
Drill and blast
Load and haul
Fragmentation
Feed strategy
Engineering and technology
Conveyor reliability
Shutdown productivity
Asset management
Asset health
Cycle time
Digital and technology
Focus area
Priorities
Value chainM in e
P o r t
R a il
Gudai-Darri
Robe Valley Sustaining
West Angelas C&D
Western Turner Syncline Phase 2
44

Operating and sustaining capital cost outlook
45
Key focus areas:- Asset reliability- Plant and rail asset health- Accommodation / camps- Systems including IT
0.5
0.91.1
1.3~1.5
2017 2018 2019 2020 2021
2021 cost guidance of $18-18.5/t Cost pressures continue:- Work index increase of 12% (from 2021 forecast)- Continued investment in asset health and reliability- Tight labour market driving higher rates- Diesel price (+23%, 2021F v 2020)- Cost of materials due to strong construction market and COVID-19 restrictions
10
14
18
22
2016 2017 2018 2019 2020 2021
Outlook for 2022 Investing in our assets
Unit cost history(US$/t)
2021 latest cost estimate (%) Sustaining capital investment(US$bn)
Pilbara Iron Ore Peers*
35
2012
20
13FTE labour
Contractor labour
Diesel and energy
Materials
Other
FTE = full time equivalent
©2021, Rio Tinto, All Rights Reserved
*Unit cost for peers are based off publicly available sales, revenue and EBITDA data, with adjustments made for comparison to RTIO's reporting method and products
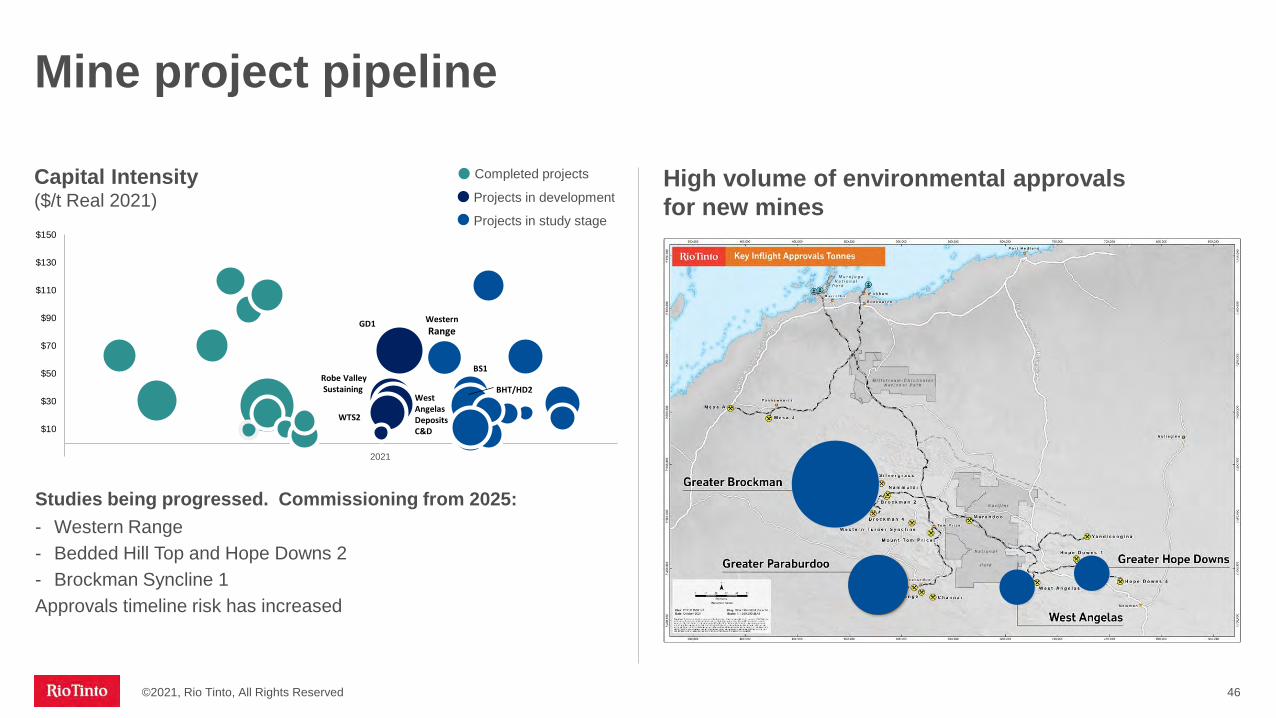
Mine project pipeline
©2021, Rio Tinto, All Rights Reserved 46
High volume of environmental approvalsfor new mines
Studies being progressed. Commissioning from 2025:- Western Range- Bedded Hill Top and Hope Downs 2 - Brockman Syncline 1 Approvals timeline risk has increased
Completed projects
Projects in development
Projects in study stage
Capital Intensity ($/t Real 2021)
-$10
$10
$30
$50
$70
$90
$110
$130
$150
2004 2009 2014 2019 2024 2029 2034
WesternRange
GD1
Robe ValleySustaining
West AngelasDeposits C&D
WTS2
BHT/HD2
BS1
2021

Ongoing focus on quality and product mix
©2021, Rio Tinto, All Rights Reserved 47
5% 3% 9% 6%8% 9%
8% 10%
17% 17%18%
13%
24% 23%20% 27%
45% 47% 45% 45%
SP10 RV HIY PBL PBF
YTD 21FY20
Shipments by product(%)
FY24F
Consistent quality remains key for our Pilbara Blend. Demand remains strong, and will continue to underpin our product strategy
Pilbara Blend quality maintained by:- Blending different ore sources to
tight specifications- Producing lower quality products
(including SP-10) as required
RV = Robe Valley, PBL: Pilbara Blend Lump, PBF: Pilbara Blend Fines | 2021 YTD at 30 September 2021
FY19
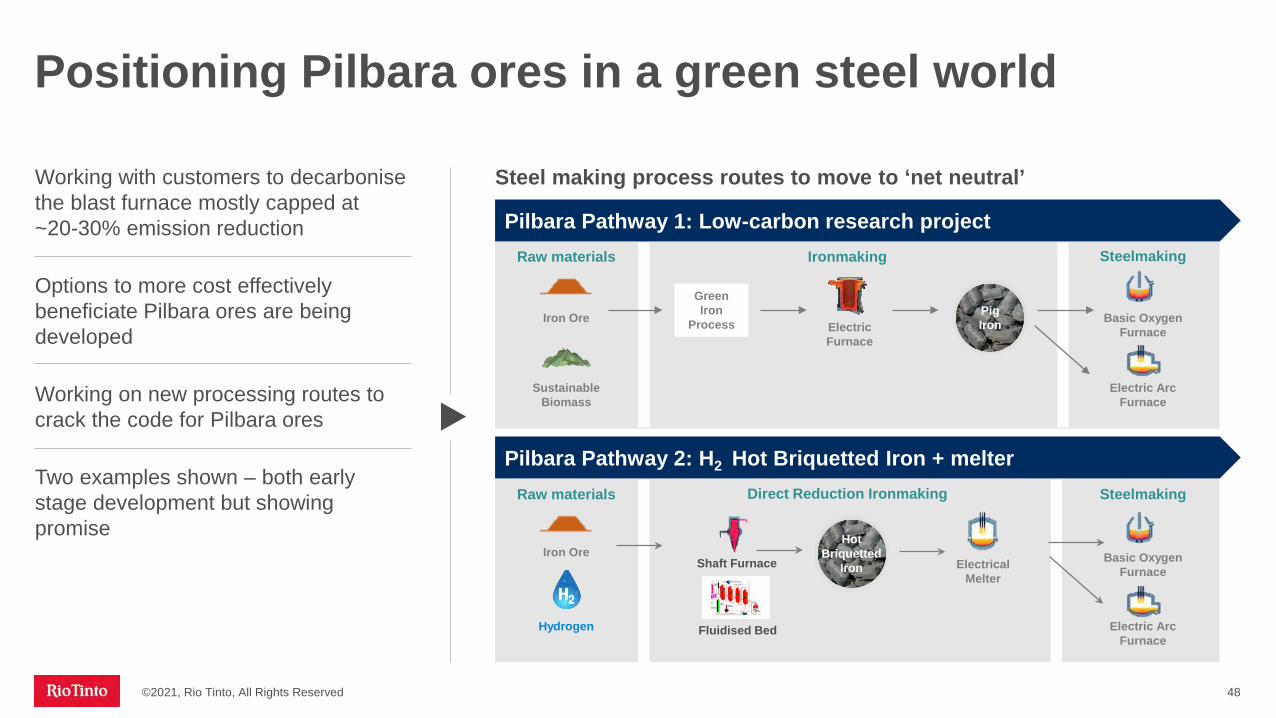
Positioning Pilbara ores in a green steel world
©2021, Rio Tinto, All Rights Reserved 48
Steel making process routes to move to ‘net neutral’Working with customers to decarbonise the blast furnace mostly capped at ~20-30% emission reduction
Options to more cost effectively beneficiate Pilbara ores are being developed
Working on new processing routes to crack the code for Pilbara ores
Two examples shown – both early stage development but showing promise
Raw materials Ironmaking Steelmaking
Iron OreElectricFurnace
Basic Oxygen Furnace
Electric ArcFurnace
PigIron
Sustainable Biomass
Green Iron
Process
Pilbara Pathway 1: Low-carbon research project
Pilbara Pathway 2: H2 Hot Briquetted Iron + melterRaw materials Direct Reduction Ironmaking Steelmaking
Iron Ore
Hydrogen
Electrical Melter
HotBriquetted
Iron
Fluidised Bed
Shaft Furnace Basic Oxygen Furnace
Electric ArcFurnace
\\\

Strengthening partnerships
49
Traditional OwnersWorking together to build a better future through employment, business and caring for country and cultureEmbedding cultural competency and heritage management into The Way We WorkAsset General managers now responsible for Traditional Owner relationshipsModernising agreements
Supporting thriving communities through economic development and employment:- Direct shipping into Dampier- Automation qualifications and education
pathwaysPartner with State Government to provide logistics support for COVID-19 vaccinations across the Pilbara
Building local capacity - using local suppliers to build rail ore cars, a first in the industry Long-term partnerships and outcomes such as the partnership with Royal Flying Doctor Service
Local Communities Western Australia
©2021, Rio Tinto, All Rights Reserved

Becoming the most valued resource business
©2021, Rio Tinto, All Rights Reserved 50
Deliver new mines of the future
Optimise Pilbara capacity,product mix and development sequence
Social licenceCreate value with our partnersConnect, partner and restore
trust with the community
Transform our safe operating performance
Empower our workforcethrough Rio Tinto SafeProduction System
Excel in development
Bestoperator
Position Pilbarafor green steel
Decarbonise the Pilbara and position our oresto participate in Green Steel
Impeccable ESG credentials
People at our heart Shift from ‘asset focus’
to ‘people focus’

Ivan VellaAluminium

Over a hundred years of aluminium expertise
©2021, Rio Tinto, All Rights Reserved 52
1950 1965
1980-90 2014
Technologicalexpertise
Engineeringexcellence
Partnershipand innovation

A structurally advantaged integrated business
©2021, Rio Tinto, All Rights Reserved 53
4 bauxite mines
56.1Mt*
Australia, Braziland Guinea
4 alumina refineries
8.0Mt*
Australia, Braziland Canada
14 aluminium smelters, 80% renewables
3.1Mt*
Australia, Canada, Iceland, New Zealand and Oman
7 hydro plants
4.1GW
Supporting ourassets in Canada
Bauxite Alumina AluminiumEnergy
*2020 production

The most profitable integrated Aluminium business
©2021, Rio Tinto, All Rights Reserved 54Jadar project geologists
6%
10%8%
4% 3%
12%
34%37%
20%24%
30%
36%
0%
5%
10%
15%
20%
25%
30%
35%
40%
2016A 2017A 2018A 2019A 2020A 2021 H1
ROCE EBITDA Margin
1Upstream assets includes bauxite, alumina and primary metal
36%
0
10
20
30
40
16H2
17H1
17H2
18H1
18H2
19H1
19H2
20H1
20H2
21H1
Competitor Margins Rio Tinto Aluminium
EBITDAMargin H1 2021
Historic supply growth created challenging conditionsMt
Integrated Upstream1
EBITDA Margin(%)
Integrated EBITDAMargin & ROCE (%)
RoW China
Source: Rio Tinto Market Analysis and peer disclosures
Peers
2009
2000
2001
2002
2003
2007
2004
2005
2006
2008
2011
2014
24
2012
2013
2016
2017
2018
24
2019
2020
2015
2628
57
3033 34
38 4038
2010
46 4850
54
59
42
5.1%
64 64 63 65
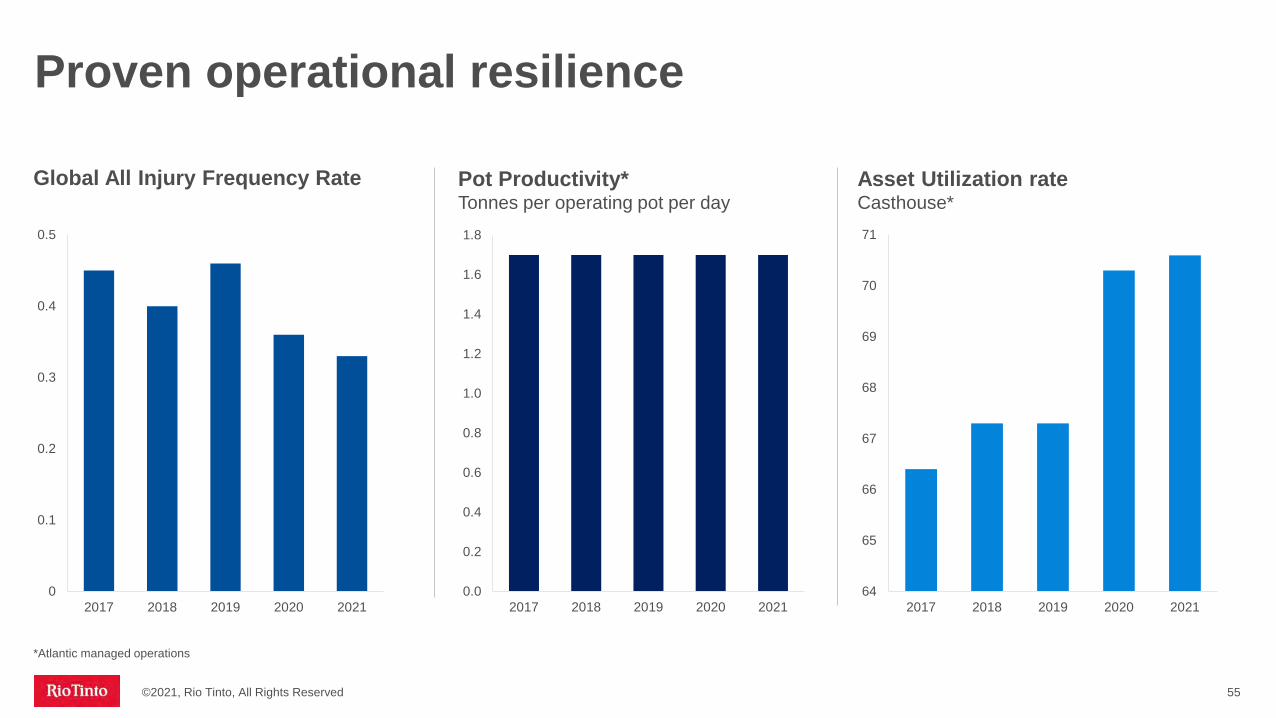
Proven operational resilience
©2021, Rio Tinto, All Rights Reserved 55
0.0
0.2
0.4
0.6
0.8
1.0
1.2
1.4
1.6
1.8
2017 2018 2019 2020 202164
65
66
67
68
69
70
71
2017 2018 2019 2020 20210
0.1
0.2
0.3
0.4
0.5
2017 2018 2019 2020 2021
*Atlantic managed operations
Global All Injury Frequency Rate Pot Productivity* Tonnes per operating pot per day
Asset Utilization rateCasthouse*

*Includes managed operations in Saguenay region.**9 months annualised
1,078 1,094
1,104 1,113 1,106 1,127
1,138 1,116
1,137
2013 2014 2015 2016 2017 2018 2019 2020 2021
~1% 1,175
Continuing to improve our business
56
Processing technology development in the areas of impurities
Exploratory work on alternativetechnologies for silica
Processing technology to reduceproduct moisture
Positioned for low CO2 metal demandAccess to structurally short US market
Optimising business through data analytics and advanced process control
Saguenay integrated operations centre
Using machine learning and automationto maximise scrap remelting opportunities
Further leveraging data analytics
Flex power – modulating smelter power demand
1st quartile bauxite mines leveraging R&D
Automating our casting process1st decile hydro-powered smelters*
Production creep**
©2021, Rio Tinto, All Rights Reserved

Aluminium supply by source (global)Mt
Potential for positive structural change in the market from energy and smelting caps in China
©2021, Rio Tinto, All Rights Reserved 57
Primary Aluminium supply (China)Mt
Non-Renewables, Primary Recycled ContentRenewables, Primary
90
58
35 36 38 4043
4749
54 54
6167
7175
7882
8591 92 91
2003
2001
2000
2011
2014
2002
2004
2009
2006
2007
2008
2010
2012
2019
2013
2015
2016
2017
2018
2020
2005
4.8%
CAGR: 4.2%
CAGR: 2.6%
CAGR: 6.8%
Renewables Inventory (RHS)Non Renewables
0
1
2
3
4
5
6
7
8
9
35
15
25
10
0
5
30
20
40
2010
China Primary Aluminium Supply, Mt Weeks of consumption
2000
2001
3231
7
2003
2004
2005
2011
2006
2007
2008
2009
2013
2012
2016
2014
2015
2017
2018
2002
2019
2020
2 34 6
9 9
14 14
1720
2225
28
36 36 3537
13
Sources: Rio Tinto Market Analysis, CRU, IAISources: Rio Tinto Market Analysis, CRU, IAI.Renewables include hydropower and other renewables. Non-Renewables include coal, gas, and nuclear.

Sources: Rio Tinto Market Analysis, CRU
New coal-powered smelting likely to be challenged
©2021, Rio Tinto, All Rights Reserved
Total metal required*Mt
7563
2025
25
2020
3643
79
2030
88
111122
3.3%
Recycled
Primary
CAGR:2.3%
CAGR:5.5%
*Global semis production including melt loss
Hydro Coal
2030$100/t
330
200290
2021e
100
2021e 2030$50/t
290700
750
770
2030$50/t
1490
770
2030$100/t
1,1901,420
2,630
1,520 1,650
3,370
Other costs
Power costs
Carbon costs
Carbon priceassumption
Aluminium smelter all-in cash costs(Real US$2021 per tonne)
All non-carbon costs are regional weighted averages from CRU, 2021 (long-run uses 2030 costs). Hydocosts are based on a weighted average of Canadian smelters. Coal costs are based on a weighted average of Chinese smelters from Shandong, Shanxi, Xinjiang and Inner Mongolia.
58

Smelting requires uninterrupted energy, increasing the technical difficultyof a transition without hydro-power…
…but regions with high-quality renewables and a coordinated approach can createvalue in the transition
Switching our Australian smelters to renewables
59
Typical energy requirements for large-scale aluminium smelter World-class solar and wind resources
Ability to create a coordinated solution to support heavy industry transition
Internationally competitive renewables and skilled industrial workforce provides regional advantage. Signed Statement of Cooperation with Queensland Government
OR +1GW hydro
Firmingsolutions
1 Renewables requirements vary by region, mix of wind and solar and system design
©2021, Rio Tinto, All Rights Reserved
~4GW renewables1

02468
1012141618
Rio
Tin
to A
tlant
ic
Peer
A
Peer
B
Peer
C
Peer
D
RoW
Peer
E
Peer
F
Rio
Tin
to P
acifi
c
Glo
bal
Chi
na
Peer
G
Peer
H
Decarbonising the aluminium supply chain
60
Producing the lowest CO2 per tonne
Lowest footprint alumina refinery in the world
P1020 metal grade or better
On track for commercial scale technologyin 2024
Green hydrogen a substitute to natural gas
Potential to underpin 10% Rio Tinto group-wide decarbonisation
Already lowest CO2 emissions Hydrogen calcination Commercialising ELYSISTM
The graph is on an equity basis for Rio Tinto and all the other individual producersSource: CRU includes direct emissions (Scope 1) and indirect from electricity generation (Scope 2)
2021 - Total emission tCO2/t
©2021, Rio Tinto, All Rights Reserved

Carbon free Responsible Traceable Circular
Green materials need to be more than carbon free
61
Recyclable material that retain its properties
Recycling pilots in Quebec
Produced with respect and care for host communities, partners, first nations and environment
Zero carbon throughthe full lifecycleof production
Decarbonisation of Australian Smelters
Materials identifiable and traceable throughout lifecycle
©2021, Rio Tinto, All Rights Reserved

Strengthening our social licence
©2021, Rio Tinto, All Rights Reserved 62
Mutual Respect Agreement with Mashteuiatsh for 20 years
Joint business opportunities with First Nations in Quebec and British Columbia
Long-term relationships with Traditional Owners in Weipa and Gove
Treatment technology developed by RTA
Treat spent pot lining of the Canadian Al industry and reuse in the cement industry
Convert Anhydrate by-product into a fertiliserused in blueberry crops
First nationsand communities
Vaudreuilfilter press
Turning waste intovaluable resources
Reduce red mud waste volume
Eliminate slurry pond storage
Stable red mud disposal sites

Opportunities to leverageour attractive foundation
©2021, Rio Tinto, All Rights Reserved
Tier 1 bauxite resource with options to expand and improve cost position
Deep technical and processing expertise
Growing smelting capacity requires more green power
Working with customers to meet their specific needs
Improve capital intensity of future investments
ELYSISTM commercial maturity in 2024
Recycling is an opportunity to enhance our profitability and relevance to customers
63

Positioned to thrive in a low-carbon environment
©2021, Rio Tinto, All Rights Reserved 64
- Integrated business with Tier 1 assets
- Advantageous renewables position
- Strong history with world-class technical expertise
- Operational stability
Strong foundation
- Accelerate zero carbon, zero waste
- Empowering our people to be the Best Operator
- Optimise capital intensity
- Build strong connections with our partners and stakeholders
- Pursue options for increased profitability orgrowth
Clear strategy
- Potential structural change in the market
- ELYSISTM – net zero aluminium smelting
- Switching Australian smelters to renewables
- Long-life Tier 1 resource in bauxite
- Long-life hydropower assets
- Well positioned for North American market
Attractive future
Excel in development
Impeccable ESG credentials
Strengthening our social licence
Best operator

The Saguenay, Canada
Peter CunninghamPerformance, investment and shareholder returns

14.1
11.3 10.0
9.3 9.3 8.0
5.6 4.9 4.8
1.6
-3.1
Jun-16
Dec-16
Jun-17
Dec-17
Jun-18
Dec-18
Jun-19
Dec-19
Jun-20
Dec-20
Jun-21
Pro-forma net debt*
8.5
13.911.8
14.9 15.9
26.6
5.8
9.57.0
9.2 9.4
19.4
2016 2017 2018 2019 2020 2021*
Operating cash flow Free cash flow
We are in very robust financial health
19%
11%
0%
15%
30%
2016 2017 2018 2019 2020
Rio Tinto PeersRio Tinto average Peers average
Investing consistently and with discipline through the cycle
66
ROCE (post-tax) – outperforming our peers Attractive cash flows$bn
Strong balance sheetNet debt (cash) $bn
Peers: BHP, Vale, Anglo American and Glencore | *Consensus (Visible Alpha, 15 October 2021) | **Pro-forma net debt (cash) adjusts for the remainder of previously announced buy-backs from operations, lags in shareholder returns from disposal proceeds, Australian tax lag (December only) and disposal-related tax lag and the impact of IFRS 16 Leases accounting change for the prior periods. This lease accounting change is reflected in the June and December 2019 reported net debt
Maintain a strong balance sheet. Focus on “Single A” credit metrics
We can grow and invest in decarbonisation whilst continuing to pay attractive dividends to shareholders –in line with our policy
©2021, Rio Tinto, All Rights Reserved
*

©2021, Rio Tinto, All Rights Reserved 67
Actions in place to improve our performance
Operating performance not where we want it to be
Rigorous performance management
Deploying Rio Tinto Safe Production System
Building capability acrossthe organisation
Increasing our capital allocation towards sustaining
Focused on risk management
Copper equivalent production for the nine months to September*Million tonnes
*Excludes divested assets
3.9 3.8 3.8 3.6
2019 2020 20212018
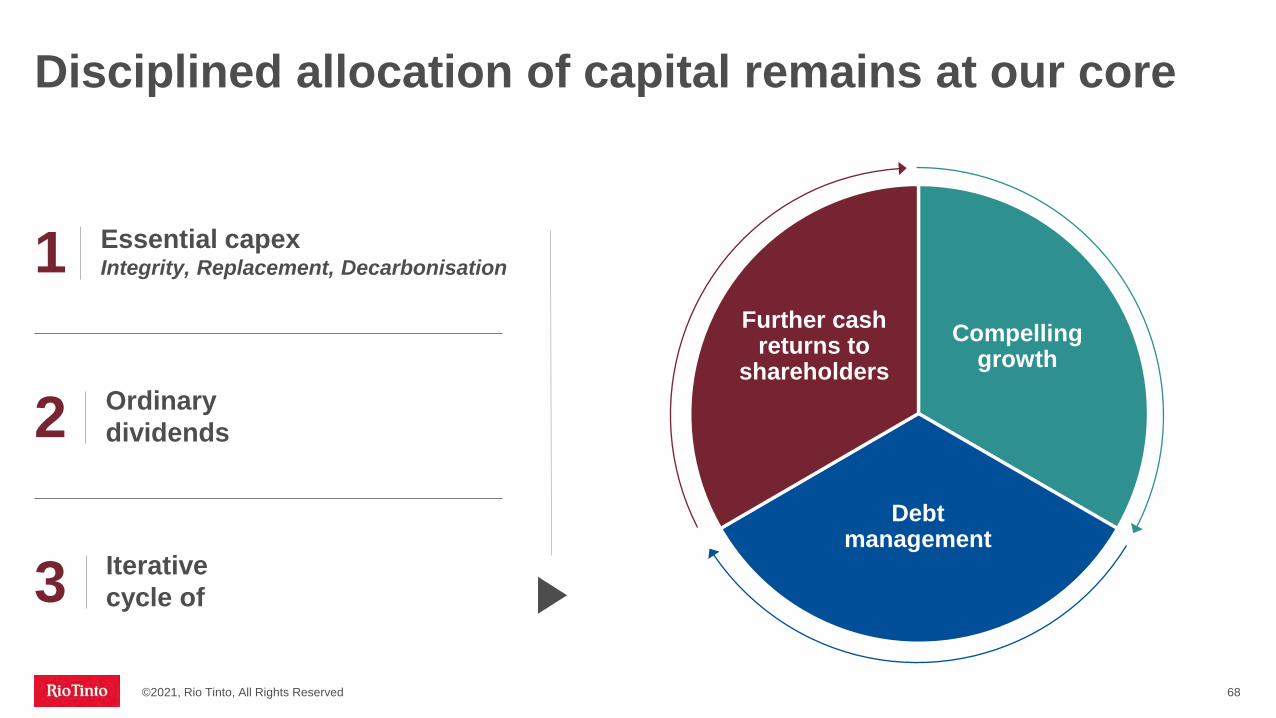
Disciplined allocation of capital remains at our core
68
Essential capexIntegrity, Replacement, Decarbonisation1
Ordinary dividends2
Iterative cycle of3
Further cash returns to
shareholdersCompelling
growth
Debtmanagement
©2021, Rio Tinto, All Rights Reserved

Maintaining our rigorous approach to investments
©2021, Rio Tinto, All Rights Reserved 69
Product Group level governance and investment committees
Final decision
Scenario based NPV, IRR, payback ranges
Detailed Risk assessment (including ESG)
Commodities which enable the energy transition
Decarbonisation
Independent Economics team sets prices
(including carbon), global scenarios and
discount rates
Independent business and technical teamsEvaluation committee
Controlled risk taking allows for more opportunities
Using a range of criteria across different investment opportunities
IntegrityRigorous assessment of options
DecarbonisationCapital intensity of CO2 reduction | Cost of capital
GrowthEmbedded options | Cost position| Valuation
M&AEmbedded options | Cost position | Strategic fit | Right owner| Valuation
Investmentthemes
Evaluation criteria
Set ranking criteria
Opportunity development
Projectreview
Investment Committee
Board

Reinvesting for growth and decarbonisation
70
5.46.2
~7.5~8.0
2018A 2019A 2020A 2021F 2022F 2023F 2024F
Sustaining Decarbonise our assets Pilbara replacementOther replacement Growth Ambition
~9.0-10.0
Capital expenditure profile$bn
5.5
Depreciation
~9.0-10.0
Sustaining capital of ~$3.5bn per year including Pilbara Iron Ore of ~$1.5bn
~$0.5bn per year to decarbonise our assets from 2022 to 2024
Total decarbonisation investmentof ~$7.5bn* from 2022 to 2030, predominantly in second halfof decade
Ambition to grow and decarbonisereflected in 2023-24 capex of up to ~$9-10bn including up to $3bn in growth spending, depending on opportunities
Replacement spending unchanged at $2-3bn per year
*Conceptual view of capital requirements at October 2021. Marginal Abatement Cost Curves (MACC) will be updated on an annual basis
©2021, Rio Tinto, All Rights Reserved

Broad-based funding modelfor decarbonisation
71
Operating expenditure
Pilbara energy system | ELYSISTM
implementation capital | MACC projects
New capability | Energy efficiency | R&D
Pacific Aluminium smelters and refineriesKennecott
Operating expenditure
Capital expenditure~$7.5bn over 2022-30
Long-term contracts
Partnerships* Green steel: 25 existing R&D partnerships –more targeted
Examples provided under each category of funding is not an exhaustive list and options for decarbonisation will continue to evolve.*Funding model to be determined. MACC = Marginal Abatement Cost Curve
©2021, Rio Tinto, All Rights Reserved

Consistent five-year record of shareholder returns
Pay-out ratio policy de-risks the company
60% average pay-out on ordinarydividend over past 5 years
73% average pay-out in total
Our financial strength allows us to simultaneously:− reinvest for growth− accelerate our own
decarbonisation− continue to pay attractive
dividends to shareholders in line with our policy
Attractive dividends remain paramount
72
Excluding divestment proceeds returned to shareholders
0
20
40
60
80
100
2016-20202020 H1 20212016 2017 2018 2019
Ordinary dividend Additional return Interim ordinary dividend
Shareholder returns of 40-60% of underlying earnings on average through the cyclePay-out ratio (%)
©2021, Rio Tinto, All Rights Reserved

Outstanding foundation Clear strategy Compelling investment proposition
Impeccable ESG credentials
Excelin Development
Strengthening our social licence
Best operator
Strong foundation for growth, decarbonisation and shareholder returns
73
- No fossil fuel extraction
- Long-life assets producing vital commodities
- Resilient cash flows through the cycle
- Capital discipline
- Robust financial position
- Advantageous renewables position
- World-class pipeline of projects and exploration
- Accelerate our own decarbonisation
- Grow in materials enabling the global energy transition
- Develop products and services that helpour customers to decarbonise
- Deliver value-adding growth
- Continue to pay attractive dividends in line with our policy
- Attractive partner to our customers and host countries
- Reduce risks by accelerating our own low-carbon transition
- Maintain financial strength and resilience
©2021, Rio Tinto, All Rights Reserved
Appendices
Jadar project, Loznica, Serbia
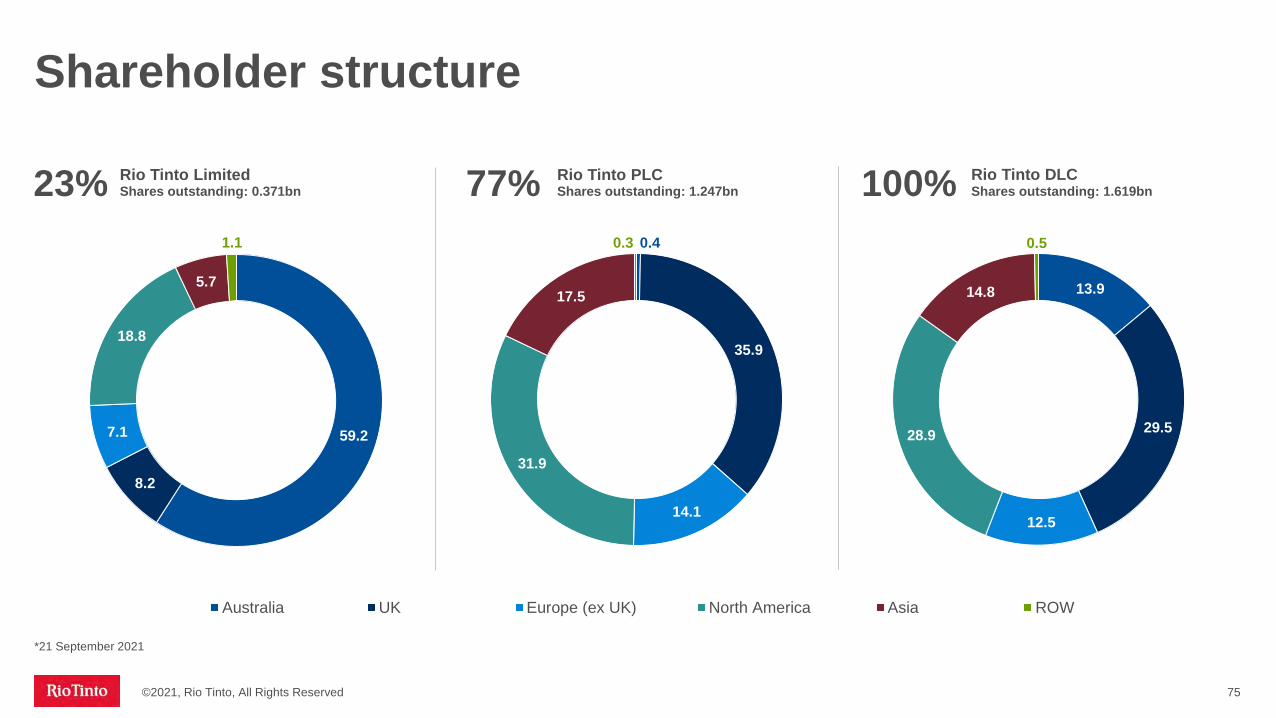
59.2
8.2
7.1
18.8
5.7
1.1
Australia UK Europe (ex UK) North America Asia ROW
Shareholder structure
©2021, Rio Tinto, All Rights Reserved 75
0.4
35.9
14.1
31.9
17.5
0.3
13.9
29.5
12.5
28.9
14.8
0.5
Shares outstanding: 1.247bnRio Tinto Limited Rio Tinto PLC Rio Tinto DLCShares outstanding: 0.371bn23% 77% 100% Shares outstanding: 1.619bn
*21 September 2021

Debt maturity profile30 June 2021 debt maturity profile*
©2021, Rio Tinto, All Rights Reserved 76
$ million Average outstanding debt maturity of corporate bonds at ~12 years (~ 9 years for Group debt)
No corporate bond maturities until 2024
Liquidity remains strong under stress tests
$7.5bn back-stop Revolving Credit Facility extended to November 2023 and remained undrawn throughout the pandemic
0
200
400
600
800
1,000
1,200
1,400
1,600
1,800
2,000
2021
2022
2023
2024
2025
2026
2027
2028
2029
2030
2031
2032
2033
2034
2035
2036
2037
2038
2039
2040
2041
2042
2043
+
External borrowings Leases
*Numbers based on June 2021 accounting value. The debt maturity profile shows $1.1 billion of capitalised leases under IFRS 16.

Group level financial guidance
©2021, Rio Tinto, All Rights Reserved 77
FY2021 FY2022 FY2023 FY2024
CAPEX
Total Group ~$7.5bn ~$8.0bn ~$9.0 – 10.0bn ~$9.0 – 10.0bn
Sustaining Capex Group ~$3.5bn ~$3.5bn ~$3.5bn ~$3.5bn
Pilbara SustainingCapex ~$1.5bn ~$1.5bn ~$1.5bn ~$1.5bn
• $0.5bn per year to decarbonise our assets from 2022 to 2024• Total decarbonisation investment of ~$7.5bn* from 2022 to 2030, predominantly in second half of decade• Ambition to grow and decarbonise reflected in 2023-24 capex of $9-10bn including up to $3bn in growth
spending, depending on opportunities• Replacement spending $2-3bn per year
Effective tax rate 30%
Returns Total returns of 40 – 60% of underlying earnings through the cycle
*Conceptual view of capital requirements at October 2021. Marginal Abatement Cost Curves (MACC) will be updated on an annual basis

Product group level guidance
©2021, Rio Tinto, All Rights Reserved
2021 production guidance1 2021 costs
Iron Ore Shipments
320 – 325mt2(100% basis)
$18.0-18.5/wmt (FOB), based on an Australian dollar exchange rate of $0.75
CopperMined CopperRefined Copper
~500kt3190 – 210kt4
C1 Copper unit costs 75-80 US c/lb
AluminiumBauxiteAluminaAluminium
54 – 55mt67.8 – 8.2mt3.1 – 3.3mt
Modelling guidance provided for Canadian smelters only (see slide 80)
MineralsTiO2
IOC pellets and concentrate8
B2O3
Diamonds
~1.07
9.5 – 10.5mt~0.5mt
3.0 – 3.8m carats5
1 Rio Tinto share unless otherwise stated. 2 Pilbara shipments guidance remains subject to COVID-19 disruptions including risks around mandatory vaccination for the resources industry in Western Australia as of 1
December, and risks around commissioning of new mines and management of cultural heritage.3 Remains subject to COVID-19 disruptions and risks around mine plan sequencing following geotechnical issues at Kennecott.4 Reduction reflects a Kennecott smelter incident in September resulting in force majeure on customer contracts.5 Diamonds 2021 guidance and actuals are for Diavik only for comparability, following Argyle closure in 2020. Unadjusted Diamonds production for 2020 was 14.7 million carats,
including both Diavik and Argyle operations.6 Reduction reflects equipment reliability issues and operational instability at the Pacific mines.The focus in the fourth quarter is on the recovery of plant equipment availability and
asset health to support 2022 performance.7 Full year titanium dioxide slag production guidance has been reinstated following stabilisation of the security situation at Richards Bay Minerals in South Africa and resumption of
operations.8 Iron Ore Company of Canada.
78

Modelling EBITDA
©2021, Rio Tinto, All Rights Reserved 79
Underlying EBITDA sensitivity
Average published price/exchange rate for 2021 first half
US$ million impact on full year 2021 underlying EBITDA of a 10% change in prices/exchange rates
Copper 413c/lb 478
Aluminium $2,245/t 784
Gold $1,805/oz 77
Iron ore realised price (62% Fe CFR freight-adjusted) $168.4/dmt 4,180
A$ 0.77US$ 665
C$ 0.80US$ 249
Oil (Brent) $65/bbl 112
Note: The sensitivities give the estimated effect on underlying EBITDA assuming that each individual price or exchange rate moved in isolation. The relationship between currencies and commodity prices is a complex one and movements in exchange rates can affect movements in commodity prices and vice versa. The exchange rate sensitivities include the effect on operating costs but exclude the effect of revaluation of foreign currency working capital.

Modelling aluminium costs
©2021, Rio Tinto, All Rights Reserved 80
Canadian* smelting unit cash** cost sensitivity
($/t) Impact a $100/t change in each of the input costs below will have on our H1 2021 Canadian smelting unit cash cost of $1,262/t
Alumina (FOB) $191
Green petroleum coke (FOB) $27
Calcined petroleum coke (FOB) $36
Coal tar pitch (FOB) $8
* Canadian smelters include all fully-owned smelters in Canada (Alma, AP60, Arvida, Grande-Baie, Kitimat, and Laterrière), as well as Rio Tinto’s share of the Becancour and Alouette smelters ** The smelting unit cash costs refer to all costs which have been incurred before casting, excluding depreciation but including corporate allocations and with alumina at market price, to produce one metric tonne of primary aluminium.
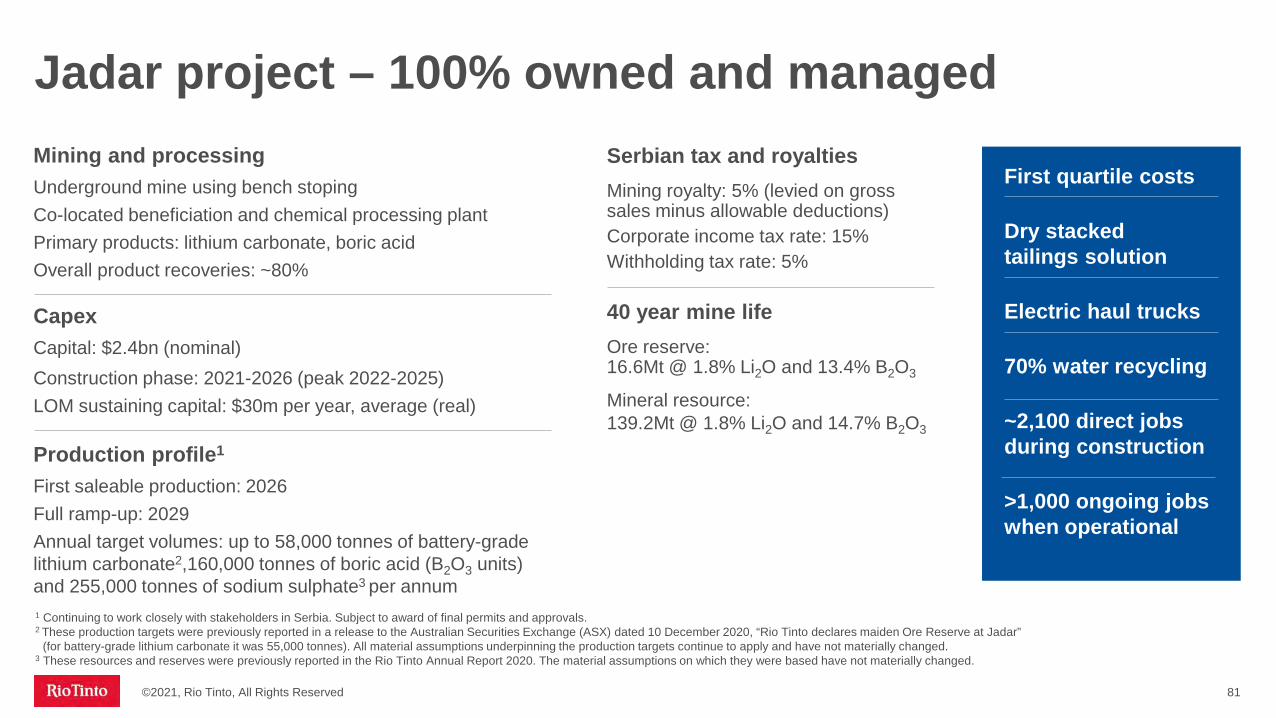
Jadar project – 100% owned and managed
©2021, Rio Tinto, All Rights Reserved 81
First quartile costs
Dry stacked tailings solution
Electric haul trucks
70% water recycling
~2,100 direct jobs during construction
>1,000 ongoing jobs when operational
1 Continuing to work closely with stakeholders in Serbia. Subject to award of final permits and approvals.2 These production targets were previously reported in a release to the Australian Securities Exchange (ASX) dated 10 December 2020, “Rio Tinto declares maiden Ore Reserve at Jadar”
(for battery-grade lithium carbonate it was 55,000 tonnes). All material assumptions underpinning the production targets continue to apply and have not materially changed.3 These resources and reserves were previously reported in the Rio Tinto Annual Report 2020. The material assumptions on which they were based have not materially changed.
Mining and processingUnderground mine using bench stopingCo-located beneficiation and chemical processing plantPrimary products: lithium carbonate, boric acidOverall product recoveries: ~80%
Production profile1
First saleable production: 2026Full ramp-up: 2029 Annual target volumes: up to 58,000 tonnes of battery-grade lithium carbonate2,160,000 tonnes of boric acid (B2O3 units) and 255,000 tonnes of sodium sulphate3 per annum
Serbian tax and royaltiesMining royalty: 5% (levied on gross sales minus allowable deductions)Corporate income tax rate: 15%Withholding tax rate: 5%
40 year mine lifeOre reserve: 16.6Mt @ 1.8% Li2O and 13.4% B2O3
Mineral resource: 139.2Mt @ 1.8% Li2O and 14.7% B2O3
CapexCapital: $2.4bn (nominal)Construction phase: 2021-2026 (peak 2022-2025)LOM sustaining capital: $30m per year, average (real)

RTA Value Chain – 2020 Actuals
©2021, Rio Tinto, All Rights Reserved 82
RTAIntersegment
3rd Party Sales
Mining Aluminium Casting
Bauxite39.4 dmt
30% 80%
100%70% 20%
57%
Bauxite56.1 dmt
Refining
Alumina8.0mt
Alumina1.6mt VAP Non-VAP
43%
Aluminium3.2mt
CasthouseProdn

©2021, Rio Tinto, All Rights Reserved 83
T = Tonne
Mt = Million tonnes
Gt = Giga tonnes
tCO2 = Tonne of carbon dioxide
tCO2 e = Tonne of carbon dioxide equivalent
P.a = Per annum
Mtpa = Million tonnes per annum
CO2 = Carbon dioxide
GHG = Greenhouse gas
Mwh = Megawatt hour
MW = Megawatt
GW = Gigawatt
Common acronyms
ROCE = Return on capital employed
EBITDA = Earnings Before Interest, Taxes, Depreciation and Amortisation
CAGR = Compound annual growth rate
USD = United States dollar
Bn = Billion
NPV = Net present value
ESG = Environmental, Social, and Governance
IRR = Internal rate of return
R&D = Research and development
VAP = Value-added product

©2021, Rio Tinto, All Rights Reserved 84
Increasing transparency for our stakeholdersA commitment to reporting on:
Ongoing progress against our own commitments and internal work-streams external obligations and recommendations.
The enhanced governance arrangements in place to oversee the company’s progress against these actions.
How Traditional Owners’ views are being sought and considered in shaping these commitments and Traditional Owners’ perspectives on how successfully these commitments are being met.
How the company is working to advocate for enhanced sector-wide cultural heritage management and how this is consistent with our internal standards.

85©2021, Rio Tinto, All Rights Reserved
Working to improve in multiple areas
1 Remedying and rebuilding our relationship with the PKKP people
2 Partnering with Pilbara Traditional Owners in modernising and improving agreements
3 Establishing the new Communities and Social Performance model
4 Building local capability and capacity to support the site General Manager
5 Improving our governance, planning and systems where it relates to communities
6 Reducing barriers to, and increasing, Indigenous employment
7 Increasing Indigenous leadership and developing cultural competency within Rio Tinto
8 Establishing a process to redefine and improve cultural heritage management standards
9 Establishing an Australian Advisory Group
10 Elevating external consultation
11 Elevating employee engagement

86
Establishing an Australian Advisory Group
The AAG aims to:- Introduce more diversity and breadth of views- Increase the awareness of leaders within Rio Tinto to make fully informed decisions- Act as a sounding board for Rio Tinto on knowledge, practices, and perspectives with a particular
focus on Indigenous issues- Provide coaching, mentoring and advice to senior leadership- Identify ways to improve the culture within Rio Tinto
(previously called Indigenous Advisory Group)
We are establishing an Australian Advisory Group (AAG) to help shape, influence and support our approach to issues that are important to Indigenous peoples, the Australian community and our business.
Specific actions
©2021, Rio Tinto, All Rights Reserved
We have:
Committed to a US$50 million investment to retain, attract and grow Indigenous professionals and leaders in our business
Increased Indigenous leaders from 6 to 19 across Australia
Increased our 2021 target to recruit 50 Indigenous leaders
Launched a leadership development programme in Australia, with over 200 Indigenous employees enrolled
Implemented a two-way Indigenous mentoring programme
Launched an Australia-wide Indigenous employee networking programme
Awarded Indigenous university scholarships to students in the fields of environmental science and engineering
87
Reducing barriers to and increasing Indigenous employmentSpecific actions
©2021, Rio Tinto, All Rights Reserved
Specific actions
We have:Increased number of CSP professionals from 250 to 300, working in 65 sites and 35 countries
Restructured reporting lines so field based CSP professionals report to their line managers
Established a central CSP Area of Expertise with technical subject matter experts
Established a senior leadership team comprising CSP leaders from all product groups, exploration, projects, closure and Indigenous Affairs
88
Establishing the new Communities and Social Performance model
©2021, Rio Tinto, All Rights Reserved

Specific actions
Preliminary discussions with ten Pilbara Traditional Owner groups in relation to agreement moderisation
Identified key principles for consideration in modernisingagreements
Signed engagement protocols that provide a scope and framework of the modernisation work with four of the Traditional Owner groups
Continuing to work with Traditional Owners to enhance benefits that flow to communities
Partnering with Pilbara Traditional Owners in modernising and improving agreements
©2021, Rio Tinto, All Rights Reserved 89

Building local capability and capacity to support the site General Manager
Iron Ore Chief Executive has the overall accountability for Traditional Owner relationships and heritage matters for the product group
Site General Managers have direct responsibility for TO relationships
Traditional Owner Engagement Leads support the mine General Managers by maintaining the day-to-day engagement with the Traditional Owner groups
Increased capacity across our CSP function as well as upgrading CSP systems to provide improved, linked-up decision-making
A Traditional Owner Partnerships Committee has been created to drive improvements and share learnings
©2021, Rio Tinto, All Rights Reserved
Specific actions
90

Rio Tinto Iron Ore has almost doubled the size of its cultural heritage team to more than 60 people.
We are progressing the Integrated Heritage Management Process (IHMP) to ensure we do not impact sites of exceptional cultural significance within our existing mineplans. To date, we have:- Reviewed 2205 heritage sites- Reviewed all sites for 2021 and 95% for 2022 - Removed approx. 54 million tonnes of Iron Ore from our reserves as a precautionary measure- Set up protective buffer zones for all sites of high cultural significance
91
Specific actions
We are increasing both the capabilities and resources of the internal Cultural Heritage teams to increase understanding and delivery of cultural heritage performance.
Establishing a process to redefine and improve cultural heritage management standards
©2021, Rio Tinto, All Rights Reserved