investor seminar presentation slides 2010 - balfour beatty · investor seminar 30 november 2010...
TRANSCRIPT

The Infrastructure Company
INVESTOR SEMINAR
30 NOVEMBER 2010
This presentation was edited from its original on 1 7 December 2010 for certain US regulatory reasons.
The edited section is clearly marked in the documen t.

Forward-looking statementsThis announcement may include certain forward-looking statements, beliefs or opinions, includingstatements with respect to Balfour Beatty plc’s business, financial condition and results of operations.These forward-looking statements can be identified by the use of forward-looking terminology,including the terms "believes", "estimates", "plans", "anticipates", "targets", "aims", "continues","expects", "intends", "hopes", "may", "will", "would", "could" or "should" or, in each case, theirnegative or other various or comparable terminology. These statements reflect the Balfour Beatty plcDirectors’ beliefs and expectations and involve risk and uncertainty because they relate to events anddepend on circumstances that may or may not occur in the future. A number of factors could causeactual results and developments to differ materially from those expressed or implied by the forward-looking statements, including, without limitation: developments in the global economy; changes in UK
1The infrastructure company
looking statements, including, without limitation: developments in the global economy; changes in UKand US government policies, spending and procurement methodologies; and the failure in BalfourBeatty's health, safety or environmental policies.
No representation is made that any of these statements or forecasts will come to pass or that anyforecast results will be achieved. Forward-looking statements speak only as at the date of therelevant materials and Balfour Beatty plc and its advisers expressly disclaim any obligations orundertaking to release any update of, or revisions to, any forward-looking statements in the materials.No statement in the announcement is intended to be, or intended to be construed as, a profit forecastor to be interpreted to mean that earnings per Balfour Beatty plc share for the current or futurefinancial years will necessarily match or exceed the historical earnings per Balfour Beatty plc share.As a result, you are cautioned not to place any undue reliance on such forward-looking statements.

Ian TylerIan TylerChief Executive

Revenue by Sector
Agenda
� Infrastructure markets Peter Zinkin
� Business model Andrew McNaughton
� Infrastructure investments Anthony Rabin
� Break
3The infrastructure company
� Break
� Financial implications Duncan Magrath
� Conclusion Ian Tyler
� Q&A

Defining core skills
Infrastructure
Technical expertise
Transport - Power - Water - Complex buildings
4The infrastructure company
Technical expertise
Complex customers
Integrator capability
Local knowledge
Reliability Quality Knowledge Safety

Defining core skills
Developed Economies
5The infrastructure company
Emerging Economies

Addressing the infrastructure market
RenewRenewProcureProcurePlanPlanDevelopDevelop
6The infrastructure company
Generating a whole greater than the parts
RenewRenew
MaintainMaintain
SupportSupport
ProcureProcure
ConstructConstruct
CommissionCommission
PlanPlan
DesignDesign
ManageManage
DevelopDevelop
InvestInvest
OperateOperate

Value creation
� Proven track record of growth
� Leveraging knowledge across the Group
� Providing integrated capability to customers
7The infrastructure company


Peter ZinkinPeter ZinkinPlanning and Development Director

Outline of presentation
� What is infrastructure and which markets are wegoing to discuss
� The global infrastructure market outlook
� Infrastructure and GDP – the virtuous circle
Infrastructure demand is relatively stable
10The infrastructure company
� Infrastructure demand is relatively stable
� Infrastructure trends in developed and emerging economies
� UK short term outlook after the CSR
� What all this means for Balfour Beatty – three propositions

� Civil infrastructure– Transportation
• Road, rail, aviation, ports
– Power– Water– Communications
� Developed economies– United Kingdom– United States of America– Canada
� Emerging economies
What is infrastructure and which markets are we going to discuss today?
11The infrastructure company
– Communications
� Social infrastructure– Health– Education– Social housing– Military housing
� Emerging economies– India– China

Balfour Beatty – proposition 1
� Infrastructure will remain a strong and stable global market which we are confident will grow
12The infrastructure company

The global infrastructure market is expected to be £20+ trillion over 2010-20
3.0
5.5
1.5
3.5%
4.0%
14.0%
13The infrastructure company
10.510.0
2.0
Source: Global insight
12.5%
9.5%
Size of market over 2010-20, £trillion Growth p.a.

Infrastructure
Supply SideInfrastructure investment� Raises productivity� Removes bottlenecks� Creates new markets
Demand SideHigher demand:� Long supply chains� High labour intensity� High consumption rates
Infrastructure and GDP - the virtuous circle
14The infrastructure company
Infrastructure investment
GDP

Infrastructure and GDP are highly correlated
China
India
Investment Growth
15The infrastructure companySource: World Bank. Figures are for 1960-2008 and based on US $ at PPP. Investment is Gross Fixed Capital Formation.
15The infrastructure company

Demand side: infrastructure investment has a higher economic multiplier effect than non-infrastructure expenditure and so has greater economic leverage
16The infrastructure companySource: UK data – ONS; USA data – US Bureau of Economic Analysis 16The infrastructure company

Infrastructure demand is very stable over prolonged periods of time... in the USAUSA Construction Market 1980 - 2009
4%
5%
6%
Housing
GDP
17The infrastructure companySource: US Census Bureau
0%
1%
2%
3%
1980 1982 1984 1986 1988 1990 1992 1994 1996 1998 2000 2002 2004 2006 2008
Housing
Civil Infrastructure
17The infrastructure company

Infrastructure demand is very stableover prolonged periods of time… also in the UKUK Construction Output 1980 - 2009
GDP
Building (private)
18The infrastructure companySource: ONS
Housing
Civil Infrastructure
Building (private)
18The infrastructure company

Balfour Beatty – proposition 2
� Infrastructure will remain a strong and stable global market which we are confident will grow
� Emerging economies will become increasingly important to us as Infrastructure growth in emerging economies will be even higher than the GDP growth
19The infrastructure company
economies will be even higher than the GDP growth

What drives infra investment in developed and emerging economies
Economic growth Economic growth -- International trade International trade -- DemographicsDemographicsEconomic growth Economic growth -- International trade International trade -- DemographicsDemographics
� Sustainability� Infrastructure renewal
� Urbanisation� Increasing GDP/head
20The infrastructure companySource: World Bank. Smoothed moving average.
Investment is Gross Fixed Capital Formation.

In developed economies start of renewal of 40+ year old infrastructure can be seen after 2000
Post 1980 spending reduced creating
backlog of renewals
Post 2000 uptick –backlog catch-up
Post WWII boom:construction of new infra
21The infrastructure companySource: UK-ONS; USA-US Census Bureau; Canada-Statistics Canada 21The infrastructure company

In emerging economies investment in civil infrastructure is accelerating
Civil infrastructure GDP % - India
22The infrastructure companySource: Balfour Beatty analysis 22The infrastructure company

Pattern of social and civil infra is different between developed and emerging economies
Developed Economy (UK)
Civil infrastructure
Emerging Economy (India)
Social infrastructure
23The infrastructure company
Social infrastructure
~1.5% of GDP ~3.0% of GDP
Civil infrastructure
Source UK-ONS; India - Balfour Beatty research

Balfour Beatty – proposition 3
� Infrastructure will remain a strong and stable global market which we are confident will grow
� Emerging economies will become increasingly important to us as infrastructure growth in emerging economies will be even higher than the GDP growth
24The infrastructure company
economies will be even higher than the GDP growth
� The impact of the CSR on overall infrastructure investment in the UK will be relatively modest with a slowdown in social infrastructure and growth in civil infrastructure

UK infrastructure outlook in the short term is mixed, with social expected to fall and civil to rise
Infrastructure spend as % of GDP
25The infrastructure company
Social
Civil
Source: ONS 25The infrastructure company

UK infrastructure trends (GDP%)
Health
GDP
26The infrastructure company
Education
Source: ONS 26The infrastructure company
40%
50%
60%
70%
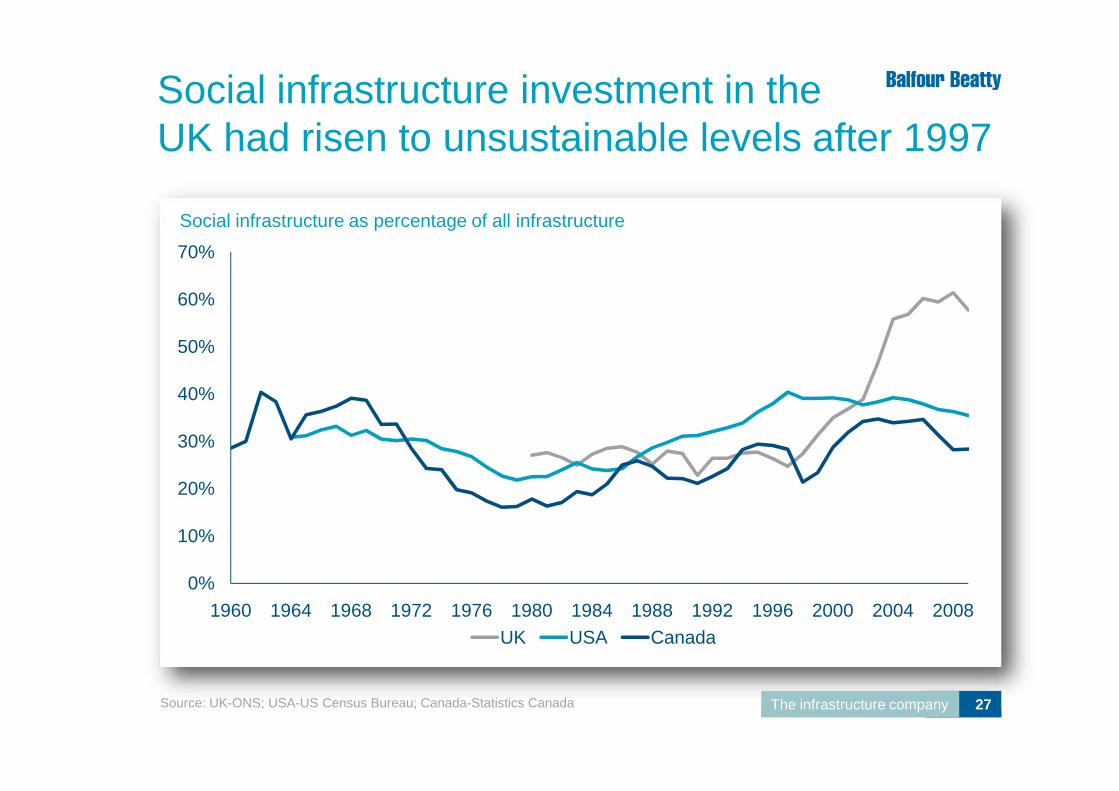
Social infrastructure investment in the UK had risen to unsustainable levels after 1997
Social infrastructure as percentage of all infrastructure
27The infrastructure company
0%
10%
20%
30%
40%
1960 1964 1968 1972 1976 1980 1984 1988 1992 1996 2000 2004 2008UK USA Canada
Source: UK-ONS; USA-US Census Bureau; Canada-Statistics Canada 27The infrastructure company

0.6%
0.7%
Although social infrastructure spending will fall it is still expected to remain at substantially above historical levelsEducation Health
GDPGDP
28The infrastructure company
0.0%
0.1%
0.2%
0.3%
0.4%
0.5%
1980 1983 1986 1989 1992 1995 1998 2001 2004 2007 2010 2013
2010—2014: Forecast period
Source: ONS and CSR
2010—2014: Forecast period
28The infrastructure company

2005/06 – 2009/10 2010/11 – 2014/15
Water
£27bnComms
Waste
£8bn
Water
£28bnComms
£34bn
UK civil infrastructure is expected to be a strong market, particularly in power sector
29The infrastructure company
£27bnComms
£35bn
Power
£29bnTransport
~£60bnTransport
£54bn
£8bnWaste
£2bnTotal
£150bn
Source: HM Treasury, 2010
Adjusted for CSR. Figures are in real terms
Power
£57bn
Total£186bn

Balfour Beatty – propositions
� Infrastructure will remain a strong and stable global market which we are confident will grow
� Emerging economies will become increasingly important to us as infrastructure growth in emerging economies will be even higher than the GDP growth
30The infrastructure company
economies will be even higher than the GDP growth
� The impact of the CSR on overall infrastructure investment in the UK will be relatively modest with a slowdown in social infrastructure and growth in civil infrastructure

Andrew McNaughtonAndrew McNaughtonChief Operating Officer

UKUSA
ROW
Balfour Beatty is an infrastructure company
32The infrastructure company
� Focused on civil and social infrastructure
� Diverse market sectors and geographies

Four elements are at the heart of the Balfour Beatty offering
Technical Expertise
Local Knowledge
Operational excellence
Ope
ratio
nal e
xcel
lenc
e Operational excellence
33The infrastructure company
Infrastructure Market
IntegratorComplex
Customers
Operational excellence
Ope
ratio
nal e
xcel
lenc
e Operational excellence

Balfour Beatty capabilities address all aspects of the infrastructure market……
34The infrastructure company
RenewRenew
MaintainMaintain
SupportSupport
ProcureProcure
ConstructConstruct
CommissionCommission
PlanPlan
DesignDesign
ManageManage
DevelopDevelop
InvestInvest
OperateOperate

Four elements are at the heart of the Balfour Beatty offering
Technical Expertise
Local Knowledge
Operational excellence
Ope
ratio
nal e
xcel
lenc
e Operational excellence
35The infrastructure company
Infrastructure Market
IntegratorComplex
Customers
Operational excellence
Ope
ratio
nal e
xcel
lenc
e Operational excellence

This differentiation is enhanced by our local presence across the world
36The infrastructure company 36The infrastructure company

Four elements are at the heart of the Balfour Beatty offering
Technical Expertise
Local Knowledge
Operational excellence
Ope
ratio
nal e
xcel
lenc
e Operational excellence
37The infrastructure company
Infrastructure Market
IntegratorComplex
Customers
Operational excellence
Ope
ratio
nal e
xcel
lenc
e Operational excellence

Four elements are at the heart of the Balfour Beatty offering
Technical Expertise
Local Knowledge
Operational excellence
Ope
ratio
nal e
xcel
lenc
e Operational excellence
38The infrastructure company
Infrastructure Market
IntegratorComplex
Customers
Operational excellence
Ope
ratio
nal e
xcel
lenc
e Operational excellence

The combination differentiates Balfour Beatty - especially on large complex projects
39The infrastructure company
M25 DBFO
� Client: Highways Agency� £6.2b - 30 year DBFO contract� BB Capital: financing (via Connect Plus) � BBMCE/BBES: construction (widening)� BBUS & BBRCE: ops & maintenance� PB: integration and management
Denver RTD
� Client: Denver Regional Transport� $7b - 29 year DBM contract� Rail USA: project lead and track� PB: system design/safety/integration� Rail Germany: traction power and
overhead catenary components

BB Strategic Positioning

Players are approaching the global infrastructure market from different starting points
Construction Europe Construction USA
� Kiewit� Tutor Perini� Walsh
� Vinci� Hochtief� Skanska
41The infrastructure company
Professional Services
Engineering & Construction
� URS� AECOM� CH2M
� Bechtel� Fluor� Jacobs
Global Infrastructure Market
~ £20+ trillion2010-20

Balfour Beatty is in the top echelon of global infrastructure players
42The infrastructure companySource: Engineering News Record 42The infrastructure company

Global infrastructure players have a range of capabilities and international coverage
Infrastructure Sectors Geographies
ROWTransport
JEC HCT
JEC – JacobsBCL – BechtelFLR – FluorVNC – VinciSKA – SkankaHCT – Hochtief
43The infrastructure company
Based on revenue in infrastructure sector only Based on total revenue, including infrastructure and industrial/oil & gas
Source: Engineering News Record and company financial statements
Building/Social Power/Water Americas Europe
ACM
URS
CH2M
JEC
FLRSKA
HCTKWT
TPE
WALVNCBB
BCL
VNC
HCT
TPEKWT
WAL
BB
BCL
JECFLR
SKAURS
CH2M
HCT – HochtiefACM – AECOMWAL – WalshKWT – KiewitTPE - Perini ACM

Balfour Beatty is larger than its global PS peers and it has broader geographical coverage than most
44The infrastructure companySource: Engineering News Record and company financial statements 44The infrastructure company

Balfour Beatty has a greater focus on infrastructure than the leading global E&C players
45The infrastructure companySource: Engineering News Record and company financial statements 45The infrastructure company

USA construction players are focused on the USA and have narrower capabilities than Balfour Beatty
46The infrastructure companySource: ENR and company financial statements 46The infrastructure company

European construction players have scale, geographical spread and PPP skills but in general lack a PS capability
47The infrastructure companySource: ENR and company financial statements 47The infrastructure company

Balfour Beatty has a distinct combination of attributes that differentiate it from its peers
� Scale
� International reach
� Infrastructure focus
� Professional services expertise
48The infrastructure company
� Professional services expertise
� PPP and infrastructure investment skills

3.0
5.5
1.5
3.5%
4.0%
14.0%
The global infrastructure market is expected to be £20+ trillion over 2010-20
49The infrastructure company
10.510.0
2.0 12.5%
9.5%
Size of market over 2010-20, £trillion Growth p.a.
Source: Global insight

� Mature assets
� Sophisticated and regulated procurement environment
� Whole life and operating costs a consideration
� Large complex projects and
� Integration capability
� In depth understanding of local supply chain
Developed economies
50The infrastructure company
� Large complex projects and programmes
� Backlog of infrastructure renewal and upgrading of existing assets
� PPP market continuing in UK and developing in USA, Canada and elsewhere
� Support services and understanding of operational constraints
� Scale important

� Planning
� Technical expertise
� Enormous need for new infrastructure
� Customers and procurement generally less sophisticated
� Business environment can
Emerging economies
51The infrastructure company
� Programme management
� PPP expertise
� Business environment can be challenging
� Deficit of local skills - local players typically focused largely on construction
� Financing of high levels of investment

Concluding remarks
� Balfour Beatty has multiple capabilities that it can bring together for complex customers:– Technical expertise– Local presence– Integration capability
52The infrastructure company
� Balfour Beatty has scale
� Balfour Beatty has global coverage, with access to both developed and emerging economies

Anthony RabinAnthony RabinDeputy Chief Executive

The Investments Agenda
� Our existing business – an update
� Evolution of our investment strategy
� Our future markets – a selection
54The infrastructure company
Our future markets – a selection
� An Infrastructure Funds Management business

Services across the entire infrastructure lifecycle
55The infrastructure company
Investments is key to our infrastructure value creation
RenewRenew
MaintainMaintain
SupportSupport
ProcureProcure
ConstructConstruct
CommissionCommission
PlanPlan
DesignDesign
ManageManage
DevelopDevelop
InvestInvest
OperateOperate

A substantial portfolio
5
4
32
1
0
20
40
60
80
100
120
1997 1999 2001 2003 2005 2007 2009 2011 later
Annual UK equity committed and invested (£m)
£624m
56The infrastructure company
2
5. US Military Housing: 18 projects
4. Other: 5 projects
3. Schools: 14 projects
2. Hospitals: 9 projects
1. Roads: 13 projects
Directors’ Valuation
£171m
£17m
£67m
£146m
£223m
£624m
Cash Invested
£135m
£6m
£52m
£71m
£93m
£357m
Equity Committed
£158m
£18m
£58m
£101m
£161m
£497mTotal PPP capital values by sector
Equity committed Equity invested
2010 H1

A leading UK PPP market position
SectorTotal original
project capex £mProjects in which BB
holds equity £mBB Market
shareTypical BB
Equity
Hospitals 11,933 1,898 16% 50%
PFI Schools (over £20m) 5,732 712 12% 50%
BSF (PFI content only) 3,771 651 17% 80%
57The infrastructure company
Infrastructure without LU PFI’s 8,727 2,054 24% 50% roads100% SL*
* SL : street lighting

2010 – An excellent UK performance
To dateYear end
2010Year end
2011
Bids - Won 10*
- In progress 19**
Phase 2 BSF 3
Equity £90m
58The infrastructure company
* BSF 4, Street Lighting 3, Blue Light 1, Roads 1, OFTO 1
** Waste 4, Hospitals 4, Blue Light 3, Highways 5, Rail 1, OFTO 1, Other 1
Construction Value £665m
FM Value £370m
Disposals AES / ERI Discount rate 7%
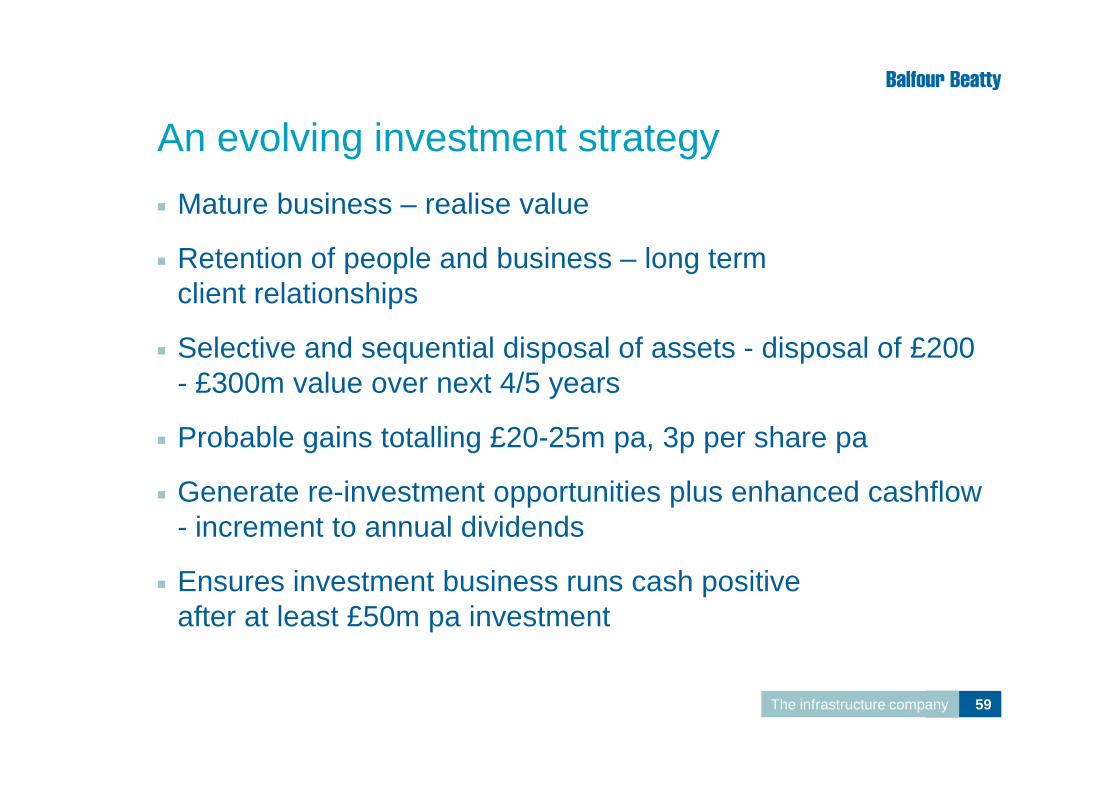
An evolving investment strategy
� Mature business – realise value
� Retention of people and business – long term client relationships
� Selective and sequential disposal of assets - disposal of £200 - £300m value over next 4/5 years
59The infrastructure company
- £300m value over next 4/5 years
� Probable gains totalling £20-25m pa, 3p per share pa
� Generate re-investment opportunities plus enhanced cashflow - increment to annual dividends
� Ensures investment business runs cash positive after at least £50m pa investment

Investments – the developer model
� Balfour Beatty will continue to be a substantial global investor in privately financed infrastructure
� Increasingly act as a developer– Greater emphasis on post construction disposals / minority stakes– Fees on financial close
60The infrastructure company
– Fees on financial close
� Boost to earnings– Gains on disposal– Fees

UK PFI – Future market still has potential
� Deficit reduction – CSR
� Political ambivalence on PPP– abandonment of PPP Credits BUT– post election positive departmental statements – Transport,
Health, DfE, MoJ
61The infrastructure company
� Increasing complexity – income risk
� Possible future 3-year PPP market c.£5 bn

Significant Canadian PPP opportunities
62The infrastructure companyThe infrastructure company

UK Offshore wind – a new opportunity
63The infrastructure company

Infrastructure Funds Management
This presentation was edited from its original on 17 December 2010 for certain
US regulatory reasons.
64The infrastructure company
US regulatory reasons.
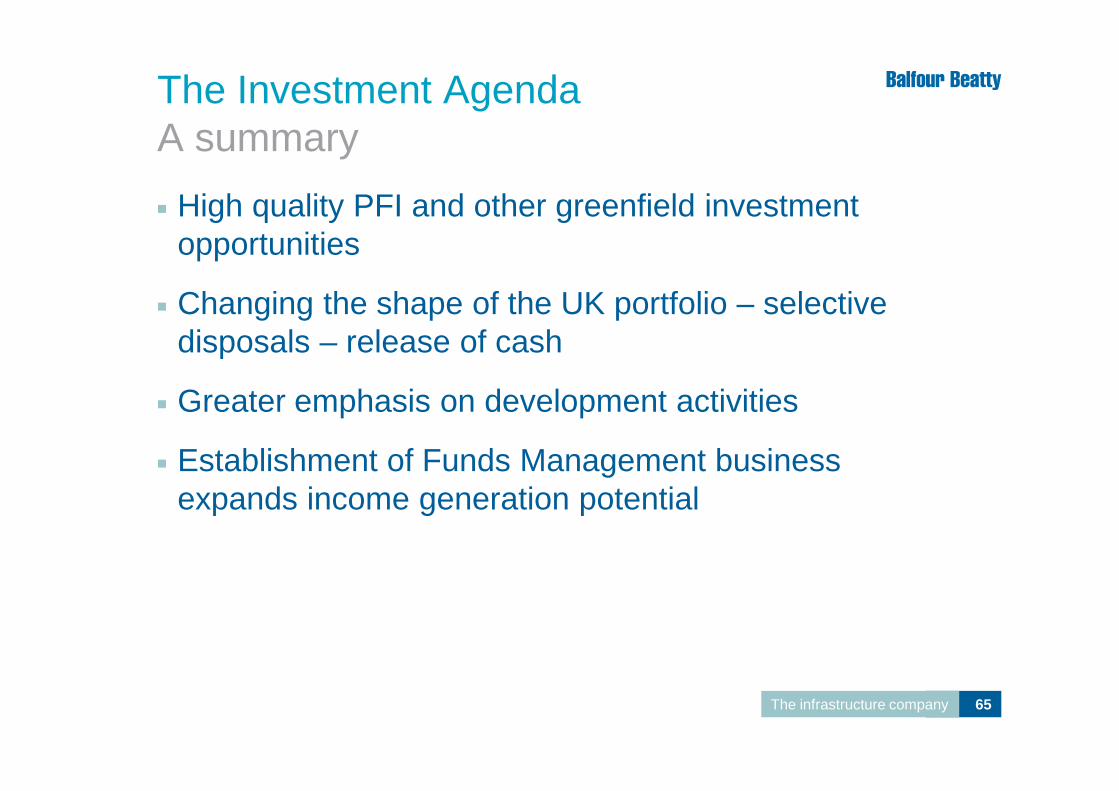
The Investment AgendaA summary
� High quality PFI and other greenfield investment opportunities
� Changing the shape of the UK portfolio – selective disposals – release of cash
� Greater emphasis on development activities
65The infrastructure company
� Greater emphasis on development activities
� Establishment of Funds Management business expands income generation potential

Break
WEBCAST WILL RESUME AT 16.00PM

Duncan MagrathDuncan MagrathGroup Finance Director

Contents
� Review of past performance
� Factors affecting future performance– Infrastructure Investments strategy– Impact of acquisitions– Margin performance
68The infrastructure company
– Margin performance
� Change in the shape of the Group over the next five years
� Summary

Historic double digit earnings and dividend growth
69The infrastructure company
� Growth from 2005 to 2009 in PBT has been 23% pa through a mixture of acquisitions and organic growth
� Excluding PB, cumulative net acquisition spend of c. £750m up to end 2009, with a return of 14% - 15% pa including subsequent growth
� Growth in adjusted EPS over that period has averaged 13% pa
� Dividend growth of 14% pa
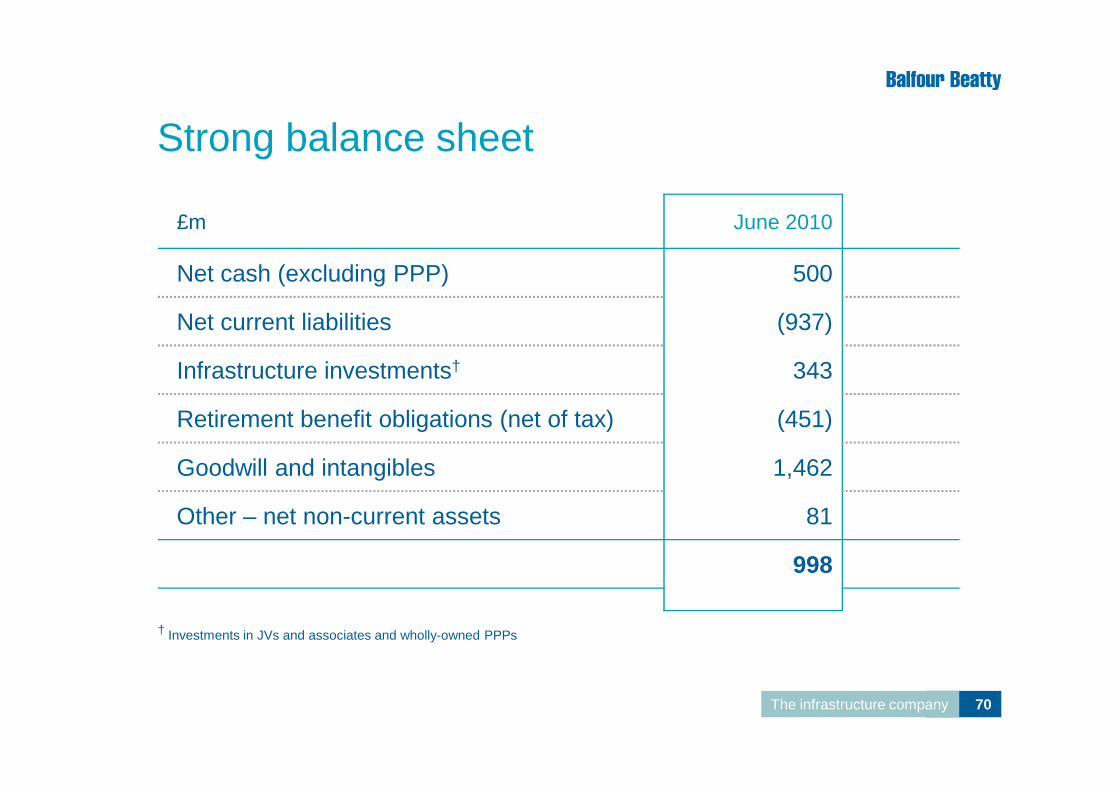
Strong balance sheet
£m June 2010
Net cash (excluding PPP) 500
Net current liabilities (937)
Infrastructure investments† 343
70The infrastructure company
Retirement benefit obligations (net of tax) (451)
Goodwill and intangibles 1,462
Other – net non-current assets 81
998
† Investments in JVs and associates and wholly-owned PPPs

Earnings and dividends from infrastructure “developer” model
� Regular stream of disposals generating:– £200m-£300m value over next 4-5 years– disposal gains of £20m pa
� From 1 January 2011 disposal gains to be treated as part of adjusted profit before tax, and in the base for
71The infrastructure company
part of adjusted profit before tax, and in the base for dividend calculation

Continuing positive cash generation
� Profitable business performance including regular investments disposal programme
� Cash inflow from growth in construction business
can fund
72The infrastructure company
� Growing dividends
� Pension deficit payments
and
� Allow for acquisition programme

Strong underlying cashflows continue to allow scope for selective acquisitions
73The infrastructure company
� Over 5 years there is scope to increase dividends and potentially to fund £500m – £700m of selective strategic acquisitions
Note: In 2006 payment of interim dividend was accelerated so in that year two interims and one final were paid
Acquisition programme weighted towards Professional Services and overseas
� Targeting to double the profits earned from our Professional Services business
� Continuing to expand our Construction Services business, principally outside UK
� Where needed, acquiring additional skill-sets for our
74The infrastructure company
� Where needed, acquiring additional skill-sets for our Support Services business
� Investments business to fund investment through disposal proceeds

Improving profit margins*
Construction Services 2.8%+ cost effectiveness+/- operational delivery+/- mix effect
Stable
2009 Margin effectsDirection of margin movement over 5 yrs
Professional Services 4.5%†+ utilisation+ collaboration+ EPC contracting
Increase to 6% to 7%
75The infrastructure company
+/- mix effect
Support Services 3.8%
+ scale benefits/cost effectiveness+ scope of services- mobilisation costs- margin pressure
Increase to 4% to 4.5%
Group (including Investments and corporate costs)
2.7% Increase to 3.5% to 4%
* Margin % is profit from operations before exceptional items and amortisation as a percentage of revenue including JVs and associates
† Pre-acquisition margin for PB

Organic Acquisition
Professional Services ++ ++
Growth expectations
5 year profit growth prospects
76The infrastructure company
Construction Services + +
Support Services +++ +
Over the medium term our organic growth should exceed growth in infrastructure markets and be supplemented by growth from selective strategic acquisitions

Increasing proportion of profit from Professional Services
10%
50%
15%
CurrentlyInvestments
Support Services
Organic
Acquisition
In 5 years
10%
45%15%
Investments
Support Services
Construction Services
77The infrastructure company
50%
25%
Professional Services
Construction Services
Acquisition
Margin Performance 30%
Professional Services
� If calculated by value, Professional Services would account for a greater proportion than shown due to higher multiples
� Despite “developer model”, profit will still understate value creation from Investments for the Group
% shown is percentage of profit from operations before corporate overhead (for June 2010, £8m incentive incom excluded from figures)

Consistent growth in dividends
78The infrastructure company
Historic performance� Growth in adjusted EPS 13% pa� Growth in dividends 14% pa� Average dividend cover 3.0x
Future performance� Earnings growth including gain on sale of
investments will drive dividend growth� Scope for reducing dividend cover

Summary
� Investments disposals will generate cash to re-invest in business, and a regular stream of disposal profit to further drive earnings and dividends
� Group margins will improve through performance of Professional Services, focus on cost efficiency and
79The infrastructure company
Professional Services, focus on cost efficiency and mix of business
� Continuing cash generation will support growth in dividends and acquisitions

Ian TylerIan TylerChief Executive

Fundamentals of our business
� Global scale
� Infrastructure focus
� Breadth of capabilities
� Core skills to leverage those capabilities
81The infrastructure company
� Core skills to leverage those capabilities

Infrastructure markets
� Growing need to renew post-war infrastructure in developed markets where we have market-leading positions
� Shift in the UK from social infrastructure to civil infrastructure
82The infrastructure company
infrastructure
� Fastest growth expected in emerging markets which we will access through our project development and professional services capabilities
Potential value over the next five years
� Growth, particularly in Professional and Support services
� Strong cash generation supports capacity for £500-700 million of acquisitions
� Group margin expansion to 3.5-4%
83The infrastructure company
� Group margin expansion to 3.5-4%
� Realising value from infrastructure assets through regular disposals: the ‘developer model’

Returns to shareholders
� Progressive dividend policy
� Incremental dividends from the ‘developer model’ approach to infrastructure assets
84The infrastructure company
