investor meetings presentation july 2009
TRANSCRIPT

1
Investor Meetings
7 July 2009
Contents
Strategic Focus
Operations Review
Market Review and Outlook
Going Forward
2
STRATEGIC FOCUS
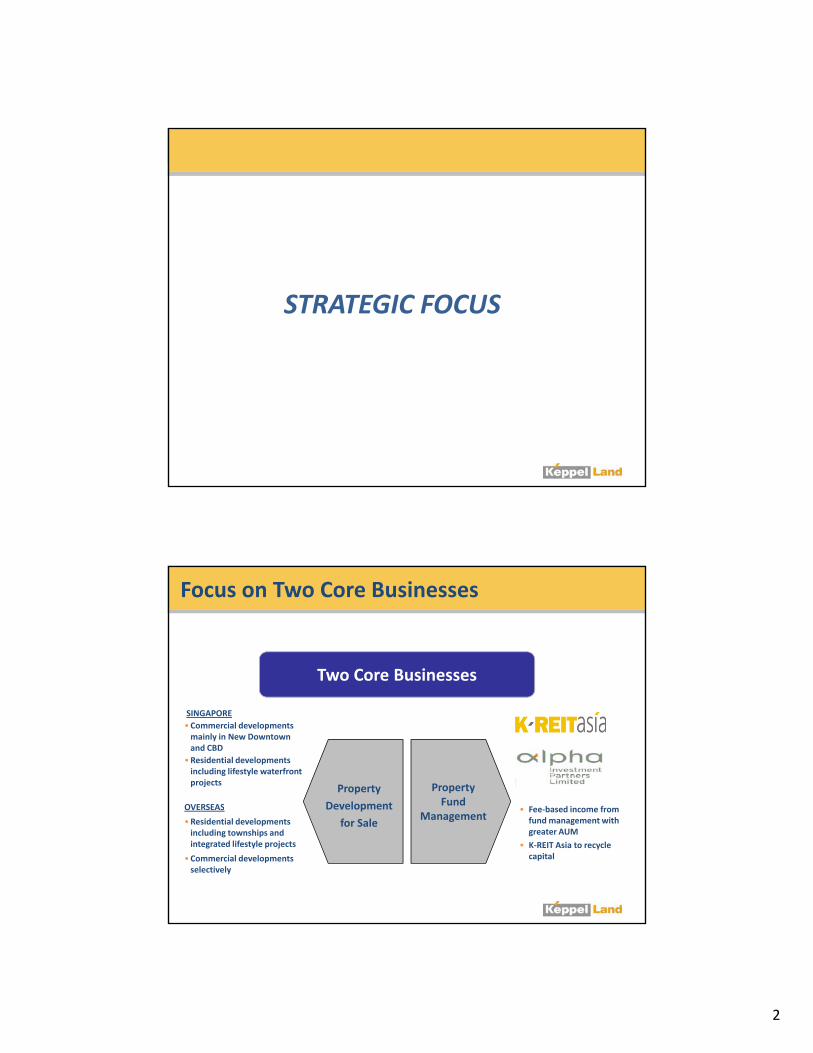
Focus on Two Core Businesses
Two Core Businesses
SINGAPORE
•Commercial developments mainly in New Downtown and CBD
•Residential developments including lifestyle waterfront projects
OVERSEAS
Property
Development
Property FundOVERSEAS
•Residential developments including townships and integrated lifestyle projects
•Commercial developments selectively
• Fee‐based income from fund management with greater AUM
• K‐REIT Asia to recycle capital
Development
for Sale
Fund Management

3
OPERATIONS REVIEW
FINANCIAL MANAGEMENT Rights Issue
and Dividend Reinvestment Scheme

4
Financial Management
Rights Issue • Rationale : Capitalise on opportunities arising from current downturn
: Strengthen balance sheet and enhance financial flexibility• Raised gross proceeds : Approx. $707.6mRaised gross proceeds : Approx. $707.6m • Number of rights shares issued : 649.2m
Dividend Reinvestment Scheme (DRS)• Rationale : Allow shareholders to reinvest in the Company by receiving
dividends for FY2008 in shares: Allow Company to conserve cash
• Number of new shares issued : 34.3m
Post Rights Issue and DRS • Total number of shares : Increased from 721.3m 1.4 bn• Market capitalisation : Increased from $1.05 bn(1) $3.1 bn(2)
(1) As at 31 March 2009(2) As at 03 July 2009
SINGAPORE

5
Singapore Residential
Two projects almost fully sold
• Park Infinia at Wee Nam : 23 units sold as at end‐May 2009
• The Tresor : 28 units sold as at end‐May 2009
Landbank strategically located in prime residential districts and along new MRT lines
Park Infinia at Wee Nam The Tresor
Singapore Commercial
3.8m sf NLA under development in CBD and New Downtown

6
Singapore Commercial
Marina Bay Financial Centre Ocean Financial Centre
• NLA : 2.9m sf• Strong overall pre‐commitment : 61%
‐ Phase 1 : 66%
• NLA : 0.85m sf
• 4th generation building to rise ‐ Phase 2 : 55%
• Expected completion : ‐ Phase 1 : 2010‐ Phase 2 : 2012
at former Ocean Building site
• Expected completion : 2011
MBR
T3 T2
MBS
Marina Bay Financial Centre Ocean Financial Centre
T1
Singapore Commercial – K‐REIT Asia
• 95.8% committed occupancy as at end‐Mar 2009• Average portfolio gross rental up 17.5% y‐o‐y to $8.06 psf per month
• 28% of portfolio’s NLA accounted by long lease terms
Stable Portfolio of Five Quality Office Assets with AUM
of $2.1bn
• 1Q 2009 distributable income up 37.3% y‐o‐y to $15.7m• Distribution for 1Q 2009 : 2.38 cents per unit
Continued Income Growth
• Low aggregate leverage maintained at 27.6%• Debt maturing only in 2011
Healthy Balance Sheet
Prudential Tower Keppel Towers GE Tower Bugis Junction Towers One Raffles Quay

7
OVERSEAS
Overseas ‐ China
Continuing improving sales especially in township homes
• The Botanica, Chengdu and Central Park City, Wuxi achieving average sales of 100 units per month respectively
Participate in Tianjin Eco Cit as an in estor and consorti mmember Participate in Tianjin Eco‐City as an investor and consortium member, and project manager in the development of a 30‐ha site within the SUA
Tianjin Eco‐City Entire Development Start‐up Area (SUA)
Size 30 sq km 4 sq km
Development period 10‐15 years 3‐5 years
No. of homes >100,000 >20,000
Population size (approx) 350,000 85,000
The Botanica Central Park City
8
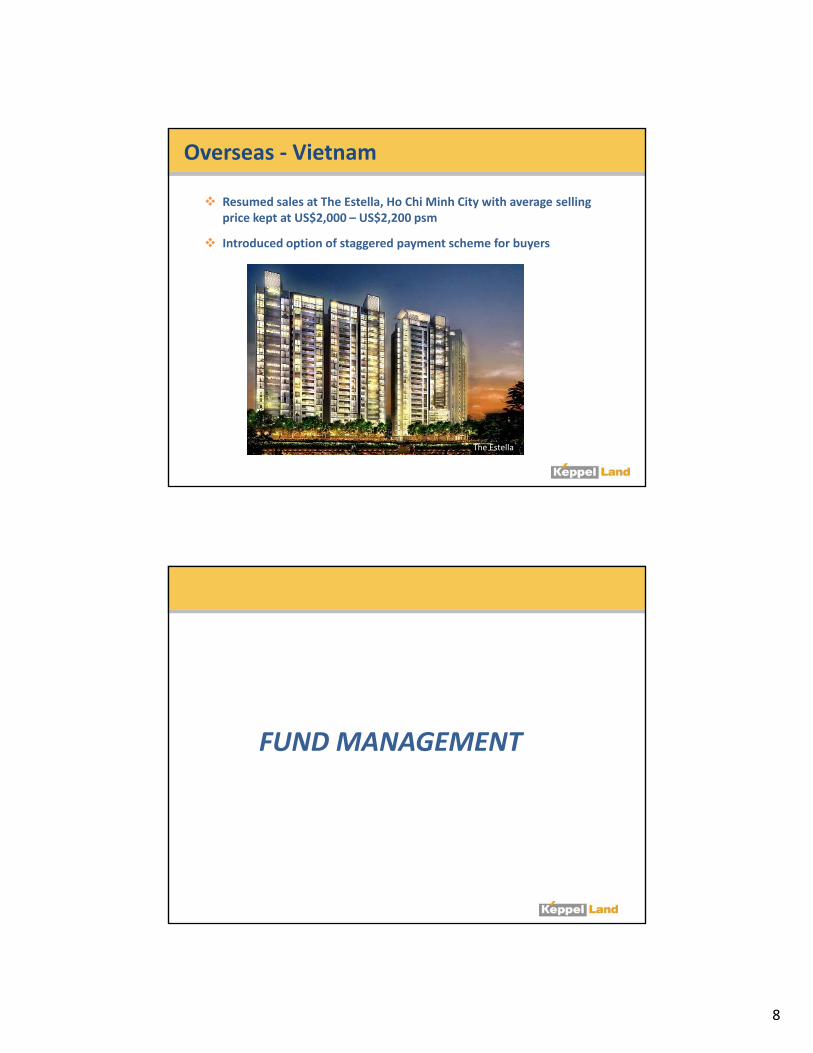
Overseas ‐ Vietnam
Resumed sales at The Estella, Ho Chi Minh City with average selling price kept at US$2,000 – US$2,200 psm
Introduced option of staggered payment scheme for buyers p gg p y y
The Estella
FUND MANAGEMENT

9
Fund Management
K‐REIT Asia
• Portfolio value : $2.1 bn
Alpha Investment PartnersTotal AUM: $9 8 b (1) Alpha Investment Partners
• AUM : $7.7 bn (1)
• Alpha Asia Macro Trends Fund acquired office building in Gangnam, Seoul
Funds under Alpha Committed Equity % InvestedNo. of Countries
Invested In
Asia No. 1 Property Fund $400m 100% 6
$9.8 bn (1)
Alpha Core Plus Real Estate Fund $720m 100% 4
AIB Alpha Japan Fund $259m 38% 1
Alpha Asia Macro Trends Fund $1.7bn 7% 4
(1) When fully leveraged and fully invested
As at 1Q 2009
MARKET REVIEW and OUTLOOK
10
Singapore Residential
Sentiments improved• Surge in new home sales
‐ 1H09 sales (estimated 6,500 units) exceed full year 2008 (4,264 units)
• Good take‐up at recently launched mid‐ and higher‐end projects
• Signs of improved economic conditions in 2Q09
Positive drivers supporting housing demand• Population growth
‐ Up 5.5% to reach 4.84m in 2008
‐ Growth mainly from PRs (+6%) and non‐residents (+19%) (Source : National Population Secretariat)
• Demand from HDB upgraders ‐ HDB upgraders accounted for 65% of buyers of new homes in 1H09, compared to 44% in 2008
(Source : CBRE)(Sou ce )
• Increased buying interest from foreigners‐ Total no. of homes sold to foreigners (excluding PRs) : March – 4% ; April – 7% ; May – 9%
(Source : URA)
• Spin‐off effects from integrated resorts ‐ Developments close to IRs will benefit from proximity
Singapore Commercial
Global economy still weak although there are some positive signs of stabilisation
• Office demand likely to be soft in 2009
• Interest in investment sales starting to pick up
Delays in construction of some office projects have reduced supply
• New office supply from 2009‐2012 lowered to 5.9m sf(1) (or 1.6m sf pa)
• Limited impact of shadow space as lease period usually shorter than 3 years after which
sub‐lessees face risk of relocation
Singapore remains a key business destination in longer term
• Growth into a global cosmopolitan city and multi‐hub business destination
• Ranked 4th in recent Forbes ranking of Best Countries to do Business
• Ranked 15th in CBRE’s May 2009 Global Occupancy Costs Survey, below Asian cities like
Tokyo, Hong Kong, Mumbai and New Delhi
(1) Excluding pre‐committed space of about 2.4 million sf as estimated by CBRE
11
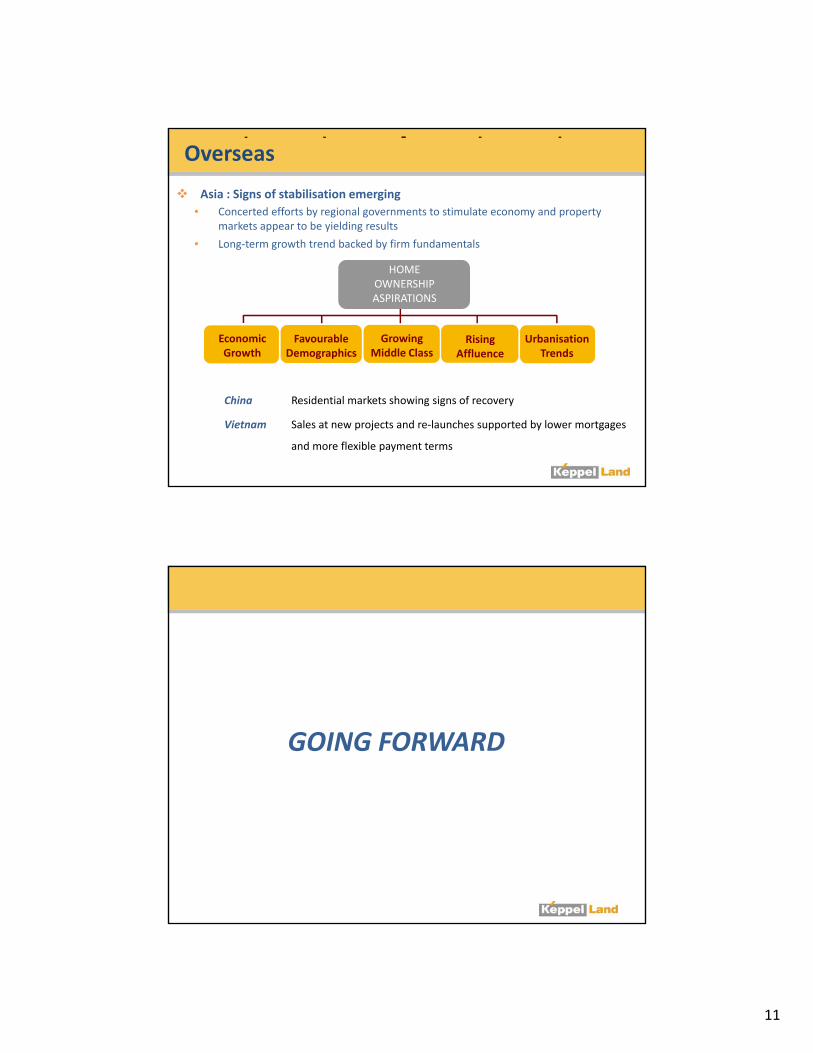
Overseas
Asia : Signs of stabilisation emerging
• Concerted efforts by regional governments to stimulate economy and property markets appear to be yielding results
• Long‐term growth trend backed by firm fundamentalsLong term growth trend backed by firm fundamentals
HOME OWNERSHIP ASPIRATIONS
Economic Growth
Favourable Demographics
Growing Middle Class
Rising Affluence
Urbanisation Trends
China Residential markets showing signs of recovery
Vietnam Sales at new projects and re‐launches supported by lower mortgages
and more flexible payment terms
GOING FORWARD

12
Seek acquisitions in Singapore and overseas, capitalising
Going Forward
q g p p gon opportunities from economic downturn
Continue to focus on developing quality residential, office, township and sustainable developments
K REIT A i d Al h t f d t i K‐REIT Asia and Alpha to grow fund management income and acquire good quality assets
THANK YOU
13
ADDITIONAL SLIDES
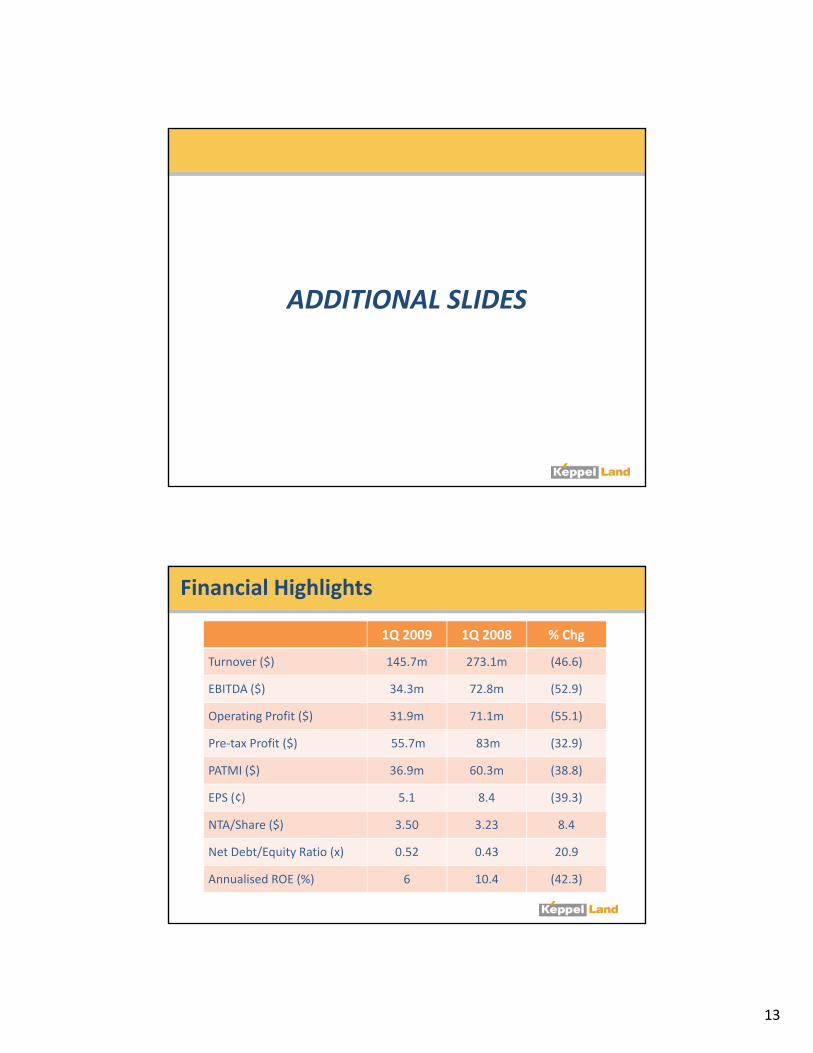
Financial Highlights
1Q 2009 1Q 2008 % Chg
Turnover ($) 145.7m 273.1m (46.6)
EBITDA ($) 34 3 72 8 (52 9)EBITDA ($) 34.3m 72.8m (52.9)
Operating Profit ($) 31.9m 71.1m (55.1)
Pre‐tax Profit ($) 55.7m 83m (32.9)
PATMI ($) 36.9m 60.3m (38.8)
EPS (¢) 5.1 8.4 (39.3)
NTA/Share ($) 3.50 3.23 8.4
Net Debt/Equity Ratio (x) 0.52 0.43 20.9
Annualised ROE (%) 6 10.4 (42.3)
14
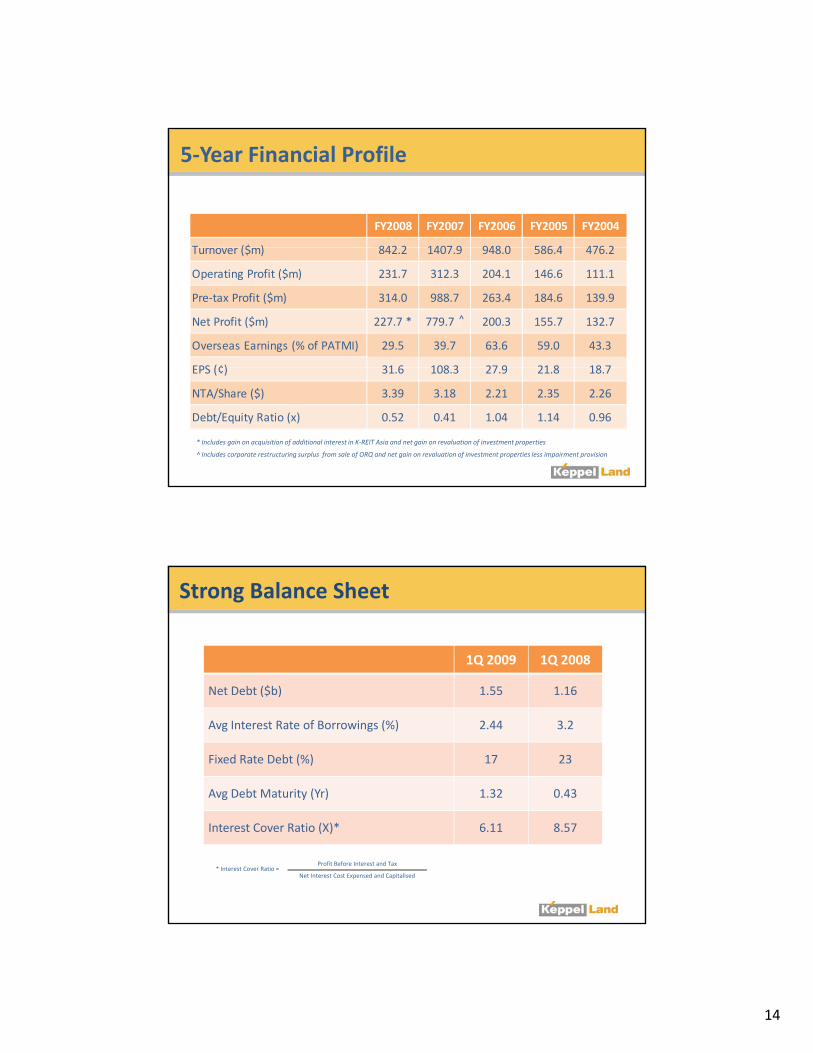
5‐Year Financial Profile
FY2008 FY2007 FY2006 FY2005 FY2004
T ($ ) 842 2 1407 9 948 0 586 4 476 2Turnover ($m) 842.2 1407.9 948.0 586.4 476.2
Operating Profit ($m) 231.7 312.3 204.1 146.6 111.1
Pre‐tax Profit ($m) 314.0 988.7 263.4 184.6 139.9
Net Profit ($m) 227.7 * 779.7 * 200.3 155.7 132.7
Overseas Earnings (% of PATMI) 29.5 39.7 63.6 59.0 43.3
EPS (¢) 31 6 108 3 27 9 21 8 18 7
^
EPS (¢) 31.6 108.3 27.9 21.8 18.7
NTA/Share ($) 3.39 3.18 2.21 2.35 2.26
Debt/Equity Ratio (x) 0.52 0.41 1.04 1.14 0.96
* Includes gain on acquisition of additional interest in K‐REIT Asia and net gain on revaluation of investment properties
^ Includes corporate restructuring surplus from sale of ORQ and net gain on revaluation of investment properties less impairment provision
Strong Balance Sheet
1Q 2009 1Q 2008
$Net Debt ($b) 1.55 1.16
Avg Interest Rate of Borrowings (%) 2.44 3.2
Fixed Rate Debt (%) 17 23
Avg Debt Maturity (Yr) 1.32 0.43
Interest Cover Ratio (X)* 6.11 8.57
* Interest Cover Ratio = Profit Before Interest and Tax
Net Interest Cost Expensed and Capitalised
15
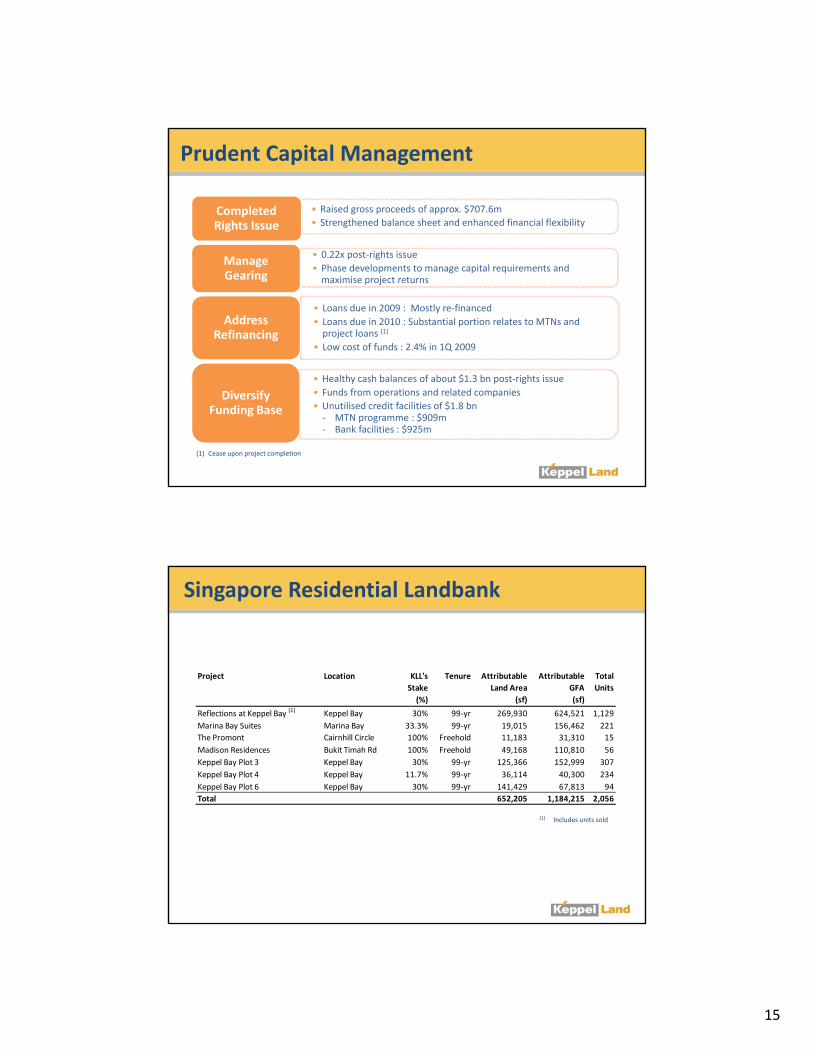
• Raised gross proceeds of approx. $707.6m
• Strengthened balance sheet and enhanced financial flexibility
Prudent Capital Management
Completed Rights Issue
• 0.22x post‐rights issue
• Phase developments to manage capital requirements and maximise project returns
Manage Gearing
• Loans due in 2009 : Mostly re‐financed
• Loans due in 2010 : Substantial portion relates to MTNs and project loans (1)
• Low cost of funds : 2.4% in 1Q 2009
Address Refinancing
• Healthy cash balances of about $1.3 bn post‐rights issue
• Funds from operations and related companies
• Unutilised credit facilities of $1.8 bn ‐ MTN programme : $909m‐ Bank facilities : $925m
Diversify Funding Base
(1) Cease upon project completion
Singapore Residential Landbank
Attributable Attributable
L d A GFA
Total
U i
Project Location KLL's
S k
Tenure
Land Area GFA
(%) (sf) (sf)
Reflections at Keppel Bay (1) Keppel Bay 30% 99‐yr 269,930 624,521 1,129
Marina Bay Suites Marina Bay 33.3% 99‐yr 19,015 156,462 221
The Promont Cairnhill Circle 100% Freehold 11,183 31,310 15
Madison Residences Bukit Timah Rd 100% Freehold 49,168 110,810 56
Keppel Bay Plot 3 Keppel Bay 30% 99‐yr 125,366 152,999 307
Keppel Bay Plot 4 Keppel Bay 11.7% 99‐yr 36,114 40,300 234
Keppel Bay Plot 6 Keppel Bay 30% 99‐yr 141,429 67,813 94
Total 652,205 1,184,215 2,056
UnitsStake
(1) Includes units sold
16
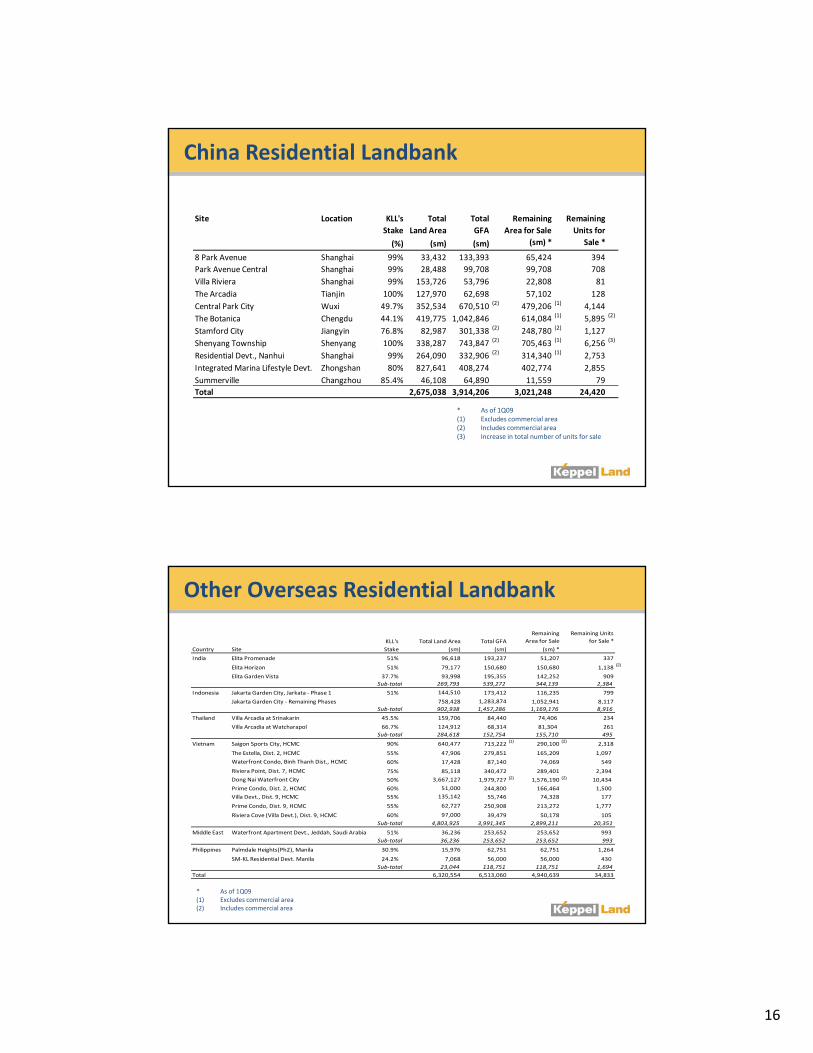
China Residential Landbank
Site Location Total Total
Land Area GFA
(%) (sm) (sm)
Remaining
Units for
Sale *
KLL's
Stake
Remaining
Area for Sale
(sm) *( ) ( ) ( )
8 Park Avenue Shanghai 99% 33,432 133,393 65,424 394
Park Avenue Central Shanghai 99% 28,488 99,708 99,708 708
Villa Riviera Shanghai 99% 153,726 53,796 22,808 81
The Arcadia Tianjin 100% 127,970 62,698 57,102 128
Central Park City Wuxi 49.7% 352,534 670,510 (2) 479,206 (1) 4,144
The Botanica Chengdu 44.1% 419,775 1,042,846 614,084 (1) 5,895 (2)
Stamford City Jiangyin 76.8% 82,987 301,338 (2) 248,780 (2) 1,127
Shenyang Township Shenyang 100% 338,287 743,847 (2) 705,463 (1) 6,256 (3)
Residential Devt., Nanhui Shanghai 99% 264,090 332,906 (2) 314,340 (1) 2,753
Integrated Marina Lifestyle Devt Zhongshan 80% 827 641 408 274 402 774 2 855Integrated Marina Lifestyle Devt. Zhongshan 80% 827,641 408,274 402,774 2,855
Summerville Changzhou 85.4% 46,108 64,890 11,559 79
Total 2,675,038 3,914,206 3,021,248 24,420
* As of 1Q09(1) Excludes commercial area(2) Includes commercial area(3) Increase in total number of units for sale
Other Overseas Residential Landbank
KLL's Total Land Area Total GFA
Remaining
Area for Sale
Remaining Units
for Sale *
Stake (sm) (sm) (sm) *
India Elita Promenade 51% 96,618 193,237 51,207 337
Elita Horizon 51% 79,177 150,680 150,680 1,138(2)
Elita Garden Vista 37.7% 93,998 195,355 142,252 909
Sub‐total 269,793 539,272 344,139 2,384
Country Site
Sub total 269,793 539,272 344,139 2,384
Indonesia Jakarta Garden City, Jarkata ‐ Phase 1 51% 144,510 173,412 116,235 799
Jakarta Garden City ‐ Remaining Phases 758,428 1,283,874 1,052,941 8,117
Sub‐total 902,938 1,457,286 1,169,176 8,916
Thailand Villa Arcadia at Srinakarin 45.5% 159,706 84,440 74,406 234
Villa Arcadia at Watcharapol 66.7% 124,912 68,314 81,304 261
Sub‐total 284,618 152,754 155,710 495
Vietnam Saigon Sports City, HCMC 90% 640,477 713,222(1)
290,100(2)
2,318
The Estella, Dist. 2, HCMC 55% 47,906 279,851 165,209 1,097
Waterfront Condo, Binh Thanh Dist., HCMC 60% 17,428 87,140 74,069 549
Riviera Point, Dist. 7, HCMC 75% 85,118 340,472 289,401 2,394
Dong Nai Waterfront City 50% 3,667,127 1,979,727 (2) 1,576,190 (2) 10,434
Prime Condo, Dist. 2, HCMC 60% 51,000 244,800 166,464 1,500
Villa Devt., Dist. 9, HCMC 55% 135,142 55,746 74,328 177
P i C d Di t 9 HCMC 55% 62 727 250 908 213 272 1 777Prime Condo, Dist. 9, HCMC 55% 62,727 250,908 213,272 1,777
Riviera Cove (Villa Devt.), Dist. 9, HCMC 60% 97,000 39,479 50,178 105
Sub‐total 4,803,925 3,991,345 2,899,211 20,351
Middle East Waterfront Apartment Devt., Jeddah, Saudi Arabia 51% 36,236 253,652 253,652 993
Sub‐total 36,236 253,652 253,652 993
Philippines Palmdale Heights(Ph2), Manila 30.9% 15,976 62,751 62,751 1,264
SM‐KL Residential Devt. Manila 24.2% 7,068 56,000 56,000 430
Sub‐total 23,044 118,751 118,751 1,694
Total 6,320,554 6,513,060 4,940,639 34,833
* As of 1Q09(1) Excludes commercial area(2) Includes commercial area

17
Singapore Commercial – K‐REIT Asia
Accounting & consultancy services4 0%
Shipping & marine services7 7%
Tenant Business Sector by Net Lettable Area as at 31 Mar 2009
4.0%
Banking, insurance & financial services
35.3%Pharmaceuticals & healthcare
4.2%
Real estate & property services8.1%
Services9.0%
7.7%
Conglomerate8.6%Government agency
7.2%
Hospitality & leisure3.0%
IT services & consultancy5.8%
Others7.0%
Developments to benefit from new Downtown Line (DTL)
• Values of properties nearby expected to rise (JLL)
Singapore Residential
p p y p ( )
KLL’s Development Location DTL Station
The Tresor Duchess Road Tan Kah Kee
Madison Residences Bukit Timah Road Stevens/Botanic Gardens
Interchange
Park Infinia Wee Nam Road Newton Interchange

18
Awards
Singapore Corporate Awards – Best Annual Report (Gold)
• Market Capitalisation of $1 bn and above
Five new BCA Green Mark Award
• MBFC Ph 2 (Commercial) – Gold Plus
• Marina Bay Suites – Gold
• Madison Residences – Gold
• The Promont – Gold
• One Raffles Quay – Gold (First building to achieve a Green Mark Award under new• One Raffles Quay – Gold (First building to achieve a Green Mark Award under new
guidelines for existing developments)
Governance and Transparency Index by Business Times(1)
• Ranked 8th out of 677 companies
• Only property company placed in Top 10
(1) Replaced Business Times Corporate Transparency Index
This release may contain statements which are subject to risks and uncertainties that could cause actual results to differ materially from such statements. You are
cautioned not to place undue reliance on such statements, which are based on the current views of Management on future developments and events.