investor presentation march 2020 - femsa
TRANSCRIPT

Investor Presentation – March 2020

2
Safe Harbor Statement
During this presentation management may discuss certain forward-looking statementsconcerning FEMSA’s future performance that should be considered as good faith estimates madeby the Company. These forward-looking statements reflect management expectations and arebased upon currently available data. Actual results are subject to future events anduncertainties, which could materially impact FEMSA’s actual performance.

3
Overview
Market leader and fastest growing retail
chain in Mexico
The world’s most international brewer
Ownership
Coca-Cola’s largest franchise bottler in
the world by volume
47%(1) 100% 15%
1 Represents 56% of shares with voting rights.

FEMSA ComercioCoca-Cola
FEMSALogistics/
RefrigerationProximity Division
HealthDivision
Fuel Division
Mexico
Brazil
Colombia
Argentina
Venezuela
Chile
Panama
Costa Rica
Uruguay
Guatemala
Nicaragua
Peru
Ecuador 4
Leading Consumer Company in Latin America
Internal company data, YTD.

5
Creating Economic Value in the Last Decade
Source: Bloomberg, as of March 05, 2020
CAGR 08 – Mar 2020: 11%
1 Amounts expressed in millions of Mexican Pesos2 Includes the effect of IFRS-163 Figures for 2009 are the arithmetical sum of Coca Cola FEMSA and FEMSA Comercio, therefore figures exclude sold businesses.
• Consistently strengthening our competitive position.
• Ability to operate in a rapidly changing economicenvironment.
• Strong brand portfolio and exceptional operationalcapabilities.
FMX Market Cap Evolution (US$ MM)
Financial Highlights1
20192 20093 CAGR %
Revenue 506,711 156,316 12%
EBIT 47,152 20,292 9%
EBIT Margin 9.3% 13.0%
EBITDA 75,440 25,533 11%
EBITDA Margin 14.9% 16.3%
CAPEX 25,579 8,950 11%
9,999
28,993
2008 March 2020

1,620 1,620
2,600
4,600
6,200 6,684 6,684
7,350
8,355 8,636 9,221
9,692
2008 2009 2010 2011 2012 2013 2014 2015 2016 2017 2018 2019
6
Increasing Cash to Shareholders Over Time…
Ordinary Dividend(Millions of Mexican Pesos)
Note: Dividend figures are in Mexican pesos. Payout ratio figures are the division of the dividend between previous year net majority income. 2010 net majority income does not include Heineken transaction effect. 2011 and thereafter figures are under International Financial Reporting Standards (“IFRS”).
…while retaining strategic and financial flexibility
PayoutRatio
19% 24%
26%
34%
40% 32% 42%
44%
47%
CAGR 18%
41%
Net Debt /EBITDA
1.1 x 0.7 x -0.1 x 0.0 x 0.0 x 1.2 x 1.1 x 1.6 x1.2 x 0.4 x
22% 40%
0.9 x

66%
34%
2009
40%
60%
2019
79%
21%
2009
60%
40%
2019
7
An Increasingly Balanced Core Portfolio
Revenue Contribution EBITDA Contribution
Coca-Cola FEMSA
FEMSA Comercio
Note: Figures show the arithmetical sum of Coca Cola FEMSA and FEMSA Comercio for comparison purposes.


9
FEMSA Comercio Overview
Includes drugstores and related operations
in Mexico and South America
Operates the OXXO GASchain of retail service
stations in Mexico
Proximity Division
Health Division
Fuel Division
Operates OXXO, the
largest C-store chain in the Americas by units

-
5,000
10,000
15,000
20,000
25,000
30,000
35,000
40,000
2007 2008 2009 2010 2011 2012 2013 2014 2015 2016 2017 2018 2019
10
FEMSA Comercio EBITDA ($Millions of Pesos) and Business Evolution
FEMSA Comercio Business Evolution
CAGR1
19%
CAGR1
17%1 Total FEMSA Comercio Annual EBITDA CAGR.2 2019 vs. 2018 EBITDA growth on a comparable basis (Adjusted for IFRS16)
Surpass 1,000openings per
year
10,000OXXO store
mark
16,000OXXO store
mark
12%2

11
FEMSA Comercio is finding growth in adjacent formats
Note: Numbers as of December 31, 2019.
Contribution for 2019
Revenue EBITDA
Proximity79%
Health15%
Fuel6%
Proximity63%
Health20%
Fuel17%

12
• Second largest retailer in terms of
Revenues in Mexico
• Benchmark for SSS and sales
density in Mexico
• Best-in-class margins and returns
• We open one new store every 6
hours on average
• Every day, approximately 14 million
people make a purchase at an
OXXO Store
OXXO: A Format that Fits our Consumer’s Needs

7,3348,426
9,56110,601
11,72112,853
14,06115,225
16,52617,839
19,089
0.60%
0.80%
1.00%
1.20%
1.40%
1.60%
1.80%
2.00%
2.20%
2.40%
0
5,0 00
10, 000
15, 000
20, 000
25, 000
2009 2010 2011 2012 2013 2014 2015 2016 2017 2018 2019
19,330
11,900 11,254
5,8754,202 3,766 3,323 3,047
0
5, 000
10, 000
15, 000
20, 000
25, 000
2,011
1,439
3,450
0
500
1,0 00
1,5 00
2,0 00
2,5 00
3,0 00
3,5 00
4,0 00
13
OXXO Stores as a Percentage of Mom & Pops in Mexico
Largest Store Chain in the Americas by Units
Note: For The Americas Section: Alimentation Couche-Tard includes US, Canada and Latin America as of February, 3, 2019. Source: Company Information. 7-Eleven: US, Canada and Mexico Operations as of Dec 2018. Source: Company Information. Rest of the companies: Source: CS News "Top 100 US Convenience Store Companies”, Published July 2018. Mom & pops: Company and INEGI information.
1 OXXO stores in Mexico as of December 31, 2019. 2 Total OXXO stores in LatAm as of December 31, 2019.
Other C-Storesin Mexico
Others
Mexico
Number of Stores
1
# OXXO stores in Mexico
% mom & pops in Mexico
2
The Americas
19,089
0
2,0 00
4,0 00
6,0 00
8,0 00
10, 000
12, 000
14, 000
16, 000
18, 000
20, 000
1
Mexico

14
Horizontal Growth: Plenty of Runway Ahead
19,089 stores in Mexico and counting
OXXO Penetration Level by Population
19 Distribution Centers
Penetration Population / OXXO
Medium <10,000 per store
Moderate 10,000-30,000 per store
Low >30,000 per store
Nuevo Leon1
Population: 5.1 mmOXXO Stores: 1,6523,099 people/store
Note: INEGI 2015 Inter Population Consensus Survey . FEMSA information as of December 31, 2019.1OXXO stores as of December 31, 2019. Includes LATAM
Valley of Mexico1
Population: 25.1 mmOXXO Stores: 2,7899,002 people/store
FEMSA Comercio has developed proprietary models to assist in identifying optimal
store locations, store formats and product categories
Tijuana1
Population: 1.6 mmOXXO Stores: 789
2,081 people/store

15
THIRSTQuench your thirst immediately
TIME OPTIMIZATIONAcquire one-stop products and services in a simple and fast way
DAILYTake home your everyday grocery needs
BREAKFASTStart your day with a practical breakfast
REPLENISHMENTReplenish your depleted grocery and non-food products
LUNCHSatisfy your hunger with an on-the-go meal
CRAVINGSatisfy your sudden craving for a snack, a meal or drink
GATHERINGStop by for your party needs
Differentiated Approach to Fill Consumer Needs

16
Fine-tuning Strategies to Drive Same-Store Sales and Profitability
SegmentationCategory Development -Prepared Food
Category Development -Services
+1,400 services offered in the store
17
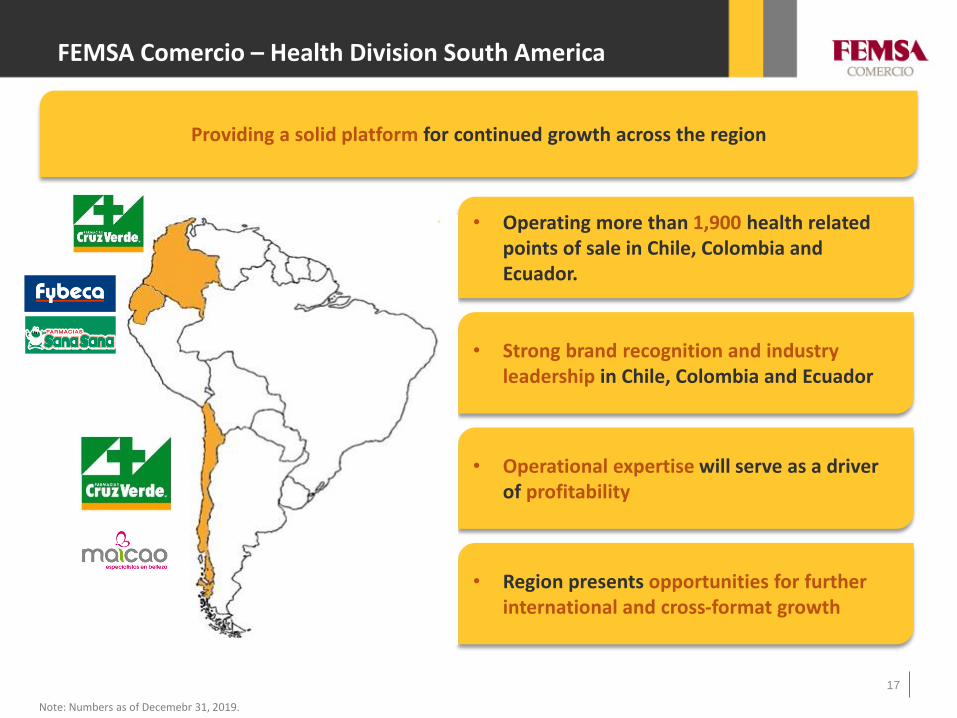
FEMSA Comercio – Health Division South America
• Operating more than 1,900 health related points of sale in Chile, Colombia and Ecuador.
• Strong brand recognition and industryleadership in Chile, Colombia and Ecuador
• Operational expertise will serve as a driver of profitability
Providing a solid platform for continued growth across the region
• Region presents opportunities for further international and cross-format growth
Note: Numbers as of Decemebr 31, 2019.

18
FEMSA Comercio – Health Division Mexico
• FEMSA Comercio now operates more than 1,250 drugstores in Mexico, or approximately 3% of industry units
• Current expected organic revenue growth of 10% in the Mexican operations
• Oxxo´s operational and logistics expertise will facilitate national expansion
• Standardizing business model across different regional brands
Aspiring to consolidate fragmented industry following OXXO game plan
Note: Numbers as of December 31, 2019.

1,023 1,079
1,515
1,9071,988
2,0732,168
3,161
A Growing Footprint
19
FEMSA Comercio’s Health Division is gradually becoming a key drugstore operator inLatin America
2 1 1
Source: 1 2019 Company Reports. FEMSA Comercio – Health Division includes drugstores and beauty stores.2 3Q17 Company Reports3 LatAm Retail Pharma Map, ILACAD World Retail, points of sale as of March, 2015; Euromonitor
LatAm Comparable Players by Number of Stores
HealthDivision
3 1 133

539540
541 541
545
536
537
538
539
540
541
542
543
544
545
546
4Q18 1Q19 2Q19 3Q19 4Q19
1.1%
Footprint
FEMSA is participating in the rapid transformation of Mexico’s Fuel industry
20
Gas Stations (OXXO GAS)
• New changes to Mexican regulatory framework now allow FEMSA to participate directly in the Energy sector, particularly through petrol stations
• We concentrate mainly in the northern part of the country, but with a growing presence in 17 Mexican States
+
-
Note: Numbers as of December 31, 2019.
Number of Stations(End of Quarter)
Station Annual Growth

12.6
10.912.4 12.3 12.2
17.5 17.6 17.7 17.7 17.8
4Q18 1Q19 2Q19 3Q19 4Q19
21
• High-growth, low asset-intensity, high-return business
• As of December 31, 2019 there were 545 OXXO GAS stations, representing around 4% of a highly-fragmented industry
Gas Stations (OXXO GAS)
1 Volume in thousands of liters considering same stations with more than twelve months of operations.2 Average price per liter in Mexican Pesos.
Same Station Volume1
(5.9%)
Priceper
Liter2
Revenue(Billions of Mexican Pesos)
448
421
4Q18 4Q19

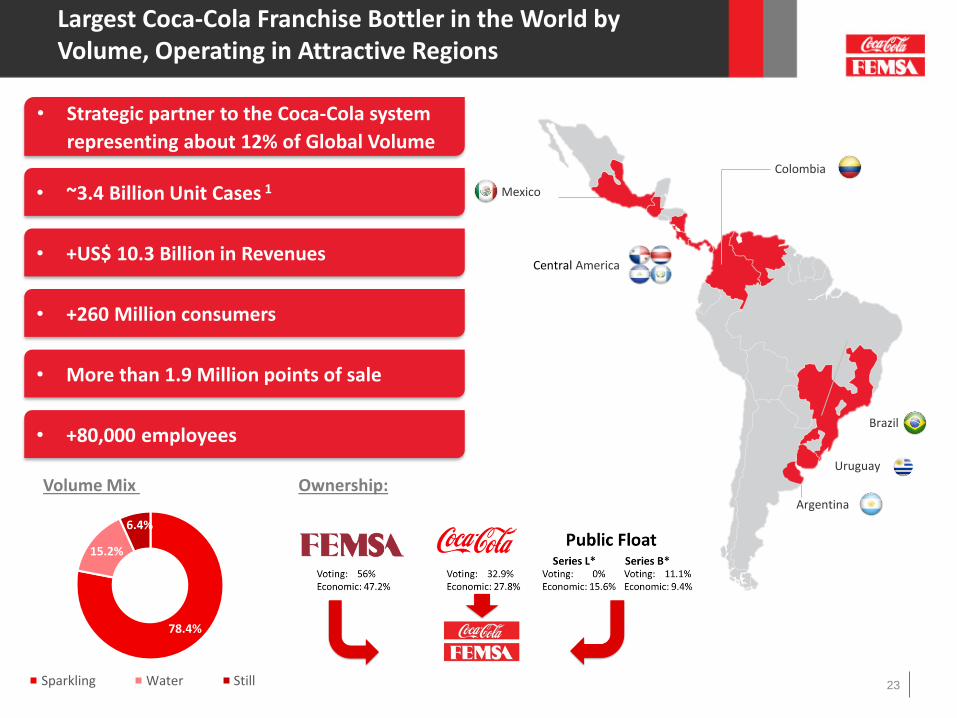
78.4%
15.2%
6.4%
Sparkling Water Still
Largest Coca-Cola Franchise Bottler in the World by Volume, Operating in Attractive Regions
23
Volume Mix Ownership:
Mexico
Colombia
Brazil
Argentina
• ~3.4 Billion Unit Cases 1
• +US$ 10.3 Billion in Revenues
• +260 Million consumers
• More than 1.9 Million points of sale
• +80,000 employees
• Strategic partner to the Coca-Cola system
representing about 12% of Global Volume
Central America
Uruguay

CAGR 08 – Mar 2020: 4%
Creating Economic Value During the Last Decade
24
KOF Market Cap Evolution (US$ MM)
• Consolidate as a Multi-category Leader.
• Reach Full Operating Potential.
• Growth Through Innovation.
• Growth Through Acquisitions.
• Proactive Environment Management.
1 Amounts expressed in millions of Mexican Pesos2 Includes the effect of IFRS-16
Source: Bloomberg, as of March 05, 2020.
Financial Highlights1
20192 2009 CAGR %
Revenue 194,471 102,767 7%
EBIT 25,423 15,835 5%
EBIT Margin 13.1% 15.4%
EBITDA 37,148 19,746 7%
EBITDA Margin 19.1% 19.2%
CAPEX 11,465 6,282 6%8,000
11,484
2008 March 2020

0
1,000
2,000
3,000
4,000
5,000
25
Strategic partner to the Coca-Cola System
Over the past 25 years, we have travelled a successful journey by consolidating across territories
and categories leveraging on our operational excellence and a disciplined approach to capital
allocation
Volume (Mn UC)
1994 20192003 2010
Points of sale (Mn) 1.5 1.6 1.9
Revenues (USD bn)
EBITDA (USD bn)
2,5001,451 3,369306
3.2 5.5 10.3
.8 1.1 1.9
2007
2008
2010
2011
20122013
2017
2016
2018
2019

KOF’s Strategic Framework continues to be the guide for the business…

…while their consumers and clients are at the center of everything they do.


Sustainability Strategy: Structure
29
We are committed to developing the capabilities needed to generate the economic, social, and environmental conditions required to operate today—and to grow in the future in harmony with our environment. That is how we understand sustainability.
We contribute to create economic and social value through our Strategic Sustainability Framework:

Selected Sustainability Achievements 2018
30
We are aware of the fact that our communities face challenges that are increasingly more complex. Consequently, we know we need to evolve and strengthen our decision-making processes based on criteria that simultaneously creates economic and social value, as defined by our mission.
• FEMSA and Coca-Cola FEMSA have been part of the Mexican Stock Exchange Sustainability Index for seven consecutive years.
• FEMSA and Coca-Cola FEMSA have been part of the FTSE4Good Index Series for 3 consecutive years.
• Coca-Cola FEMSA has been for seven consecutive years part of the Dow Jones Sustainability Index (DJSI) for Emerging Markets.
• FEMSA and Coca-Cola FEMSA have been for three consecutive years part of the DJSI Latin American Integrated Market Index (MILA).

Our Investment in Sustainability
31
At FEMSA we invest ~ 1% of our total consolidated revenue in sustainability every year.
USD
Mill
ion
s
Total Spending on Sustainability (by Pillar)
* In MXN terms the investment made on Sustainability during 2015 grew compared to 2014 and during 2014 compared to 2013, but when translated to USD it decreases due to the depreciation of the MXN against the USD (December 31 for each year).
Our People
Our Community
Our Planet
0
20
40
60
80
100
120
140
160
180
2010 2011 2012 2013 2014 2015 2016 2017 2018 2019

32
Going Forward
Sustained organic growth at OXXO in Mexico, with compelling growth in newcomplementary drugstore and fuel operations, as well as medium-term objectivesto test additional international markets.
Focus on disciplined capital deployment to take advantage of balance sheetflexibility, targeting assets consistent with our business platform and set ofcapabilities.
Continue to drive organic revenue growth across markets, working in tandem withThe Coca-Cola Company to enhance our portfolio by addressing evolving consumerpreferences, and continue to pursue incremental territories that are structurallywell suited to our skill set.

Financial Summary (Amounts in millions of Mexican Pesos)
33
2014 % Var 2015 % Var 2016 % Var 2017 % Var 2018 % Var 2019(1) % Var
Total Revenues 263,449 2% 311,589 18% 399,507 28% 460,456 15% 469,744 2% 506,711 8%
Income from Operations 29,983 0% 33,735 13% 37,427 11% 41,439 11% 41,576 0% 47,152 13%
% of Revenues 11% -2% 11% -5% 9% -13% 9% -4% 9% 9%
Operative Cash Flow 40,945 3% 46,626 14% 54,987 18% 61,418 12% 60,458 -2% 75,440 25%
% of Revenues 16% 1% 15% -4% 14% -8% 13% -3% 13% 15%
CAPEX 18,163 2% 18,885 4% 22,155 17% 25,180 14% 24,266 -4% 25,579 5%
% of Revenues 7% 0% 6% -12% 6% -8% 5% -1% 5% 5%
FEMCO
2014 % Var 2015 % Var 2016 % Var 2017 % Var 2018 % Var 2019(1) % Var
Total Revenues 109,624 12% 151,401 38% 209,166 38% 240,013 15% 266,133 11% 291,584 10%
Income from Operations 8,680 10% 11,105 28% 13,310 20% 14,331 8% 16,650 16% 21,041 26%
% of Revenues 8% -2% 7% -7% 6% -13% 6% -6% 6% 7%
Operative Cash Flow 11,756 11% 14,802 26% 18,306 24% 20,139 10% 23,157 15% 35,270 52%
% of Revenues 11% -1% 10% -9% 9% -10% 8% -4% 9% 12%
CAPEX 5,191 -9% 6,276 21% 8,405 34% 9,628 15% 11,123 16% 12,609 13%
% of Revenues 5% -19% 4% -12% 4% -3% 4% 0% 4% 4%
OXXO SSS %growth 2.7 13% 6.9 156% 7.0 1% 6.4 -9% 5.2 -17% 5.0 -5%
KOF
2014 % Var 2015 % Var 2016 % Var 2017 % Var 2018 % Var 2019(1) % Var
Total Revenues 147,298 -6% 152,360 3% 177,718 17% 203,780 15% 182,342 -11% 194,472 7%
Income from Operations 20,743 -3% 22,645 9% 23,920 6% 26,175 9% 24,673 -6% 25,423 3%
% of Revenues 14% 2% 15% 6% 13% -9% 13% -5% 14% 13%
Operative Cash Flow 28,385 -1% 31,233 10% 35,495 14% 39,546 11% 35,456 -10% 37,148 5%
% of Revenues 19% 5% 20% 6% 20% -3% 19% -3% 19% 19%
CAPEX 11,313 -3% 11,484 2% 12,391 8% 14,612 18% 11,069 -24% 11,465 4%
% of Revenues 8% 2% 8% -2% 7% -7% 7% 3% 6% 6%
Volume (mill UC) 3,417.3 7% 3,435.6 1% 3,334.0 -3% 3,318.1 0% 3,321.8 0% 3,369.2 1%
1) Includes the effect of IFRS-16

14.5% 4.2%2.4% 44.6% 0.7% 33.6%
89%
11%
54.5%
18.9%
18.8%
7.8%
8.1%
1.7%
1.8%
3.9%
34
Other Currencies
Euros
Mexican Pesos
Currency Average Rate
6.68%
Weighted Average
Rate
Variable Rate
FixedRate
US Dollars
Debt Profile – December 31, 2019
Maturity
2020 2021 2022 2023 2024 2025+

Contact Information
[email protected]: (52) 818328-6167
Stock Information
Bolsa Mexicana de Valores (BMV): FEMSAUBDNew York Stock Exchange, Inc (NYSE): FMXADR 10:1