investor presentation preliminary ifrs group result as at
TRANSCRIPT

Investor Presentation
IFRS Group Result as at 30 June 2021
19th August 2021
Agenda
READY FOR THE FUTURETransformation in completion, BdB entrance envisaged
1.
FINANCIAL GROUP RESULTSH1 2021
2.
SEGMENT OVERVIEWH1 2021
3.
APPENDIX5.
2
HCOB AT A GLANCEA private commercial bank and specialist financier
4.

1. READY FOR THE FUTURETransformation in completion, BdB entrance envisaged
3
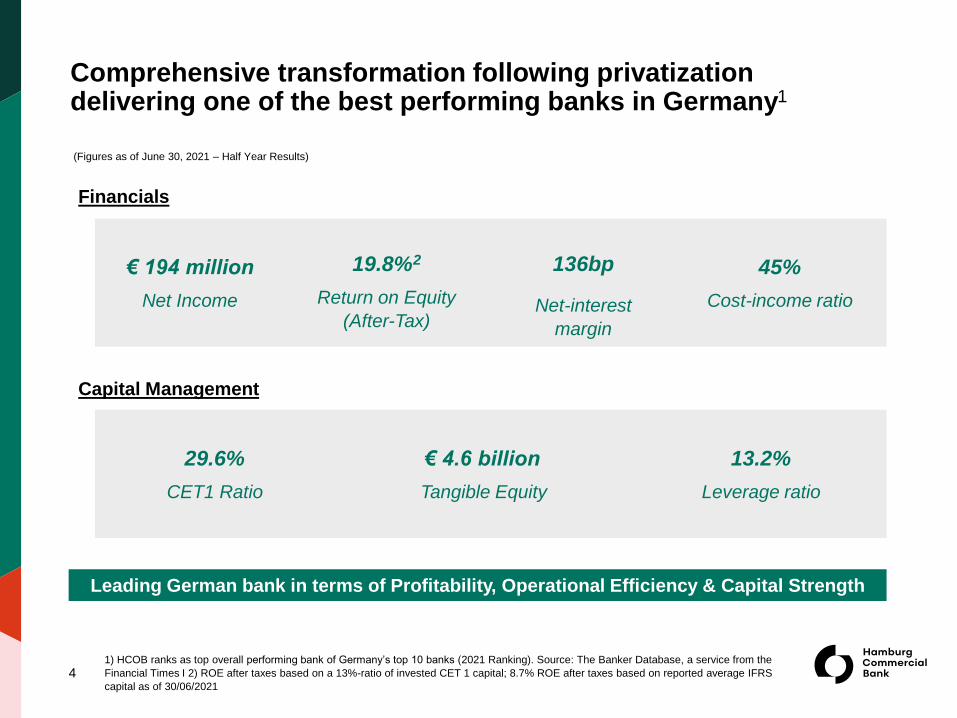
Comprehensive transformation following privatization delivering one of the best performing banks in Germany1
4
Financials
€ 194 million
Net Income
19.8%2
Return on Equity
(After-Tax)
45%
Cost-income ratio
Capital Management
29.6%
CET1 Ratio
€ 4.6 billion
Tangible Equity
13.2%
Leverage ratio
Leading German bank in terms of Profitability, Operational Efficiency & Capital Strength
1) HCOB ranks as top overall performing bank of Germany’s top 10 banks (2021 Ranking). Source: The Banker Database, a service from the
Financial Times I 2) ROE after taxes based on a 13%-ratio of invested CET 1 capital; 8.7% ROE after taxes based on reported average IFRS
capital as of 30/06/2021
(Figures as of June 30, 2021 – Half Year Results)
136bp
Net-interest
margin
5
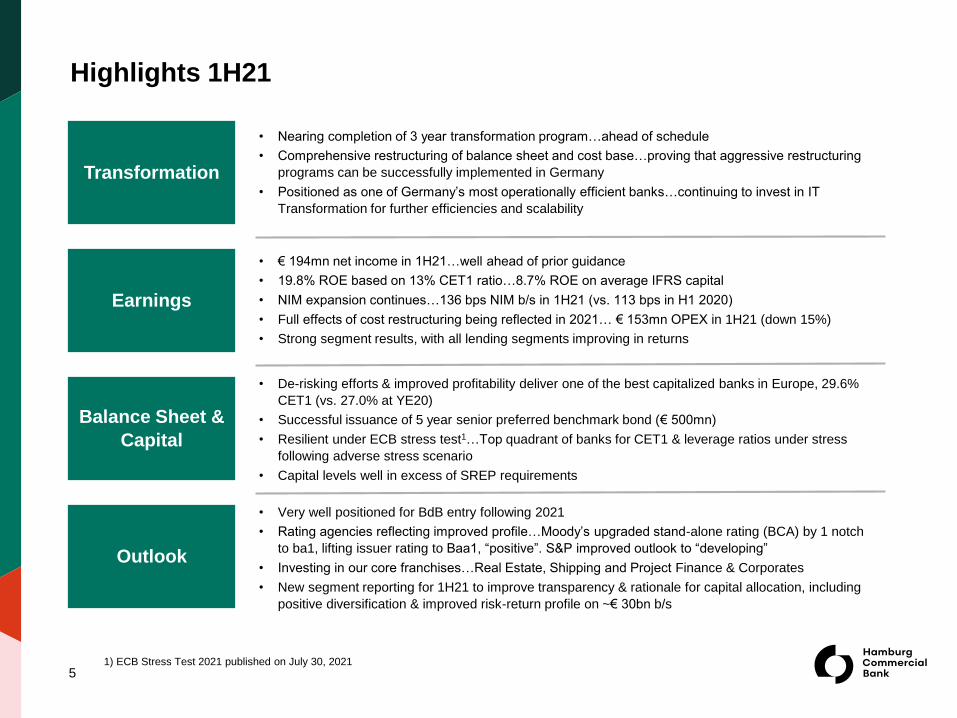
Transformation
• Nearing completion of 3 year transformation program…ahead of schedule
• Comprehensive restructuring of balance sheet and cost base…proving that aggressive restructuring
programs can be successfully implemented in Germany
• Positioned as one of Germany’s most operationally efficient banks…continuing to invest in IT
Transformation for further efficiencies and scalability
Earnings
• € 194mn net income in 1H21…well ahead of prior guidance
• 19.8% ROE based on 13% CET1 ratio…8.7% ROE on average IFRS capital
• NIM expansion continues…136 bps NIM b/s in 1H21 (vs. 113 bps in H1 2020)
• Full effects of cost restructuring being reflected in 2021… € 153mn OPEX in 1H21 (down 15%)
• Strong segment results, with all lending segments improving in returns
Balance Sheet &
Capital
• De-risking efforts & improved profitability deliver one of the best capitalized banks in Europe, 29.6%
CET1 (vs. 27.0% at YE20)
• Successful issuance of 5 year senior preferred benchmark bond (€ 500mn)
• Resilient under ECB stress test1…Top quadrant of banks for CET1 & leverage ratios under stress
following adverse stress scenario
• Capital levels well in excess of SREP requirements
Outlook
• Very well positioned for BdB entry following 2021
• Rating agencies reflecting improved profile…Moody’s upgraded stand-alone rating (BCA) by 1 notch
to ba1, lifting issuer rating to Baa1, “positive”. S&P improved outlook to “developing”
• Investing in our core franchises…Real Estate, Shipping and Project Finance & Corporates
• New segment reporting for 1H21 to improve transparency & rationale for capital allocation, including
positive diversification & improved risk-return profile on ~€ 30bn b/s
1) ECB Stress Test 2021 published on July 30, 2021
Highlights 1H21

Privatization Transformation Envisaged BdB
Entry & start
“Business as
Usual”
Game plan Privatization:
► Create a capital efficient and profitable German bank with strong client franchise
► Data driven and cloud enabled operating company (IT Transformation in process)
► Rapid and extremely successful transformation delivered ahead of plan
Q4 2018 2021+
De-Risking & Capital
EfficiencyCost Savings &
Operational Efficiency
NIM Expansion &
Liability Optimization
Invest in Technology &
People
6
HCOB Transformation nearing completion…building track record of
execution and consistently delivering on our commitments
Employee Restructuring
(reduced from 1700+ FTEs
to ~800 target end of 2022)
HQ Facility Rationalization
(14 to 2 buildings)
Closed Asian operations
(Singapore & Hong Kong)
Self-Help (Sharp reduction
in mgmt. consultants)
• IT Transformation (€40mn+
run rate savings)
Nearly Complete
Balance sheet reduction
(€ 55.1bn to € 31.6bn)
RWA reduction (€ 22.1bn
to € 14.8bn)
CET1 build
(18.5% to 29.6%)
19.8% after tax ROE for
1H21 at 13% CET1
Capital structure
optimization
• Implementation of Future
Model Landscape started
Pricing disciple, including
SVA hurdles
Exited low returning, non-
core lines of business
Revised asset allocation,
incl. strong reduction of NIB1
assets
Cost of funds reduced by
~70 bps to 31bps for 1H21
NIM b/s: 61bps increase
since 2019 to 136bps (1H21)
Strengthened & redesigned
management board & MD’s
Delivery of new International
Payments platform
• € 120mn+ IT investment
including transition to cloud
enabled operating model
• Targeted new hires in
commercial & technology
leadership roles
Transformation delivering SVA positive business model
1) NIB – Non Interest Bearing
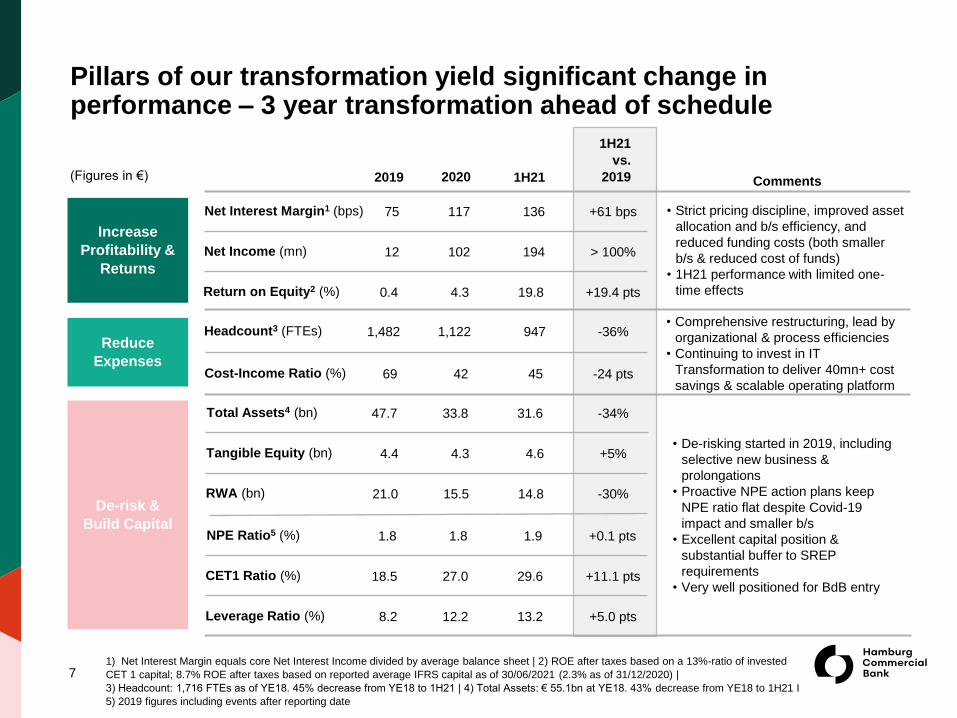
Pillars of our transformation yield significant change in performance – 3 year transformation ahead of schedule
7
(Figures in €) 1H212019
Increase
Profitability &
Returns
Reduce
Expenses
De-risk &
Build Capital
2020
1H21
vs.
2019
Net Income (mn) 12 102 194 > 100%
Headcount3 (FTEs) 1,482 1,122 947 -36%
Total Assets4 (bn) 47.7 33.8 31.6 -34%
NPE Ratio5 (%) 1.8 1.8 1.9 +0.1 pts
CET1 Ratio (%) 18.5 27.0 29.6 +11.1 pts
Return on Equity2 (%) 0.4 4.3 19.8 +19.4 pts
Net Interest Margin1 (bps) 75 117 136 +61 bps
Cost-Income Ratio (%) 69 42 45 -24 pts
RWA (bn) 21.0 15.5 14.8 -30%
Tangible Equity (bn) 4.4 4.3 4.6 +5%
Leverage Ratio (%) 8.2 12.2 13.2 +5.0 pts
Comments
• Strict pricing discipline, improved asset
allocation and b/s efficiency, and
reduced funding costs (both smaller
b/s & reduced cost of funds)
• 1H21 performance with limited one-
time effects
• Comprehensive restructuring, lead by
organizational & process efficiencies
• Continuing to invest in IT
Transformation to deliver 40mn+ cost
savings & scalable operating platform
• De-risking started in 2019, including
selective new business &
prolongations
• Proactive NPE action plans keep
NPE ratio flat despite Covid-19
impact and smaller b/s
• Excellent capital position &
substantial buffer to SREP
requirements
• Very well positioned for BdB entry
1) Net Interest Margin equals core Net Interest Income divided by average balance sheet | 2) ROE after taxes based on a 13%-ratio of invested
CET 1 capital; 8.7% ROE after taxes based on reported average IFRS capital as of 30/06/2021 (2.3% as of 31/12/2020) |
3) Headcount: 1,716 FTEs as of YE18. 45% decrease from YE18 to 1H21 | 4) Total Assets: € 55.1bn at YE18. 43% decrease from YE18 to 1H21 I
5) 2019 figures including events after reporting date

Guidance 2021/22 – HCOB focusing on recurring profitability & projecting higher Net Income for 2021
(Figures in €) 2022e
• Core income supported by NIM b/s expansion to
>150bp (YE) & improving asset mix with increased
share of productive assets on smaller b/s
• Benefits of cost restructuring realized in run rate
• Revised guidance for net income 2021 from
>€ 200mn to >€ 250mn
• Strict return thresholds…build/grow SVA positive
asset classes…exit lower performing segments
• RWA increase due to change in rating model
landscape, main impact to be reflected in 2022
• Stable asset quality & resilient capital levels
• Strong capital & recurring earnings reduce the
economic rational for issuing an AT1 bond
medium term
2020
Net Income (mn) >250102
Headcount (FTEs) ~8001,122
Total Assets (bn) ~3033.8
NPE Ratio (%) <2.01.8
CET1 Ratio (%) ~2527.0
Return on Equity1 (%) >12.0 4.3
• Strict cost management continues driven by
employee restructuring & reduced facility footprint
while investing in IT
• Moving towards target CIR driven by recurring
income, not one-offs
Total Income (mn) >600656
Cost-Income Ratio (%) 40-4242
RWA (bn) ~1815.5
Increase
Profitability &
Returns
Reduce
Expenses
De-risk &
Build Capital
81) ROE after taxes based on a 13%-ratio of invested CET 1 capital
2021e
~600
>250
>12.0
~900
~50
~30
~15
<2.0
~30
Tangible Equity (bn) >4.94.3 >4.6

Ratings Overview1 Moody’s S&P
Issuer Ratings
Deposit Rating Baa1 –
Issuer Credit Rating (Long-Term) Baa1 / positiveBBB /
developing
Short-term Debt P-2 A-2
Stand-alone Rating ba1 bbb-
Instrument Ratings (Unsecured Issuances)
“Preferred” Senior Unsecured Debt Baa1 –
“Non-Preferred” Senior Unsecured Debt Baa2 –
Subordinated Debt (Tier 2) Ba2 –
Instrument Ratings (Secured Issuances)
Mortgage Covered Bonds Aa1 –
Ship Covered Bonds A2 –
Robust and resilient capitalization, well above regulatory
requirements and peers
Substantially de-risked and simplified asset portfolio
underpinned by legacy disposals and conservative new
business with prudent risk appetite and improving
diversification, amid macroeconomic uncertainty
Strong coverage of credit risks
Progress towards diversifying the funding base, extending
the maturity profile & maintaining substantial liquidity buffer
Demonstrated expertise of owners drives best practices
Upside Drivers
Key Credit Strengths
• Demonstrating underlying franchise strength, with further
improvement in risk-adjusted profitability
• Continued diversification by reducing concentration risks
from cyclical assets
• Further maturity extension and diversified funding
• Admission to BdB’s (Association of German Banks) Deposit
Guarantee Fund (ESF)
9
Recent upgrade by Moody’s to Baa1 reflects excellent capital position, de-risked portfolio and strong profitability trajectory
1) Latest publications by rating agencies available on Hamburg Commercial Bank’s website: https://www.hcob-bank.de/en/investoren/rating/rating/

Key
MetricsRatios(in %)
HCOB
GERDeutsche
Bank
Commerz-
bank
Aareal
Bank
Deutsche
Pfandbrief-
bank
IKB
Deutsche
Industrie-
bank
BayernLB EUH1 2021 Target
2022
Capital
CET1 ratio 29.6 ~25 16.2 13.2 13.4 19.2 15.4 14.8 15.6 15.6
Leverage ratio 13.2 >12 5.0 4.8 4.6 5.7 5.9 7.5 4.4 5.6
Asset Quality NPE / NPL ratio 1.91 <21 1.2 1.4 0.8 6.0 0.9 1.8 0.5 2.5
Liquidity LCR 170 ~140 166 143 - >100 >150 205 - 174
Profitability
CIR 45 40-42 73 78 82 45 39 60 55 64
ROE2 19.8 >12 4.7 6.5 -3.8 1.9 6.0 8.8 9.5 7.6
NIM 1.4 >1.5 1.0 1.2 0.9 1.2 0.8 1.3 0.7 1.3
Long-Term
Rating
Moody’s /
S&P
Baa1 /
BBB
A3 /
BBB+
A2 /
BBB+
A1 /
BBB+A3/ - - / BBB+ Baa1 / - Aa3 / -
Strong financials well above German peers – HCOB with excellent metrics for capital and profitability
Profitability Key profitability metrics (CIR, ROE, NIM) well above German peers, due to selective new business, NIM expansion, B/S
optimization & decreasing funding costs – expanding successfully started track record will be major rating driver
Capital Excellent capitalization, well above average for higher-rated peers, excess capital will be managed over time
Asset Quality De-risked, sound, well-performing portfolio with manageable exposure in key Covid-19 impacted sectors & strong loss coverage
Liquidity Substantial liquidity buffer provide robust cushion for adverse scenarios, funding structure increasingly diversified
10Source: Company reports on H1 2021 and EBA Risk Dashboard, 2021-Q1 for GER and EU comparisons | 1) NPE for HCOB | 2) ROE after
taxes based on a 13%-ratio of invested CET 1 capital as reported for HCOB (8.7% ROE after taxes based on reported average IFRS capital
as of H1 2021)
In %
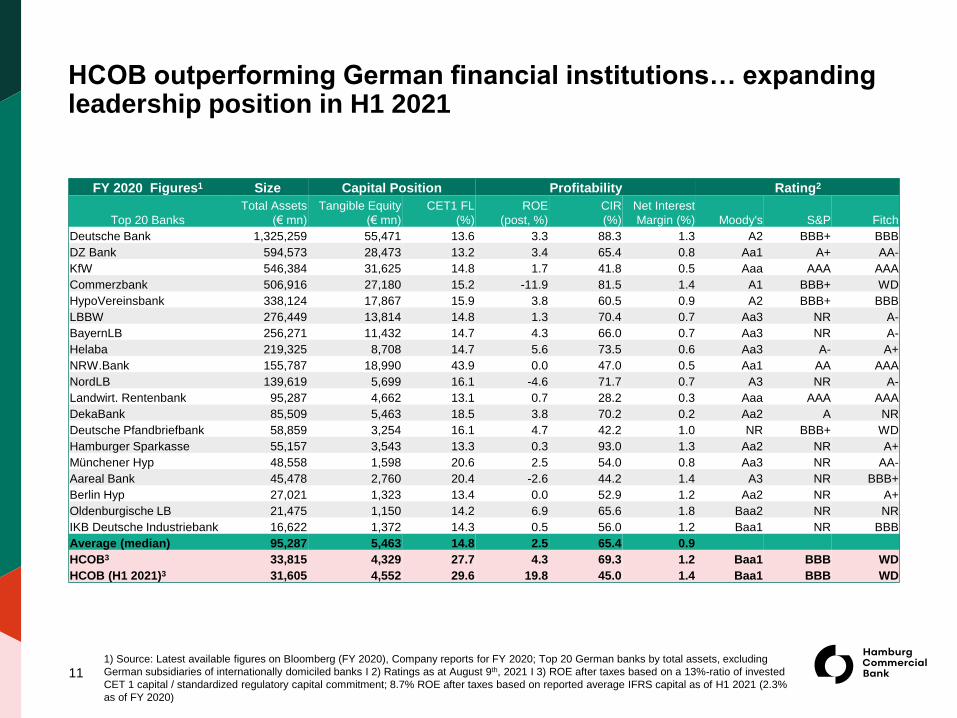
HCOB outperforming German financial institutions… expanding leadership position in H1 2021
11
FY 2020 Figures1 Size Capital Position Profitability Rating2
Top 20 Banks
Total Assets
(€ mn)
Tangible Equity
(€ mn)
CET1 FL
(%)
ROE
(post, %)
CIR
(%)
Net Interest
Margin (%) Moody's S&P Fitch
Deutsche Bank 1,325,259 55,471 13.6 3.3 88.3 1.3 A2 BBB+ BBB
DZ Bank 594,573 28,473 13.2 3.4 65.4 0.8 Aa1 A+ AA-
KfW 546,384 31,625 14.8 1.7 41.8 0.5 Aaa AAA AAA
Commerzbank 506,916 27,180 15.2 -11.9 81.5 1.4 A1 BBB+ WD
HypoVereinsbank 338,124 17,867 15.9 3.8 60.5 0.9 A2 BBB+ BBB
LBBW 276,449 13,814 14.8 1.3 70.4 0.7 Aa3 NR A-
BayernLB 256,271 11,432 14.7 4.3 66.0 0.7 Aa3 NR A-
Helaba 219,325 8,708 14.7 5.6 73.5 0.6 Aa3 A- A+
NRW.Bank 155,787 18,990 43.9 0.0 47.0 0.5 Aa1 AA AAA
NordLB 139,619 5,699 16.1 -4.6 71.7 0.7 A3 NR A-
Landwirt. Rentenbank 95,287 4,662 13.1 0.7 28.2 0.3 Aaa AAA AAA
DekaBank 85,509 5,463 18.5 3.8 70.2 0.2 Aa2 A NR
Deutsche Pfandbriefbank 58,859 3,254 16.1 4.7 42.2 1.0 NR BBB+ WD
Hamburger Sparkasse 55,157 3,543 13.3 0.3 93.0 1.3 Aa2 NR A+
Münchener Hyp 48,558 1,598 20.6 2.5 54.0 0.8 Aa3 NR AA-
Aareal Bank 45,478 2,760 20.4 -2.6 44.2 1.4 A3 NR BBB+
Berlin Hyp 27,021 1,323 13.4 0.0 52.9 1.2 Aa2 NR A+
Oldenburgische LB 21,475 1,150 14.2 6.9 65.6 1.8 Baa2 NR NR
IKB Deutsche Industriebank 16,622 1,372 14.3 0.5 56.0 1.2 Baa1 NR BBB
Average (median) 95,287 5,463 14.8 2.5 65.4 0.9
HCOB3 33,815 4,329 27.7 4.3 69.3 1.2 Baa1 BBB WD
HCOB (H1 2021)3 31,605 4,552 29.6 19.8 45.0 1.4 Baa1 BBB WD
1) Source: Latest available figures on Bloomberg (FY 2020), Company reports for FY 2020; Top 20 German banks by total assets, excluding
German subsidiaries of internationally domiciled banks I 2) Ratings as at August 9th, 2021 I 3) ROE after taxes based on a 13%-ratio of invested
CET 1 capital / standardized regulatory capital commitment; 8.7% ROE after taxes based on reported average IFRS capital as of H1 2021 (2.3%
as of FY 2020)

12
Sustainability – Key achievements and next steps in embedding ESG into company’s strategic framework
HCOB integrates sustainability considerations and objectives into its business strategy and actively manages social and environmental
risks associated with business engagements. We regard ourselves responsible to limit potential negative impact, to be a driver for
positive change, and to be a reliable partner to advise and finance our clients ESG transition activities. Thereby, we mitigate
risks, contribute to positive change and seek for continuous improvement in environmental and social practices. In addition, we strive to
be a ‘Net Zero Bank’ by 2050 the latest.
H2 20212020 H1 2021
Principles for Responsible
Banking and UNEP FI
membership signed
ESG applied to credit standards
and Black List established
ESG Scoring of new business
and simulation of total loan book
First sustainability rating
assessments with significant
improvements for Sustainalytics
and IMUG
Comprehensive ESG Roadmap finalized
CSR Report 2020 published on 1st April
Sustainability Governance –
Sustainability Committee & Office
established on 1st April
Black List enhancement and
operationalization completed
Investment Policy with respective ESG
considerations approved
Signed PCAF as carbon accounting
standard
Updated ESG Factbook published
ESG related strategy approach and target
setting/ambition levels for Group HCOB
and by business unit aligned with supporting
our clients energy transition priorities
ESG Scoring on single loan basis of entire
loan portfolio
Green Bond issuance capability
2nd Sustainability Rating Assessment
with focus on ISS and MSCI
2019 2020
CCC BB
2019 2020
28 14
2019 2020
C- C-
2019 2020
BB BB
HCOB Average range of peers rating results Legend:
40+ 0D AAA D- A+ CCC AAA
2. FINANCIAL GROUP RESULTS H1 2021
13

14
€ mn H1 2021 H1 2020 ∆
Net interest income 269 351 -23
Net commission income 22 27 -19
Result from hedging -2 2 >-100
Result from financial instruments
categorised as FVPL28 -149 >100
Net income from financial investments 2 5 -60
Result from the disposal of financial
assets classified as AC19 44 -57
Total Income 338 280 21
Loan loss provisions 22 -94 >100
Total income after loan loss provisions 360 186 94
Administrative expenses -153 -181 -15
Other operating result 5 100 -95
Expenses for regulatory affairs, deposit
guarantee fund and banking associations-31 -29 7
Net income before restructuring and
transformation181 76 >100
Result from restructuring and
transformation-13 -5 >-100
Net income before taxes 168 71 >100
Income tax expense 26 -67 >-100
Group net result 194 4 >100
H1 2021 H1 2020 ∆
ROE before taxes1
17.1% 5.5% 11.6pts
ROE after taxes1
19.8% 0.3% 19.5pts
NIM2
136 113 23bp
CIR 45% 48% -3pts
Risk Costs3
-19 59 -78bp
NPE Coverage Ratio AC4
45% 48% -3pts
► Total income (€ 338mn) driven by solid recurring earnings, in
particular sound trend in NII and NIM, and positive FVPL
result
► Better than expected LLP (€ 22mn net reversal) due to
sound risk development. Strong LLP buffers to mitigate
Covid-19 driven impact - potential upside for full year if
positive development continues
► OPEX decline by 15%, reflecting decisive cost management
► Other operating result significantly lower, reflecting nearly
neutral impact of one-off effects (e.g. building sales
dominated last year)
► Overall, strong financial metrics from increasingly strong
NIM, downward trend for CIR and strong ROE reflect upward
profitability trend
1) ROE before / after taxes based on a 13%-ratio of invested CET 1 capital as reported; 8.7% ROE after taxes based on reported average
IFRS capital as of 30/06/2021 I 2) NIM: Core NII / avg. B/S I 3) Risk Costs: LLP/ avg. loans I 4) Previous year as of 31.12.2020
Solid revenues, lower LLPs and decisively managed costs drive profitability – overhaul of b/s increasingly bearing fruit
15
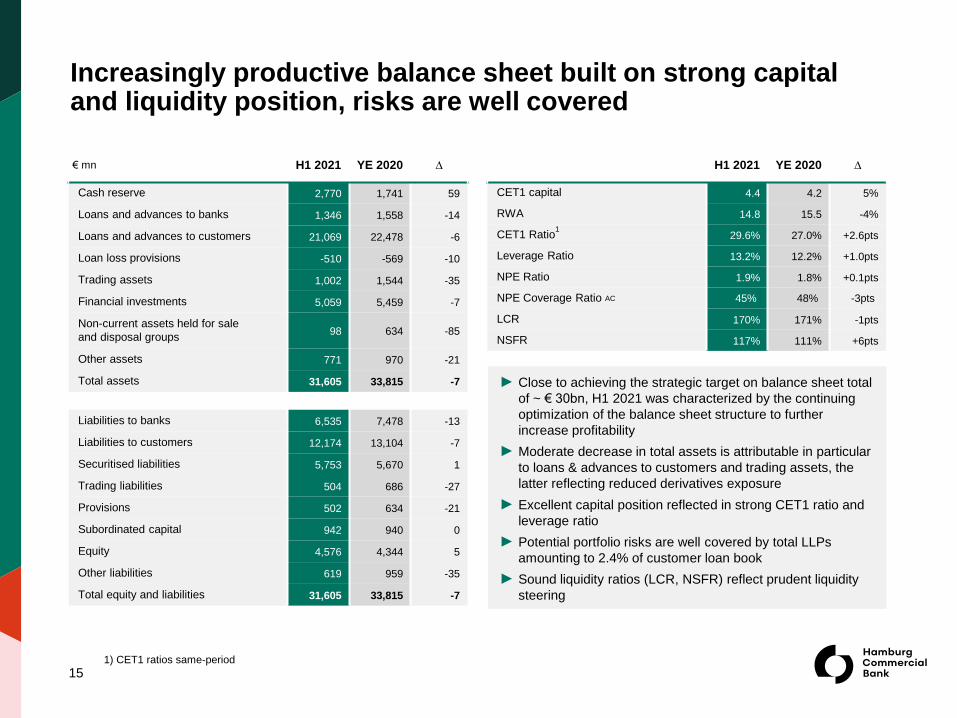
€ mn H1 2021 YE 2020 ∆
Cash reserve 2,770 1,741 59
Loans and advances to banks 1,346 1,558 -14
Loans and advances to customers 21,069 22,478 -6
Loan loss provisions -510 -569 -10
Trading assets 1,002 1,544 -35
Financial investments 5,059 5,459 -7
Non-current assets held for sale
and disposal groups98 634 -85
Other assets 771 970 -21
Total assets 31,605 33,815 -7
Liabilities to banks 6,535 7,478 -13
Liabilities to customers 12,174 13,104 -7
Securitised liabilities 5,753 5,670 1
Trading liabilities 504 686 -27
Provisions 502 634 -21
Subordinated capital 942 940 0
Equity 4,576 4,344 5
Other liabilities 619 959 -35
Total equity and liabilities 31,605 33,815 -7
H1 2021 YE 2020 ∆
CET1 capital 4.4 4.2 5%
RWA 14.8 15.5 -4%
CET1 Ratio1
29.6% 27.0% +2.6pts
Leverage Ratio 13.2% 12.2% +1.0pts
NPE Ratio 1.9% 1.8% +0.1pts
NPE Coverage Ratio AC 45% 48% -3pts
LCR 170% 171% -1pts
NSFR 117% 111% +6pts
► Close to achieving the strategic target on balance sheet total
of ~ € 30bn, H1 2021 was characterized by the continuing
optimization of the balance sheet structure to further
increase profitability
► Moderate decrease in total assets is attributable in particular
to loans & advances to customers and trading assets, the
latter reflecting reduced derivatives exposure
► Excellent capital position reflected in strong CET1 ratio and
leverage ratio
► Potential portfolio risks are well covered by total LLPs
amounting to 2.4% of customer loan book
► Sound liquidity ratios (LCR, NSFR) reflect prudent liquidity
steering
1) CET1 ratios same-period
Increasingly productive balance sheet built on strong capital and liquidity position, risks are well covered
16
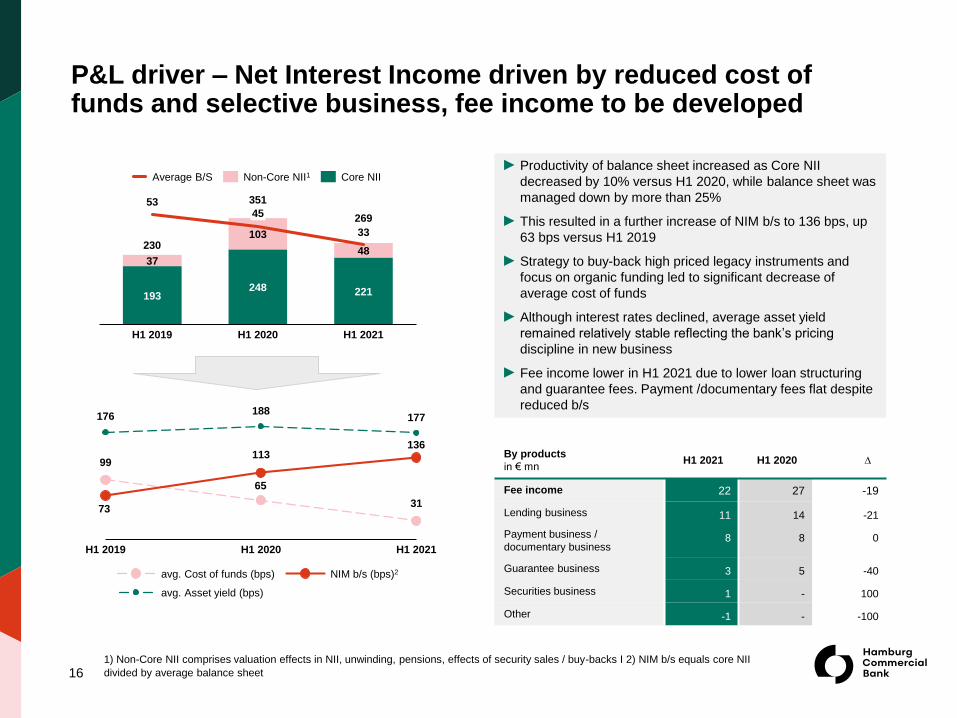
► Productivity of balance sheet increased as Core NII
decreased by 10% versus H1 2020, while balance sheet was
managed down by more than 25%
► This resulted in a further increase of NIM b/s to 136 bps, up
63 bps versus H1 2019
► Strategy to buy-back high priced legacy instruments and
focus on organic funding led to significant decrease of
average cost of funds
► Although interest rates declined, average asset yield
remained relatively stable reflecting the bank’s pricing
discipline in new business
► Fee income lower in H1 2021 due to lower loan structuring
and guarantee fees. Payment /documentary fees flat despite
reduced b/s
P&L driver – Net Interest Income driven by reduced cost of funds and selective business, fee income to be developed
1) Non-Core NII comprises valuation effects in NII, unwinding, pensions, effects of security sales / buy-backs I 2) NIM b/s equals core NII
divided by average balance sheet
By products
in € mnH1 2021 H1 2020 ∆
Fee income 22 27 -19
Lending business 11 14 -21
Payment business /
documentary business 8 8 0
Guarantee business 3 5 -40
Securities business 1 - 100
Other -1 - -100
193248 221
37
103
48
53
33
400
0
100
200
300
H1 2019
45
H1 2020 H1 2021
230
351
269
Average B/S Non-Core NII1 Core NII
99
31
188177
73
176
113
H1 2019 H1 2020 H1 2021
avg. Cost of funds (bps)
avg. Asset yield (bps)
NIM b/s (bps)2
136
65

Operating expenses – significantly reduced RTB costs and temporarily elevated CTB costs due to IT transformation
17
CAPEX
Restruc/Transf.4
23 23
7162
87
68
H1 2020
NPC (rtb)2
H1 2021
PC (rtb)1
NPC (ctb)3
181
153
-15%
135
3129Regulatory costs
95
45%48%CIR
Opex
► OPEX reduced by 15% to € 153mn, thereof reduction run
the bank (rtb) costs by -18% (€ 130mn)
- PC (rtb)1 reduction due to staff downsizing linked to
reduction in balance sheet volume, lower new business,
simplification of processes, outsourcing
- NPC (rtb)2 initial reductions especially due to lower
building costs and legal advice
- NPC (ctb)3 temporary additional requirements due to IT
transformation projects
► Moderate temporary Restructuring/Transformation costs for
e.g. decommissioning of legacy IT
► Stable regulatory costs despite increasing target volumes for
bank levy
► Limited use of CAPEX especially for IT transformation
► Improved CIR development below 50%
in € mn, rounding differences may occur
1) PC (rtb): personnel costs – run the bank | 2) NPC (rtb): non personnel costs - run the bank | 3) NPC (ctb): non personnel costs - change
the bank (projects) | 4) Restruc/Transf.: restructuring / transformation costs
9471,215FTE

Credit loss expense & risk costs1
in € mn, in bp
KPIs H1 2021 2020 2019
NPE 645 624 872
NPE coverage ratio (AC) in % 45.2 47.9 57.1
NPE ratio in % 1.9 1.8 1.83
Total LLP b/s 510 569 708
Total LLP coverage in % 2.4 2.5 2.3
Stage 1 LLP b/s 91 91 57
Stage 1 coverage in % 0.5 0.5 0.2
Stage 2 LLP b/s 179 216 308
Stage 2 coverage in % 7.3 7.9 11.2
Stage 3 SLLP 4 b/s 240 262 343
Balance sheet view and coverage ratios
-24
33
-62
-1-8
0
-94
H1 2021H1 2020
4-14
22Stage 2
Stage 1
Stage 3
Other
-59bp 19bp
2
► Slight NPE increase due to new COVID-19 induced defaults
particularly in Real Estate, partially compensated by ongoing
NPE Action Plan
► Slight increase of NPE ratio from 1.8% to 1.9% on back of
lower b/s volumes
► Solid level of risk coverage as total LLP on b/s cover 2.4% of
total loan book. Coverage ratio on NPE by SLLP (stage 3) is
sound 45%
Rounding differences possible | 1) Risk Costs (Loan loss provisions / avg. loans) I 2) Other incl. FX, FVOCI, Direct write-downs, Non-
substantial modifications, payments received on loans and advances previously written down I 3) 2019 figures including events after
reporting date I 4) Stage 3 incl. POCI | 5) Transaction for which there is no internal or external rating available are reflected in the “Other”
line item, such as receivables from third parties of the Bank’s consolidated equity holdings
Moderate LLP reversals in H1 2021, strong coverage of portfolio risks by total LLP amounting to 2.4% of loan book
18
Portfolio structure by ratingin %
EAD total: € 33.8bn (2020: € 35.4bn)
Default13-15Investment
Grade
6-9 10-12 Other
70% 70%
22% 23%
4% 3% 2% 2%1% 2% 0% 0%
H1 2021
YE 2020
5
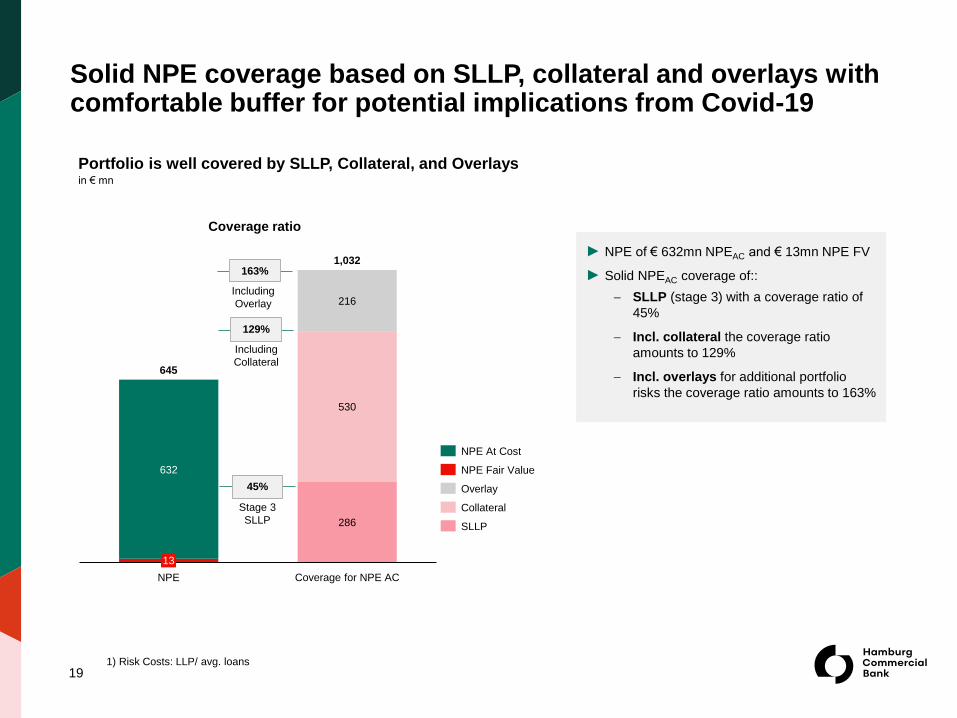
Solid NPE coverage based on SLLP, collateral and overlays with comfortable buffer for potential implications from Covid-19
286
632
530
216
13
Coverage for NPE ACNPE
1,032
645
NPE At Cost
Overlay
NPE Fair Value
SLLP
Collateral
Portfolio is well covered by SLLP, Collateral, and Overlaysin € mn
45%
129%
163%
Coverage ratio
Stage 3
SLLP
Including
Collateral
Including
Overlay
191) Risk Costs: LLP/ avg. loans
► NPE of € 632mn NPEAC and € 13mn NPE FV
► Solid NPEAC coverage of::
SLLP (stage 3) with a coverage ratio of
45%
Incl. collateral the coverage ratio
amounts to 129%
Incl. overlays for additional portfolio
risks the coverage ratio amounts to 163%

Drivers of CET1 Ratio development3
in %
20
Development of RWA / capital ratiosin € bn
► Further increased CET1 ratio of 29.6% underlines strong capital position with capital surplus well above regulatory requirements
► CET1 capital increased by positive P&L result of H1 2021 and an increased other comprehensive income (OCI)
► Leverage ratio further strengthened to very strong 13.2% (12.2%)
► RWA significantly reduced by de-risking started in 2019 and careful new business selection
15.5
21.0
18.5%
2019 2020
27.0% 29.6%
14.8
H1 2021
2.7% 2.0%8.6%
SREP
23.5%
33.3%36.0%
13.3%
+ 22.7 pp.
RWA
CET1 ratio
T2 requirement
Tier 2 AT1 requirement
CET1 requirement incl. CBR
OCI H1
2021
31.12.
2020
portfolio
(credit
risk)
1.3
FMLresult
H1 2021
0.3
1.6
-0.3-0.2
other 30.06.
2021
27.0
29.6
estimated RWA
impact2)
1) Minor fluctuations due to change of counter-cyclical buffer possible; as of ECB letter 2020 additionally Pillar 2 Guidance (P2G) of 1.0% generally
applies I 2) Estimated impact of approx. € 175mn RWA add-on by FML I 3) Rounding differences possible
Capital position further strengthened by retained earnings due to increasing profitability, rigorous de-risking supportive
21
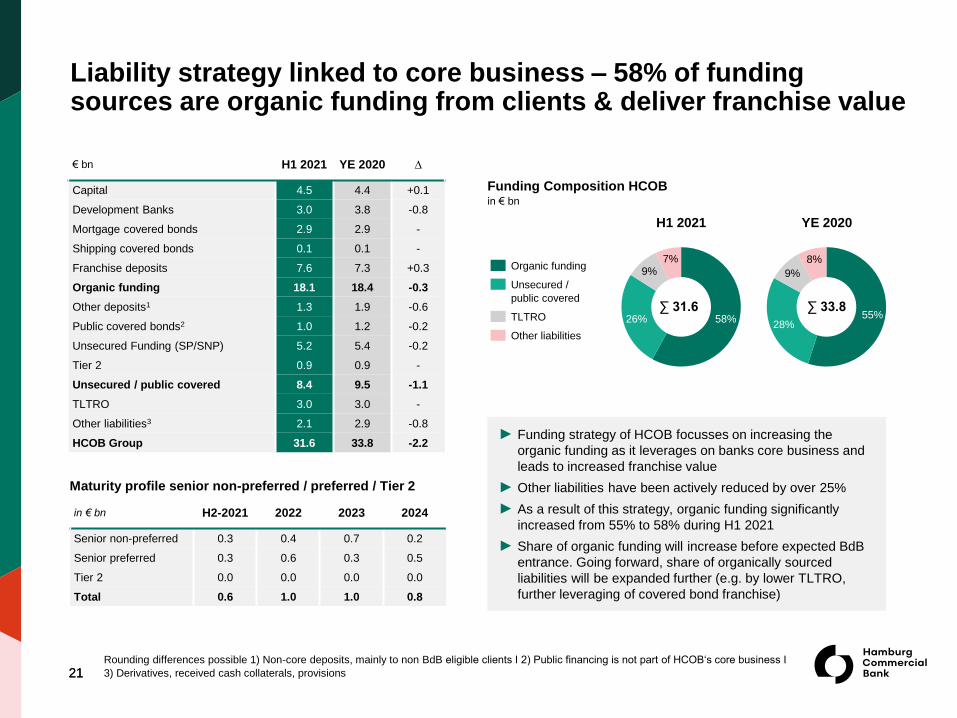
€ bn H1 2021 YE 2020 ∆
Capital 4.5 4.4 +0.1
Development Banks 3.0 3.8 -0.8
Mortgage covered bonds 2.9 2.9 -
Shipping covered bonds 0.1 0.1 -
Franchise deposits 7.6 7.3 +0.3
Organic funding 18.1 18.4 -0.3
Other deposits1 1.3 1.9 -0.6
Public covered bonds2 1.0 1.2 -0.2
Unsecured Funding (SP/SNP) 5.2 5.4 -0.2
Tier 2 0.9 0.9 -
Unsecured / public covered 8.4 9.5 -1.1
TLTRO 3.0 3.0 -
Other liabilities3 2.1 2.9 -0.8
HCOB Group 31.6 33.8 -2.2
Funding Composition HCOBin € bn
► Funding strategy of HCOB focusses on increasing the
organic funding as it leverages on banks core business and
leads to increased franchise value
► Other liabilities have been actively reduced by over 25%
► As a result of this strategy, organic funding significantly
increased from 55% to 58% during H1 2021
► Share of organic funding will increase before expected BdB
entrance. Going forward, share of organically sourced
liabilities will be expanded further (e.g. by lower TLTRO,
further leveraging of covered bond franchise)
H1 2021 YE 2020
in € bn H2-2021 2022 2023 2024
Senior non-preferred 0.3 0.4 0.7 0.2
Senior preferred 0.3 0.6 0.3 0.5
Tier 2 0.0 0.0 0.0 0.0
Total 0.6 1.0 1.0 0.8
Maturity profile senior non-preferred / preferred / Tier 2
21
58%26%
9%7%
TLTRO
Organic funding
Other liabilities
Unsecured /
public covered
55%28%
9%
8%
∑ 31.6 ∑ 33.8
Liability strategy linked to core business – 58% of funding sources are organic funding from clients & deliver franchise value
Rounding differences possible 1) Non-core deposits, mainly to non BdB eligible clients I 2) Public financing is not part of HCOB‘s core business I
3) Derivatives, received cash collaterals, provisions

3. SEGMENT OVERVIEWH1 2021
22
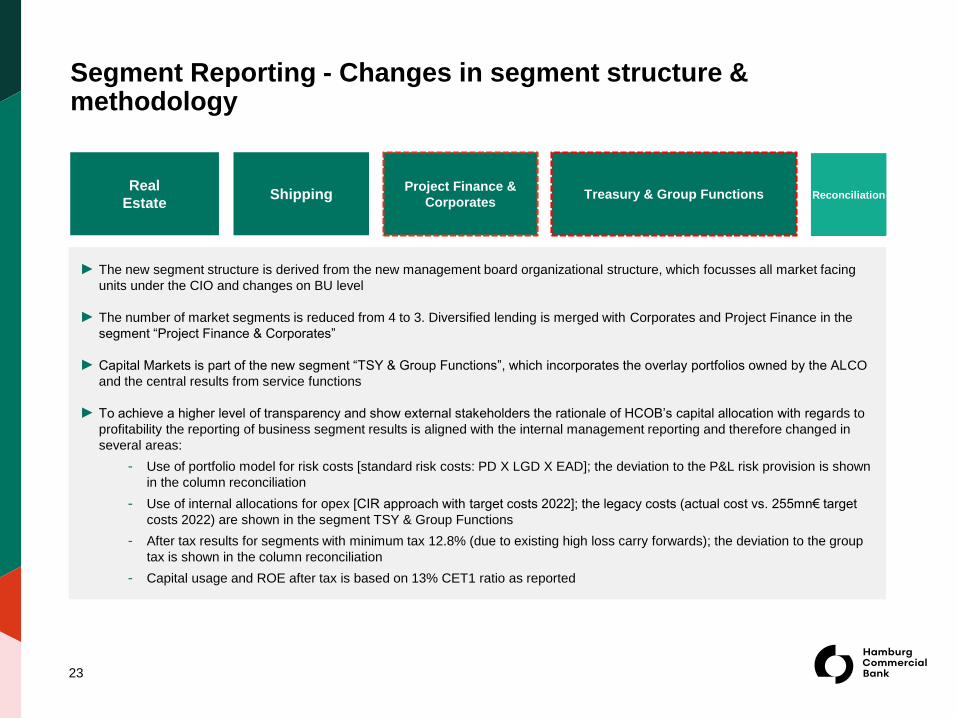
23
Project Finance &
CorporatesShipping Treasury & Group Functions
Real
EstateReconciliation
► The new segment structure is derived from the new management board organizational structure, which focusses all market facing
units under the CIO and changes on BU level
► The number of market segments is reduced from 4 to 3. Diversified lending is merged with Corporates and Project Finance in the
segment “Project Finance & Corporates”
► Capital Markets is part of the new segment “TSY & Group Functions”, which incorporates the overlay portfolios owned by the ALCO
and the central results from service functions
► To achieve a higher level of transparency and show external stakeholders the rationale of HCOB’s capital allocation with regards to
profitability the reporting of business segment results is aligned with the internal management reporting and therefore changed in
several areas:
- Use of portfolio model for risk costs [standard risk costs: PD X LGD X EAD]; the deviation to the P&L risk provision is shown
in the column reconciliation
- Use of internal allocations for opex [CIR approach with target costs 2022]; the legacy costs (actual cost vs. 255mn€ target
costs 2022) are shown in the segment TSY & Group Functions
- After tax results for segments with minimum tax 12.8% (due to existing high loss carry forwards); the deviation to the group
tax is shown in the column reconciliation
- Capital usage and ROE after tax is based on 13% CET1 ratio as reported
Segment Reporting - Changes in segment structure & methodology

Real Estate
• Well-established, risk-
conscious business,
primarily in Germany
• Expanding new business
with appropriate risk/return
requirements
• Structuring competence for
tailor-made financing
• Selective expansion of
international business in
neighbouring European
countries
RWA: € 3.0bn
Segment assets: € 9.1bn
• Focus on diversification of
portfolio through domestic
and international
counterparties with good
credit ratings
• Strategic partner based on
long-term market expertise
• New business under strict
margin and risk conditions
(focus on secondary market,
no spot market financing)
• New risk culture and new
underwriting standards in
place since 2018
Shipping
RWA: € 2.1bn
Segment assets: € 3.2bn
• Renewable Energy &
Infrastructure focus European
and, selectively non-European
markets
• Corporate Finance for
German MidCaps combined
with high competence in
Working Capital/Factoring and
Cash & Trade
• Corporates International
diversifies selectively in
European and North
American market on base of
sound risk/return profiles
Segment assets: € 7.9bn
RWA: € 5.2bn
• Treasury and active liability
management focused on
providing stable liquidity and
funding structure at
competitive costs
• Payment services for all client
segments, leveraging new
technology platform
• Liquidity buffer forms major
part of asset base,
supplemented by strategic
investment portfolio
• Group functions include all
other central functions such
as risk control, legal etc.
RWA: € 4.5bn
Segment assets: € 11.4bn
TSY & Group FunctionsProject Finance &
Corporates
Net Income: € 37mn Net Income: € 30mn Net Income: € 24mn Net Income : € 37mn
Lending Functions
24
Investment Functions
Business segments well positioned for growth – Deep market expertise & good client relationships basis for value creation
1) Segments excl. reconciliation
As of June 30th, 20211
High-performance suite of payment transaction services for all customer segments
25
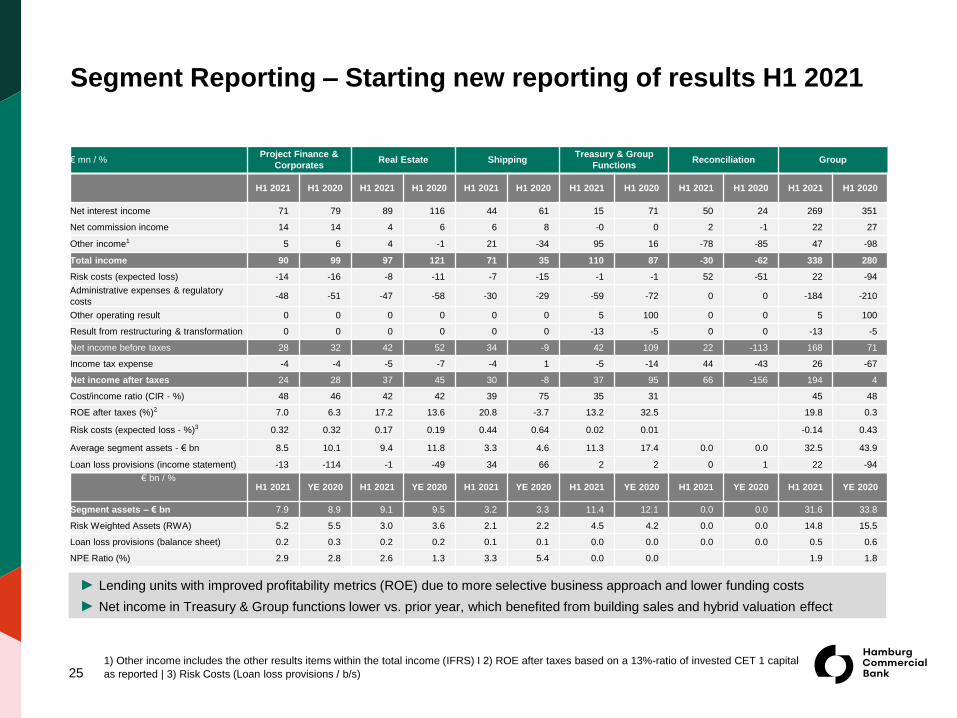
Segment Reporting – Starting new reporting of results H1 2021
► Lending units with improved profitability metrics (ROE) due to more selective business approach and lower funding costs
► Net income in Treasury & Group functions lower vs. prior year, which benefited from building sales and hybrid valuation effect
€ mn / %Project Finance &
CorporatesReal Estate Shipping
Treasury & Group
FunctionsReconciliation Group
H1 2021 H1 2020 H1 2021 H1 2020 H1 2021 H1 2020 H1 2021 H1 2020 H1 2021 H1 2020 H1 2021 H1 2020
Net interest income 71 79 89 116 44 61 15 71 50 24 269 351
Net commission income 14 14 4 6 6 8 -0 0 2 -1 22 27
Other income1 5 6 4 -1 21 -34 95 16 -78 -85 47 -98
Total income 90 99 97 121 71 35 110 87 -30 -62 338 280
Risk costs (expected loss) -14 -16 -8 -11 -7 -15 -1 -1 52 -51 22 -94
Administrative expenses & regulatory
costs-48 -51 -47 -58 -30 -29 -59 -72 0 0 -184 -210
Other operating result 0 0 0 0 0 0 5 100 0 0 5 100
Result from restructuring & transformation 0 0 0 0 0 0 -13 -5 0 0 -13 -5
Net income before taxes 28 32 42 52 34 -9 42 109 22 -113 168 71
Income tax expense -4 -4 -5 -7 -4 1 -5 -14 44 -43 26 -67
Net income after taxes 24 28 37 45 30 -8 37 95 66 -156 194 4
Cost/income ratio (CIR - %) 48 46 42 42 39 75 35 31 45 48
ROE after taxes (%)2 7.0 6.3 17.2 13.6 20.8 -3.7 13.2 32.5 19.8 0.3
Risk costs (expected loss - %)3 0.32 0.32 0.17 0.19 0.44 0.64 0.02 0.01 -0.14 0.43
Average segment assets - € bn 8.5 10.1 9.4 11.8 3.3 4.6 11.3 17.4 0.0 0.0 32.5 43.9
Loan loss provisions (income statement) -13 -114 -1 -49 34 66 2 2 0 1 22 -94
€ bn / %H1 2021 YE 2020 H1 2021 YE 2020 H1 2021 YE 2020 H1 2021 YE 2020 H1 2021 YE 2020 H1 2021 YE 2020
Segment assets – € bn 7.9 8.9 9.1 9.5 3.2 3.3 11.4 12.1 0.0 0.0 31.6 33.8
Risk Weighted Assets (RWA) 5.2 5.5 3.0 3.6 2.1 2.2 4.5 4.2 0.0 0.0 14.8 15.5
Loan loss provisions (balance sheet) 0.2 0.3 0.2 0.2 0.1 0.1 0.0 0.0 0.0 0.0 0.5 0.6
NPE Ratio (%) 2.9 2.8 2.6 1.3 3.3 5.4 0.0 0.0 1.9 1.8
1) Other income includes the other results items within the total income (IFRS) I 2) ROE after taxes based on a 13%-ratio of invested CET 1 capital
as reported | 3) Risk Costs (Loan loss provisions / b/s)
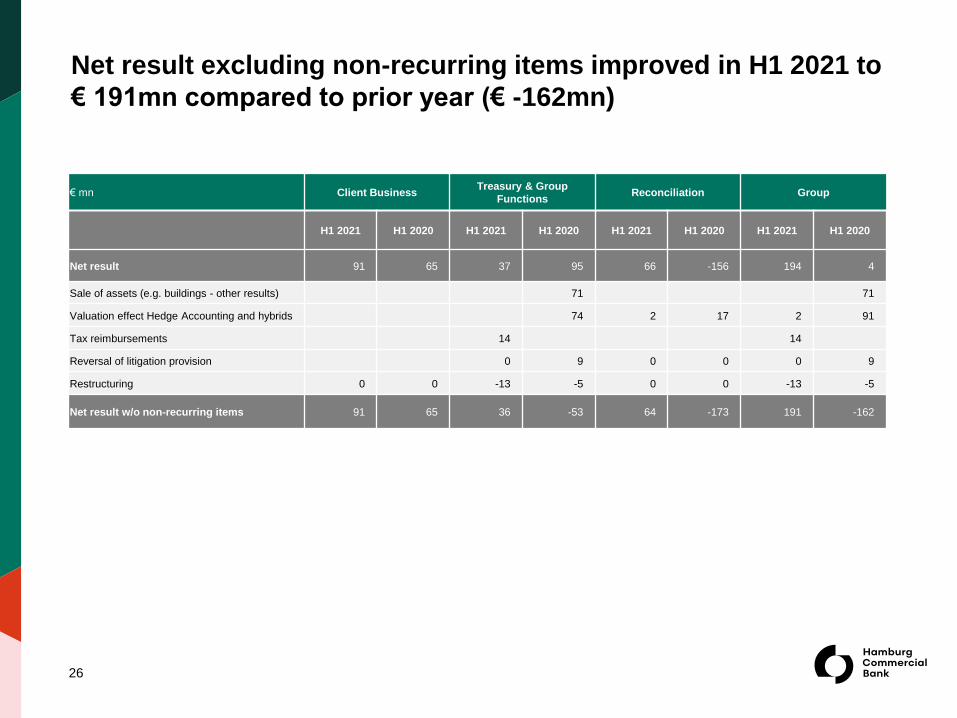
Net result excluding non-recurring items improved in H1 2021 to
€ 191mn compared to prior year (€ -162mn)
26
€ mn Client BusinessTreasury & Group
FunctionsReconciliation Group
H1 2021 H1 2020 H1 2021 H1 2020 H1 2021 H1 2020 H1 2021 H1 2020
Net result 91 65 37 95 66 -156 194 4
Sale of assets (e.g. buildings - other results) 71 71
Valuation effect Hedge Accounting and hybrids 74 2 17 2 91
Tax reimbursements 14 14
Reversal of litigation provision 0 9 0 0 0 9
Restructuring 0 0 -13 -5 0 0 -13 -5
Net result w/o non-recurring items 91 65 36 -53 64 -173 191 -162
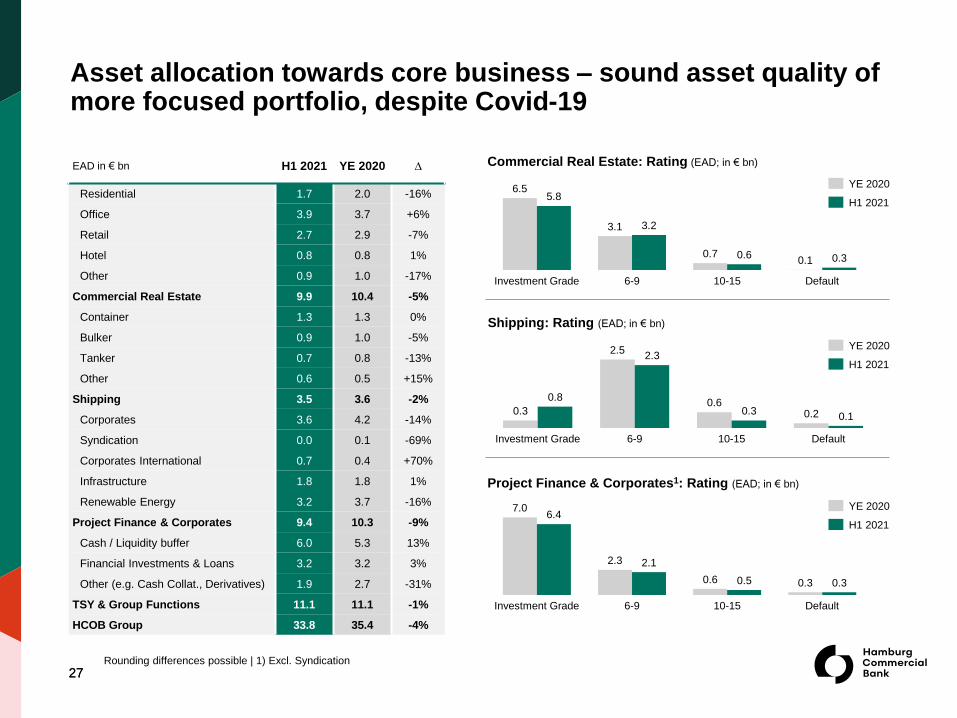
27
Commercial Real Estate: Rating (EAD; in € bn)
Shipping: Rating (EAD; in € bn)
Project Finance & Corporates1: Rating (EAD; in € bn)
27
10-15
6.4
Investment Grade 6-9
2.1
Default
7.0
2.3
0.6 0.5 0.3 0.3
Investment Grade
3.1
6-9
0.3
10-15 Default
3.2
0.7
6.55.8
0.60.1
6-9Investment Grade Default10-15
2.32.5
0.3
0.80.6
0.3 0.2 0.1
H1 2021
YE 2020
YE 2020
H1 2021
YE 2020
H1 2021
Rounding differences possible | 1) Excl. Syndication
Asset allocation towards core business – sound asset quality of more focused portfolio, despite Covid-19
EAD in € bn H1 2021 YE 2020 ∆
Residential 1.7 2.0 -16%
Office 3.9 3.7 +6%
Retail 2.7 2.9 -7%
Hotel 0.8 0.8 1%
Other 0.9 1.0 -17%
Commercial Real Estate 9.9 10.4 -5%
Container 1.3 1.3 0%
Bulker 0.9 1.0 -5%
Tanker 0.7 0.8 -13%
Other 0.6 0.5 +15%
Shipping 3.5 3.6 -2%
Corporates 3.6 4.2 -14%
Syndication 0.0 0.1 -69%
Corporates International 0.7 0.4 +70%
Infrastructure 1.8 1.8 1%
Renewable Energy 3.2 3.7 -16%
Project Finance & Corporates 9.4 10.3 -9%
Cash / Liquidity buffer 6.0 5.3 13%
Financial Investments & Loans 3.2 3.2 3%
Other (e.g. Cash Collat., Derivatives) 1.9 2.7 -31%
TSY & Group Functions 11.1 11.1 -1%
HCOB Group 33.8 35.4 -4%
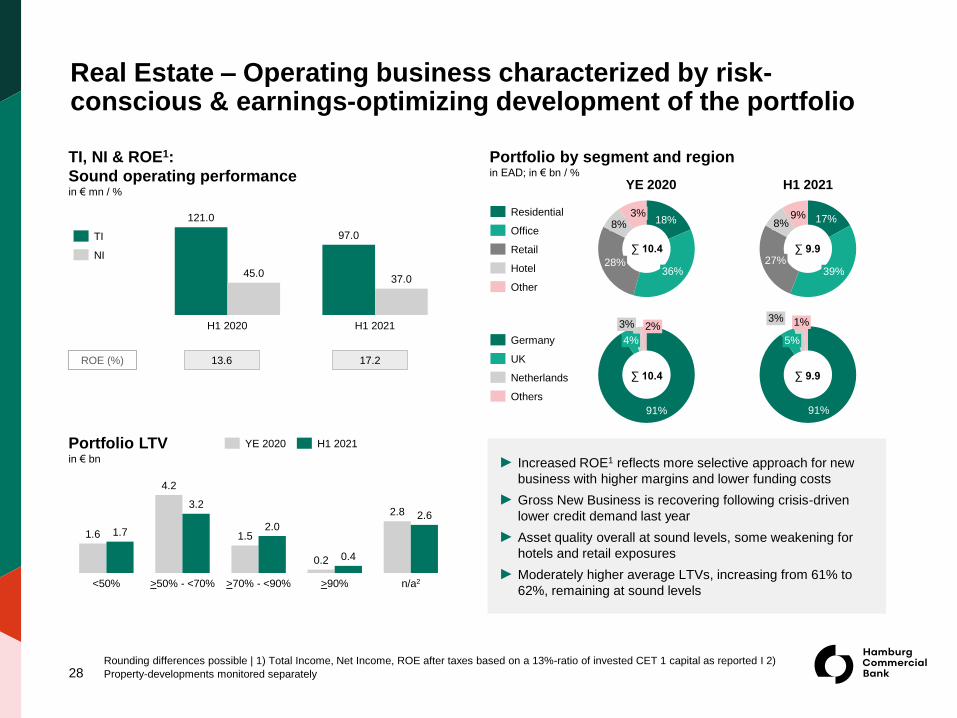
TI, NI & ROE1:
Sound operating performance in € mn / %
28
► Increased ROE1 reflects more selective approach for new
business with higher margins and lower funding costs
► Gross New Business is recovering following crisis-driven
lower credit demand last year
► Asset quality overall at sound levels, some weakening for
hotels and retail exposures
► Moderately higher average LTVs, increasing from 61% to
62%, remaining at sound levels
Portfolio by segment and regionin EAD; in € bn / %
H1 2021YE 2020
18%8%
36%28%
Portfolio LTVin € bn
17%9%
39%27%
8%Residential
Retail
Office
Hotel
Other
91%
4%
91%
5%Germany
UK
Others
Netherlands
∑ 9.9
∑ 9.9
∑ 10.4
∑ 10.4
H1 2020
37.0
H1 2021
97.0
121.0
45.0
ROE (%) 13.6 17.2
1.5
>90%<50% >50% - <70%
1.7
>70% - <90% n/a2
1.6
4.2
3.2
2.0
0.2 0.4
2.8 2.6
3%
3% 1%3% 2%
YE 2020 H1 2021
TI
NI
Rounding differences possible | 1) Total Income, Net Income, ROE after taxes based on a 13%-ratio of invested CET 1 capital as reported I 2)
Property-developments monitored separately
Real Estate – Operating business characterized by risk-conscious & earnings-optimizing development of the portfolio
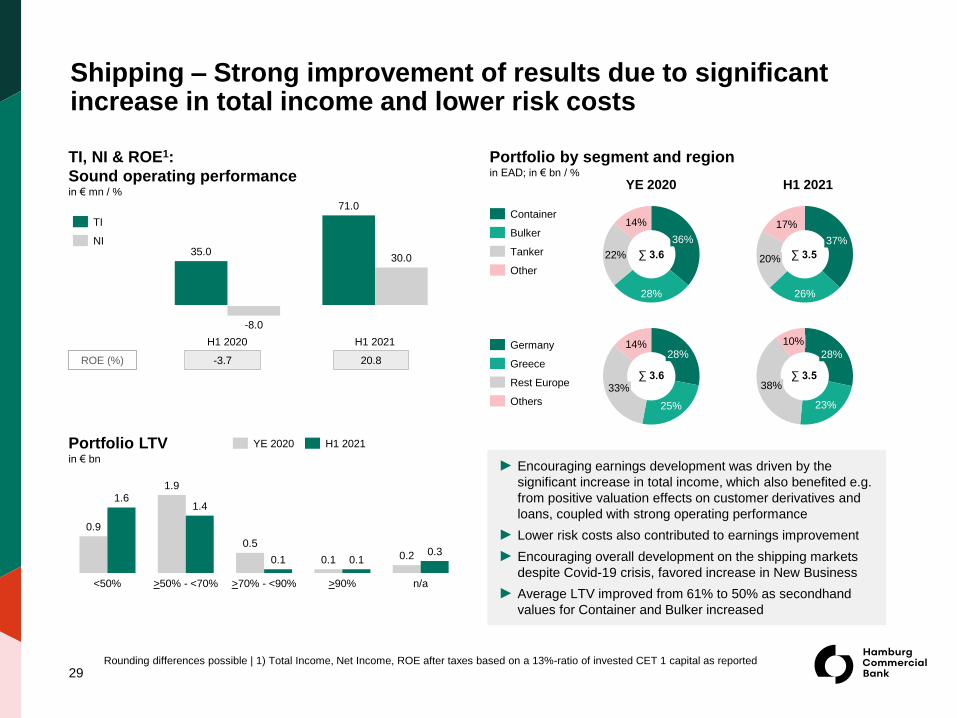
TI, NI & ROE1:
Sound operating performancein € mn / %
29
► Encouraging earnings development was driven by the
significant increase in total income, which also benefited e.g.
from positive valuation effects on customer derivatives and
loans, coupled with strong operating performance
► Lower risk costs also contributed to earnings improvement
► Encouraging overall development on the shipping markets
despite Covid-19 crisis, favored increase in New Business
► Average LTV improved from 61% to 50% as secondhand
values for Container and Bulker increased
26%
17%
37%
20%
Container
Other
Bulker
Tanker
25%
14%28%
33%
23%
10%
28%
38%
∑ 3.5
∑ 3.5
∑ 3.6
∑ 3.6
30.0
H1 2020 H1 2021
71.0
35.0
-8.0
ROE (%) -3.7 20.8
28%
22%
14%
36%NI
TI
H1 2021YE 2020
Portfolio by segment and regionin EAD; in € bn / %
Shipping – Strong improvement of results due to significant increase in total income and lower risk costs
Germany
Rest Europe
Greece
Others
<50%
1.9
n/a>50% - <70% >70% - <90%
0.9
>90%
1.61.4
0.5
0.1 0.20.1 0.10.3
Portfolio LTVin € bn
YE 2020 H1 2021
Rounding differences possible | 1) Total Income, Net Income, ROE after taxes based on a 13%-ratio of invested CET 1 capital as reported
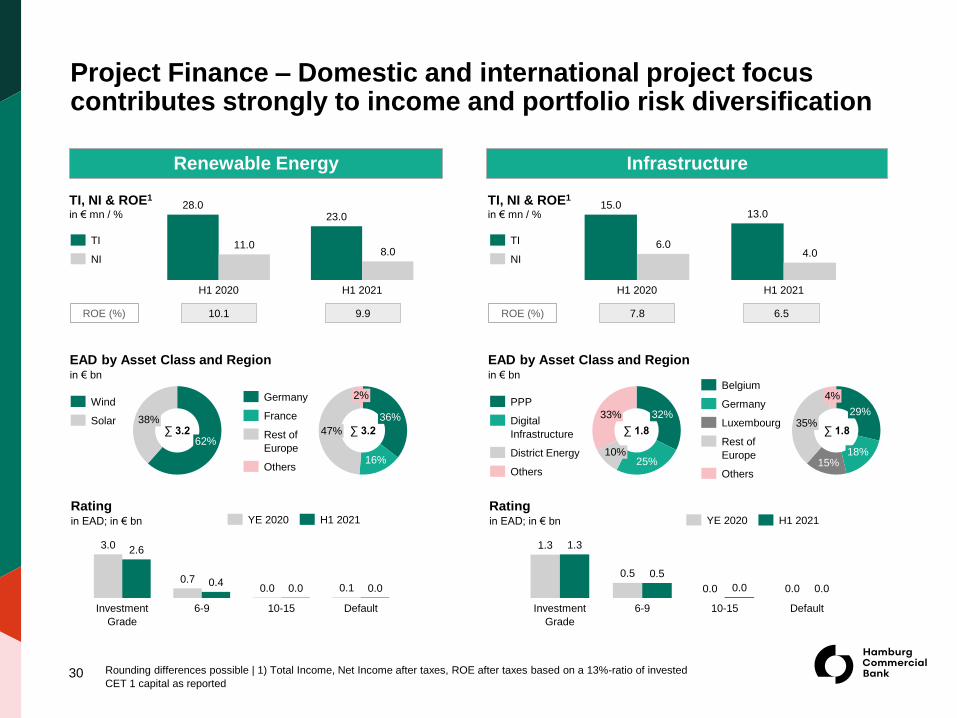
EAD by Asset Class and Regionin € bn
30
InfrastructureRenewable Energy
16%
36%
47%
2%
62%
38%Solar
Wind
15%18%
29%35%
4%
25%
33% 32%
10%
Digital
Infrastructure
PPP
District Energy
Others
0.00.4
3.0
Investment
Grade
6-9 10-15
0.7
Default
2.6
0.0 0.1 0.0
6-9Investment
Grade
1.3
10-15 Default
1.3
0.5 0.5
0.0 0.0 0.0 0.0
EAD by Asset Class and Regionin € bn
TI, NI & ROE1
in € mn / %
H1 2020 H1 2021
11.0
28.0
8.0
23.0
ROE (%) 10.1 9.9
TI, NI & ROE1
in € mn / %
4.0
H1 2020
15.0
H1 2021
13.0
6.0
Rest of
Europe
Belgium
Germany
Luxembourg
Others
Germany
Others
Rest of
Europe
France
∑ 3.2 ∑ 3.2 ∑ 1.8 ∑ 1.8
Rating in EAD; in € bn
Rating in EAD; in € bn
ROE (%) 7.8 6.5
YE 2020 H1 2021YE 2020 H1 2021
TI
NI
TI
NI
Rounding differences possible | 1) Total Income, Net Income after taxes, ROE after taxes based on a 13%-ratio of invested
CET 1 capital as reported
Project Finance – Domestic and international project focus contributes strongly to income and portfolio risk diversification

31
24%
31%
43%
2%
15%
41%
12%
31%Services
Others
Industry
Retail
1.0
Investment
Grade
2.5
6-9
2.1
10-15 Default
0.80.20.5 0.4 0.2
H1 2020
52.0
H1 2021
10.04.0
35.0
3.8 2.2
17.0
H1 2020 H1 2021
2.0
8.0
1.0
US
Others
Great Britain
Rest of Europe∑ 3.6 ∑ 0.7
ROE (%) 22.6 22.2
85%
15%
0%
Germany
Rest of
Europe
Others
∑ 3.6
YE 2020 H1 2021
0.2
0.4
Investment
Grade
0.1
6-9 10-15
0.3
Default
0.1 0.0 0.0 0.0
YE 2020 H1 2021
TI
NI
TI
NI
Rating in EAD; in € bn
EAD by Asset Class and Regionin € bn
TI, NI & ROE2
in € mn / %
ROE (%)
Corporates International1Corporates
EAD by Regionin € bn
TI, NI & ROE2
in € mn / %
Rating in EAD; in € bn
Rounding differences possible | 1) Former “Diversified Lending” | 2) Total Income, Net Income, ROE after taxes based on a 13%-ratio of invested
CET 1 capital as reported
Corporates – Ongoing de-risking with simultaneous development of Corporates International as strong new segment

32
4. HCOB AT A GLANCE A private commercial bank and specialist financier
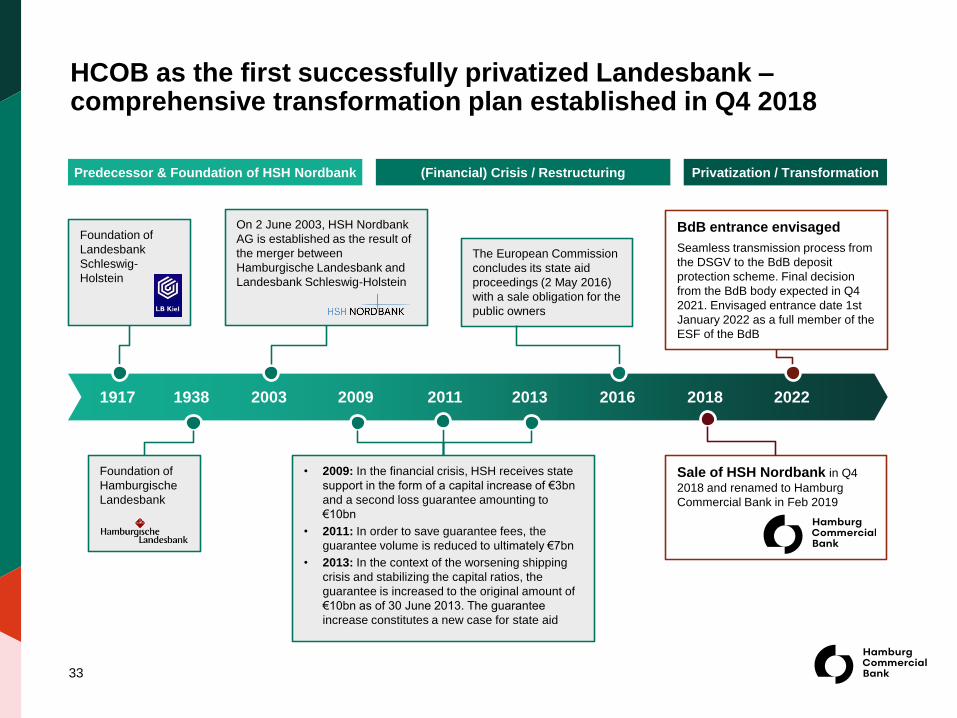
2003 2009 2011 2013
On 2 June 2003, HSH Nordbank
AG is established as the result of
the merger between
Hamburgische Landesbank and
Landesbank Schleswig-Holstein
• 2009: In the financial crisis, HSH receives state
support in the form of a capital increase of €3bn
and a second loss guarantee amounting to
€10bn
• 2011: In order to save guarantee fees, the
guarantee volume is reduced to ultimately €7bn
• 2013: In the context of the worsening shipping
crisis and stabilizing the capital ratios, the
guarantee is increased to the original amount of
€10bn as of 30 June 2013. The guarantee
increase constitutes a new case for state aid
Foundation of
Landesbank
Schleswig-
Holstein
1917 2016
Foundation of
Hamburgische
Landesbank
The European Commission
concludes its state aid
proceedings (2 May 2016)
with a sale obligation for the
public owners
1938
Predecessor & Foundation of HSH Nordbank (Financial) Crisis / Restructuring Privatization / Transformation
2018
Sale of HSH Nordbank in Q4
2018 and renamed to Hamburg
Commercial Bank in Feb 2019
2022
BdB entrance envisaged
Seamless transmission process from
the DSGV to the BdB deposit
protection scheme. Final decision
from the BdB body expected in Q4
2021. Envisaged entrance date 1st
January 2022 as a full member of the
ESF of the BdB
33
HCOB as the first successfully privatized Landesbank –comprehensive transformation plan established in Q4 2018
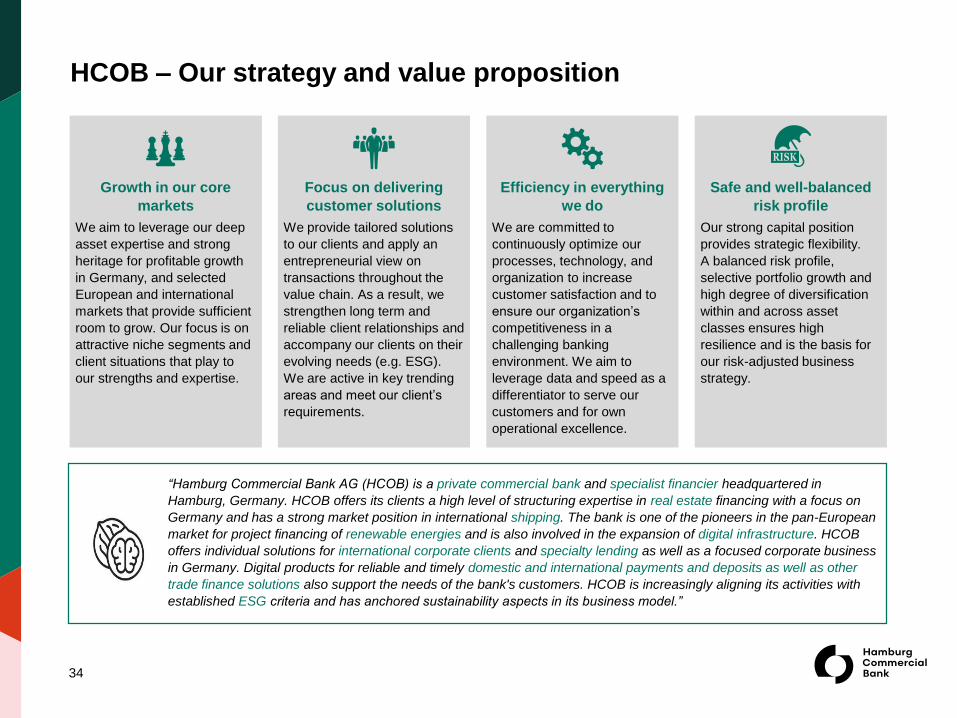
Growth in our core
markets
We aim to leverage our deep
asset expertise and strong
heritage for profitable growth
in Germany, and selected
European and international
markets that provide sufficient
room to grow. Our focus is on
attractive niche segments and
client situations that play to
our strengths and expertise.
Focus on delivering
customer solutions
We provide tailored solutions
to our clients and apply an
entrepreneurial view on
transactions throughout the
value chain. As a result, we
strengthen long term and
reliable client relationships and
accompany our clients on their
evolving needs (e.g. ESG).
We are active in key trending
areas and meet our client’s
requirements.
Efficiency in everything
we do
We are committed to
continuously optimize our
processes, technology, and
organization to increase
customer satisfaction and to
ensure our organization’s
competitiveness in a
challenging banking
environment. We aim to
leverage data and speed as a
differentiator to serve our
customers and for own
operational excellence.
Safe and well-balanced
risk profile
Our strong capital position
provides strategic flexibility.
A balanced risk profile,
selective portfolio growth and
high degree of diversification
within and across asset
classes ensures high
resilience and is the basis for
our risk-adjusted business
strategy.
34
“Hamburg Commercial Bank AG (HCOB) is a private commercial bank and specialist financier headquartered in
Hamburg, Germany. HCOB offers its clients a high level of structuring expertise in real estate financing with a focus on
Germany and has a strong market position in international shipping. The bank is one of the pioneers in the pan-European
market for project financing of renewable energies and is also involved in the expansion of digital infrastructure. HCOB
offers individual solutions for international corporate clients and specialty lending as well as a focused corporate business
in Germany. Digital products for reliable and timely domestic and international payments and deposits as well as other
trade finance solutions also support the needs of the bank's customers. HCOB is increasingly aligning its activities with
established ESG criteria and has anchored sustainability aspects in its business model.”
HCOB – Our strategy and value proposition

What we offer
Hamburg
Kiel
Berlin
Dusseldorf
Frankfurt
Munich
Athens
35
HCOB is engaged in & across various segments & countries
HCOB is a private commercial bank that works with and
supports its clients at eye level while offering efficient
solutions to complex challenges
We are characterized by our experience and sector
knowledge in our clients businesses, which is supported by
our focused capital markets products and services
Business areas: Commercial project finance in the real estate,
renewable energies and infrastructure segments; Shipping;
Tailored finance for medium-sized businesses; Structured
Finance, including syndications; Payment services and
transaction banking products as well as expert advice in
corporate finance
EAD by Segmentin € bn
EAD by Regionin € bn
Luxembourg
London
29%
10%
28%
33%Real Estate
Shipping
Corporates & Project Finance
Treasury & Group Functions
55%
25%
8%
5%7%
Germany
Others
Rest of Europe
Eurozone
Asia-Pacific
∑ 33.8
∑ 33.8
HCOB - Providing specialized financial solutions in selected
segments to our clients
Ownership Structure
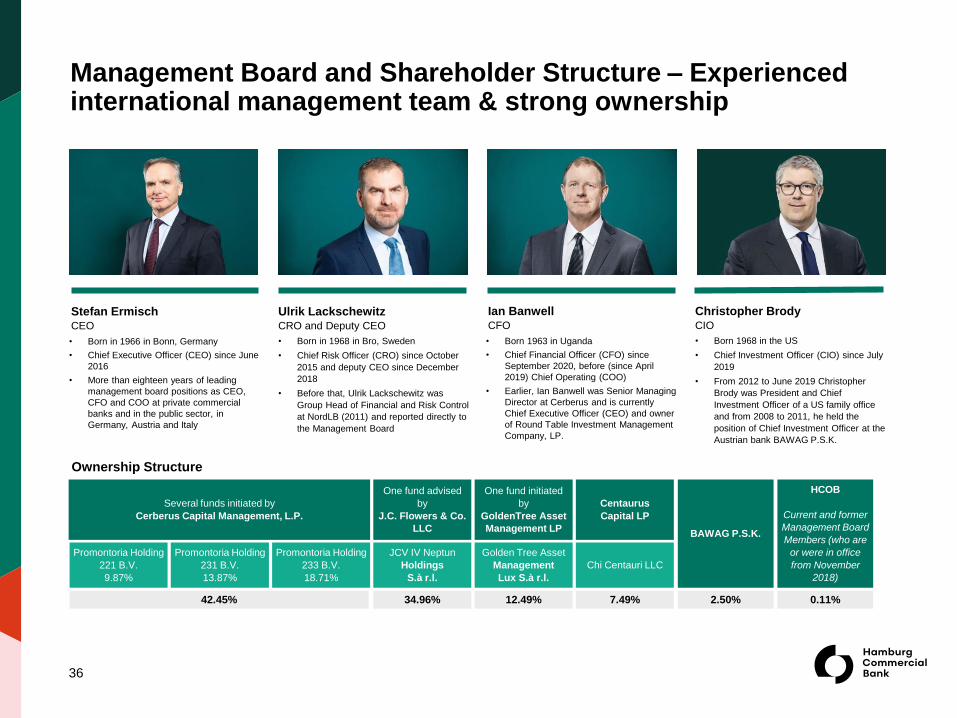
Stefan Ermisch CEO
Ulrik LackschewitzCRO and Deputy CEO
• Born in 1966 in Bonn, Germany
• Chief Executive Officer (CEO) since June
2016
• More than eighteen years of leading
management board positions as CEO,
CFO and COO at private commercial
banks and in the public sector, in
Germany, Austria and Italy
• Born in 1968 in Bro, Sweden
• Chief Risk Officer (CRO) since October
2015 and deputy CEO since December
2018
• Before that, Ulrik Lackschewitz was
Group Head of Financial and Risk Control
at NordLB (2011) and reported directly to
the Management Board
Ian BanwellCFO
Christopher BrodyCIO
• Born 1963 in Uganda
• Chief Financial Officer (CFO) since
September 2020, before (since April
2019) Chief Operating (COO)
• Earlier, Ian Banwell was Senior Managing
Director at Cerberus and is currently
Chief Executive Officer (CEO) and owner
of Round Table Investment Management
Company, LP.
• Born 1968 in the US
• Chief Investment Officer (CIO) since July
2019
• From 2012 to June 2019 Christopher
Brody was President and Chief
Investment Officer of a US family office
and from 2008 to 2011, he held the
position of Chief Investment Officer at the
Austrian bank BAWAG P.S.K.
36
Several funds initiated by
Cerberus Capital Management, L.P.
One fund advised
by
J.C. Flowers & Co.
LLC
One fund initiated
by
GoldenTree Asset
Management LP
Centaurus
Capital LP
BAWAG P.S.K.
HCOB
Current and former
Management Board
Members (who are
or were in office
from November
2018)
Promontoria Holding
221 B.V.
9.87%
Promontoria Holding
231 B.V.
13.87%
Promontoria Holding
233 B.V.
18.71%
JCV IV Neptun
Holdings
S.à r.l.
Golden Tree Asset
Management
Lux S.à r.l.
Chi Centauri LLC
42.45% 34.96% 12.49% 7.49% 2.50% 0.11%
Management Board and Shareholder Structure – Experienced international management team & strong ownership
Martin JonasHead of Investor Relations &
Sustainability Office
Tel. no.: +49 (0) 40 3333 11500
Ralf LöweHead of Treasury
Hamburg Commercial Bank AG
Gerhart-Hauptmann-Platz 50
D-20095 Hamburg
Hamburg Commercial Bank AG
Gerhart-Hauptmann-Platz 50
D-20095 Hamburg
Tel. no.: +49 (0) 40 3333 25421
Ian BanwellCFO
Hamburg Commercial Bank AG
Gerhart-Hauptmann-Platz 50
D-20095 Hamburg
Stefan ErmischCEO
Hamburg Commercial Bank AG
Gerhart-Hauptmann-Platz 50
D-20095 Hamburg
37
Contacts
The market and other information contained in this presentation is for general informational purposes only. This presentation is not intended to replace either your own market research or
any other information or advice, in particular of a legal, tax or financial nature. This presentation does not contain all material information needed to make important financial decisions, in
particular investment decisions, and may differ from information and estimates from other sources/market participants. The presentation is neither an offer nor a solicitation to buy or sell
securities or other forms of investment of Hamburg Commercial Bank AG or other companies, nor does it constitute any advice or recommendation to that effect. In particular, it is not a
prospectus. Investment decisions relating to securities or other forms of investment of Hamburg Commercial Bank AG or other companies should not be based on this presentation.
Hamburg Commercial Bank AG points out that the market information presented herein is only intended for professional, financially experienced investors who are able to assess the
risks and opportunities of the market(s) discussed and obtain comprehensive information from a number of different sources.
The statements and information contained in this presentation are based on information that Hamburg Commercial Bank AG has researched or obtained from generally accessible
sources. While Hamburg Commercial Bank AG generally regards the sources used as reliable, it cannot assess such reliability with absolute certainty. Hamburg Commercial Bank AG
did not perform any checks of its own on the factual accuracy of the individual pieces of information from these sources.
Furthermore, this presentation contains estimates, forward-looking-statements and forecasts based on numerous assumptions, projections and subjective assessments made by
Hamburg Commercial Bank AG, as well as outside sources available at the time of this presentation, and only represents non-binding views regarding markets and products at the time
the estimate/forecast was prepared which are subject to inherent risks, uncertainties and other factors which could cause actual results to differ materially from the future results
expressed or implied by such forward-looking statements. Forward-looking statements express an expectation or belief and contain a projection, plan or assumption. Thus, a number of
factors (e.g. market fluctuations, unexpected market developments in Germany, the EU or the US, etc.) may result in a forward-looking statement proving to be unfounded at a later date.
Hamburg Commercial Bank AG does not enter into any obligation to update the information contained in this presentation.
Hamburg Commercial Bank AG and its employees and executive bodies provide no guarantee, despite exercising due care, that the information and forecasts provided are complete, up-
to-date or accurate. Neither Hamburg Commercial Bank AG nor its executive bodies or employees can be held liable for any direct or indirect losses or other damage that may arise from
the use of this presentation, excerpts from this presentation or its contents, or for loss or damage that otherwise arises in connection with this presentation.
In general, this document may only be distributed in jurisdictions where such distribution is not unlawful and only in compliance with the statutory provisions applicable in the relevant
countries, and individuals in possession of this document should familiarise themselves with the applicable local provisions. Hamburg Commercial Bank AG points out that the
presentation is intended for the recipient and that the distribution of this presentation or information contained herein to third parties is prohibited. In particular, this presentation may not
be used for advertising purposes. Losses incurred by Hamburg Commercial Bank AG as the result of the unauthorised distribution of this presentation or any of its contents to third
parties are to be fully compensated for by the distributor. Such person must hold Hamburg Commercial Bank AG harmless from any third-party claims resulting from the unauthorised
distribution of this presentation and from all legal defence costs incurred in connection with such claims. This applies, in particular, to the distribution of this presentation or information
contained therein to persons located in the US.
Management system and defined management indicators of the IFRS Group
The Bank’s integrated management system is aimed at the management of key value drivers on a targeted basis. The Bank (which was operating under the name HSH Nordbank AG up
until February 4, 2019) uses a risk-adjusted key indicator and ratio system for this purpose that ensures that the Overall Bank are managed in a uniform and effective manner. The
Hamburg Commercial Bank Group is managed mainly on the basis of figures for the Group prepared in accordance with the International Financial Reporting Standards (IFRS) and/or
the relevant prudential rules.
Within the management reporting framework, the Bank focuses on the most important management indicators for the individual value drivers of the IFRS Group. On the one hand, the
focus is on how these key indicators changed compared to the previous year and, on the other, on how they are expected to change in the future. The Group management report for the
2020 financial year contains further information on the management system and defined management parameters of the Hamburg Commercial Bank Group as well as disclosures.
38
Disclaimer

5. APPENDIX
39
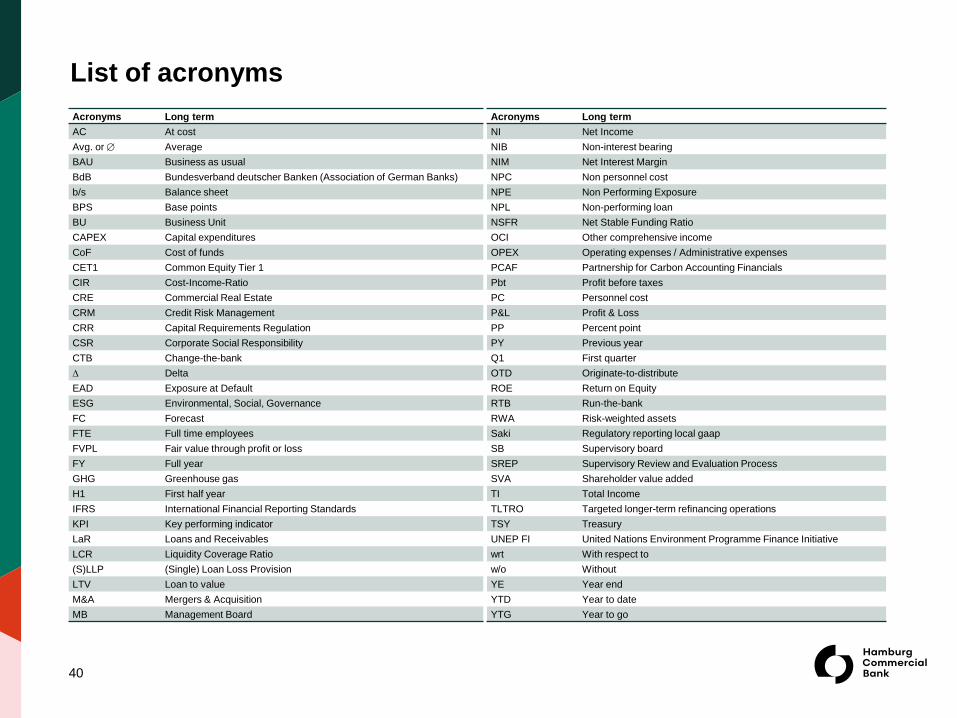
Acronyms Long term
NI Net Income
NIB Non-interest bearing
NIM Net Interest Margin
NPC Non personnel cost
NPE Non Performing Exposure
NPL Non-performing loan
NSFR Net Stable Funding Ratio
OCI Other comprehensive income
OPEX Operating expenses / Administrative expenses
PCAF Partnership for Carbon Accounting Financials
Pbt Profit before taxes
PC Personnel cost
P&L Profit & Loss
PP Percent point
PY Previous year
Q1 First quarter
OTD Originate-to-distribute
ROE Return on Equity
RTB Run-the-bank
RWA Risk-weighted assets
Saki Regulatory reporting local gaap
SB Supervisory board
SREP Supervisory Review and Evaluation Process
SVA Shareholder value added
TI Total Income
TLTRO Targeted longer-term refinancing operations
TSY Treasury
UNEP FI United Nations Environment Programme Finance Initiative
wrt With respect to
w/o Without
YE Year end
YTD Year to date
YTG Year to go
Acronyms Long term
AC At cost
Avg. or Average
BAU Business as usual
BdB Bundesverband deutscher Banken (Association of German Banks)
b/s Balance sheet
BPS Base points
BU Business Unit
CAPEX Capital expenditures
CoF Cost of funds
CET1 Common Equity Tier 1
CIR Cost-Income-Ratio
CRE Commercial Real Estate
CRM Credit Risk Management
CRR Capital Requirements Regulation
CSR Corporate Social Responsibility
CTB Change-the-bank
∆ Delta
EAD Exposure at Default
ESG Environmental, Social, Governance
FC Forecast
FTE Full time employees
FVPL Fair value through profit or loss
FY Full year
GHG Greenhouse gas
H1 First half year
IFRS International Financial Reporting Standards
KPI Key performing indicator
LaR Loans and Receivables
LCR Liquidity Coverage Ratio
(S)LLP (Single) Loan Loss Provision
LTV Loan to value
M&A Mergers & Acquisition
MB Management Board
40
List of acronyms