investor presentation q3 fy2021
TRANSCRIPT
INVESTOR PRESENTATIONQ3 FY2021November 23, 2020
2
Except for the historical information contained herein, certain matters in this presentation including, but not limited to, statements as to: our financial position; our markets; the performance, benefits, abilities and impact of our products and technology; the availability of our products and technology; our partnerships and customers; our use of cash; the acquisition of Arm and its impacts; NVIDIA’s financial outlook for the fourth quarter of fiscal 2021; our growth and growth drivers; our financial policy; future revenue growth; our opportunities in existing and new markets; the TAM for our products; and performance in our financial metrics are forward-looking statements within the meaning of the Private Securities Litigation Reform Act of 1995. These forward-looking statements and any other forward-looking statements that go beyond historical facts that are made in this presentation are subject to risks and uncertainties that may cause actual results to differ materially. Important factors that could cause actual results to differ materially include: global economic conditions; our reliance on third parties to manufacture, assemble, package and test our products; the impact of technological development and competition; development of new products and technologies or enhancements to our existing product and technologies; market acceptance of our products or our partners' products; design, manufacturing or software defects; changes in consumer preferences and demands; changes in industry standards and interfaces; unexpected loss of performance of our products or technologies when integrated into systems and other factors.
NVIDIA has based these forward-looking statements largely on its current expectations and projections about future events and trends that it believes may affect its financial condition, results of operations, business strategy, short-term and long-term business operations and objectives, and financial needs. These forward-looking statements are subject to a number of risks and uncertainties, and you should not rely upon the forward-looking statements as predictions of future events. The future events and trends discussed in this presentation may not occur and actual results could differ materially and adversely from those anticipated or implied in the forward-looking statements. Although NVIDIA believes that the expectations reflected in the forward-looking statements are reasonable, the company cannot guarantee that future results, levels of activity, performance, achievements or events and circumstances reflected in the forward-looking statements will occur. Except as required by law, NVIDIA disclaims any obligation to update these forward-looking statements to reflect future events or circumstances. For a complete discussion of factors that could materially affect our financial results and operations, please refer to the reports we file from time to time with the SEC, including our Annual Report on Form 10-K and quarterly reports on Form 10-Q. Copies of reports we file with the SEC are posted on our website and are available from NVIDIA without charge.
NVIDIA uses certain non-GAAP measures in this presentation including non-GAAP gross margin, non-GAAP operating margin, non-GAAP net income, non-GAAP operating income, non-GAAP diluted earnings per share, non-GAAP operating expenses, non-GAAP other income (expense), net, free cash flow, and adjusted EBITDA. NVIDIA believes the presentation of its non-GAAP financial measures enhances investors' overall understanding of the company's historical financial performance. The presentation of the company's non-GAAP financial measures is not meant to be considered in isolation or as a substitute for the company's financial results prepared in accordance with GAAP, and the company's non-GAAP measures may be different from non-GAAP measures used by other companies. Further information relevant to the interpretation of non-GAAP financial measures, and reconciliations of these non-GAAP financial measures to the most comparable GAAP measures, may be found in the slide titled “Reconciliation of Non-GAAP to GAAP Financial Measures”.
3
Q3 FY21 Earnings Summary
Proposed Acquisition of Arm
Key Announcements This Quarter
NVIDIA Overview
Financials
Non-GAAP to GAAP Reconciliation
CONTENT
4
Q3 FY21 EARNINGS SUMMARY
5
HIGHLIGHTS
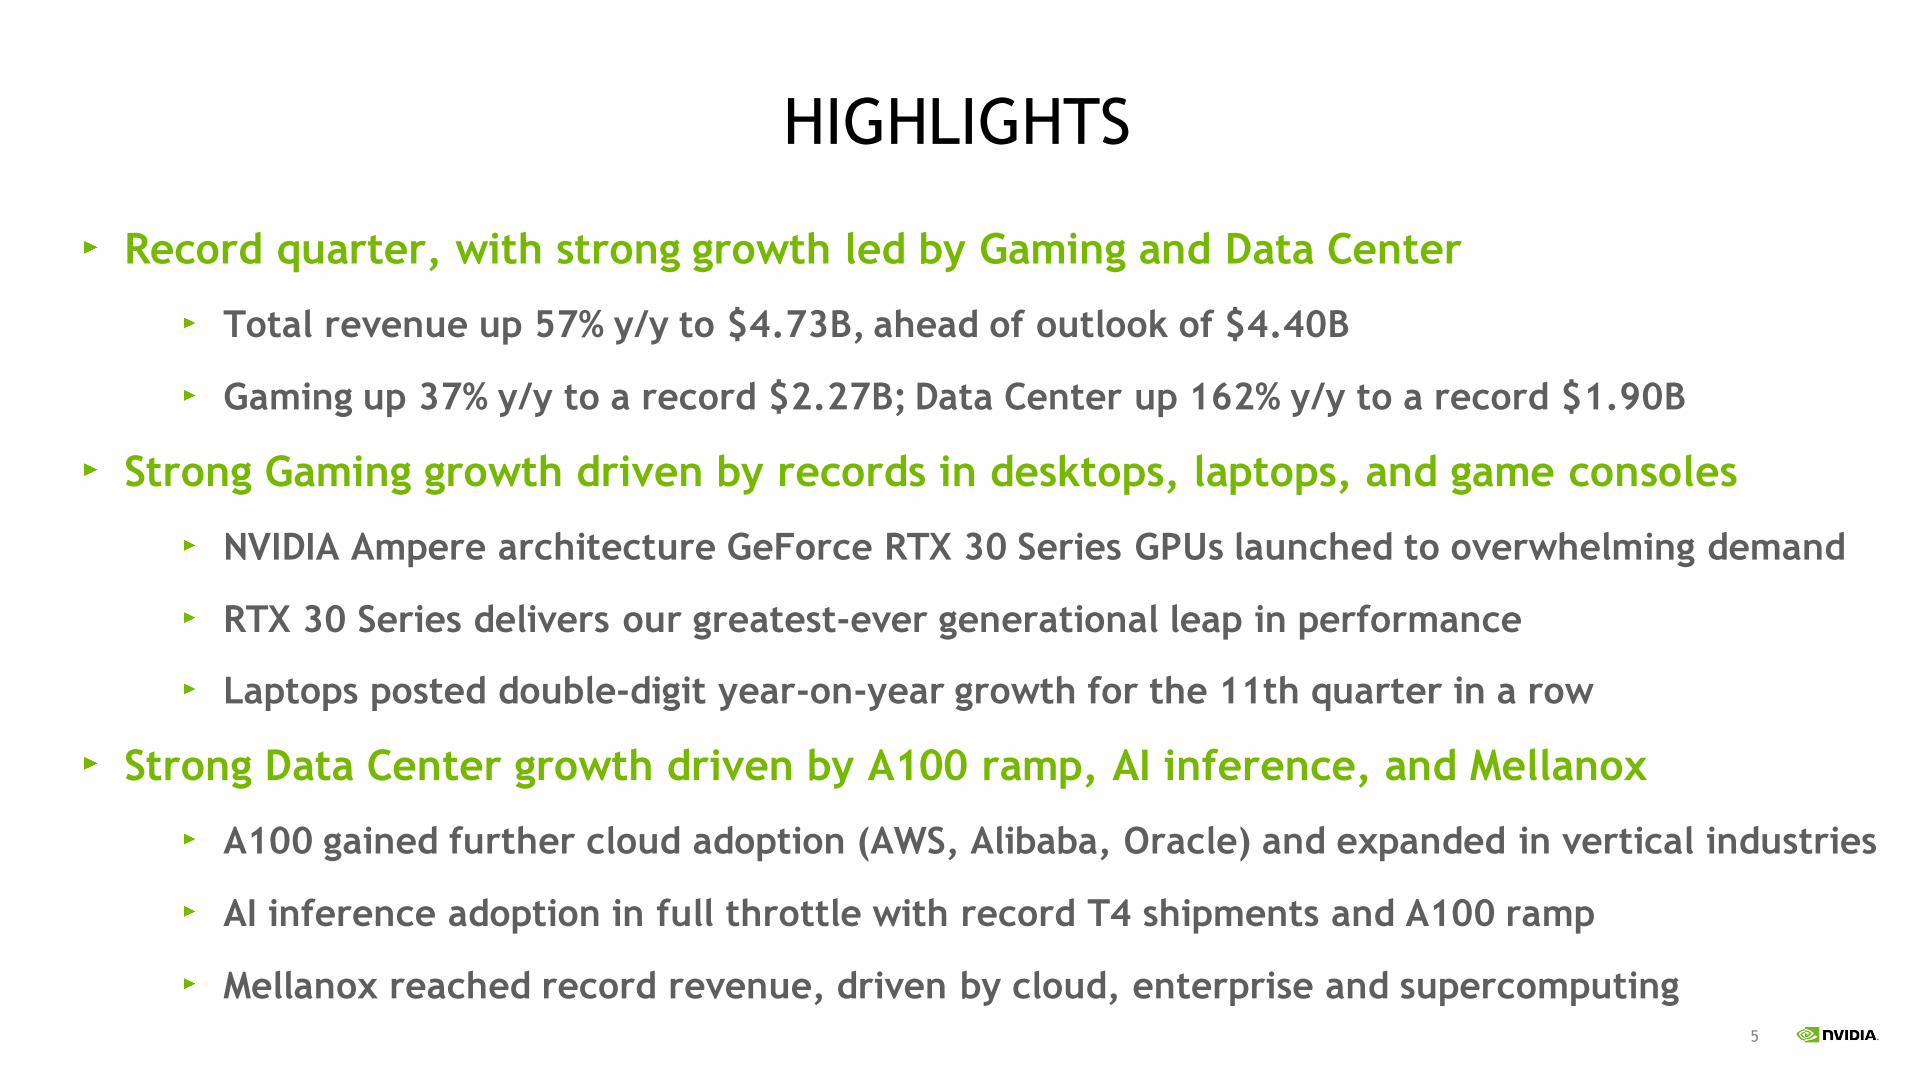
Record quarter, with strong growth led by Gaming and Data Center
Total revenue up 57% y/y to $4.73B, ahead of outlook of $4.40B
Gaming up 37% y/y to a record $2.27B; Data Center up 162% y/y to a record $1.90B
Strong Gaming growth driven by records in desktops, laptops, and game consoles
NVIDIA Ampere architecture GeForce RTX 30 Series GPUs launched to overwhelming demand
RTX 30 Series delivers our greatest-ever generational leap in performance
Laptops posted double-digit year-on-year growth for the 11th quarter in a row
Strong Data Center growth driven by A100 ramp, AI inference, and Mellanox
A100 gained further cloud adoption (AWS, Alibaba, Oracle) and expanded in vertical industries
AI inference adoption in full throttle with record T4 shipments and A100 ramp
Mellanox reached record revenue, driven by cloud, enterprise and supercomputing

6
Q3 FY2021 FINANCIAL SUMMARY
GAAP Non-GAAP
Q3 FY21 Y/Y Q/Q Q3 FY21 Y/Y Q/Q
Revenue $4,726 +57% +22% $4,726 +57% +22%
Gross Margin 62.6% -100 bps +380 bps 65.5% +140 bps -50 bps
Operating Income $1,398 +51% +115% $1,993 +72% +31%
Net Income $1,336 +49% +115% $1,834 +66% +34%
Diluted EPS $2.12 +46% +114% $2.91 +63% +33%
Cash Flow from Ops $1,279 -22% -18% $1,279 -22% -18%
$3,014$3,105 $3,080
$3,866
$4,726
64.1%65.4% 65.8% 66.0% 65.5%
55.0%
60.0%
65.0%
70.0%
75.0%
80.0%
85.0%
1,500
2,000
2,500
3,000
3,500
4,000
4,500
5,000
Q3FY20 Q4FY20 Q1FY21 Q2FY21 Q3FY21
Revenue($M) Non-GAAP GM
No difference between GAAP and Non-GAAP Cash Flow from Operations and Revenue
7
GAMING
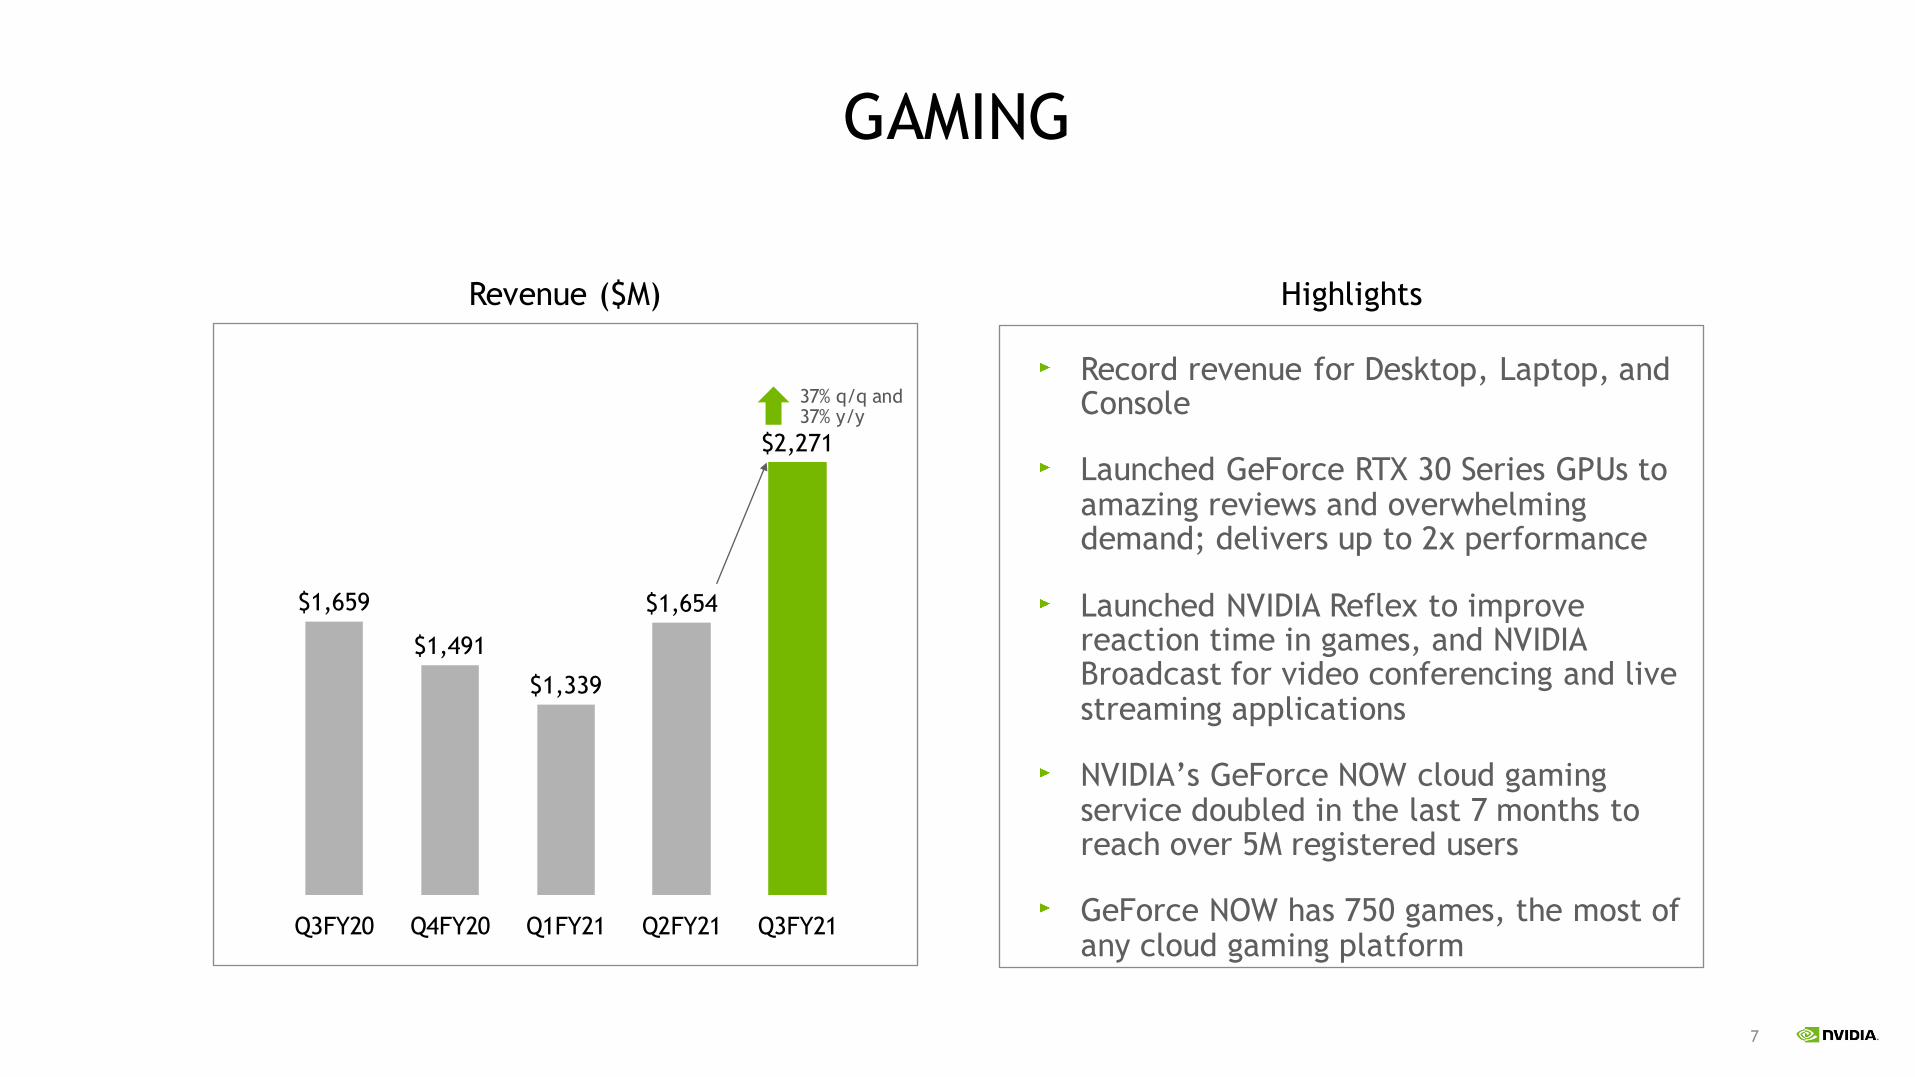
Record revenue for Desktop, Laptop, and Console
Launched GeForce RTX 30 Series GPUs to amazing reviews and overwhelming demand; delivers up to 2x performance
Launched NVIDIA Reflex to improve reaction time in games, and NVIDIA Broadcast for video conferencing and live streaming applications
NVIDIA’s GeForce NOW cloud gaming service doubled in the last 7 months to reach over 5M registered users
GeForce NOW has 750 games, the most of any cloud gaming platform
Revenue ($M)
$1,659
$1,491
$1,339
$1,654
$2,271
$600
$800
$1,000
$1,200
$1,400
$1,600
$1,800
$2,000
$2,200
$2,400
Q3FY20 Q4FY20 Q1FY21 Q2FY21 Q3FY21
Highlights
37% q/q and 37% y/y
8
DATA CENTER
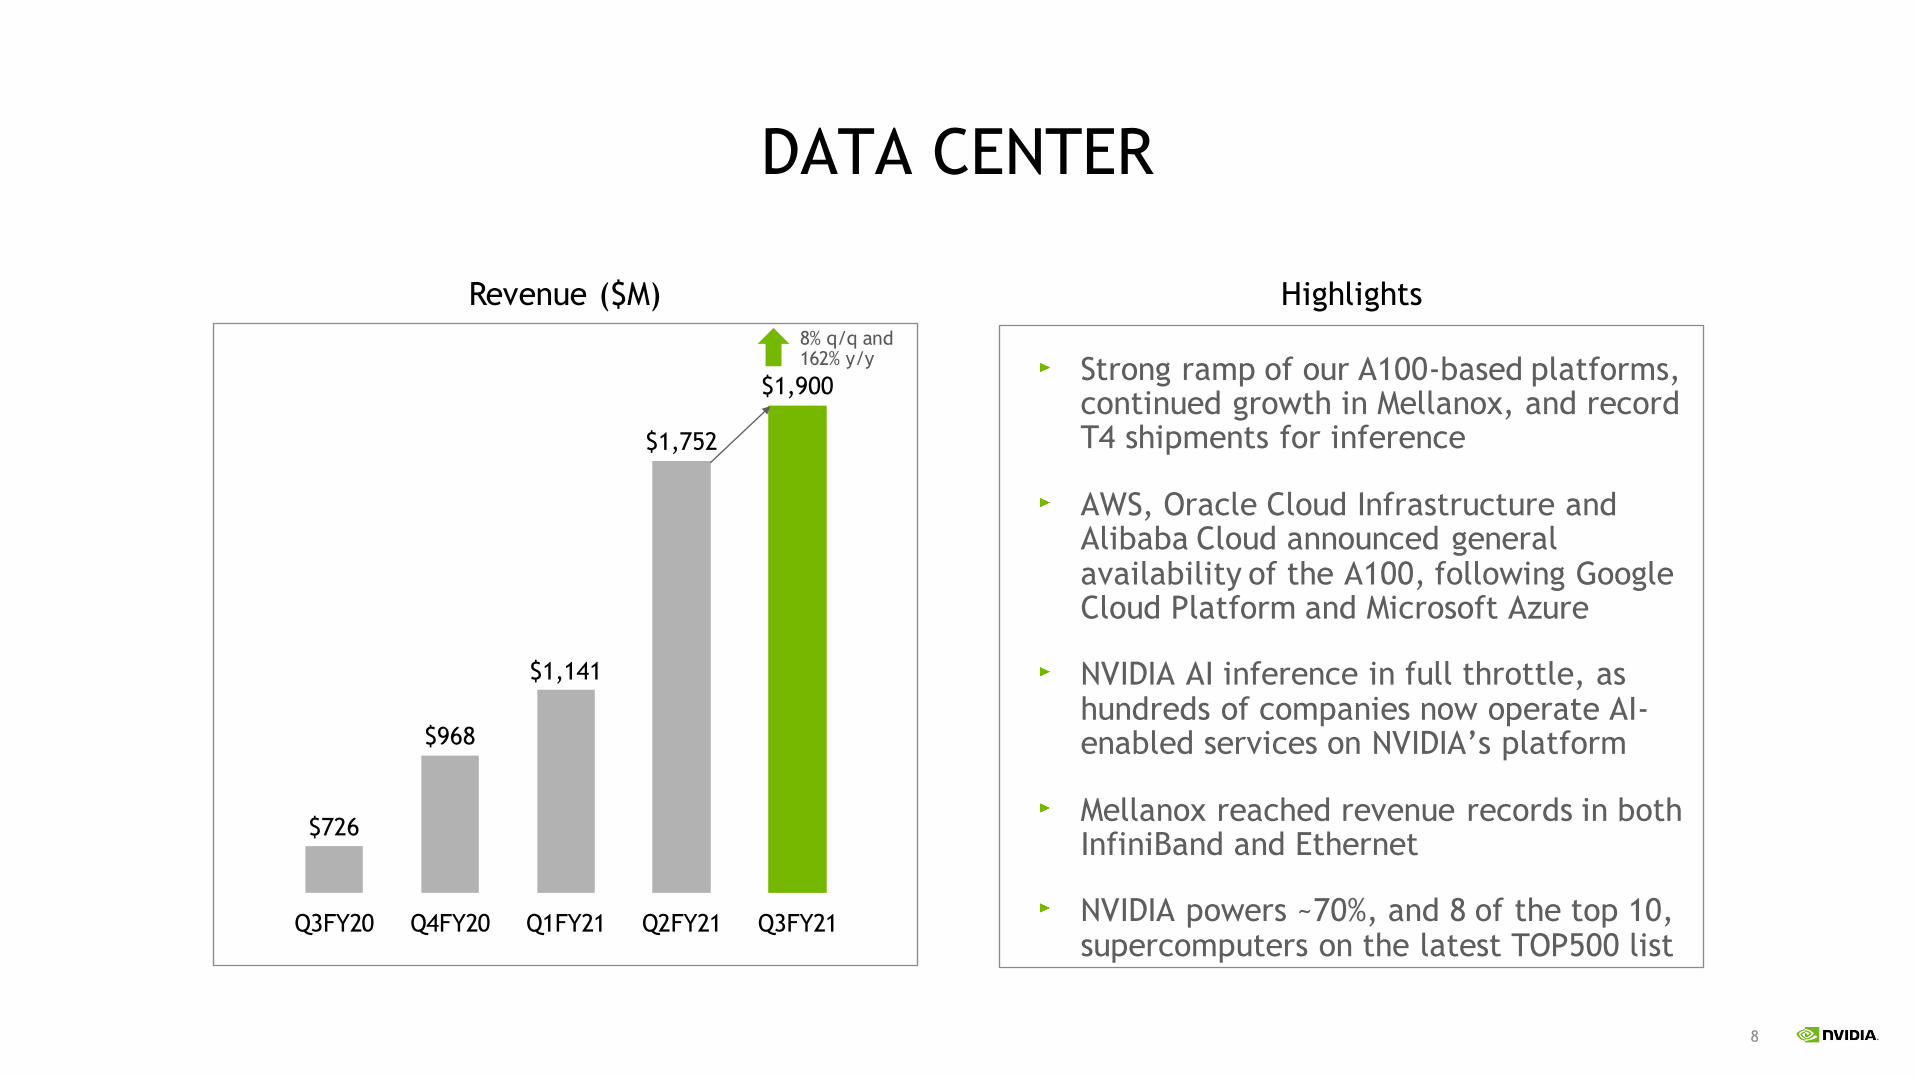
$726
$968
$1,141
$1,752
$1,900
$600
$800
$1,000
$1,200
$1,400
$1,600
$1,800
$2,000
Q3FY20 Q4FY20 Q1FY21 Q2FY21 Q3FY21
Revenue ($M) Highlights
8% q/q and 162% y/y Strong ramp of our A100-based platforms,
continued growth in Mellanox, and record T4 shipments for inference
AWS, Oracle Cloud Infrastructure and Alibaba Cloud announced general availability of the A100, following Google Cloud Platform and Microsoft Azure
NVIDIA AI inference in full throttle, as hundreds of companies now operate AI-enabled services on NVIDIA’s platform
Mellanox reached revenue records in both InfiniBand and Ethernet
NVIDIA powers ~70%, and 8 of the top 10, supercomputers on the latest TOP500 list
9
PROFESSIONAL VISUALIZATION
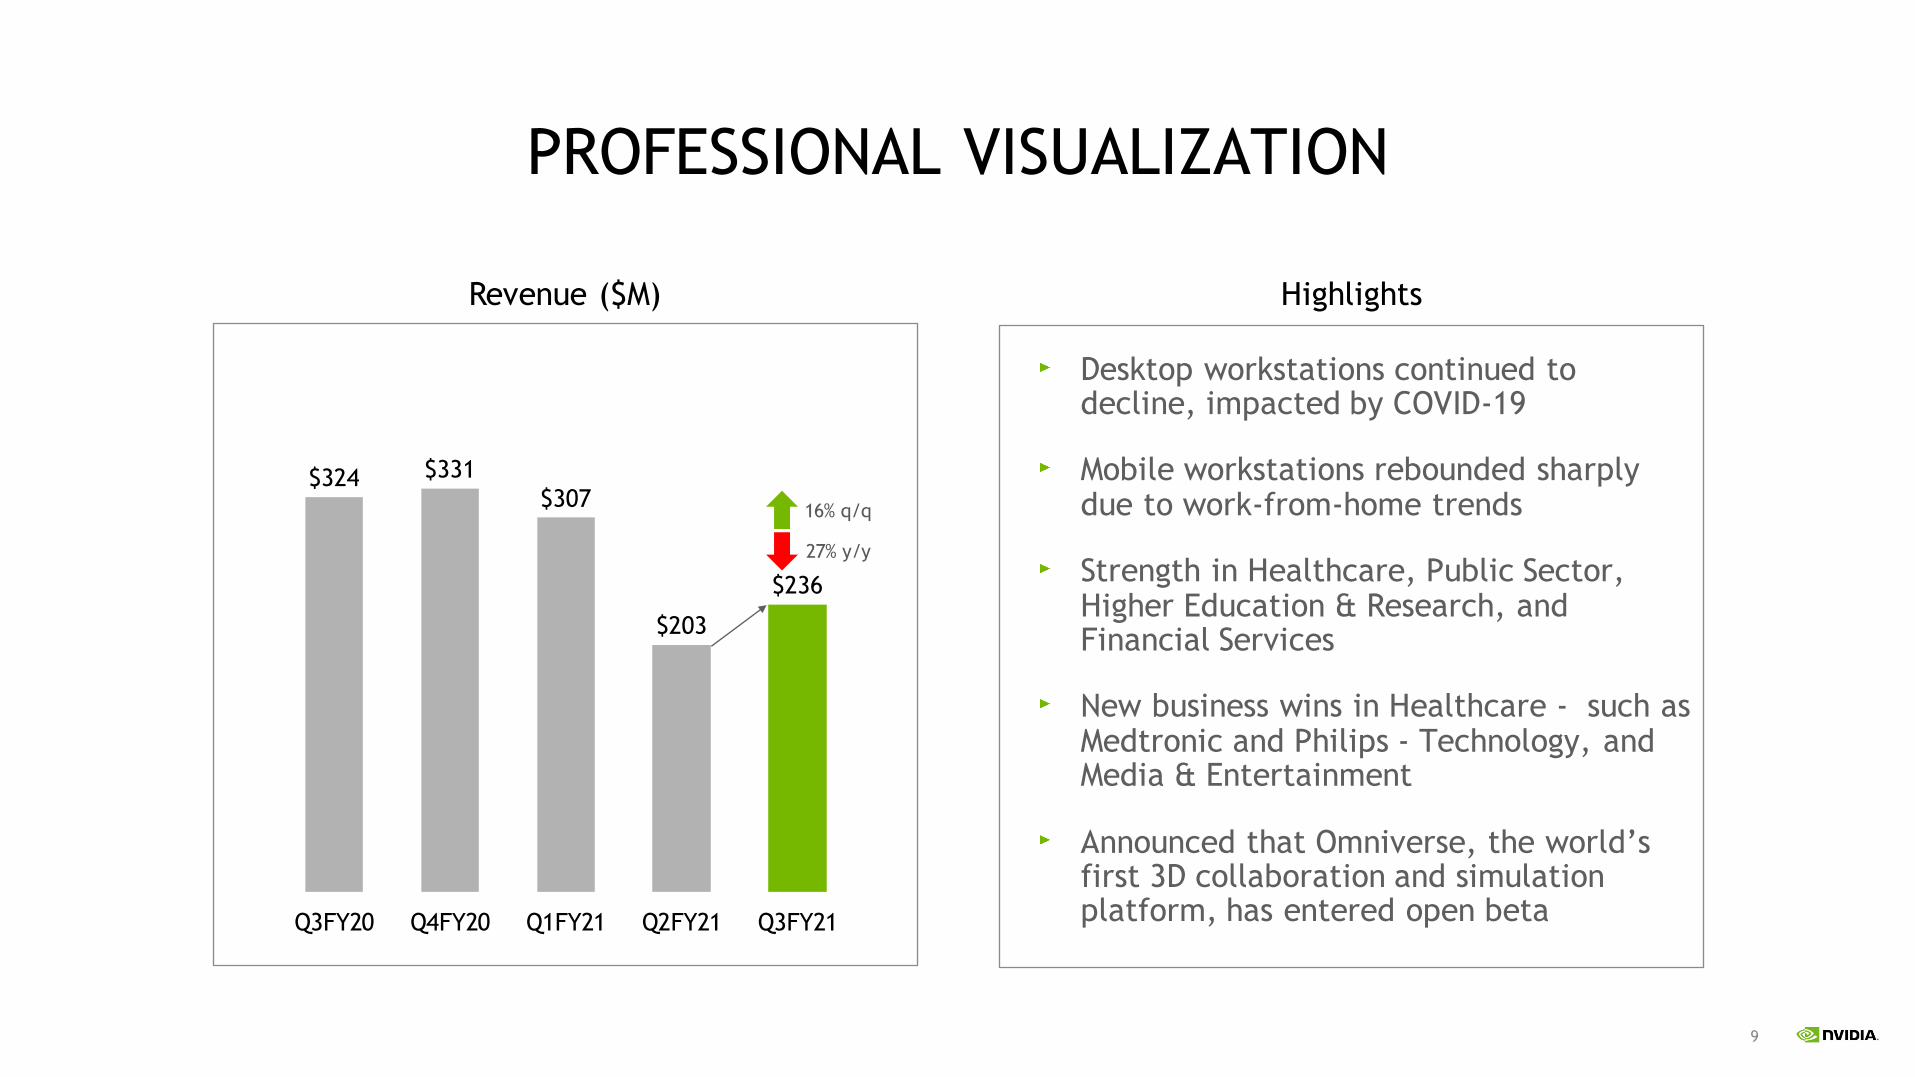
$324 $331
$307
$203
$236
$0
$350
Q3FY20 Q4FY20 Q1FY21 Q2FY21 Q3FY21
HighlightsRevenue ($M)
27% y/y
16% q/q
Desktop workstations continued to decline, impacted by COVID-19
Mobile workstations rebounded sharply due to work-from-home trends
Strength in Healthcare, Public Sector, Higher Education & Research, and Financial Services
New business wins in Healthcare - such as Medtronic and Philips - Technology, and Media & Entertainment
Announced that Omniverse, the world’s first 3D collaboration and simulation platform, has entered open beta
10
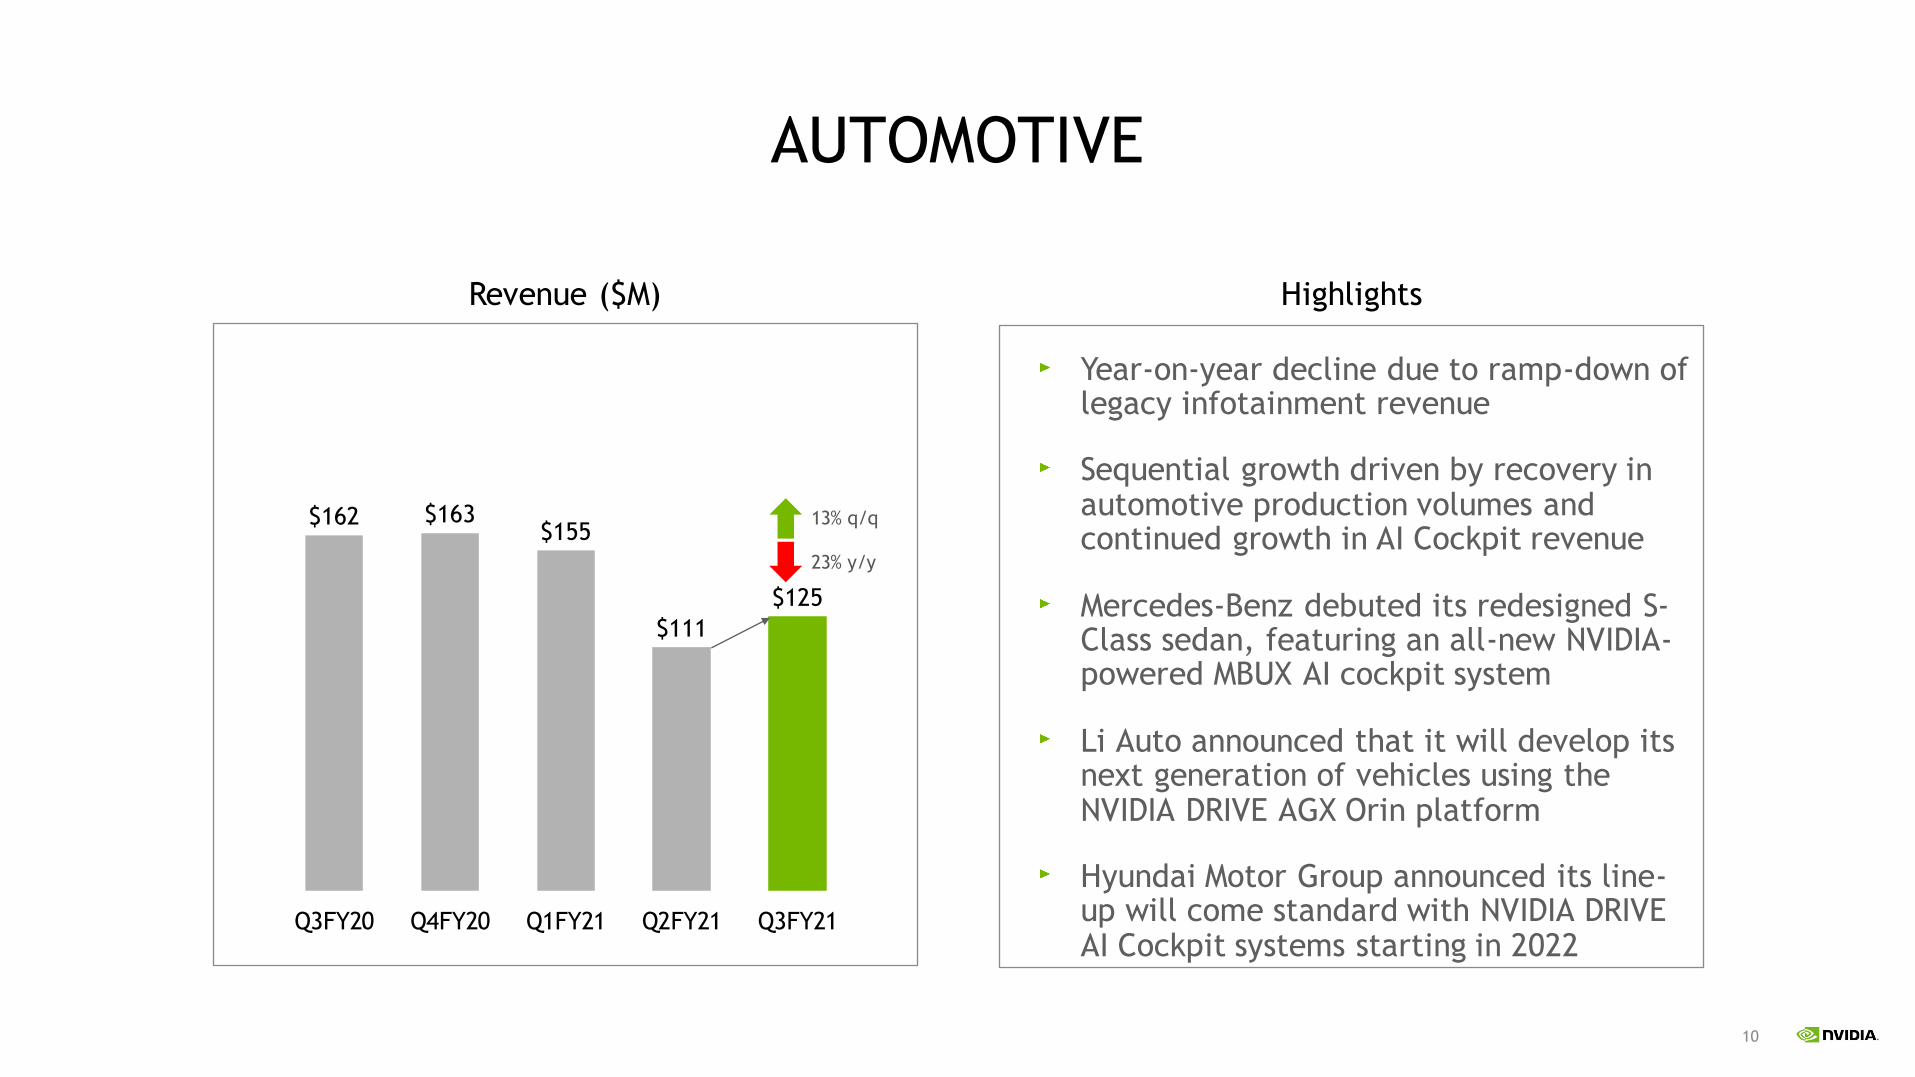
AUTOMOTIVE
$162 $163$155
$111
$125
$0
$250
Q3FY20 Q4FY20 Q1FY21 Q2FY21 Q3FY21
HighlightsRevenue ($M)
23% y/y
13% q/q
Year-on-year decline due to ramp-down of legacy infotainment revenue
Sequential growth driven by recovery in automotive production volumes and continued growth in AI Cockpit revenue
Mercedes-Benz debuted its redesigned S-Class sedan, featuring an all-new NVIDIA-powered MBUX AI cockpit system
Li Auto announced that it will develop its next generation of vehicles using the NVIDIA DRIVE AGX Orin platform
Hyundai Motor Group announced its line-up will come standard with NVIDIA DRIVE AI Cockpit systems starting in 2022

11
SOURCES & USES OF CASH
$1,640
$1,465
$909
$1,566
$1,279
$0
$200
$400
$600
$800
$1,000
$1,200
$1,400
$1,600
$1,800
$2,000
$2,200
Q3FY20 Q4FY20 Q1FY21 Q2FY21 Q3FY21
Gross cash is defined as cash/cash equivalents & marketable securities.Debt is defined as principal value of debt.Net cash is defined as gross cash less debt.
HighlightsCash Flow from Operations ($M)
18% q/q and 22% y/y
Paid $2B in cash as part of our announced acquisition of Arm
Returned $99M to shareholders in the form of dividends
Invested $473M in capex
Ended the quarter with $10B in gross cash and $7B in debt, $3B of net cash

12
Q4 FY2021 OUTLOOK
Revenue –$4.80 billion, plus or minus two percent
We expect Gaming to be up sequentially. We expect Data Center to be down slightly sequentially. We expect
continued sequential improvement in Auto and Pro Viz, and a sequential seasonal decline in OEM.
Gross Margin – 62.8% GAAP and 65.5% non-GAAP, plus or minus 50 basis points
Operating Expense – Approximately $1.64 billion GAAP and $1.18 billion non-GAAP
Other Income & Expense – Net expense of $55 million for both GAAP and non-GAAP
Tax Rate – GAAP and non-GAAP both eight percent, plus or minus one percent, excluding discrete items
Capital Expenditure – Approximately $300 to $325 million

13
PROPOSED ACQUISITION OF ARM
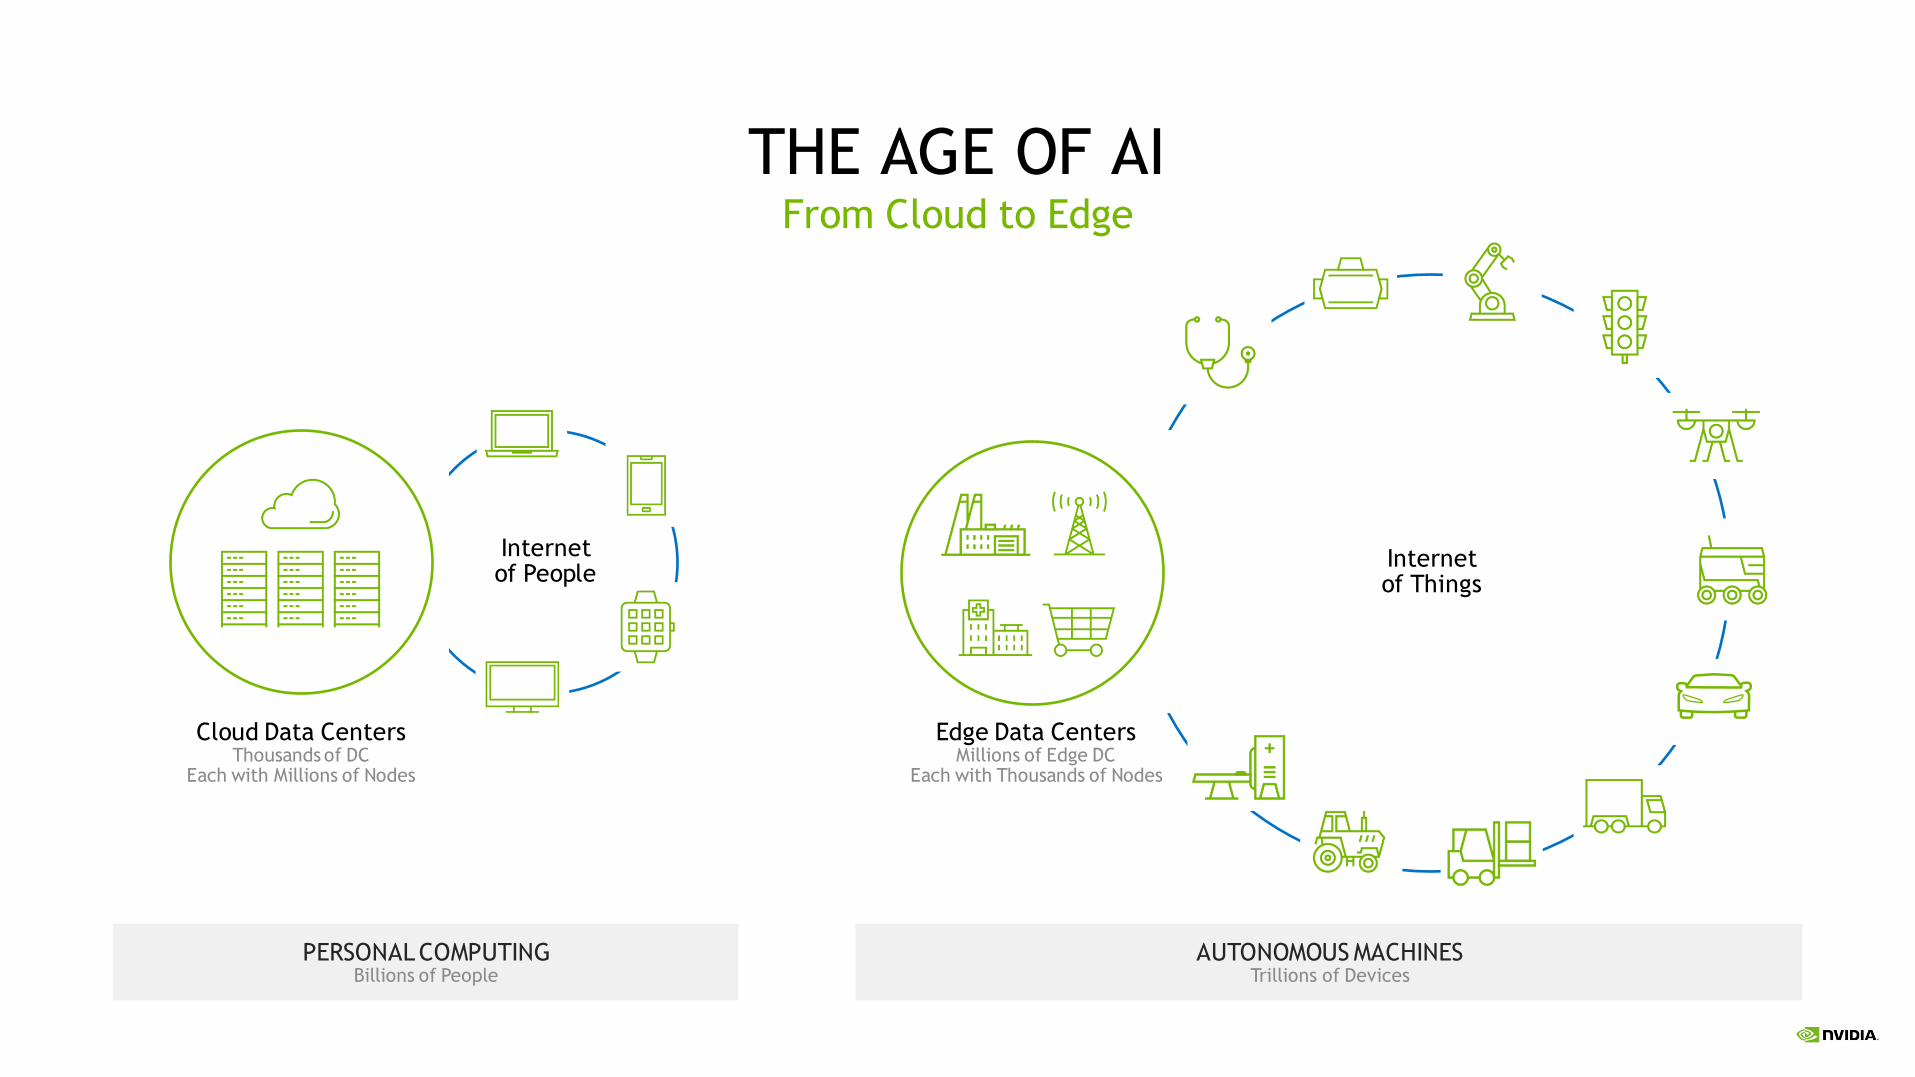
THE AGE OF AI
PERSONAL COMPUTINGBillions of People
AUTONOMOUS MACHINESTrillions of Devices
Edge Data CentersMillions of Edge DC
Each with Thousands of Nodes
Internet of Things
Cloud Data CentersThousands of DC
Each with Millions of Nodes
Internet of People
From Cloud to Edge

NVIDIA TO ACQUIRE ARM
Creates the premier computing company for the age of AI —
combining NVIDIA’s leading AI computing platform with Arm’s vast CPU ecosystem
Expands Arm’s IP licensing portfolio with NVIDIA’s technology in large end markets —
including Mobile and PCs
Turbocharges Arm’s server CPU roadmap pace and accelerates
Data Center, Edge AI, and IoT opportunities
Expands NVIDIA’s computing platform reach from 2 to over 15 million developers
Financially attractive: immediately accretive to
non-GAAP gross margins and non-GAAP EPS upon closing
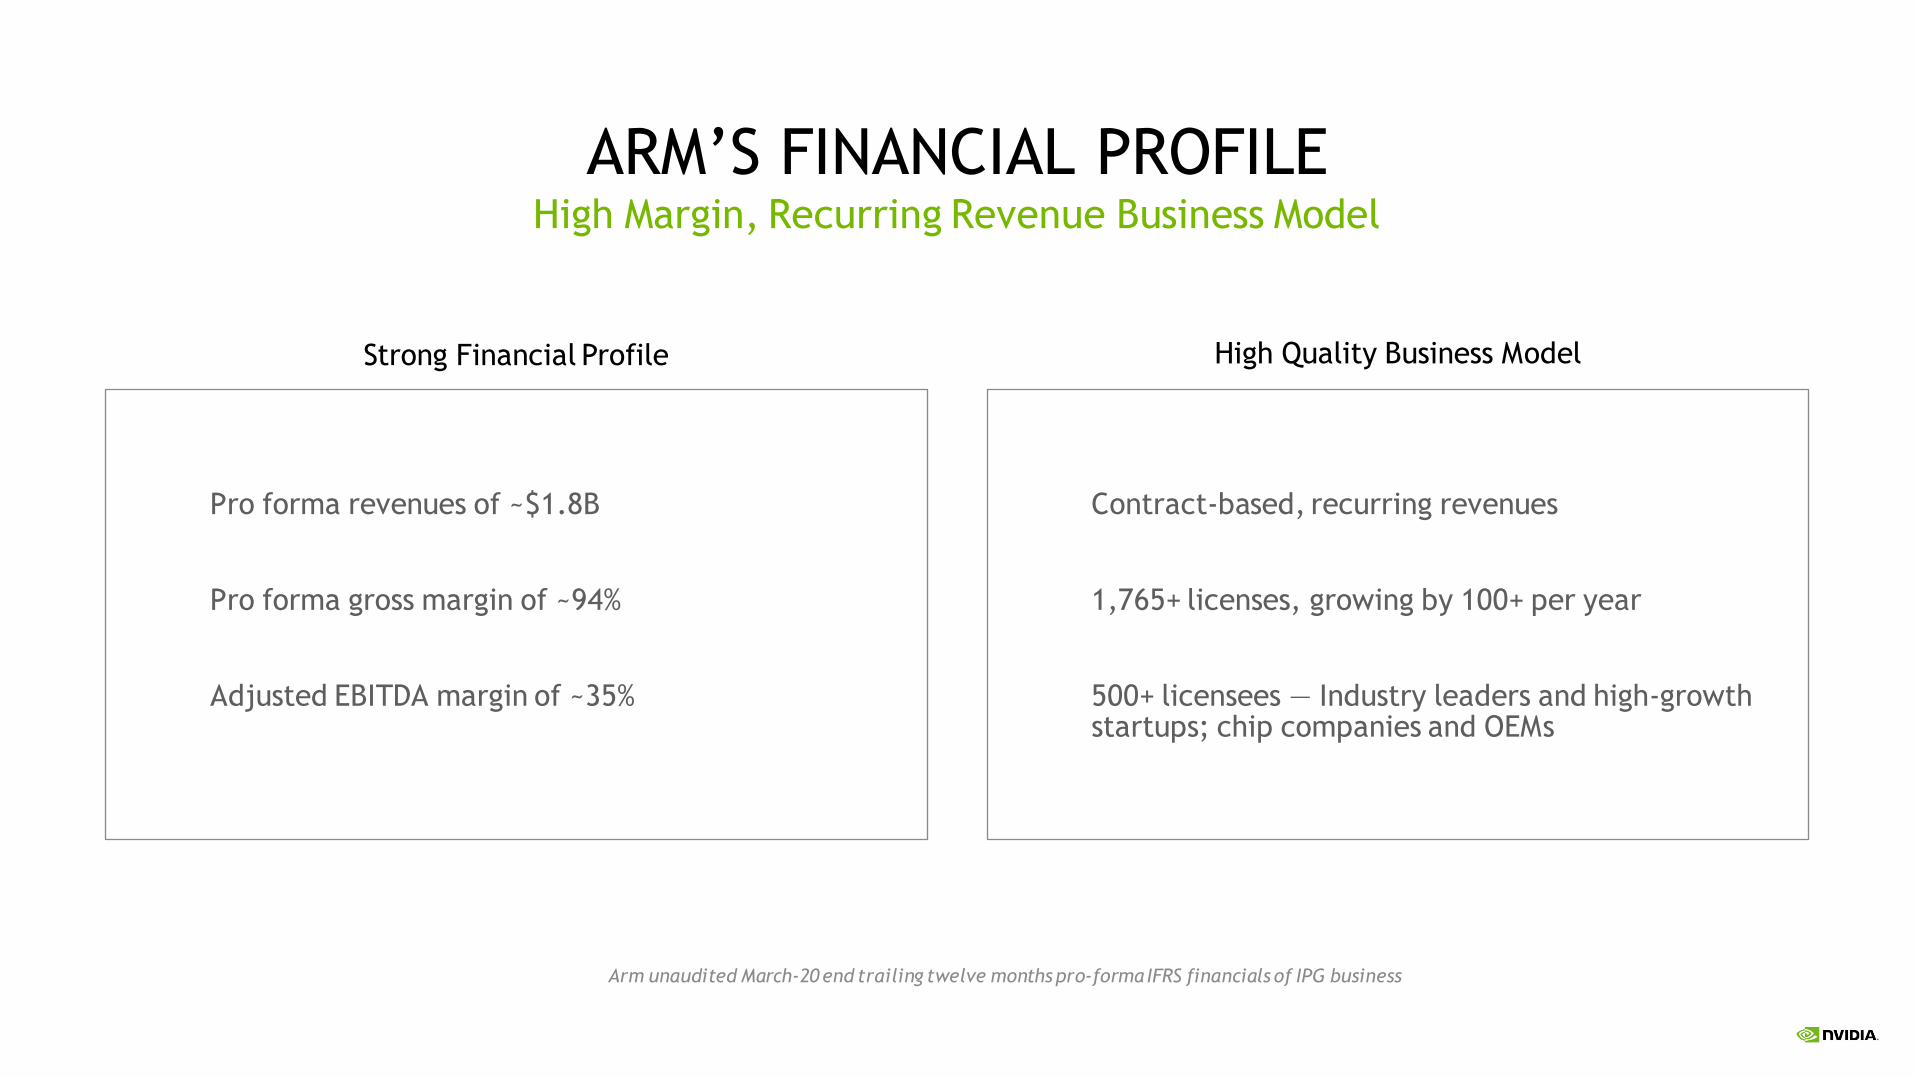
ARM’S FINANCIAL PROFILE
Pro forma revenues of ~$1.8B
Pro forma gross margin of ~94%
Adjusted EBITDA margin of ~35%
High Margin, Recurring Revenue Business Model
Arm unaudited March-20 end trailing twelve months pro-forma IFRS financials of IPG business
Contract-based, recurring revenues
1,765+ licenses, growing by 100+ per year
500+ licensees — Industry leaders and high-growth startups; chip companies and OEMs
Strong Financial Profile High Quality Business Model

TRANSACTION SUMMARY
TRANSACTION
CONSIDERATION
Up to $40B purchase price at the time of signing:
• $21.5B in NVIDIA shares
• $12B in cash, with $2B paid at signing
• $1.5B employee equity for post-closing retention
• $5B performance based earn-out paid in cash or up to 10.3M NVIDIA shares
FINANCIAL
IMPACT
Expected to be immediately accretive to NVIDIA’s non-GAAP gross margin
and non-GAAP earnings per share
APPROVAL
PROCESS
Approved by NVIDIA, Arm and SoftBank Boards of Directors
Subject to regulatory approvals
EXPECTED
CLOSING
Expected close in the first quarter of 2022
Customary closing conditions

KEY ANNOUNCEMENTS THIS QUARTER
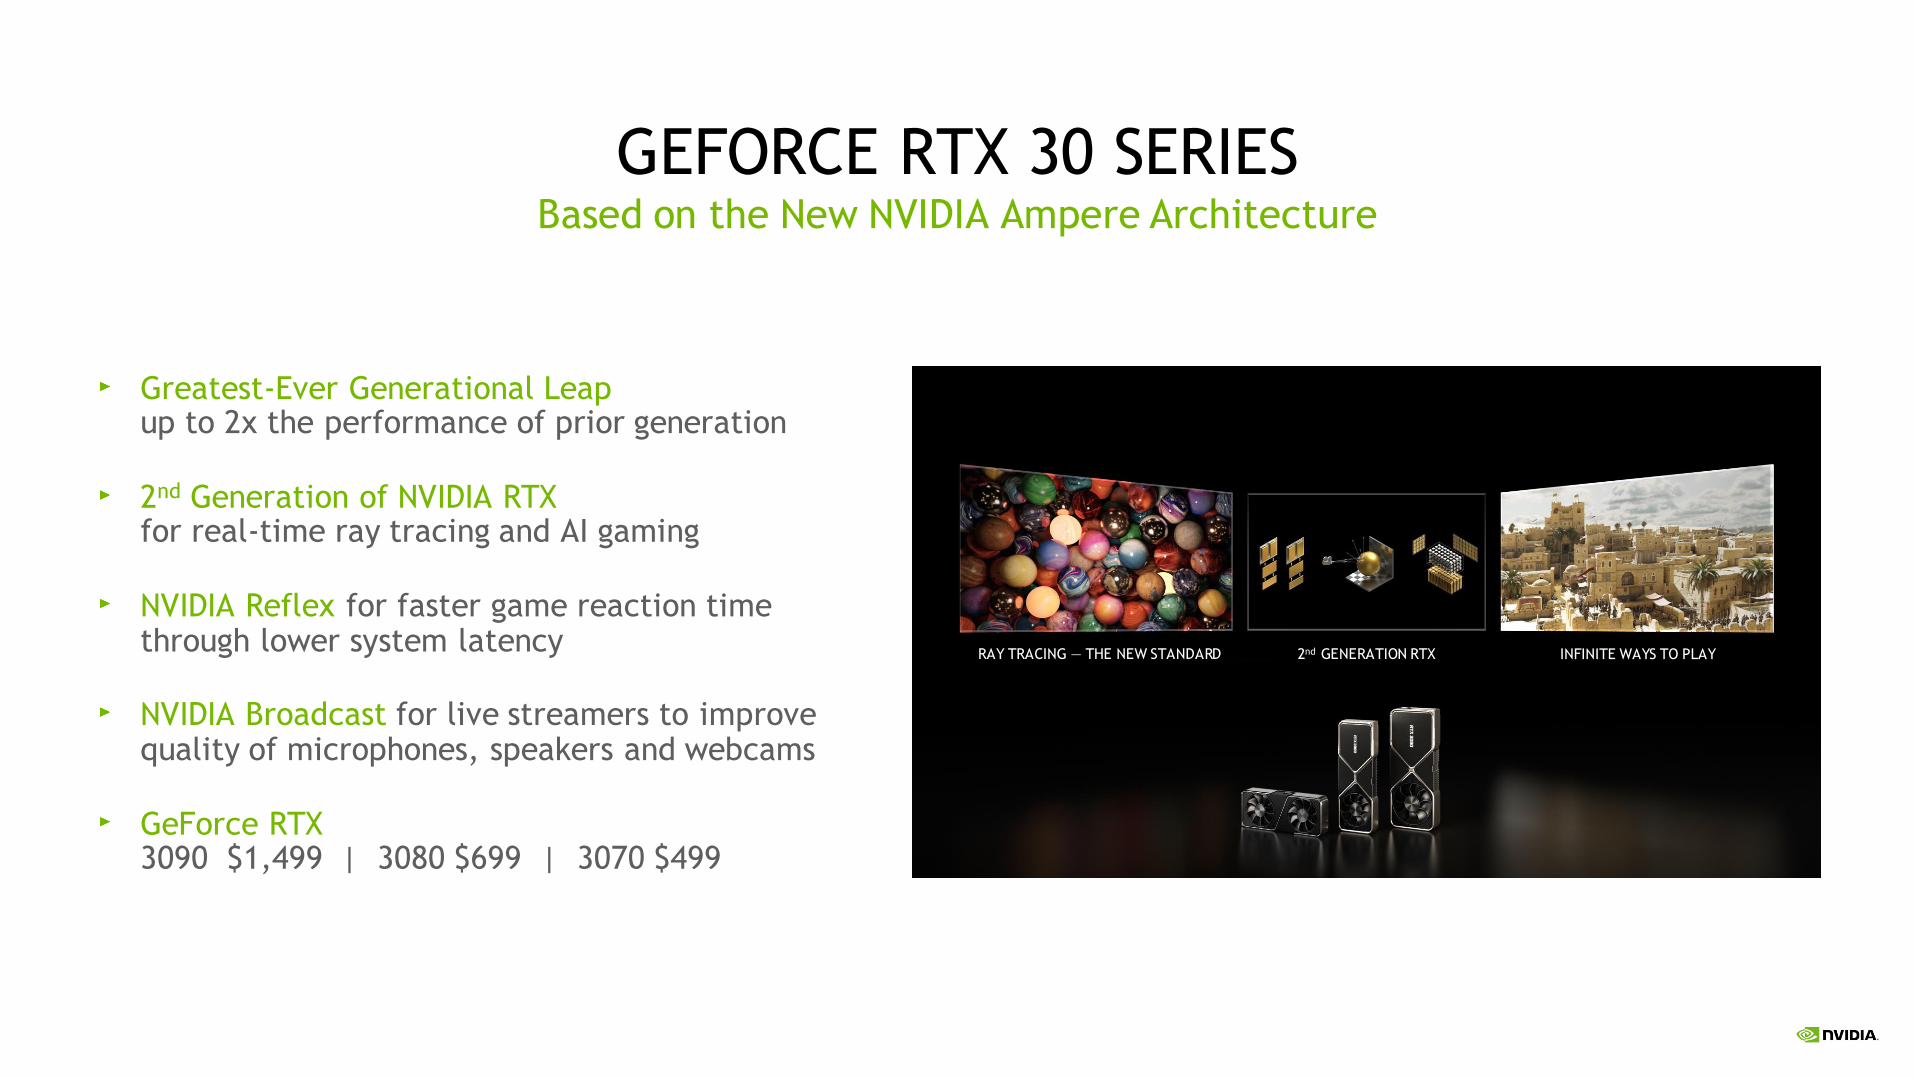
GEFORCE RTX 30 SERIES
Greatest-Ever Generational Leap up to 2x the performance of prior generation
2nd Generation of NVIDIA RTX for real-time ray tracing and AI gaming
NVIDIA Reflex for faster game reaction time through lower system latency
NVIDIA Broadcast for live streamers to improve quality of microphones, speakers and webcams
GeForce RTX 3090 $1,499 | 3080 $699 | 3070 $499
Based on the New NVIDIA Ampere Architecture
RAY TRACING — THE NEW STANDARD INFINITE WAYS TO PLAY2nd GENERATION RTX

NVIDIA WINS BENCHMARK FOR AI INFERENCEExtending its Lead in Latest MLPerf Inference v0.7 Benchmark
What is MLPerf?
The industry’s first and only objective standard for measuring machine learning performance
Consortium of over 70 universities and companies, including Google, Intel, Baidu and NVIDIA, founded in 2018
NVIDIA won all prior MLPerf benchmarks, including for training in Dec. 2018, July 2019 and July 2020, and for inference Nov. 2019
MLPerf October 2020 — AI Inference
NVIDIA won every test across all six application areas for data center and edge computing systems
NVIDIA increased its lead, beating CPU-only systems by 30x on the ResNet-50 test versus 6x in the last round, and outperformed CPUs by up to 237x in the newly added recommender test
NVIDIA T4 Tensor Core GPU continues to be a high-performance inference platform for mainstream enterprise, edge servers and cost-effective cloud instances, beating CPUs by up to 28x
NVIDIA Jetson AGX Xavier is the performance leader among SoC-based edge devices
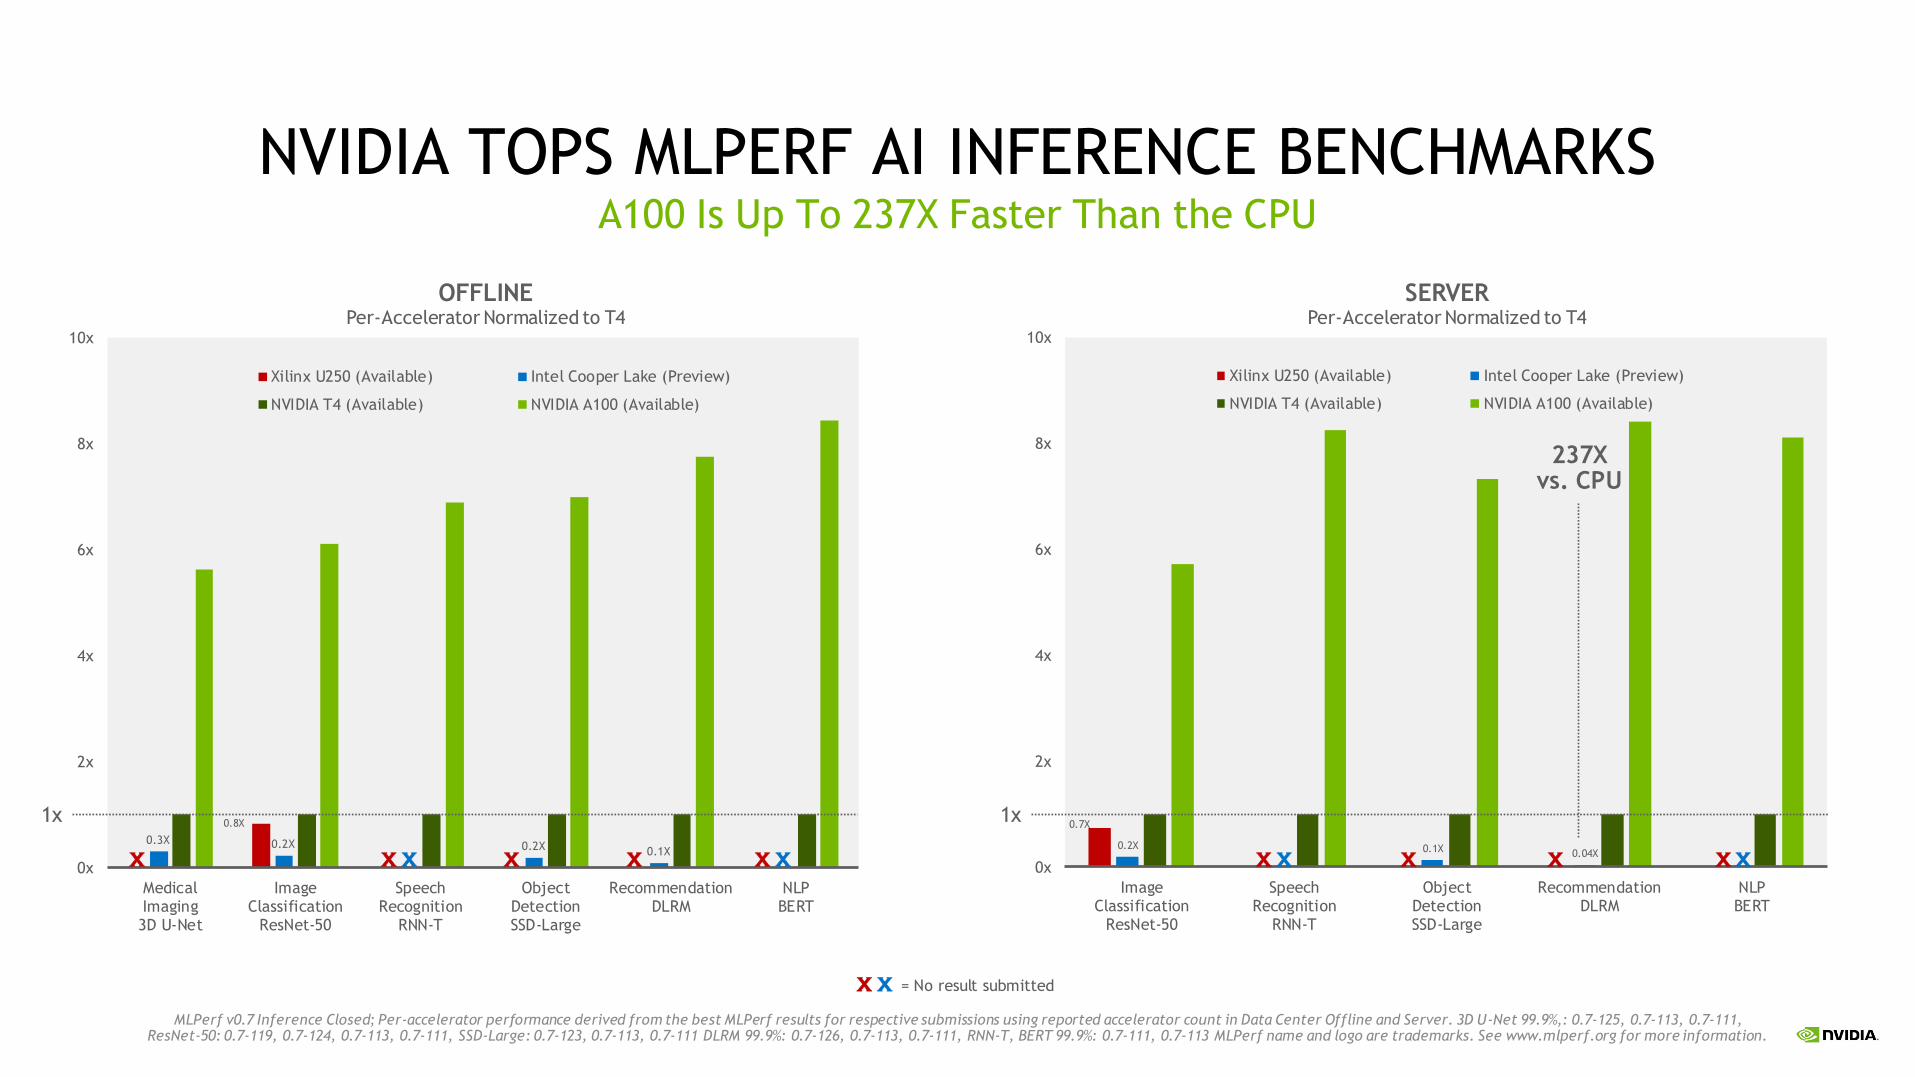
NVIDIA TOPS MLPERF AI INFERENCE BENCHMARKSA100 Is Up To 237X Faster Than the CPU
0.8X
0.3X 0.2X 0.2X 0.1X
0x
2x
4x
6x
8x
10x
MedicalImaging3D U-Net
ImageClassification
ResNet-50
SpeechRecognition
RNN-T
ObjectDetectionSSD-Large
RecommendationDLRM
NLPBERT
Xilinx U250 (Available) Intel Cooper Lake (Preview)
NVIDIA T4 (Available) NVIDIA A100 (Available)
0.7X
0.2X 0.1X 0.04X
0x
2x
4x
6x
8x
10x
ImageClassification
ResNet-50
SpeechRecognition
RNN-T
ObjectDetectionSSD-Large
RecommendationDLRM
NLPBERT
Xilinx U250 (Available) Intel Cooper Lake (Preview)
NVIDIA T4 (Available) NVIDIA A100 (Available)
X X X X XXX
1x
MLPerf v0.7 Inference Closed; Per-accelerator performance derived from the best MLPerf results for respective submissions using reported accelerator count in Data Center Offline and Server. 3D U-Net 99.9%,: 0.7-125, 0.7-113, 0.7-111, ResNet-50: 0.7-119, 0.7-124, 0.7-113, 0.7-111, SSD-Large: 0.7-123, 0.7-113, 0.7-111 DLRM 99.9%: 0.7-126, 0.7-113, 0.7-111, RNN-T, BERT 99.9%: 0.7-111, 0.7-113 MLPerf name and logo are trademarks. See www.mlperf.org for more information.
X X = No result submitted
1x
X XX X X
OFFLINE SERVER
237Xvs. CPU
Per-Accelerator Normalized to T4 Per-Accelerator Normalized to T4
X

ACCELERATING ADOPTION OF NVIDIA AI INFERENCECelebrating 10 Years of NVIDIA GPU in the Cloud
Inference ExaOPS shipped: Represents 12-month periods from October of the previous year to September of the year shown
2000+ Optimizations
TensorFlow, PyTorch, ONNX
1.3M Downloads
16,000 Companies
2017 2018 2019 2020
<12
25
166
TRTTRT
2010NVIDIA M2050
2020NVIDIA A100
0
1
10
100
1,000
10,000
100,000
1,000,000
7TH GENERATION TensorRT(Inference Compiler)
ACCELERATED ADOPTION OF NVIDIA GPU(EXA OPS)
TOTAL CLOUD AI INFERENCE COMPUTE CAPACITY (PETA OPS)
Total GPU
Total CPU

NVIDIA AI INFERENCE CUSTOMERS
CSPCONSUMER INTERNETAUTO RETAIL & FSIMEDICAL INDUSTRIALROBOTICS
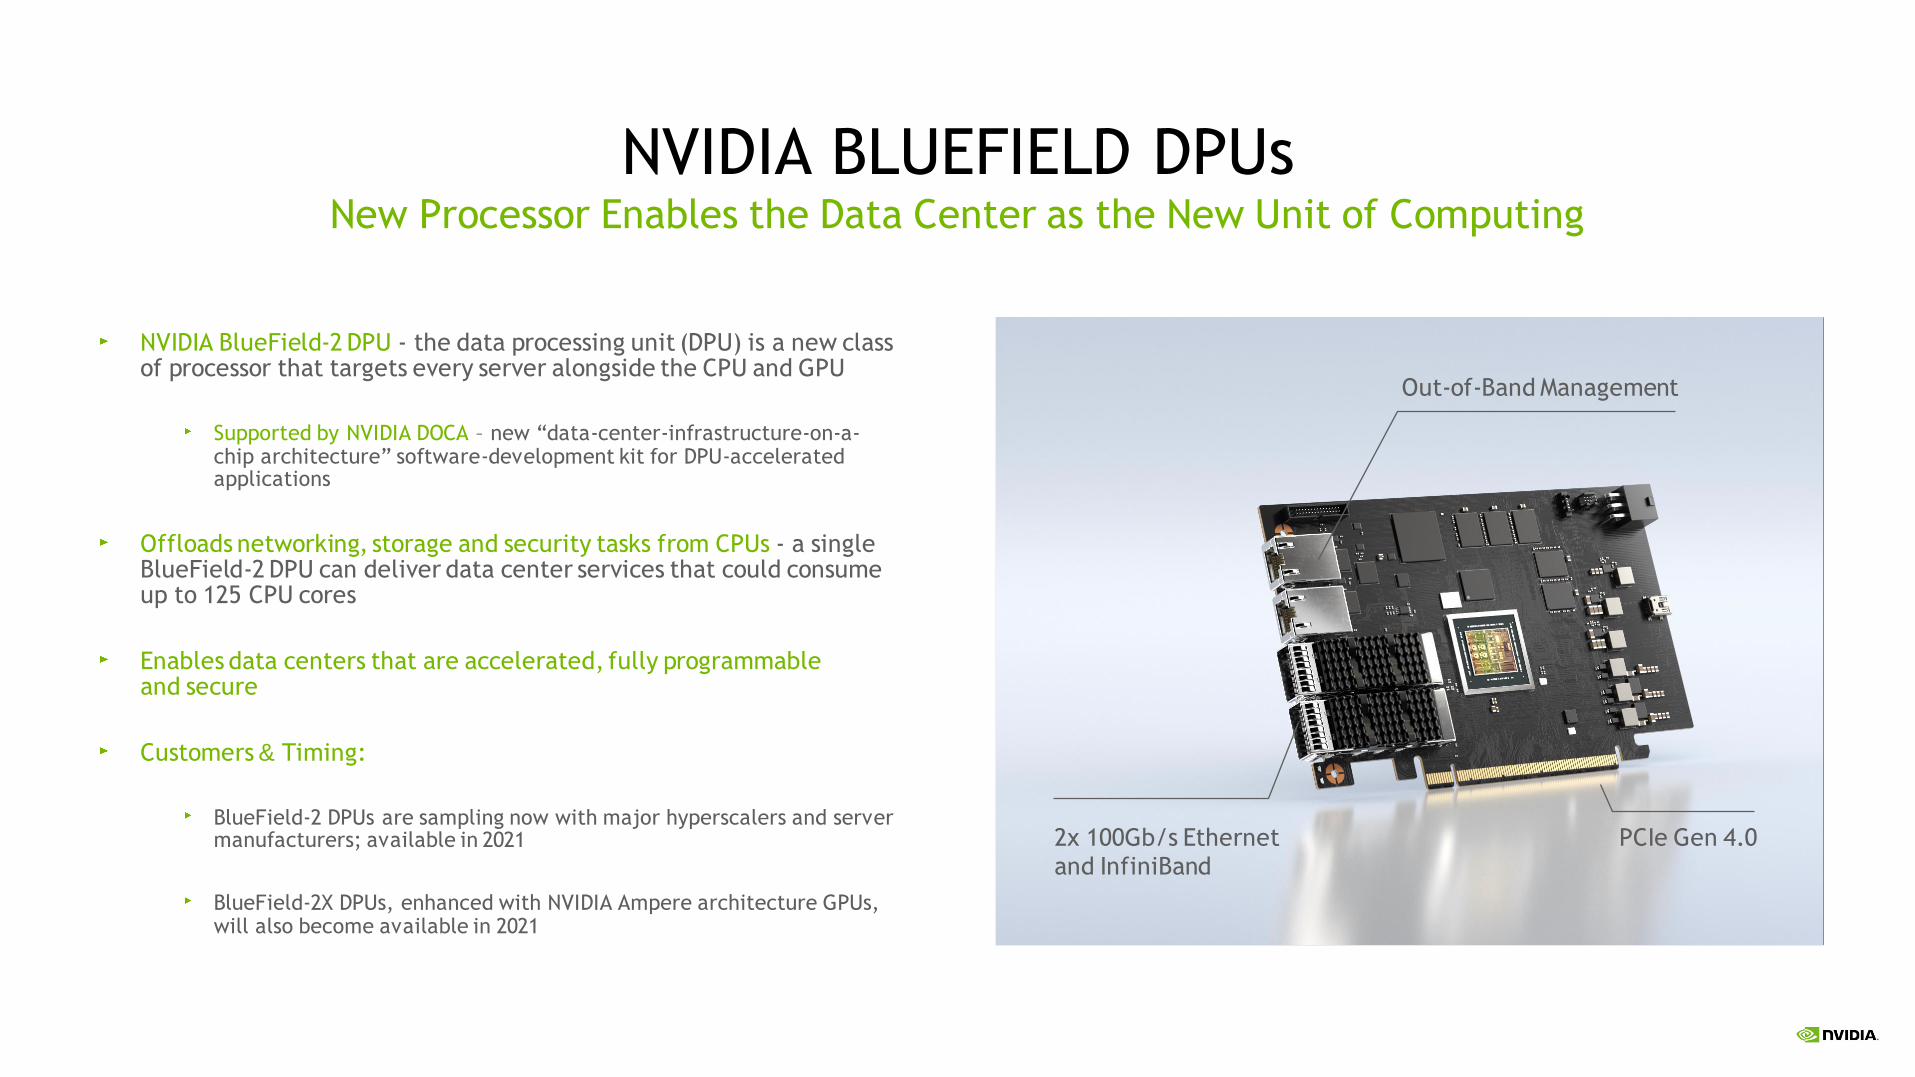
NVIDIA BLUEFIELD DPUs
NVIDIA BlueField-2 DPU - the data processing unit (DPU) is a new class of processor that targets every server alongside the CPU and GPU
Supported by NVIDIA DOCA – new “data-center-infrastructure-on-a-chip architecture” software-development kit for DPU-accelerated applications
Offloads networking, storage and security tasks from CPUs - a single BlueField-2 DPU can deliver data center services that could consume up to 125 CPU cores
Enables data centers that are accelerated, fully programmable and secure
Customers & Timing:
BlueField-2 DPUs are sampling now with major hyperscalers and server manufacturers; available in 2021
BlueField-2X DPUs, enhanced with NVIDIA Ampere architecture GPUs, will also become available in 2021
New Processor Enables the Data Center as the New Unit of Computing
Out-of-Band Management
2x 100Gb/s Ethernetand InfiniBand
PCIe Gen 4.0
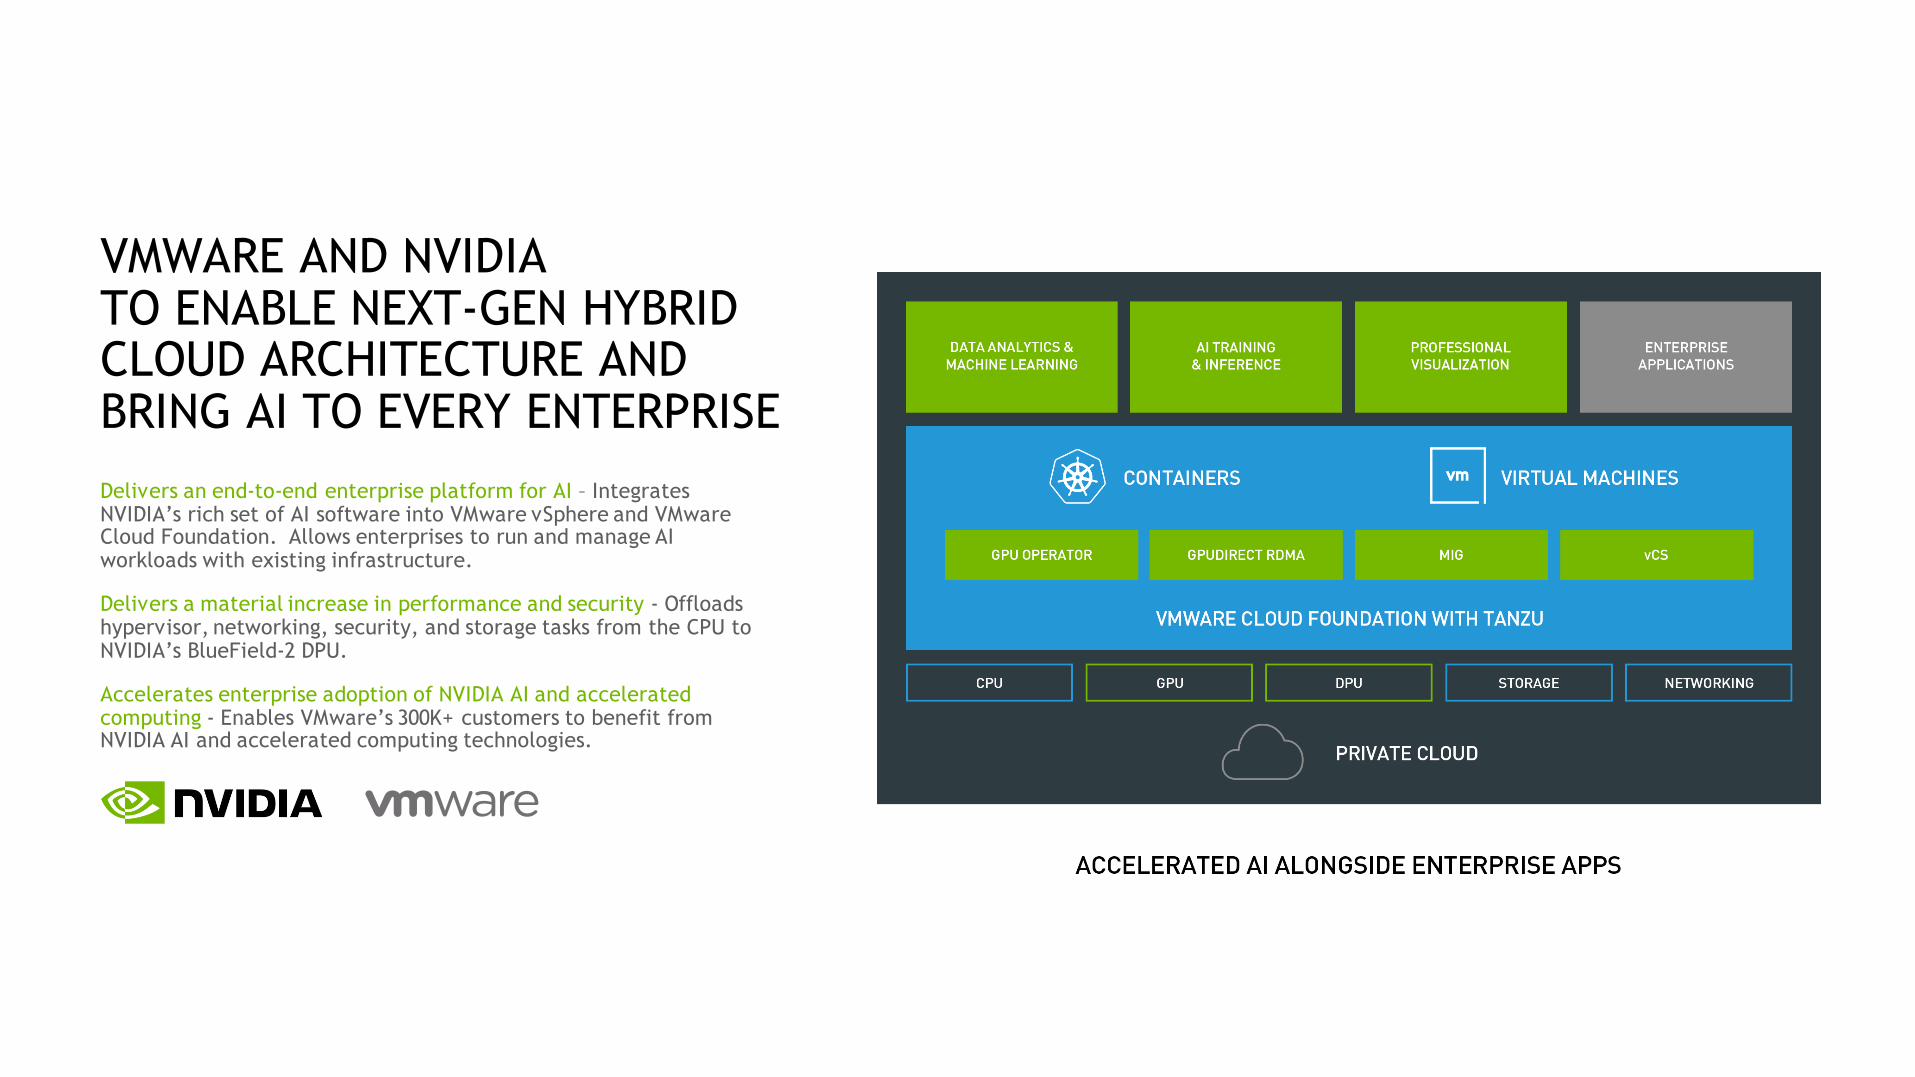
VMWARE AND NVIDIA TO ENABLE NEXT-GEN HYBRID CLOUD ARCHITECTURE AND BRING AI TO EVERY ENTERPRISE
Delivers an end-to-end enterprise platform for AI – Integrates NVIDIA’s rich set of AI software into VMware vSphere and VMware Cloud Foundation. Allows enterprises to run and manage AI workloads with existing infrastructure.
Delivers a material increase in performance and security - Offloads hypervisor, networking, security, and storage tasks from the CPU to NVIDIA’s BlueField-2 DPU.
Accelerates enterprise adoption of NVIDIA AI and accelerated computing - Enables VMware’s 300K+ customers to benefit from NVIDIA AI and accelerated computing technologies.
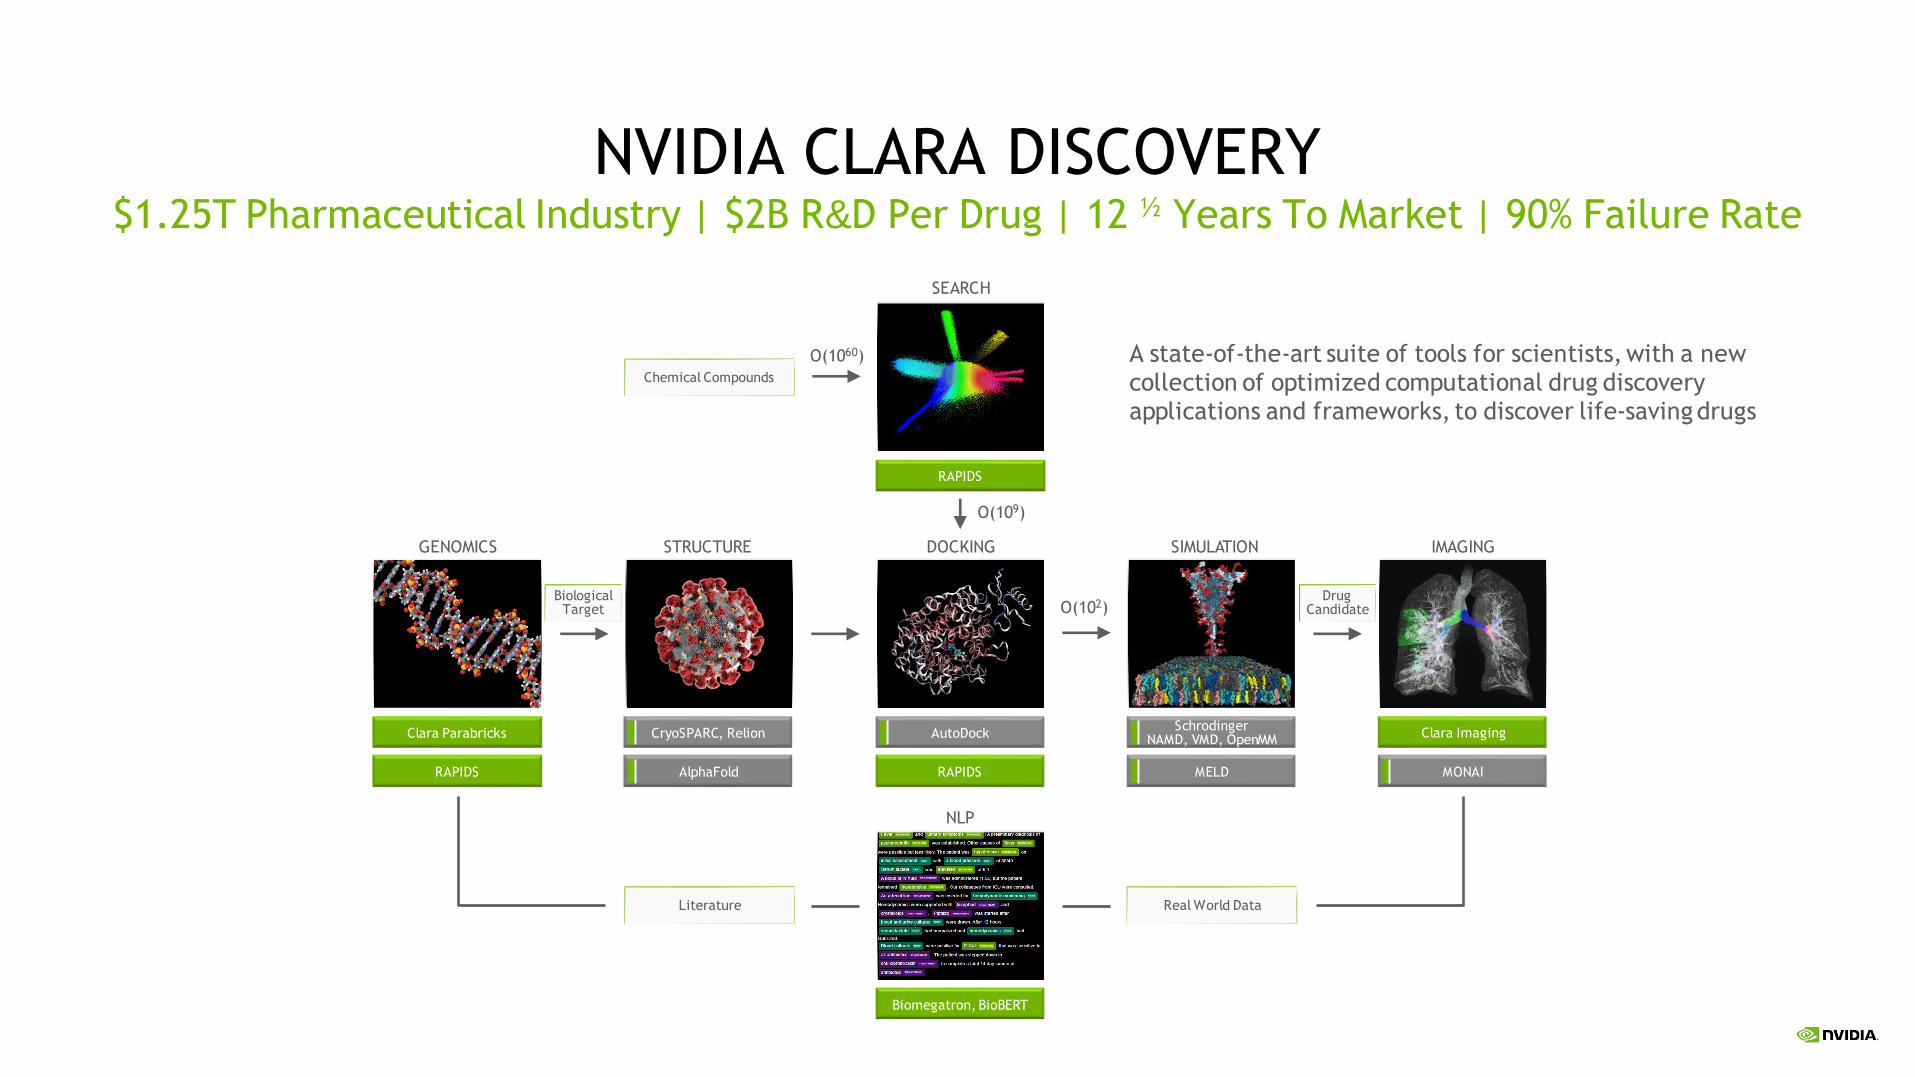
NVIDIA CLARA DISCOVERY $1.25T Pharmaceutical Industry | $2B R&D Per Drug | 12 ½ Years To Market | 90% Failure Rate
AutoDock
RAPIDS
NLP
GENOMICS STRUCTURE DOCKING SIMULATION IMAGING
O(109)
O(1060)
SEARCH
RAPIDS
O(102)
SchrodingerNAMD, VMD, OpenMM
MELD
Clara Imaging
MONAI
CryoSPARC, Relion
AlphaFold
Clara Parabricks
RAPIDS
Biomegatron, BioBERT
A state-of-the-art suite of tools for scientists, with a new collection of optimized computational drug discovery applications and frameworks, to discover life-saving drugs
Literature Real World Data
DrugCandidate
BiologicalTarget
Chemical Compounds
27
NVIDIA OVERVIEW

28
NVIDIA — A COMPUTING PLATFORM COMPANY
NVIDIA pioneered accelerated computing to help solve the most challenging computational problems. The approach is broadly recognized as the way to advance computing as Moore’s law ends and AI lifts off. NVIDIA’s platform is installed in several hundred million computers, is available in every cloud and from every server maker, powers 346 of the TOP500 supercomputers, and boasts 2.3 million developers.
Headquarters: Santa Clara, CAHeadcount: 17,500

29
FY16 FY17 FY18 FY19 FY20
NVIDIA AT A GLANCEAccelerated Computing Pioneer
Brief History
Recognitions From Chip Vendor to Computing Platform
Revenue by Market Platform
1993: Founded by Jensen Huang, Chris Malachowsky, and Curtis Priem
1999: IPO on NASDAQ at $12 (prior to 4 stock splits, now 12:1)
2001: Xbox win; fastest semiconductor company to reach $1B in sales
2006: Unveils CUDA architecture, expanding to scientific computing
2009: Inaugural GPU Technology Conference (GTC)
2016: Introduces first products for AI and autonomous driving
Harvard Business Review’s The CEO 100
Fortune’s Best Places to Work
MIT Tech Review’s 50 Smartest Companies
Fortune’s World’s Most Admired Companies
Forbes JUST 100 Best Corporate Citizens
Dow Jones Sustainability Index
1999GM 30%+
2014GM 50%+
YTD FY21GM 60%+
$5.0B
$6.9B
$9.7B$10.9B
$11.7B
CUDA-X
CUDA
Health-
care
AIPRO VIZTrans-
portation
Smart
City/IOTHPC
Robotics
GAMING
ARCHITECTURE SYSTEMS DATA CENTER
YTD FY20 YTD FY21
Gaming
Data Center
ProViz
Auto
OEM/IP
$11.7B
$7.8B

30
GROWTH DRIVERS
AI Self-driving CarsGaming AR/VR

COMPUTING FOR THE AGE OF AI
NVIDIA Hyperscale AI includes estimated Total Addressable Market for accelerated computing platforms used in Hyperscale/Cloud.Source: NVIDIA estimates, incorporating data from Counterpoint, Dell’Oro, Gartner, IDC, IHS, Hyperion and Strategy Analytics
NVIDIA HPC
$10B $45B
NVIDIA HYPERSCALE AI
$30B
NVIDIA ENTERPRISE AI
$15B
NVIDIA EDGE AINVIDIA RTX
$8B
Data Center Total Addressable Market by 20242020 Revenue*18% Trailing 5-year CAGR
*Trailing 4-quarters through F3Q 2021 outlook for Gaming and Professional Visualization market platforms

32
OUR CORE BUSINESSES
Data Center27% of FY20 Rev
Automotive6% of FY20 Rev
Gaming51% of FY20 Rev
Professional Visualization11% of FY20 Rev
FY20 Revenue $5.52B, 3-year CAGR of 11%
Strong market position and technology leadership
Compounded long-term unit and ASP growth
200M+ gamers on our platform
Strong Gaming ecosystem
Multiple secular growth drivers: expanding population of gamers, eSports, VR, rising production value of games, gaming and prosumer laptops
FY20 Revenue of $2.98B, 3-year CAGR of 53%
Leader in deep learning/AI –used by all major cloud computing providers and thousands of enterprises
Leader in HPC - in 8 of the top 10 and 2/3rds of the top 500 fastest supercomputers
Multiple secular growth drivers: fast growing adoption of AI in every major industry; rising compute needs unmet by conventional approaches such as x86 CPUs; Mellanox networking
FY20 Revenue of $1.21B, 3-year CAGR of 13%
90%+ market share in graphics for workstations
Diversified end markets, e.g. media & entertainment, architecture, engineering &construction, public sector
Strong software ecosystem
Multiple secular growth drivers: expanding creative & design workflows, mobile workstations, rising adoption of AR/VR across industries
FY20 Revenue of $700M, 3-year CAGR of 13%
Current revenue driven largely by infotainment
Future growth expected to be driven largely by Autonomous Vehicle (AV) solution offering full hardware & software stack
Large secular growth opportunity: autonomous vehicles estimated to drive a $25B TAM for the AV computing stack by 2025
ASP = Average Selling Price. Gamers are defined as consumers who purchase our GPUs to play video games. 200M+ gamers on our platform as of August 2020. FY20 ended 1/26/2020.
33
54
7
15
6
17
GamingData CenterProVizAutoOEM / IP
43
42
74 4
GamingData CenterProVizAutoOEM / IP
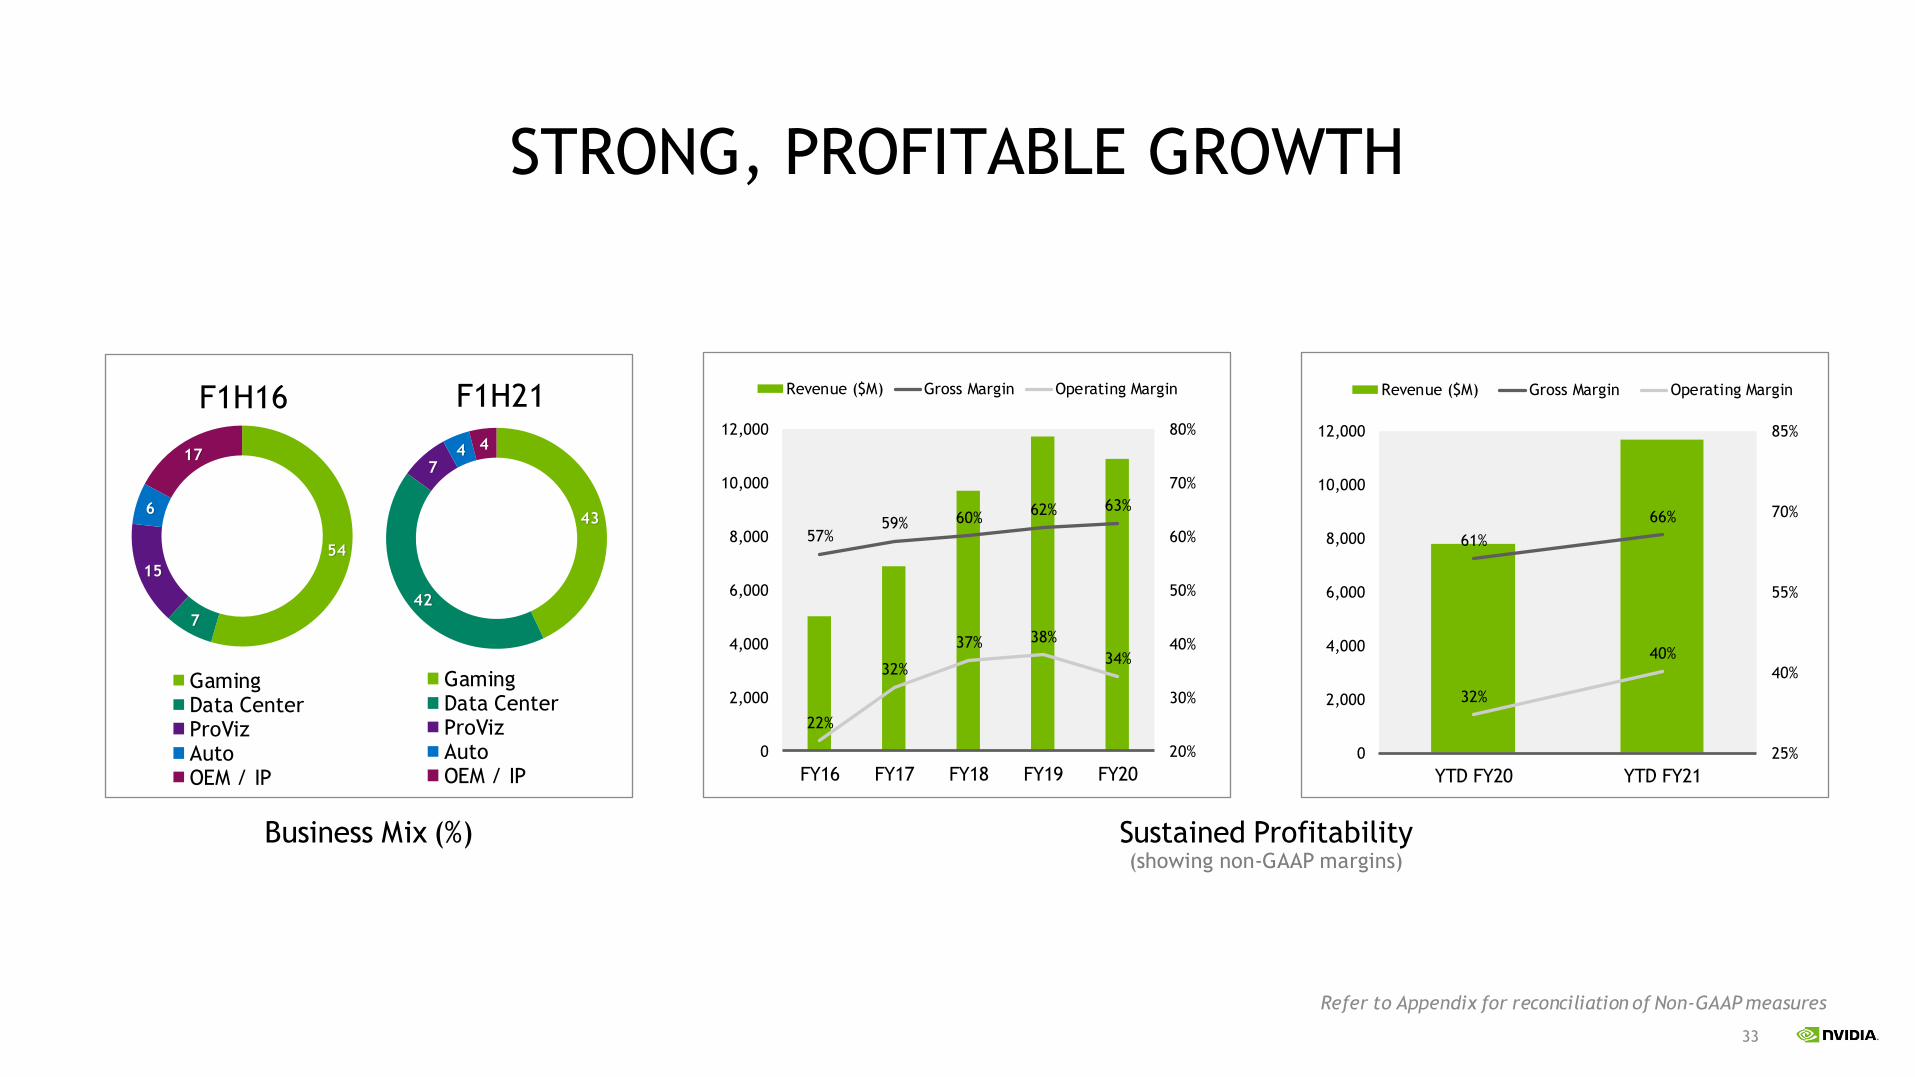
STRONG, PROFITABLE GROWTH
Sustained Profitability(showing non-GAAP margins)
Business Mix (%)
57%59% 60%
62% 63%
22%
32%
37% 38%
34%
20%
30%
40%
50%
60%
70%
80%
0
2,000
4,000
6,000
8,000
10,000
12,000
FY16 FY17 FY18 FY19 FY20
Revenue ($M) Gross Margin Operating MarginF1H16 F1H21
Refer to Appendix for reconciliation of Non-GAAP measures
61%
66%
32%
40%
25%
40%
55%
70%
85%
0
2,000
4,000
6,000
8,000
10,000
12,000
YTD FY20 YTD FY21
Revenue ($M) Gross Margin Operating Margin

34
WHY ACCELERATED COMPUTING?
The world’s demand for computing power continues to grow exponentially, yet CPUs are no longer keeping up as Moore’s Law has ended.
NVIDIA pioneered GPU-accelerated computing to solve this challenge.
Optimizing across the entire stack — from silicon to software — allows NVIDIA to advance computing in the post-Moore’s Law era for large and important markets:
Gaming, Pro Viz, High Performance Computing (HPC), AI, Cloud, Transportation, Healthcare, Robotics, and the Internet of Things (IOT).
Advancing Computing in the Post-Moore’s Law Era
1980 1990 2000 2010 2020
103
105
107
GPU PERFORMANCE
CPU PERFORMANCE
35
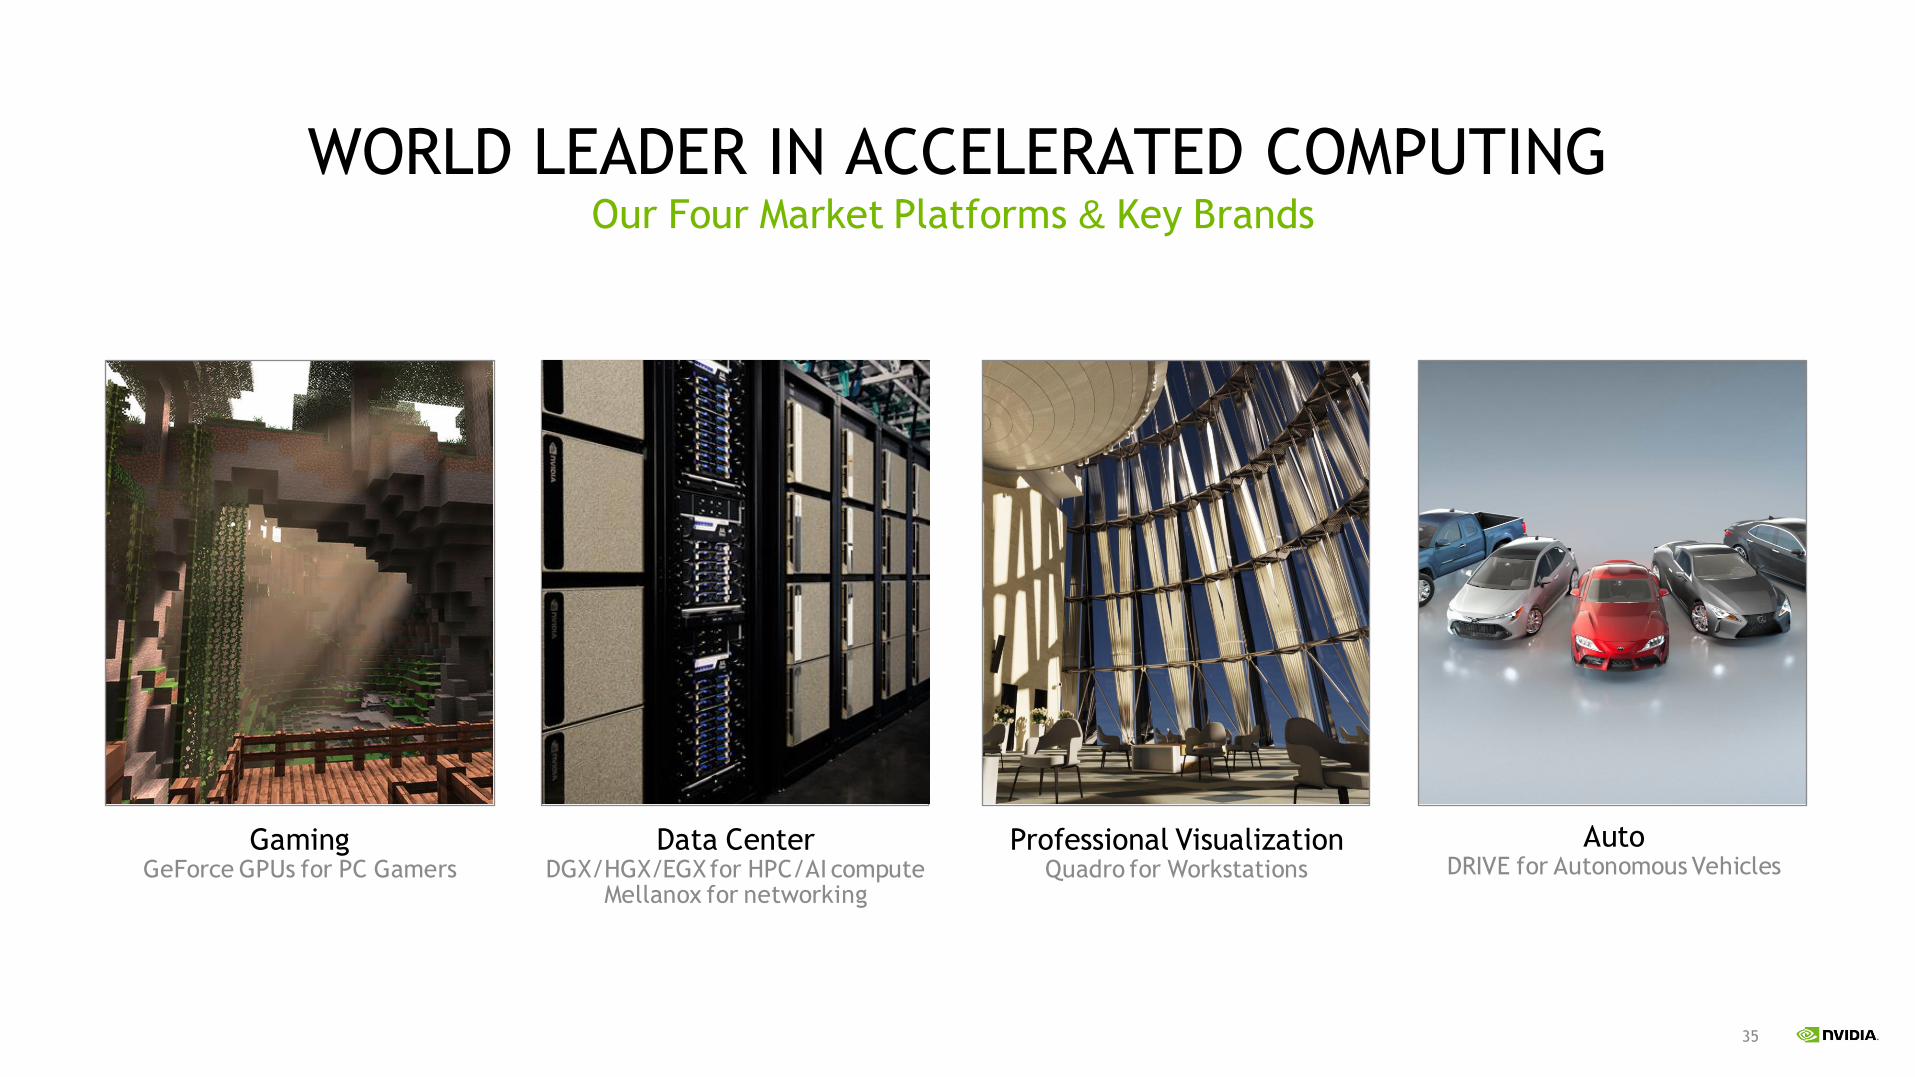
WORLD LEADER IN ACCELERATED COMPUTINGOur Four Market Platforms & Key Brands
AutoDRIVE for Autonomous Vehicles
Data CenterDGX/HGX/EGX for HPC/AI compute
Mellanox for networking
GamingGeForce GPUs for PC Gamers
Professional VisualizationQuadro for Workstations

36
$2,818
$4,060
$5,513
$6,246
$5,518
FY16 FY17 FY18 FY19 FY20
18% CAGR
GAMINGGeForce - The World’s Largest Gaming Platform
HighlightsRevenue ($M) 200M+ Gamers on GeForce
#1 in PC gaming with more than 3X the revenue of the other major GPU vendor
Expanding the market with gaming laptops and cloud gaming
Powering the Nintendo Switch console
37
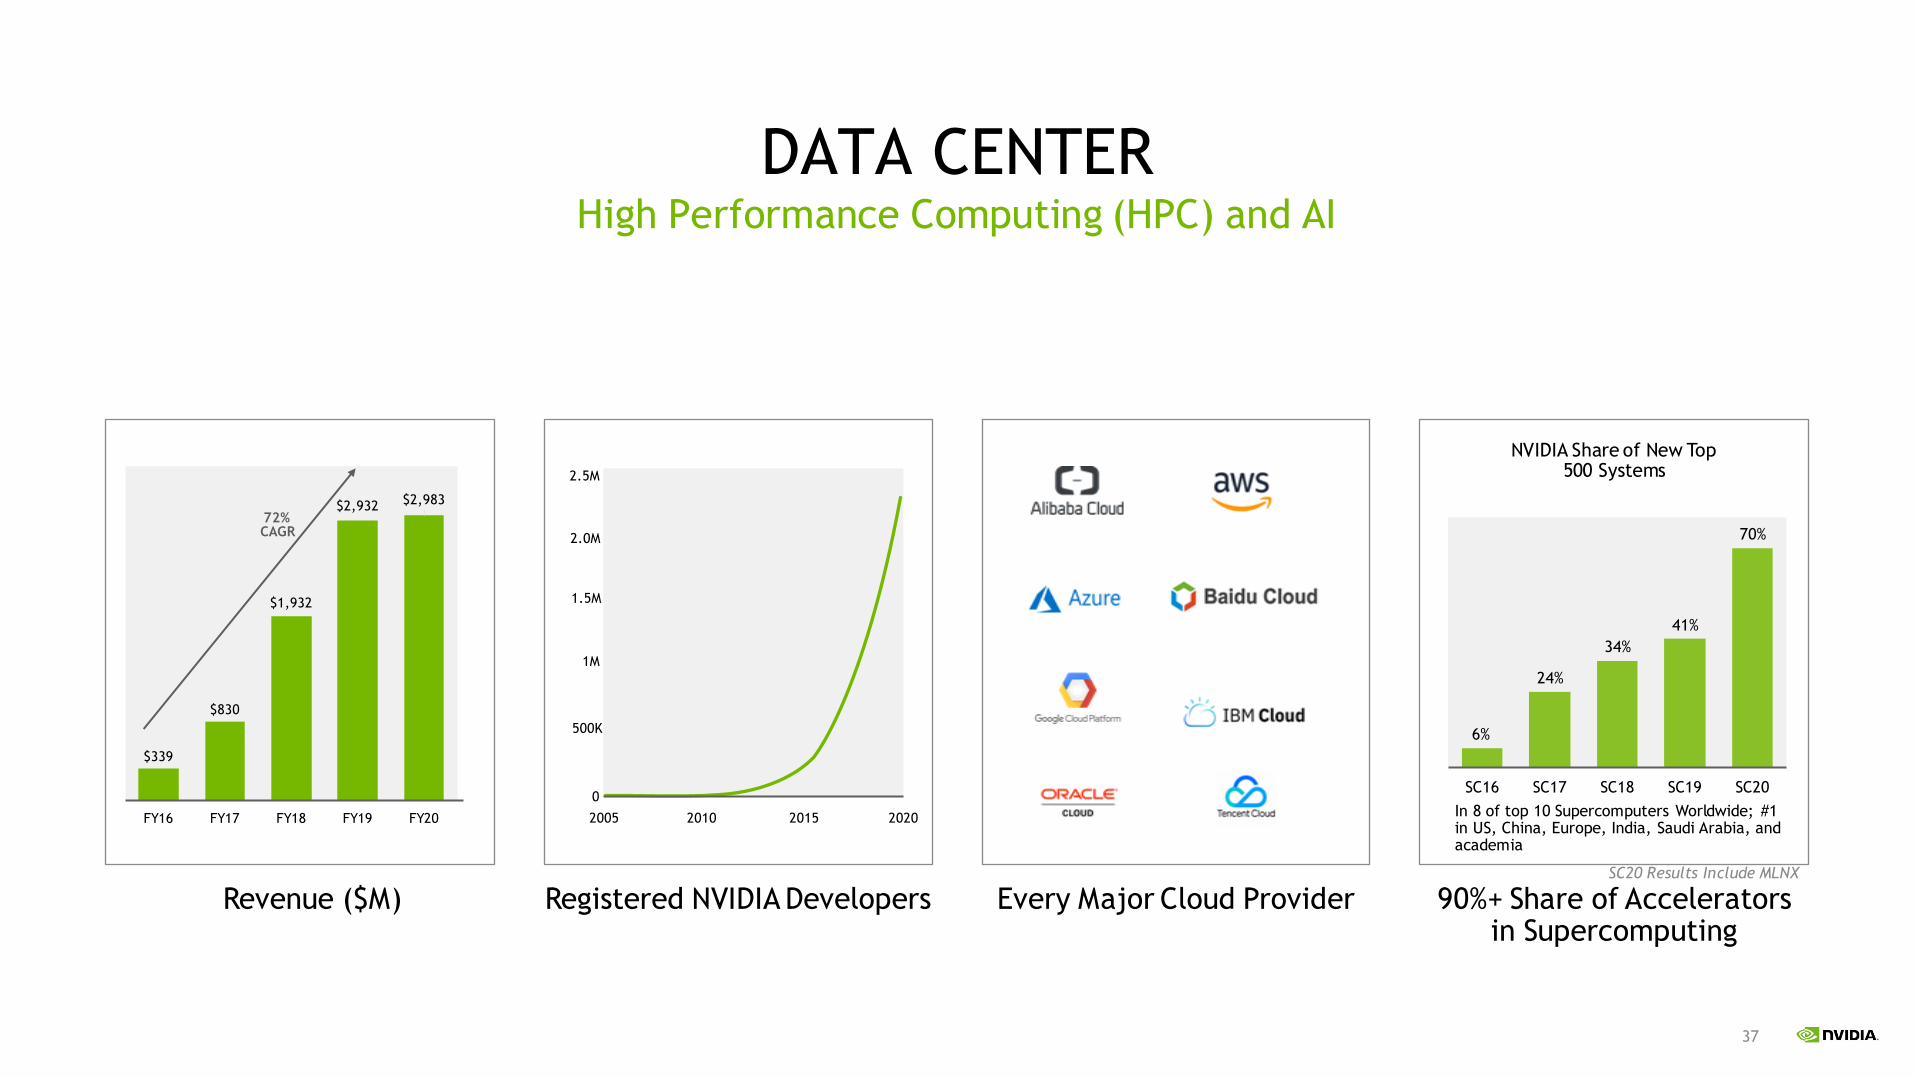
$339
$830
$1,932
$2,932 $2,983
FY16 FY17 FY18 FY19 FY20
72% CAGR
DATA CENTERHigh Performance Computing (HPC) and AI
Registered NVIDIA Developers 90%+ Share of Accelerators in Supercomputing
Revenue ($M) Every Major Cloud Provider
NVIDIA Share of New Top 500 Systems
In 8 of top 10 Supercomputers Worldwide; #1 in US, China, Europe, India, Saudi Arabia, and academia
6%
24%
34%
41%
70%
SC16 SC17 SC18 SC19 SC20
2005 2010 2015 2020
0
500K
1M
1.5M
2.0M
SC20 Results Include MLNX
2.5M
38
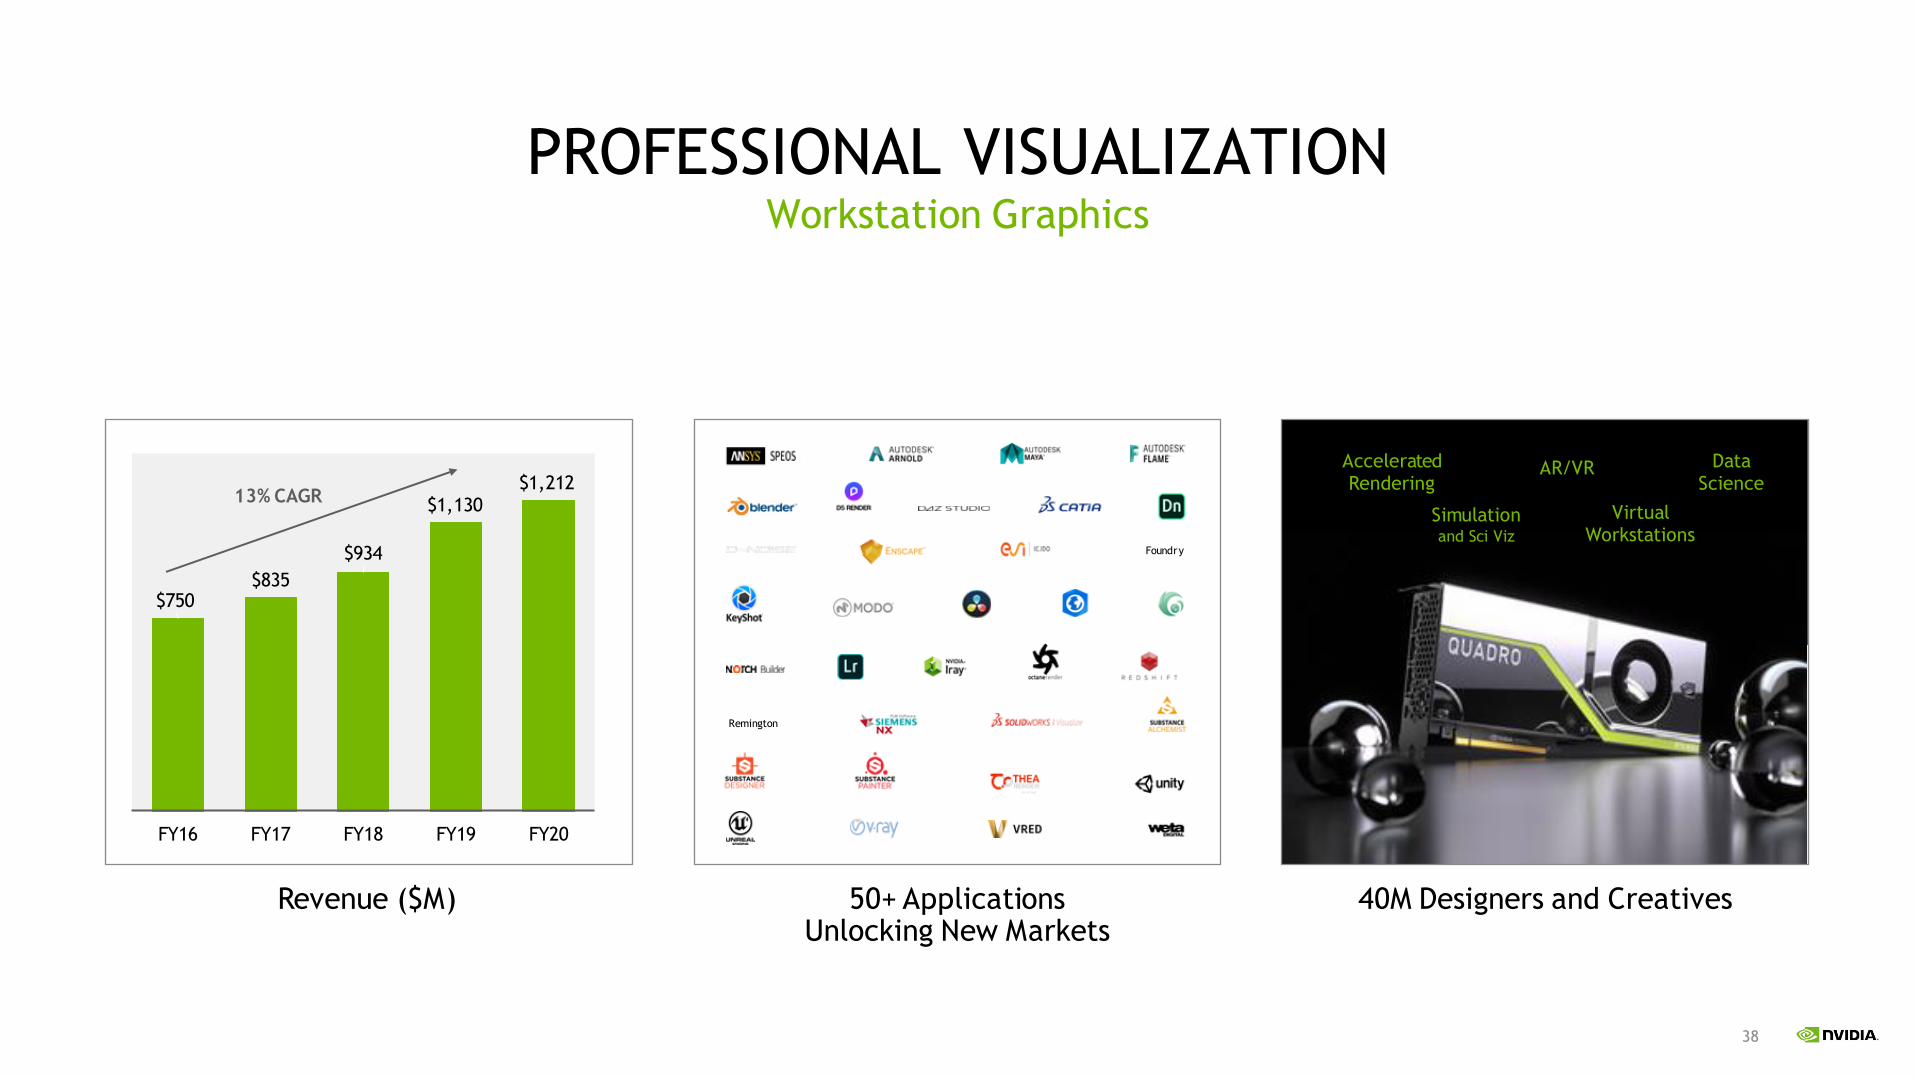
PROFESSIONAL VISUALIZATIONWorkstation Graphics
50+ Applications Unlocking New Markets
40M Designers and Creatives
Foundry
Remington
Virtual Workstations
Accelerated Rendering
Data Science
Simulationand Sci Viz
AR/VR
Revenue ($M)
$750$835
$934
$1,130$1,212
FY16 FY17 FY18 FY19 FY20
13% CAGR

39
42
7
26 24
15
33
76
0
10
20
30
40
50
60
70
80
Cars Trucks Tier 1sRobotaxis SensorsMapping Software
$320
$487
$558
$641
$700
FY16 FY17 FY18 FY19 FY20
22% CAGR
AUTOInfotainment and Autonomous Vehicles
NVIDIA DRIVE Partners Strong Partnership / EcosystemRevenue ($M)
TOYOTA MERCEDES-BENZ
VOLVO
DIDI ZF
XPENG
40
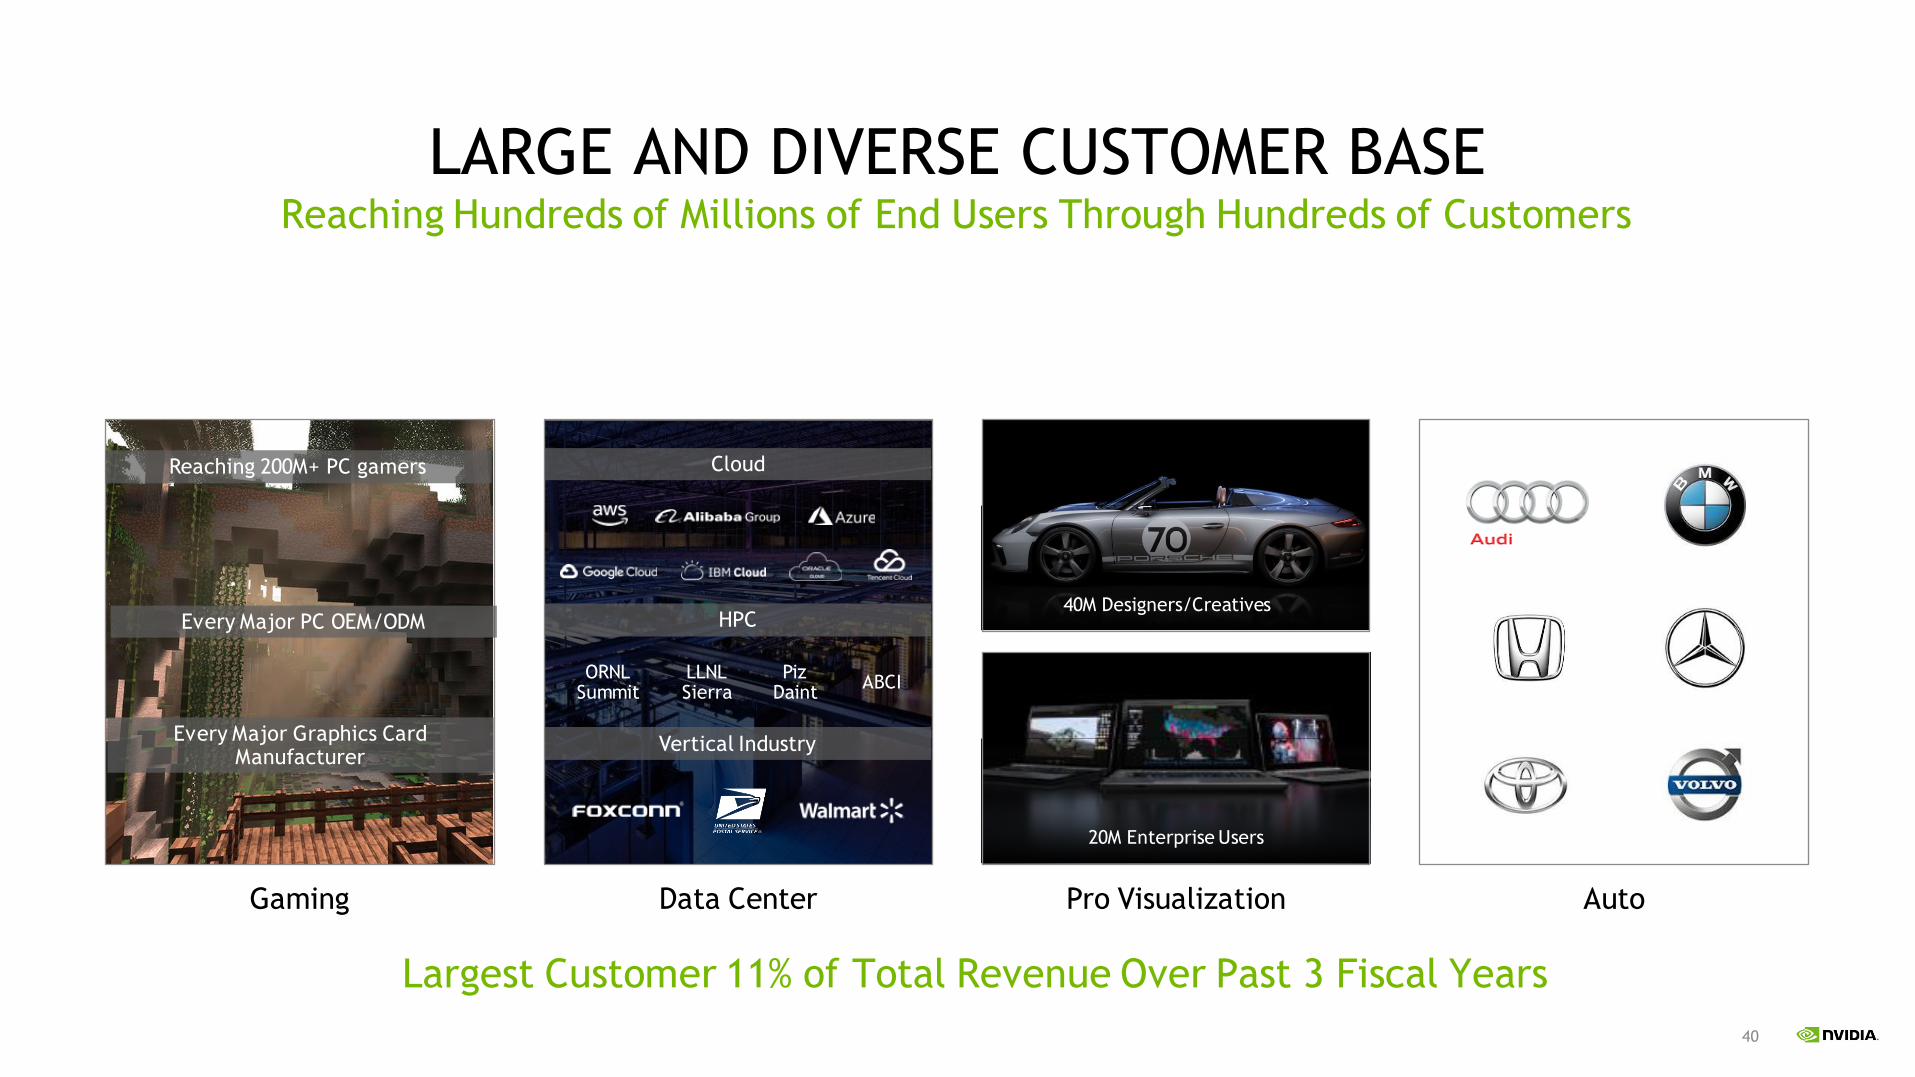
LARGE AND DIVERSE CUSTOMER BASEReaching Hundreds of Millions of End Users Through Hundreds of Customers
Data Center AutoGaming Pro Visualization
40M Designers/Creatives
20M Enterprise Users
Cloud
HPC
Vertical Industry
ORNLSummit
LLNLSierra
PizDaint
ABCI
Reaching 200M+ PC gamers
Every Major PC OEM/ODM
Every Major Graphics Card Manufacturer
Largest Customer 11% of Total Revenue Over Past 3 Fiscal Years

41
FINANCIALS
42
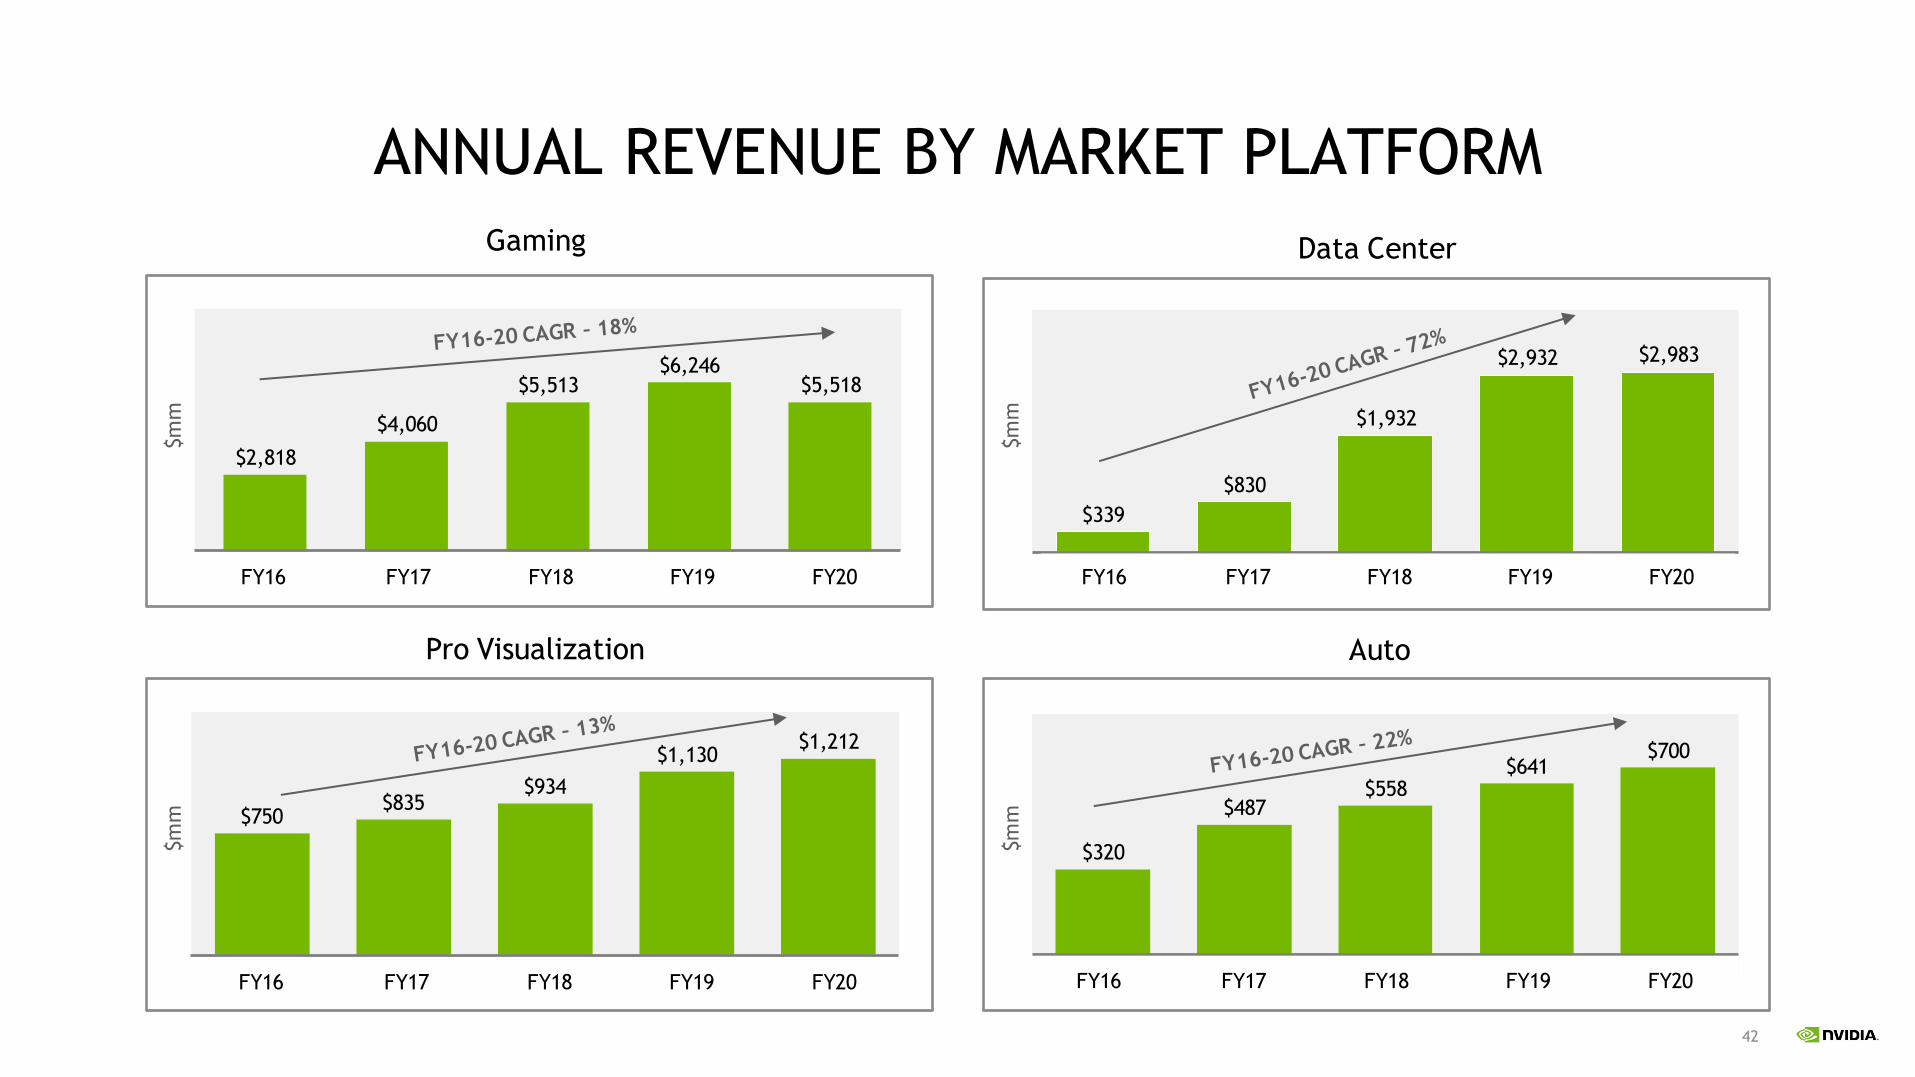
ANNUAL REVENUE BY MARKET PLATFORM
Gaming
Pro Visualization Auto
Data Center
$2,818
$4,060
$5,513$6,246
$5,518
FY2016 FY2017 FY2018 FY2019 FY2020FY16 FY17 FY18 FY19 FY20
$339
$830
$1,932
$2,932 $2,983
FY2016 FY2017 FY2018 FY2019 FY2020FY16 FY17 FY18 FY19 FY20
$750$835
$934
$1,130$1,212
FY2016 FY2017 FY2018 FY2019 FY2020FY16 FY17 FY18 FY19 FY20
$320
$487$558
$641$700
FY2016 FY2017 FY2018 FY2019 FY2020FY2016 FY2017 FY2018 FY2019 FY2020FY16 FY17 FY18 FY19 FY20
$m
m
$m
m
$m
m
$m
m

43
ANNUAL CASH & CASH FLOW METRICS
ADJUSTED EBITDA (NON-GAAP)
FREE CASH FLOW CASH BALANCE
OPERATING CASH FLOW
FY16 FY17 FY18 FY19 FY20
$m
m
$m
m
$m
m
$m
m
$1,305
$2,392
$3,803$4,110
FY2016 FY2017 FY2018 FY2019 FY2020
$1,175$1,672
$3,502 $3,743
FY2016 FY2017 FY2018 FY2019 FY2020
$5,037
$6,798 $7,108 $7,422
$10,897
FY2016 FY2017 FY2018 FY2019 FY2020
FY16 FY17 FY18 FY19 FY20
FY16 FY17 FY18 FY19 FY20
$1,089$1,496
$2,909$3,143
FY16 FY17 FY18 FY19 FY20
$4,272
$4,761$4,662
Cash balance is defined as cash and cash equivalents plus marketable securities
44
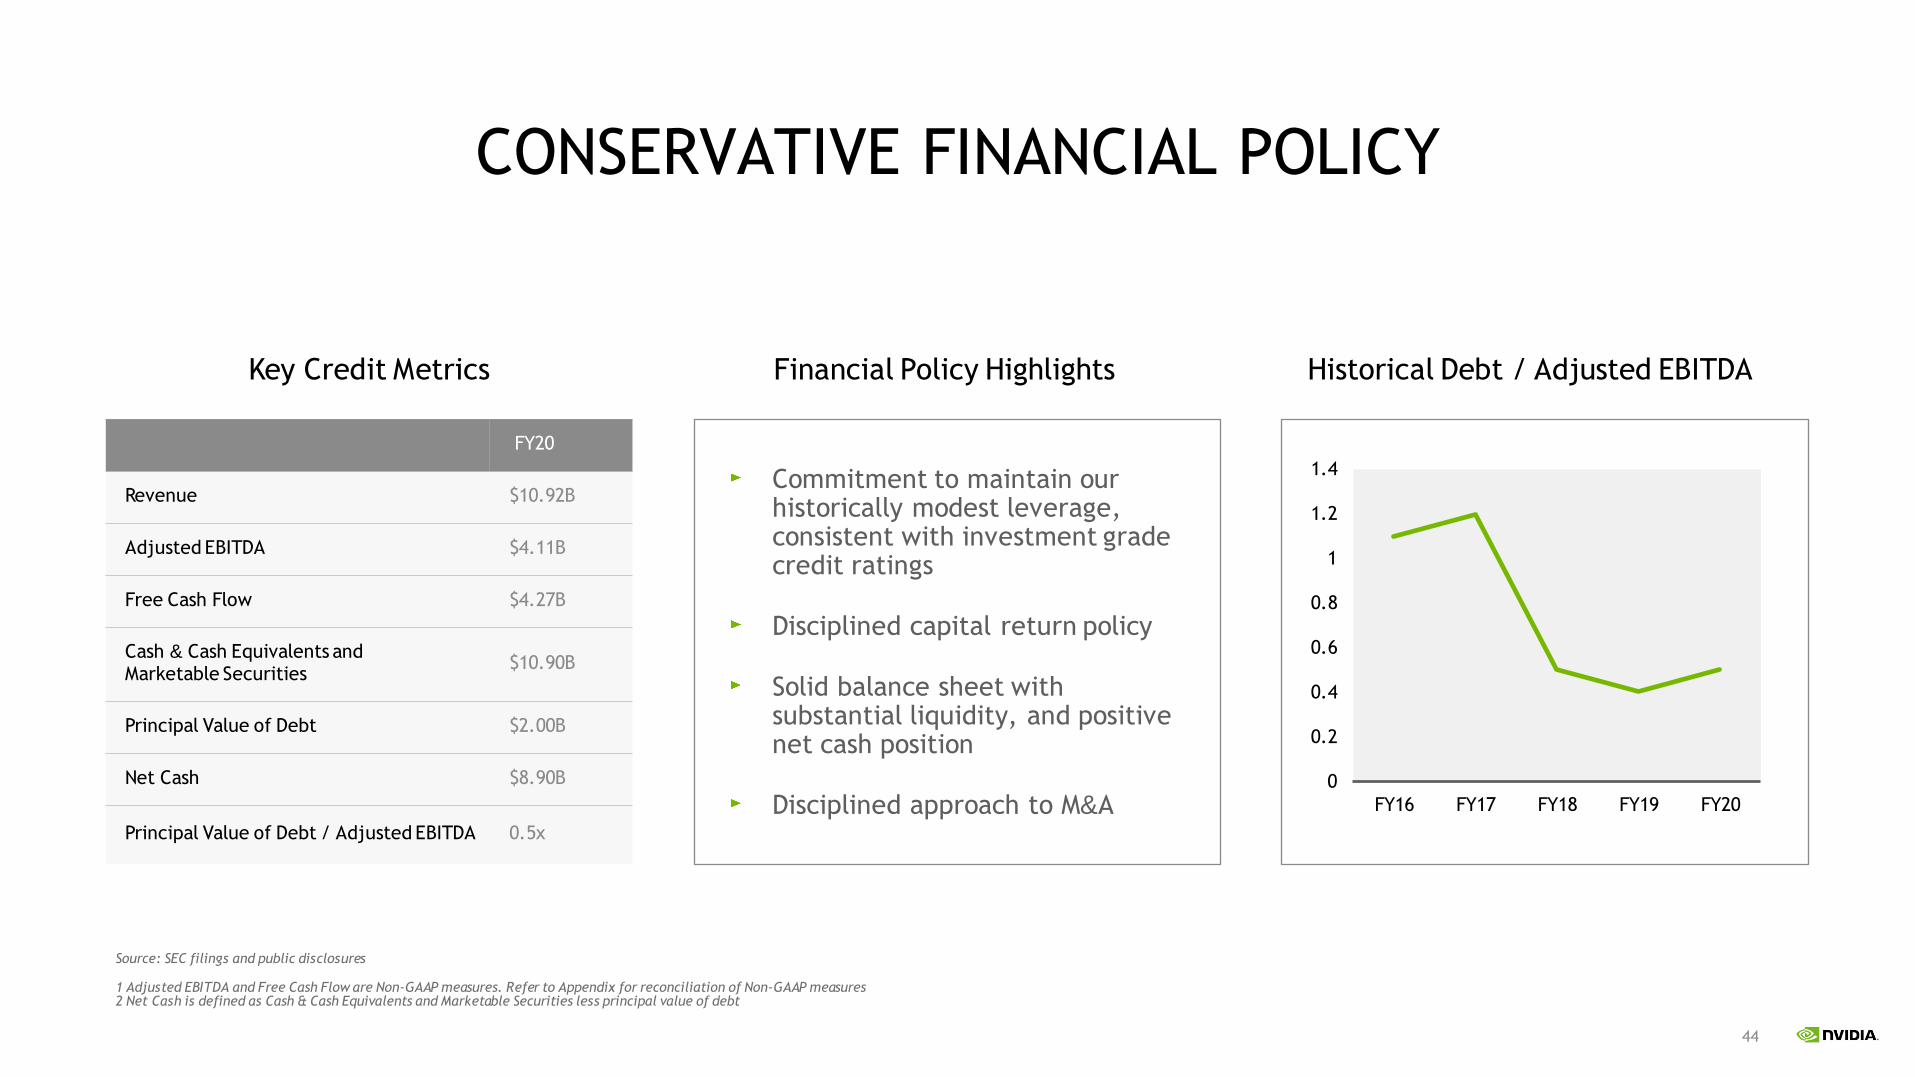
FY20
Revenue $10.92B
Adjusted EBITDA $4.11B
Free Cash Flow $4.27B
Cash & Cash Equivalents and Marketable Securities
$10.90B
Principal Value of Debt $2.00B
Net Cash $8.90B
Principal Value of Debt / Adjusted EBITDA 0.5x
CONSERVATIVE FINANCIAL POLICY
Financial Policy Highlights Historical Debt / Adjusted EBITDA
Source: SEC filings and public disclosures
1 Adjusted EBITDA and Free Cash Flow are Non-GAAP measures. Refer to Appendix for reconciliation of Non-GAAP measures2 Net Cash is defined as Cash & Cash Equivalents and Marketable Securities less principal value of debt
Commitment to maintain our historically modest leverage, consistent with investment grade credit ratings
Disciplined capital return policy
Solid balance sheet with substantial liquidity, and positive net cash position
Disciplined approach to M&A0
0.2
0.4
0.6
0.8
1
1.2
1.4
FY16 FY17 FY18 FY19 FY20
Key Credit Metrics

45
NVIDIA’S COMMITMENT TO ESG
Create a Leading Workplace Tackle Climate Change
Investor’s Business DailyOct. 26, 2020
“Nvidia Stock Wows Wall Street And ESG Investors Too As Best ESG
Company”
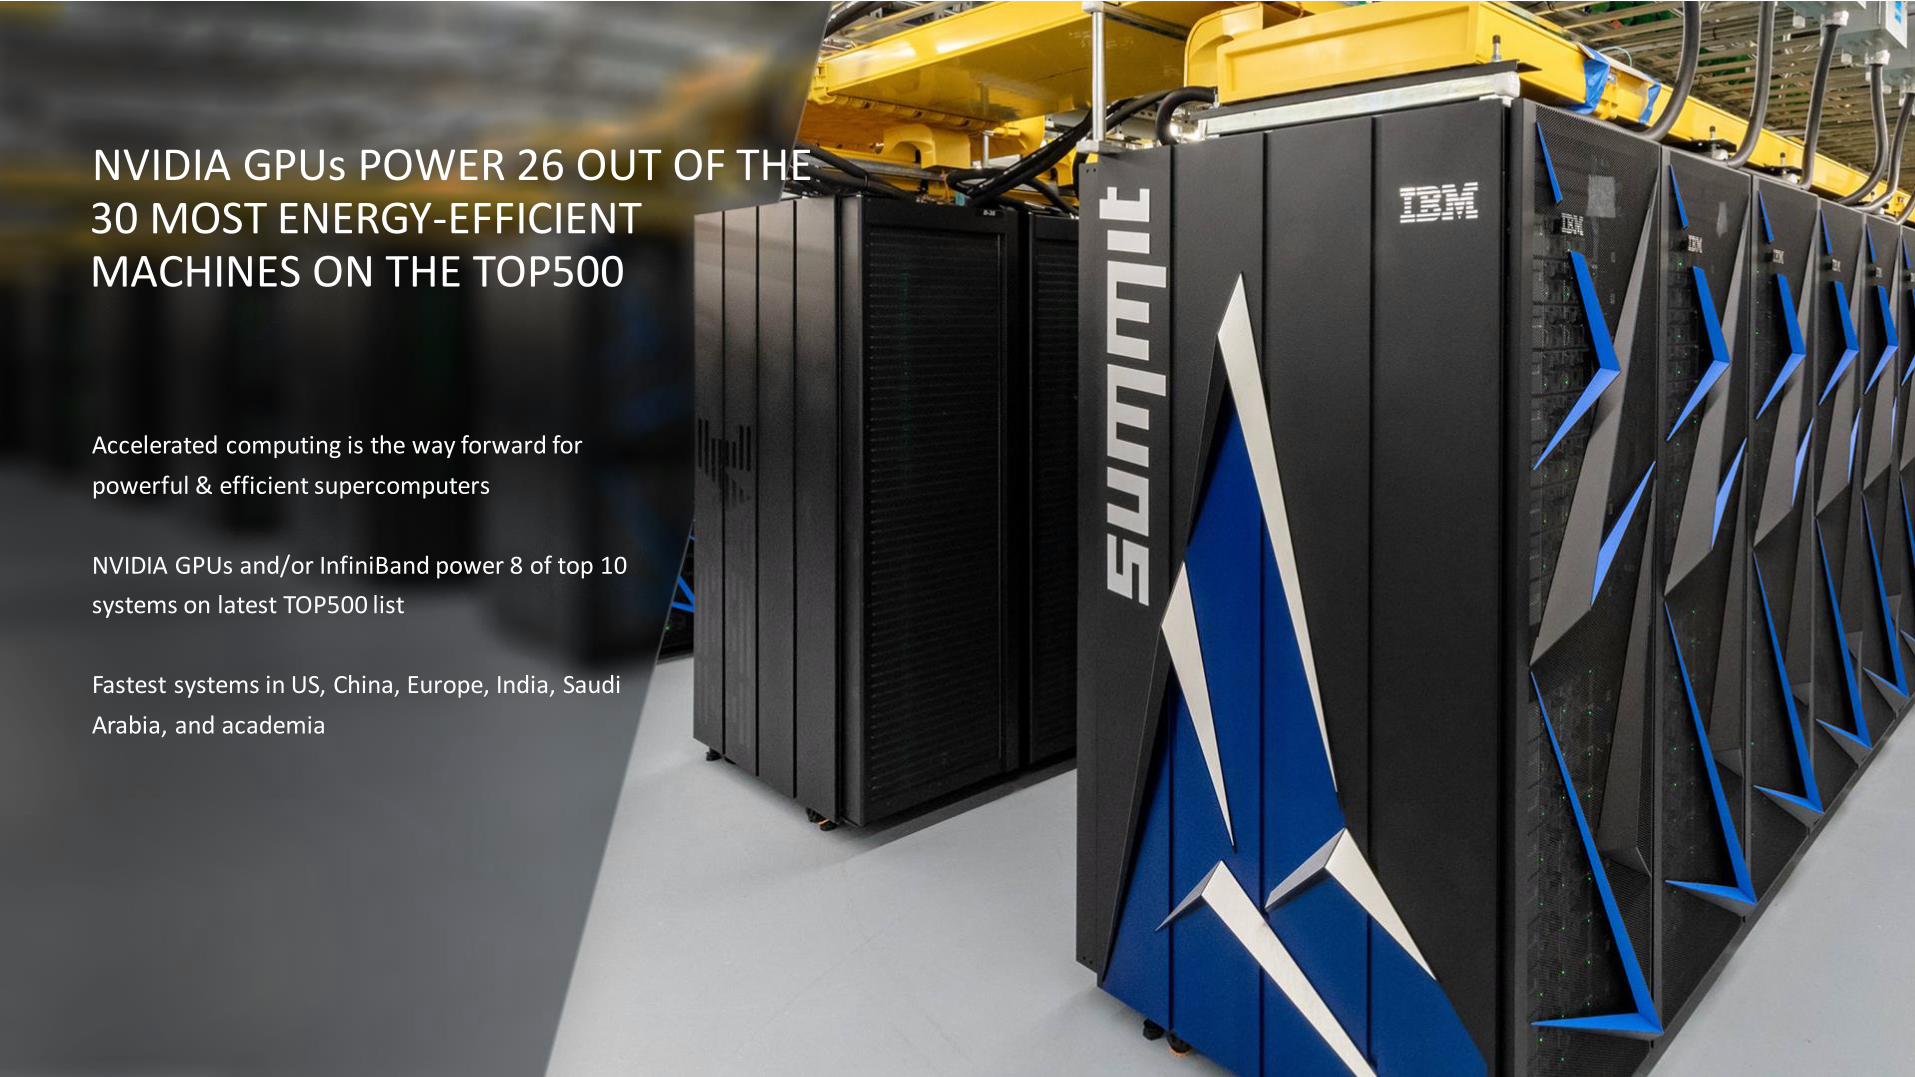
#1 on the Green500 list,
26/30 super computers
NVIDIA GPU powered.
46
Accelerated computing is the way forward for
powerful & efficient supercomputers
NVIDIA GPUs and/or InfiniBand power 8 of top 10
systems on latest TOP500 list
Fastest systems in US, China, Europe, India, Saudi
Arabia, and academia
NVIDIA GPUs POWER 26 OUT OF THE 30 MOST ENERGY-EFFICIENT MACHINES ON THE TOP500

47
RECONCILIATION OF NON-GAAP TO GAAP FINANCIAL MEASURES

48
RECONCILIATION OF NON-GAAP TO GAAP FINANCIAL MEASURES
($ IN MILLIONS)
NON-GAAP
OPERATING INCOME
(A)
GAAP DEPRECIATION
& AMORTIZATION
AMORTIZATION OF
ACQUISITION-
RELATED
INTANGIBLES
ADJUSTED EBITDA
FY 2016 $1,125 197 (17) $1,305
FY 2017 $2,221 187 (16) $2,392
FY 2018 $3,617 199 (13) $3,803
FY 2019 $4,407 262 (7) $4,662
FY 2020 $3,735 381 (6) $4,110
A. Refer to Appendix herein for reconciliation of Non-GAAP operating income to GAAP operating income

49
RECONCILIATION OF NON-GAAP TO GAAP FINANCIAL MEASURES (CONTD.)
($ IN
MILLIONS)
NON-GAAP
OPERATING
INCOME
STOCK-BASED
COMPENSATION
(A)
PRODUCT
WARRANTY
(B)
ACQUISITION-
RELATED AND
OTHER COSTS
(C)
OTHER
(D)
GAAP
OPERATING
INCOME
FY 2016 $1,125 (205) (20) (22) (131) $747
FY 2017 $2,221 (248) — (16) (23) $1,934
FY 2018 $3,617 (391) — (13) (3) $3,210
FY 2019 $4,407 (557) — (2) (44) $3,804
FY 2020 $3,735 (844) — (30) (15) $2,846
A. Stock-based compensation charge was allocated to cost of goods sold, research and development expense, and sales, general and administrative expense
B. Consists of warranty charge associated with a product recall
C. Consists of amortization of acquisition-related intangible assets, transaction costs, compensation charges, other credits related to acquisitions, and other costs
D. Comprises of legal settlement costs, contributions, and restructuring and other charges

50
RECONCILIATION OF NON-GAAP TO GAAP FINANCIAL MEASURES (CONTD.)
($ IN
MILLIONS)
NON-GAAP
OPERATING
INCOME
STOCK-BASED
COMPENSATION
(A)
ACQUISITION-
RELATED AND
OTHER COSTS (B)
OTHER
(C)
GAAP
OPERATING
INCOME
YTD Q3 FY20 $2,515 (624) (22) (13) $1,856
YTD Q3 FY21 $4,714 (981) (669) (39) $3,025
A. Stock-based compensation charge was allocated to cost of goods sold, research and development expense, and sales, general and administrative expense
B. Consists of amortization of intangible assets, inventory step-up, transaction costs, and certain compensation charges
C. Comprises of legal settlement costs

51
RECONCILIATION OF NON-GAAP TO GAAP FINANCIAL MEASURES (CONTD.)
($ IN MILLIONS) NON-GAAP
STOCK-BASED
COMPENSATION
(A)
ACQUISITION-
RELATED ITEMS
AND OTHER COSTS
(B)
OTHER
(C)
TAX IMPACT OF
ADJUSTMENTSGAAP
Q3 FY2021
Revenue $4,726 — — — — $4,726
Gross profit $3,095 (28) (86) (21) — $2,960
Gross margin 65.5% (0.6) (1.8) (0.5) — 62.6%
Research and development expense $813 232 2 — — $1,047
Sales, general and administrative expense $288 123 104 — — $515
Operating expense $1,101 355 106 — — $1,562
Operating income $1,993 (383) (192) (20) — $1,398
Net income $1,834 (383) (192) (25) 102 $1,336
Diluted EPS $2.91 (0.61) (0.30) (0.04) 0.16 $2.12
A. Stock-based compensation charge was allocated to cost of goods sold, research and development expense, and sales, general and administrative expense
B. Primarily consists of amortization of intangible assets, inventory step-up, transaction costs, and certain compensation charges
C. Comprises of legal settlement costs, losses from non-affiliated investments, and interest expense related to amortization of debt discount

52
RECONCILIATION OF NON-GAAP TO GAAP FINANCIAL MEASURES (CONTD.)
NON-GAAP GROSS
MARGIN
STOCK-BASED
COMPENSATION
(A)
PRODUCT
WARRANTY (B)
OTHER
(C)
GAAP GROSS
MARGIN
FY 2016 56.8% (0.3) (0.4) — 56.1%
FY 2017 59.2% (0.2) — (0.2) 58.8%
FY 2018 60.2% (0.3) — — 59.9%
FY 2019 61.7% (0.2) — (0.3) 61.2%
FY 2020 62.5% (0.4) — (0.1) 62.0%
A. Stock-based compensation charge was allocated to cost of goods sold
B. Consists of warranty charge associated with a product recall
C. Consists of legal settlement costs

53
RECONCILIATION OF NON-GAAP TO GAAP FINANCIAL MEASURES (CONTD.)
NON-GAAP
GROSS MARGIN
STOCK-BASED
COMPENSATION
(A)
ACQUISITION-
RELATED ITEMS
AND OTHER
COSTS (B)
OTHER
(C)
GAAP GROSS
MARGIN
Q3 FY2020 64.1% (0.5) — — 63.6%
Q4 FY2020 65.4% (0.4) — (0.1) 64.9%
Q1 FY2021 65.8% (0.7) — — 65.1%
Q2 FY2021 66.0% (0.4) (6.3) (0.5) 58.8%
Q3 FY2021 65.5% (0.6) (1.8) (0.5) 62.6%
A. Stock-based compensation charge was allocated to cost of goods sold
B. Consists of amortization of intangible assets and inventory step-up
C. Consists of legal settlement costs

54
RECONCILIATION OF NON-GAAP TO GAAP FINANCIAL MEASURES (CONTD.)
NON-GAAP
GROSS MARGIN
STOCK-BASED
COMPENSATION
(A)
ACQUISITION-
RELATED ITEMS
AND OTHER
COSTS (B)
OTHER
(C)
GAAP GROSS
MARGIN
YTD Q3 FY20 61.3% (0.4) — (0.1) 60.8%
YTD Q3 FY21 65.7% (0.5) (2.8) (0.4) 62.0%
A. Stock-based compensation charge was allocated to cost of goods sold
B. Consists of amortization of intangible assets and inventory step-up
C. Consists of legal settlement costs

55
RECONCILIATION OF NON-GAAP TO GAAP FINANCIAL MEASURES (CONTD.)
NON-GAAP
OPERATING
MARGIN
STOCK-BASED
COMPENSATION
(A)
PRODUCT
WARRANTY
(B)
ACQUISITION-
RELATED AND
OTHER COSTS
(C)
OTHER
(D)
GAAP
OPERATING
MARGIN
FY 2016 22.5% (4.2) (0.4) (0.4) (2.6) 14.9%
FY 2017 32.1% (3.6) — (0.2) (0.3) 28.0%
FY 2018 37.2% (4.0) — (0.2) — 33.0%
FY 2019 37.6% (4.7) — — (0.4) 32.5%
FY 2020 34.2% (7.7) — (0.3) (0.1) 26.1%
A. Stock-based compensation charge was allocated to cost of goods sold, research and development expense, and sales, general and administrative expense
B. Consists of warranty charge associated with a product recall
C. Consists of amortization of acquisition-related intangible assets, transaction costs, compensation charges, other credits related to acquisitions, and other costs
D. Comprises of legal settlement costs, contributions, and restructuring and other charges

56
RECONCILIATION OF NON-GAAP TO GAAP FINANCIAL MEASURES (CONTD.)
NON-GAAP
OPERATING
MARGIN
STOCK-BASED
COMPENSATION
(A)
ACQUISITION-
RELATED AND
OTHER COSTS (B)
OTHER
(C)
GAAP
OPERATING
MARGIN
YTD Q3 FY20 32.2% (7.9) (0.3) (0.2) 23.8%
YTD Q3 FY21 40.4% (8.4) (5.7) (0.4) 25.9%
A. Stock-based compensation charge was allocated to cost of goods sold, research and development expense, and sales, general and administrative expense
B. Consists of amortization of intangible assets, inventory step-up, transaction costs, and certain compensation charges
C. Comprises of legal settlement costs
57
RECONCILIATION OF NON-GAAP TO GAAP FINANCIAL MEASURES (CONTD.)
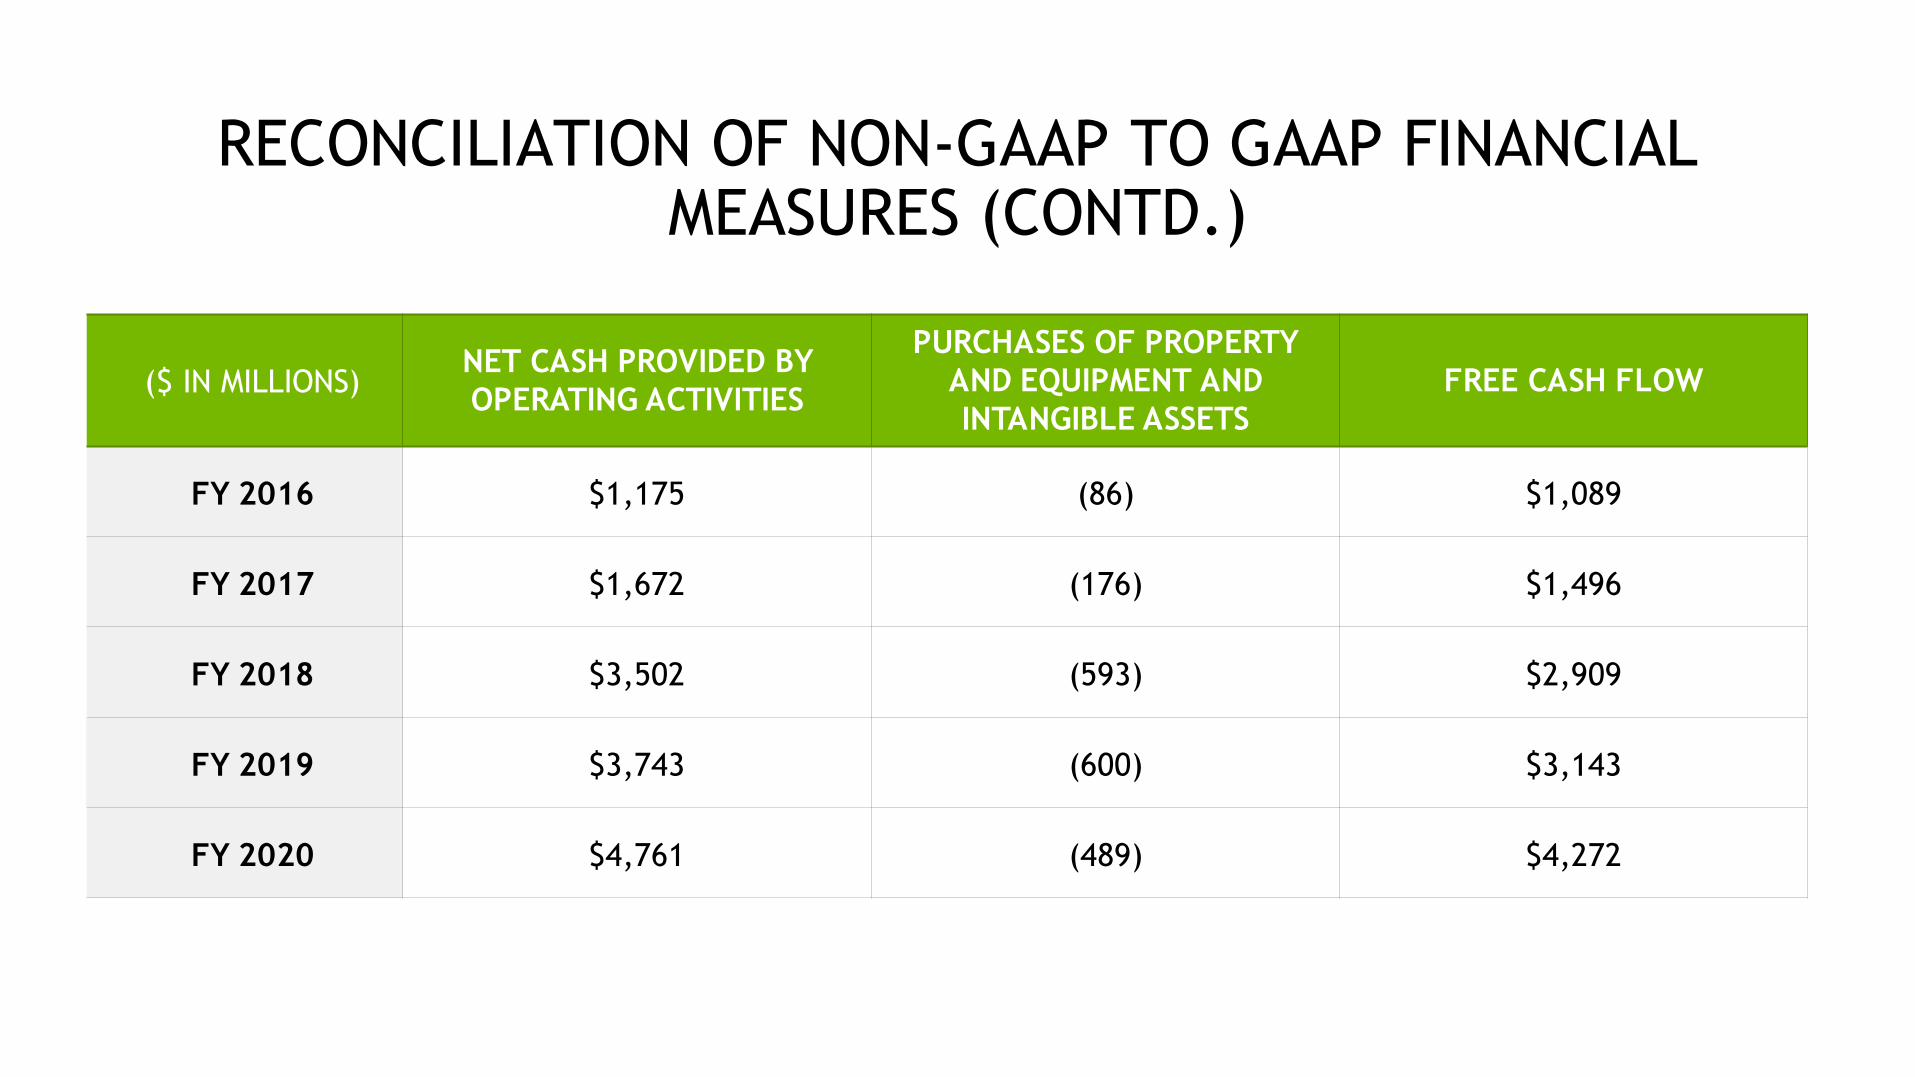
($ IN MILLIONS)NET CASH PROVIDED BY
OPERATING ACTIVITIES
PURCHASES OF PROPERTY
AND EQUIPMENT AND
INTANGIBLE ASSETS
FREE CASH FLOW
FY 2016 $1,175 (86) $1,089
FY 2017 $1,672 (176) $1,496
FY 2018 $3,502 (593) $2,909
FY 2019 $3,743 (600) $3,143
FY 2020 $4,761 (489) $4,272
58
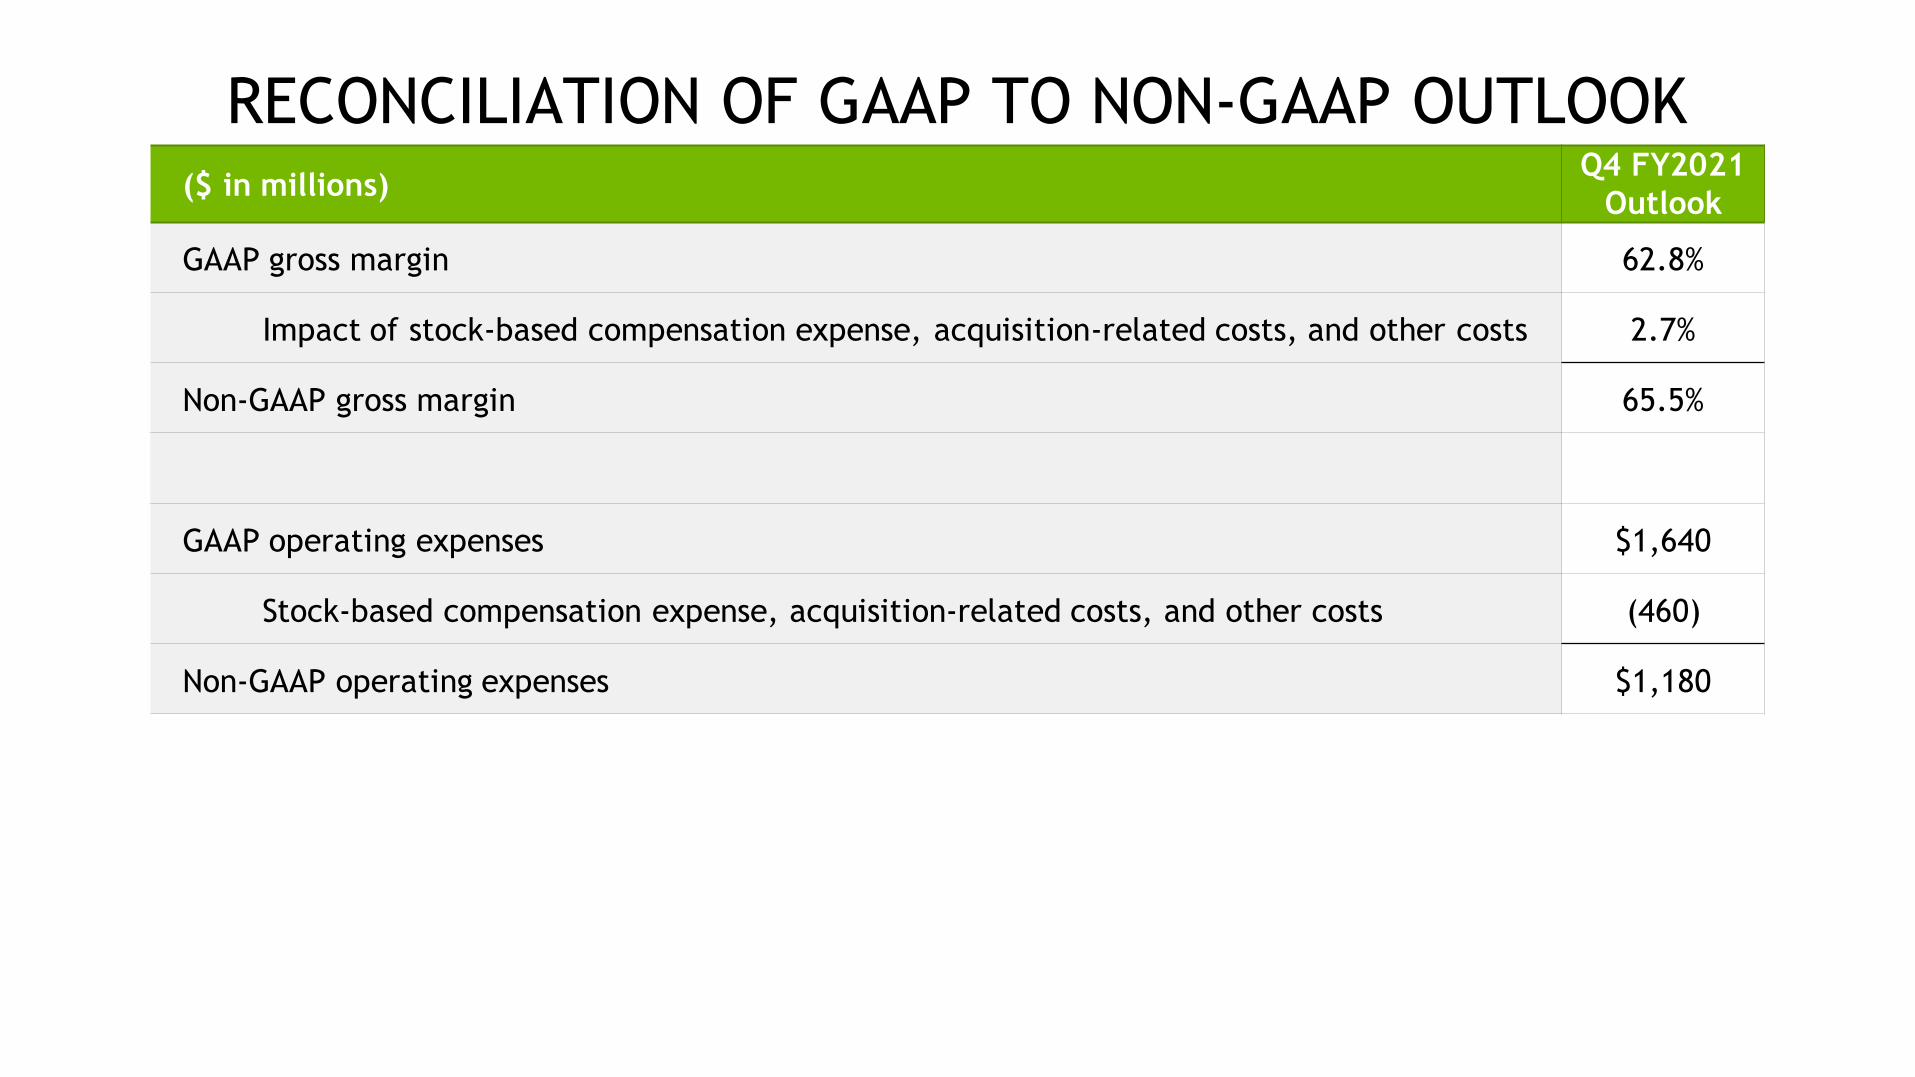
RECONCILIATION OF GAAP TO NON-GAAP OUTLOOK($ in millions)
Q4 FY2021
Outlook
GAAP gross margin 62.8%
Impact of stock-based compensation expense, acquisition-related costs, and other costs 2.7%
Non-GAAP gross margin 65.5%
GAAP operating expenses $1,640
Stock-based compensation expense, acquisition-related costs, and other costs (460)
Non-GAAP operating expenses $1,180