investor presentation q4 2015 - pkc group...investor presentation q4 2015 strategic projects...
TRANSCRIPT

Investor Presentation Q4 2015Strategic projects advanced, EBITDA continued to improve
PKC Investor Presentation Q4 2015 February 11, 2016 Matti Hyytiäinen, President & CEO

• New truck order activity has slowed and build rates declined in North America
• Truck demand in Europe continued to recover while Brazilian market is in recession
Q4 2015 Highlights
PKC Investor Presentation Q4 2015
Business Environment
PKC’s Operations
PKC’s Financial Performance
• European manufacturing footprint improvement continues
• Curitiba, Brazil factory successfully closed
• Wiring Systems’ comparable EBITDA continued to improve
• Record quarterly cash flow
• Dividend proposal is EUR 0.70 per share

North America Market
PKC Investor Presentation Q4 2015
0
50,000
100,000
150,000
200,000
250,000
300,000
350,000
2011 2012 2013 2014 2015 2016 2017 2018
Heavy Duty Trucks Medium Duty TrucksSource: LMC Automotive forecasting Q4/2014
Production units
-23%
-10%
+14%
-3%
EPA 2014 1st stage
0
10,000
20,000
30,000
40,000
50,000
60,000
70,000
80,000
90,000
100,000
Q1/13Q2/13Q3/13Q4/13Q1/14Q2/14Q3/14Q4/14Q1/15Q2/15Q3/15Q4/15
Heavy Duty Trucks Medium Duty Trucks
+10%
+6%
Source: LMC Automotive forecasting Q4/2015, ACT Build History January 2016, PKC Group
0
2,000,000
4,000,000
6,000,000
8,000,000
10,000,000
12,000,000
2011 2012 2013 2014 2015 2016 2017 2018
Light Vehicle (Pick-up and SUV)
+2%+7%
58%
42%34%
66%
Heavy Duty Trucks Medium Duty Trucks
Market Share 1-12/2015
Production units
Production units
-9%
+3%
EPA 2014 2st stage EPA 2014 1st stage

EU27 + EFTA Market
PKC Investor Presentation Q4 2015
0
50,000
100,000
150,000
200,000
250,000
300,000
350,000
400,000
450,000
2011 2012 2013 2014 2015 2016 2017 2018
Heavy Duty Trucks Medium Duty TrucksSource: LMC Automotive forecasting Q4/2014
Production units
-1%
+4%
+14%
-3%
EURO 6
0
20,000
40,000
60,000
80,000
100,000
120,000
Q1/13Q2/13Q3/13Q4/13Q1/14Q2/14Q3/14Q4/14Q1/15Q2/15Q3/15Q4/15
Heavy Duty Trucks Medium Duty Trucks
EURO 6
+16%
+4%
Source: LMC Automotive forecasting Q4/2015, PKC Group
44%
56%
22%
78%
Heavy Duty Trucks Medium Duty Trucks
Market Share 1-12/2015
Production units
+9%
+10%

Brazil Market
PKC Investor Presentation Q4 2015
0
20,000
40,000
60,000
80,000
100,000
120,000
140,000
160,000
2011 2012 2013 2014 2015 2016 2017 2018
Heavy Duty Trucks Medium Duty TrucksSource: LMC Automotive forecasting Q4/2014
Production units
+12%
-6%
+14%
-3%
0
5,000
10,000
15,000
20,000
25,000
30,000
35,000
40,000
45,000
Q1/13Q2/13Q3/13Q4/13Q1/14Q2/14Q3/14Q4/14Q1/15Q2/15Q3/15Q4/15
Heavy Duty Trucks Medium Duty Trucks
-44%
-32%
Source: LMC Automotive forecasting Q4/2015, PKC Group
31%
69%
2%
98%
Heavy Duty Trucks Medium Duty Trucks
Market Share 1-12/2015
Production units
+51%
+2%
PKC estimates production volume to continue to decrease

China Market
PKC Investor Presentation Q4 2015
0
100,000
200,000
300,000
400,000
500,000
600,000
700,000
800,000
900,000
2011 2012 2013 2014 2015 2016 2017 2018
Heavy Duty Trucks Medium Duty TrucksSource: LMC Automotive forecasting Q4/2014
Production units
+5%
+4%
+14%
-3%
0
50,000
100,000
150,000
200,000
250,000
Q1/13Q2/13Q3/13Q4/13Q1/14Q2/14Q3/14Q4/14Q1/15Q2/15Q3/15Q4/15
Heavy Duty Trucks Medium Duty Trucks
-29%
-25%
Source: LMC Automotive forecasting Q4/2015, PKC Group
10%
90%
0%
100%
Heavy Duty Trucks Medium Duty Trucks
Market Share 1-12/2015
Production units
+21%
+23%
EURO 4 EURO 4
China market share since September 2015,
joint venture started operations

Revenue
PKC Investor Presentation Q4 2015
17 17 20 13 12 9 9 60
50
100
150
200
250
Q1/14 Q2/14 Q3/14 Q4/14 Q1/15 Q2/15 Q3/15 Q4/15
South America
189 191 195 197 206 209 212 220
15 15 15 1321 15 14 12
0
50
100
150
200
250
Q1/14 Q2/14 Q3/14 Q4/14 Q1/15 Q2/15 Q3/15 Q4/15
Total GroupEUR million EUR million
55 52 46 53 54 58 64 77
10 10 10 8 8 8 88
0
50
100
150
200
250
Q1/14 Q2/14 Q3/14 Q4/14 Q1/15 Q2/15 Q3/15 Q4/15
EuropeEUR million
115 121 129 129 138 142 136 123
0
50
100
150
200
250
Q1/14 Q2/14 Q3/14 Q4/14 Q1/15 Q2/15 Q3/15 Q4/15
North AmericaEUR million
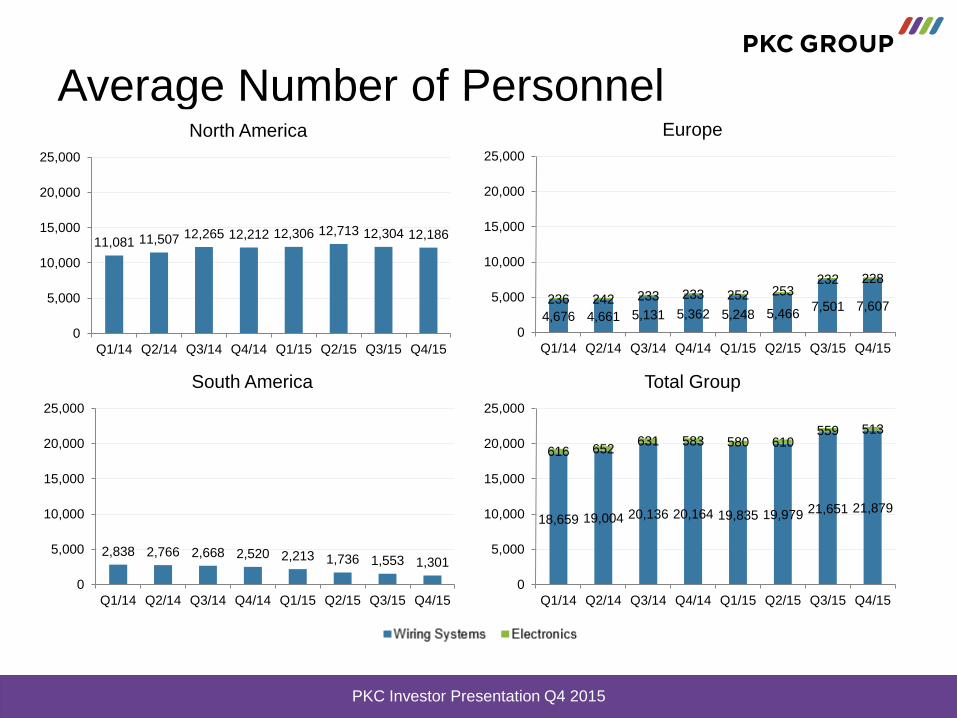
Average Number of Personnel
PKC Investor Presentation Q4 2015
11,081 11,507 12,265 12,212 12,306 12,713 12,304 12,186
0
5,000
10,000
15,000
20,000
25,000
Q1/14 Q2/14 Q3/14 Q4/14 Q1/15 Q2/15 Q3/15 Q4/15
North America
4,676 4,661 5,131 5,362 5,248 5,4667,501 7,607
236 242 233 233 252 253232 228
0
5,000
10,000
15,000
20,000
25,000
Q1/14 Q2/14 Q3/14 Q4/14 Q1/15 Q2/15 Q3/15 Q4/15
Europe
2,838 2,766 2,668 2,520 2,213 1,736 1,553 1,301
0
5,000
10,000
15,000
20,000
25,000
Q1/14 Q2/14 Q3/14 Q4/14 Q1/15 Q2/15 Q3/15 Q4/15
South America
18,659 19,004 20,136 20,164 19,835 19,979 21,651 21,879
616 652631 583 580 610
559 513
0
5,000
10,000
15,000
20,000
25,000
Q1/14 Q2/14 Q3/14 Q4/14 Q1/15 Q2/15 Q3/15 Q4/15
Total Group

• North American heavy-duty and medium-duty truck production is estimated to decrease by 17% compared to previous year’s level.
• European heavy-duty and medium-duty truck production is estimated to remain on the previous year’s level.
• Brazilian heavy-duty and medium-duty truck production is expected to continue to decrease.
• Chinese heavy-duty and medium-duty truck production is expected to grow by about 5% compared to previous year’s level
• The demand for the rolling stock is expected to continue to grow steadily.
• The market demand for Electronics segment’s products is expected to remain on the current level at the most.
Market Outlook – Full Year 2016
PKC Investor Presentation Q4 2015

• PKC Group estimates that with prevailing exchange rates 2016 revenue will be at or above previous year level and comparable EBITDA will be higher than previous year level. Revenue and comparable EBITDA improvement is to take place in the second half of the year.
• In 2015, PKC’s revenue was EUR 908.0 million and comparable EBITDA before non-recurring items was EUR 63.9 million.
PKC Group’s Outlook
PKC Investor Presentation Q4 2015

Key Figures
PKC Investor Presentation Q4 2015
EUR million 10-12/15 10-12/14 Change
%
1-12/15 1-12/14 Change
%
Revenue 231.8 209.2 +10.8 908.0 829.5 +9.5
EBITDA1)15.6 8.6 +80.9 63.9 48.6 +31.5
EBITDA%1)6.7 4.1 7.0 5.9
Non-recurring items -1.2 -11.7 -89.6 -9.0 -28.4 -68.4
Operating profit (loss) 5.7 -10.2 22.7 -7.0
EPS (EUR) 0.08 -0.63 0.29 -1.21
Cash flow from operations 53.6 34.4 +55.6 14.8 41.0 -63.9
Gross capital expenditure 5.9 4.0 +48.5 38.1 19.9 +91.5
Core working capital2) 92.7 70.2 +32.1 92.7 70.2 +32.1
ROCE, %3) 10.8 7.7
Gearing, % 31.4 -5.6
1) Excluding non-recurring items2) Inventories + trade receivables - trade payables3) ROCE, % = Adjusted operating profit (excl. NRIs) / ((Total equity + interest-bearing liabilities)(average))

• Revenue increased +12% including FX impact of +6%
– Light-vehicle build-outs still reduced revenue and truck revenue was lower from peak volumes in North America
– European revenue grew while revenue in Brazil decreased substantially due to poor market conditions
– KTP acquisition increased revenue by 9% while Chinese JV impact was 6%
• Adjusted EBITDA continued to improve– Lower losses in Brazil, favorable FX
translation impact and improvement in Europe
– Development program in Europe continuing
– The recent transactions in Poland and China included in Wiring Systems segment
Wiring Systems Segment, Q4 2015
PKC Investor Presentation Q4 2015
188.6191.3
195.4 196.7
205.7209.3
212.0
219.8
170
180
190
200
210
220
230
Q1/14 Q2/14 Q3/14 Q4/14 Q1/15 Q2/15 Q3/15 Q4/15
Revenue
EUR million
11.7 13.5 15.510.7
15.3 16.5 16.9 17.7
-2.1 -1.0 -7.4 -9.7
0.0
-5.0
0.0
-0.7
6.27.1
7.9
5.5
7.4 7.9 7.9 8.1
-4
-2
0
2
4
6
8
10
-10
-5
0
5
10
15
20
25
Q1/14 Q2/14 Q3/14 Q4/14 Q1/15 Q2/15 Q3/15 Q4/15
EBITDA excl. NRIs
NRIs
EBITDA excl. NRIs, % of revenue
EUR million %

Electronics Segment, Q4 2015
PKC Investor Presentation Q4 2015
15.4 14.7 14.8
12.5
20.8
14.7 13.912.0
0
5
10
15
20
25
Q1/14 Q2/14 Q3/14 Q4/14 Q1/15 Q2/15 Q3/15 Q4/15
Revenue
EUR million
1.2 0.8 1.0 0.2
2.8
0.7 0.7
-0.5-0.2
8.0
5.26.5
1.4
13.6
4.7 4.7
-3.8-5
0
5
10
15
-1.0
0.0
1.0
2.0
3.0
4.0
Q1/14 Q2/14 Q3/14 Q4/14 Q1/15 Q2/15 Q3/15 Q4/15
EBITDA excl. NRIs
NRIs
EBITDA excl. NRIs, % of revenue
EUR million %
• Revenue was down 4% in the quarter, but up 7% YTD
• Lower quarterly EBITDA impacted by lower revenue and unfavorable product mix of ODM products

Net Working Capital
PKC Investor Presentation Q4 2015
105.7 102.8 112.389.0
116.8 99.6 116.6 106.8
80.4 82.283.4
79.4
89.494.1
100.794.9
-87.0 -86.3 -95.9 -98.3 -102.7 -97.3 -92.8 -109.0
-17.6 -20.5-32.9 -44.0 -41.2 -36.7 -27.6
-37.6
0
2
4
6
8
10
12
14
16
18
-200
-150
-100
-50
0
50
100
150
200
250
Q1/14 Q2/14 Q3/14 Q4/14 Q1/15 Q2/15 Q3/15 Q4/15
Trade payables Other liabilities and receivables***
NWC* % of Revenue** Core working capital* % of Revenue**
Inventories Trade receivables
* Average of previous four quarters ** Revenue of previous 12 months *** Related to employee benefits, taxes and financial
items. Since Q3/14 includes additional tax liability of EUR
8.3 million and non-recurring items booked, but not paid.
EUR million %
81.6 78.266.9
26.2
Core working capital = Inventories + trade receivables – trade payables
62.3 59.896.9
55.1

Cash Flow
PKC Investor Presentation Q4 2015
41.0
14.8
-20.3
-15.7
20.7
-0.9
0.0
-22.5
20.7
-23.4
-30
-20
-10
0
10
20
30
40
50
2014 2015
Cash from operations Net capex (organic)
Cash after net capex Acquisitions
Free cash flow
EUR million EUR million
-18.4
-31.8
7.4
1.60.9
-17.9
30.7
47.0
-40
-30
-20
-10
0
10
20
30
40
50
2014 2015
Q1 Q2 Q3 Q4
Free cash flow excl. acquisitions
EUR million

Balance Sheet and Return
PKC Investor Presentation Q4 2015
42.7
34.7
29.0
0
5
10
15
20
25
30
35
40
45
2013 2014 2015
Equity ratio, %
-1.1 -5.6
31.4
-10
0
10
20
30
40
50
60
70
80
90
100
2013 2014 2015
Gearing, %
-2.2-8.9
49.4
66.9
48.6
63.9
-20
-10
0
10
20
30
40
50
60
70
80
2013 2014 2015
Net debt EBITDA*
12.2
7.7
10.8
0
2
4
6
8
10
12
14
2013 2014 2015
ROCE, %
%
EUR million %
%
*EBITDA of previous 12 months excl. NRIs ROCE % = Adjusted operating profit (excl. NRIs) /
((Total equity + interest-bearing liabilities)(average))

PKC’s Strategy Captures Growth
Opportunities
PKC Investor Presentation Q4 2015
PKC Investor Presentation Q4 2015
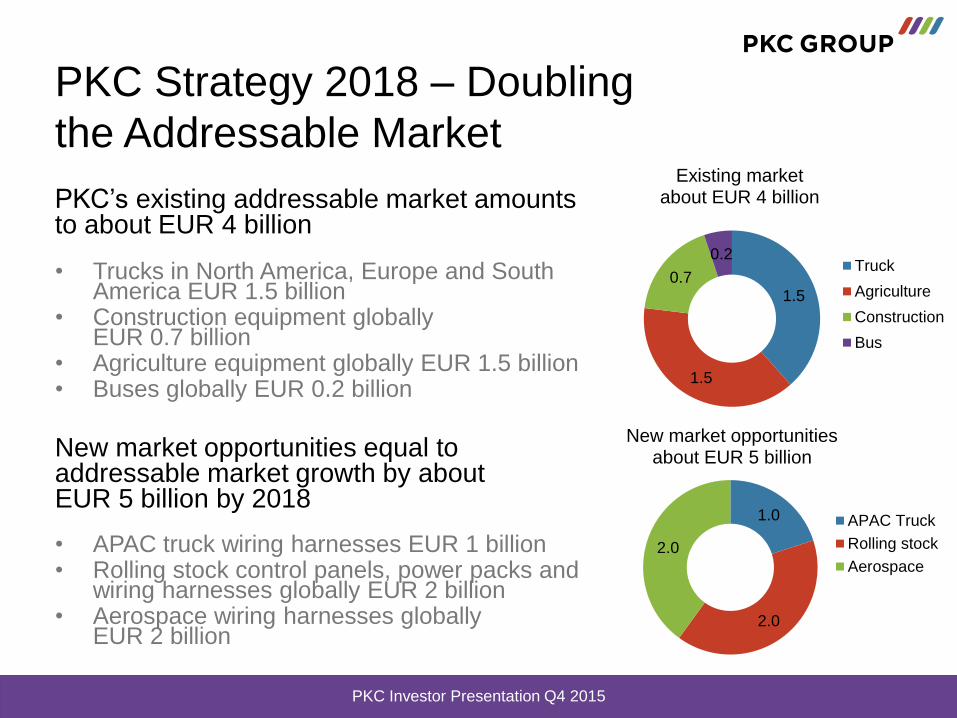
PKC’s existing addressable market amounts to about EUR 4 billion
• Trucks in North America, Europe and South America EUR 1.5 billion
• Construction equipment globally EUR 0.7 billion
• Agriculture equipment globally EUR 1.5 billion• Buses globally EUR 0.2 billion
New market opportunities equal to addressable market growth by about EUR 5 billion by 2018
• APAC truck wiring harnesses EUR 1 billion• Rolling stock control panels, power packs and
wiring harnesses globally EUR 2 billion• Aerospace wiring harnesses globally
EUR 2 billion
PKC Strategy 2018 – Doubling
the Addressable Market
1.5
1.5
0.7
0.2
Existing marketabout EUR 4 billion
Truck
Agriculture
Construction
Bus
1.0
2.0
2.0
New market opportunitiesabout EUR 5 billion
APAC Truck
Rolling stock
Aerospace
PKC Investor Presentation Q4 2015
• Doubling the addressable market
• Improved manufacturing footprint and expansion of engineering services enable to maintain strong market position in western truck markets and to capture further growth opportunities
• Expansion into rolling stock market well received by the customers, working on to globalize commercial relationships with the main industry OEM’s
• 1st Chinese PKC joint venture expanding into new customers. PKC knowhow recognized by the market and further organic and inorganic opportunities identified and in progress
Strategy Execution Proceeding

PKC Group Plc
Bulevardi 7
FI-00120 Helsinki, Finland
www.pkcgroup.comPKC Investor Presentation Q4 2015