investor presentation september, 2007
TRANSCRIPT

Online Magazines Trade shows Direct online sales
(NASDAQ-GS: GSOL)
Merle A. Hinrichs
Chairman and CEO
Investor PresentationSeptember, 2007

2
Safe Harbor
This presentation contains forward-looking statements within the meaning of Section 27-A of the Securities Act of 1933, as amended and Section 21-E of the Securities Exchange Act of 1934, as amended. The company's actual results could differ materially from those set forth in the forward-looking statements as a result of the risks associated with the company's business, changes in general economic conditions, and changes in the assumptions used in making such forward-looking statements.
3
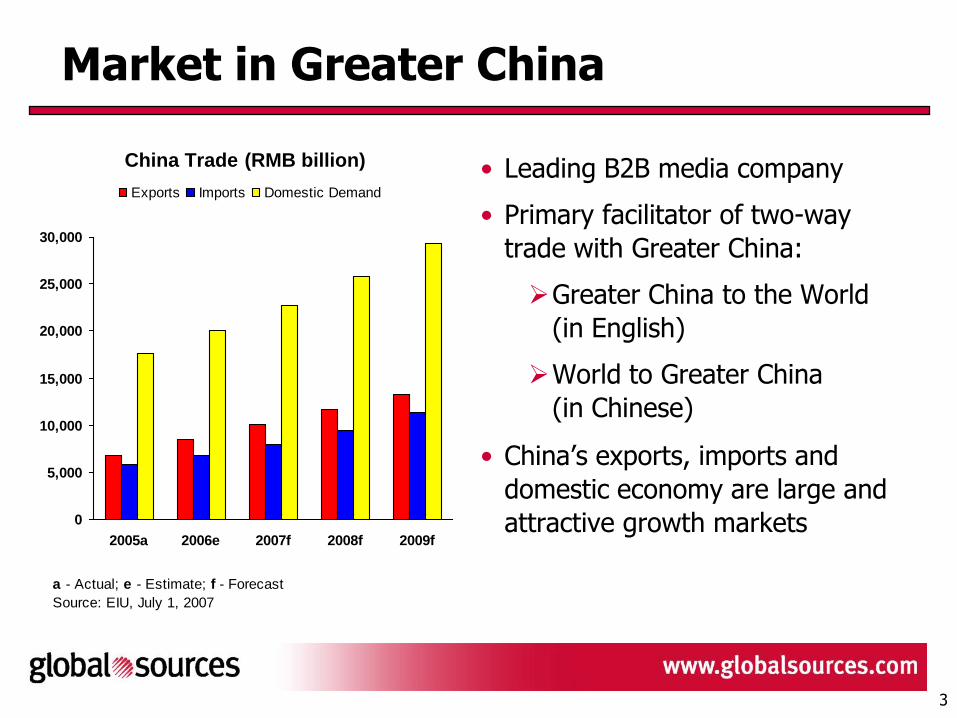
• Leading B2B media company
• Primary facilitator of two-way
trade with Greater China:
Greater China to the World
(in English)
World to Greater China
(in Chinese)
• China’s exports, imports and
domestic economy are large and
attractive growth markets
Market in Greater China
China Trade (RMB billion)
0
5,000
10,000
15,000
20,000
25,000
30,000
2005a 2006e 2007f 2008f 2009f
Exports Imports Domestic Demand
a - Actual; e - Estimate; f - Forecast
Source: EIU, July 1, 2007
4
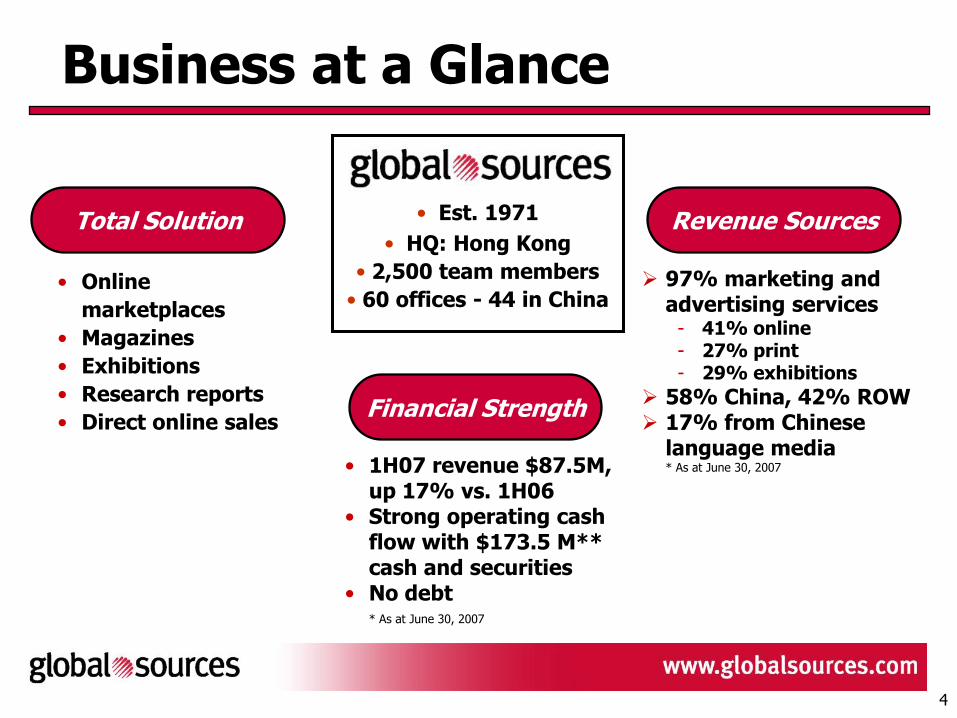
Business at a Glance
Revenue Sources
• Online
marketplaces
• Magazines
• Exhibitions
• Research reports
• Direct online sales
97% marketing and advertising services
41% online 27% print 29% exhibitions
58% China, 42% ROW 17% from Chinese
language media* As at June 30, 2007
• Est. 1971
• HQ: Hong Kong
• 2,500 team members
• 60 offices - 44 in China
• 1H07 revenue $87.5M, up 17% vs. 1H06
• Strong operating cash flow with $173.5 M** cash and securities
• No debt* As at June 30, 2007
Total Solution
Financial Strength

5
Community: 151,000 suppliers
Key Driver: Suppliers with quality products and the ability to export
Community: 635,000 active buyers in 230 countries (certified with E&Y)
Key Driver: Professional buyers that import and outsource in volume
Greater China to the World
RFI Generation: 18.7 million to suppliers through Global Sources Online alone for 12 months ending June 30, 2007
Product Shipments
RFI Generation: 18.7 million to suppliers through Global Sources Online alone for 12 months ending June 30, 2007
Product Shipments
14 VERTICAL MARKETS- Auto Parts & Accessories
- Baby & Children’s Products
- Computer Products
- Consumer Electronics
- Electronic Components
- Fashion Accessories
- Garments & Textiles
- Gifts & Premiums
- Hardware & DIY
- Home Products
- Machinery
- Security Products
- Telecom Products
- Underwear & Swimwear

6
Chief Executive
China is the
market leader
with a circulation
of 195,000 and
844,000
registered online
users.
World to Greater China
Community: Manufacturers of semiconductors and electronics equipment -- plus luxury consumer brands
Key Drivers: Companies want to penetrate the China market
7 VERTICAL MARKETS
- Electronic Engineering
- Electronic Design
- Electronics Manufacturing
- Fashion Accessories
- Baby & Children’s Products
- Lifestyle
- Management
Community: More than 1 million users/readers including BPA audited subscribers and registered online users
Key Drivers: Need and demand for imported products
International IC-China is China’s biggest semiconductor show. Held annually in three locations, in 2007 there were 29,000 attendees and 1050 booths including 12 of the world’s top 15 makers as exhibitors.
EE Times-China is
the market leader.
Combined with two
related titles, total
circulation 125,000
with some 400,000
registered online
users.
Product Shipments & Services

7
For export media, Global Sources has the most breadth, depth, verification and vertical specialization of sourcing content
Print OnlineTrade Shows
Direct Online Sales
Creative & Production
Services
Research Reports
Global Sources
Hong Kong TDC
Alibaba
Kenfair
B2bmanufacturers.com
Powerful Differentiation
Made-in-China.com
Ninetowns / Tootoo
Trade Easy
Canton Fair

8
Cont’…..Powerful Differentiation
RetailOnline Print Face-to-Face
GSOL My Catalog Magazines China Sourcing Reports
China Sourcing Fair
Vendor Summits
Private Sourcing Events
Carrefour
Casino
Coles Group
El Corte Ingles
Halfords
Lowe’s
Kingfisher
QVC
Sears
Staples
KarstadtQuelle
Woolworths
• Large-volume, professional buyers: Retail(Source: Agentrics members using our Private Sourcing Events)
9
Cont’…..Powerful Differentiation
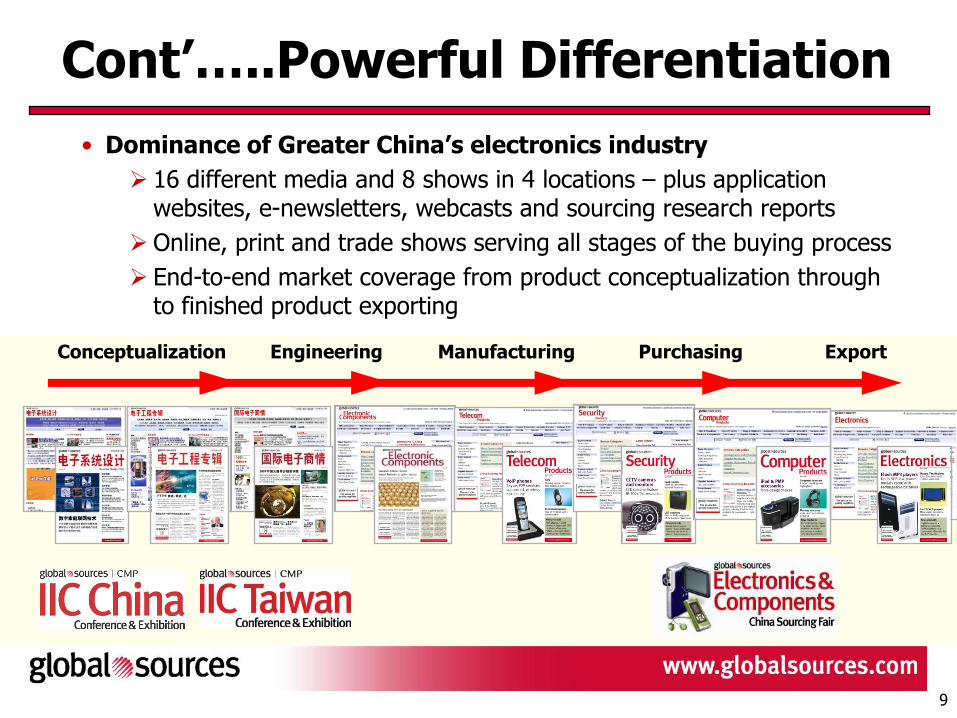
• Dominance of Greater China’s electronics industry
16 different media and 8 shows in 4 locations – plus application websites, e-newsletters, webcasts and sourcing research reports
Online, print and trade shows serving all stages of the buying process
End-to-end market coverage from product conceptualization through to finished product exporting
Conceptualization Engineering ManufacturingConceptualization Engineering Purchasing ExportManufacturing Purchasing Export

10
Strong Revenue and Earnings Growth
0
20
40
60
80
100
120
140
160
180
200
FY 2005 FY 2006 FY 2007
Guidance
Revenue (in US$ m)
112.2
156.5
182.0 – 183.5
Notes:
• 2006 Non-GAAP EPS excludes a $7.9 million gain from sale of 199 shares of the company’s subsidiary eMedia Asia Ltd.
• 2007 Non-GAAP EPS excludes an impairment charge of $1.8 million on the company’s HC International investment.
0.00
0.10
0.20
0.30
0.40
0.50
0.60
0.70
FY 2005 FY 2006 FY 2007
Guidance
GAAP Non-GAAP
EPS (in US$)
0.32
0.66
0.49
0.62 -0.65
0.66 -0.69

11
Improving Operating Margins
7%8%
10%
15%
0%
2%
4%
6%
8%
10%
12%
14%
16%
Q206 Q207
Including non-cash stock based compensation expense
Excluding non-cash stock based compensation expense
• China Sourcing Fairs beginning to demonstrate leverage
• Increase in non-cash compensation expenses in Q207 due primarily to increased value of share awards resulting from the increase in share price at the end of Q207

12
Strong Cash Generation & High Visibility
• Cash and securities: $173.5 M;
72% of total assets
• No debt
• High visibility from advance
collections and recurring revenue
Deferred income leads
revenues
Online and print contracts
are for 6 or 12 months
Trade shows booth contracts
are for multiple events
• Strong organic cash generation
Profitable for 36 years
13 days sales outstanding
US
$ m
Cash & Deferred Income
0
10
20
30
40
50
60
70
80
90
100
110
120
130
140
150
160
170
180
2004 2005 2006 1H 2007
Cash and Securities Total deferred income and customer prepayments
13
Recognition
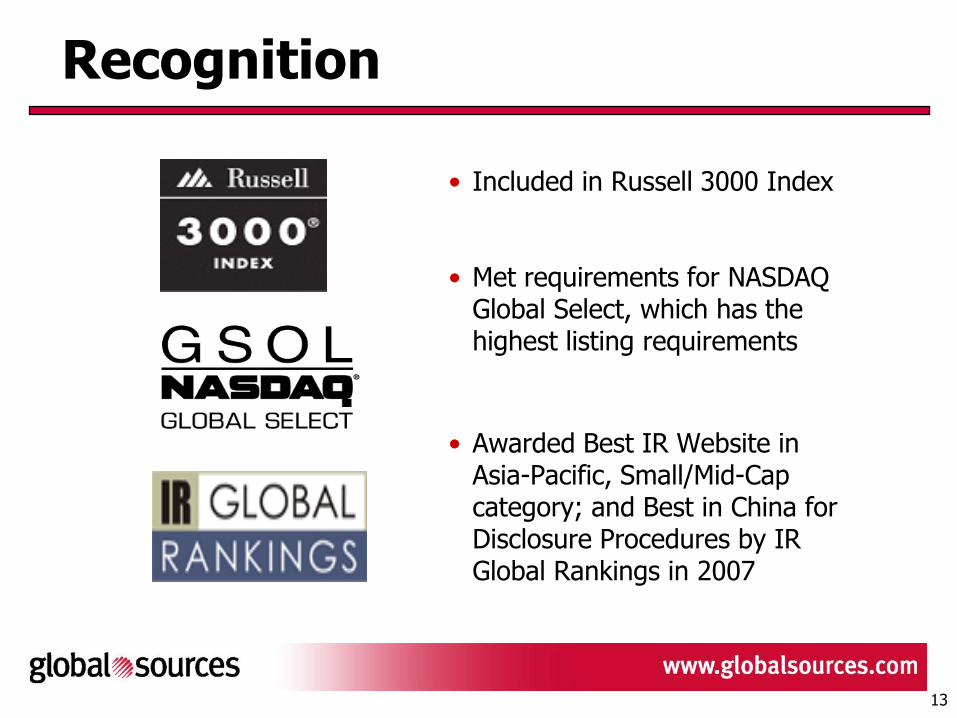
• Included in Russell 3000 Index
• Met requirements for NASDAQ Global Select, which has the highest listing requirements
• Awarded Best IR Website in Asia-Pacific, Small/Mid-Cap category; and Best in China for Disclosure Procedures by IR Global Rankings in 2007

14
New Product DevelopmentNew Product Development
Market Penetration
Market Penetration
Acquisitions/Alliances
Acquisitions/Alliances
Expand into China’s
Domestic B2B Market
Expansion intoChina’s Domestic
B2B Market
B2B Trade with and
within Greater China
Growth Strategy
15
1. Market Penetration
• Large prospect base of 151,000 suppliers
• Primary focus:
Cross sell to clients not using online, print and shows
China Sourcing Fairs: sell more booths; achieve higher revenue
per booth
Continued high revenue growth from China
New and Developing Initiatives
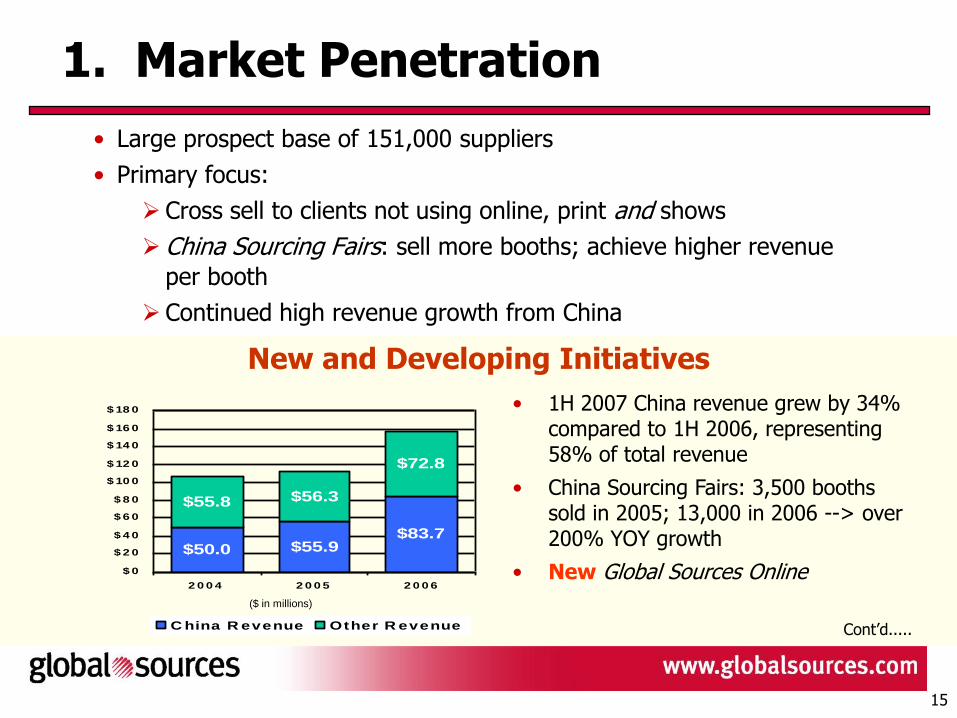
• 1H 2007 China revenue grew by 34% compared to 1H 2006, representing 58% of total revenue
• China Sourcing Fairs: 3,500 booths sold in 2005; 13,000 in 2006 --> over 200% YOY growth
• New Global Sources Online $50.0 $55.9
$83.7
$55.8 $56.3
$72.8
$ 0
$ 2 0
$ 4 0
$ 6 0
$ 8 0
$ 10 0
$ 12 0
$ 14 0
$ 16 0
$ 18 0
2 0 0 4 2 0 0 5 2 0 0 6
C hina R evenue Other R evenue
($ in millions)
Cont’d.....

16
New Global Sources Online
• One stop destination – Double the amount of product and supplier content
• Incentive program for new suppliers
• October 2007 launch
Vertical Search Engine with New and Distinctive Features
• Objective: Comprehensive results
• Three tiers of search results:
Verified Global Sources clients
Suppliers from other sites or marketplaces
Other suppliers from the Web
• Objective: Enhanced verification
Suppliers are who they claim to be
Consumer standards met
Manufacturing processes complied with
Suppliers post certifications and credit ratings
17
New and Developing Initiatives
2. New Product Development
• Primary focus:
More specialized online marketplaces, magazines and trade shows
New media formats (i.e. application websites, e-newsletters, direct
online sales)
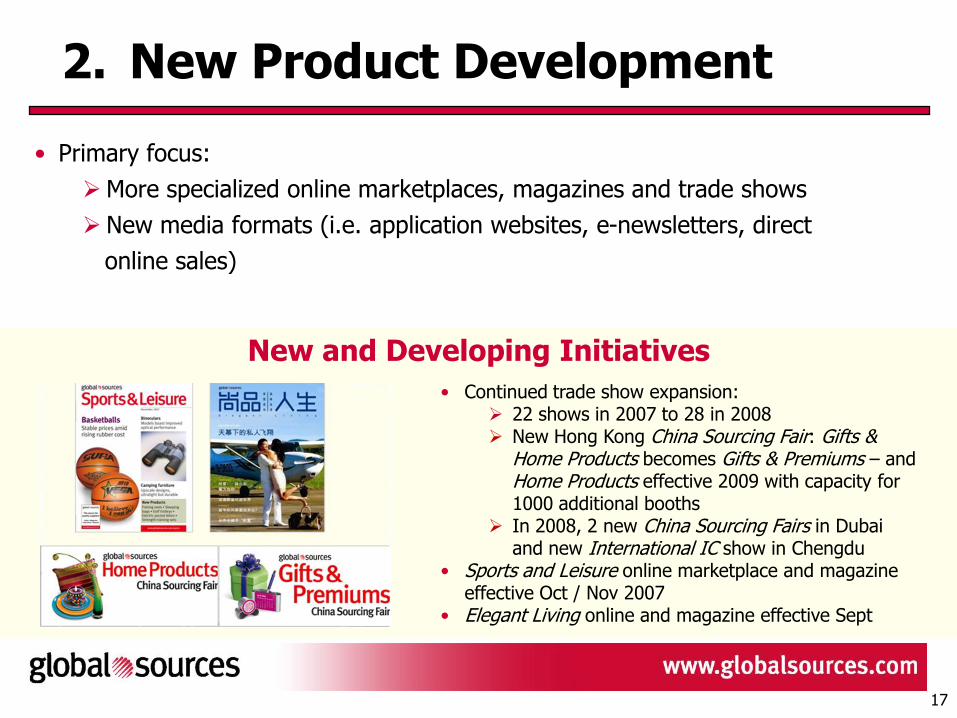
• Continued trade show expansion: 22 shows in 2007 to 28 in 2008 New Hong Kong China Sourcing Fair: Gifts &
Home Products becomes Gifts & Premiums – and Home Products effective 2009 with capacity for 1000 additional booths
In 2008, 2 new China Sourcing Fairs in Dubai and new International IC show in Chengdu
• Sports and Leisure online marketplace and magazine effective Oct / Nov 2007
• Elegant Living online and magazine effective Sept
18
3. Expansion into China’s B2B Market
• Attractive growth market that complements our business serving export and import sectors
• Primary focus:
New online, print and trade shows – in existing or related industry sectors
Leverage brands, content, advertisers, sales, infrastructure, expertise and community
New and Developing Initiatives
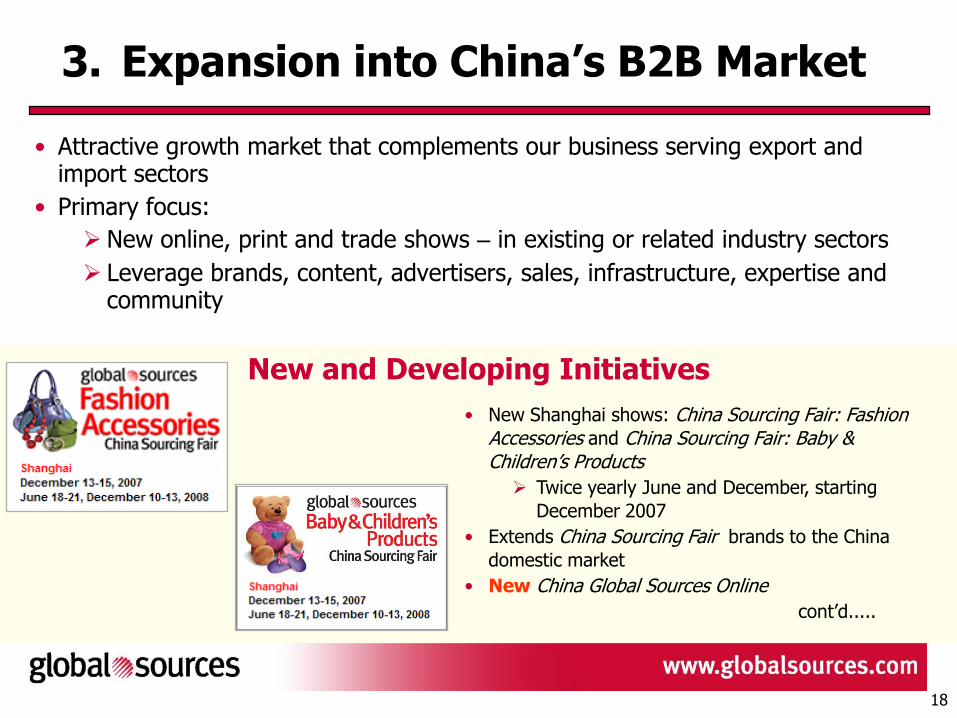
• New Shanghai shows: China Sourcing Fair: Fashion Accessories and China Sourcing Fair: Baby & Children’s Products
Twice yearly June and December, starting
December 2007
• Extends China Sourcing Fair brands to the China
domestic market
• New China Global Sources Online
cont’d.....

19
New China Global Sources Online
• Objective: One stop sourcing, comprehensive, aggregated results – and verified suppliers
November launch
Buyers: China’s retailers, distributors and manufacturers purchasing in volume
Suppliers: Global Sources’ export customers, foreign suppliers, domestic China businesses
• Strategy: higher-end, vertically focused, multimedia solution
• Key Differentiators:
Comprehensive content, verified suppliers, higher quality products
Trade shows in various verticals
• Competitive advantages:
Large database of exporters who are domestic sellers and buyers
Cross-selling with export service and domestic shows
High brand recognition
• Free at launch to gain leadership traction
Initial development investment: US$600K
Supplier home page indicating a verified
supplier

20
Cont’d… New China Global Sources Online
• Large future market opportunity:
Many unserved and
underserved segments
Up to 25 million SME’s
Price point online-only up
to RMB 3,000 per year --
and RMB 15,000 with viable
trade show
China’s Domestic B2B Market

21
New and Developing Initiatives
4. Acquisitions/Alliances
• Primary focus:
Complementary businesses, technologies or products that will accelerate
achievement of strategic goals
Develop relationships such as those with CMP and Penton where we can
apply our China resources and expertise
• Blue Bamboo Ventures
Asset acquisition recorded as long term
investment
Primary value: R&D and related contribution
to various Chinese language initiatives
Websites complementary to Elegant Living,
Chief Executive China and our domestic
trade shows

22
Investment Highlights
• Huge and attractive market opportunity
• Clear growth opportunities for market penetration, product development and further expansion into China’s domestic B2B market
• Strong revenue and earnings growth, and diversified revenue streams
• Strong cash flow generation with $173.5 million in cash and securities, and no debt
• 36 year track record of profitability and success
• Well positioned with end-to-end offerings, leading brands, and an extensive infrastructure
GSOL is a proxy for
investing in B2B China trade

Thank you
Online Magazines Trade shows Direct online sales

24
Guidance*
• Q3 2007
Revenue expected to be between $33.5 million and $34.0 million
• 14% to 16% growth compared to Q3 2006
EPS (diluted) expected to be between $0.11 and $0.12
• 10% to 20% growth compared to Q3 2006
• Full Year 2007
Revenue expected to be between $182.0 million and $183.5 million
• 16% to 17% growth compared to full year 2006
GAAP EPS (diluted) expected to be between $0.62 and $0.65
Non-GAAP EPS (diluted) expected to be between $0.66 and $0.69
• 35% to 41% growth compared to full year 2006
• Provided August 09, 2007• EPS calculations based on increase in number of shares from the 1 for 10 bonus share distribution, announced March 2007

25
Financials – GAAP to Non-GAAP Reconciliation
Q2 Q2 y-y 1H 1H y-y
(in US$ millions except number of shares and % data) 2007 2006 growth % Jun-07 Jun-06 growth %
Revenues
Online 18.5 15.7 18 35.8 30.8 16
Print 12.0 12.3 (2) 23.8 23.4 2
Exhibitions 20.9 16.4 27 25.7 20.1 28
Miscellaneous 1.1 0.4 175 2.2 0.6 267
Total revenue 52.5 44.8 17 87.5 74.9 17
Operating expenses (47.4) (41.6) (14) (75.7) (67.6) (12)
Operating income 5.1 3.2 59 11.8 7.3 62
Interest and dividend income 1.7 1.3 31 3.1 2.3 35
Gain on sale of available-for-sale securities 0.0 0.2 (100) 0.0 0.3 (100)
Loss on investment, net (1.8) 0.0 (100) (1.8) 0.0 (100)
Foreign exchange losses, net (0.2) (0.2) 0 (0.5) (0.2) (150)
Income before income taxes 4.8 4.5 7 12.6 9.7 30
Income tax expense (0.3) (0.2) (50) (0.6) (0.4) (50)
Minority Interest (0.3) (0.3) 0 (1.3) (1.1) (18)
Cumulative effect of change in accounting
principle 0.0 0.0 0 0.0 0.2 (100)
Net income 4.2 4.0 5 10.7 8.4 27
Net income per diluted share 0.10 0.10 0.25 0.20
GAAP to Non-GAAP Reconciliation
GAAP net income 4.2 4.0 5 10.7 8.4 27
Add-back :
Loss of investment, net 1.8 0.0 (100) 1.8 0.0 (100)
Non-GAAP net income 6.0 4.0 50 12.5 8.4 49
Non-GAAP net income per diluted share 0.14 0.10 0.29 0.20
Total shares used in diluted net income per share
calculations (GAAP and Non-GAAP Net Income) 42,828,613 42,340,666 42,631,899 42,300,614

26
Operating Margin Reconciliation
Note 1 – Increase in non-cash compensation expenses in Q2 2007 was due mainly to increase in value of share awards resulting from the
increase in share price at the end of Q2 2007.
$ % $ % $ % $ %
Total Revenue ( net ) 52,545 100 44,826 100 87,492 100 74,857 100
Total Operating Expenses 47,397 90 41,600 93 75,698 87 67,537 90
Income from Operation / Operating Margin 5,148 10 3,226 7 11,794 13 7,320 10
Non-cash Compensation Expenses ( Note 1 ) 2,769 5 538 1 3,293 4 1,355 2
Income from Operation / Operating Margin excluding
non-cash compensation expenses 7,917 15 3,764 8 15,087 17 8,675 12
2ND QTR 2007 2ND QTR 2006 YTD 2007 YTD 2006
INCOME FROM OPERATION / OPERATING MARGIN
ACTUAL ACTUAL ACTUAL ACTUAL
In U.S. Dollars Thousands

27
Global Sources 2008 Show Schedule
Hong Kong – April & OctoberDubai - June
Hong Kong – April & OctoberShanghai – June & DecemberDubai - June
Hong Kong – April & October
Shanghai – June & December
ShenzhenBeijing - MarchShanghaiChengdu
ShenzhenBeijing - MarchShanghaiChengdu
GuangzhouBeijing - NovemberShanghai
Taipei - August
Taipei - August
Hong Kong – April & OctoberDubai - June