investor relations presentation - rogers corporation
TRANSCRIPT

Investor PresentationJul 2021

Forward-looking statements
2
Safe Harbor StatementThis presentation contains forward-looking statements, which concern our plans, objectives, outlook, goals, strategies, future events, future net sales or performance, capital expenditures, future restructuring, plans or intentions relating to expansions, business trends and other information that is not historical information. All forward-looking statements are based upon information available to us on the date of this release and are subject to risks, uncertainties and other factors, many of which are outside of our control, which could cause actual results to differ materially from those indicated by the forward-looking statements. Risks and uncertainties that could cause such results to differ include: the duration and impacts of the novel coronavirus global pandemic and efforts to contain its transmission and distribute vaccines, including the effect of these factors on our business, suppliers, customers, end users and economic conditions generally; failure to capitalize on, volatility within, or other adverse changes with respect to the Company's growth drivers, including advanced mobility and advanced connectivity, such as delays in adoption or implementation of new technologies; uncertain business, economic and political conditions in the United States (U.S.) and abroad, particularly in China, South Korea, Germany, Hungary and Belgium, where we maintain significant manufacturing, sales or administrative operations; the trade policy dynamics between the U.S. and China reflected in trade agreement negotiations and the imposition of tariffs and other trade restrictions, including trade restrictions on Huawei Technologies Co., Ltd. (Huawei); fluctuations in foreign currency exchange rates; our ability to develop innovative products and the extent to which our products are incorporated into end-user products and systems and the extent to which end-user products and systems incorporating our products achieve commercial success; the ability and willingness of our sole or limited source suppliers to deliver certain key raw materials, including commodities, to us in a timely and cost-effective manner; intense global competition affecting both our existing products and products currently under development; business interruptions due to catastrophes or other similar events, such as natural disasters, war, terrorism or public health crises; failure to realize, or delays in the realization of anticipated benefits of acquisitions and divestitures due to, among other things, the existence of unknown liabilities or difficulty integrating acquired businesses; our ability to attract and retain management and skilled technical personnel; our ability to protect our proprietary technology from infringement by third parties and/or allegations that our technology infringes third party rights; changes in effective tax rates or tax laws and regulations in the jurisdictions in which we operate; failure to comply with financial and restrictive covenants in our credit agreement or restrictions on our operational and financial flexibility due to such covenants; the outcome of ongoing and future litigation, including our asbestos-related product liability litigation; changes in environmental laws and regulations applicable to our business; and disruptions in, or breaches of, our information technology systems. For additional information about the risks, uncertainties and other factors that may affect our business, please see our most recent annual report on Form 10-K and any subsequent reports filed with the Securities and Exchange Commission, including quarterly reports on Form 10-Q. Rogers Corporation assumes no responsibility to update any forward-looking statements contained herein except as required by law.

Non-GAAP Information
3
This presentation includes the following financial measures that are not presented in accordance with generally accepted accounting principles in the United States of America (“GAAP”):
(1) Adjusted earnings per diluted share, which the Company defines as net income excluding amortization of acquisition intangible assets and discrete items, such as acquisition and related integration costs, environmental accrual adjustments, gains or losses on the sale or disposal of property, plant and equipment, restructuring, severance, impairment and other related costs, UTIS fire charges and the related income tax effect on these items (collectively, “discrete items”);
(2) Adjusted operating income, which the Company defines as operating income excluding acquisition-related amortization of intangible assets and discrete items;
(3) Adjusted operating margin, which the Company defines as operating margin excluding acquisition-related amortization of intangible assets and discrete items;
(4) Adjusted EBITDA, which the Company defines as net income excluding interest expense, net, income tax expense, depreciation and amortization, stock-based compensation expense and discrete items;
(5) Adjusted EBITDA Margin, which the Company defines as the percentage that results from dividing Adjusted EBITDA by total net sales;
Management believes that adjusted earnings per diluted share, adjusted operating income, adjusted operating margin, adjusted EBITDA and adjusted EBITDA margin, are useful to investors because they allow for comparison to the Company’s performance in prior periods without the effect of items that, by their nature, tend to obscure the Company’s core operating results due to potential variability across periods based on the timing, frequency and magnitude of such items. As a result, management believes that these measures enhance the ability of investors to analyze trends in the Company’s business and evaluate the Company’s performance relative to peer companies. However, non-GAAP financial measures have limitations as analytical tools and should not be considered in isolation from, or as alternatives to, financial measures prepared in accordance with GAAP. In addition, these non-GAAP financial measures may differ from, and should not be compared to, similarly named measures used by other companies. Reconciliations of the differences between these non-GAAP financial measures and their most directly comparable financial measures calculated in accordance with GAAP are set forth in the appendix.

Rogers at a Glance
4*See appendix for reconciliation of adjusted EPS to EPS.
Employees 2020 Sales Non-U.S. Sales 2020 Adjusted EPS*
Rogers (NYSE: ROG) is a global leader in materials technology focused on delivering innovative high-performance solutions in Advanced Mobility, Advanced Connectivity and more
3,350 z $803M ~70% $5.08

Advanced Mobility• ADAS• EV/HEV
Advanced Connectivity• Portable Electronics• Wireless infrastructure (4G & 5G)
Other• Aerospace & Defense• Clean Energy• General Industrial• Mass Transit
What We Do
5.
Products
Advanced Connectivity Systems (ACS)• High frequency circuit materials
• Ceramic substrates used in power modules
• Laminated busbars
Markets
Advanced Electronics Solutions (AES)
Elastomeric Material Solutions (EMS)
• Polyurethane and silicone materials for cushioning, sealing and vibration management

The Rogers Opportunity
6*Adjusted operating margin improvement from 2012 to 2020. See appendix for reconciliation of operating margin to adjusted operating margin**Net cash defined as cash and cash equivalents in excess of total debt
Strong Secular Tailwinds
Market & Technology Leadership
Focused strategy driving market leadership in high growth areas
Proven Track Record Consistent long-term sales growthAdjusted operating margins increased 570 bps*
Strong Balance Sheet $204M net cash position at Q’21**
Strategy Targeted to Enable Profitable Growth Through Market-focused Innovation, M&A and Operational Excellence
Growth Drivers: EV/HEV, ADAS, 5G Smartphones, Defense

3 5 6 9 11 13610
1317
2024
2020 2021 2022 2023 2024 2025
Pouch
Prismatic
Cylinder
Advanced Mobility Outlook
7
EV/HEV ADAS
1 – IHS Markit Light Vehicle Production Forecast Mar 2021; 2 – Boston Consulting Group “Why Electric Cars Can’t Come Fast Enough” April 20213 – IHS Markit E-Mobility Battery Cell Forecast Feb 2021; 4 - IHS Markit June 2020 Auto Sensor forecast
• Long-term outlook of 15-20% CAGR4
• ADAS features becoming standard on more vehicles
• Safety regulations and OEM commitments driving adoption
• Rogers has strong market positions with major Tier I suppliers
4 5 8 11 14 164
67
910
11
24
68
10
13
2020 2021 2022 2023 2024 2025
HEV - Mild
HEV - Full
EV
Electric & Hybrid Electric Vehicles1
(units in millions)Electric & Hybrid Electric Batteries3
(units in millions)
81
119139
155172
188
2020 2021 2022 2023 2024 2025
Auto Radar Sensors4
(units in millions)
• Long-term outlook of >30% CAGR1. Recent forecast showing accelerated EV/HEV adoption2.
• OEMs ramping EV/HEV production, with incentives and regulations adding to momentum
• Rogers investing aggressively in capacity to meet growing demand
• Substrates for power semi packaging: Content opportunity across entire EV/HEV market
• Battery cell pads and other solutions: Content opportunity across all battery types
• Power interconnects provide additional content opportunity with leading EV market entrants

Advanced Mobility: Rogers’ Product Portfolio
8
AES
77GHZ Corner RadarShort/Medium Range
77GHz RadarLong/Medium Range
24/77GHz Corner RadarShort/Medium Range
EMS
Battery
Inverter
Battery Module Interconnect Battery Cell Interconnect
Battery Compression Pads Vibration Dampening PadsBattery Pack Sealing Solutions
Vehicle Electrification (Electric power steering, water pump, regenerative braking, etc)
Ceramic Substrates for Power Semiconductor Packaging
Converter
Specific to EV/HEV

Focused Strategy Driving Market Leadership
9
• 4 global innovation centers developing leading technology
• Highly-engineered materials & solutions for markets that demand performance & reliability
• Enabling technology roadmaps
• Focus on ‘Top of Pyramid’• Market & technology leadership• Strong financial profile
• Multiple acquisitions since 2015
• Optimize utilization
• Improve productivity & yields to improve GM
• Global growth driver focus
• Strong, collaborative, solution-oriented customer relationships
31.8%
36.4%
2012 2020
Company Gross Margin
Market-Driven Innovation Leadership
Synergistic M&A Operational Excellence

Commitment to Corporate Social Responsibility
10
• Rogers’ commitment to sustainability is deeply rooted throughout our history
• Our advanced materials are found in leading-edge technologies that improve lives, protect our environment and fuel our future
• Rogers is committed to being responsible members of the communities where we live and work through robust environmental, health and safety management practices
• Inaugural ESG Report available on rogerscorp.com

Advanced Mobility
28%Wireless
Infrastructure10%
Portable Electronics
9%
A&D11%
Industrial19%Other
13%
Clean Energy
10%
Mass Transit4%
e-Mobility15%
ADAS9%
Rogers Business Overview
*Market percentages are approximate and based on company estimates. Percentages may not sum due to rounding. 11
Portfolio Highlights
• High-performance materials
• Mission-critical applications
• Technology innovation and leadership
• Strong, collaborative customer relationships
• Engineer-to-engineer sales
• Global sales, manufacturing and technology footprint
Key Business Metrics1H 2021
38.6%Gross Margin
380 basis point increase vs 1H 2020
$464MNet Sales
19% increase vs 1H 2020
Strong growth outlook with continuing margin expansion opportunities
Sales by Market*
Percentages may not add due to rounding
1H 2021

Net SalesAdjusted
Operating Margin**
1H 2021 $272M 13.5%
Net SalesAdjusted
Operating Margin**
1H 2021 $181M 23.9%
Business Unit Overview
12
ADAS16%
e-mobility18%
Clean Energy17%
Aerospace & Defense
19%
Wireless Infrastructure
17%
Other13%
1H 2021 Markets*
*Market percentages are approximate and based on company estimates **See reconciliation of adjusted operating margin to operating margin in the appendix.
Note: Other business unit not shown
AES EMS
e-mobility11%
General Industrial
45%
Portable Electronics
21%
Other23%
1H 2021 Markets*

$40
$165
2012 2020
Financial Track Record
*See reconciliation in the appendix of adjusted operating margin to operating margin and earnings per share to adjusted earnings per share. 13
Revenue Growth Increasing Profitability
$499
$803
2012 2020
10.0%
15.7%
2012 2020
Improving Cash Generation
Net Sales ($M) Adjusted Operating Margin* Operating Cash Flow ($M)
Strong Financial Performance Driven by Focused Multi-Year Strategy

Financial Overview
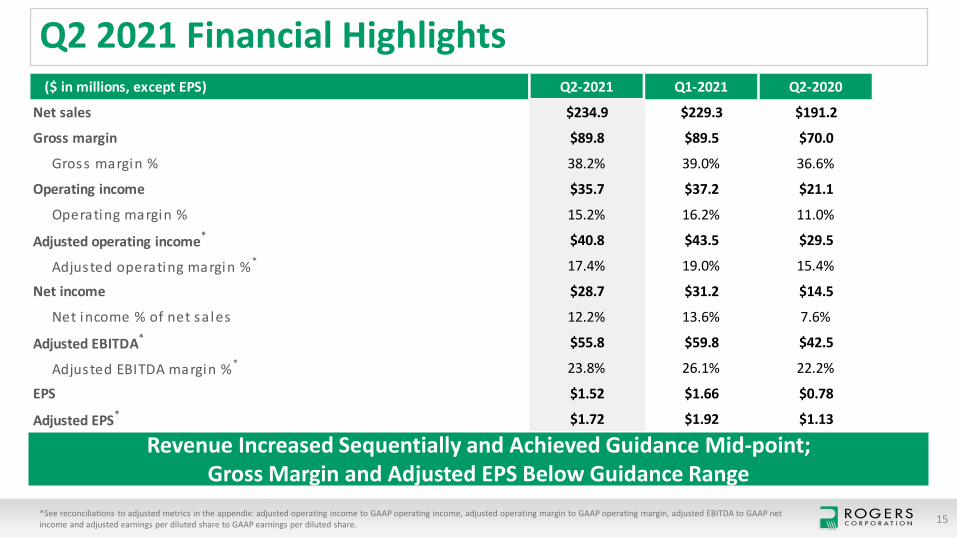
Q2 2021 Financial Highlights
15*See reconciliations to adjusted metrics in the appendix: adjusted operating income to GAAP operating income, adjusted operating margin to GAAP operating margin, adjusted EBITDA to GAAP net income and adjusted earnings per diluted share to GAAP earnings per diluted share.
Revenue Increased Sequentially and Achieved Guidance Mid-point; Gross Margin and Adjusted EPS Below Guidance Range
($ in millions, except EPS) Q2-2021 Q1-2021 Q2-2020
Net sales $234.9 $229.3 $191.2
Gross margin $89.8 $89.5 $70.0
Gross margin % 38.2% 39.0% 36.6%
Operating income $35.7 $37.2 $21.1
Operating margin % 15.2% 16.2% 11.0%
Adjusted operating income* $40.8 $43.5 $29.5
Adjusted operating margin %* 17.4% 19.0% 15.4%
Net income $28.7 $31.2 $14.5
Net income % of net sa les 12.2% 13.6% 7.6%
Adjusted EBITDA* $55.8 $59.8 $42.5
Adjusted EBITDA margin %* 23.8% 26.1% 22.2%
EPS $1.52 $1.66 $0.78
Adjusted EPS* $1.72 $1.92 $1.13

Full Year 2020 Financial Highlights
16
($ in millions, except EPS) FY-2020 FY-2019
Net sales $802.6 $898.3
Gross margin $291.8 $314.3
Gross margin % 36.4% 35.0%
Operating income $67.3 $110.5
Operating margin % 8.4% 12.3%
Adjusted operating income* $125.8 $141.4
Adjusted operating margin %* 15.7% 15.7%
Net income $50.0 $47.3
Net income % of net sales 6.2% 5.3%
Adjusted EBITDA* $177.0 $188.2
Adjusted EBITDA margin %* 22.1% 21.0%
EPS $2.67 $2.53
Adjusted EPS* $5.08 $6.14
*See reconciliations to adjusted metrics in the appendix: adjusted operating income to GAAP operating income, adjusted operating margin to GAAP operating margin, adjusted EBITDA to GAAP net income and adjusted earnings per diluted share to GAAP earnings per diluted share.
Revenue and Earnings Affected by Weakened Market Demand from COVID-19;Gross Margin Improvement Driven by Strong Operational Execution

Appendix

18
Q2 2021: Adjusted operating margin reconciliation
Note: percentages and dollars may not add due to rounding.
($ in millions) Q2-20($) Q2-20(%) Q1-21($) Q1-21(%) Q2-21($) Q2-21(%)
GAAP operating margin 21.1$ 11.0% 37.2$ 16.2% 35.7$ 15.2%
Restructuring, severance, impairment and other related costs 0.6$ 0.3% 1.9$ 0.8% 1.0$ 0.4%
Acquisition and related integration costs 0.4$ 0.2% -$ - -$ -
Asbestos-related charges -$ - -$ - -$ -
Environmental accrual adjustment (0.2)$ (0.1%) -$ - -$ -
Gain on sale or disposal of property, plant and equipment 0.1$ 0.0% (0.1)$ (0.0%) (0.6)$ (0.3%)
Utis fire charges -$ - 1.3$ 0.6% 1.5$ 0.6%
Total discrete items 0.9$ 0.5% 3.2$ 1.4% 1.9$ 0.8%
Operating margin adjusted for discrete items 22.0$ 11.5% 40.4$ 17.6% 37.6$ 16.0%
Acquisition intangible amortization 7.5$ 3.9% 3.1$ 1.4% 3.1$ 1.3%
Adjusted operating margin 29.5$ 15.4% 43.5$ 19.0% 40.8$ 17.4%

19
Q2 2021: Adjusted EBITDA and adjusted EBITDA margin reconciliation
Note: percentages and dollars may not add due to rounding.
($ in millions) Q2-20($) Q1-21($) Q2-21($)
GAAP net income 14.5$ 31.2$ 28.7$
Interest expense, net 1.8$ 0.6$ 0.4$
Income tax expense 6.4$ 10.5$ 9.9$
Depreciation 7.4$ 7.2$ 7.5$
Amortization 7.6$ 3.1$ 3.1$
Stock-based compensation expense 3.9$ 4.0$ 4.4$
Restructuring, severance, impairment and other related costs 0.6$ 1.9$ 0.9$
Acquisition and related integration costs 0.4$ -$ -$
Asbestos-related charges -$ -$ -$
Environmental accrual adjustment (0.2)$ -$ -$
Gain on sale or disposal of property, plant and equipment 0.1$ (0.1)$ (0.6)$
Utis fire charges -$ 1.3$ 1.5$
Adjusted EBITDA 42.5$ 59.8$ 55.8$
Divided by Total Net Sales 191.2$ 229.3$ 234.9$
Adjusted EBITDA Margin 22.2% 26.1% 23.8%

Q2 2021: Adjusted EPS reconciliation
20Note: dollars may not add due to rounding.(a) This represents the dilutive effect of awards under equity compensation plans. See reconciliation of weighted average shares outstanding – diluted to Adjusted weighted average shares outstanding –diluted in the appendix
Q2-20($) Q1-21($) Q2-21($)
GAAP earnings per diluted share 0.78$ 1.66$ 1.52$
Restructuring, severance, impairment and other related costs 0.02$ 0.08$ 0.04$
Acquisition and related integration costs 0.02$ -$ -$
Asbestos-related charges -$ 0.00$ -$
Environmental accrual adjustment (0.01)$ -$ -$
Gain on sale or disposal of property, plant and equipment 0.00$ (0.00)$ (0.02)$
Utis fire charges -$ 0.05$ 0.06$
Total discrete items 0.04$ 0.13$ 0.08$
Earnings per diluted share adjusted for discrete items 0.82$ 1.79$ 1.60$
Acquisition intangible amortization 0.31$ 0.13$ 0.13$
Adjusted earnings per diluted share 1.13$ 1.92$ 1.72$

21
YTD 2021: Segment adjusted operating income and operating margin reconciliation
Note: percentages and dollars may not add due to rounding.
($ in millions)EMS AES
1H’21 ($) 1H’21 (%) 1H’21 ($) 1H’21 (%)
Operating income and operating margin $35.7 19.7% $33.1 12.2%
Restructuring, severance, impairment & other related costs $0.1 0.1% $2.8 1.0%
Acquisition and related integration costs - - - -
Asbestos-related charges - - - -
Environmental accrual adjustment - - - -
Loss on sale of disposal of property, plant and equipment $(0.2) -0.1% $(0.5) -0.2%
UTIS Fire $2.8 1.5% - -
Operating income and operating margin, adjusted for discrete items $38.4 21.2% $35.5 13.0%
Acquisition intangible amortization $4.9 2.7% $1.4 0.5%
Adjusted operating income and operating margin $43.3 23.9% $36.9 13.5%

22
2020: Adjusted operating margin reconciliation
Note: percentages and dollars may not add due to rounding.
($ in millions) FY-19($) FY-19(%) FY-20($) FY-20(%)
GAAP operating margin $110.5 12.3% $67.3 8.4%
Restructuring, severance, impairment and other related costs $7.7 0.9% $16.4 2.0%
Acquisition and related integration costs $1.9 0.2% $1.0 0.1%
Transition services, net $0.9 0.1% - -
Pension settlement charges - - $0.1 -
Asbestos-related charges $1.7 0.2% ($0.7) (0.1%)
Environmental accrual adjustment $0.8 0.1% ($0.2) -
Gain from indemnity claim and antitrust litigation settlements ($0.7) (0.1%) - -
Change in foreign jurisdiction tax regulation on equity awards attributable to a prior period $0.5 0.1% - -
Loss on sale or disposal of property, plant and equipment $0.6 0.1% - -
Total discrete items $13.4 1.5% $16.6 2.1%
Operating margin adjusted for discrete items $123.9 13.8% $83.9 10.4%
Acquisition intangible amortization $17.6 2.0% $42.0 5.2%
Adjusted operating margin $141.4 15.7% $125.8 15.7%

23
2020: Adjusted EBITDA and adjusted EBITDA margin reconciliation
Note: percentages and dollars may not add due to rounding.
($ in millions) FY-19($) FY-20($)
GAAP net income $47.3 $50.0Interest expense, net $6.9 $7.1Income tax expense $7.8 $18.5Depreciation $31.4 $29.3Amortization $17.8 $42.1Stock-based compensation expense $12.3 $13.5Restructuring, severance, impairment and other related costs $7.7 $16.2Acquisition and related integration costs $1.9 $1.0Transition service lease income ($1.0) -Pension settlement charges $53.2 $0.1Asbestos-related charges $1.7 ($0.7)Environmental accrual adjustment $0.8 ($0.2)Gain from indemnity claim and antitrust settlements ($0.7) -Change in foreign jurisdiction tax regulation on equity awards attributable to a prior period $0.5 -Loss on sale or disposal of property, plant and equipment $0.6 -
Adjusted EBITDA $188.2 $177.0
Divided by Total Net Sales $898.3 $802.6Adjusted EBITDA Margin 21.0% 22.1%

2020: Adjusted EPS reconciliation
24Note: dollars may not add due to rounding.
FY-19 ($) FY-20 ($)
GAAP earnings per diluted share $2.53 $2.67
Restructuring, severance, impairment and other related costs $0.31 $0.67
Acquisition and related integration costs $0.08 $0.04
Transition services, net $0.04 -
Pension settlement charges $2.35 -
Asbestos-related charges $0.07 ($0.03)
Environmental accrual adjustment $0.03 ($0.01)
Gain from indemnity claim and antitrust litigation settlement ($0.03) -
Loss on sale or disposal of property, plant and equipment $0.03 -
Change in foreign jurisdiction tax regulation on equity awards attributable to a prior period $0.02 -
Total discrete items $2.90 $0.67
Earnings per diluted share adjusted for discrete items$5.42 $3.35
Acquisition intangible amortization $0.72 $1.73
Adjusted earnings per diluted share$6.14 $5.08