investor update presentation for personal use only · 2020-06-14 · investor update presentation...
TRANSCRIPT

Sydney
Level 23, 1 O'Connell Street
Sydney NSW 2000 Australia
T +61 2 9640 2600
Singapore
Level 16, Singapore Land Tower
50 Raffles Place, Singapore 048623
T +65 6320 7718
Web: www.tribecaip.com/lic
Email: [email protected]
ABN: 16 627 596 418
15 June 2020 ASX Market Announcements ASX Limited 20 Bridge Street Sydney NSW 2000 BY ELECTRONIC LODGEMENT Investor Update Presentation
Please find attached Investor Update Presentation.
The information contained in this document has been prepared for use in conjunction with a verbal presentation and should be read in that context.
Video link to Investor Update Presentation
For any enquiries please contact TGF at [email protected] or by calling +61 2 9640 2600.
Authorised for released by the Board of Tribeca Global Natural Resources Limited.
Ken Liu Company Secretary Tribeca Global Natural Resources Limited
For
per
sona
l use
onl
y

Tribeca Global Natural Resources Ltd (ASX:TGF)
Investor Update
Ben Cleary, Portfolio Manager
June 2020
For
per
sona
l use
onl
y

Legal Disclaimer This presentation has been prepared for Tribeca Global Natural Resources Limited (ABN 16 627 596 418) (“TGF”) by its investment
manager, Tribeca Global Resources Pty Ltd (ABN 11 606 707 662) (“Tribeca”) under AFS License 239070 (Tribeca Investment
Partners Pty Ltd). The information contained in this presentation is for information purposes only and has been prepared for use in
conjunction with a verbal presentation and should be read in that context. The information contained in this presentation is not
investment or financial product advice and is not intended to be used as the basis for making an investment decision. Please note that,
in providing this presentation, Tribeca has not considered the objectives, financial position or needs of any particular recipient. Investors
must not make investment decisions on the basis of any matter contained in this presentation but must conduct your own assessment,
investigations and analysis. Tribeca strongly suggests that prior to making an investment decision, investors seek financial, legal and
taxation advice appropriate to your investment objectives, financial situation and circumstances.
This presentation is intended for the exclusive benefit of the party to which it is presented. It may not be reproduced, disseminated,
quoted or referred to, in whole or in part, without the express consent of Tribeca. No representation or warranty, express or implied, is
made as to the fairness, accuracy, completeness or correctness of the information, opinions and conclusions contained in this
presentation. To the maximum extent permitted by law, none of Tribeca, TGF, their related bodies corporate, shareholders or respective
directors, officers, employees, agents or advisors, nor any other person accepts any liability, including, without limitation, any liability
arising out of fault or negligence for any loss arising from the use of information contained in this presentation.
This presentation includes “forward looking statements”. Such forward looking statements are not guarantees of future performance and
involve known and unknown risks, uncertainties and other factors, many of which are beyond the control of Tribeca, TGF and their
officers, employees, agents or associates that may cause actual results to differ materially from those expressed or implied in such
statement. Actual results, performance or achievements may vary materially from any projections and forward-looking statements and
the assumptions on which those statements are based. Tribeca and TGF assume no obligation to update such information. Financial
position and performance data contained in this presentation is unaudited. Opinions expressed in this presentation may change without
notice. Whilst every effort is made to ensure the information is accurate at the time of preparation, Tribeca does not guarantee its
accuracy, reliability or completeness nor does it undertake to correct any information subsequently found to be inaccurate.
This presentation does not constitute an offer to sell, or a solicitation of an offer to buy, any securities in the United States. The
securities of TGF have not been, and will not be, registered under the U S Securities Act of 1933 as amended (Securities Act) or the
securities laws of any state or other jurisdiction of the United States, and may not be offered or sold in the United States except in
compliance with the registration requirements of the Securities Act and any other applicable securities laws or pursuant to an exemption
from, or in a transaction not subject to, the registration requirements of the Securities Act and any other applicable securities laws.
Disclaimer
2
For
per
sona
l use
onl
y

3
Agenda
1.
2.
3.
4. Listed Equities Update
Corporate Update
Market Environment and Outlook
TGF Portfolio Update
Credit Update
5.
For
per
sona
l use
onl
y

TGF Portfolio Update
For
per
sona
l use
onl
y
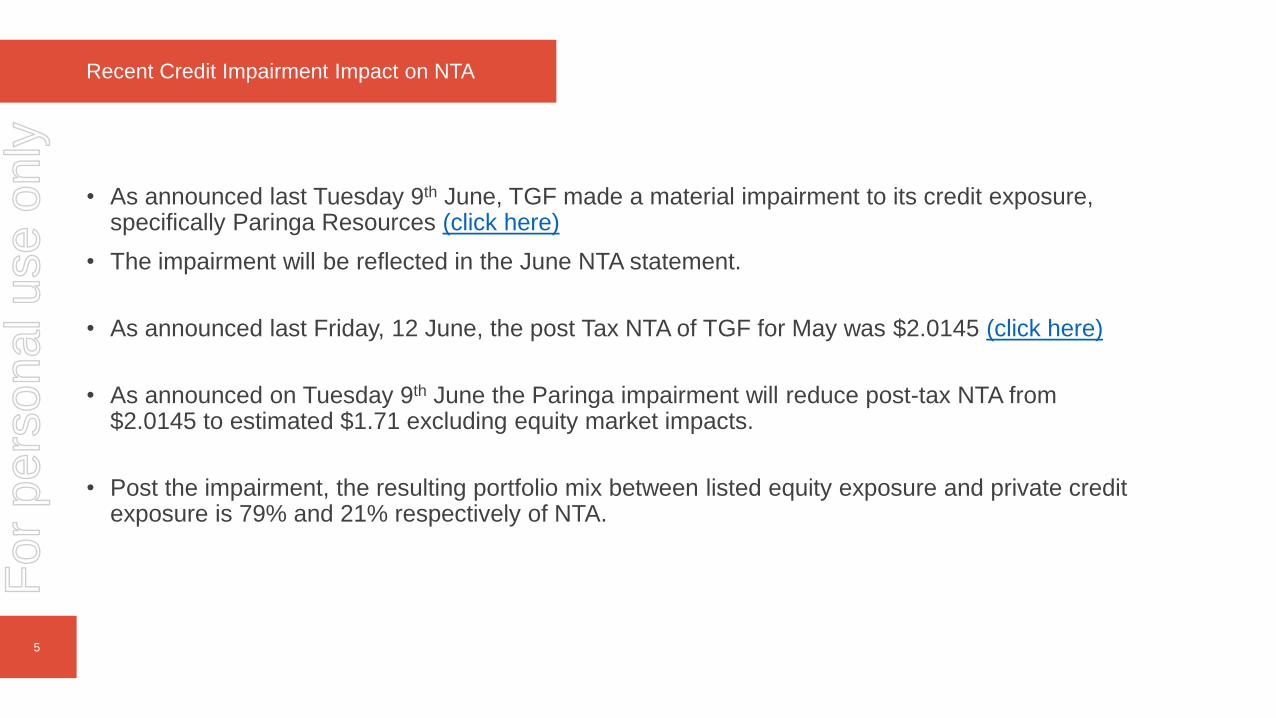
• As announced last Tuesday 9th June, TGF made a material impairment to its credit exposure, specifically Paringa Resources (click here)
• The impairment will be reflected in the June NTA statement.
• As announced last Friday, 12 June, the post Tax NTA of TGF for May was $2.0145 (click here)
• As announced on Tuesday 9th June the Paringa impairment will reduce post-tax NTA from $2.0145 to estimated $1.71 excluding equity market impacts.
• Post the impairment, the resulting portfolio mix between listed equity exposure and private credit exposure is 79% and 21% respectively of NTA.
5
Recent Credit Impairment Impact on NTA
For
per
sona
l use
onl
y

TGF NTA vs Share Price Performance
Key Details (as at 31 May 2020)
ASX Code TGF
Listing Share Price $2.50
Share Price $1.27
Shares on Issue 62.72 million
Market Capitalisation $79.91 million
Listing Date 12 October 2018
NTA Per Share (as at 31 May 2020)
NTA Pre-Tax $1.8455
NTA Post-Tax $2.0145
Net Performance (Post-Tax) to 31 May 2020
1 Month 0.47%
Financial YTD -16.25%
Total Return Since Inception -19.42%Source: ASX, Citco Fund Services. Past performance is not an indicator of future performance.
6
Monthly NTA Monthly Performance Since Listing
Jan Feb Mar Apr May Jun Jul Aug Sep Oct Nov Dec YTD
-0.07% -0.36% -0.71% -1.14%
0.16% -0.44% -0.16% 0.25% -3.24% 0.78% -0.52% -1.93% -0.54% 0.60% 0.79% 3.67% -0.72%
-7.68% -7.62% -9.48% 5.74% 0.47% -17.90%
-70%
-60%
-50%
-40%
-30%
-20%
-10%
0%
10%
$0.50
$1.00
$1.50
$2.00
$2.50
$3.00TGF NTA (Post Tax) vs Share Price Since Listing
Share Price NTA Premium / Discount
For
per
sona
l use
onl
y

Current Portfolio Exposures
Source: Tribeca Global Natural Resources Ltd
7
Source: Tribeca Global Natural Resources Ltd
Source: Tribeca Global Natural Resources Ltd
Current Net Exposures by Sector (as at 12 June 2020)
Net and Gross Exposures (inc. Credit)
-5% 0% 5% 10% 15% 20% 25%
Base Metals
Battery Metals
Bulk Commodities
Private Credit
Diversifed Mining
Oil & Gas
Precious Metals
Services
Soft Commodities
Uranium
21%
79%
Private Credit
Listed Equities
Exposure Allocation by Strategy
0%
20%
40%
60%
80%
100%
120%
140%Gross Exposure
Net Exposure
For
per
sona
l use
onl
y

Market Environment and Portfolio Outlook
For
per
sona
l use
onl
y

Commodities: Fundamentals, Macro and Positioning are Supportive
9
• As foreshadowed in the March investor update, the Chinese economy has quickly returned to “normal”
output levels across a broad range of economic and leading indicators.
• Despite the rest of world falling into material negative growth in 2Q, the commodity complex setup looks
positive for the second half of 2020.
• Chinese demand for most commodities has snapped back and in the case of copper, oil and steel is now
showing year-on-year growth despite the January and February shutdown.
• At the same time Chinese demand has improved, global supply disruptions across most major
commodities has led to inventory declines which has supported prices.
• The outlook in coming months is supportive with further inventory declines and Chinese credit growth to
underpin further commodity price hikes.
• Positioning within the commodity complex is supportive with mainly short to neutral investor interest and
material runway for investors to go long.
• As is often the case, soft commodities have lagged hard rock commodities and energy in the early stages
of this recovery and should outperform in coming months.
For
per
sona
l use
onl
y

China V-Shaped Recovery: Normalization of Key Leading Indicators
10
Daily property sales have now risen back to close to flat y/y levels Power-plant coal consumption pointed to normal levels
Retail vehicle sales have picked up sequentially and now back into y/y growth Congestion index across major China cities suggests return to normality
For
per
sona
l use
onl
y

Material Covid-19 Related Supply Issues in South America and Africa
11
Source: Bloomberg, Citi Research
For
per
sona
l use
onl
y

Strong Chinese Demand Driving Inventory Draws
12
0
10
20
30
40
50
60
Copper
-cath
ode &
pro
du
cts
Irone o
re
Cru
de o
il
Refin
ed
pro
du
cts
So
ybeans
Ste
el pro
ducts
Natu
ral g
as
Ag
ricultura
lp
rod
ucts
y/y
gro
wth
(%
)
May China Commodity Trade Data Growth Y/Y (Imports)
Source: China Customs
Iron-ore port stock draws started to emerge again from mid-April
90
100
110
120
130
140
150
160
170
Jan Feb Mar Apr May Jun Jul
China port iron ore stocks, Mt
2016 2017 2018 2019 2020
Sources: Deutsche Bank, WIND
Steel stocks were at record levels but have turned lower over the past six weeks
7
9
11
13
15
17
19
21
23
25
27
Jan Feb Mar Apr May Jun Jul
China trader steel stocks, Mt
2016 2017 2018 2019 2020
300
400
500
600
700
800
900
1000
1100
Jan Feb Mar Apr May Jun Jul
Thousands
China SHFE + bonded stocks, kt copper cathode
2016 2017 2018 2019 2020
Copper inventories continue to trend lower, multi-year lows onshore
Sources: Deutsche Bank, WIND Sources: Deutsche Bank, WIND
For
per
sona
l use
onl
y

China Credit Impulse Underpins Q3 Demand
13
China Credit Impulse Pointing to Very Strong Copper Use Consumption
Source: Bloomberg, Citi Research
Historical relationships between the credit
impulse (credit growth) and copper end use
demand growth point to very strong copper
consumption growth (>10% y/y) over the
next 3-6 months.
Money Supply Growth hit >2-year highs in
May of ~6.8%
For
per
sona
l use
onl
y

Positioning Remains Supportive, Distorted by WTI
14
Managed Money Net Positioning
Positioning Across Natgas, WTI and Copper
Brent WTI Spread
Source: Vanda Research
Source: Vanda Research
Source: Vanda Research
For
per
sona
l use
onl
y

TGF Portfolio - Private Credit Exposure Update
For
per
sona
l use
onl
y

16
Impairment of Credit Exposure to Paringa Group (ASX:PNL)
[1] Book Value based on Hartshorne accounts[2] Contract Value is based on Average Selling price of US$43.25 and Current Spot price of US$32 per tonne
• TGF impaired the Company’s exposure to Paringa Resources by ~80% on June 9th
• The revised valuation of this exposure has been endorsed by the Company’s independent valuation agent.
• This impairment implies underlying valuations for the assets (Property, Plant & Equipment, and Sales Contracts)
over which the Lenders hold security in excess of 75% below stated book value¹ or spot value (as appropriate)².
• Lockdowns associated with the COVID-19 crisis and other external factors have impeded efforts to realise the
security that supports this Loan, and the sales process will be ongoing.
• The outcome for the Loan is dependent on several factors including court approval and TGF will update the market
• TGF’s exposure to Paringa is ~6% of total TGF NTA
For
per
sona
l use
onl
y

Paringa Resources Ltd (~6% Weight)
17
Operational Update • Coal quality and specification continues to meet customer
requirements.
• Recent operating performance for the first mining unit has
been outperforming historical performance.
Valuation
Considerations
• Paringa raised US$140m for developing the Buck Creek
Mine Complex.
• The Poplar Grove Mine is fully permitted to produce 2.8Mtpa.
• As at 30 September 2019 the carry value was US$123m.
• Over 4Mt contracted at pricing above spot and forward curve.
• Refer to 9 June TGF announcement for further information.
United States
Loan Overview • TGF is a lender in the US$40m senior secured debt facility
to a wholly owned US subsidiary of listed thermal coal
company, Paringa Resources Limited for an amount of
US$14.15m.
• Coupon 15% p.a., with default rate increasing to 17% p.a.
Chapter 11
Overview
• On 21st February 2020, Paringa’s US subsidiaries filed for
Chapter 11 Bankruptcy protection in the Western District of
Kentucky.
• A court supervised sales process is being conducted with
set milestones to maximise value of the estate.
• Paringa are being advised by FTI Consulting, Squire
Patton Boggs and Parella Weinberg.
• Debtor in possession finance of up to US$7.65m to fund
costs of operations and sales costs though to completion
(TGF not participating).For
per
sona
l use
onl
y

18
Unfortunate Timing for Sales Process Amid Significant Headwinds for the Sector
Coal Consumption Fell to 5-year lows Gas Prices Hit 12 Month Lows Exports Price Fell >20%
0
2
4
6
8
10
12
Dec 19 Jan 20 Feb 20 Mar 20 Apr 20 May 20 Jun 20
Last
Price (
$)
Alliance Resources (ARLP US) YTD
0
2
4
6
8
10
12
Dec 19 Jan 20 Feb 20 Mar 20 Apr 20 May 20 Jun 20
Last
Price (
$)
Peabody Energy (BTU US) YTD
1
1.5
2
2.5
3
Jun 19 Aug 19 Oct 19 Dec 19 Feb 20 Apr 20
Last
Price (
$)
Henry Hub Gas Price 12m
0
1000
2000
3000
4000
5000
6000
Jun 15 Jun 16 Jun 17 Jun 18 Jun 19
Mid
Price (
$ 0
00's
)
US Power Generation from Coal
50
52
54
56
58
60
62
64
66
68
Jan 20 Feb 20 Mar 20 Apr 20 May 20 Jun 20
Mid
Price (
$)
API2
Feb-May US
thermal coal
pricing and
consumption
smashed due to
Covid-19
Sector
valuations
fell to
decade
lows
For
per
sona
l use
onl
y

19
Resulting TGF Credit Exposure
• Private credit represents ~21% of TGF’s NTA of which Paringa is ~6%.
• Cash within the private credit portion of the portfolio is ~7% TGF NTA.
• Other Private Credit investments account for ~8% of NTA.
• There are no other investments that are under valuation review.
• Despite the issues with Paringa we still see opportunity in the sector.
• Important to note that percentage of exposure to private credit fluctuates with the performance of the
listed equities portfolio.
For
per
sona
l use
onl
y
TGF Portfolio – Listed Equity Exposure Update
For
per
sona
l use
onl
y

21
Listed Equity Overview
• Listed equities currently accounts for ~79% of the Company’s NTA
• The largest net exposures by commodity are: ~22% base metals, ~20% precious metals, ~16% uranium
• These have been three of the four central investment themes within the portfolio over the last year.
• The largest portfolio change year to date has been the disposal of oil tanker stocks during April. This was in
response to a combination of share price performance and expectation of lower oil contango and storage costs.
• The company has added to its precious metals exposure during March and April
• Oil & gas and services companies have been the largest detractor year to date. While the sector has bounced, we
have not added to our exposure which currently sits at~3%
For
per
sona
l use
onl
y

• Top 3 single stock position at ~7% of the portfolio
• Has been material underperformer in recent years despite owning Tier1
assets across the base materials and steel making coal sector
• Main commodity exposures of copper, zinc and coking coal should be
well supported over the second half of year
• Tribeca launched a public campaign in April that suggested a number of
portfolio improvements that would help realise the full valuation of Teck’s
assets
• Our valuation analysis suggests a range of $17 to $46 per share versus
the current ~$14 share price
22
Teck Resources (~7% Weight)
Teck Remains Significantly Undervalued on Multiple Measures
Valuation Method Valuation (C$)
Method 1: EV to EBITDA Multiple (using historical average
multiple of Teck)17.01
Method 2: DCF (using consensus) 28.70
Method 3: Bottom up of separate transactions 46.44
0
5
10
15
20
25
31-Dec-19 31-Jan-20 29-Feb-20 31-Mar-20 30-Apr-20 31-May-20
Teck Resources B - YTD Share Price (CAD)
For
per
sona
l use
onl
y

23
Nickel Mines (~5% Weight)
• Nickel Mines is now the largest pure play Nickel producer on the ASX
• Right partner in Tsingshan, the world’s largest stainless steel producer
and significant nickel consumer
• Production has been largely unaffected by Covid-19 and cash costs
remain in bottom quartile of global producers
• Nickel market has tightened in recent weeks but price remains well
below 2019 highs, undemanding valuation supports 100% upside to
current share price
• Recent battery technology announcements from China and Tesla
confirm Nickel will be a major beneficiary of electricfication of the auto
industry
Stainless Production Facilities in Tsingshan Industrial Park
0.2
0.3
0.4
0.5
0.6
0.7
0.8
Dec 19 Jan 20 Feb 20 Mar 20 Apr 20 May 20 Jun 20
Nickel Mines Share Price (AUD)
For
per
sona
l use
onl
y
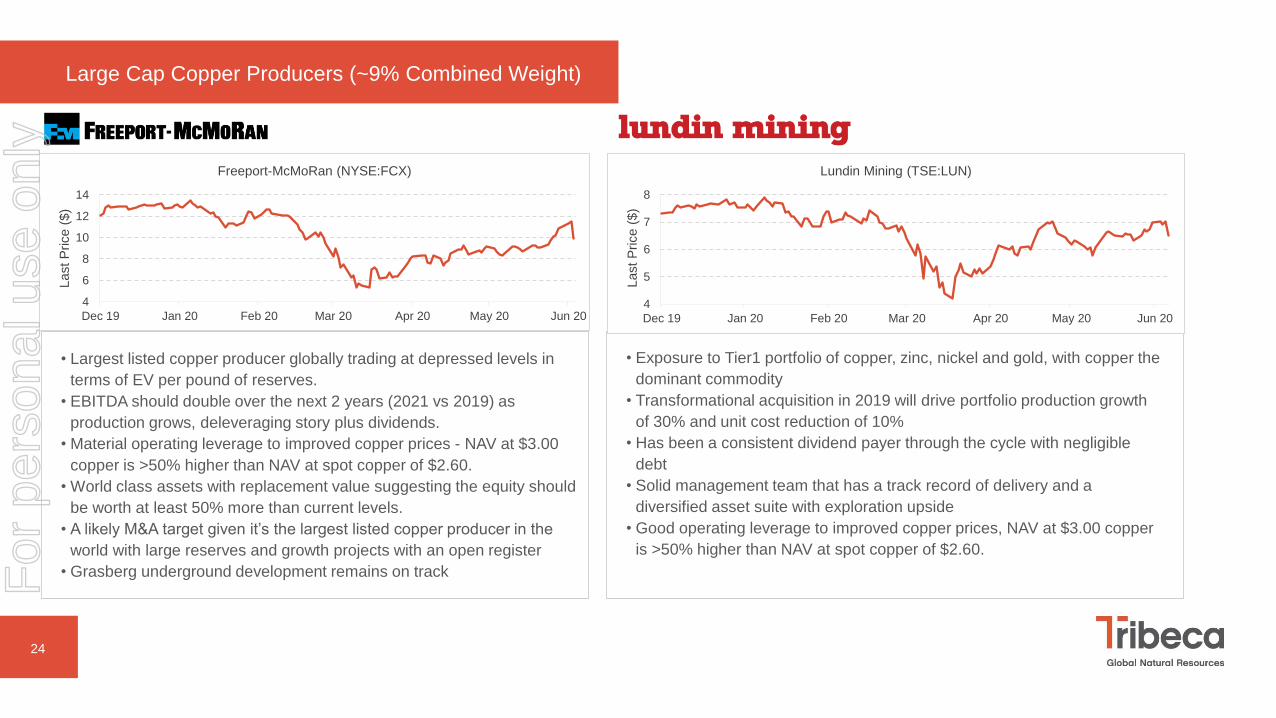
• Exposure to Tier1 portfolio of copper, zinc, nickel and gold, with copper the
dominant commodity
• Transformational acquisition in 2019 will drive portfolio production growth
of 30% and unit cost reduction of 10%
• Has been a consistent dividend payer through the cycle with negligible
debt
• Solid management team that has a track record of delivery and a
diversified asset suite with exploration upside
• Good operating leverage to improved copper prices, NAV at $3.00 copper
is >50% higher than NAV at spot copper of $2.60.
24
Large Cap Copper Producers (~9% Combined Weight)
• Largest listed copper producer globally trading at depressed levels in
terms of EV per pound of reserves.
• EBITDA should double over the next 2 years (2021 vs 2019) as
production grows, deleveraging story plus dividends.
• Material operating leverage to improved copper prices - NAV at $3.00
copper is >50% higher than NAV at spot copper of $2.60.
• World class assets with replacement value suggesting the equity should
be worth at least 50% more than current levels.
• A likely M&A target given it’s the largest listed copper producer in the
world with large reserves and growth projects with an open register
• Grasberg underground development remains on track
4
5
6
7
8
Dec 19 Jan 20 Feb 20 Mar 20 Apr 20 May 20 Jun 20
Last
Price (
$)
Lundin Mining (TSE:LUN)
4
6
8
10
12
14
Dec 19 Jan 20 Feb 20 Mar 20 Apr 20 May 20 Jun 20
Last
Price (
$)
Freeport-McMoRan (NYSE:FCX)
For
per
sona
l use
onl
y

25
Precious Metals: (~20% Weight)
• Federal Reserve comments last week supportive for Gold with interest rates
likely to be near zero through to 2022
• The number of countries that have negative real rates is increasing which
means gold is cheaper to hedge equity risk than government treasuries
• The total amount of negative yielding corporate debt also continues to
increase
• Elevated geopolitical risk and tensions such as trade wars and potential 2nd
wave of Covid-19 will support safe haven assets like gold
• Technically the gold price has held US$1700 per ounce level in recent weeks
and is now poised for move towards US$2000 per ounce
Structural Tailwinds for Gold in All Currencies
Basket Features
• Our basket contains a mix of AUD, CAD and USD gold earners
• Thematic of strong production growth and unit price declines
• Generally stocks in the basket have long life assets and reserves
• Strong free cash flow generation and dividend growth potential
US FED balance sheet expected to more than double 2008 levels as % of
GDP
Source: Morgan StanleyFor
per
sona
l use
onl
y

Uranium: (~16% Weight)
26
Portfolio Allocation
Spot Price Producers Developers
15
20
25
30
35
40
Apr-15 Oct-15 Apr-16 Oct-16 Apr-17 Oct-17 Apr-18 Oct-18 Apr-19 Oct-19 Apr-20U
SD
/lb
Jan 2017KAP 10%
production
curtailment
Nov 2017CCO suspends
McArthur River
Dec 2017KAP cuts 20%
production over 3
years
Apr 2018S232 Uranium
Dec 2019USNFWG report
lodged
Jan 2020COVID-19
Source: Tribeca Investment Partners, Bloomberg
Apr 2020KAP 10.4m lb
COVID-19 loss
Uranium 5-year Spot Price
For
per
sona
l use
onl
y

27
Corporate Update
• New Equity Partners
Key members of the Global Natural Resources Investment Team, Michael Orphanides (Analyst, Metals & Mining) and Guy
Keller (Head of Commodities Trading) admitted as equity partners.
• Corporate Buy-Back Update
On-Market Share Buy-Back Program was announced on 26 February 2020. Buy-Back Program remains ongoing (refer to
latest Appendix 3E lodgement). Follows on market buying from board and investment manager.
• New Hire –Todd Warren
• Todd joins the Tribeca Team following 22 years with Colonial First State Asset Management (CFSAM), including 6
years in London. Todd is an equity partner and will be the head of research.
• Most recently Head of Global Resources at CFSAM leading a team managing in excess of $3bn while serving as
portfolio manager for the CFS Wholesale Global Resources Fund as well as other global resources long-only
mandates and long-short portfolios.
* as at 11 June 2020
For
per
sona
l use
onl
y

Investor Relations
Email: [email protected]
Web: https://tribecaip.com/lic
Singapore
Tribeca Investment Partners Pte Ltd
#16-01 Singapore Land Tower
50 Raffles Place, Singapore 048623
Tel: +65 6320 7711
Sydney
Tribeca Investment Partners Pty Ltd
Level 23, 1 O’Connell Street
Sydney NSW 2000Tel: +61 2 9640 2600
28
For
per
sona
l use
onl
y