investor update - s26.q4cdn.com
TRANSCRIPT

Investor Update
AUGUST 2021
SINGLE TENANT RETAIL PROPERTY REIT WITH
32 CONSECUTIVE ANNUAL DIVIDEND INCREASES

Safe Harbor
(All data as of June 30, 2021)
This presentation contains certain statements that are the Company’s and
Management’s hopes, intentions, beliefs, expectations, or projections of the future and
might be considered to be forward-looking statements under Federal Securities laws.
Prospective investors are cautioned that any such forward-looking statements are not
guarantees of future performance, and involve risks and uncertainties. The Company’s
actual future results may differ significantly from the matters discussed in these forward-
looking statements, and we may not release revisions to these forward-looking
statements to reflect changes after we’ve made the statements. Factors and risks that
could cause actual results to differ materially from expectations are disclosed from time
to time in greater detail in the company’s filings with the SEC including, but not limited
to, the Company’s report on Form 10-K and Form 10-Q, as well as company press
releases.
2

3

4
NNN’s Unique Long-Term Strategy
Consistent Predictable
Earnings Growth with Low Volatility
Strong Investment Grade Balance Sheet
Elite Level Long-Term Total Returns

5
Strong Investment Grade Balance Sheet
Long-Term Track Record of Success
Second Quarter Highlights
Low Risk Strategy Generates Consistent Growth

Summary – Attributes, Advantages & Risk Mitigation
6
High-quality portfolio produces consistent results
High occupancy through cycle
Strong lease renewal rates with very little capital expenditure (not buying-up rent)
Long-term, net leases adds stability to operating results
Quality comes from sustainable rents (market rent is barometer)
Balance sheet conservatism
In place long before 2008-09 and 2020 (no dilutive equity issuances needed)
Below-average leverage and strong liquidity to weather all environments
Unencumbered portfolio
No reliance on short-term debt to drive per share results
Fixed-rate debt focused to mitigate rising rate risks
Existing scale provides
High diversification (3,100+ properties)
Top exposure to every single-tenant retail acquisition prospect in sector
Low cost of capital relative to competitors
Indicators of competitive advantage
Equity multiple, credit spreads, dividend yield, etc.
Institutional ownership
Track record of annual dividend increases (32 years)

Summary – Attributes, Advantages & Risk Mitigation
7
Proven, tenured management team with domain expertise
Top five executives – average NNN tenure 20 years (range 16-28 years)
Next eight SVPs – average NNN tenure 19 years (range 12-29 years)
Sustainable model
Projections – no heroic assumptions (acquisitions volume, debt tenor, capital pricing, etc.)
Managed market expectations – not promising more than delivered in the past
Market cycle tested over many years
Focused investment strategy (single-tenant retail) – no strategy drift into multiple property types
Operating results are consistent and predictable
Balance sheet never under stress
Management manages for the long-term
Above average total returns over 15-, 20-, and 25-years with below average risk profile

Consistent and Simple Strategy
8
Focus on single-tenant net lease retail properties
Sustain high occupancy and maximize value of existing real estate assets
Maintain fully diversified portfolio
Grow through internal portfolio growth and well underwritten acquisitions
Utilize asset sales to manage risk, enhance value and partially finance new property
acquisitions
Preserve conservative balance sheet and financial flexibility through access to
multiple sources of capital and unsecured debt
Grow per share results mid-single digit percentage annually on a relatively leverage
neutral basis
Produce safe and growing dividends – 32 consecutive annual dividend increases

9
NNN’s Long-Term Retail Net Lease Strategy
Creates a Solid Foundation of Highly Predictable
Operating Income
NNN’s Disciplined Acquisition Approach
Generates Steady Earnings Growth Through
Higher Yields With Less Risk Than Development
and Other Acquisition Approaches
Strategy Generated 3.1% Average Annual
Core FFO Per Share Growth Since 2015

Retail Net Lease Strategy Generatesa Reliable Income Stream with Low Volatility
10
Well-selected retail tenants provide stronger performance through various economic cycles than office, industrial or other tenant types.
Main street locations provide strong market for replacement tenants and rent growth
Lower earnings volatility from higher occupancy (18-year low of 96.4%)
Retail properties more likely to renew lease at end of initial term
10-20-year initial lease terms; 10.6-year weighted average remaining lease term
Only 8.5% of leases expire through YE 2023
Tenants responsible for operating expenses, taxes and capital expenditures – no CAM leakage
No anchor or co-tenancy issues for tenants to leverage into reduced rent
High Quality, Well-Diversified Portfolio
$8.7 billion total assets (gross book basis)
3,173 properties (32.7 million SF) in 48 states
370+ national and regional retail tenants
Top 25 tenants (57% of rent) average 1,055 stores each

11
From 2003 – Q2 2021, NNN’s occupancy never fell below 96.4% while the REIT industry
average never rose above 93.7%.
Source: SNL Financial *REIT Industry Average as of Q1 2021
85%
90%
95%
100%
2003 2004 2005 2006 2007 2008 2009 2010 2011 2012 2013 2014 2015 2016 2017 2018 2019 2020 Q22021
NNN REIT Industry (Excludes Hotels & Health Care)
97.0%
98.3% 98.2% 98.3%
96.7%96.4%
96.9%
97.9% 98.2%
98.6%
99.1% 99.0% 99.1%
98.2%
99.0%
92.1%
93.0%
93.5% 93.5%
92.8%
92.0%
95.0%90.1%
90.8%90.7%
92.0%
92.7% 92.5%
93.3% 93.5%93.7% 93.6%
97.4% 97.4%98.0%
NNN Avg.
98.5 %
87.1%
98.3 %
*86.9%
NNN’s Strategy Results in Higher Occupancy and Less Volatility

NNN’s Acquisition Approach is Unique Because It’s More Difficult
12
Acquisition quality over quantity requires selectivity, discipline and patience:
Small transactions in areas of historical expertise (retail) rather than large portfolio transactions provides higher risk adjusted returns
Retail – NNN’s historical expertise generates higher and more consistent operating results vs. other net lease and non-net lease sectors
Approximately 25 relationships with managements of strong growing retail concepts
Underwriting focuses on alternative uses upon future rollover and current tenant strength
Multiple credit upgrades after NNN’s acquisition – 7-Eleven, Sunoco (Susser),
Bloomin’ Brands, Lowes (Orchard Supply), Advance Auto (Carquest), Darden
(Cheddar’s), Camping World
Lease terms and conditions negotiated based on unique aspects of location and tenant’s business and credit. Tenant “self selection”- unlikely to sign a long-term lease on questionable store

NNN’s Unique Acquisition ApproachGenerates Strong FFO Growth
13
Retail net lease market is very large yet has less buyer competition than other property types because properties are smaller
NNN’s more focused relationship based acquisition approach is more difficult and time consuming further resulting in less buyer competition
Less buyer competition results in higher initial cap rates and built-in rent growth (see page 15)
Careful targeting and underwriting of management and the future prospects of NNN’s retail tenants is supported by:
Consistently high portfolio occupancy; and
Multiple credit upgrades realized by relationship tenants
Consistently high portfolio occupancy results in less earnings volatility
All of the above generate greater per share accretion from lower acquisition volumes and allows NNN to continue to acquire accretively, despite cap rate compression and increased interest rates

14
2007 – 2021 Acquisitions Volumein $ Millions by Source
$340
$122
$17
$220 $194 $293 $333
$109
$249 $188
$106 $104
$22 $7
$357
$233
$36
$221
$552 $513 $337 $285 $617 $598 $567 $610 $648
$158 $202
$0
$50
$100
$150
$200
$250
$300
$350
$400
$450
$500
$550
$600
$650
$700
$750
$800
$850
$900
2007 2008 2009 2010 2011 2012 2013 2014 2015 2016 2017 2018 2019 2020 2021
Relationship @ 7.6% Average Cap Rate ($5,934 million = 72%)
Market / Auction @ 7.5% Average Cap Rate ($2,304 million = 28%)
$238
$772
$707
$630 $618
$726$755
$716$752
$847
$697
$355
$180$209

15
NNN’s Acquisition Volumes vs. Other REIT Property Types
$0
$100
$200
$300
$400
$500
$600
$700
$800
$900
2005 2006 2007 2008 2009 2010 2011 2012 2013 2014 2015 2016 2017 2018 2019 2020 2021
(Mill
ion
s)
9.5%
8.8%
8.4%
9.0%
9.4%
9.5%
8.4%
8.3%
7.8%7.5%
7.2%
6.9%
6.9%
6.8%
6.9%
6.5%6.4%
Historical Acquisition Volume at Weighted Average Initial Cash Cap Rates
NNN has consistently generated strong acquisition volumes at
significantly higher cap rates than other REIT property types

16
Strong Investment Grade Balance Sheet
Long-Term Track Record of Success
Second Quarter Highlights
Low Risk Strategy Generates Consistent Growth

Durable Capital Structure
17
Long-Term Balance Sheet Management
Objectives
Avoid financing risk (never need capital)
Maintain access to capital & flexibility to take advantage of market
opportunities and weather economic storms
Reduce cost of capital – competitive advantage
Longer duration capital reduces re-finance risks (vs. shorter duration capital)
Unencumbered properties maximizes flexibility (leasing, selling, expanding,
etc.) and lowers debt service burden
Maintain strong investment-grade debt ratings
Stagger debt maturities
Maintain bank line capacity to fund near-term debt maturities and acquisitions
Asset dispositions are a source of capital – sector leading expertise
In making capital allocation decisions, fully burden the cost of equity (expected
return) to limit dilution and maximize per share accretion

Strong Investment Grade Balance Sheet –Risk Management is a Core Competency
18
Investment-grade debt rating (BBB+ / Baa1) supported by industry leading leverage ratios
99.7% of assets unencumbered - only $11.0 million of secured debt
Well-laddered debt maturities
$1.1 billion unsecured bank credit line (accordion to $2.0 billion)
No outstanding balance as of 6/30/21 ($249 million cash balance at 06/30/21)
Matures June 2025, plus two, six-month extensions at NNN’s option
Priced at LIBOR + 77.5 bps
Weighted average outstanding balance past seven years under $80 million
Raised $2.4 million of common equity and generated $40.4 million of property disposition proceeds in first half 2021
March 2021 issued $450 million of unsecured notes due 2051 at 3.50% effective rate
March 2021 repaid $350 million of unsecured notes due 2023 at 3.30% effective rate

19
Conservative Balance Sheet Management
(As of June 30, 2021 - total gross book assets)
Secured Debt - $11.0 million
Unsecured Debt - $3,049.7 million*wtd. avg. maturity 13.0 yrs; wtd. avg. effective interest rate 3.7%
Preferred Equity - $345.0 million
Common Equity - $5,330.6 million
Total Capitalization: $8.7 billion (gross book)
Interest coverage ratio: 4.7x
Fixed-Charge coverage ratio: 4.2x
Unsecured
Debt
34.9%
Preferred
Equity
4.0%Common
Equity
61.0%
Secured
Debt
0.1%

20
Credit Metrics Summary
2016 2017 2018 2019 2020
June
2021
Net debt / Total assets (gross book) 30.2% 35.3% 34.6% 35.3% 34.4% 35.0%
Net debt + preferred / Total assets (gross book) 43.9% 44.0% 42.6% 39.3% 38.4% 39.0%
Net Debt / EBITDA (last four quarters) 4.3 4.9 4.8 4.9 5.0 5.0
EBITDA / Interest expense (cash) 4.8 4.7 4.8 5.0 4.6 4.7
EBITDA / Fixed charges (cash) 3.4 3.5 3.7 4.0 4.0 4.2
Unencumbered assets / Total assets (gross book) 99.7% 99.7% 99.7% 99.7% 99.7% 99.7%
Bank line weighted average usage (millions) 70$ 98$ 122$ 24$ 19$ -$
Bank line usage (millions) (period end) -$ 121$ -$ 134$ -$ -$
Bank line availability (millions) (period end) 650$ 779$ 900$ 766$ 900$ 1,100$
Capital Raised (millions):
Common equity, net 274$ 253$ 341$ 525$ 124$ 2$
Preferred equity, net 334$ (288)$ -$ (288)$ -$ -$
Unsecured notes, gross 350$ 400$ 700$ -$ 700$ 450$
Secured debt, gross -$ -$ -$ -$ -$ -$
Property dispositions, net proceeds 103$ 97$ 148$ 126$ 54$ 40$
Retained AFFO (after all dividends) 91$ 102$ 116$ 129$ 75$ 86$

21
Well-Laddered Debt Maturities
NNN’s Low Leverage Balance Sheet Strategy is Enhanced by its Well-Laddered Debt Maturities
$-
$50
$100
$150
$200
$250
$300
$350
$400
$450
$500
2021 2022 2023 2024 2025 2026 2027 2028 2030 2048 2050 2051
Mill
ion
s
3.9%
4.0%
3.6%
5.2 %
4.8% 3.1%
2.5%
5.2%5.2%
3.5% 4.3%
3.5%
Weighted average debt maturity of 13.0 years

22
Credit Facility and Notes Covenants
The following is a summary of key financial covenants for the company's unsecured credit facility and notes,
as defined and calculated per the terms of the facility's credit agreement and the notes' governing
documents, respectively, which are included in the company's filings with the Commission. These
calculations, which are not based on U.S. GAAP measurements, are presented to investors to show that as
of June 30, 2021, the company believes it is in compliance with the covenants.
Unsecured Credit Facility Key Covenants Required June 30, 2021
Maximum leverage ratio < 0.60 0.34
Minimum fixed charge coverage ratio > 1.50 4.27
Maximum secured indebtedness ratio < 0.40 0.001
Unencumbered asset value ratio > 1.67 2.96
Unencumbered interest ratio > 1.75 4.93
Unsecured Notes Key Covenants Required June 30, 2021
Limitation on incurrence of total debt ≤ 60% 36.5%
Limitation on incurrence of secured debt ≤ 40% 0.1%
Debt service coverage ratio ≥ 1.50 4.43
Maintenance of total unencumbered assets ≥ 150% 274%

23
Strong Investment Grade Balance Sheet
Long-Term Track Record of Success
Second Quarter Highlights
Low Risk Strategy Generates Consistent Growth
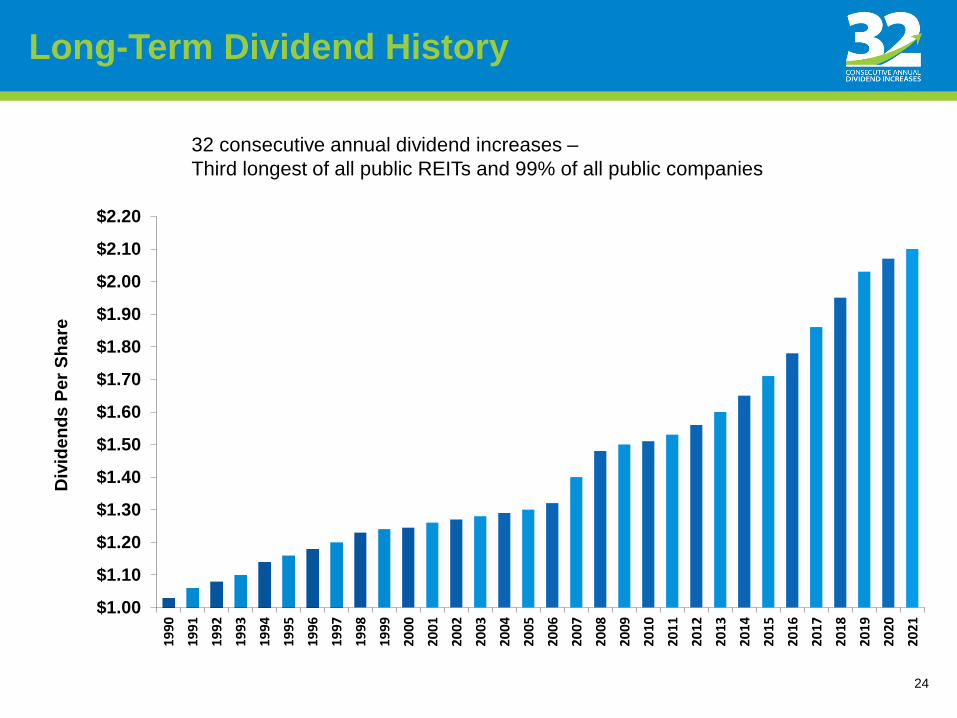
Long-Term Dividend History
24
$1.00
$1.10
$1.20
$1.30
$1.40
$1.50
$1.60
$1.70
$1.80
$1.90
$2.00
$2.10
$2.20
19
90
19
91
19
92
199
3
19
94
19
95
19
96
19
97
19
98
19
99
20
00
20
01
20
02
20
03
20
04
20
05
20
06
20
07
20
08
20
09
20
10
20
11
201
2
20
13
20
14
20
15
20
16
20
17
20
18
20
19
20
20
20
21
Div
ide
nd
s P
er
Sh
are
32 consecutive annual dividend increases –
Third longest of all public REITs and 99% of all public companies

25
Strong Investment Grade Balance Sheet
Long-Term Track Record of Success
Second Quarter Highlights
Low Risk Strategy Generates Consistent Growth

Second Quarter Highlights
26
Dividend yield at June 30, 2021 of 4.4%
Maintained high level of occupancy at 98.3%
Invested $102.9 million in property investments @ average 6.7% cap rate (initial cash
yield)
Sold 15 properties for $22.9 million
Maintained dividend payout ratio of approximately 68% of AFFO
Maintained significant balance sheet capacity and liquidity
Ended the quarter with $249.6 million of cash, no amounts drawn on $1.1 billion bank line
and no debt maturities until 2024
As of July 28, 2021, collected approximately 99% of rent originally due for the quarter
ended June 30, 2021

COVID-19 Update
NNN successfully continuing operations
IT systems investment paying off; most working in office; no layoffs/furloughs
Retail tenants challenged given prolonged continuation of business closures
and social-distancing practices
As of July 28, 2021, collected approximately 99% of rent for the quarter ended
June 30, 2021
Conservative balance sheet management and strong liquidity
Ended Q2 2021 with $249.6 million of cash, no amounts drawn on bank credit
facility and no debt due until 2024
Quality of Properties
Good retail real estate locations; historically high occupancy
27

Collections by Line of Trade
28
The following table details NNN’s rent collections received as of July 28, 2021, excluding the repayment of
amounts previously deferred according to the rent deferral lease amendments, by NNN’s top 20 lines of trade:
% of Total
% of Rent Collected
Quarter Ended Month Ended
Top 20 Lines Of Trade Annual Base
Rent(2)
March 31, 2021(1)
June 30, 2021(2)
July 31, 2021(2)
1. Convenience stores 18.0 % 100.0 % 99.9 % 100.0 %
2. Automotive service 11.4 % 99.5 % 99.7 % 99.8 %
3. Restaurants – full service 9.9 % 91.3 % 93.9 % 93.9 %
4. Restaurants – limited service 9.2 % 99.9 % 99.7 % 99.7 %
5. Family entertainment centers 6.1 % 99.9 % 99.9 % 99.6 %
6. Health and fitness 5.2 % 94.3 % 99.3 % 100.0 %
7. Theaters 4.6 % 77.1 % 94.9 % 98.2 %
8. Recreational vehicle dealers, parts and
accessories
3.5 % 100.0 % 100.0 % 100.0 %
9. Equipment rental 3.2 % 100.0 % 100.0 % 100.0 %
10. Automotive parts 3.1 % 100.0 % 100.0 % 99.4 %
11. Home improvement 2.6 % 99.5 % 100.0 % 97.0 %
12. Wholesale clubs 2.5 % 100.0 % 100.0 % 100.0 %
13. Medical service providers 2.2 % 99.6 % 98.6 % 97.1 %
14. General merchandise 1.7 % 99.4 % 98.7 % 100.0 %
15. Furniture 1.6 % 99.2 % 99.5 % 100.0 %
16. Consumer electronics 1.6 % 100.0 % 100.0 % 100.0 %
17. Home furnishings 1.6 % 100.0 % 100.0 % 100.0 %
18. Travel plazas 1.5 % 100.0 % 100.0 % 100.0 %
19. Drug stores 1.4 % 100.0 % 100.0 % 100.0 %
20. Bank 1.3 % 100.0 % 100.0 % 100.0 %
Other 7.8 % 99.6 % 98.6 % 95.9 %
Total 100.0 % 97.7 % 98.9 % 98.8 %
As a percentage of annual base rent, which is the annualized base rent for all leases in place. (1) $684,283,000 as of March 31, 2021.
(2) $689,364,000 as of June 30, 2021.
% of Total
% of Rent Collected
Quarter Ended Month Ended
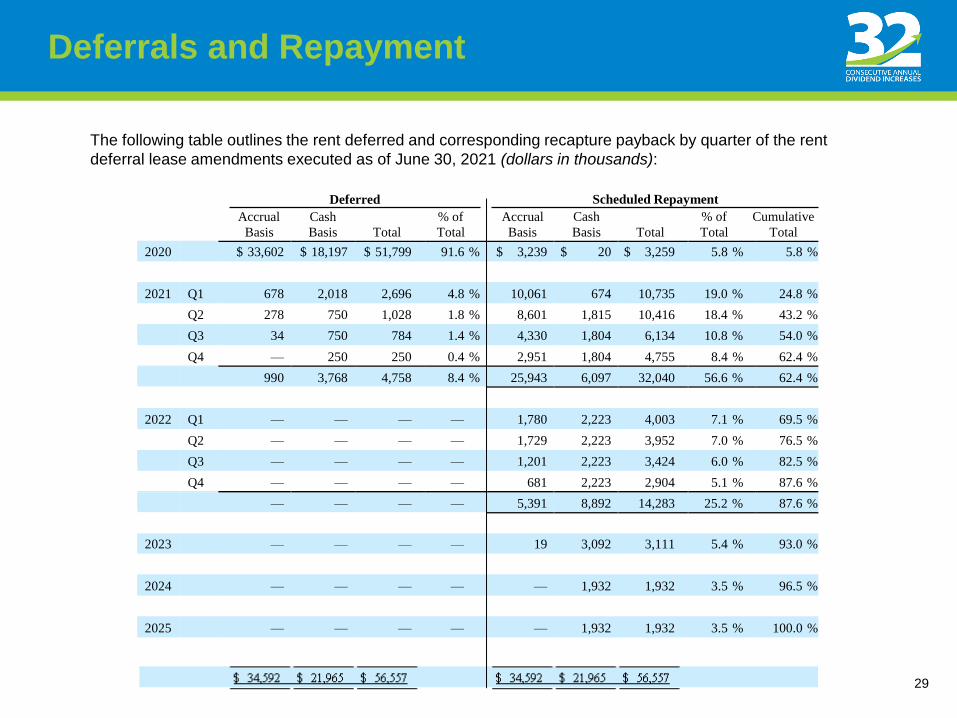
Deferrals and Repayment
29
The following table outlines the rent deferred and corresponding recapture payback by quarter of the rent
deferral lease amendments executed as of June 30, 2021 (dollars in thousands):
Deferred
Accrual Cash % of
Accrual
Scheduled Repayment
Cash % of Cumulative Basis Basis Total Total Basis Basis Total Total Total
2020 $ 33,602 $ 18,197 $ 51,799 91.6 % $ 3,239 $ 20 $ 3,259 5.8 % 5.8 %
2021 Q1 678 2,018 2,696 4.8 % 10,061 674 10,735 19.0 % 24.8 %
Q2 278 750 1,028 1.8 % 8,601 1,815 10,416 18.4 % 43.2 %
Q3 34 750 784 1.4 % 4,330 1,804 6,134 10.8 % 54.0 %
Q4 — 250 250 0.4 % 2,951 1,804 4,755 8.4 % 62.4 %
990 3,768 4,758 8.4 % 25,943 6,097 32,040 56.6 % 62.4 %
2022 Q1 — — — — 1,780 2,223 4,003 7.1 % 69.5 %
Q2 — — — — 1,729 2,223 3,952 7.0 % 76.5 %
Q3 — — — — 1,201 2,223 3,424 6.0 % 82.5 %
Q4 — — — — 681 2,223 2,904 5.1 % 87.6 %
— — — — 5,391 8,892 14,283 25.2 % 87.6 %
2023 — — — — 19 3,092 3,111 5.4 % 93.0 %
2024 — — — — — 1,932 1,932 3.5 % 96.5 %
2025 — — — — — 1,932 1,932 3.5 % 100.0 %

30
Appendix

NNN Attributes
31
Triple-net long-term leases
Small properties – typically $2 to $4 million investment size
High land value per asset
Net leases reduce volatility of returns – rent growth drops to bottom line
Large universe of investment opportunities
Fragmented non-institutional competition; NNN is a clear leader
Structured sale-leaseback acquisitions at great initial cap rates
Excellent capital recycling track record
Strong balance sheet with limited near-term maturities
Solid earnings profile with lower risk
32 consecutive years of increased annual dividends while reducing payout ratio
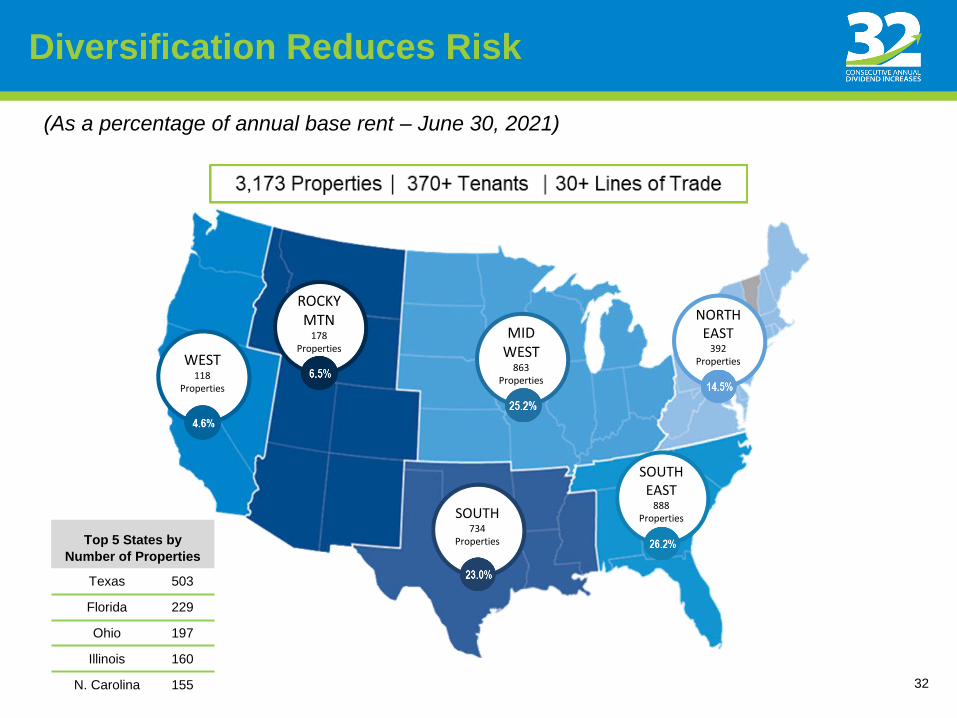
Diversification Reduces Risk
32
Top 5 States by
Number of Properties
Texas 503
Florida 229
Ohio 197
Illinois 160
N. Carolina 155
(As a percentage of annual base rent – June 30, 2021)
MID WEST
863Properties
WEST118
Properties
ROCKY MTN
178 Properties
NORTHEAST
392 Properties
SOUTH734
Properties
SOUTHEAST
888 Properties

33
Lease Expirations
(As a percentage of annual base rent – June 30, 2021)
0%
10%
20%
30%
40%
50%
60%
70%
2021
2022
2023
2024
2025
2026
2027
2028
2029
2030
The
rea
fte
r
Weighted average remaining lease term of 10.6 years
Only 8.5% of leases expire through 2023

Driving Per Share Growth -- Cost of Capital View Matters
Differing Views on the Cost of Equity in making Capital Allocation Decisions (all other variables the same)
NNN's View Other REITs' View
"Economic / Expected Return Cost of Equity" "Cash / Accounting Cost of Equity"
(inverse of FFO multiple driven)
Dividend yield 4.5%
Dividend per share growth 3.0 - 4.0%
FFO per share growth 3.0 - 5.0%
Weighting Cost Wtd Avg Weighting Cost Wtd Avg
Debt * 35% 2.20% 0.77% Debt * 35% 2.20% 0.77%
Preferred 5% 5.20% 0.26% Preferred 5% 5.20% 0.26%
Common 60% 8.00% 4.80% Common 60% 5.00% 3.00%
100.0% 5.83% 100.0% 4.03%
Reflects a focus on per share value creation Supports a focus on asset growth
Promotes selectivity Promotes lower return acquisitions
* Ten year, fixed rate debt only
34
Cost of Capital in Making Capital Allocation Decisions

23 Leases(95% of Prior)
19 Leases(107% of Prior)
22 Leases(87% of Prior)
31 Leases(101% of Prior)
16 Leases(79% of Prior)
39 Leases(95% of Prior)
39 Leases(87% of Prior)
32 Leases(101% of Prior)
40 Leases(100% of Pror)
139 Leases(101% of Prior)
46 Leases(103% of Prior))
58 Leases(97% of Prior)
81 Leases(104% of Prior)
76 Leases(100% of Prior)
66 Leases(87% of Prior)
$-
$500,000
$1,000,000
$1,500,000
$2,000,000
$2,500,000
$3,000,000
$- $1,000,000 $2,000,000 $3,000,000 $4,000,000 $5,000,000 $6,000,000 $7,000,000 $8,000,000 $9,000,000
$10,000,000 $11,000,000 $12,000,000 $13,000,000 $14,000,000 $15,000,000 $16,000,000 $17,000,000 $18,000,000 $19,000,000 $20,000,000 $21,000,000 $22,000,000 $23,000,000 $24,000,000 $25,000,000
2007 2008 2009 2010 2011 2012 2013 2014 2015 2016 2017 2018 2019 2020 2021
T.I
. /
Cap
ital E
xp
en
dit
ure
s
An
nu
al
Ren
t
Historical Lease Renewals (expirations within 18 months)
Prior Rent Renewal Rent T.I. / Capital Expenditures
35
Historical Lease Renewals
2007 through 2021:
84% of leases renewed – 727 leases out of 864 (199 tenants)
65% above prior rent, 24% below prior rent and 11% at prior rent
99% ($123.3 million) of prior rent ($126.7 million) – excluding 37 outliers, 101% of prior rent
$2.0 million of T.I./capital expenditures – not inclined to “buy” higher rent

36
Top 20 Lines of Trade
1. Convenience stores 18.0% 647 41 30 99.9%
2. Automotive service 11.4% 414 19 29 99.7%
3. Restaurants - full service 9.9% 426 77 38 93.9%
4. Restaurants - limited service 9.2% 568 56 34 99.7%
5. Family entertainment centers 6.1% 97 6 25 99.9%
6. Health and fitness 5.2% 33 2 17 99.3%
7. Theaters 4.6% 33 5 15 94.9%
8. RV dealers, parts and accessories 3.5% 38 1 20 100.0%
9. Equipment rental 3.2% 95 5 26 100.0%
10. Automotive parts 3.1% 155 6 33 100.0%
11. Home Improvement 2.6% 49 10 20 100.0%
12. Wholesale clubs 2.5% 11 1 6 100.0%
13. Medical service providers 2.2% 86 18 21 98.6%
14. General merchandise 1.7% 73 16 20 98.7%
15. Furniture 1.6% 44 14 20 99.5%
16. Consumer electronics 1.6% 17 2 14 100.0%
17. Home furnishings 1.6% 15 4 12 100.0%
18. Travel plazas 1.5% 25 4 6 100.0%
19. Drug stores 1.4% 32 4 16 100.0%
20. Bank 1.3% 57 5 9 100.0%
Other 8.2% 258 91 36 98.6%
Total 100.0% 3,173 98.9%
% Rent
Collections
Qtr. Ended
June 30, 2021(1)(2)
# of
Tenants
# of
StatesLine of Trade
% Base
Rent
# of
Properties
(As of June 30, 2021)
(1) Based on the annual base rent of $689,364,000, which is the annualized base rent for all leases in place as of June 30, 2021 (2) Rent collections received as of July 28, 2021, excluding repayment of amounts previously deferred according to rent deferral lease amendments

37
Top 20 Tenants
Properties % Base Rent
1. 7-Eleven 139 5.0%
2. Mister Car Wash 120 4.7%
3. Camping World 47 4.3%
4. LA Fitness 30 3.8%
5. GPM Investments (Convenience Stores) 153 3.3%
6. Flynn Restaurant Group (Taco Bell/Arby's) 204 3.2%
7. AMC Theatre 20 3.0%
8. Couche-Tard (Pantry) 83 2.7%
9. BJ's Wholesale Club 11 2.5%
10. Sunoco 59 2.2%
11. Mavis Tire Express Services 123 2.1%
12. Main Event 18 1.8%
13. Frisch's Restaurants 73 1.8%
14. Fikes (Convenience Stores) 56 1.6%
15. Chuck E. Cheese's 53 1.6%
16. Best Buy 16 1.5%
17. Bob Evans 106 1.5%
18. Life Time Fitness 3 1.4%
19. Dave & Buster's 11 1.4%
20. Ahern Rentals 35 1.4%
Tenant
(As of June 30, 2021)

38
Acquiring properties directly from tenants produces more efficient pricing and higher initial returns
NNN assesses discrete risks vs.
More risks/unknowns in value-add, development, or
Typical lower yielding real estate investment
Each deal is structured based on its unique characteristics:
Real estate attributes, tenant corporate credit analysis, asset (store) level data
NNN Acquisitions Approach has Multiple Advantages

39
NNN Approach to Net Lease Acquisitions
Real Estate
AttributesCorporate
Credit
Competitive positioning
Management team track
record / vision
Credit analysis / leverage
profile
Pending maturities
Use of transaction
proceeds
Fixed charge and rent
coverage
Property location
Underlying land value
Area demographics
Market rent / similar
transaction comparables
Location of competitors
Alternative use
Replacement cost analysis
Local market conditions
Parking
Access
Co-tenants
Visibility
Traffic counts
Age of improvements
Historical sales and
profitability
Sales & Profit trends
Revenue drivers and margins
Rent as a % of Sales
Corp. G & A allocation
Rent coverage
Comparison with similar
stores
Remaining lease term
Newest prototype
Capital markets
environment
Current conditions in
tenants’ industry /
market(s)
Local and national
economy
NNN cost of capital
Cap rate trends
Legislative risk
Transaction
Proceeds &
Terms
Asset-Level
Performance
Market
Conditions
Due Diligence and Determination of Proceeds & Terms
The chart to the right summarizes our areas of focus, which: a) determine our interest in a transaction, and b) drive our specific negotiation of the terms, rates and proceeds for each deal
This sale-leaseback approach to acquisitions produces multiple advantages for NNN versus many of our REIT peers, and particularly our shopping center / mall REIT competitors
Our ability to assess these discrete risks in a single-tenant, sale-leaseback transaction has allowed us to execute transactions with very efficient pricing, higher initial returns and more stable cash flows versus the higher and greater unknowns associated with: a) value-add investing, b) new construction / development transactions, and / or, c) lower-yielding, core retail investment strategies

40
NNN’s proven disposition platform strengthens portfolio quality and long-term earning by reinvesting at higher return rates
Highly productive proprietary www.nnn1031.com website enables property sales at premium retail pricing, at volumes far above other triple-net sellers:
Standardizes downloadable due diligence information and contracts
Technologically sophisticated but user friendly
Low cost to maintain
Since 2005, sold 710 properties generating net proceeds over $1.9 billion
Disposition expertise provides ability to sell properties:
That do not meet hold criteria
To better control tenant and line of trade concentrations
Making NNN a more attractive buyer
Enhances acquisitions returns via higher effective cap rate on retained properties
NNN’s Disposition Platform

350+ service hours annually
Great People in a Supportive Culture
41
• 3000+ online courses available to associates on NNNU
• Virtual conferences
• Professional webinars
• Cross training / job shadowing
Educational Seminars
• Cyber Security
• Women Talk Money & Financial Planning
• Vitality Health and Wellness
• Emotional Wellbeing
• Healthcare Consumerism
Learning & Development Community Engagement
Top fundraising team
for RMH virtual event
Proud to be a member of the 2021 GEI, committed to driving accountability
through data transparency.

42