investor views on european and us capital markets and how
TRANSCRIPT
Bridging the growth gapInvestor views on European and US capital markets and how they drive investment and economic growth
Association for Financial Markets in Europewww.afme.eu
Vasco da Gam
a Bridge, Lisbon, P
ortugal

This report was commissioned by AFME from The Boston Consulting Group (BCG). It has been written jointly by AFME and BCG.
Report qualifications/assumptions & limiting conditions
BCG was commissioned by AFME to support the production of this report.
Neither BCG nor AFME shall have any liability to any third party in respect of this report or any actions taken or decisions made as a consequence of the results, advice or recommendations set forth herein and you hereby waive any rights and claims you may have at any time against BCG or AFME with regards to this report, including the accuracy or completeness thereof, and review of this report shall be deemed agreement with and consideration for the foregoing.
This report does not represent legal advice, which can only be provided by legal counsel and for which you should seek advice of counsel. Similarly, this report does not represent tax or accounting advice and you should seek independent advice concerning these matters. The opinions expressed herein are valid only for the purpose stated herein and as of the date the report is published. Information furnished by others, upon which all or portions of this report are based, is believed to be reliable but has not been verified. No warranty is given as to the accuracy of such information. Public information and industry and statistical data are from sources BCG and AFME deem to be reliable; however, neither BCG nor AFME make any representation as to the accuracy or completeness of such information and have accepted the information without further verification.
The findings contained in this report may contain predictions based on current data and historical trends. Any such predictions are subject to inherent risks and uncertainties. In particular, actual results could be impacted by future events which cannot be predicted or controlled. BCG and AFME accept no responsibility for actual results or future events. This publication is intended to discuss general market activity, industry or sector trends or other broad-based economic, market or political conditions. It should not be construed as research. Any reference to a specific company or security is for illustrative purposes and does not constitute a recommendation to buy, sell, hold or directly invest in such company or its securities.
No responsibility is taken for changes in market conditions or laws or regulations and no obligation is assumed to revise this report to reflect changes, events or conditions, which occur subsequent to the date of publication of this report.
February 2015

Bridging the growth gapPage 1
Contents
Foreword 2
Introduction 3
Executive summary 5
Interview methodology 15
Interviewee firms 16
What should Europe do differently? 17
Better financing for SMEs 25
Increasing investment in long-term infrastructure projects 37
Raising the profile and use of Private Placements in Europe 47
Appendices 53

Foreword
Bridging the growth gapPage 2
Foreword
Europe’s economy is at a critical point. Seven years on from the financial crisis, economic growth remains muted, public debt in some countries is still stubbornly high and deflation threatens to prolong this period of stagnation. After years of economic uncertainty, we must look at new ways to deliver growth and jobs.
Against this background, AFME is publishing Bridging the growth gap – our new analysis of the differences between EU and US financing in the areas of SMEs, infrastructure and Private Placements. Researched and written by The Boston Consulting Group, it canvasses the views of some of the largest global investors (representing €9tn of assets under management) and supplements them with desk research.
The study reaches revealing conclusions. It shows how the fragmentation of Europe’s financial markets and relatively smaller size of aggregate investable assets act as a brake on growth when compared with the US. More than 20 years after the birth of the European Union, the institutional investors interviewed told us that issues such as differences between national regulations and tax rates were still holding back growth.
Our research also suggested that Europe is over-reliant on bank funding, and that Europe’s capital markets are significantly underdeveloped compared to the US. It estimates that Europe only has two-thirds of the investable assets in the US. In other words, it has approximately €30tn of external funding, against approximately €49tn in the US. Similarly, Europe has only approximately half as much equity capital: €10tn vs €19tn in the US.
Our findings are extremely topical at a time when the European Commission is proposing a Capital Markets Union (CMU) and has recently announced its €315bn European Fund for Strategic Investments (EFSI). AFME and its members fully support both initiatives. If well implemented, they will go some way towards addressing the challenges our study identifies.
AFME and our bank members are eager to help play our part in improving Europe’s financing gap. We have good insights into how financial markets fund growth. Our members’ corporate clients are Europe’s engines of growth and jobs, while their investor clients allocate investment capital, including risk capital around the globe.
For this reason, we plan to support the Commission’s drive to foster growth and employment. We will back the proposed CMU through specific actions to lift the proportion of funding provided by capital markets. We will also help to educate corporate issuers, investors and other stakeholders through publishing guides. Finally, we will help to promote a responsible equity risk culture; important for funding entrepreneurs, especially in high-growth sectors such as technology.
Working collaboratively, we all have a key part to play in helping support growth across the EU.
Simon Lewis Clare FrancisChief Executive, Managing Director,Association for Financial Head of GlobalMarkets in Europe Corporate Banking, Lloyds Banking Group

Introduction

Bridging the growth gapPage 4
Introduction
Introduction
In June 2013, AFME published Unlocking funding for European investment and growth,1 an industry survey of obstacles in Europe's funding markets, and potential solutions to them.
AFME’s report made several recommendations to help promote growth in Europe, with the emphasis on increasing the availability of funds to European small and medium-sized enterprises (SMEs), increasing the flexibility in how large and mid-sized companies access finance (including Private Placements), and making infrastructure investment more accessible to non-bank investors. The new European Commission has underlined its commitment to financing growth by identifying Capital Markets Union (CMU) as a priority initiative for the next five years.
Some of the obstacles found in our previous report appear to have eased. Issuance in the European high-yield market has grown and funding conditions for crisis-affected countries have improved, as have conditions for infrastructure lending and capital markets across the region.
But economic growth remains a major concern, and certain funding bottlenecks and inefficiencies remain. Despite having improved from 2012 levels, Europe’s economies have recently begun to stagnate once more. Europe grew by only 0.2% in 3Q14, after reporting no growth at all in 2Q14. This compares with 1.2% quarter-on-quarter growth in the US in 3Q14, following 1.1% growth in 2Q14. All of this begs the question: what, if anything, can Europe leverage from the US in terms of financing growth? There are opportunities for EU policymakers and market practitioners to draw on successful practice in the US capital markets to promote investment and growth.
We have set out to understand better key differences between the European and US capital markets. The two regions have economies of similar size, yet very different financial markets. We have sought to understand why investors are investing more or less in one region rather than the other, and to identify the best business and regulatory practices seen to promote growth, flexibility and investor choice in both markets.
To identify these differences, AFME has produced this report, together with The Boston Consulting Group (BCG). In researching the report, BCG interviewed prominent investors, with aggregate assets under management of approximately €9tn globally. Interviewees include leading global, European and US asset managers, insurers, hedge funds, pension funds, private equity funds, fund management associations, and exchanges. This gives a unique and granular investors’ perspective on the key issues of growth and investment.
Summaries of AFME’s guide to Raising finance for Europe’s SMEs; the AFME-ICMA Guide to infrastructure financing through bank loans, Private Placements and public bonds; and a Pan-European Private Placement guide are also provided in the Appendices of this report.

Executive summary
Executive summary
At a time when Europe’s economy is struggling to expand, this report, based on a survey of leading institutional investors, compares the overarching differences between US and European capital markets and ways to improve delivery of finance in Europe. It focuses particularly on the key areas of small and medium-sized enterprises (SMEs), infrastructure and mid-sized corporates (via Private Placements).
The leading institutional investors taking part in the survey highlight the key differences in the markets in Europe and the US, as well as a number of measures to improve the investment landscape in Europe.
This second AFME report follows the first AFME Growth publication, Unlocking funding for European investment and growth (2013), which focused on identifying specific funding obstacles affecting growth. In response to this second report, AFME members are keen to make tangible contributions to address problems identified by survey investors, in order to help European economic growth.
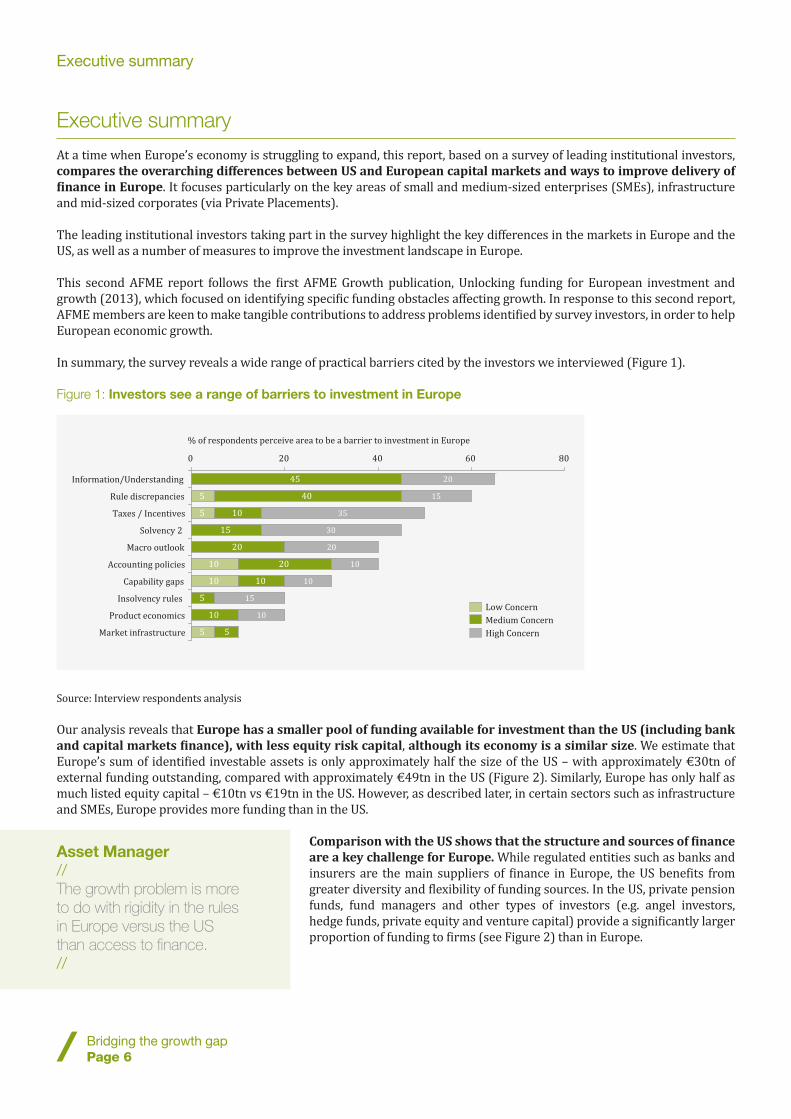
In summary, the survey reveals a wide range of practical barriers cited by the investors we interviewed (Figure 1).
Figure 1: Investors see a range of barriers to investment in Europe
Source: Interview respondents analysis
Our analysis reveals that Europe has a smaller pool of funding available for investment than the US (including bank and capital markets finance), with less equity risk capital, although its economy is a similar size. We estimate that Europe’s sum of identified investable assets is only approximately half the size of the US – with approximately €30tn of external funding outstanding, compared with approximately €49tn in the US (Figure 2). Similarly, Europe has only half as much listed equity capital – €10tn vs €19tn in the US. However, as described later, in certain sectors such as infrastructure and SMEs, Europe provides more funding than in the US.
Comparison with the US shows that the structure and sources of finance are a key challenge for Europe. While regulated entities such as banks and insurers are the main suppliers of finance in Europe, the US benefits from greater diversity and flexibility of funding sources. In the US, private pension funds, fund managers and other types of investors (e.g. angel investors, hedge funds, private equity and venture capital) provide a significantly larger proportion of funding to firms (see Figure 2) than in Europe.
Executive summary
Bridging the growth gapPage 6
5
15
20
10
10
5
10
5 5
20
10
5
45
20
10
15
10
30
40
20
10
35
10
15
0 20 40 60 80
% of respondents perceive area to be a barrier to investment in Europe
Market infrastructure
Product economics
Insolvency rules
Capability gaps
Rule discrepancies
Information/Understanding
Accounting policies
Macro outlook
Solvency 2
Taxes / Incentives
Medium Concern
High Concern
Low Concern
Asset Manager//The growth problem is more to do with rigidity in the rules in Europe versus the US than access to finance.//

Executive summary
Bridging the growth gapPage 7
However, when asked to assess whether the amount of funding available was holding back European growth, 77% of the investors interviewed said that they did not see the amount of financing available as being the chief barrier to growth.
In addition, there is a greater appetite for risk in US business culture, alongside larger pools of capital (Figure 2). Private pension funds in the US provide a far greater amount of funding than in Europe, which more than offsets the fact that Europe’s insurer assets are twice as large as in the US. The same trend can be found in the amount of ‘dry-powder’ – committed, but not yet invested capital – by institutional investors into the private equity and venture capital asset class. In 2014, US private equity (PE) and venture capital (VC) funds had €488bn ready to be invested in comparison to comparable European funds having €245bn to be invested.2 In terms of risk appetite, US pension funds and fund managers invest more in the equity asset class than their European peers (53% vs 37% of funds managed).
Similarly, there is a lower allocation of investments toward equities in Europe. Part, but not all, of the lower risk profile of European asset allocation can be attributed to the larger role of state pension systems in Europe, whereby individual pension beneficiaries do not make the investment decisions that will impact their retirement income. This puts more pressure on national government finances, since governments will have to absorb reinvestment risks rather than those who benefit from the retirement provision.
Figure 2: European Union and the US: different structures and sources of finance
Note: Illustration only – not exhaustive. Source: Appendix 1
Outstanding market (€T) Flows (€B)
CorporateDebt
SovereignDebt
Bank loansoutstanding to NFCs
Leveraged loansissuance (2013)
Bonds outstanding to NFCs
High yield bond issuance (2013)
Securitisation market outstanding
Sovereign bondsoutstanding
Equity / M&A
Listed marketcapitalisation
IPOs (2013)
M&A deal volume(2013)
Institutions Investors &Household
Insurance company investible assets
Pension funds investible assets
Private equity raised (2013)
Mutual funds investible assets
Venture capital invested (2013)
Hedge funds investible assets
Sovereign Wealth Funds
Corporates managed funds
Household�inancial assets
5.51.3
1.13.3
1.56.8
9.612.3
6.84.0
4.314.9
2.14.4
0.41.5
196105
5827
512773
265
244122
USEU
24892
0.80.1
15.323.3
0.60.5
1019
Executive summary
Bridging the growth gapPage 8
Commenting specifically on SMEs, which represent 58% of Europe's value-added and 67% of its employment, interviewees noted that lending by certain banks has fallen in the past few years, especially in crisis-affected countries. However, the European Central Bank (ECB) report, Survey on the access to finance of enterprises,3 reported an improvement in the availability of finance in net terms, with the exception of the smallest firms, in the six months from April to September 2014.
Bank loans are the greatest source of finance for Europe’s SMEs, especially the smallest firms, with the result that SMEs’ balance sheets are frequently under-capitalised. An EU member state government study found that 71% of businesses in that country approach only one provider when seeking finance, and that in more than half of cases it will be their main bank.4 SMEs in Europe
rely heavily on their bank for finance, yet for small companies with limited profits or cash flows, bank loans are often not the most suitable form of financing. Equity may be more suitable in many situations.
Infrastructure spending, another critical driver of growth in Europe, is also down and below long-term averages. New infrastructure spending provides an immediate stimulus to the economy, and also builds an ecosystem for future businesses to thrive. Interviewees said there was no shortage of capital. Instead, it was mentioned that infrastructure spending was being held back by a variety of factors, including: the risk of governments "moving the goal posts", an insufficient number of high-quality projects, regulatory treatment of investments, and the need for better management of demand/usage risk.
Finally, interviewees observed that many of Europe’s middle-sized and large companies would also benefit from alternative financing options such as Private Placements, especially when compared to other markets such as the US.
As well as differences in sources of funding and risk profile, four other key conclusions were reached:
• Fragmentation: Survey participants highlighted that fragmentation discourages investments in Europe; 65% of interviewees cited information/understanding differences across markets as a key barrier, and 60% cited national discrepancies in rules. Half cited differences in taxes and incentives. Information/understanding issues could include language differences, difficulty in finding information to compare cross-border investment risk issues, as well as inconsistencies between data sources. Successful US SMEs find it easier to achieve scale – due both to the single language and the ease of expanding across US state lines, compared to national boundaries in Europe.
• SMEs: Estimates show an outstanding stock of SME finance of €1.2tn in the US versus €2.0tn in Europe, with gross financing of €571bn in the US vs €926bn in Europe. Despite this higher overall funding for SMEs compared to the US, European SMEs suffer from a lack of financing avenues that could provide equity. This lack of equity is a key bottleneck to the provision of further overall SME funding; the US has a much more developed equity network for SMEs. Interviewees cited a European preference for debt funding over equity. Also cited was the widespread inability of European issuers to access equity investment by friends and family, business angels and private equity/venture capital. Public support for SMEs by the US Small Business Administration was also seen as more efficient and effective than the current fragmented European approach. See summary table of differences in the section, Better financing for SMEs.
• Infrastructure: European infrastructure would benefit from more targeted public support, to mitigate risks that cannot be accepted by private sector investors. These include usage/volume risks, as well as the risk of European issuers reducing tariff revenues after bonds have been sold. Europe has recently provided more funding for infrastructure than the US, although it relies much more on bank funding, while the US is more dependent on municipal finance. Interviewees also suggested a more coordinated issuance pipeline to aid investment planning and, in particular, support the Commission and EIB plan to develop a pipeline reporting initiative. It would also improve municipality planning match demand to overall strategy. Forty five per cent of respondents cited Solvency II concerns and 40% cited accounting concerns (Figure 1).
Asset Manager//The key difference between Europe and the US is that Europe is a number of different markets and as such there are lots of differences between them.//
Executive summary
Bridging the growth gapPage 9
• European Private Placements: These would benefit from standardised documentation, which could be developed by the wholesale financial markets industry. This should also be complemented by clarification (possibly through some type of definition of a Private Placement) of regulatory and tax ambiguities that discourage investment. The US has two successful regulatory Private Placement regimes that reduce this investment uncertainty through ‘safe harbour’ exemptions (see summary of differences in the section, Raising the profile and use of Private Placements in Europe). The Pan-European Private Placement (PEPP) initiative should provide an important first step in the standardisation of Private Placement documentation for loans and notes/bonds.
Better financing small and medium-sized enterprises (SMEs)
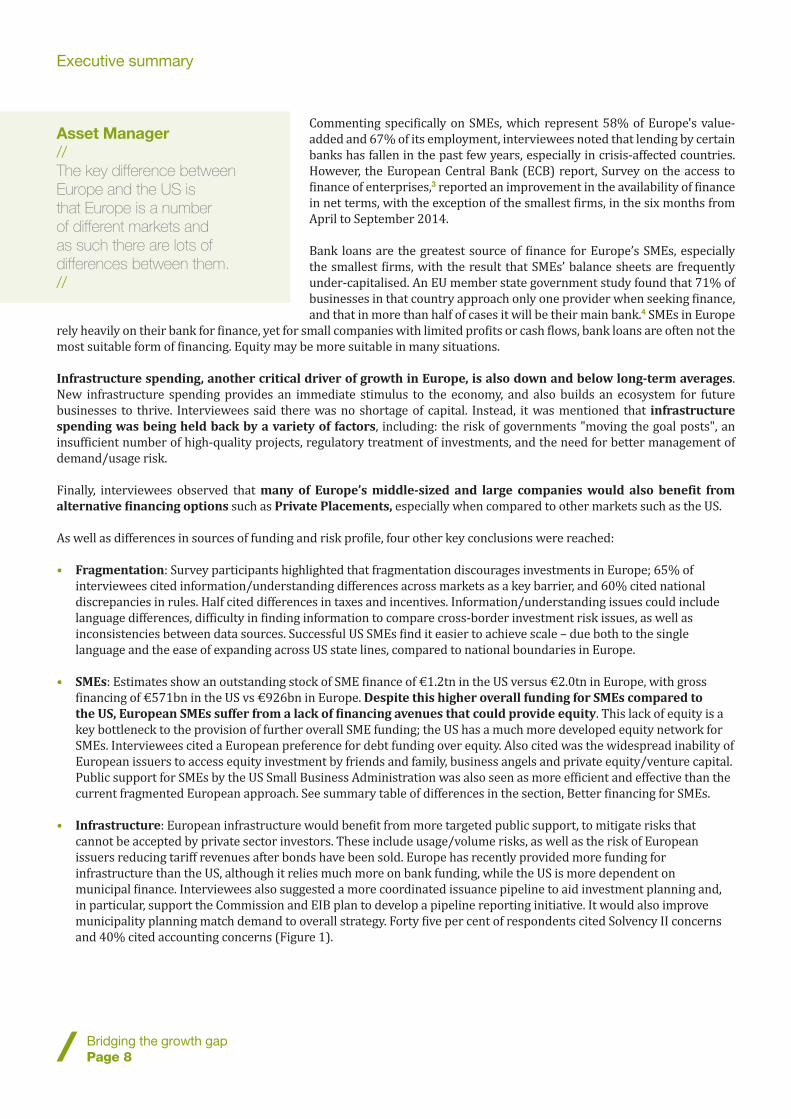
In addressing how to better finance SMEs within Europe, as indicated above, AFME found that the amount of money available is not the major barrier. Analysis shows that more money is available to European SMEs than to US SMEs. Our estimates indicate that almost double the amount of total financing has been made available to SMEs in Europe from banks, non-banks and governments than to their US equivalents (Figure 3).
Of this, banks appear to provide a much larger proportion of SME financing in Europe than in the US, even after the recent decline in bank lending in certain countries. Data show that in 2013, €926bn of new funding of all types was provided to Europe’s SMEs, compared to just over €571bn in the US. Note that data in both regions excludes funding provided by personal financing, including funds made available to SMEs by their owners through their own personal wealth and retained earnings. Our analysis uses the European Commission’s SME definition, where explicit data are available, of turnover of less than €50m for the largest SMEs.
Figure 3: Sizes and sources of financing for SMEs in Europe and the US
Sources: Appendix 2. Please note that the table excludes the funds provided to SMEs by their owners through their own personal wealth
Interviewees thought that a European culture of risk aversion among SMEs and investors might explain the reliance on bank lending. In particular, they contrasted Europe to the US.
Research and interviews found that European SMEs strongly prefer bank lending over personal or alternative sources of financing. This is evidenced by the under-developed nature of alternative sources of finance – such as venture capital and angel investing – available to smaller SMEs in Europe. For example, €26bn was invested by venture capital firms in SMEs in the US in 2013; against only €5bn in Europe. Over the same period, €20bn was invested by angel investors in US SMEs, versus only €6bn in Europe.
Source US ( €B) EU ( €B) US ( €B) EU ( €B)
Loans 464 1,425* 281* 712
Securitised loans 30 118 5* 36
Bonds/Equity2
Subtotal 494 1,543 286 748
Mutual
Segregated Mandates
funds
Pension Funds3
Insurance3
Private
SWF3
Equity Funds 59*
~5
32*
~10
14* 9*
~1 0
107 88 10 7
Venture Capital Funds 104* 22* 26 5
Family and friends 371* 168* 186* 84*
Crowd funding 3* 1*2 1 1
Angel Investing 39* 11* 20 6
Subtotal 688 332 258 112
Government guarantees and sponsored loans 54* 132* 27 66*
Subtotal 54* 132* 27 66*
Total 1,236 2,007 571 926
Banks
Non banks
Government
SME
Desk research and investor interviews indicate only marginal investments
Desk research and investor interviews indicate only marginal investments via funds , mandates or securitisation
Stock(of outstanding �inancing)
Flow(of new �inancing in 2013
1)
* Estimates used, see Appendix 2
Executive summary
Bridging the growth gapPage 10
115
260
182
159
0
100
200
300
400
500
0
1
2
3
4
%Total infrastructure spending in 2013, € bn
EU
419
US
297
% GDP (RHS)
Private
Government
Insurance Company//For infrastructure, there is always a direct or indirect link with politics; if the regulatory framework is not clear and hasn’t been demonstrated to be solid, we won’t invest.//
Insurance Company//Solvency II is a real problem for long-term investors in Europe, and will hinder smaller players entering the infrastructure space.//
Investors also noted that, in order to provide long-term financing to SMEs, a number of logistical barriers need to be addressed. SMEs could be made more aware of the differences between, and suitability of, debt and equity finance. Cost and
size requirements for SMEs to issue debt/equity are often too high for many small firms, and current market conditions do not make the securitisation of SME loans particularly attractive.
To address these points, AFME believes that Europe should focus on increasing SME supply and demand for alternative forms of finance – particularly equity finance for small SMEs.
Increasing investment in long-term infrastructure projects
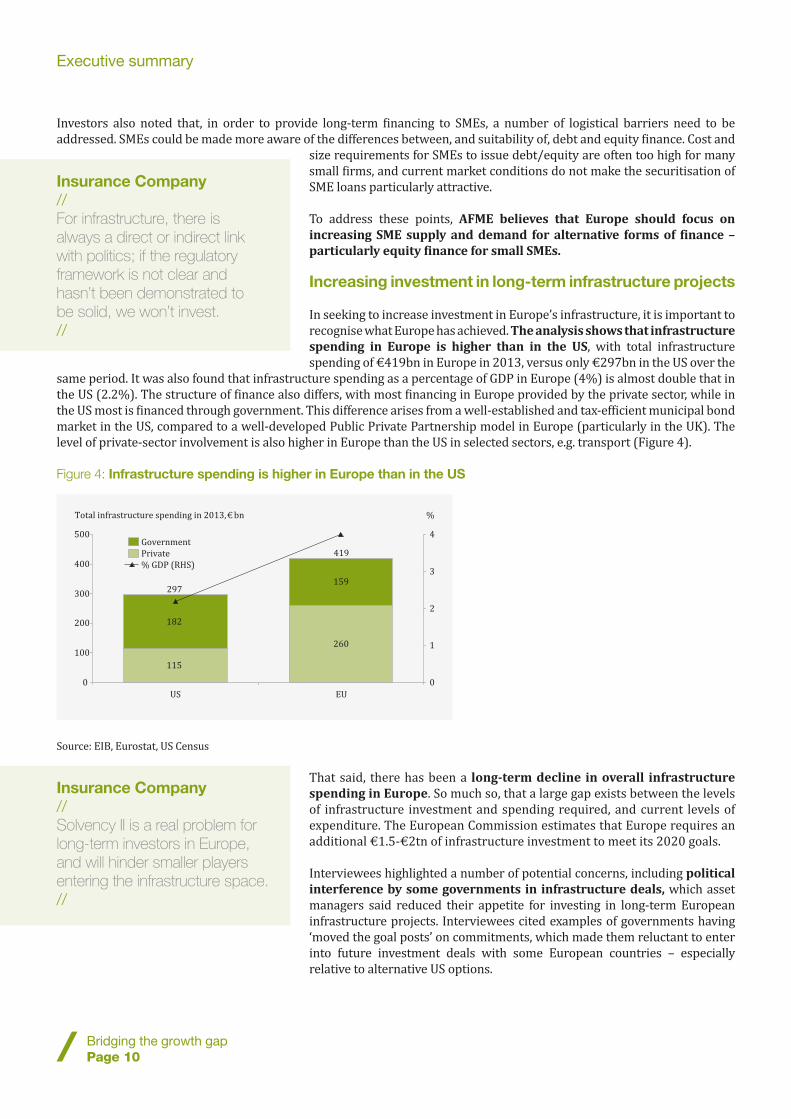
In seeking to increase investment in Europe’s infrastructure, it is important to recognise what Europe has achieved. The analysis shows that infrastructure spending in Europe is higher than in the US, with total infrastructure spending of €419bn in Europe in 2013, versus only €297bn in the US over the
same period. It was also found that infrastructure spending as a percentage of GDP in Europe (4%) is almost double that in the US (2.2%). The structure of finance also differs, with most financing in Europe provided by the private sector, while in the US most is financed through government. This difference arises from a well-established and tax-efficient municipal bond market in the US, compared to a well-developed Public Private Partnership model in Europe (particularly in the UK). The level of private-sector involvement is also higher in Europe than the US in selected sectors, e.g. transport (Figure 4).
Figure 4: Infrastructure spending is higher in Europe than in the US
Source: EIB, Eurostat, US Census
That said, there has been a long-term decline in overall infrastructure spending in Europe. So much so, that a large gap exists between the levels of infrastructure investment and spending required, and current levels of expenditure. The European Commission estimates that Europe requires an additional €1.5-€2tn of infrastructure investment to meet its 2020 goals.
Interviewees highlighted a number of potential concerns, including political interference by some governments in infrastructure deals, which asset managers said reduced their appetite for investing in long-term European infrastructure projects. Interviewees cited examples of governments having ‘moved the goal posts’ on commitments, which made them reluctant to enter into future investment deals with some European countries – especially relative to alternative US options.

Executive summary
Bridging the growth gapPage 11
Interviewees stated that EU and national government support should be channelled towards ‘greenfield’ and ‘brownfield’ projects that would otherwise not be financially viable. This is particularly true for projects with unquantifiable usage/demand risk. According to a recent Preqin study, 70% of all European infrastructure projects in 2013 were in operational or brownfield stage assets, which are already well established, and so have a lower risk and potentially a reduced contribution to economic growth. Please note that this study is primarily based on equity, debt and some, but not all, bank loan financing. It may not represent all infrastructure transactions.
Also raised were significant concerns about the regulatory treatment of infrastructure investment. It appears that the lack of a clear asset class definition for infrastructure investment is leading to disproportionate accounting regulation and capital charges for some long-term investors.
Turning to solutions, several improvements were suggested that would help encourage greater investment by institutional investors in European infrastructure projects. These were: greater visibility of the pipeline for infrastructure projects, better links with national growth strategies and frameworks, increased consistency in procurement processes across markets, and a greater appetite from governments for Public Private Partnership (PPP) deals. Many institutional investors reported that the size of their infrastructure investment teams may be difficult to justify if the deal flow does not increase soon.
Finally, several interviewees noted that direct investment in infrastructure was often not a viable option for smaller funds in Europe; especially across borders. This obstacle contrasted with the US, where the $3.5tn municipal bond market gives smaller US investors access to infrastructure in a tax effective way through the purchase of revenue bonds. While interviewees were quick to point out the benefits of such a scheme, they acknowledged that implementing an equivalent scheme in Europe would be difficult, given the lack of a unified tax system across nations.
AFME believes that solutions should seek to: reduce political and regulatory risk associated with investing in selected European countries; focus government support measures on projects/areas that are currently unviable potentially through partial guarantees; amend punitive accounting and capital charges associated with investing in infrastructure as an asset class; and increase the size and consistency of the project pipeline.
Raising the profile and the use of private placements in Europe
The desirability of promoting alternative funding avenues for mid-sized and large corporates was consistently mentioned by interviewees. They believed that a larger and more visible European Private Placement market would provide a faster, more flexible route for investing in European firms.
Interviewees regarded Private Placements as an important source of funding for European firms wishing to avoid the costly disclosure requirements that public market issuance often entails.
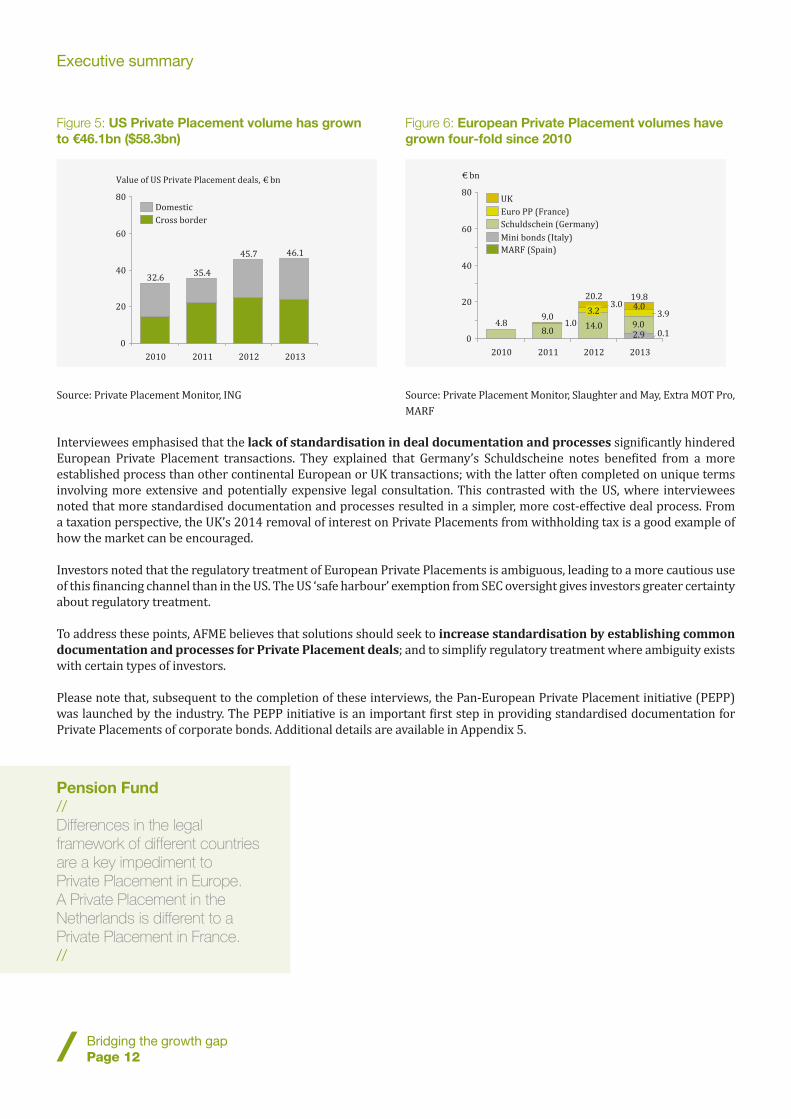
The status of the US as the long-standing leading centre for European deals was confirmed by investors, who viewed it as “the” global market. Interviewees were quick to point out that a European Private Placement market was still far from being a reality – despite rapid growth in the number and value of Private Placement deals taking place in Germany, France and the UK. The analysis indicates that the value of US Private Placement deals at €46.1bn ($58.3bn) in 2013 far outstripped the size of European deals, which totalled €20bn over the same period (Figures 5 and 6).
Executive summary
Bridging the growth gapPage 12
Pension Fund//Differences in the legal framework of different countries are a key impediment to Private Placement in Europe. A Private Placement in the Netherlands is different to a Private Placement in France.//
Figure 5: US Private Placement volume has grown to €46.1bn ($58.3bn)
Source: Private Placement Monitor, ING
Figure 6: European Private Placement volumes have grown four-fold since 2010
Source: Private Placement Monitor, Slaughter and May, Extra MOT Pro, MARF
Interviewees emphasised that the lack of standardisation in deal documentation and processes significantly hindered European Private Placement transactions. They explained that Germany’s Schuldscheine notes benefited from a more established process than other continental European or UK transactions; with the latter often completed on unique terms involving more extensive and potentially expensive legal consultation. This contrasted with the US, where interviewees noted that more standardised documentation and processes resulted in a simpler, more cost-effective deal process. From a taxation perspective, the UK’s 2014 removal of interest on Private Placements from withholding tax is a good example of how the market can be encouraged.
Investors noted that the regulatory treatment of European Private Placements is ambiguous, leading to a more cautious use of this financing channel than in the US. The US ‘safe harbour’ exemption from SEC oversight gives investors greater certainty about regulatory treatment.
To address these points, AFME believes that solutions should seek to increase standardisation by establishing common documentation and processes for Private Placement deals; and to simplify regulatory treatment where ambiguity exists with certain types of investors.
Please note that, subsequent to the completion of these interviews, the Pan-European Private Placement initiative (PEPP) was launched by the industry. The PEPP initiative is an important first step in providing standardised documentation for Private Placements of corporate bonds. Additional details are available in Appendix 5.
14.08.0
4.83.9
3.0
1.00.1
0
20
40
60
80
€ bn
20132012
20.2
3.2
2011
9.0
2010
Mini bonds (Italy)
Euro PP (France)
UK
MARF (Spain)
Schuldschein (Germany)
9.0
19.84.0
2.90
20
40
60
80
20112010
35.4
Value of US Private Placement deals, € bn
46.1
20132012
45.7
32.6
Cross border
Domestic

Executive summary
Bridging the growth gapPage 13
Why Europe must act
This report details a number of observations from investors about differences between Europe’s financial markets and the US. As a next step, the wholesale financial markets industry recommends identifying aspects of US market structures that might be useful in Europe. The European Commission’s proposed Capital Markets Union is a good opportunity to do so.
The wholesale financial markets industry is keen to demonstrate that it is actively listening to end user needs and acting upon policymaker concerns about economic growth. Specific industry action steps prompted by the conclusions of this survey include:
1. Active support for a stronger EU Capital Markets Union and implementation of specific targets, such as increasing the market capitalisation of European equities as well as the percentage of European funding provided by capital markets instruments.
2. Active support for promoting broader understanding of financial markets for borrowers, investors, and other stakeholders. These include, concurrent with publication of this report, the following practical guides for specific categories of issuers identified in the survey: a) helping infrastructure issuers more easily tap various types of infrastructure funding; b) improving the chances of SMEs across Europe to achieve success with loan and equity investment applications and bond issues; and c) development of standardised industry practices for a pan-European Private Private Placement market (Appendices 3, 4, 5).
3. Help promote a responsible equity risk culture for all types of equity raising – important for the development of entrepreneurship, start-ups and growth expansion for jobs creation.
AFME is actively implementing these three steps, and will also be evaluating progress so that further AFME members’ support for European growth remains rigorous.

Executive summary
Bridging the growth gapPage 14
Summary of identified roadblocks to investment and possible actions
European roadblocks US view Possible solution
SMEs
• Presence and accessibility of alternative funding avenues is underdeveloped for SMEs e.g. venture capital & angel investing
• Culture of risk aversion among SMEs relative to US peers
• Many European SMEs are unaware of risk assessment methodology used by lenders and their preference for more capitalised SMEs
• European government funding is fragmented and difficult for SMEs to identify and access
• The market for SME securitised assets is underdeveloped in Europe, with current legislation preventing increase in usage
• Higher cultural risk appetite has led to better development of credible alternative funding avenues
• Strong culture of utilising internal funds and personal savings/wealth for SMEs
• US Small Business Association (SBA) is ‘one-stop-shop’ for SMEs providing access to required information in a user-friendly way
• Greater consistency in definition and application process, with no data restrictions applied at across states
• Established national credit rating system (FICO)
• More established securitisation market
• Establish a more coordinated availability and consistency of borrowing and investing information for SMEs on a pan-European basis
• Increase the use of alternative financing sources e.g. VC/angel investing
• Produce easy-to-understand ‘how to’ guides for SMEs
• Better sharing and linking of information about SMEs across nations and borders
• Increase awareness and incentives for SMEs to raise equity financing
• Increase the size and prevalence of SME securitisation within Europe
• Address tax code preference for debt over equity
Infrastructure
• Examples of governments having ‘moved the goalposts’ has increased perceived political risk and regulatory uncertainty in some European infrastructure projects
• Lack of project linkages to investor demand
• Public involvement and credit enhancement not perceived to focus on most needed countries/projects
• Accounting and regulatory treatment of investments currently punitive to long-term infrastructure projects
• Direct investing not easily accessible to smaller investors
• US perceived to have high rating as a destination for infrastructure investing, based on political stability and a sound legal/insolvency regime
• US municipal bond market provides access to retail investors in a tax-effective manner
• Establish an EU-wide legal framework to prevent issuers from lowering tariffs after purchasers have invested
• Establish a more comprehensive public review process for infrastructure to ensure planning is more strategically coordinated
• Increase focus of government and Europe-wide funding to financially unviable, but socially important projects (potentially through (partial) guarantees in order to make them viable)
• Produce easy-to-understand guide to infrastructure finance through banks and capital markets
• Amend accounting and regulatory treatment of infrastructure projects to increase attractiveness for investors
• Increase use of structures which enable retail investors to participate better in illiquid financings
Private Placements
• A lack of standardisation in Private Placement deals and documentation
• Rating and regulatory treatment of Private Placement deals differs across nations, reducing desire to invest via Private Placements
• Poor visibility of Private Placements conducted in Europe, with many investors unaware of this option to raise funds in Europe
• US Private Placement market well established and viewed globally as ‘go-to’ location
• Standardised documentation exists in US, e.g. Model Note Purchase Agreement
• Common legal framework used in assessment and application of deals with ‘safe harbour’ of SEC exemption through Regulation D
• All deals required NAIC rating through the Securities Valuation Office (SVO)
• Promote and increase awareness of Private Placements as a funding avenue, and their potential benefits
• Establish standardised documentation for European Private Placement deals
• Increase consistency and clarity of accounting procedures and regulatory and tax treatment of investment
To build on these observations, AFME and its members have developed detailed SME, Infrastructure and Private Placement guides. A summary of these guides can be found in the appendices to this document.

Interview methodology
Bridging the growth gapPage 15
Interview methodology
To identify potential roadblocks and to make recommendations to promote growth in Europe, BCG conducted a series of interviews with leading asset managers, insurers, hedge funds, pension funds, private equity funds, as well as fund management associations and exchanges.
Interviewees for this report represent a diverse sample of investors and other market participants, with in-depth expertise across the areas being assessed.
Interviews were conducted with senior executives at asset management firms with approximately €9tn of assets under management globally. In addition, BCG spoke to a number of industry associations, representing approximately 8,000 member firms. Around 35 per cent of interviewees were based in the US; 15% had a global remit; and 50% of interviewees were European in focus and output.
BCG conducted the interviews based on a detailed questionnaire developed by the project working group. The interview guide was structured in three parts:
• Questions about economic growth in Europe versus the US, and the role of capital markets
• Questions about differences in investment choices and rationale between Europe and the US, with particular focus on SMEs, infrastructure and private placements
• Questions about how capital markets can further support European economic growth
Interviews were used to help identify roadblocks, emerging issues and potential solutions for Europe. Opinions were captured, tested and refined through subsequent interviews, and once again with all respondents before publication of this report.
The views expressed in subsequent sections of this report summarise interviewees’ concerns and suggestions. Wherever possible, a quantitative analysis of responses is provided.
Interviews were conducted on a confidential basis, and some firms interviewed chose to remain "off the record". Only those companies that gave their consent have their logos displayed in this report.
The interviews forming the basis of this report were conducted throughout October and November 2014, and compiled in December 2014.

Interviewee firms
We are especially thankful to the large number of firms and individuals who contributed their time towards the interviews that form the basis of this report. A partial list is below, since some participants chose to remain anonymous.
This report reflects its authors’ opinions, and not necessarily those of the firms interviewed.
Interviewee firms
Bridging the growth gapPage 16

What should Europe do differently?
What should Europe do differently?
Bridging the growth gapPage 18
What should Europe do differently?
Economic context
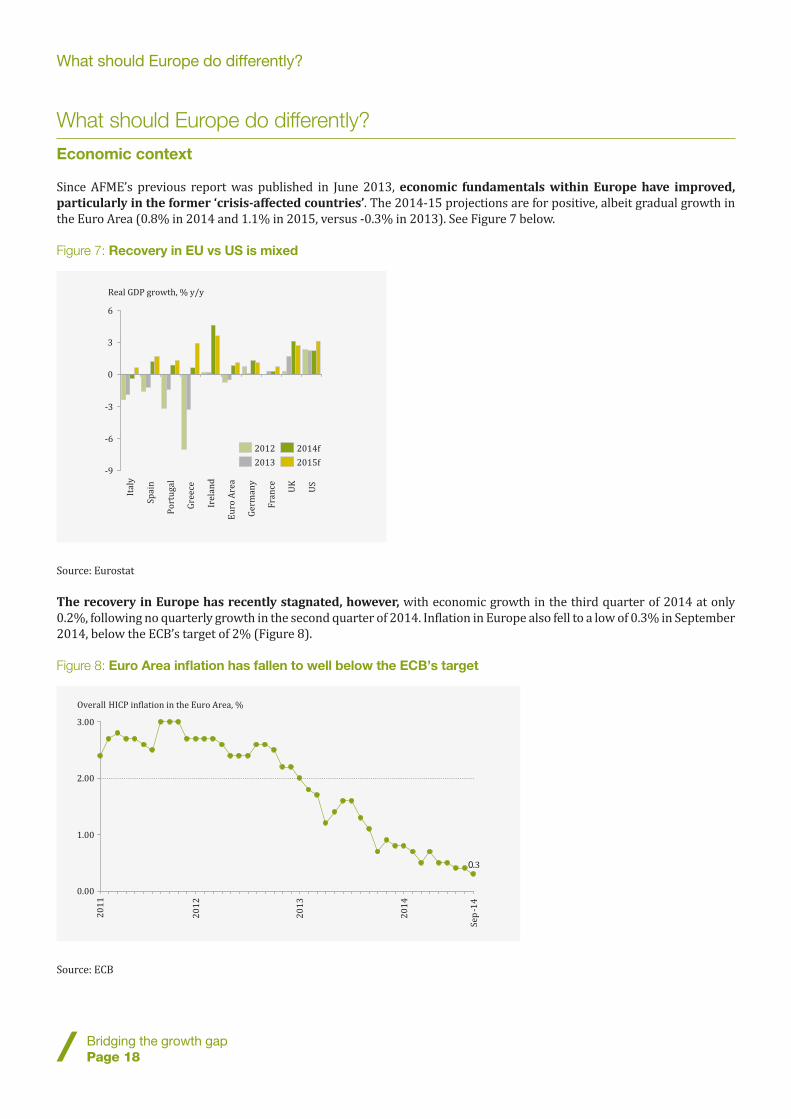
Since AFME’s previous report was published in June 2013, economic fundamentals within Europe have improved, particularly in the former ‘crisis-affected countries’. The 2014-15 projections are for positive, albeit gradual growth in the Euro Area (0.8% in 2014 and 1.1% in 2015, versus -0.3% in 2013). See Figure 7 below.
Figure 7: Recovery in EU vs US is mixed
Source: Eurostat
The recovery in Europe has recently stagnated, however, with economic growth in the third quarter of 2014 at only 0.2%, following no quarterly growth in the second quarter of 2014. Inflation in Europe also fell to a low of 0.3% in September 2014, below the ECB’s target of 2% (Figure 8).
Figure 8: Euro Area inflation has fallen to well below the ECB’s target
Source: ECB
-9
-6
-3
0
3
6U
S
Fra
nce UK
Ge
rma
ny
Eu
ro A
rea
Ire
lan
d
Gre
ece
Po
rtu
ga
l
Sp
ain
Ita
ly
Real GDP growth, % y/y
2015f
2014f
2013
2012
0.00
1.00
2.00
3.00
20
12
20
11
0.3
20
14
20
13
Overall HICP in�lation in the Euro Area, %
Se
p-1
4
What should Europe do differently?
Bridging the growth gapPage 19
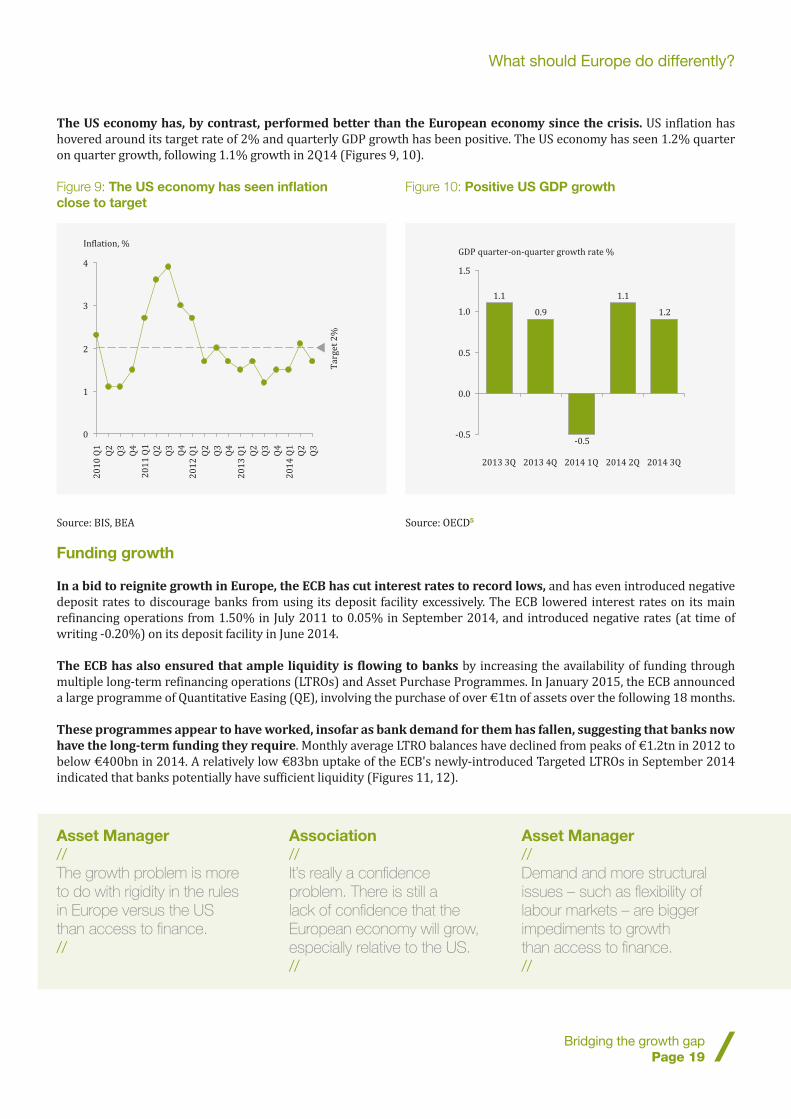
The US economy has, by contrast, performed better than the European economy since the crisis. US inflation has hovered around its target rate of 2% and quarterly GDP growth has been positive. The US economy has seen 1.2% quarter on quarter growth, following 1.1% growth in 2Q14 (Figures 9, 10).
Figure 9: The US economy has seen inflation close to target
Source: BIS, BEA
Funding growth
In a bid to reignite growth in Europe, the ECB has cut interest rates to record lows, and has even introduced negative deposit rates to discourage banks from using its deposit facility excessively. The ECB lowered interest rates on its main refinancing operations from 1.50% in July 2011 to 0.05% in September 2014, and introduced negative rates (at time of writing -0.20%) on its deposit facility in June 2014.
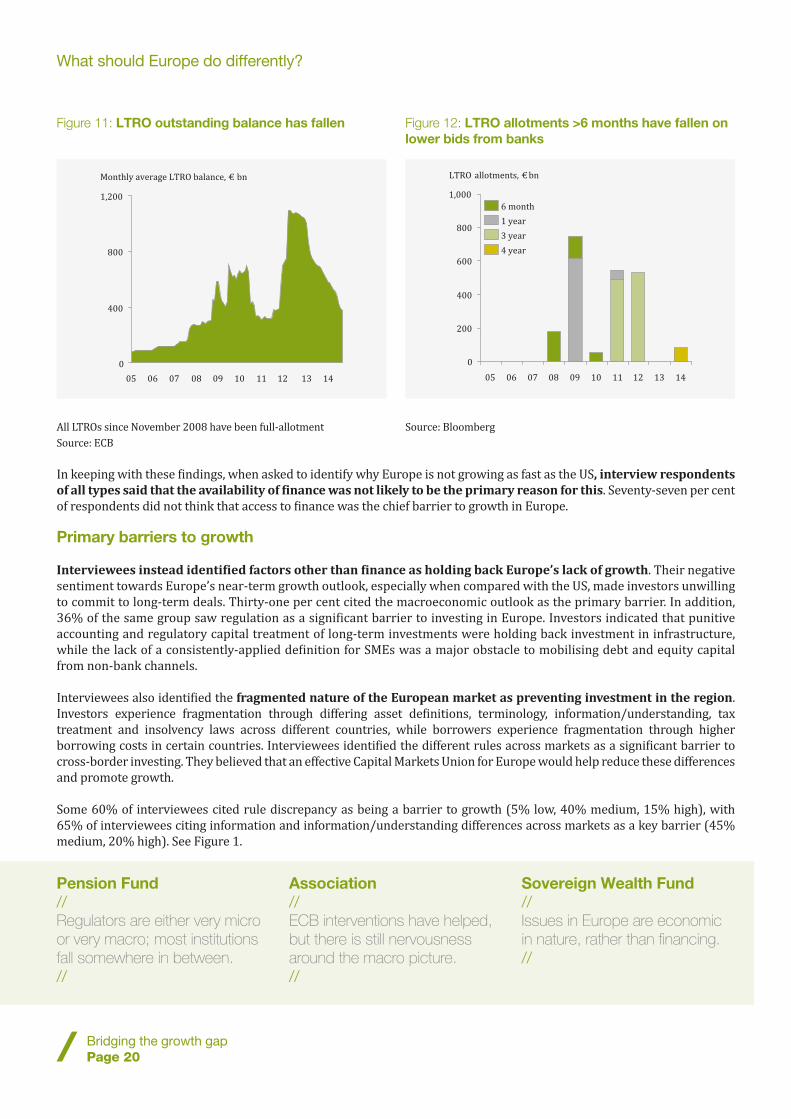
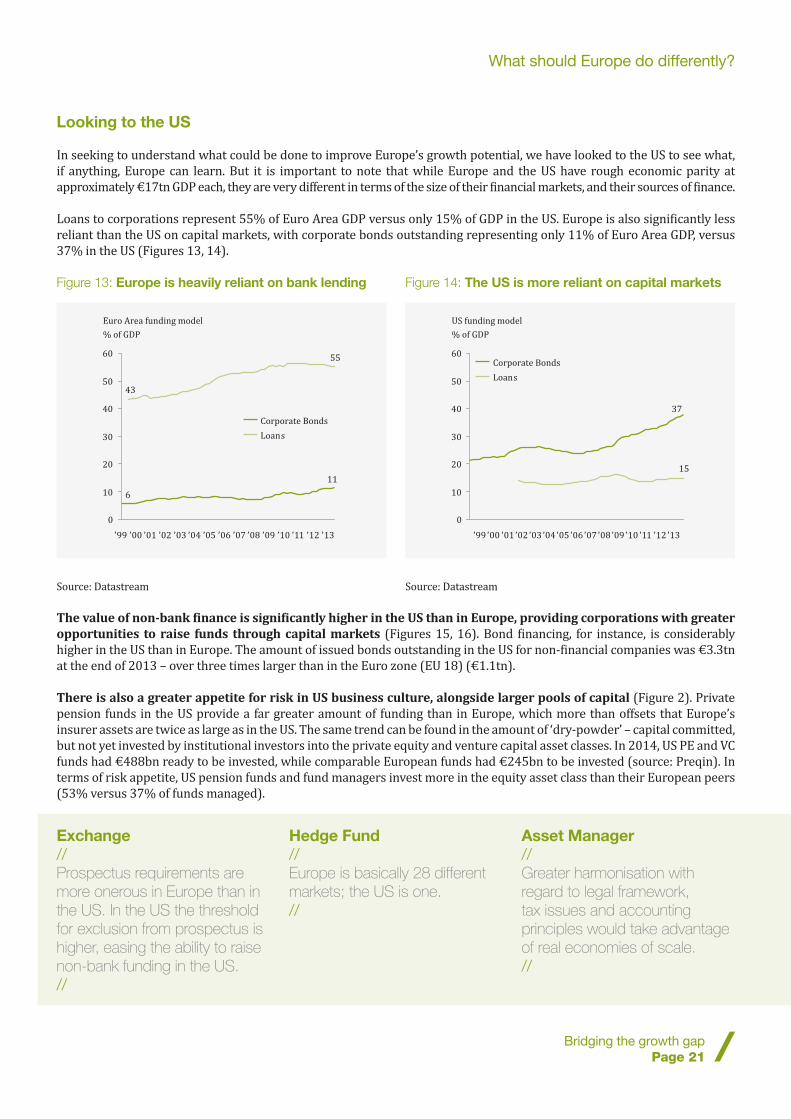
The ECB has also ensured that ample liquidity is flowing to banks by increasing the availability of funding through multiple long-term refinancing operations (LTROs) and Asset Purchase Programmes. In January 2015, the ECB announced a large programme of Quantitative Easing (QE), involving the purchase of over €1tn of assets over the following 18 months.
These programmes appear to have worked, insofar as bank demand for them has fallen, suggesting that banks now have the long-term funding they require. Monthly average LTRO balances have declined from peaks of €1.2tn in 2012 to below €400bn in 2014. A relatively low €83bn uptake of the ECB's newly-introduced Targeted LTROs in September 2014 indicated that banks potentially have sufficient liquidity (Figures 11, 12).
Figure 10: Positive US GDP growth
Source: OECD5
Asset Manager//The growth problem is more to do with rigidity in the rules in Europe versus the US than access to finance.//
Association//It’s really a confidence problem. There is still a lack of confidence that the European economy will grow, especially relative to the US.//
Asset Manager//Demand and more structural issues – such as flexibility of labour markets – are bigger impediments to growth than access to finance.//
1.2
1.1
-0.5
0.9
1.1
-0.5
0.0
0.5
1.0
1.5
GDP quarter-on-quarter growth rate %
2014 3Q2014 2Q2014 1Q2013 4Q2013 3Q
0
1
2
3
4
Q3
Q2
20
11
Q1
Q4
Q3
Q2
20
10
Q1
Ta
rge
t 2
%
Q3
Q2
20
14
Q1
Q4
Q3
Q2
20
13
Q1
Q4
Q3
Q2
20
12
Q1
Q4
In�lation, %
What should Europe do differently?
Bridging the growth gapPage 20
Figure 11: LTRO outstanding balance has fallen
All LTROs since November 2008 have been full-allotment Source: ECB
In keeping with these findings, when asked to identify why Europe is not growing as fast as the US, interview respondents of all types said that the availability of finance was not likely to be the primary reason for this. Seventy-seven per cent of respondents did not think that access to finance was the chief barrier to growth in Europe.
Primary barriers to growth
Interviewees instead identified factors other than finance as holding back Europe’s lack of growth. Their negative sentiment towards Europe’s near-term growth outlook, especially when compared with the US, made investors unwilling to commit to long-term deals. Thirty-one per cent cited the macroeconomic outlook as the primary barrier. In addition, 36% of the same group saw regulation as a significant barrier to investing in Europe. Investors indicated that punitive accounting and regulatory capital treatment of long-term investments were holding back investment in infrastructure, while the lack of a consistently-applied definition for SMEs was a major obstacle to mobilising debt and equity capital from non-bank channels.
Interviewees also identified the fragmented nature of the European market as preventing investment in the region. Investors experience fragmentation through differing asset definitions, terminology, information/understanding, tax treatment and insolvency laws across different countries, while borrowers experience fragmentation through higher borrowing costs in certain countries. Interviewees identified the different rules across markets as a significant barrier to cross-border investing. They believed that an effective Capital Markets Union for Europe would help reduce these differences and promote growth.
Some 60% of interviewees cited rule discrepancy as being a barrier to growth (5% low, 40% medium, 15% high), with 65% of interviewees citing information and information/understanding differences across markets as a key barrier (45% medium, 20% high). See Figure 1.
0
1,200
800
400
0908070605 1413121110
Monthly average LTRO balance, € bn
Figure 12: LTRO allotments >6 months have fallen on lower bids from banks
Source: Bloomberg
Pension Fund//Regulators are either very micro or very macro; most institutions fall somewhere in between.//
Association//ECB interventions have helped, but there is still nervousness around the macro picture.//
Sovereign Wealth Fund//Issues in Europe are economic in nature, rather than financing.//
0
200
400
600
800
1,000
121110090807
LTRO allotments, € bn
14130605
3 year
1 year
6 month
4 year
What should Europe do differently?
Bridging the growth gapPage 21
Looking to the US
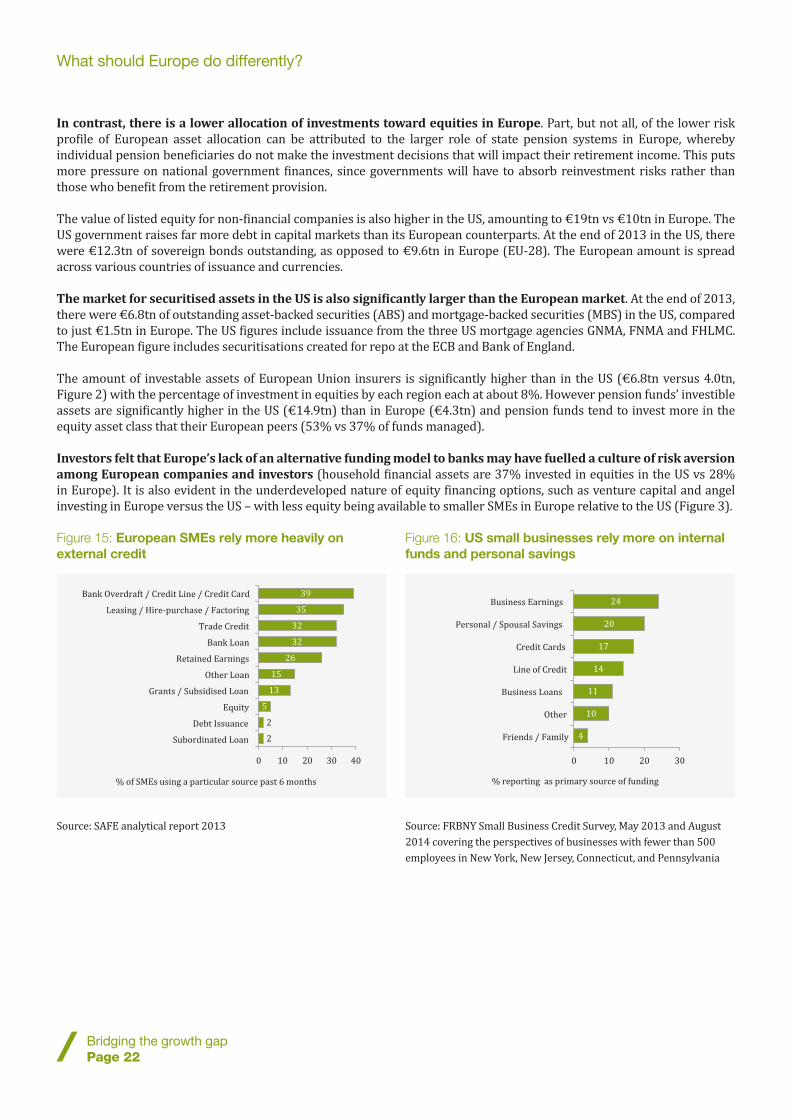
In seeking to understand what could be done to improve Europe’s growth potential, we have looked to the US to see what, if anything, Europe can learn. But it is important to note that while Europe and the US have rough economic parity at approximately €17tn GDP each, they are very different in terms of the size of their financial markets, and their sources of finance.
Loans to corporations represent 55% of Euro Area GDP versus only 15% of GDP in the US. Europe is also significantly less reliant than the US on capital markets, with corporate bonds outstanding representing only 11% of Euro Area GDP, versus 37% in the US (Figures 13, 14).
Figure 13: Europe is heavily reliant on bank lending
Source: Datastream
Figure 14: The US is more reliant on capital markets
Source: Datastream
The value of non-bank finance is significantly higher in the US than in Europe, providing corporations with greater opportunities to raise funds through capital markets (Figures 15, 16). Bond financing, for instance, is considerably higher in the US than in Europe. The amount of issued bonds outstanding in the US for non-financial companies was €3.3tn at the end of 2013 – over three times larger than in the Euro zone (EU 18) (€1.1tn).
There is also a greater appetite for risk in US business culture, alongside larger pools of capital (Figure 2). Private pension funds in the US provide a far greater amount of funding than in Europe, which more than offsets that Europe’s insurer assets are twice as large as in the US. The same trend can be found in the amount of ‘dry-powder’ – capital committed, but not yet invested by institutional investors into the private equity and venture capital asset classes. In 2014, US PE and VC funds had €488bn ready to be invested, while comparable European funds had €245bn to be invested (source: Preqin). In terms of risk appetite, US pension funds and fund managers invest more in the equity asset class than their European peers (53% versus 37% of funds managed).
11
6
55
43
0
10
20
30
40
50
60
Euro Area funding model
% of GDP
’13’12’11’10’09’08’07’06’05’04’03’02’01’00’99
Loans
Corporate Bonds
37
15
0
10
20
30
40
50
60
US funding model
% of GDP
’13’12’11’10’09’08’07’06’05’04’03’02’01’00’99
Corporate Bonds
Loans
Exchange//Prospectus requirements are more onerous in Europe than in the US. In the US the threshold for exclusion from prospectus is higher, easing the ability to raise non-bank funding in the US.//
Hedge Fund//Europe is basically 28 different markets; the US is one.//
Asset Manager//Greater harmonisation with regard to legal framework, tax issues and accounting principles would take advantage of real economies of scale.//
What should Europe do differently?
Bridging the growth gapPage 22
In contrast, there is a lower allocation of investments toward equities in Europe. Part, but not all, of the lower risk profile of European asset allocation can be attributed to the larger role of state pension systems in Europe, whereby individual pension beneficiaries do not make the investment decisions that will impact their retirement income. This puts more pressure on national government finances, since governments will have to absorb reinvestment risks rather than those who benefit from the retirement provision.
The value of listed equity for non-financial companies is also higher in the US, amounting to €19tn vs €10tn in Europe. The US government raises far more debt in capital markets than its European counterparts. At the end of 2013 in the US, there were €12.3tn of sovereign bonds outstanding, as opposed to €9.6tn in Europe (EU-28). The European amount is spread across various countries of issuance and currencies.
The market for securitised assets in the US is also significantly larger than the European market. At the end of 2013, there were €6.8tn of outstanding asset-backed securities (ABS) and mortgage-backed securities (MBS) in the US, compared to just €1.5tn in Europe. The US figures include issuance from the three US mortgage agencies GNMA, FNMA and FHLMC. The European figure includes securitisations created for repo at the ECB and Bank of England.
The amount of investable assets of European Union insurers is significantly higher than in the US (€6.8tn versus 4.0tn, Figure 2) with the percentage of investment in equities by each region each at about 8%. However pension funds’ investible assets are significantly higher in the US (€14.9tn) than in Europe (€4.3tn) and pension funds tend to invest more in the equity asset class that their European peers (53% vs 37% of funds managed).
Investors felt that Europe’s lack of an alternative funding model to banks may have fuelled a culture of risk aversion among European companies and investors (household financial assets are 37% invested in equities in the US vs 28% in Europe). It is also evident in the underdeveloped nature of equity financing options, such as venture capital and angel investing in Europe versus the US – with less equity being available to smaller SMEs in Europe relative to the US (Figure 3).
Figure 15: European SMEs rely more heavily on external credit
Source: SAFE analytical report 2013
39
35
32
32
26
15
13
5
2
2
0 10 20 30 40
% of SMEs using a particular source past 6 months
Subordinated Loan
Debt Issuance
Equity
Grants / Subsidised Loan
Other Loan
Retained Earnings
Bank Loan
Trade Credit
Leasing / Hire-purchase / Factoring
Bank Overdraft / Credit Line / Credit Card
Figure 16: US small businesses rely more on internal funds and personal savings
Source: FRBNY Small Business Credit Survey, May 2013 and August 2014 covering the perspectives of businesses with fewer than 500 employees in New York, New Jersey, Connecticut, and Pennsylvania
24
20
17
14
11
10
4
0 10 20 30
% reporting as primary source of funding
Friends / Family
Other
Business Loans
Line of Credit
Credit Cards
Personal / Spousal Savings
Business Earnings
What should Europe do differently?
Bridging the growth gapPage 23
Changes in loan demand and bank lending
Interviewees also observed that Europe still faces a number of issues with financing the core growth engines of its economy.
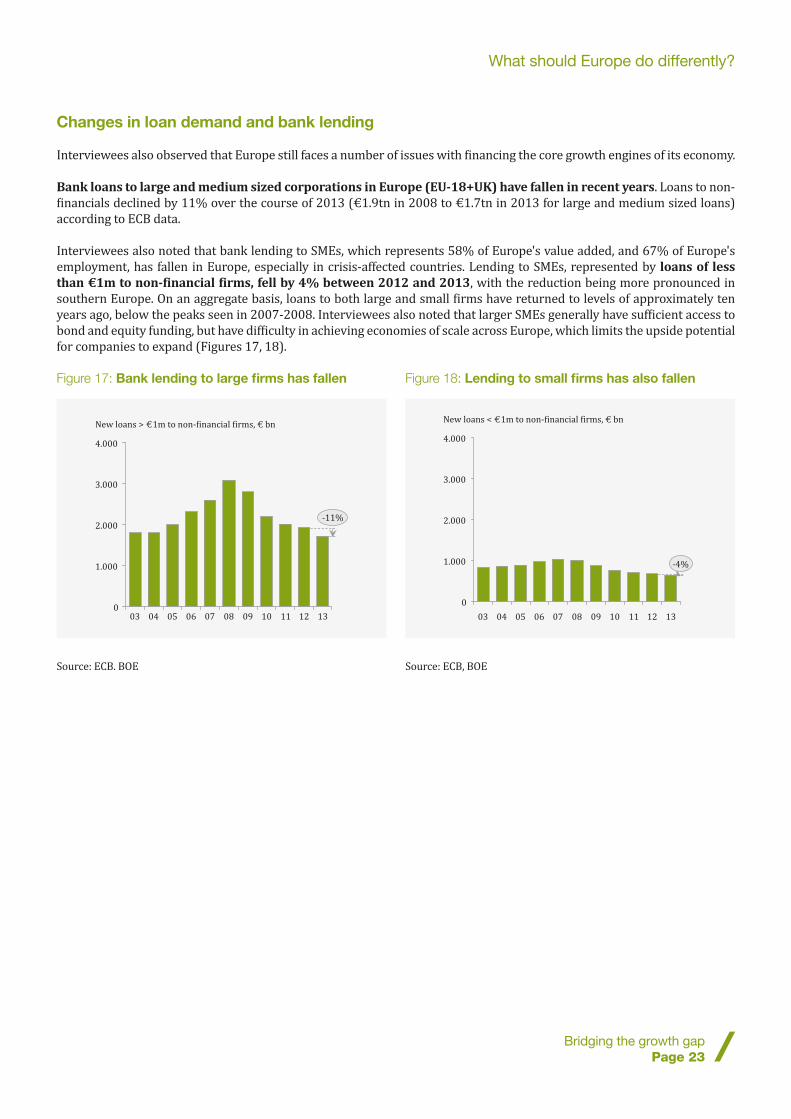
Bank loans to large and medium sized corporations in Europe (EU-18+UK) have fallen in recent years. Loans to non-financials declined by 11% over the course of 2013 (€1.9tn in 2008 to €1.7tn in 2013 for large and medium sized loans) according to ECB data.
Interviewees also noted that bank lending to SMEs, which represents 58% of Europe's value added, and 67% of Europe's employment, has fallen in Europe, especially in crisis-affected countries. Lending to SMEs, represented by loans of less than €1m to non-financial firms, fell by 4% between 2012 and 2013, with the reduction being more pronounced in southern Europe. On an aggregate basis, loans to both large and small firms have returned to levels of approximately ten years ago, below the peaks seen in 2007-2008. Interviewees also noted that larger SMEs generally have sufficient access to bond and equity funding, but have difficulty in achieving economies of scale across Europe, which limits the upside potential for companies to expand (Figures 17, 18).
Figure 17: Bank lending to large firms has fallen
Source: ECB. BOE
4.000
2.000
0
1.000
3.000
New loans > €1m to non-�inancial �irms, € bn
-11%
1312111009080706050403
Figure 18: Lending to small firms has also fallen
Source: ECB, BOE
1.000
0
4.000
3.000
2.000
New loans < €1m to non-�inancial �irms, € bn
-4%
1312111009080706050403


Better financing for SMEs
Better financing for SMEs
Bridging the growth gapPage 26
Better financing for SMEs
Introduction
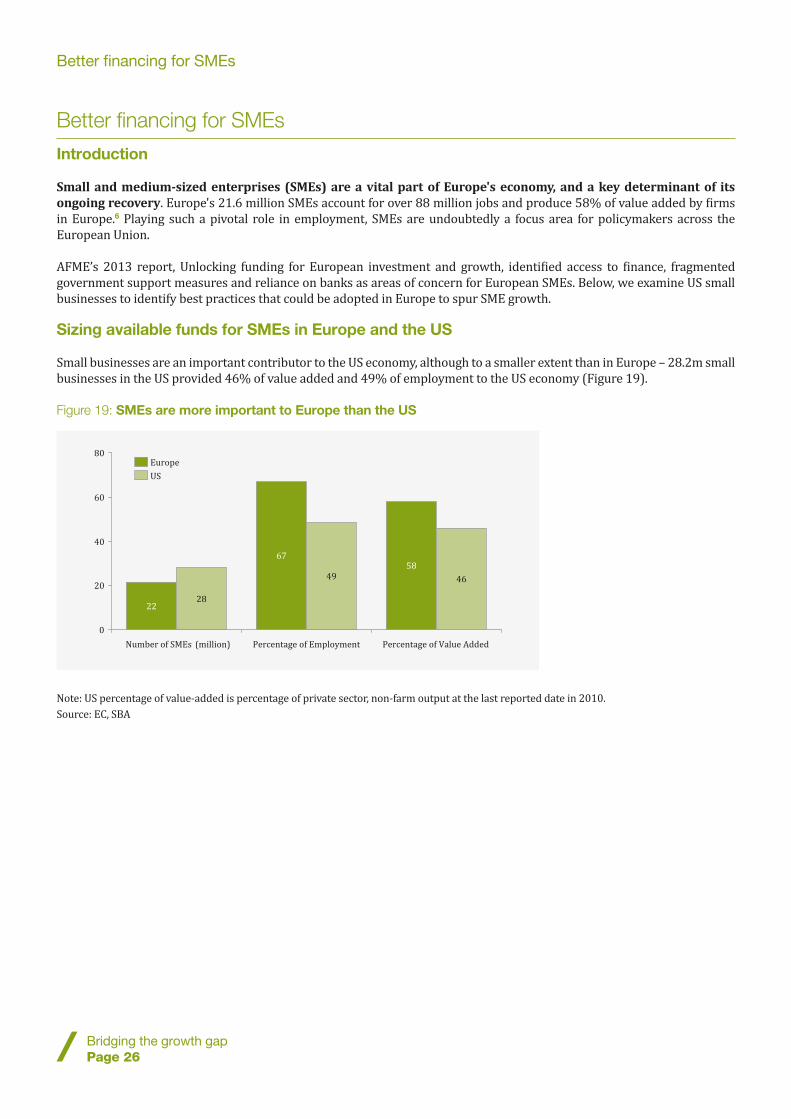
Small and medium-sized enterprises (SMEs) are a vital part of Europe's economy, and a key determinant of its ongoing recovery. Europe's 21.6 million SMEs account for over 88 million jobs and produce 58% of value added by firms in Europe.6 Playing such a pivotal role in employment, SMEs are undoubtedly a focus area for policymakers across the European Union.
AFME’s 2013 report, Unlocking funding for European investment and growth, identified access to finance, fragmented government support measures and reliance on banks as areas of concern for European SMEs. Below, we examine US small businesses to identify best practices that could be adopted in Europe to spur SME growth.
Sizing available funds for SMEs in Europe and the US
Small businesses are an important contributor to the US economy, although to a smaller extent than in Europe – 28.2m small businesses in the US provided 46% of value added and 49% of employment to the US economy (Figure 19).
Figure 19: SMEs are more important to Europe than the US
Note: US percentage of value-added is percentage of private sector, non-farm output at the last reported date in 2010. Source: EC, SBA
22
6758
28
49 46
0
20
40
60
80
Number of SMEs (million) Percentage of Value AddedPercentage of Employment
US
Europe

Better financing for SMEs
Bridging the growth gapPage 27
However, there are differences in the sizes and sources of financing available to SMEs in Europe and the US. Our analysis focuses on three broad avenues of funding available to SMEs: banks, non-banks and governments. Due to difficulties in attaining reliable data and issues regarding comparability between the two geographies, our analysis does not include personal wealth or existing corporate profits, which may also be a significant source of financing for SMEs.
Analysis shows that more money is available to European SMEs than US SMEs, with estimates indicating European SMEs receive almost twice as much financing from banks, non-banks and governments as do US SMEs. The estimates show an outstanding stock of finance of €1.2tn in the US compared to €2.0tn in Europe, and gross financing of €571bn in the US versus €926bn in Europe (Figure 3).
AFME and BCG research indicates that bank lending is a far more important avenue of funding for European SMEs than their US counterparts. Data show that in 2013, approximately €712bn of funding of all types was provided to Europe’s SMEs, compared with over €281bn in the US. Note that data in both regions exclude funding provided by personal financing (wealth plus retained earnings – see Figure 3).
Interviewees also felt there was a higher reliance on bank lending among European SMEs relative to US SMEs for financing – perhaps driven by a culture of risk aversion among European SMEs and investors; particularly when compared to the US.
The research and interviews for this report found evidence of SMEs’ strong preference for bank lending over personal or other equity financing. This has led to the lack of alternative sources of financing, such as venture capital and angel investing, being developed for SMEs in Europe.
Venture capital (VC) and angel investment is significantly higher in the US than in Europe, with VC firms investing €26bn in US SMEs in 2013 versus only €5bn in Europe, and angel investors investing €20bn in US SMEs versus only €6bn in Europe. Nevertheless, a shift is taking place in US VC funding – away from seed financing towards later-stage financing, and potentially reducing the funds available to smaller start-up firms.
Our analysis suggests that friends and family play a more significant role in SME financing in the US than in Europe. One survey conducted by the European Commission estimates that approximately 5% of funds obtained by SMEs are from family or friends. This varies significantly across Europe, ranging from just 1% in France to 24% in the Netherlands. Although more recent data for the US are not available, a 2011 study by the US Small Business Administration indicates that 60% of firms relied on personal or family savings for start-up capital, while over 25% of firms using expansion financing relied on personal/family savings. Approximately 18% of SMEs used private loans from friends and family. Crowdfunding and P2P lending are also becoming more popular as a form of SME financing, with our estimates showing approximately €3bn having based by US SMEs vs approximately €1bn by their European counterparts.
Finally, government financial support for SMEs – through guarantees and sponsored loans – appears to be larger in Europe than in the US. The US Small Business Administration (Box 1) indicates that it extended €27bn of support in 2013, including 7(a) and 504 loans, export-import bank-supported credit insurance and export working capital. This number is smaller than the estimated €66bn committed by national governments in Germany, France, Italy, Spain and the UK, and European Commission-led measures.7
Better financing for SMEs
Bridging the growth gapPage 28
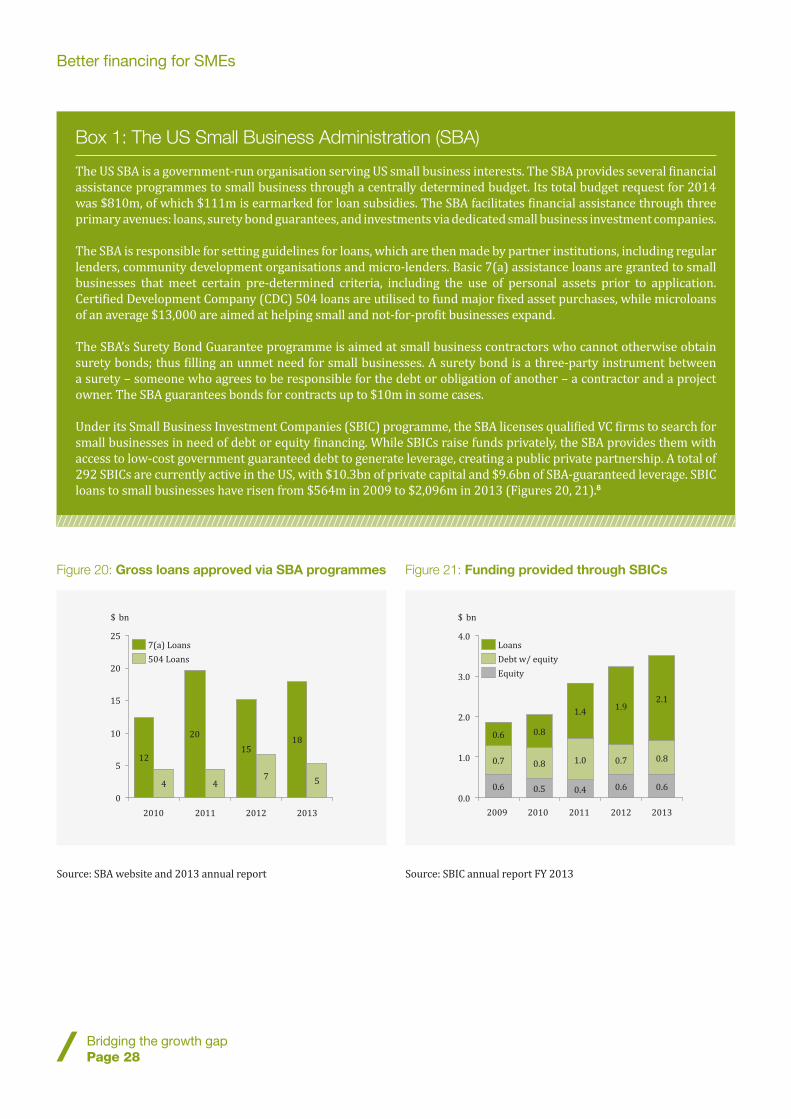
Figure 20: Gross loans approved via SBA programmes
Source: SBA website and 2013 annual report
Figure 21: Funding provided through SBICs
Source: SBIC annual report FY 2013
12
2015
18
4 47 5
0
5
10
15
20
25
20132010
$ bn
20122011
504 Loans7(a) Loans
4.0
3.0
2.0
1.0
0.0
$ bn
2013
0.6
0.8
2.1
2012
0.6
0.7
1.9
2011
0.4
1.0
1.4
2010
0.5
0.8
0.8
2009
0.6
0.7
0.6
Equity
LoansDebt w/ equity
Box 1: The US Small Business Administration (SBA)
The US SBA is a government-run organisation serving US small business interests. The SBA provides several financial assistance programmes to small business through a centrally determined budget. Its total budget request for 2014 was $810m, of which $111m is earmarked for loan subsidies. The SBA facilitates financial assistance through three primary avenues: loans, surety bond guarantees, and investments via dedicated small business investment companies.
The SBA is responsible for setting guidelines for loans, which are then made by partner institutions, including regular lenders, community development organisations and micro-lenders. Basic 7(a) assistance loans are granted to small businesses that meet certain pre-determined criteria, including the use of personal assets prior to application. Certified Development Company (CDC) 504 loans are utilised to fund major fixed asset purchases, while microloans of an average $13,000 are aimed at helping small and not-for-profit businesses expand.
The SBA’s Surety Bond Guarantee programme is aimed at small business contractors who cannot otherwise obtain surety bonds; thus filling an unmet need for small businesses. A surety bond is a three-party instrument between a surety – someone who agrees to be responsible for the debt or obligation of another – a contractor and a project owner. The SBA guarantees bonds for contracts up to $10m in some cases.
Under its Small Business Investment Companies (SBIC) programme, the SBA licenses qualified VC firms to search for small businesses in need of debt or equity financing. While SBICs raise funds privately, the SBA provides them with access to low-cost government guaranteed debt to generate leverage, creating a public private partnership. A total of 292 SBICs are currently active in the US, with $10.3bn of private capital and $9.6bn of SBA-guaranteed leverage. SBIC loans to small businesses have risen from $564m in 2009 to $2,096m in 2013 (Figures 20, 21).8
////////////////////////////////////////////////////////////////////////////////////////////////////////////////////////////////////////////////////////////////////////////////////////////////////////////////////////////////
Better financing for SMEs
Bridging the growth gapPage 29
Perceived problems in Europe today
The interviews with banks, investors and trade associations highlighted five chief areas of concern for European SMEs:
1. Presence and accessibility of adequate funding avenues
2. Evaluation, scoring and rating of SMEs by lenders and investors
3. Differences in financing sources
4. Availability and success of government support initiatives
5. Use of the securitisation market to distribute SME loan-backed securities
Below, we address each of these points before identifying possible solutions in the following section.
Presence and accessibility of adequate funding avenues for SMEs
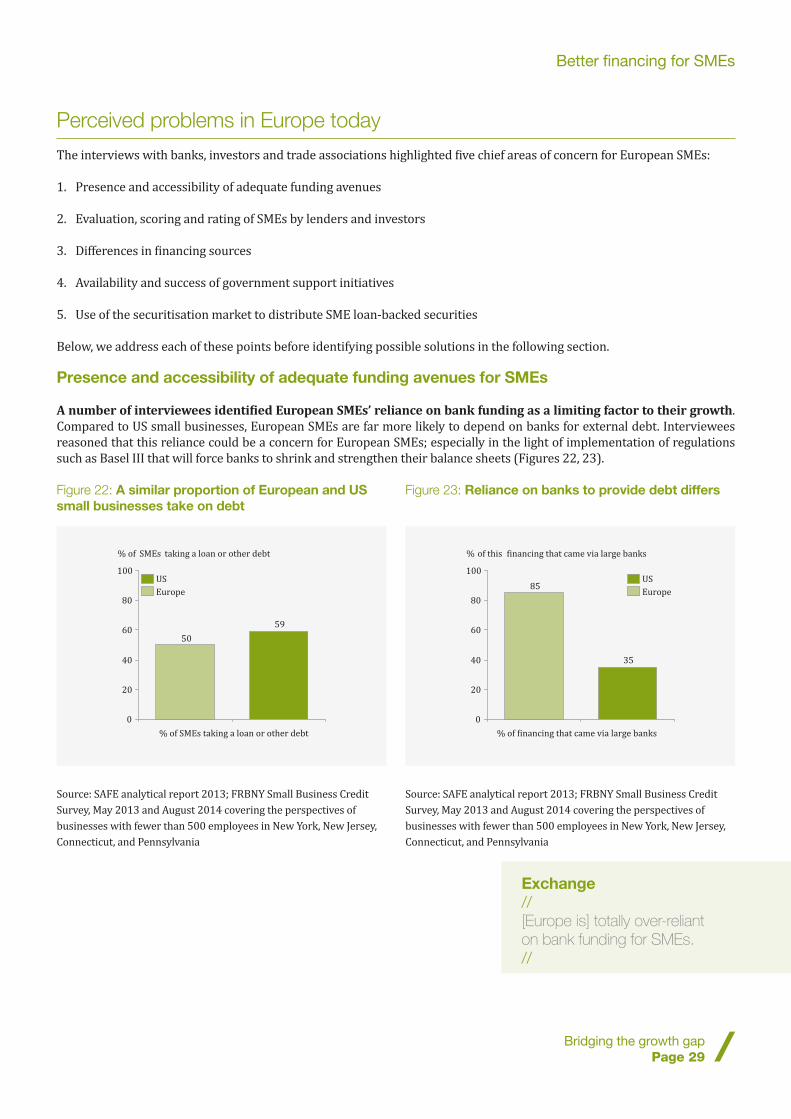
A number of interviewees identified European SMEs’ reliance on bank funding as a limiting factor to their growth. Compared to US small businesses, European SMEs are far more likely to depend on banks for external debt. Interviewees reasoned that this reliance could be a concern for European SMEs; especially in the light of implementation of regulations such as Basel III that will force banks to shrink and strengthen their balance sheets (Figures 22, 23).
Figure 22: A similar proportion of European and US small businesses take on debt
Source: SAFE analytical report 2013; FRBNY Small Business Credit Survey, May 2013 and August 2014 covering the perspectives of businesses with fewer than 500 employees in New York, New Jersey, Connecticut, and Pennsylvania
50
59
0
20
40
60
80
100
% of SMEs taking a loan or other debt
% of SMEs taking a loan or other debt
US
Europe
Figure 23: Reliance on banks to provide debt differs
Source: SAFE analytical report 2013; FRBNY Small Business Credit Survey, May 2013 and August 2014 covering the perspectives of businesses with fewer than 500 employees in New York, New Jersey, Connecticut, and Pennsylvania
85
35
0
20
40
60
80
100
% of this �inancing that came via large banks
% of �inancing that came via large banks
US
Europe
Exchange//[Europe is] totally over-reliant on bank funding for SMEs.//
Better financing for SMEs
Bridging the growth gapPage 30
SMEs are also more reliant on bank loans than larger firms in Europe. Recent analysis based on data from the Bank for the Accounts of Companies Harmonised (BACH) highlight that bank loans constitute 23% of small and 20% of medium firms' balance sheets, compared with only 11% for large firms.9
The interviews also revealed that some banks are not seeing adequate demand for loans from SMEs that meet their lending criteria. A recent ECB working paper10 indicates that credit supply shocks explained only one-third of the fall in lending growth during the crisis. This indicates declining demand may have played a significant role in the fall in bank lending to SMEs.
An interesting observation by some lenders was that SMEs often approach banks for "equity-type" loans, with the assumption that bank loans should fulfil a similar role to alternative financing sources: e.g. venture capital or angel investment. Banks are discouraged from providing equity under current banking regulations.
Interviewees also highlighted that SMEs' historical reliance on banks meant that SMEs often feel lost when trying to identify alternative sources of funding. This is not helped by the plethora of government and non-government schemes set up to support SMEs in recent times. The US Small Business Administration was identified by both bank and non-bank sources as a good example of a "one-stop-shop" for SMEs in need of both advice and funding.
Evaluation, scoring and rating of SMEs by lenders and investors
A number of investors identified the difficulty in evaluating SMEs and the lack of a consistent definition for SMEs across European countries as roadblocks to investment. Given the small ticket size of SME loans, interviewees noted that it is not generally economically viable for non-banks to conduct research on individual SMEs. It is also difficult to conduct such research due to a lack of available data. Interviewees cited the lack of consistent and timely information, especially across different European countries, as an inhibitor to SME lending.
Asset Manager//We need to find a new source of financing for small corporate in Europe and can potentially look to the US as an example.//
Hedge Fund//The US has, and always has had, a great focus on entrepreneurship... This starts at a young age... The European education system doesn’t seem as progressive in this regard...//
Exchange//Europe lacks a tier of advisors who are set up to help SMEs raise funds. This exists more in the US.//
Some investors cited the inconsistent use of SME definitions as a further barrier to growth. Although the European Commission has mandated a standard definition for SMEs across the European Union (Box 2), it was found that national governments, lenders and their associations often used different definitions of SMEs. Interviewees said this made it more complex to understand the nature of underlying risks; especially within portfolios of SME loans.
While a consistently-applied definition for SMEs across Europe would benefit investors in terms of categorisation of risks, interviewees believed that this would also allow for more targeted and therefore effective national and pan-European SME support schemes.
The current European definition of SMEs (Box 2) includes firms of vastly different sizes and does not allow for differentiation on the basis of industry. In contrast, the US SBA practice of providing constantly updated, industry-specific definitions for eligibility as a small business was cited by interviewees as a good example of definitions facilitating targeted support for SMEs. Since all lenders should retain the flexibility to define SMEs in any way that suits their commercial business, a more refined categorisation for both public support and investor credit review reasons could improve effectiveness of subsidies and enhance the availability of information provided to investors.

Better financing for SMEs
Bridging the growth gapPage 31
Investors also identified a lack of easily accessible information on SMEs as a deterrent to investing, especially in the case of cross-border investment decisions. This should not come as a surprise, given Europe's historical reliance on a bank-based system that derives its value from local knowledge and expertise. This reliance on local knowledge and expertise manifests itself in another roadblock identified by interviewees – the reliance on qualitative factors when making investment decisions.
Several interviewees across Europe and the US explained that a better rating or scoring system for SMEs would make them feel more equipped to invest directly or through SME-loan-backed securities. It was accepted, however, that the cost of establishing such a system might be prohibitively high, given the large number of SMEs.
Box 2: Definitions of SMEs
Standard European definition, according to EU law (EU recommendation 2003/361)
Micro enterprises: Enterprises employing fewer than 10 people, with an annual turnover not exceeding €2m, and/or a balance sheet total not exceeding €2m.
Small enterprises: Enterprises larger than micro firms, but employing fewer than 50 people, with annual turnover not exceeding €10m.
Medium-sized enterprises: firms larger than small enterprises, but employing fewer than 250 people, with annual turnover not exceeding €50m.
MiFID II definition: SMEs are defined for the purposes of MiFID II as companies that had an average market capitalisation of less than €200m on the basis of end-year quotes for the previous three calendar years. As ESMA points out, this could be interpreted as excluding all SMEs with a lifespan of less than three years from counting towards the 50% threshold.
US Small Business Administration definition
The Small Business Administration (SBA) defines a small business concern as one that is: independently owned and operated, organised for profit, and not dominant in its field. Depending on the industry, size standard eligibility is based on the average number of employees for the preceding 12 months, or on sales volume averaged over a three-year period. Examples of SBA general size standards include:
• Manufacturing: maximum number of employees may range from 500 to 1,500, depending on product manufactured
• Wholesaling: maximum number of employees may range from 100 to 500, depending on product being provided
• Services: annual receipts may not exceed $2.5m to $21.5m, depending on service being provided
• Retailing: annual receipts may not exceed $5m to $21m, depending on the product being provided
• General and heavy construction: general construction annual receipts may not exceed $13.5m to $17m, depending on the type of construction
• Special trade construction: annual receipts may not exceed $7m
• Agriculture: annual receipts may not exceed $0.5m to $9m, depending on the type of agricultural product
////////////////////////////////////////////////////////////////////////////////////////////////////////////////////////////////////////////////////////////////////////////////////////////////////////////////////////////////
Better financing for SMEs
Bridging the growth gapPage 32
Differences in financing sources
The greater use of alternative financing sources (e.g. venture capital and angel funding) in the US further bolsters the equity component of US small businesses’ balance sheets, making the differences between European and US capital structures even greater.
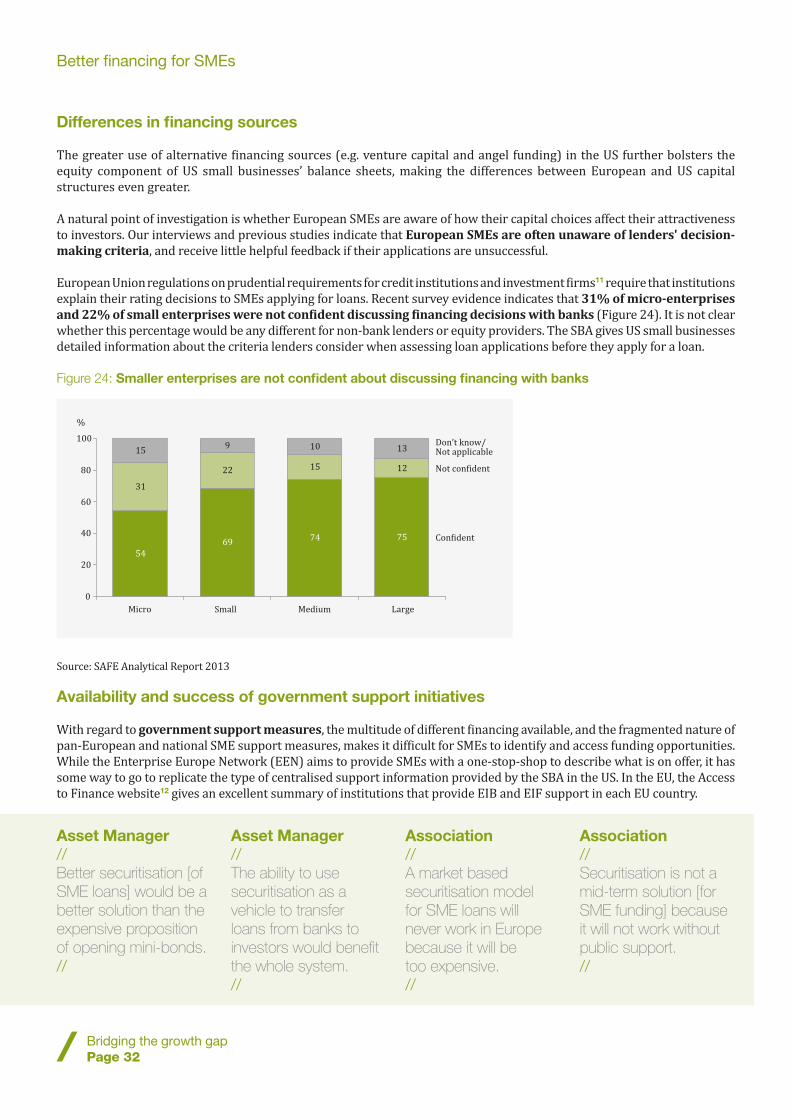
A natural point of investigation is whether European SMEs are aware of how their capital choices affect their attractiveness to investors. Our interviews and previous studies indicate that European SMEs are often unaware of lenders' decision-making criteria, and receive little helpful feedback if their applications are unsuccessful.
European Union regulations on prudential requirements for credit institutions and investment firms11 require that institutions explain their rating decisions to SMEs applying for loans. Recent survey evidence indicates that 31% of micro-enterprises and 22% of small enterprises were not confident discussing financing decisions with banks (Figure 24). It is not clear whether this percentage would be any different for non-bank lenders or equity providers. The SBA gives US small businesses detailed information about the criteria lenders consider when assessing loan applications before they apply for a loan.
Figure 24: Smaller enterprises are not confident about discussing financing with banks
Source: SAFE Analytical Report 2013
Availability and success of government support initiatives
With regard to government support measures, the multitude of different financing available, and the fragmented nature of pan-European and national SME support measures, makes it difficult for SMEs to identify and access funding opportunities. While the Enterprise Europe Network (EEN) aims to provide SMEs with a one-stop-shop to describe what is on offer, it has some way to go to replicate the type of centralised support information provided by the SBA in the US. In the EU, the Access to Finance website12 gives an excellent summary of institutions that provide EIB and EIF support in each EU country.
54
6974 75
31
22 15 12
159 10 13
0
20
40
60
80
100
Con�ident
Don’t know/Not applicable
%
SmallMicro Large
Not con�ident
Medium
Asset Manager//Better securitisation [of SME loans] would be a better solution than the expensive proposition of opening mini-bonds.//
Asset Manager//The ability to use securitisation as a vehicle to transfer loans from banks to investors would benefit the whole system.//
Association//A market based securitisation model for SME loans will never work in Europe because it will be too expensive.//
Association//Securitisation is not a mid-term solution [for SME funding] because it will not work without public support.//

Better financing for SMEs
Bridging the growth gapPage 33
The SBA's position as gatekeeper to government subsidies and guarantees in the US means that support schemes are centralised and easy to access for small businesses. The US focus on SBICs – first introduced in 1958 under the Eisenhower administration – also means that a major avenue of government support is provided through non-bank investors. Potential direct support provided by US state and local governments to SMEs has not been reviewed as part of this study.
Use of the securitisation market to distribute SME-loan-backed securities
A final area of concern identified by interviewees was the underdeveloped nature of Europe's securitisation market. A number of interviewees highlighted that banks' inability to distribute the SME loans on their balance sheets restricted their capacity to lend to SMEs. However, interviewees gave mixed responses regarding the feasibility of a large-scale European market for SME-loan-backed securities. Some believed this was already a viable option, while others thought public support would be necessary to bring it into being.
Detailed efforts to build a deeper market and improve the economics of securitisation in Europe lie beyond the scope of this report, and are more closely aligned with other reports published by AFME: www.afme.eu/securitisation. We would, however, note that interviewees identified two primary explanations for Europe's relatively under-developed securitisation market.
Firstly, it was felt that Europe's geographic diversity and historic reliance on bank lending had hindered the development of a pan-European originate-to-distribute model. Secondly, some interviewees considered that Solvency II requirements applied a disproportionate capital charge to securitised assets, dissuading investors from investing in them.
Both within the context of securitisation and more generally, interviewees identified the superior capabilities of non-bank investors in the US – towards due diligence and risk management – as a significant contributor to their higher risk appetite and willingness to innovate.
What Europe could do differently on SMEs?
AFME identifies possible solutions to some of the roadblocks identified through our interviews; drawing on best practices from our study of the US and other markets. While some of these solutions are concrete, others are suggestions made by interviewees that will require further exploration.
Some interviewees highlighted that a more centralised approach to tackling SMEs' financing and growth concerns could be beneficial to SME growth in Europe. To this end, they said that merging existing initiatives into a single entity acting as a gatekeeper to both national level and pan-European SME support schemes should be a top priority. As highlighted earlier in this report, the US SBA provides a good example of such an organisation, and an existing initiative such as the Enterprise Europe Network could provide a suitable base for a more comprehensive solution.
Another concern identified was the difficulty European SMEs face in accessing non-bank funding alternatives such as venture capital, angel investment and micro loans. Here, too, interviewees said a centrally managed initiative similar to the US SBA-led SBICs would help European SMEs. If such vehicles could be set up at pan-European level, and facilitated through a single US SBA-style entity, they could also help facilitate greater cross-border investment.
Asset Manager//I don’t think access to information [on SMEs] is an issue; banks fulfill this function and can be partnered with to act as a reliable, regional rating agency.//
Asset Manager//Having a single product across Europe is key.//

Better financing for SMEs
Bridging the growth gapPage 34
Such measures, while undoubtedly crucial to European SMEs’ ability to access the funding they require, can only be implemented in the medium term. More urgently, our interviewees supported the case for comprehensive ‘how to’ guide for European SMEs. Such a guide would provide SMEs with an overview of the financing alternatives and support schemes for which they are eligible, so long as they are widely available.
While interviewees said easily accessible ratings or credit scores for SMEs would help increase the flow of funds to creditworthy SMEs, they conceded that providing these ratings could be prohibitively expensive, due to the number of firms and quantity of analysis involved.
In the medium-term, interviewees believed it crucial to explore ways of allowing lenders to profit from sharing their internal ratings systems; predominantly lenders with regional expertise. One possible way to achieve this could be through promotion of partnerships between lenders and asset managers, with the former responsible for conducting diligence. While such partnerships may already be in operation (e.g. Barclays’ partnership with BlueBay Asset Management),13 streamlining the process of establishing them, and reducing restrictions they are subject to, would increase their use in Europe.
In the short term, interviewees said that implementation of consistent, industry-based definitions for SMEs across Europe could help investors evaluate investment opportunities more easily; especially in relation to SME loan portfolios and securitisations. Our interviews underscored the need for crucial economic actors – lenders, data providers and governments – to all have uniform definitions to facilitate instruments that are truly tradable across Europe.
As discussed above, the interviews indicated that European SMEs' preference for debt appears to have made them less attractive to potential investors. Exploring this through interviews and research yielded two possible solutions.
Firstly, aligning the tax treatment of debt and equity would give SMEs more incentive to use more equity capital. Currently, unequal rates of taxation discourage many European firms from raising equity. German dividends, for example, are taxed at 50%, while debt is taxed at 25%. Greater use of the Allowance for Corporate Equity (ACE), in practice in Belgium and more recently in Italy, together with capital gains exemptions for equity sales by SMEs, were also suggested by interviewees. These options are certainly worth exploring.
Secondly, and with a longer-term horizon in mind, fostering a culture of risk-taking and innovation among SMEs and SME investors could create more balanced capital structures. Towards this end, interviewees recommended educating both SMEs and potential investors about the benefits of Europe’s dedicated SME exchanges, such as the LSE's AIM or Euronext's Alternext. The route to market for SMEs should be made easier by regulation, not more daunting.
In the short-term, two possible solutions were identified by interviewees: better implementation of European Commission regulations aimed at the explanation of lending decisions; and, educating SME loan applicants about the criteria for credit risk assessment, to help them prepare more thoroughly when applying for loans.
Finally, some interviewees argued that a well-functioning market for SME-loan-backed securities could help increase banks' capacity to lend to SMEs in Europe. The broader subject of developing securitisation markets in Europe, however, lies beyond the scope of this report and is discussed in other AFME publications.
Exchange//We increasingly see the importance of working with angel investors and VCs to make the route to market easier.//
Exchange//Prospectus requirements are more onerous in Europe than in the US. In the US, the threshold for exclusion from prospectus is higher, easing the ability to raise non-bank funding in the US.//

Better financing for SMEs
Bridging the growth gapPage 35
SME summary
European roadblocks US view Possible actions
Evaluation / rating
• Lack of high-quality and easily accessible information on SMEs makes due diligence difficult
• Lack of consistently applied SME definitions within and across countries and industries
• Evaluation often involves qualitative factors that are not easy to explain and share
• Economics of rating/scoring SMEs may be prohibitive
• Limited availability of scorings and ratings for SMEs
• Greater consistency in definition and application process, with no data restrictions applied across states
• Established, well-regarded and national credit rating system (FICO) score
• Increasing use of ‘Big Data’ among newer firms to include non-financial/public data to review financing applications
• SBA role in providing financing enables greater linkage with other financial data
• Increase use of mandatory reporting for key financial information in public records such as developed in France and Italy
• Ensure greater access to, and linkage with, existing data records on file to improve general SME quality of information
• Extend data sharing agreements with supra-national agencies across borders to enable higher quality assessment
• Explore the use of consistent, industry-based definitions for SMEs
Locating funding avenues
• Alternative sources of financing such as VC and angel investing are underdeveloped in Europe
• Applying to multiple lenders risks tarnishing credit record through multiple failed applications
• Strong culture of internal funds and personal savings/wealth for SMEs
• Significantly larger and more developed VC and angel investing market in US (vs EU)
• US Small Business Association (SBA) is ‘one-stop-shop’ for SMEs, providing access to required information in a user-friendly way
• Higher cultural risk appetite has led to better development of credible alternative avenues
• Create comprehensive ‘how to’ financing guides for SMEs to use as their source
• Merge existing initiatives and further develop a single European SME entity, along the lines of US SBA
• Facilitate VC investing through promotion of SME equity initiatives e.g. US SBA-led SBIC initiative
SME risk
• SMEs have strong preference for debt over equity
• High debt ratios are potentially unattractive to lenders
• SMEs unaware of decision process and need for more equity
• SMEs receive insufficient feedback on their application in the event that it is unsuccessful
• Limited risk taking across borders
• Culture of personal savings/wealth makes for more attractive capital structure
• Higher equity on balance sheet / use of VC funds
• More information readily available on loan decisions
• SBA provides significant information resources to SMEs
• Promote a culture of greater equity involvement through use of personal savings / wealth
• Provide feedback to SMEs through better application of CRR 431 (4)
• Explore ways to incentivise sharing of internal rating systems towards harmonisation profitable to banks
Government support
• Government support programmes often difficult to find/hard to obtain and regularly require use of a bank or other intermediary to make application
• SBA plays a prominent role as gatekeeper to government subsidies and guarantees
• Many subsidies/loans provided without need for bank
• Mandate a single entity as the gatekeeper of European subsidies / guarantees
• Explore alternative to banks as provider of subsidies / guarantees
Use of securitisation
• Originate-to-distribute model of financing is less prevalent in Europe
• Solvency II applies an unduly high capital charge for securitised assets, dissuading investment
• Originate-to-distribute model more established in US
• Better capabilities among non-bank investors to assess risk
• Further develop securitisation market regulatory framework
• Promote partnerships between banks and investors with former conducting diligence and co-investing with latter

Increasing investment in long-term infrastructure
projects
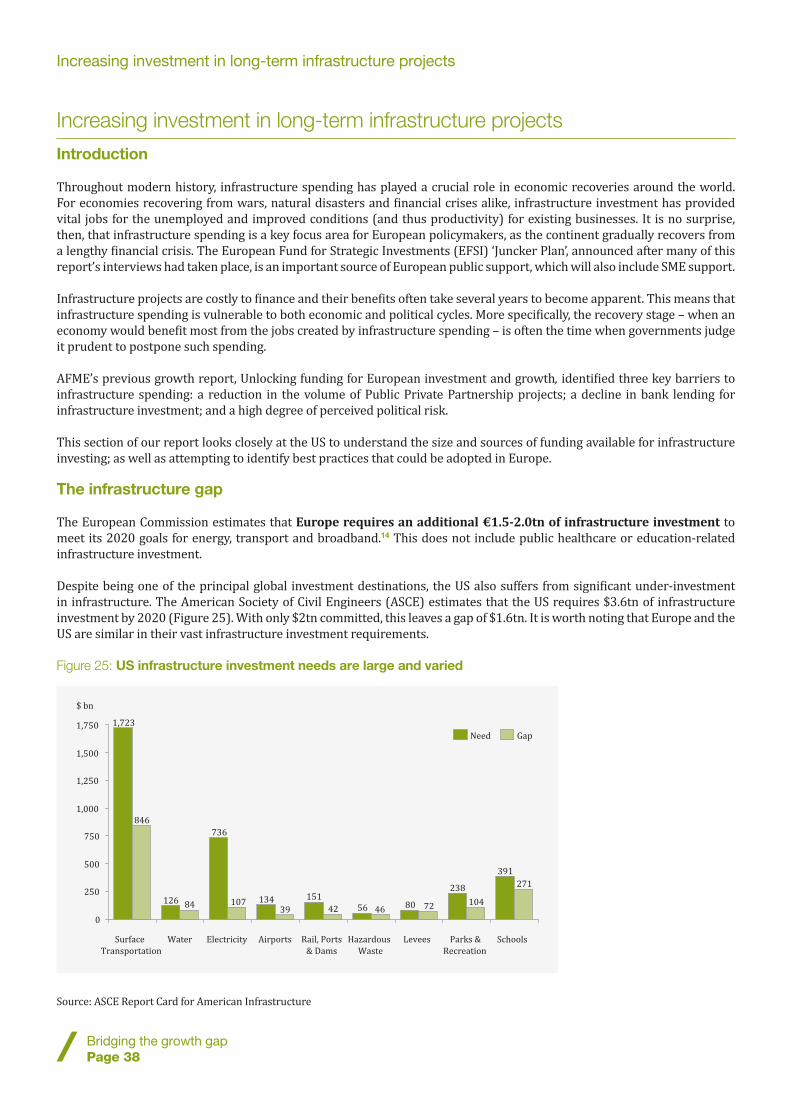
Increasing investment in long-term infrastructure projects
Bridging the growth gapPage 38
Increasing investment in long-term infrastructure projects
Introduction
Throughout modern history, infrastructure spending has played a crucial role in economic recoveries around the world. For economies recovering from wars, natural disasters and financial crises alike, infrastructure investment has provided vital jobs for the unemployed and improved conditions (and thus productivity) for existing businesses. It is no surprise, then, that infrastructure spending is a key focus area for European policymakers, as the continent gradually recovers from a lengthy financial crisis. The European Fund for Strategic Investments (EFSI) ‘Juncker Plan’, announced after many of this report’s interviews had taken place, is an important source of European public support, which will also include SME support.
Infrastructure projects are costly to finance and their benefits often take several years to become apparent. This means that infrastructure spending is vulnerable to both economic and political cycles. More specifically, the recovery stage – when an economy would benefit most from the jobs created by infrastructure spending – is often the time when governments judge it prudent to postpone such spending.
AFME’s previous growth report, Unlocking funding for European investment and growth, identified three key barriers to infrastructure spending: a reduction in the volume of Public Private Partnership projects; a decline in bank lending for infrastructure investment; and a high degree of perceived political risk.
This section of our report looks closely at the US to understand the size and sources of funding available for infrastructure investing; as well as attempting to identify best practices that could be adopted in Europe.
The infrastructure gap
The European Commission estimates that Europe requires an additional €1.5-2.0tn of infrastructure investment to meet its 2020 goals for energy, transport and broadband.14 This does not include public healthcare or education-related infrastructure investment.
Despite being one of the principal global investment destinations, the US also suffers from significant under-investment in infrastructure. The American Society of Civil Engineers (ASCE) estimates that the US requires $3.6tn of infrastructure investment by 2020 (Figure 25). With only $2tn committed, this leaves a gap of $1.6tn. It is worth noting that Europe and the US are similar in their vast infrastructure investment requirements.
Figure 25: US infrastructure investment needs are large and varied
Source: ASCE Report Card for American Infrastructure
0
250
500
750
1,000
1,250
1,500
1,750
Parks &
Recreation
104
238
Levees
7280
Hazardous
Waste
4656
Rail, Ports
& Dams
Water
84126
Surface
Transportation
846
151
$ bn
Airports
39134
Electricity
42107
Schools
271
391
736
1,723
GapNeed
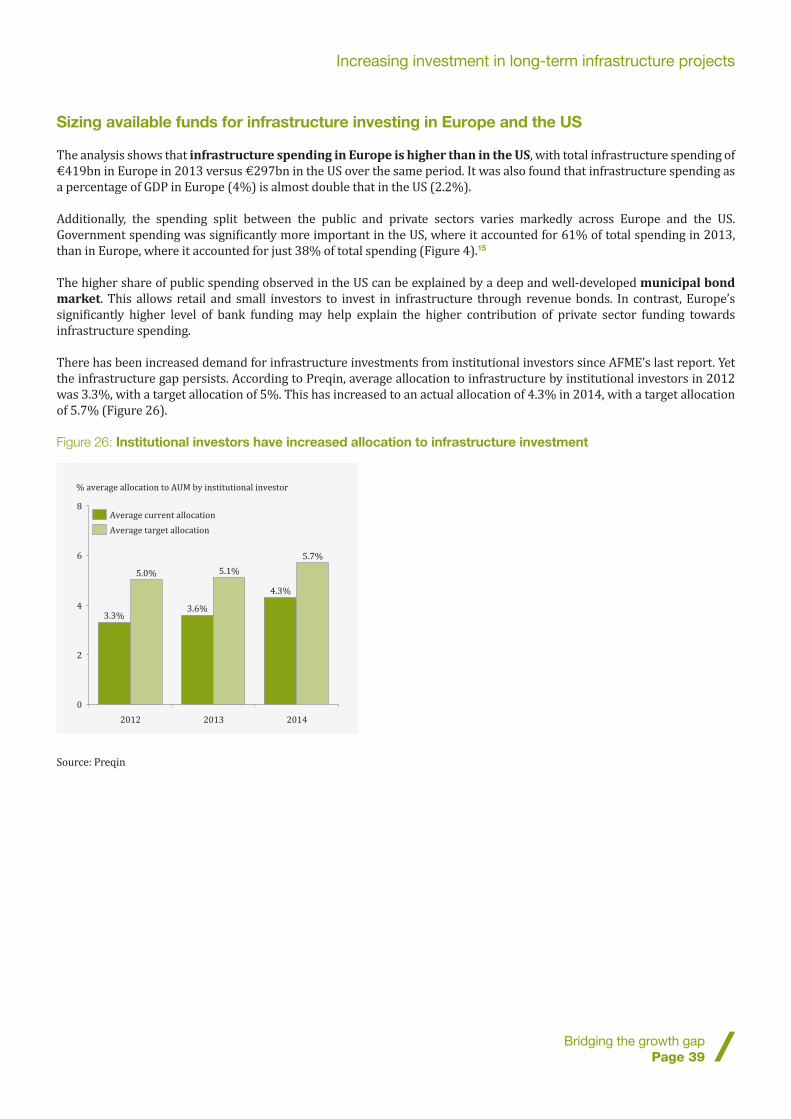
Increasing investment in long-term infrastructure projects
Bridging the growth gapPage 39
Sizing available funds for infrastructure investing in Europe and the US
The analysis shows that infrastructure spending in Europe is higher than in the US, with total infrastructure spending of €419bn in Europe in 2013 versus €297bn in the US over the same period. It was also found that infrastructure spending as a percentage of GDP in Europe (4%) is almost double that in the US (2.2%).
Additionally, the spending split between the public and private sectors varies markedly across Europe and the US. Government spending was significantly more important in the US, where it accounted for 61% of total spending in 2013, than in Europe, where it accounted for just 38% of total spending (Figure 4).15
The higher share of public spending observed in the US can be explained by a deep and well-developed municipal bond market. This allows retail and small investors to invest in infrastructure through revenue bonds. In contrast, Europe’s significantly higher level of bank funding may help explain the higher contribution of private sector funding towards infrastructure spending.
There has been increased demand for infrastructure investments from institutional investors since AFME’s last report. Yet the infrastructure gap persists. According to Preqin, average allocation to infrastructure by institutional investors in 2012 was 3.3%, with a target allocation of 5%. This has increased to an actual allocation of 4.3% in 2014, with a target allocation of 5.7% (Figure 26).
Figure 26: Institutional investors have increased allocation to infrastructure investment
Source: Preqin
0
2
4
6
8
2012
5.0%
3.3%
5.7%
2013
% average allocation to AUM by institutional investor
4.3%
5.1%
3.6%
2014
Average current allocation
Average target allocation

Increasing investment in long-term infrastructure projects
Bridging the growth gapPage 40
What could Europe do differently?
Through in-depth interviews with asset managers, insurance companies, pension funds and their trade associations, AFME was able to identify the following five areas as key potential growth barriers to infrastructure investing in Europe:
1. Political risk and legal uncertainty
2. Government involvement, credit enhancement and project viability
3. Accounting and regulatory treatment of investments
4. Demand linkages
5. Accessibility to smaller investors
AFME addresses each of these below before identifying possible solutions.
Political risk and legal uncertainty
Several interviewees stated that the single largest determinant of infrastructure investment decisions is the political and regulatory risk of the country where a project is located. They explained that the stability of an existing government, the likelihood that it would change the rules governing a project, and the nature of that nation’s dispute resolution processes, were key determinants of risk in the case of infrastructure investing.
Asset Manager//The return to infrastructure investing is heavily affected by political interference.//
Insurance Company//For infrastructure, there is always a direct or indirect link with politics; if the regulatory framework is not clear and hasn’t been demonstrated to be solid, we won’t invest.//
Insurance Company//Political risk from governments remains the biggest fundamental risk.//
Private Equity Investor//Once bitten twice shy... Some investors were burned by movements of the government and will think again before making investments in this market.//
More specifically, interviewees highlighted instances where European governments had ‘moved the goal posts’ on commitments made to them – amending project terms retrospectively and changing the return on investments they had anticipated. Interviewees said that if such actions had taken place – even not recently – this significantly decreased the certainty of project payoffs and made them more cautious about investing in that country again.
Within Europe, infrastructure investors pointed towards the UK as a transparent market with a stable political and regulatory framework that increased their desire to invest. This stood in contrast to other European countries, such as Italy and Spain, where previous actions caused investors to assess potential opportunities with greater caution.
The US, in contrast, was lauded for its stable political regime and sound legal system. Interviewees noted the length of infrastructure investments meant that a transparent and well-defined dispute resolution process was something they considered when making decisions. It is likely that the US scores highly in this regard. The recent ARCADIS Global Infrastructure Investment Index, which scores countries according to their attractiveness to investors, places the US above most European countries. The index also highlights the wide dispersion of attractiveness among European countries (Figure 27).
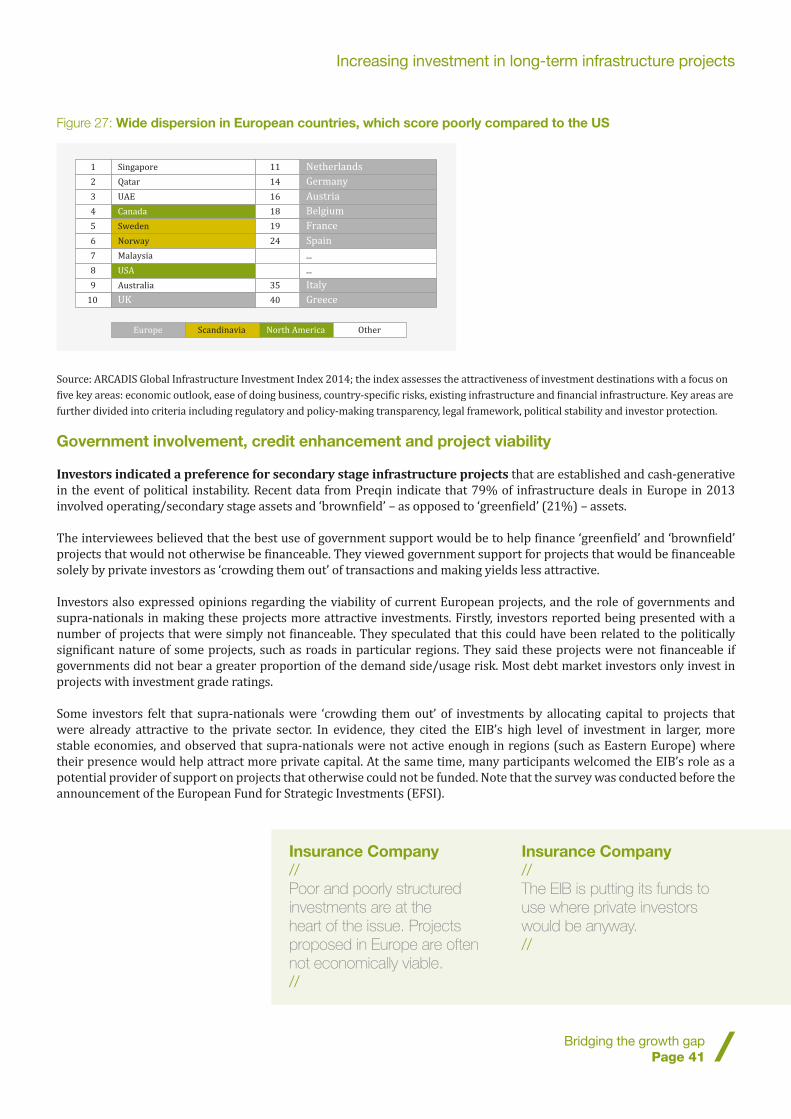
Increasing investment in long-term infrastructure projects
Bridging the growth gapPage 41
Figure 27: Wide dispersion in European countries, which score poorly compared to the US
Source: ARCADIS Global Infrastructure Investment Index 2014; the index assesses the attractiveness of investment destinations with a focus on five key areas: economic outlook, ease of doing business, country-specific risks, existing infrastructure and financial infrastructure. Key areas are further divided into criteria including regulatory and policy-making transparency, legal framework, political stability and investor protection.
Government involvement, credit enhancement and project viability
Investors indicated a preference for secondary stage infrastructure projects that are established and cash-generative in the event of political instability. Recent data from Preqin indicate that 79% of infrastructure deals in Europe in 2013 involved operating/secondary stage assets and ‘brownfield’ – as opposed to ‘greenfield’ (21%) – assets.
The interviewees believed that the best use of government support would be to help finance ‘greenfield’ and ‘brownfield’ projects that would not otherwise be financeable. They viewed government support for projects that would be financeable solely by private investors as ‘crowding them out’ of transactions and making yields less attractive.
Investors also expressed opinions regarding the viability of current European projects, and the role of governments and supra-nationals in making these projects more attractive investments. Firstly, investors reported being presented with a number of projects that were simply not financeable. They speculated that this could have been related to the politically significant nature of some projects, such as roads in particular regions. They said these projects were not financeable if governments did not bear a greater proportion of the demand side/usage risk. Most debt market investors only invest in projects with investment grade ratings.
Some investors felt that supra-nationals were ‘crowding them out’ of investments by allocating capital to projects that were already attractive to the private sector. In evidence, they cited the EIB’s high level of investment in larger, more stable economies, and observed that supra-nationals were not active enough in regions (such as Eastern Europe) where their presence would help attract more private capital. At the same time, many participants welcomed the EIB’s role as a potential provider of support on projects that otherwise could not be funded. Note that the survey was conducted before the announcement of the European Fund for Strategic Investments (EFSI).
1 Singapore 11 Netherlands
2 Qatar 14 Germany
3 UAE 16 Austria
4 Canada
North AmericaScandinaviaEurope Other
18 Belgium
5 Sweden 19 France
6 Norway 24 Spain
7 Malaysia ...
8 USA ...
9 Australia 35 Italy
10 UK 40 Greece
Insurance Company//Poor and poorly structured investments are at the heart of the issue. Projects proposed in Europe are often not economically viable.//
Insurance Company//The EIB is putting its funds to use where private investors would be anyway.//
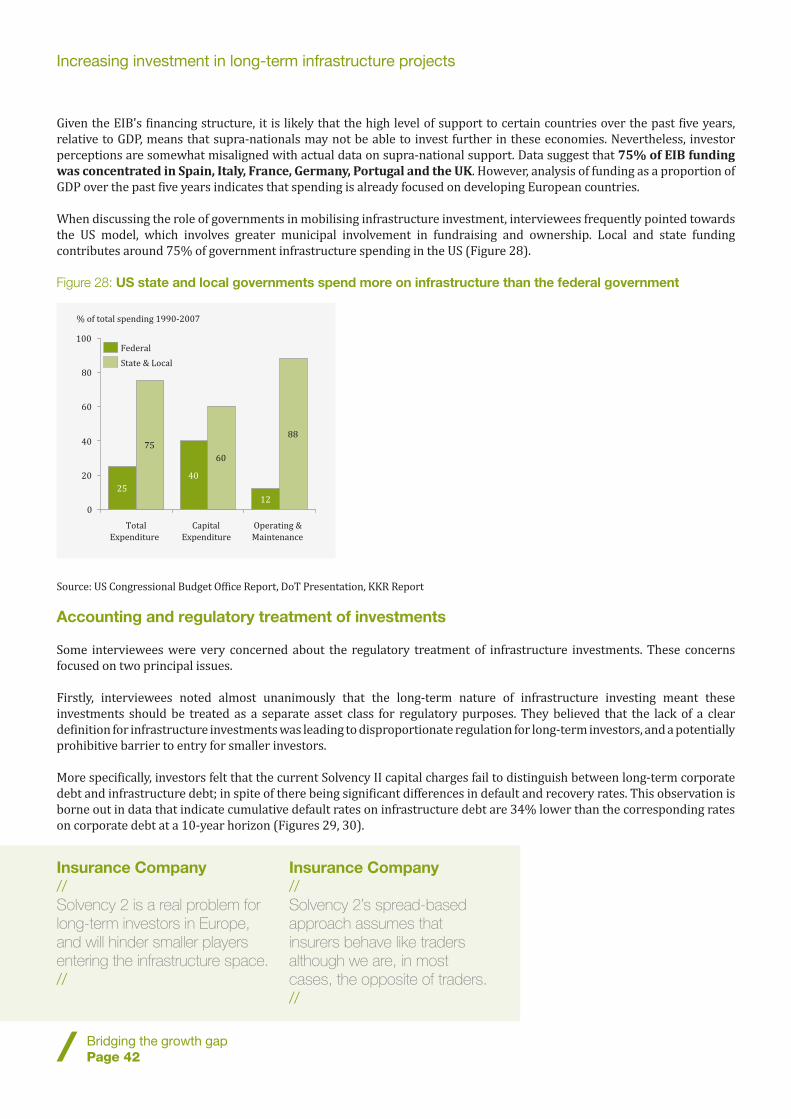
Increasing investment in long-term infrastructure projects
Bridging the growth gapPage 42
Given the EIB's financing structure, it is likely that the high level of support to certain countries over the past five years, relative to GDP, means that supra-nationals may not be able to invest further in these economies. Nevertheless, investor perceptions are somewhat misaligned with actual data on supra-national support. Data suggest that 75% of EIB funding was concentrated in Spain, Italy, France, Germany, Portugal and the UK. However, analysis of funding as a proportion of GDP over the past five years indicates that spending is already focused on developing European countries.
When discussing the role of governments in mobilising infrastructure investment, interviewees frequently pointed towards the US model, which involves greater municipal involvement in fundraising and ownership. Local and state funding contributes around 75% of government infrastructure spending in the US (Figure 28).
Figure 28: US state and local governments spend more on infrastructure than the federal government
Source: US Congressional Budget Office Report, DoT Presentation, KKR Report
Accounting and regulatory treatment of investments
Some interviewees were very concerned about the regulatory treatment of infrastructure investments. These concerns focused on two principal issues.
Firstly, interviewees noted almost unanimously that the long-term nature of infrastructure investing meant these investments should be treated as a separate asset class for regulatory purposes. They believed that the lack of a clear definition for infrastructure investments was leading to disproportionate regulation for long-term investors, and a potentially prohibitive barrier to entry for smaller investors.
More specifically, investors felt that the current Solvency II capital charges fail to distinguish between long-term corporate debt and infrastructure debt; in spite of there being significant differences in default and recovery rates. This observation is borne out in data that indicate cumulative default rates on infrastructure debt are 34% lower than the corresponding rates on corporate debt at a 10-year horizon (Figures 29, 30).
25
40
12
75
60
88
0
20
40
60
80
100
% of total spending 1990-2007
Operating &
Maintenance
Capital
Expenditure
Total
Expenditure
State & Local
Federal
Insurance Company//Solvency 2 is a real problem for long-term investors in Europe, and will hinder smaller players entering the infrastructure space.//
Insurance Company//Solvency 2’s spread-based approach assumes that insurers behave like traders although we are, in most cases, the opposite of traders.//
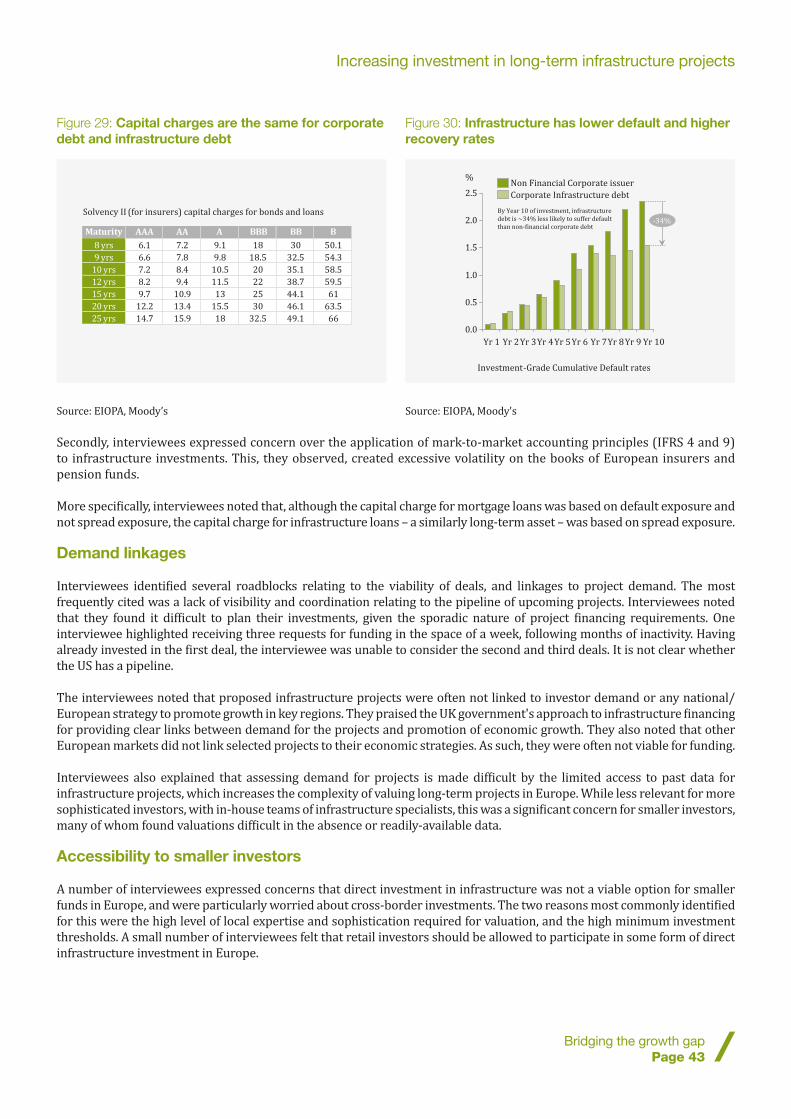
Secondly, interviewees expressed concern over the application of mark-to-market accounting principles (IFRS 4 and 9) to infrastructure investments. This, they observed, created excessive volatility on the books of European insurers and pension funds.
More specifically, interviewees noted that, although the capital charge for mortgage loans was based on default exposure and not spread exposure, the capital charge for infrastructure loans – a similarly long-term asset – was based on spread exposure.
Demand linkages
Interviewees identified several roadblocks relating to the viability of deals, and linkages to project demand. The most frequently cited was a lack of visibility and coordination relating to the pipeline of upcoming projects. Interviewees noted that they found it difficult to plan their investments, given the sporadic nature of project financing requirements. One interviewee highlighted receiving three requests for funding in the space of a week, following months of inactivity. Having already invested in the first deal, the interviewee was unable to consider the second and third deals. It is not clear whether the US has a pipeline.
The interviewees noted that proposed infrastructure projects were often not linked to investor demand or any national/European strategy to promote growth in key regions. They praised the UK government's approach to infrastructure financing for providing clear links between demand for the projects and promotion of economic growth. They also noted that other European markets did not link selected projects to their economic strategies. As such, they were often not viable for funding.
Interviewees also explained that assessing demand for projects is made difficult by the limited access to past data for infrastructure projects, which increases the complexity of valuing long-term projects in Europe. While less relevant for more sophisticated investors, with in-house teams of infrastructure specialists, this was a significant concern for smaller investors, many of whom found valuations difficult in the absence or readily-available data.
Accessibility to smaller investors
A number of interviewees expressed concerns that direct investment in infrastructure was not a viable option for smaller funds in Europe, and were particularly worried about cross-border investments. The two reasons most commonly identified for this were the high level of local expertise and sophistication required for valuation, and the high minimum investment thresholds. A small number of interviewees felt that retail investors should be allowed to participate in some form of direct infrastructure investment in Europe.
Increasing investment in long-term infrastructure projects
Bridging the growth gapPage 43
Figure 29: Capital charges are the same for corporate debt and infrastructure debt
Source: EIOPA, Moody’s
Figure 30: Infrastructure has lower default and higher recovery rates
Source: EIOPA, Moody's
Solvency II (for insurers) capital charges for bonds and loans
Maturity AAA AA A BBB BB B8 yrs 6.1 7.2 9.1 18 30 50.1
9 yrs 6.6 7.8 9.8 18.5 32.5 54.3
10 yrs 7.2 8.4 10.5 20 35.1 58.5
12 yrs 8.2 9.4 11.5 22 38.7 59.5
15 yrs 9.7 10.9 13 25 44.1 61
20 yrs 12.2 13.4 15.5 30 46.1 63.5
25 yrs 14.7 15.9 18 32.5 49.1 66
0.0
0.5
1.0
1.5
2.0
2.5
%
Investment-Grade Cumulative Default rates
By Year 10 of investment, infrastructure
debt is ~34% less likely to suffer default
than non-�inancial corporate debt-34%
Yr 10 Yr 9Yr 8Yr 7Yr 6Yr 5Yr 4Yr 3Yr 2Yr 1
Corporate Infrastructure debt
Non Financial Corporate issuer

Increasing investment in long-term infrastructure projects
Bridging the growth gapPage 44
This situation contrasts with the US, where the $3.5tn municipal bond market gives smaller investors easy and tax-effective access to infrastructure investing through the purchase of revenue bonds. While our interviewees were quick to point out that implementing such a scheme in Europe would be very difficult, given the respective nations’ different tax rates, they were in favour of exploring avenues for Europe to access finance better from retail investors.
In this context, interviewees often praised the European Long-term Investment Funds, proposed by the European Commission. These, they thought, might involve more players in infrastructure investing.
What could Europe do differently?
Below, AFME identifies possible solutions to roadblocks identified through our interviews; drawing on best practices from our study of the US. While some of these solutions are more concrete, others are suggestions made by interviewees that warrant further exploration.
Political risk and regulatory uncertainty were the two biggest roadblocks identified by interviewees. However, they were quick to acknowledge that no solution can be put forward for reducing these, since each is the outcome of the interaction between multiple stakeholders with varied agendas. Our discussion, therefore, focuses on solutions proposed by interviewees to mitigate the impact these risks have on infrastructure investment decisions.
Interviewees firstly identified a need for clearer rules on contractual agreements – specifically for termination provisions. Well-defined rules for each project would ensure that all parties completely understood the nature of the deal. Such an approach would allow each party to price the transaction accordingly, having made its investment decision in full knowledge of all the facts.
As well as clearer ‘rules of the road’, interviewees also suggested that the European Commission establish a legal framework to ‘grandfather’ long-term infrastructure investments already made. They envisioned a system that locked in the rules governing an infrastructure project – and its subsequent return to investors – at the time an investment was made. Such a system, they argue, would prevent national governments from moving the goalposts retrospectively by changing rules. Interviewees thought that such a mechanism would facilitate greater investment in greenfield and brownfield projects.
One interesting solution proposed by interviewees involves a supra-national body, such as the European Investment Bank, providing partial guarantees for demand risk, minimum volumes and first loss structures. They suggested that the EIB could make investing in particular regions or products more attractive by deploying its capital to guarantee investors’ capital in the event of certain political risks materialising. Such a solution, they said, would prevent the EIB from crowding out private sector investment, while retaining EIB interest in shaping national government behaviour towards private investors. Investors also acknowledged that a number of infrastructure projects are inevitably high priority and low return, and that the Europe 2020 Project Bond initiative should focus specifically on these areas, along with potentially socially important but less economically viable projects.
Asset Manager//An EU guarantee (or implied guarantee) can help to encourage additional investment. We recently made an investment in the US on these terms and were encouraged to do so by the implicit guarantee.//
Insurance Company//Mark-to-market is a disaster for insurance companies who are long-term investors.//
Increasing investment in long-term infrastructure projects
Bridging the growth gapPage 45
Interviewees strongly believed that changes to the accounting and regulatory treatment of infrastructure assets were needed to ensure that investors could help fill gaps in the infrastructure investment space. They advocated the introduction of a clear definition of infrastructure as an asset class. Having such a definition, they felt, would allow regulators to treat long-term infrastructure assets in a suitable manner. While interviewees stopped short of recommending specific rule changes, they suggested the use of book value accounting measures, and revisiting current Solvency II directive capital charges.
To enrich the data set recording past infrastructure projects, in order to improve the valuation of future projects, interviewees proposed the establishment of a pan-European database of past infrastructure projects. Such a database would include common financial measures such as return on capital employed, as well as metrics specifically related to infrastructure projects, including timing of cash flows, construction/political risk, and contractual disputes encountered and resolved. Interviewees also suggested exploring ways of incentivising data providers to aggregate infrastructure data and to provide it to smaller investors at a reasonable cost.
To address their concerns about the lack of viability of some infrastructure projects, interviewees recommended the development of a more comprehensive infrastructure framework to guide project development and selection. They thought such a framework would give investors greater confidence about project demand and increase the likelihood of success. It could also link projects more broadly with strategy at the national and supranational level.
While interviewees conceded that it would be difficult to replicate a US-style municipal bond market to fund infrastructure investing at local level in Europe, they felt that facilitating the entry of smaller investors, currently ‘sized out’ of direct infrastructure investing, was crucial. They suggested that European authorities should work towards facilitating pooled investments by pension funds at a pan-European level.
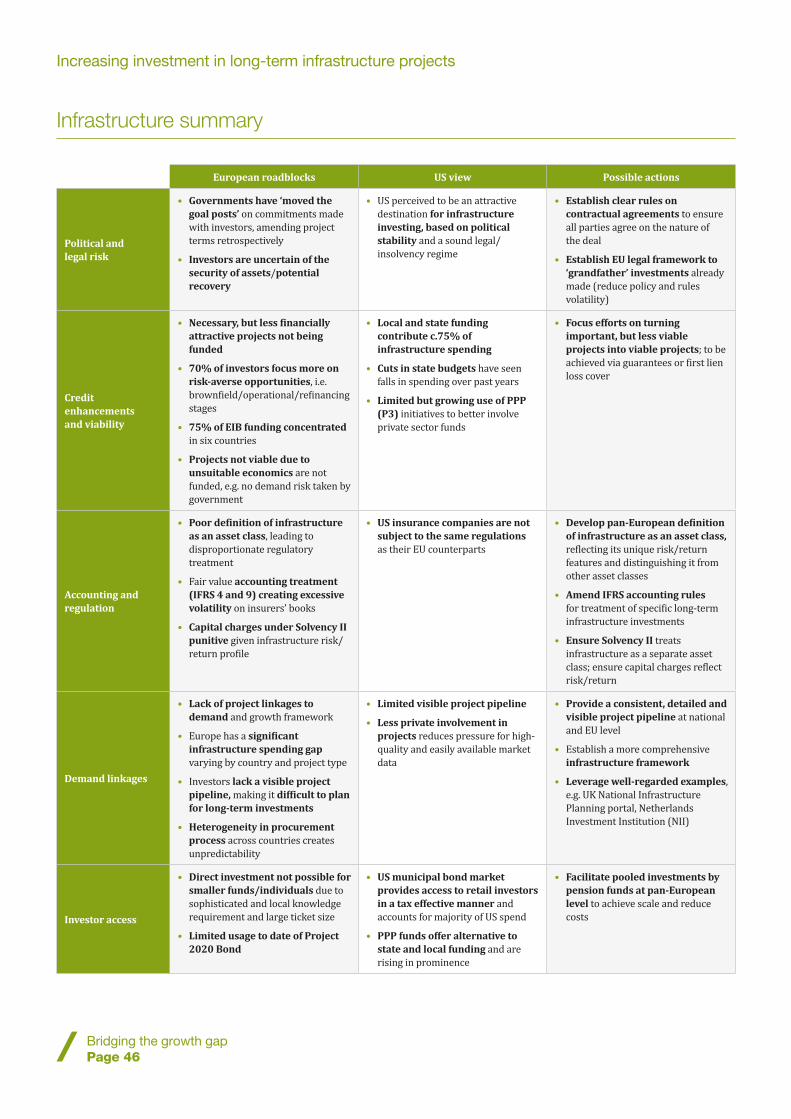
Increasing investment in long-term infrastructure projects
Bridging the growth gapPage 46
Infrastructure summary
European roadblocks US view Possible actions
Political and legal risk
• Governments have ‘moved the goal posts’ on commitments made with investors, amending project terms retrospectively
• Investors are uncertain of the security of assets/potential recovery
• US perceived to be an attractive destination for infrastructure investing, based on political stability and a sound legal/insolvency regime
• Establish clear rules on contractual agreements to ensure all parties agree on the nature of the deal
• Establish EU legal framework to ‘grandfather’ investments already made (reduce policy and rules volatility)
Credit enhancements and viability
• Necessary, but less financially attractive projects not being funded
• 70% of investors focus more on risk-averse opportunities, i.e. brownfield/operational/refinancing stages
• 75% of EIB funding concentrated in six countries
• Projects not viable due to unsuitable economics are not funded, e.g. no demand risk taken by government
• Local and state funding contribute c.75% of infrastructure spending
• Cuts in state budgets have seen falls in spending over past years
• Limited but growing use of PPP (P3) initiatives to better involve private sector funds
• Focus efforts on turning important, but less viable projects into viable projects; to be achieved via guarantees or first lien loss cover
Accounting and regulation
• Poor definition of infrastructure as an asset class, leading to disproportionate regulatory treatment
• Fair value accounting treatment (IFRS 4 and 9) creating excessive volatility on insurers’ books
• Capital charges under Solvency II punitive given infrastructure risk/return profile
• US insurance companies are not subject to the same regulations as their EU counterparts
• Develop pan-European definition of infrastructure as an asset class, reflecting its unique risk/return features and distinguishing it from other asset classes
• Amend IFRS accounting rules for treatment of specific long-term infrastructure investments
• Ensure Solvency II treats infrastructure as a separate asset class; ensure capital charges reflect risk/return
Demand linkages
• Lack of project linkages to demand and growth framework
• Europe has a significant infrastructure spending gap varying by country and project type
• Investors lack a visible project pipeline, making it difficult to plan for long-term investments
• Heterogeneity in procurement process across countries creates unpredictability
• Limited visible project pipeline
• Less private involvement in projects reduces pressure for high-quality and easily available market data
• Provide a consistent, detailed and visible project pipeline at national and EU level
• Establish a more comprehensive infrastructure framework
• Leverage well-regarded examples, e.g. UK National Infrastructure Planning portal, Netherlands Investment Institution (NII)
Investor access
• Direct investment not possible for smaller funds/individuals due to sophisticated and local knowledge requirement and large ticket size
• Limited usage to date of Project 2020 Bond
• US municipal bond market provides access to retail investors in a tax effective manner and accounts for majority of US spend
• PPP funds offer alternative to state and local funding and are rising in prominence
• Facilitate pooled investments by pension funds at pan-European level to achieve scale and reduce costs

Raising the profile and use of Private Placements in Europe
Raising the profile and use of Private Placements in Europe
Bridging the growth gapPage 48
Raising the profile and use of Private Placements in Europe
Introduction
While capital market issuance is the most commonly cited alternative to bank funding, Private Placements are an important funding avenue for firms wishing to avoid the costly disclosure requirements that public market issuance often entails.
AFME’s 2013 report, Unlocking funding for European investment and growth, highlighted that a European Private Placement market could provide a faster and more flexible route for non-bank investors to invest in European firms.
Despite the increasing use of the term ‘Private Placement’, no detailed and consistently used definition of a Private Placement deal exists. The Federal Reserve has previously noted that the term ‘Private Placement’ traditionally referred to a debt or equity security issued in the US that is exempt from registration with the US Securities and Exchange Commission by virtue of being issued through a transaction not involving any public offering.16 Today, the term is used globally and, more generally, refers to transactions involving the sale of securities without the use of public markets.
AFME acknowledges the crucial role of a clear definition in developing a pan-European Private Placement market by proposing the definition set out in Box 3.
The specifics of a Private Placement deal – such as the issuer, investor, instrument, seniority of instrument and role played by arrangers – often vary substantially. Deals may also contain characteristics unique to the jurisdiction in which they are conducted. As a result, they are structured according to the laws of particular countries, and may not translate perfectly across geographies. Interviewees noted that US Private Placement investors widely accept UK law when conducting deals, yet do not accept German or French law.
There is no formal ‘market’ for Private Placements, as these are usually facilitated by banks and governed by the legal system under which they were drawn up. However, the US has long been the biggest centre for Private Placement deals, and cross-border (non-US) issuers have become a large part of the market in recent years.
Interviewees pointed out that a ‘European’ Private Placement market was still far from being a reality. This is despite rapid growth in the number and value of Private Placement deals taking place in Germany and France. The German Schuldschein market, with €9bn of deals in 2013, represents approximately 50% of the ’European’ total. Schuldscheine have historically played an important role in the long-term financing of German mittelstand companies. The French Private Placement market (EuroPP), where the total value of deals rose to €3.9bn in 2013, typically utilises French law governing listed bonds. In the UK, a number of individual firms have conducted Private Placement deals, yet interviewees don’t perceive the country as having an established Private Placement market.
The total value of US Private Placement deals has grown steadily to €46.1bn ($59bn) in 2013. Cross-border (non-US) issuers accounted for around €25bn (or 53%) of this total in 2013. Meanwhile, the total value of Private Placement deals conducted in Europe has increased four-fold over the past four years (Figures 5, 6).
In post-crisis Europe, policymakers have focused on Private Placements as they explore alternatives to bank financing for European firms' growth requirements.
Box 3: A proposed definition for pan-European Private Placements
A pan-European Private Placement (PEPP) refers to a medium- or long-term financing transaction between a listed or unlisted company and a small number of institutional investors, based on deal-specific documentation negotiated between the borrower and the investors. Generally, but not necessarily, one or more bank intermediates as arranger; acting in an agency capacity (i.e. not underwriting instruments changing hands in the deal). Instruments may include debt (in the form of loans, notes or bonds), equities, covered bonds and securitised products.
////////////////////////////////////////////////////////////////////////////////////////////////////////////////////////////////////////////////////////////////////////////////////////////////////////////////////////////////
Raising the profile and use of Private Placements in Europe
Bridging the growth gapPage 49
A larger and more recognised Private Placement market in Europe could provide a faster and more flexible route for investing in European firms. In consequence, this section focuses on understanding how asset managers, insurance companies, pension funds and other investors could invest more easily in Private Placements to meet the financing needs of European firms.
Below, we summarise interviewees’ opinions about the roadblocks that hinder companies raising funds through Private Placements in Europe. In addition, AFME explores how lessons from the US might be applied in Europe to increase fund raising through Private Placements.
Perceived problems in Europe today
Investors interviewed about European Private Placements – drawn from a variety of investment disciplines – identified the following main areas of concern:
• Lack of standardisation across European Private Placement deals
• Ambiguity in rating, tax and regulatory treatment of Private Placement investments
• Poor visibility of Europe’s Private Placement deals
Lack of standardisation in European Private Placement deals
Interviewees highlighted the lack of standardisation in deal documentation and processes as significantly hindering Private Placements in Europe. They noted that, while deals involving German Schuldscheine benefited from a more established process, other European deals were completed on unique terms and often involved expensive legal consultation. As a result, interviewees expressed reluctance to experiment with Private Placement deals in new markets. They preferred to stick with what they knew best.
This contrasts with the US situation, where interviewees noted that a more mature market, with more standardised documentation and processes, led to a simpler and more cost-effective deal process.
Ambiguity in rating, tax and regulatory treatment of Private Placement investments
Our interviews revealed that investors perceive an ambiguity in the regulatory treatment of Private Placement investments in Europe, leading them to view such investments with caution. In contrast, investors felt more certain about the regulatory treatment of US Private Placement investments.
Interviewees noted that a counterpart to the ‘safe harbour’ exemption from SEC oversight in the US did not exist in Europe. This safe harbour – established under Rule 506 of Regulation D – provides an assurance of exemption from extensive SEC listing requirements, and, potentially, costly reporting requirements. Interviewees explained that the existence of an explicit safe harbour rule provided additional security and peace of mind about the treatment of their investment. The lack of an equivalent, explicit clarity in Europe was cited as a roadblock to investing in Private Placements.
Pension Fund//Differences in the legal framework of different countries are a key impediment to Private Placement in Europe. A Private Placement in the Netherlands is different to a Private Placement in France.//
Hedge Fund//Private Placements have always been part of the fabric in the US... There’s less of an intrusion by governments and regulators on the vehicles investors use to invest if these are working.//

Raising the profile and use of Private Placements in Europe
Bridging the growth gapPage 50
Interviewees also said that the ambiguous treatment of withholding tax across countries made returns on Private Placement investments less certain. Interviewees expressed this view most strongly about the UK, but it should be noted that subsequent to the completion of this survey, the UK government approved the exemption of Private Placements from UK withholding tax. Withholding tax could prove to be a wider issue with issuers in other member states currently inactive in the Private Placement market, as they begin to see more activity.
The interviewees added that the lack of consistent and accepted designations for Private Placements regarding regulatory capital treatment created considerable ambiguity.
More specifically, interviewees cited the role of the US National Association of Insurance Commissioners (NAIC) in giving Private Placement bonds a score on a scale of NAIC-1 to NAIC-6, reflecting their quality and risk of default, and thus determining their regulatory capital treatment. They believed that this encouraged investment in Private Placements. It is noteworthy that Private Placements accounted for $726bn or 28% of US life insurance companies’ total bond portfolios, as of 2013.17 The lack of a European equivalent was regarded as a roadblock to Private Placement investing.
Some interviewees also noted that introducing complex credit criteria might deter small and medium-sized enterprises from approaching Private Placement markets. While some institutional investors would need to make substantial investments in credit capabilities to conduct proper due diligence without ratings, large established investors would find this less of a problem.
Poor visibility for Private Placement deals conducted in EuropeInterviewees pointed out that a European Private Placement market was still far from being a reality, in spite of rapid growth in the number and value of deals taking place in Germany and France. Our interviews reinforced the perception that the US is the location of choice for Private Placement deals. Investors view US Private Placements as commonplace, yet European deals remain exceptional or noteworthy.
Interviewees observed that the thriving US swaps market has helped it to attract multiple cross-border Private Placement deals. Interviewees provided multiple examples of deals where European firms raised funds via Private Placements in the US, and then easily swapped the proceeds into the currency of their choice. While some of these deals were discussed off the record, others have been quoted in public media. For examples, Smith & Nephew Plc, a UK-based medical technology business, recently raised $325m via a Private Placement in the US to repay outstanding bank loans. The funds were raised at a rate of 3.7%, with an average maturity a little over nine years. Smith & Nephew cited the desire to diversify its funding base as a key driver of the deal.18
Investor//The US Private Placement market is ‘the’ global Private Placement market.//
Asset Manager//We haven’t been big on Private Placement deals in Europe as they tend to be expensive and the size is too small.//
Pension Fund//The US market has a standardised issuance process for Private Placements, this is why deals are done in the US; Europe needs to get together and rewrite the rules for Private Placements.//
Raising the profile and use of Private Placements in Europe
Bridging the growth gapPage 51
What could Europe do differently?
AFME highlights possible solutions to roadblocks identified through our interviews below, drawing on best practices from our study of the US. While some of these solutions are concrete, others are suggestions made by interviewees warranting further exploration.
Interviewees believed that promoting the use of Private Placement deals as an alternative to bank lending and capital market issuance would help to raise their profile in Europe. They felt that many European investors do not even consider Private Placements as an investment option. Yet they thought better information and communication of Private Placements’ potential benefits, to issuers and investors alike could bring them into the investment mainstream.
Interviewees recommended production of a Private Placement guide to inform investors’ choices. The launch of the Pan-European Private Placement Guide by market participants is an important first step in developing standardised European Private Placement documentation and common terms and conditions (Appendix 5).
Interviewees also noted that the chief advantage of US Private Placement deals was the standardised documentation process. Consequently, they suggested the establishment of common documentation and a standard process for European Private Placement deals. Some interviewees felt that if this were comparable with US documentation and process, Europe might even attract overseas companies seeking to raise capital through Private Placements. They explained that any new documentation should build on the strengths of existing markets, such as Germany’s Schuldschein, and allow existing structures in member states to easily ‘map into’ them, including France’s Euro PP market.
Interviewees have suggested that tax treatment ambiguity should be a priority area for standardisation at EU level when growing a pan-European Private Placement market. That said, they recognised the considerable challenges in achieving tax standardisation, and acknowledge that similar barriers to investment in US Private Placement deals, with differences in tax treatment, do not deter EU investors from investing in US Private Placements.
Interviewees said that achieving regulatory clarity about the capital treatment of European Private Placement bonds would spur growth in the number of deals.
The interviewees also highlighted that easy-to-understand guidance about the current regulatory treatment of Private Placement deals would enable smaller investors to consider investing through this avenue.
Please note that, subsequent to the completion of these interviews, the Pan-European Private Placement initiative (PEPP) was launched by the industry. The PEPP initiative is an important first step in providing standardised documentation for Private Placements of corporate bonds. Additional details are available in Appendix 5.
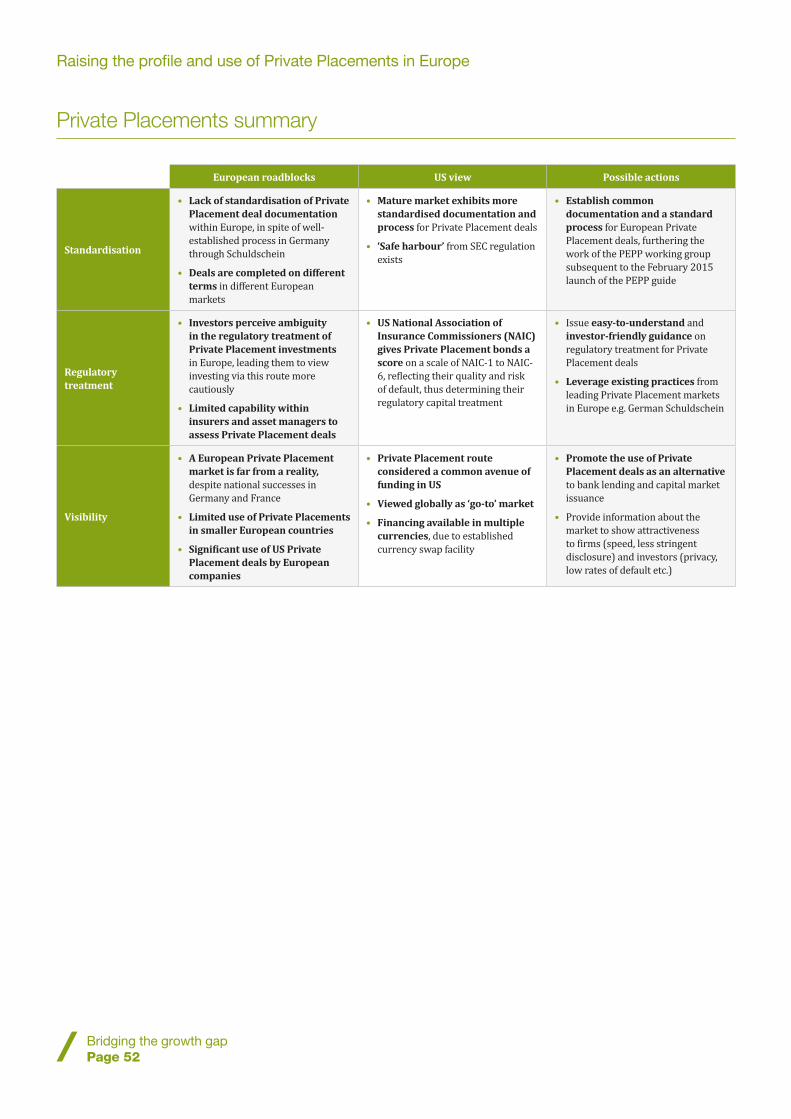
Raising the profile and use of Private Placements in Europe
Bridging the growth gapPage 52
Private Placements summary
European roadblocks US view Possible actions
Standardisation
• Lack of standardisation of Private Placement deal documentation within Europe, in spite of well-established process in Germany through Schuldschein
• Deals are completed on different terms in different European markets
• Mature market exhibits more standardised documentation and process for Private Placement deals
• ‘Safe harbour’ from SEC regulation exists
• Establish common documentation and a standard process for European Private Placement deals, furthering the work of the PEPP working group subsequent to the February 2015 launch of the PEPP guide
Regulatory treatment
• Investors perceive ambiguity in the regulatory treatment of Private Placement investments in Europe, leading them to view investing via this route more cautiously
• Limited capability within insurers and asset managers to assess Private Placement deals
• US National Association of Insurance Commissioners (NAIC) gives Private Placement bonds a score on a scale of NAIC-1 to NAIC-6, reflecting their quality and risk of default, thus determining their regulatory capital treatment
• Issue easy-to-understand and investor-friendly guidance on regulatory treatment for Private Placement deals
• Leverage existing practices from leading Private Placement markets in Europe e.g. German Schuldschein
Visibility
• A European Private Placement market is far from a reality, despite national successes in Germany and France
• Limited use of Private Placements in smaller European countries
• Significant use of US Private Placement deals by European companies
• Private Placement route considered a common avenue of funding in US
• Viewed globally as ‘go-to’ market
• Financing available in multiple currencies, due to established currency swap facility
• Promote the use of Private Placement deals as an alternative to bank lending and capital market issuance
• Provide information about the market to show attractiveness to firms (speed, less stringent disclosure) and investors (privacy, low rates of default etc.)

Appendices

Appendices
Bridging the growth gapPage 54
Appendix 1. Sources and sizes of finance in Europe and the US
Source methodology
Debt
Bank Loans (Outstanding) Bank loans to Non-Financial Corporations outstanding. US: Federal Reserve Economic data (2013), EU: ECB loans to NFC (2013) (EU-18)
Debt (Outstanding) Bonds outstanding to Non Financial Corporations US: SIFMA (2013) EU: ECB (2013)(EU-18)
Securitisation (Outstanding) All outstanding securitisation including ABS and GSE. US and EU: SIFMA (2013)
Sovereign (Outstanding) Sovereign bonds outstanding US: SIFMA (2013). EU: ECB (2013)
Leveraged Loans (Flows) New issuance of leverage loans in 2013. US and EU from S&P Capital IQ
High Yield Bond (Flows) New issuance of High yield bonds in 2013. US and EU from Deloitte, Bloomberg
Equity
Equity (Outstanding) Listed US and EU Market Cap from World Federation of Exchanges, 2013
IPOs (Flows) New issuance of IPO. US and EU from Thomson One (2013)
M&A (Flows) New M&A issuance. US: Factset, EU: WilmerHale (2013)
Institutions and Investors
Insurance FundsUS insurance market sized from the Federal Insurance Office, US Department of the Treasury (2012). Includes life and non-life pensions. EU insurance investment portfolio size from Insurance Europe (2012).
Pension Funds US and EU pension market sized from Tower Watson Pension report (2013)
Mutual Funds US and EU mutual fund total market sizing data from BCG GAM (2013)
Sovereign Wealth Funds US and EU market sizing from City UK and SWF Institute data (2013)
Hedge Funds US and EU outstanding AUM of hedge funds from City UK (2013)
Private Equity (Flows) US and EU private equity raised from Preqin (2013)
Venture Capital (Flows) New invested venture capital finance. US and EU from E&Y, Venturesource (2013)

Appendices
Bridging the growth gapPage 55
Appendix 2. Sources and methodology underlying SME sizing calculations
To estimate the sizes and sources of funding made available to small and medium-sized enterprises (SMEs) in Europe and the US, the following data sources and assumptions have been used:
Stock calculation Flow calculation
Retail bank loans
US loans outstanding to SME includes business loans <$1m (2013). Source: C&I, SBA
EU outstanding SME loans of <€1m in the Eurozone plus UK as reported. Source: EC and BoE (2013)
US gross new SME loans estimated as the difference between outstanding loan growth and runoff rate (every 3 years) + refinancing margin. Source: FDIC, C&I (2013)
EU SME gross new loans given and includes all issuance less than €1m (2013) for Euro zone plus UK gross SME loans. Source: EC & BoE
Securitised bank loans
US outstanding securitised loans from the SBA as given, Source: SIFMA (2013). EU securitised SME loans as given, Source: AFME (2013)
US SME gross securitisation of SBA loans estimated from five-year average ABS issuance (estimated as 50% allocated to ‘other ABS’ 2013). Source: SIFMA
EU issuance of SME securitisation as given, Source: AFME (2013)
Mutual funds US and EU mutual fund investment in SME (2014). Simfunds BCG analysis
Segregated mandates
Simfund (2013), BCG analysis Simfund & BCG GAM data and BCG analysis
Pension / insurance / hedge funds
Pension, insurance and hedge fund investments included in segregated mandates number or through securitised loans
Private equity
US and EU outstanding PE estimated by aggregating 5 years of investment. SME share allocated using EVCA estimates (14% of Buyout and 55% of growth funds). Source: Preqin, EVCA (2013)
US and EU new PE investment for 2013 as given from Preqin. SME share of PE allocated from EVCA estimates (14% of Buyout and 55% of growth funds). Source: Preqin, ECVA
Venture capital
US and EU outstanding VC funds estimated by aggregating last 4 years investments (average life of VC investment). All VC activity assumed to be SME. VC issuance as given. Source: Venturesource, E&Y (2013)
US and EU All VC activity assumed to be SME. Source: Venturesource, E&Y (2013)
Family and friendsUS and EU Family stock assumed to follow same stock/flow cycle as bank loans (2013)
US family and friends’ contribution assumed at 18% (SBA) of all borrowing. EU, 5% of funding from family or friends (EC) (2013)
Crowdfunding
US and EU crowdfunding in 2012 increased twofold. Outstanding assumed to be aggregate of last two years new issuance (given new emergence as financing channel). Source: Massolution
US and EU crowdfunding, as given by Massolution (2012)
Angel investingUS and EU Outstanding angel investment assumed to follow same stock/flow cycle as bank loans (2013)
US angel investment as given by Center for Venture Research at the University of New Hampshire. EU estimates from The European Trade Association for Business Angels, Seed Funds and Early Stage Market Players (2013)
GovernmentUS and EU government loans outstanding assumed to follow same stock/flow cycle as bank loans (2013)
US includes SBA loan guarantees (504) and 7(A) outstanding(2013). EU Government guarantees and direct government sponsored loans from OECD (2012). OECD covers 18 EU countries (90% of GDP), remaining EU countries assumed to have similar guarantees and scaled up to ~€66bn

Appendices
Bridging the growth gapPage 56
Appendix 3. Summary of AFME’s guide to raising finance for Europe’s small and medium-sized businesses
Introduction
Every business needs to raise finance at some point. How well small and medium-sized enterprises (SMEs) are capitalised influences whether they succeed or fail. AFME’s guide to raising finance for Europe’s small and medium-sized businesses helps SMEs make educated choices about how much and what type of capital they need, where they should get it from, and how they should apply.
There are a growing range of options – from banks, through to different types of equity providers, and even peer-to-peer online platforms. The more SMEs know about these options, the better their chances of raising the right type of funding on the right terms.
The guide gives practical advice and guidance to SMEs across Europe. The kind of finance a business needs depends on factors such as its size and the purpose for which the money is needed. Is the money for working capital? Is it to finance a start-up? Or is it to expand an existing business?
The answers to these questions will determine whether a business seeks a loan, equity finance, asset finance, or even raise a bond, and whether the business is looking in the right place for that particular type of finance.
The main types of finance this guide examines are loans by banks and non-banks, equity funding, bond funding. The guide also looks at Europe’s government support schemes.
AFME members have keen insights into the practical issues surrounding SME fund raising, since they not only lend to SMEs, but are leaders in the placement of equity and bonds into the capital markets, depending on the size and characteristics of transactions.
Some members also can refer SMEs to other organisations, which may be able to provide products they might not offer themselves. In this guide, AFME reports the type of credit criteria used to make decisions, which may vary depending on business profile, sector of activity and type of finance provider. It also describes the information usually required by the various providers. Understanding how providers of loans, bonds and equity evaluate a business gives a better chance of finding the finance needed on the best possible terms.
Choices for loan finance
Bank loans remain by far the most common form of SME finance in Europe. Yet there are other types of lenders that might be more appropriate in particular circumstances. Banks, being primarily deposit-funded, will generally offer the lowest-cost loans and the widest variety of products.
Additionally, so-called non-banks (including crowdfunding and peer-to-peer platforms, leasing companies and invoice finance providers) lend to businesses. Loans from non-banks may have a higher cost to the borrower than loans from banks, depending on the non-bank’s source of funding.
It describes borrowing through bank loans, debt crowd funding and peer-to-peer lending, leasing/equipment finance, invoice finance and export finance.

Appendices
Bridging the growth gapPage 57
Raising equity
Growing companies with unpredictable cash flows may find equity finance more suitable than loans. Such companies might include start-ups and early-stage companies, or established companies raising finance for expansion. Equity finance involves selling shares in a business to an investor, who then shares in the risks and rewards of ownership. It does not necessarily involve a transfer of control, although it can be structured in that way if desired. In some cases, equity finance can take a form that does not require giving up control or voting rights, although this is less common. Often, an investor may help to improve business strategy.
Equity investors seek a return from long-term growth in the value of their shares, as well as dividends. Frequently, they also plan an ‘exit’ at some point in time, when they will sell their shares, hopefully at a profit.
A wide range of sources of equity finance is available, depending on the size of the investment and the stage of growth of the company. The guide describes raising equity through family and friends, equity crowdfunding, business angels, venture capital and private equity, listing on a stock exchange, and other types of equity finance.
Bond issues for larger SMEs
Larger SMEs may raise debt capital through public bond issues or private bond placements, which can give access to broader and deeper pools of capital than loans. There are several source of debt finance in Europe for mid-sized companies with annual turnovers of between €25m and €500m. The minimum size for a bond issue or Private Placement is usually €20m, although it can be as little as €5m.
When issuing bonds, the issuer promises to repay investors by a specified date and to pay them interest in the meantime. The debt capital markets differentiate between these types of security, depending on their term to repayment as follows: bonds (maturity over three years); medium-term notes (maturity up to three years); and commercial paper (maturity of less than one year). This section describes issuing bonds in France, Germany, Italy, Spain and the UK.
Europe’s government support schemes
Many European Union and national support programmes are available through banks, and some are available directly.
The guide summarises the support available from Pan-European programmes (European Investment Bank, European Investment Fund), national development banks in the five largest EU countries (Bpifrance, KfW, Cassa Depositi e Prestiti, Instituto de Crédito Oficial and ENISA, British Business Bank) and the private sector (European Enterprise Network).
The AFME SME finance guide is available on the following webpage: www.afme.eu/Funding-Economy
Bridging the growth gapPage 58
Appendices
Appendix 4. Summary of AFME-ICMA’s guide to infrastructure financing through bank loans, Private Placements and public bonds
Introduction
The Guide to infrastructure financing – bank loans, Private Placements and public bond markets (the Guide) produced by AFME and the International Capital Market Association (ICMA) is designed to raise awareness of infrastructure finance, with the aim of supporting the expansion of capital markets financing in line with the European Commission’s goal of bolstering economic growth through long-term financing.
The Guide is a reference source for participants in infrastructure financings. Addressing public authorities, project sponsors, project companies and issuers, it sets out the relative merits of bank and bond markets and describes transaction processes while taking account of planning and procurement issues and key considerations, and also sets out key considerations for investors in project bonds.
A combination of considerable untapped financial firepower of capital market investors committed to investing in the asset class, together with changes in the bank lending market that may, over time, make it less attractive for certain global banks to lend long-term for infrastructure finance, and the European Commission’s plans to raise €315bn through its European Fund for Strategic Investment (EFSI). The industry wants to be supportive of distribution of this important financing to all types of interested private investors to help ensure its success.
Underlying the Guide are four key principles which are explored in more detail in the document:
1. Choice of funding: infrastructure projects may be financed in a variety of ways, including the bank loan market, the Private Placement market and the public institutional investor capital market. Key decision criteria for issuers include needed flexibility for changes over time, tenor, confidentiality, nature of the risks, and investor needs.
2. Credit enhancement and ratings: an investment grade rating helps to broaden the investor base, as most institutional investors have a mandate to invest accordingly. Public guarantees and/or credit enhancement – partial or full – may be used to upgrade the rating of a transaction that might otherwise be less acceptable from a credit risk perspective to investors.
3. Usage guarantees: some transactions are financeable if the usage or demand risks are either short-term in nature, or alternatively, quantifiable, well-proven and appropriately assessed and measured. Transactions with unquantifiable usage risks may be unsalable at any price, and may require public guarantees to make them saleable.
4. Restrictions on adverse post-closing changes, including tariff reductions: regulators and public sector authorities should maintain transparency as well as consistency with regards to tariff-setting and/or regulatory controls post-financial close of a transaction. In the past, certain authorities have significantly lowered tariffs on transactions after the financial closing, which has caused large mark to market or permanent losses for investors. This can discourage further investment.
The Guide concentrates on project finance bank loans and bonds, defined as financings of single assets subject to (limited-life) long-term offtake agreements or concessions, or where revenue risk has been mitigated adequately.
Overview of bank loan and project bond markets
Europe’s sources of infrastructure finance are changing. While banks remain the dominant lenders to infrastructure projects, capital markets investors are starting to make significant inroads into the market as pension and insurance monies look for long-dated investments backed by stable cash-flow characteristics. Over time, this trend is expected to continue, giving project sponsors a greater diversity of funding sources.

Bridging the growth gapPage 59
Appendices
Procurement and planning process
The process of identifying, creating, building, licensing and, in some cases, negotiating a concession contract to provide services (whether by public or private sector) involves four phases:
1 Selecting, planning and scoping appropriate projects
2. Procurement and contractual design
3. Construction period to completion
4. Operation of the asset
The first two phases – planning and procurement – are the most important. If mistakes are made at these stages, the project may fail later, regardless of the structure of the funding. Since a key benefit of the project finance structure is that it spans both the construction and operation phases, planning needs to cover the whole project lifecycle.
A key question for a public sector procurer is how to achieve best value for money, which depends on the competition between those tendering for a project, the mix of funding and the processes followed in discussions/negotiations. This section of the Guide highlights planning and procurement considerations relevant to infrastructure financing.
Financing choices: corporate finance or project finance, loan finance or bond finance
When deciding how to finance an infrastructure project, the sponsor has a number of choices. It can finance the project on its own balance sheet, or through a project company – in which case it has the option of bank loans or bonds. Making the right decision depends on a number of factors. This section of the Guide describes the different factors that will influence the sponsor’s choice.
Mechanics of a loan or bond issue – parties, roles and tasks
Once the funding phase of a project starts, the funds will be received in 3-4 months, which is part of the overall project finance transaction timeline, which takes longer. The exact timing depends on issues such as how long the bank’s in-house credit assessment team takes to evaluate the credit risk, the time required for credit review by ratings agencies and investors, preparation of disclosure documents such as an offering memorandum or prospectus, the listing process, the opening of bank accounts, planning and implementation of a roadshow marketing process and preparation of final closing documentation.
This section of the Guide elaborates on the first steps towards bond issuance and the parties involved, including a detailed example of how to calculate the all-in costs of a bank or bond financing. Section 10 of the Guide (Marketing, pricing and issuance process) describes the issuance process, including expected timing, in more detail.
Credit enhancement alternatives
Structuring a bond or bank loan to achieve a higher credit rating is likely to broaden the investor base, which should in turn lower the overall transaction cost for the issuer.
While capital markets investors have differing risk appetites, many invest only in investment grade transactions, whether rated investment grade by a credit rating agency or judged independently by the investor, and the size of the investor market for investment grade debt is much larger than for high yield/non-investment grade debt.
This section of the Guide considers the different forms of external and internal credit enhancement. The Guide also sets out highlights of the EFSI plan; an initiative intended to support projects that otherwise might not be funded.
Bridging the growth gapPage 60
Appendices
Credit review processes
Credit committees of banks, investors and credit rating agencies carry out comprehensive assessments of an infrastructure project’s credit risks, performing extensive due diligence and credit reviews. They generally require more information than that included in an offering memorandum or prospectus.
This section looks at the type of issues examined in the credit review process.
Project bond investor base
An understanding of what types of institutional investor invest in infrastructure, and their respective needs, is helpful when attempting to raise funds. This section describes the main types of infrastructure investors and gives examples of both fixed income and equity investors in infrastructure. Section 12 (Key considerations for investors) sets out further risk evaluation considerations for investors, including revenue risk and the risk of the decline in project tariff revenue.
Marketing, pricing and issuance process
In the case of bank loans, just one organisation (the bank) assesses the credit assessment and makes the lending decision. With a project bond issue, the rating agencies and investors assess the credit individually, after which the investment bank arranging the transaction sets the pricing. The issuer is also involved in this process.
This section describes the steps in the issuance process.
Disclosure and reporting best practice: EFR standardised guidelines
The European Financial Services Roundtable (EFR) is launching a constructive new initiative to support the standardising of disclosure and reporting requirements across Europe. In broad terms, the initiative proposes greater transparency into, and harmonisation of, project pipelines, structures, financing and performance; all of which should improve efficiency and help to make infrastructure more accessible as an asset class, which is described in more detail in section 11 of the Guide.
Key considerations for investors
Investment in project finance can present potentially attractive investment returns to institutional investors, if sufficient resources are available to analyse the various risks and rewards, as well as to monitor the ongoing performance of transactions.
This section includes a checklist of credit risk and non-credit risks, such as regulatory and political risks for investors when considering an infrastructure investment. It also describes two examples of investment review processes that may be of use to potential investors: a list of factors for rating project finance provided by the Bank for International Settlements (BIS); and a summary of the factors that would typically be considered by a credit rating agency.
Examples of European infrastructure project bond transactions
This section provides examples of the two main categories of transactions: greenfield and brownfield/operating (also referred to as secondary stage/asset refinancing stages). Included within each of these three categories are further classifications, including type of credit enhancement, and also whether investors face material project concession/ demand risk.
Participants
The guide was written by Brian Scott-Quinn of the ICMA Centre at the University of Reading in the UK, supported by Deyber Cano, AFME and ICMA members and staff. In addition to the EFR, the International Regulatory Strategy Group (IRSG) was an observer in working group meetings.
The AFME-ICMA Guide to infrastructure financing is available on the following webpages: www.afme.eu/Funding-Economy and www.icmagroup.org
Bridging the growth gapPage 61
Appendices
Appendix 5. Pan-European Corporate Private Placement Market Guide summary
Introduction
Agreement on common market standards and best practices is essential for the development of a pan-European Private Placement market for corporate debt. The Pan-European Corporate Private Placement Market Guide (‘the Guide’), developed by the Pan-European Private Placement Working Group (PEPP Working Group) and published in February 2015 aims to support the development of this market by building on existing practices in the bond and bank loan markets, as well as in other international Private Placement markets. The Guide is intended to provide a non-binding framework of best practice for pan-European Private Placement transactions.
The Guide evolved from the Charter for Euro Private Placements, which was developed by the Euro PP Working Group – a French financial industry initiative bringing together corporate borrowers, investors and intermediaries, endorsed by the relevant French financial industry associations and supported by the Banque de France and the French Trésor. The Charter for Euro Private Placements was published in March 2014, and is available at: www.euro-privateplacement.com
The Guide identifies core issuers and investors, defines best practices and the role of intermediaries, while providing standard summary terms for discussion between borrowers and investors that is both documentation- and jurisdiction-neutral.
PEPP market objectives
This section sets out the PEPP market’s objectives, which include the following:
• To provide private, primarily unlisted, debt financing for medium-sized, rated and unrated, listed and private companies
• To provide a source of risk diversification for investors
• To set a market standard for PEPP transactions
• To strengthen the identity and recognition of the PEPP market
• To promote long-lasting and transparent market relationships
• To contribute to the development of a European Capital Markets Union
PEPP market characteristics
A PEPP is a medium or long-term, primarily unlisted, private debt financing transaction between a listed or unlisted company and a small number of institutional investors, based on deal-specific documentation negotiated between the borrower and the investors – generally but not necessarily with the participation of one or more bank intermediaries as arranger(s) acting in an agency capacity (i.e. not as an underwriter).
This section describes the PEPP characteristics in terms of target borrowers, rating requirements, target investors, private offerings of debt, unlisted debt, transferability, seniority and security, the role of arrangers, disclosure and issue structure.
Negotiation and documentation
Negotiation of contractual terms and conditions by the borrower and the investor is an important feature of a PEPP. This distinguishes a PEPP from public and syndicated bond issues, such as Eurobond issues, where investors subscribe to an issue without usually being involved in the negotiation of the terms and conditions.
The negotiation of PEPP terms and conditions therefore more closely resembles the negotiation process and contractual terms seen in the bank loan market.
Bridging the growth gapPage 62
Appendices
Both the Loan Market Association (LMA) and the Euro PP Working Group have published standard model framework documentation for PEPPs in the form of loans and notes, to which users of the Guide are directed.
Special case: listed PEPP transactions
PEPP notes primarily take the form of unlisted securities. However, listed Private Placement transactions currently occur in some national European markets (for example, the French Euro Private Placement market and the Italian Private Placement market) as a result of domestic legal requirements and investor preferences. As a result, it is possible that parties to certain PEPP transactions may also seek to have the PEPP listed.
Parties, documents and timetable
This section summarises the main parties to the transaction, and their respective roles and responsibilities at its various stages. The Guide also describes the required transaction documents and includes an illustrative timetable. An indicative information memorandum template and form of non-disclosure agreement are included as appendices.
Key processes – recommendations
This section summarises key processes and recommendations, including: the levels of required borrower’s information; the key economic and legal terms and conditions of the PEPP transaction; arranger and investors’ due diligence; and disclosures and monitoring of legal financial covenants. A detailed description of key points to be discussed between the borrower and the investor is included as an appendix.
Participants
The Guide was prepared by the PEPP Working Group – an umbrella European initiative led by ICMA, including: AFME, the French Euro Private Placement (Euro PP) Working Group, the Loan Market Association (LMA), TheCityUK, The Investment Association, and the European Private Placement Association (EU PPA). It also brings together representatives from major institutional investors (including Delta Lloyd, Fédéris Gestion d’Actifs, KBC Group, LGIM, M&G Investments, Muzinich, Natixis Asset Management) and benefits from the participation of major law firms, including Allen & Overy LLP, Ashurst, Bonelli Erede Pappalardo LLP, CMS Bureau Francis Lefebvre, DLA Piper, Gide Loyrette Nouel AARPI, Herbert Smith Freehills, King & Wood Mallesons, Kramer Levin Naftalis & Frankel, Linklaters, Loyens & Loeff, Simmons & Simmons, Slaughter and May, and White & Case.
This PEPP Working Group further enjoys the support of the official sector, participating in an observer capacity (including the Banque de France, the Bank of Italy, the French Trésor and HM Treasury).
The Pan-European Corporate Private Placement Market Guide is available on the following webpages: www.icmagroup.org and www.afme.eu/Funding-Economy
Bridging the growth gapPage 63
Appendices
References
The present report is the result of multiple interviews, which took place across 30 firms, including fund managers, trade associations and exchanges.
1 AFME, Oliver Wyman. Unlocking funding for European investment and growth (2013)
2 Preqin website, www.preqin.com
3 European Central Bank. Survey on the access to finance of enterprises (SAFE)
4 BMG Research Report on behalf of the Department for Business, Innovation and Skills. SME journey towards raising finance (2013)
5 BCG analysis. DP growth figures are quarter on quarter, compared to the conventional US reporting standard of quarter on quarter SAAR, to facilitate comparisons with the Euro Area (2015)
6 European Commission. Annual Report on SMEs (2014)
7 Infelise, F. Supporting access to finance for SMEs (2014)
8 SBIC. Annual Report FY 2013
9 Deutsche Bank. SME financing in the Euro Area (2014)
10 European Central Bank. Working Paper Series No. 1644 (2014)
11 EU Regulation No. 575/2013. Article 431, paragraph 4
12 Europa.eu. Access to finance: http://europa.eu/youreurope/business/funding-grants/access-to-finance/
13 Financial Times. ‘Direct lending’ fund tops €2bn as demand booms (23 March 2014)
14 European Commission. Investment needs: http://ec.europa.eu/economy_finance/financial_operations/investment/europe_2020/investment_needs_en.htm
15 BCG analysis (2015). To compare European and US infrastructure spending, our analysis makes use of the following segmentation: For the US, transport spending includes the categories ‘Transport including highway and street’ and ‘Communication’; health spending includes the category ‘Healthcare’; education spending includes the category ‘Educational’; and utilities spending includes the categories ‘Power’, ‘Water Supply’ and ‘Sewage and waste water disposal’. For Europe, transport spending includes the categories ‘Transport’ and ‘Communication and Storage’; health spending includes the categories ‘Hospitals’ and ‘Social Services’; education spending includes the category ‘Education’; and utility spending includes the categories ‘Fuel and Energy (gas/electric)’, ‘Water’ and ‘Waste Management’.
16 Federal Reserve Bulletin. The Economics of the Private Placement Market. Appendix A (1994)
17 National Association of Insurance Commissioners. Private Placements
18 White & Case LLP. Private placements: tapping the US Market (2014)

Bridging the growth gapPage 64
Contacts
AFME
Rick WatsonManaging Director, Capital [email protected]+44 (0)20 7743 9333
Robert FergussonManaging Director, Institutional and Corporate [email protected]+44 (0)20 7743 9353
Cédric PachecoAssociate, [email protected]+44 (0)20 7743 9361
The Boston Consulting Group
Philippe MorelSenior Partner & Managing Director, [email protected]+44 (0)20 7753 8336
Dean [email protected]+44 (0)20 7753 3940

About The Boston Consulting GroupThe Boston Consulting Group is a global management consulting firm and the world’s leading advisor on business strategy. We partner with clients from the private, public, and not-for-profit sectors in all regions to identify their highest-value opportunities, address their most critical challenges, and transform their enterprises.
Our customized approach combines deep insight into the dynamics of companies and markets with close collaboration at all levels of the client organization. This ensures that our clients achieve sustainable competitive advantage, build more capable organizations, and secure lasting results. Founded in 1963, BCG is a private company with more than 80 offices in 45 countries.
About AFMEThe Association for Financial Markets in Europe (AFME) is the voice of Europe’s wholesale financial markets.
We represent the leading global and European banks and other significant capital market players.
We believe that liquid capital markets and a well-functioning banking system are central to any successful modern economy.
We advocate stable, competitive, sustainable European financial markets that support economic growth and benefit society.
Focuson a wide range of market, business and prudential issues
Expertisedeep policy and technical skills
Strong relationshipswith European and global policymakers
Breadthbroad global and European membership
Pan-Europeanorganisation and perspective
Global reachvia the Global Financial Markets Association (GFMA)
Association for Financial Markets in Europewww.afme.eu
London OfficeSt Michael’s House1 George YardLondon EC3V 9DHUnited Kingdom
Switchboard:+44 (0)20 7743 9300
Brussels OfficeRue de la Loi, 821040 BrusselsBelgium
Switchboard:+32 (0)2 788 3971
Press enquiriesDavid [email protected]+44 (0)20 7743 9504
Anna [email protected]+44 (0)20 7743 9367
[email protected]+44 (0)20 7743 9300
Follow AFME on Twitter@News_from_AFME