investors perception regarding mutual funds in india · 2019-06-05 · investors perception...
TRANSCRIPT

Investors Perception Regarding Mutual Funds in India
Dr. G.S.Batra * Ms. Sukhwinder Kaur
Abstract:
Mutual fund industry has become a vital source of finance for the corporate sector in India. It
channelizes the savings of small investors into the corporate sector. It was started in India for small
investors. Mutual fund companies are offering innovative schemes to lure the investors. So
considering these points this paper is an attempt to examine the investor’s perception regarding
mutual funds in India and to give the suggestions for growth of mutual funds in India. Primary and
secondary data have been used in the study. Sample size has taken 200 investors for survey. The
analysis of data has been done with factor analysis. The findings of the study revealed that
investors consider mutual funds as safe and secured investment and vehicle to enter into blue chip
companies and assure monetary benefits. As far as suggestions for the growth of mutual funds are
concerned there is a strong need on the part of regulators and fund houses to create awareness and
education of investors regarding mutual funds, transparency and dissemination of information.
Keywords: Mutual Funds, Blue chip Companies, Monetary Benefits, Investors’ Perception and
Information.
Professor and Head, School of Management studies, Punjabi University Patiala (Punjab)
E-mail: [email protected] Contact No. +91-9855028013
*Assistant Professor and Head, Department of Management Studies, Baba Banda Singh Bahadur
engineering College, Fatehgarh sahib, Punjab, 140407.
E-mail ID: [email protected] Contact No. +91-9417367244
Introduction:
Frequently people have the money, but they feel unsecure while investing their money in stock
market. The reasons are that they lack time, skills and knowledge regarding the complexities of
stock market. To overcome these problems the best option available for investors is to hand over

this job to professional fund managers. Mutual funds provide a mechanism to invest in the stock
market without knowing the complexities of stock market. The reasons for selecting the AMC
(Asset Management Company) involve efficient management, liquidity, diversification of risk
and safety of investment. The members of the AMC are highly experienced, professional and
talented person. The mutual fund manager keeps constant watch on financial markets and adjusts
the portfolio to achieve the highest returns. Thus Mutual fund provides a mechanism to small
investors to invest in blue chip companies.
Mutual fund companies collects the savings from small investors they make the big corpus of
these funds and then they invest these funds in a diversified portfolios of ten to twenty
companies. For these services, mutual funds companies charges only nominal fee. Mutual fund
companies issue the units to investors according to their share of investment. Mutual funds offer
close ended and open ended schemes. Close ended schemes have some stipulated time period
that is normally between 3 to 15 years. Open ended schemes are available for subscription during
the all time period. These are further available in growth, income, balanced, ELSS, FMCG, ETF,
gold fund and sector specific.
Mutual funds have started in India in 1964. The first scheme which was launched in India was
Unit Scheme 1964. UTI has the monopoly over the mutual fund industry up to 1987. In 1987,
Government institutes were allowed to start mutual funds operations. In 1993, it was opened for
private sector. In that year SEBI has made the regulations on mutual funds. These regulations
were further revised in the year 1996. Today there are near about 42 mutual funds companies
operated in India. Moreover government is doing every effort to promote the mutual funds in
India. In 1999 it has exempted the all dividend incomes in the hands of investors fully tax free.
Mutual fund industry is doing every effort to attract the investors to invest in mutual funds by
offering innovative schemes. Moreover, Investors have great expectations from mutual funds. So
this paper is an attempt to know the investors perception regarding mutual funds and to give
suggestions for growth of mutual funds in India.
Literature review:

Das et al (2008) identified the preferences of investors look for in investment products. They
have taken the sample size of 100 investors from two metros of Orissa state. They have used
Chi-Square, Two way Anova, Rank correlation, t test, Z-test and Kendall’s Concordance test for
the analysis of data. On the basis of Anova the study find that investors have significant
differences in the pattern of investment with respect to their age and there has no difference in
the investment pattern on the basis of level of education. They concluded that majority of
investors like to invest in insurance followed by mutual funds. And 68% investors like to invest
in LIC as compared to ICICI. Rao and Prashar (2010) identified the factors affecting
perception of investors towards mutual funds. They have conducted the study in three states
namely: Rajasthan, Gujarat and Madhya Pradesh. Sample size has taken 400 investors. The data
has been analyzed with the Factor analysis. They have extracted the different factors from
different states. From Madhya Pradesh the most important among them are monetary, investors
expectation followed by benefits and infrastructure, Schemes NAV followed by promotional
measures and miscellaneous. From Gujarat the most important among them are monetary and
schemes NAV, return, risk followed by image and benefits followed by investment preference
and advertisement. From Rajasthan the most important among them are promotional tools and
benefits, NAV and monetary, Risk and return followed by Investors preference and
Miscellaneous. Das (2011) analyzed the influence of demographic factors on mutual funds,
factors influencing the mutual funds. He has also examined the problems in mutual funds and
factors affecting investors’ perceptions. He has collected the data through questionnaire, from the
period June-July 2011, from 250 small investors of Assam. He has applied percentage method,
cross tabulation and chi- square method for analysis. The study found that majority of the
respondents are males and the maximum investors belonged to the age between 35-45 years. He
further found that there has a significant relationship between gender and investor satisfaction.
But there has no significant relationship between age, education, amount of investment and
income with that of satisfaction. Investors invest in mutual funds for tax benefits followed by
high returns, safety, regular incomes and liquidity. He found the managers lack experience.
Gupta and et. al, (2011) examined the investor’s perception regarding mutual funds and fixed
deposits and they have also evaluated the relation between mutual funds and occupation of the
investors. Sample size of the study has taken 100 investors and the data has been analyzed with Z
test and Chi- square test. The findings of the study revealed that 88 % of investors are willing to
invest in mutual funds. Z test showed that mutual funds are not more significant than fixed
deposits and the investment done in near future in mutual fund is not statistically significant.
Saini, Anjum and Saini (2011) evaluated the investor’s awareness and perception regarding
mutual funds in India and to know the growth and major deficiencies in the working of mutual
funds in India. They have taken the sample of 200 investors by using stratified sampling. They
have analyzed the data through Chi-Square test. The major findings of the study revealed that
investors invested in the mutual funds for tax benefits followed by high return and safety. Age
has significant relation with the factors that can win back the investors’ confidence. They found
that investors choose a scheme for investment on the basis of past performance, stability of
returns and past dividends. Sharma (2012) analyzed the investor’s perspectives towards
investment in mutual funds. She has also examined the factors that may affect the selection of
mutual funds schemes. She has conducted a survey on 250 investors. She has analyzed the data
through mean, SD, correlation and factor analysis. The study has found the benefits which
emerge out from investment and it has grouped into three categories on the basis of factor
analysis. The first category has related to fund related attributes. Second has related to monetary
benefits provided by the funds and the last category has related to sponsor related attributes.
Singh (2012) conducted a study to analyze the impact of various demographic factors on
investor’s attitude towards mutual funds and to find out the factors which leads for selection of
mutual funds by using Chi Square test. He has conducted this study on 250 investors. He has
found that there is no association between age, occupation and attitude towards mutual funds.
But there is an association between sex, income, educational qualifications and attitude towards
mutual funds. As far as the benefits of the mutual funds are concerned, return potential and
liquidity have been perceived to be most attractive by investors, followed by flexibility,
transparency and affordability. Vyas (2012) evaluated the forms of investment, mode of
investment preferred by investors. He has also examined the investor’s knowledge of risk and
preference over switching of funds by using Chi-Square test, Pearson’s correlation, mean and
median. He has taken 363 investors for the analysis of the data. He found that investors preferred
investment in gold followed by bank deposits, Life insurance schemes and post office schemes.
Investors preferred lump sum investment as compare to that of SIP. There has a significant
relationship between occupation of investors and mode of investment. Majority of the investors
have the knowledge of risk factors in mutual funds. Investors switched the investment only for

the sake of profitability and investors preferred existing schemes for investment and they
preferred to invest in equity schemes. Palanivelu and Chandrakumar (2013) identified the
preferred investment avenues among the salaried people of Namakkal Taluk. They have taken
100 salaried people for survey. The study has found that salaried class in the above stated region
was not aware about the equity, bond, stock market and debentures. All the age group people
preferred insurance followed by bank deposits. They suggested that there is a strong need to
create the awareness among the people of that region regarding various investment avenues.
Objectives of the study:
1. To know the investors perception regarding mutual funds as an investment tool.
2. To give the suggestions for growth of mutual funds in India
Research Methodology:
Both Primary and secondary data has been used in this study. Primary data has been collected
with the help of five point Likert scale questionnaire. Secondary data has been taken from
various journals, magazines and websites related to mutual funds. Sample size has been taken
200 investors. Sampling area has been taken Ludhiana stock exchange, Delhi stock exchange and
investors available in private and public sector mutual funds. The analysis of data has been done
with the help of factor analysis.
Analysis and Findings of the study:
Exploratory Factor analysis: Factor analysis is a data reduction technique. The first condition
to apply factor analysis is that there should be significant correlation between the variables. In
this study all the variables had showed a significant correlation. This provides an adequate basis
for proceeding to next level.
Table-I
KMO and Bartlett’s Test
Kaiser-Meyer-Olkin Measure of Sampling
Adequacy. .772
Bartlett's Test of Sphericity Approx. Chi-
Square 1584.774
Df 55

The next step is to assess the overall significance of correlation matrix with Bartlett’s test.
Bartlett's Test of Sphericity: it is used to examine that population correlation is an identity
matrix. Diagonals are ones and Off-diagonals are zeros. A significant result (Sig. < 0.05)
indicates matrix is not an identity matrix; i.e., the variables do relate to one another enough to
run a meaningful EFA. In this research overall correlation is significant at 0.000 levels which are
1584.774. The other is overall test is measure of sampling adequacy.
Kaiser-Meyer-Olkin Measure of Sampling Adequacy: it is an index, used to examine the
appropriateness of factor analysis. If it is between 0.5 to 1 than it is appropriate. If it is below 0.5
it may not be appropriate. In this study it is .772>0.5. To assess the importance of each
component, Eigen values have been used in selecting the number of factors. In this study we
choose the three factors which represent 62% variance of all components and having Eigen value
more than one.
Table-II
Communalities
Components Initial Extraction
to earn ret on idle resources 1.000 .577
provision for uncertain future 1.000 .490
to meet the cost of inflation 1.000 .511
to generate specified money for specific goal 1.000 .546
to avail tax benefits 1.000 .191
MF involves less risk 1.000 .967
MF involves less transaction cost 1.000 .966
MF ensures liquidity. 1.000 .665
MF ensure transparency 1.000 .553
one can enter into blue chip co. with MF 1.000 .663
MFs are suitable for small investors. 1.000 .664
Extraction Method: Principal Component Analysis.

Communality is the extent to which an item correlates with all other items. Higher
communalities are better. If communalities for a particular variable is low (between 0.0-0.4),
then that variable will struggle to load significantly on any factor. In the above table one
statement has shown value less than 0.4.this variable has failed to load on any factor.
Table-III
Total Variance Explained
Compo Extraction Sums of Squared Rotation Sums of Squared
Nent Initial Eigen values Loadings Loadings
%of %of %of
Varianc Cumula Varianc Cumula Varianc Cumula
Total e tive % Total e tive % Total e tive %
1 3.938 35.802 35.802 3.938 35.802 35.802 2.432 22.111 22.111
2 1.709 15.534 51.337 1.709 15.534 51.337 2.270 20.637 42.748
3 1.147 10.427 61.764 1.147 10.427 61.764 2.092 19.016 61.764
4 .965 8.773 70.537
5 .698 6.344 76.880
6 .643 5.843 82.723
7 .591 5.371 88.095
8 .506 4.602 92.697
9 .432 3.924 96.621
10 .370 3.363 99.984
11 .002 .016 100.00
Extraction Method: Principal Component Analysis.
Table-III has shown that only three components have shown Eigen value more than one. These
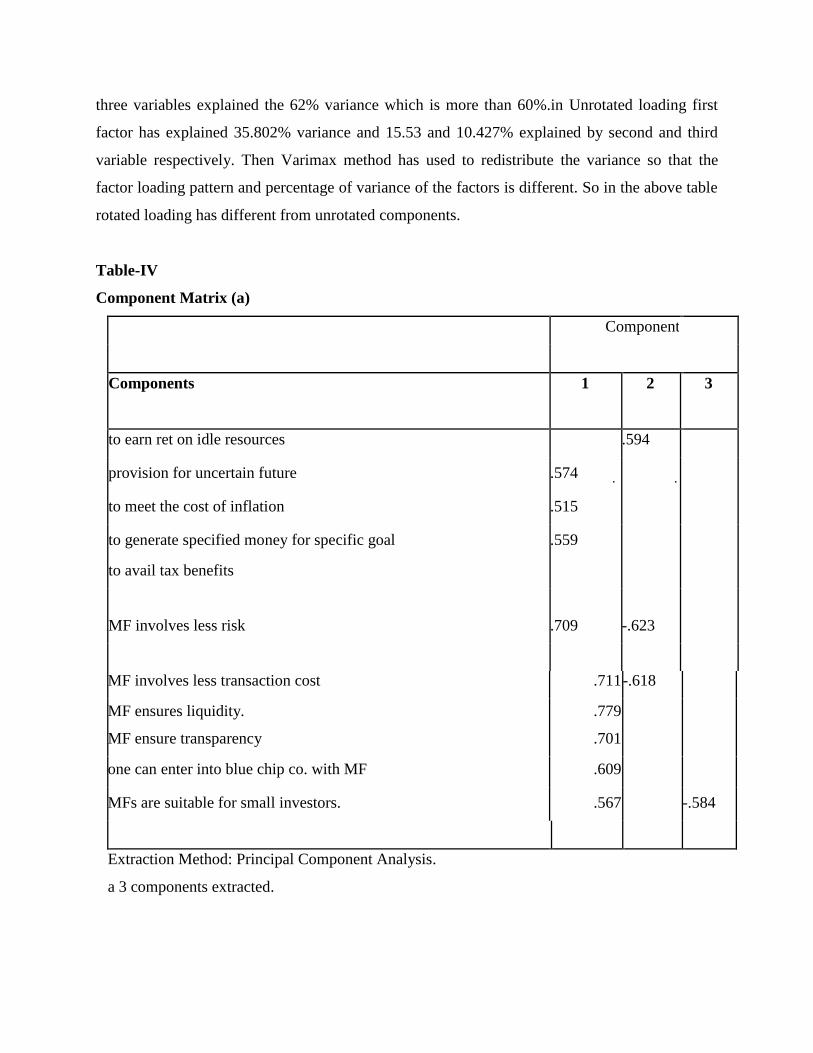
three variables explained the 62% variance which is more than 60%.in Unrotated loading first
factor has explained 35.802% variance and 15.53 and 10.427% explained by second and third
variable respectively. Then Varimax method has used to redistribute the variance so that the
factor loading pattern and percentage of variance of the factors is different. So in the above table
rotated loading has different from unrotated components.
Table-IV
Component Matrix (a)
Component
Components 1 2 3
to earn ret on idle resources .594
provision for uncertain future .574
to meet the cost of inflation .515
to generate specified money for specific goal .559
to avail tax benefits
MF involves less risk .709 -.623
MF involves less transaction cost .711 -.618
MF ensures liquidity. .779
MF ensure transparency .701
one can enter into blue chip co. with MF .609
MFs are suitable for small investors. .567 -.584
Extraction Method: Principal Component Analysis.
a 3 components extracted.

Table-V
Rotated Component Matrix
Component
1 2 3
to earn ret on idle resources .751
provision for uncertain future .625
to meet the cost of inflation .685
to generate specified money for specific goal .646
to avail tax benefits
MF involves less risk .970
MF involves less transaction cost .969
MF ensures liquidity. .591
MF ensure transparency .602
one can enter into blue-chip co. with MF .783
MFs are suitable for small investors. .796
Extraction Method: Principal Component Analysis. Rotation Method: Varimax with Kaiser
Normalization. a. Rotation converged in 5 iterations.
In rotated matrix. Variable 6, 7, 8 significantly loaded on first factor. Variables 9, 10, 11
significantly loaded on second factor and variables 1,2,3,4 significantly loaded on factor
three. Overall three factors have been extracted from the above variables. On the basis of above
variables following names are given to factors:
1. Mutual funds are Safe and secured.
2. Mutual funds are transparent, Beneficial and provide entry into blue chip
companies
3. Utilization of Idle resources to beat the uncertain future/ monetary benefits.

These factors facilitate the investment in mutual funds. The findings of the study revealed that
investors think that mutual funds are safe and secured, these provides the entry into blue chip
companies. Moreover they believe that mutual funds provide monetary benefits.
Suggestions for Growth of Mutual Funds in India:
These suggestions were given on the basis of general observations:
There is a strong need on the part of mutual fund companies to create the awareness among
the investors regarding the concept of mutual funds and its mechanism.
Investors do invest in mutual funds but they have no idea how the mutual fund works. They
totally relied on the fund houses.
Mutual fund Regulators should do lots of efforts to educate the investors regarding mutual
funds. Majority of the investors consider mutual fund as safe investment tool. So there is
need to educate the investors that mutual funds involve the market risk.
Mutual fund companies should focus on the rural areas. All the Mutual fund companies are
operating in big cities only. Majority of the investors belong to urban areas. There should be
inclusive approach for mutual funds.
There is need of separate investor’s grievance redresser agency. So that the problems of
investors can be sorted without any wastage of time. It will enhance the confidence of
investors in mutual funds. Majority of the investors feel frustrated if there problems are not
properly listened by the mutual funds.
Information should be disseminating to investors quickly regarding dividend details,
quarterly statements as well as risk return relationship of the schemes.
There is a need to educate the agents or distributors of the mutual funds. Even they lack the
knowledge of mutual funds. Moreover investors find it difficult to approach the distributors.
There should be a top class code of conduct for all Asset management Companies. Then only
the mutual fund industry can grow at rapid pace.
Mutual fund companies should not focus on the increase in number of scheme but on the
quality of the schemes in terms of its composition, various stock included in its portfolio
and revision of portfolios regularly.

There is need to create the awareness of different plans under the same scheme. Investor has
no knowledge of the dividend plan and growth plan. They simply invest in the scheme by
its name they have no idea about the features of dividend plan and growth plan.
AMC just make the portfolio for diversification but they don’t deeply make the research
while choosing the sectors in portfolio. Hence there is a need to train the asset management
companies.
There should be transparency on the part of mutual funds companies.
Conclusion:
Synoptically, the study concluded that mutual fund industry in India has succeed to attract the
investors towards mutual funds. it can been seen from the findings of the study that investors
find mutual fund as safe and secured investment option with monetary benefits and they found
mutual fund to provide an entry into Blue-chip companies. The study also found that investors
consider mutual funds as a safe investment option, but there is a need to educate the investors
that mutual fund involves a market risk. There should be need on the part of regulators and fund
houses to create awareness regarding the working of mutual fund companies. There are lots of
suggestions for growth of mutual funds in India. But in nutshell there should be transparency, top
class code of conduct for AMCs and investor grievance redresser agency. And proper
information should be disseminated to investors.
Bibliography:
Das, Bhagaban, Mahanty, Sangeeta and Shil, Nikhil Chandra (2008) “Mutual Funds Vs Life
Insurance: Behavioral Analysis of Retail Investors” International Journal of Business and
Management, Vol. 3, No. 10, pp 89- 103. Available at www.ccsenet.org/journal.html.
Das, Sanjay (2011) “Small investor’s perceptions on mutual funds in Assam: an Empirical
Analysis” ABHINAV National Monthly Refereed Journal of Research in Commerce &
Management, Vol. No. 1, issue 8, pp 11-27. Available at www.Abhinavjournal.Com.

Krishna , B. Murali , Rakesh, K And Kumar , P.V.S. (2012) , “Investors’ Perception In Mutual
Fund Investments (A Study In Selected Mutual Fund Organizations In Visakhapatnam)”
International Journal Of Research In Commerce & Management Volume No. 3 (2012), Issue No.
6 , pp 43-47.
Palanivelu,V.R., and Chandrakumar, K., (2013), “ A study on Preferred Investment Avenue
Among the Salaried People with Reference to Namakkal Taluk, Tamilnadu India”, a paper
presented in the IBEA, International Conference on Business, Economics, and Accounting, 20-
23 March 2013, Bangkok, Thailand
Saini, Simran, Anjum, Bimal and Saini, Ramandeep (2011), “Investors Awareness and
Perception about Mutual Funds” Zenith International Journal of Multidisciplinary Research,
Vol. 1, Issue 1, pp 14-29.
Sharma, Nishi (2012), “Indian Investors’ Perceptions towards Mutual Funds” Business
Management Dynamics, Vol. 2, No. 2, pp 01-09.
Singh, Binod Kumar (2012), “A Study on Investors Attitude towards Mutual Funds as an
Investment Option” International Journal of Research in Management, Vol. 2, Issue 2, pp 61-70.
Singh, Jaspal and Chander, Subash (2004) “An Empirical Analysis of Perceptions of Investors
towards Mutual Funds”, Finance India, Dec.2004.
Vyas, Ravi (2012) “Mutual fund Investor’s Behavior and perception in Indore city” Journals of
Arts, Science and Commerce, Vol. III, Issue 3(1), pp 67-75, available at www.
Researchersworld.com.