iobc / wprs · valentina m. afonina, wladimir b. tshernyshev, olga v. solovchenko ..... 1 . model...
TRANSCRIPT

IOBC / wprs
Working group “Landscape Management for Functional Biodiversity”
OILB / srop
Groupe de travail “Gestion de l’Environnement pour
Une Biodiversité Fonctionelle”
PROCEEDINGS OF THE 3RD WG MEETING
LANDSCAPE MANAGEMENT FOR FUNCTIONAL BIODIVERSITY
in Bordeaux, France
14-17 May 2008
Editors:
Walter A.H. Rossing, Hans-Michael Poehling, Maarten van Helden
IOBC wprs Bulletin Bulletin OILB srop Vol. 34, 2008

The IOBC/WPRS Bulletin is published by the International Organization for Biological and Integrated Control of Noxious Animals and Plants, West Palearctic Regional Section (IOBC/WPRS) Le Bulletin OILB/SROP est publié par l‘Organisation Internationale de Lutte Biologique et Intégrée contre les Animaux et les Plantes Nuisibles, section Regionale Ouest Paléarctique (OILB/SROP) Copyright: IOBC/WPRS 2008 The Publication Commission of the IOBC/WPRS: Horst Bathon Julius Kühn-Institute (JKI) Federal Research Center for Cultivated Plants Institute for Biological Control Heinrichstr. 243 D-64287 Darmstadt (Germany) Tel +49 6151 407-225, Fax +49 6151 407-290 e-mail: [email protected]
Luc Tirry University of Gent Laboratory of Agrozoology Department of Crop Protection Coupure Links 653 B-9000 Gent (Belgium) Tel +32-9-2646152, Fax +32-9-2646239 e-mail: [email protected]
Address General Secretariat: Dr. Philippe C. Nicot INRA – Unité de Pathologie Végétale Domaine St Maurice - B.P. 94 F-84143 Montfavet Cedex (France) ISBN 978-92-9067-208-1 http://www.iobc-wprs.org

Preface Landscapes enjoy considerable attention as objects of study. Ecosystem services are a key word in research and policy. The IOBC-WPRS Working Group ‘Landscape management for functional biodiversity’ addresses the crucial ecosystem service of pest suppression in agriculture. The Working Group was created in 2001 by the IOBC General Assembly to bring together researchers from different research backgrounds to discuss progress in the field and to support design of new research enterprises that transcend the national scale. Since then, meetings have been held in Bologna and Zürich-Reckenholz. Attention for the contribution of landscape to agriculture has important implications for research. As yet limited conceptual basis exists that helps us in designing relevant experiments, and understanding observed phenomena. The empirical and methodological foundation is still narrow and, as may be expected in such emerging field of science, concepts and methods develop rapidly. At the same time there is awareness of a ‘new contract of science with society’ under which translation of scientific findings to societal use takes place in a process of interaction between researchers and societal stakeholders. This is the setting for the Working Group Meeting at ENITAB Bordeaux from 14 to 17 May 2008. This Bulletin presents 34 papers that will be discussed during the meeting. The papers address different scales, ranging from field and field plus margin to habitat mosaic and landscape. They comprise biological and socio-economic topics and they mobilize methods ranging from surveys and experiments, molecular analytical tools to computer-based models. In response to suggestions at the 2nd Working Group Meeting, sessions were prepared to highlight specific areas of interest. Prof. Dr. Bärbel Gerowitt organized a session on public and private support for ecological infrastructure schemes. Ecological infrastructures such as conservation headlands or flowering strips are artificial structures in agricultural landscapes. Ecological infrastructures cause management decisions at different levels: Acceptance by the public is required to set up any supporting scheme for ecological infrastructures, measures need to be administrable and implemented by the farming practice. The session intended to give examples for studies in this area of research, thus contributing to learning from success. Prof. Dr. Felix Wäckers prepared a session on novel tools to assess constraints for the efficiency of biocontrol agents. Recently developed tools allow us to better investigate mobility, energetic reserves, feeding history, reproductive success and age structure of field collected arthropods. The proposed session intended to give an overview over these tools and how they can be applied to the fields of functional biodiversity and conservation biological control. Dr. Wopke van der Werf put together a session on spatially explicit modelling for functional biodiversity research and management. Models ranging from descriptive approaches such as GIS to attempts at explanatory process modelling, provide instruments to add value to empirical observations and experiments. The aim of this session was to create an overview and illustration of mathematical concepts and models that help structure our thinking on making better use of pest suppressive properties of landscapes. We would like to thank the Scientific Advisory Board for their role as moderators in the
iii

Meeting, thus contributing to the liveliness of the programme: Barbara Ekbom, Felix Wäckers, Hervé Jactel, Claire Lavigne, Guillaume Pain and Joséphine Pithon. The meeting is organized by Dr. Maarten van Helden and his team. We would like to thank Fanny, Mercedes, Emma and Maarten and all students for their full dedication to this event, overlooking the organisation as well as the scientific contents, while keeping an eye on external funding opportunities. Their optimism, resolve and networking skills have been indispensable for the success of the meeting. To get the IOBC Bulletin out as pre-ceedings for the meeting required a major logistic effort. We thank Ms Wampie van Schouwenburg and ir Bas Allema MSc for thoughtful editing and collation of the papers and for keeping their cool in the face of deadlines. We also thank Prof. Dr. Luc Tirry and his team of the IOBC Publication Commission for managing the final stages of Bulletin printing and distribution. The Meeting is financially supported by IOBC, Enita de Bordeaux, Conseil regional d’Aquitaine and Conseil Général Gironde and the following sponsors: Univitis Winery, Viti-Vista, Buzet Wine producers, Syngenta France and Nova-Flore. We wish all of you success in understanding and applying functional biodiversity from a field, farm and landscape perspective. Hans-Michael Poehling Walter A.H. Rossing Convenors IOBC-WPRS Working Group Landscape Management for Functional Biodiversity 3 April 2008
iv

Contents Preface ..................................................................................................................................... iii Contents .................................................................................................................................... v Which biotopes can supply the arable field with natural enemies? Valentina M. Afonina, Wladimir B. Tshernyshev, Olga V. Solovchenko ............................... 1 Model for integrating internal and external drivers for dispersal and distribution pattern in carabid beetles Bas Allema, Walter Rossing, Wopke van der Werf, Tibor Bukovinszky, Eveliene Steingröver, Ariena van Bruggen, Joop van Lenteren, Kees Booij ......................................... 5 Insectary plants to enhance the biological control of Nasonovia ribisnigri and Frankliniella occidentalis in lettuce Oscar Alomar, Judit Arnó, Rosa Gabarra ................................................................................ 9 Hover-Winter: a multi-agent model to simulate the overwintering of a beneficial insect (Episyrphus balteatus, Diptera, Syrphidae) in a heterogeneous landscape Florent Arrignon, Claude Monteil, Jean-Pierre Sarthou, Marc Deconchat, Gérard Balent ......................................................................................................................... 13
Gis-based methodology to assess pesticide risk on biodiversity in terrestrial ecosystems Stefania Barmaz, Serenella Sala, Marco Vighi ...................................................................... 17 Mapping the ecosystem service of pest control associated with forest in agricultural landscapes; a proof of concept J.M. Baveco, F.J.J.A. Bianchi, W. van der Werf, P.W. Goedhart ......................................... 21 Vegetation on field margins as a source of predatory mites (Phytoseiidae) for strawberry plantations in Poland: Preliminary observations Zbigniew T. Dabrowski, Danuta Kropczynska, Jakub Garnis ............................................... 25 Green bridges over the winter: consequences for Brassica pests Eefje den Belder, Jane Landure, Janneke Elderson, Marian Vlaswinkel, Jeroen Willemse, Frans van Alebeek, Paul van Rijn, Henny van Gurp ................................. 29
The impact of agri-environment schemes on cereal aphid control John Holland, Heather Oaten, Steve Moreby, Sue Southway ................................................ 33 Long-term set-asides and functional biodiversity Erja Huusela-Veistola ............................................................................................................ 37 Botanical and social aspects of conservation headlands in Switzerland Katja Jacot, Lisa Eggenschwiler, Nina Richner, Daniel Schaffner ........................................ 41
v

Combining studies on crop mosaic dynamics and pest population dynamics to foster biological control Alexandre Joannon, Aude Vialatte, Chloé Vasseur, Jacques Baudry, Claudine Thenail .................................................................................................................... 45 Explaining participation in multifunctional agricultural activities: an empirical analysis of the Winterswijk region in The Netherlands Roelof A. Jongeneel, Nico B.P. Polman, Louis H.G. Slangen .............................................. 49 Reservoirs role of some weed plants in the agroecosystem-dominated landscapes of southeastern Europe (Hymenoptera: Braconidae: Aphidiinae) Nickolas G. Kavallieratos, Željko Tomanović, Petr Starý, Christos G. Athanassiou ............ 53 Biodiversity of spiders appearing on nettle (Urtica dioica L.) in natural stands Hanna Legutowska, Magdalena Sitko .................................................................................... 57
The 'Cake on the plate' syndrome ... and how specialist tansy aphids avoid extinction by hungry predators and parasitoids: insights from the use of polymorphic micro- satellite markers Hugh D. Loxdale, Franklin Nyabuga, Wolfgang W. Weisser ............................................... 61 Determinants for implementing different types of conservation measures in intensive arable regions Juliane Mante, Bärbel Gerowitt ............................................................................................. 65 Are landscape structures important for the colonization of spinach fields by insects? Rainer Meyhöfer, Thomas Klug, Hans-Michael Poehling ..................................................... 69 Does the spatial density of field margins affect aerially dispersing aphid predators, if so, at what scale? Heather Oaten, John Holland, Barbara Smith, Simon Leather .............................................. 73 Evaluating predator diversity and abundance in vineyards and the contiguous hedgerows Stefan Otto, Filippo Maria Buzzetti, Giuseppe Zanin, Carlo Duso ....................................... 77 Biodiversity and its interactions with viticulture in a wine-growing area in the west of France: case study of a local initiative in a controlled origin appellation (AOC Saumur-Champigny) Guillaume Pain, Véronique Beaujouan, Hervé Daniel, David Montembault, Joséphine Pithon, Annie Sigwalt ............................................................................................ 81 Expression of on-farm functional biodiversity as affected by management and multi-scale agroecosystem disturbance Souzi Rouphael, Anna-Camilla Moonen, Paolo Bàrberi, Ruggero Petacchi, Luigi Boccaccio ...................................................................................................................... 85
vi

The effect of source habitats on arable spider communities: is proximity the most important? Ferenc Samu, András Horváth, Éva Szita, Balázs Bernáth, Erika Botos, Kinga Fetykó .......................................................................................................................... 89 Stable isotopes as a tool for food web analysis Stefan Scheu ........................................................................................................................... 93 Implementation of an agri-environmental scheme providing sown boundary strips in an agricultural landscape of northern Germany Horst-Henning Steinmann, Jan Freese, Sebastian Klimek ..................................................... 97 Some approaches to natural enemies management Wladimir B. Tshernyshev .................................................................................................... 101 The dynamics of generalist predators in two different six years crop rotation systems: sources and sinks? F. van Alebeek, R. van den Broek, J.H. Kamstra, W. van den Berg, A. Visser .................. 105 Ecological infrastructure and polycultures to improve natural control of insect pests in cabbage: first year results Rob van den Broek, Frans van Alebeek, Wim van den Berg ............................................... 109 Kernel approach for quantifying the spatial extent of the ecosystem service of pest control provided by non-crop habitats in agricultural landscapes W. van der Werf, P. Goedhart, F.J.J.A. Bianchi & H. Baveco ............................................ 113 Experimenting with landscape management to control pest populations in viticulture Maarten van Helden, Guillaume Pain, Josephine Pithon, Marie-Anne Simonneau ............ 117 Perspectives for functional agro biodiversity in Brussels sprouts Paul van Rijn, Eefje den Belder, Janneke Elderson, Marian Vlaswinkel, Frans van Alebeek ................................................................................................................ 121 Functional agro biodiversity in Dutch arable farming: results of a three year pilot Paul van Rijn, Frans van Alebeek, Eefje den Belder, Felix Wäckers, Jan Buurma, Jeroen Willemse, Henny van Gurp ...................................................................................... 125 Spatial analysis of greenhouse density in relation to western flower thrips (Frankliniella occidentalis), onion thrips (Trips tabaci) and minute pirate bug (Orius spp.) population in greenhouses Andrea Veres, Ferenc Tóth, Szilvia Orosz, Daniel Kristóf, Kinga Fetykó .......................... 129 Tracing food source use by nectarivorous insects Felix L. Wäckers .................................................................................................................. 133
vii


Landscape Management for Functional Biodiversity IOBC wprs Bulletin Vol. 34, 2008
pp. 1-4
Which biotopes can supply the arable field with natural enemies?
Valentina M. Afonina, Wladimir B. Tshernyshev, Olga V. Solovchenko Department of Entomology, Faculty of Biology, Moscow State University, 119991, Moscow, Russia. E-mail: [email protected]
Abstract: Insects communities were studied with the help of pitfall traps and entomological net sampling. Our research was carried out in different biotopes: mixed forest, meadow (mowing yearly), abandoned field (5 years since last ploughing), a grassy field margin, the edge (10 m into the field) and the centre of a winter wheat field. Data analysis of collected carabid beetles showed that the most original community of these beetles occurred in the forest (natural climax biotope) followed by the meadow (semi-natural biotope). There was a certain similarity between the abandoned field and the field margin. Both the number of species and individuals of species of carabid beetles were minimal in the forest and meadow. Common field species well adapted to the field conditions such as Poecilus cupreus and Harpalus rufipes were absent in these biotopes. Thus only unstable biotopes with an excess of dominant predators can provide a source of such natural enemies for the field. Hortobiont (living on the grassy plants) insects, like predaceous bugs, were caught in all open biotopes including the arable field but some of them avoided its central part. Therefore the natural and semi-natural biotopes will not provide a source of carabid beetles for arable fields, predaceous bugs, however, can colonize the fields from other biotopes.
Key words: natural enemies, biotopes, agrolandscape, carabid-beetles, bugs Introduction The majority of natural enemies colonize arable field after ploughing in spring. They follow phytophagous pests and use the field as a hunting territory. The results of our preliminary studies in Krasnodar region (Tshernyshev et al., 2007) showed that a semi-natural biotope (meadow) was settled only by few non-abundant insect species while insect communities of grassy strips crossing a sun-flower field showed a small number of species but very abundant ones. The overwhelming majority of plants on these strips and on abandoned territories comprised of the weed Ambrosia artemisiifolia L. The common field species of herpetobionts (arthropods living on the soil surface) were almost absent in the meadow.
We tried to evaluate the possible role of different biotopes to supply the arable fields of Moscow region with natural enemies.
Material and methods Our observations were carried out in the Scientific Centre of Moscow University “Chashnikovo” (Moscow region) during the years 1995, 1998 and 2007. We collected arthropods with the help of pitfall traps and entomological net sampling. To achieve comparability of results of different years we analyzed here only the results of approximately the same sampling periods during June, July and August of different years (150 trap-days and 300 catches by entomological net per every season). We established 10 pitfall traps in every biotope. These traps were open during 5 days for one sample per biotope and date. Entomological net sampling consisted of taking 4 catches per date and biotope, everyone was
1

a result of 25 sweeps. Arthropods were collected in the following biotopes: 1) centre of a winter wheat field (about 150 m from its edge, 1998); 2) edge of this field (reaching about 10 m into the field, 1998); 3) the grassy margin adjacent to the field, 1998); 4) a mixed forest near the field (10 m into the forest, 1998); 5) the field abandoned for 5 years (no arable fields in the vicinity for last years, 2007); 6) a meadow (mowing once a year, no ploughing, 2007). Sweep net sampling was carried out in 1995 (field center and edge, margin) and in 2007 (abandoned field and meadow). We suppose that such comparison of different years results at the given case is admissible because these results are comparable as shown below.
Determination of resemblance of carabid beetles communities in different biotopes was carried out with the help of the R.L. Naumov’s pair comparison index: I = ΣCmin/(A+B–ΣCmin), where A is the sum of all species (species density) in biotope A, B such sum in biotope B and ΣCmin is the minimal sum of species mutual for both biotopes. This index ranges from 0 (no similarity) to 1 (coincidence). The advantage of this index is taking into account both the presence of a given species in a biotope and its density (Tshernyshev, 1996). We used the total sum of catches for a given species for season as density.
Results and discussion
1) Herpetobiont insects (living on the soil surface) The results of comparison of carabid communities of the different biotopes are presented in Table 1. Table 1. Results of the pair comparison of carabid communities in different biotopes.
Field
centre Field edge
Margin Forest Meadow Abandoned field
Field centre 1.00 0.46 0.31 0.16 0.10 0.20 Field edge 1.00 0.31 0.20 0.14 0.19 Margin 1.00 0.13 0.26 0.38 Forest 1.00 0.19 0.12 Meadow 1.00 0.39 Abandoned field
1.00
Means of indices
0.25 0.26 0.28 0.16 0.22 0.26
It is interesting that the indices of similarity between the abandoned field and the field margin (0.38) and between the abandoned field and meadow (0.39) were relatively high. We have to note that the distance between the abandoned field and meadow was only about 100 m. A slightly lower grade of similarity (0.26) was observed between the field margin and the meadow. We suppose that the abandoned field communities descended from communities of the field margin and changed over the spatial gradient towards to meadow.
The low line of table shows the means of indices for every biotope. Communities of these beetles are especially original in the forest in comparison with all other biotopes showing a minimal resemblance represented by the mean index of 0.16. We have to underline that forest is a climax stage of the geobotanical succession in Central Russia and represents a real natural biotope. The second ranking biotope in terms of originality is the meadow with a
2

mean index of 0.22. This biotope is a semi-natural due to every year mowing. On the contrary, the biotope “field margin” is with its index of 0.28 relatively similar to all other biotopes, such as the abandoned field (0.26), the field edge (0.26) and the central part of the field (0.25) there.
The number of species (only in analyzed samples!) was the following: forest - 11, meadow - 14, the field margin - 15, the abandoned field - 18, the field edge as well as the center - 19. Hence natural (forest) and semi-natural (meadow) biotopes contained the lowest numbers of species.
The similar picture was observed when counting all specimens of carabid beetles caught in the different biotopes. These results were as follows: meadow - 46, forest - 71, the abandoned field - 116, margin - 170, edge - 245, centre of the field - 427.
The high catches of these beetles in the field (centre and edge) may be explained by the presence of large populations of common arable field species like Poecilus cupreus L. and Harpalus rufipes De Geer. The relative amount (percent) of these both species in relation to all sampled carabid beetles in the different biotopes were as follows: field centre - 49% and 37%, edge - 26% and 31%, margin – 0.5% and 47%, abandoned field - 4% and 0%, meadow - 0% and 0%, forest - 0% and 0%, respectively.
It is necessary to note that many individuals of both species migrate to the field margins before winter and some of them can reach more distant biotopes such as the edge of neighbouring forest. However in summer these common arable field species have not been found in natural and semi-natural biotopes. A similar pattern was shown for two dominating species of rove-beetles Philonthus fuscipennis Mannh. and Ph. varius Gyll. These species preferred field areas (Soboleva-Dokuchaeva et al., 2002).
Our data resemble results of studies in the Krasnodar region (Tshernyshev et al., 2007) where the carabid beetles Calosoma auropunctatum Herbst were present in huge numbers in grassy strips and absent in a nearby meadow.
On the contrary, the carabid beetle Epaphius secalis Paykull prefers natural biotopes, since the proportions of E. secalis caught was in the field centre - 0%, edge – 0.1%, margin - 11%, abandoned field - 15 %, meadow - 30% and forest - 24%.
2) Hortobion insects (living on the grassy plants) In 1995 and 2007 we analyzed the occurrence of the carnivorous bug Nabis ferus L. in various biotopes, but not considering the forest. The mean numbers per trap and sampling date were as follows: 1995 - field centre 1.1±0.1, field edge 0.8±0.1, margin 2.0±0.3; 2007 -abandoned field 1.8±1.3 and meadow 2.2±2.1. Another important predatory bug is Anthocoris nemorum L. with a quite similar behaviour as N. ferus, however these species was not found in the central part of fields (Afonina et al., 2004). In the Moscow region these bugs can be found in every open biotope but prefer natural habitats. This conclusion is not in accordance with our results obtained in Krasnodar region (Tshernyshev et al., 2007) where the abundance of N. ferus on strips crossing the arable field was significantly higher than in the meadow.
In the Moscow region the hortobiont spiders Xysticus spp., Tetragnatha spp. and Microlinyphia spp. were abundant in the field margins. Many of them are mobile enough to reach the central part of the field (Seyfulina et al., 2001). Conclusions It can be supposed that the groups of arthropods can colonize the arable fields to a different degree. Special communities are established in the field and adjacent biotopes. Only some species from surrounding semi-natural biotopes can be introduced into the typical “field
3

community”. The more biotopes show natural characteristics the less is the abundance and number of
common field species of carabids able to mass outbreaks. The common herpetobiont species of agroecosystems are adapted to the arable fields conditions and absent in natural biotopes. Hence we can suppose that natural biotopes are not an important source of such carabid and rove-beetles playing an important role as natural enemies in the fields. However some predaceous hortobiont arthropods like bugs and spiders can colonize the arable field but usually prefer open natural biotopes. References Afonina, V.M., Tshernyshev, W.B., Soboleva-Dokuchaeva, I.I. & Timokhov, A.V. 2004:
Spatial distribution of hortobiont insects in agroecosystems of Moscow region. Entomol. Review 84 (4): 462-471.
Seyfulina, R.R. & Tshernyshev, W.B. 2001: Hortobiont spiders (Arachnidae, Aranei) in agroecosystems of Moscow Province (species composition, spatial distribution and seasonal dynamics). Entomol. Review, supplement 1 (81): 137-148.
Soboleva-Dokuchaeva, I.I., Chernyshov (Tshernyshev), W.B., Afonina, V.M. & Timokhov, A.V. 2002: Seasonal dynamics of spatial distribution of mass staphylinid beetles (Coleoptera, Staphylinidae) in agroecosystems. Entomol. Review 82 (7): 870-882.
Tshernyshev, W.B. 1996: Insect Ecology (in Russian). Moscow State University. Moscow: 299 pp.
Tshernyshev, W.B. 2001: Ecological Pest Management. Arthropods in agroecosystem. (in Russian). Moscow State University. Moscow: 135 pp.
Tshernyshev, W.B. & Afonina, V.M. 2007: Grassy strips, created in the field, as a source of predators (in Russian). Contribution of entomology to the agroindustrial complex, forestry and medicine. Abstracts of the XIII Congress of Russian Entomol. Soc. Krasnodar: 217-218.
4

Landscape Management for Functional Biodiversity IOBC wprs Bulletin Vol. 34, 2008
pp. 5-8
Model for integrating internal and external drivers for dispersal and distribution pattern in carabid beetles Bas Allema1, Walter Rossing1, Wopke van der Werf2, Tibor Bukovinszky3, Eveliene Steingröver4, Ariena van Bruggen1, Joop van Lenteren3, Kees Booij5
Wageningen University and Research Centre: 1 Biological Farming Systems group, Marijke-weg 22, 6709 PG Wageningen, The Netherlands; 2Crop and Weed Ecology; 3Laboratory of Entomology; 4Alterra; 5Plant Research International Abstract: Carabid beetles are important contributors to the ecosystem service of biological control of invertebrate crop pests. The density of carabid beetles varies over the landscape and their spatial pattern is highly dynamic in time and space. We hypothesize that the ever changing pattern of carabids in the landscape, and the spatial distribution of the associated ecosystem service, may be predicted by integrating internal and external drivers into a behavioural model for individuals. Internal drivers include the need for food, egg laying substrate and shelter. External drivers include the spatial pattern of food items, structure and density of vegetation, microclimate, and the presence of conspecifics or predators. Both types of drivers show strong seasonal variability. Process data will be collected in artificial arenas with automated camera observation of behaviour of Pterostichus melanarius and Poecilus cupreus. Here, the conceptual framework of the modelling is explained together with the experimental approach and some expected outcomes. One strong and one weak point of our approach are discussed. Key words: Carabid beetles, population distribution, walking behaviour, internal- and external drivers of behaviour Introduction Dispersal processes play a key role in determining population distributions of animals in space. Within fields, beetles tend to aggregate into species specific patches that do not change a lot during summer, but which may differ between years (Holland et al., 2005; Thomas et al., 2001; 2006). Previous studies correlated environmental factors, such as plant density, vegetation type or soil moisture content with population densities to explain spatial patterns. Although these studies have provided much knowledge about environmental factors that correlate with population distributions, the mechanisms that drive dispersal are not well understood. To understand these mechanisms we need to know what beetles respond to and what they are motivated for. We assume that beetles respond to prey density, to suitability of the substrate for egg-laying, to shelter, to natural enemies and to conspecifics. The motivations, or the internal driving forces that we distinguish are need for food, need for egg-laying substrate and need for shelter. We hypothesize that changing distribution patterns of carabids in the landscape may be predicted by integrating these motivations with external driving forces of movement into a behavioural model for individuals. In this paper we explain the conceptual framework for this model, the experimental approach and some expected outcomes.
5

Conceptual framework In our conceptual framework (see Figure 1) we distinguish between internal and external driving forces of carabid walking behaviour. Based on data from earlier research on carabids we assume the need for food, egg-laying substrate and shelter as major internal driving forces (or motivation states) of carabid walking behaviour. The need for food can be defined by satiation state and the need for egg-laying substrate by egg maturity. Mols (1993) and others (see Table 1) quantified in detail walking behaviour in relation to satiation state. Egg maturity has not been related to walking behaviour in literature, but because beetles do have a clear preference for certain egg-laying substrates (Tréfás & Van Lenteren, 2004), we hypothesize that females that have mature eggs will adapt their walking behaviour till a suitable egg-laying substrate is found. Satiation state and egg maturity have a strong interrelationship (Mols, 1993). Need for shelter plays a role at the end of the daily activity period and at the end of the season when beetles move to hibernation sites. How the need for shelter influences walking behaviour has not been studied yet. Satiation state, egg maturity and need for shelter are in this model assumed to be controlled by the circadian and annual cycle of beetles.
Microclimate / Vegetation
Walking behaviour
Prey
Prey consumed
Egg-laying substrate
Eggs laid
Circadian cycle / Annual cycle (phenology)
Egg maturity Satiation state
Environment
Beetle
Shelter found
Shelter
Need for shelter
Figure 1. Relation diagram with external drivers of walking behaviour (top half of figure) and internal drivers (bottom half of figure). We assume that the major external driving forces of walking behaviour are: availability of egg-laying substrate, prey availability and presence of shelter. The internal driving forces determine the beetles’ motivation to show a particular walking behaviour, which is triggered and affected by external driving factors. The resulting behaviour determines whether a resource is found or not. In our model egg laying, prey consumption or finding a shelter has a feedback on walking behaviour through changes in motivation (egg maturity, satiation state or need for shelter) of the beetle. These feedback mechanisms are acting on the level of internal
6

physiology of the beetle. This integration level is essential for the model but it is not addressed in our experiments. Availability of egg-laying substrate, shelter and prey density are all three determined by local microclimate and by the structure, density and species composition of the vegetation and beetle density (see table 1 for references). Also, vegetation may have a direct effect on walking behaviour by the resistance it causes for movement (Jopp & Reuter, 2005). Table 1. Studies on some of the relationships that are shown in Figure 1.
Relation Reference Satiation state – Walking activity Fournier & Loreau (2001) – Ecol Entom 26
Frampton et al. (1995) – Biological Conservation 71 Satiation state – Walking behaviour Mols (1993) – PhD thesis, Wageningen University
Wallin & Ekbom (1994) – Pop Ecology Vegetation density – Walking activity Tréfás et al. (2003) – IOBC wprs Bulletin 26 Microclimate – Walking activity Tréfás et al. (2003) – IOBC wprs Bulletin 26
Thiele (1977) – Carabid beetles in their environments Phenology – Egg load Basedow (1994) – in Descender et al. Carabid
Beetles – ecology and evolution Microclimate – Emergence pattern Holland et al. (2007) – Bulletin Entomol Res 97 Microclimate – Egg-laying site availability
Tréfás & Van Lenteren (2004) – Proc Netherlands Entomol Soc Meeting 15
This model concept is unique in that it couples external to internal drivers. Thomas et al. (2006), for example, directly link environmental driving factors to walking behaviour, but assume that beetles will always respond to these drivers in the same way. The coupling that we make between external and internal drivers is useful when motivation of beetles changes through the year, which we consider very likely. After emergence from their overwintering site or from the pupal stage, female beetles are expected to be motivated for foraging. But later in the season, as eggs are maturing, motivation will change to find a suitable egg-laying substrate. And at the end of the season, beetles will be motivated to find suitable overwintering sites. Experimental approach The relationship between walking behaviour and the external and internal drivers mentioned above will be studied for two common carabid beetles which occur in arable land: Pterostichus melanarius and Poecilus cupreus. We selected these species because (1) they differ in their reproductive and overwintering strategies (summer versus winter larvae) and (2) because they are large enough to track with cameras in a laboratory setup. By comparing two species with contrasting reproductive and overwintering strategies we expect to gain greater insight in the seasonal variation on internal drivers.
Our first aim is to identify the environmental conditions which determine habitat quality for foraging and egg-laying. To do this we create arenas with two artificial habitats that are contrasting in one environmental condition. We will first test plant density, prey density and soil moisture content. By comparing prey encounter rate and the number of eggs laid in a non-choice situation we hope to quantify habitat quality with respect to foraging and egg-laying.
7

Our next aim is to see how the motivation of beetles changes in the course of the season. To assess motivation we place beetles in arenas that consist of one patch that is optimal for foraging and one patch that is optimal for egg-laying and measure walking behaviour and residence time in each patch. We will repeat this experiment during the season to see how the motivation of beetles changes. At this point we should be able to say to which environmental factors beetles respond at a particular time in the year. All experiments are carried out in observation arenas of about 6 m2. This large size is needed to minimize edge tracking behaviour, which is typical in studies on carabids in arenas that are too small (Mols, 1993). Expected outcomes and discussion The research proposed here attempts to scale up individual walking behaviour of carabids to patterns in population density in the field. We aim at a model that predicts the spatial behaviour of a population of carabids in a small landscape mosaic of several hectares. Strong point of this model is that it accounts for a change in the response of beetles to environmental variables as the motivation of the beetle changes. This enables us to simulate walking behaviour from spring to autumn. The weak point is that we need to collect substantial information on the environmental variables to feed the model. To account for this we will only consider those environmental variables that are most relevant for walking behaviour to explain population distribution at our scale of interest in casu fields plus adjacent habitats. Similar to results of Firle et al. (1998), we expect dispersal to be determined by different mechanisms at different scales. At a large scale covering several fields searching for hibernation sites may for example be the strongest determinant, but at the scale of a single field foraging and/or egg-laying may determine distribution patterns. References Firle, S., Bommarco, R., Ekbom, B. & Natiello, M. 1998: The influence of movement and
resting behavior on the range of three carabid beetles. Ecology 79: 2113-2122. Frampton, G.K., Çilgi, T., Fry, G.L.A. & Wratten, S.D. 1995: Effects of grassy banks on the
dispersal of some carabid beetles (Coleoptera, Carabidae) on farmland, 1995. Biological Conservation 71: 347-355.
Holland, J.M., Thomas, C.F.G., Birkett, T., Southway, S. & Oaten, H. 2005: Farm-scale spatiotemporal dynamics of predatory beetles in arable crops. Journal of Applied Ecology 42: 1140-1152.
Jopp, F. & Reuter, H. 2005: Dispersal of carabid beetles - emergence of distribution patterns. Ecological Modelling 186: 389-405.
Mols, P.J.M. 1993: Walking to survive: searching, feeding and egg production of the carabid beetle (Pterostichus coerulescens L. (= Poecilus versicolor Sturm). PhD Thesis Wageningen University, The Netherlands.
Thomas, C.F.G., Parkinson, L., Griffiths, G.J.K., Garcia, A.F. & Marshall, E.J.P. 2001: Aggregation and temporal stability of carabid beetle distributions in field and hedgerow habitats. Journal of Applied Ecology 38: 100-116.
Thomas, C.F.G., Brown, N.J. & Kendall, D.A. 2006: Carabid movement and vegetation density: Implications for interpreting pitfall trap data from split-field trials. Agriculture Ecosystems & Environment 113: 51-61.
Tréfás, H. & Van Lenteren, J.C. 2004: Egg laying site preferences in Pterostichus melanarius Illiger (Coleoptera: Carabidae). Proceedings of the Netherlands Entomological Society Meeting 15.
8

Landscape Management for Functional Biodiversity IOBC wprs Bulletin Vol. 34, 2008
pp. 9-12
Insectary plants to enhance the biological control of Nasonovia ribisnigri and Frankliniella occidentalis in lettuce Oscar Alomar, Judit Arnó, Rosa Gabarra IRTA Cabrils, carretera de Cabrils Km 2, E-08348 Cabrils (Barcelona), Spain Abstract: Habitat management procedures are known to enhance the activity and abundance of natural enemies in field crops. From previous work on the relative attractiveness of plant species to predators, we short listed a preliminary mixture of plants to be annually planted in order to favour the presence of predators. The objective of this work was to evaluate the benefit of adding plant resources to a lettuce field in order to ensure the biological control of aphids (Nasonovia ribisnigri) and thrips (Frankliniella occidentalis). Providing plant resources in the field ensured the presence of key predators: adult hoverflies were attracted and aggregated on flower patches, and predatory bugs did establish on the insectary plants. Being highly mobile, both predators did disperse to plots without flower patches and established on lettuce plants unless limited by pesticide treatments. As a result of predator establishment, prey populations were reduced below the economic threshold. Key words: predators, habitat management Introduction Heterogeneity in the landscape, typical in many vegetable cropping systems in the Mediterranean can exacerbate pest problems, but may also provide abundant refuges and sources for entomophagous thus favouring natural biological control in crops (Albajes & Alomar, 1999; Alomar et al., 2002; Gabarra et al., 2004; Castañe et al., 2004). However, natural control is not always fully predictable, and inoculative releases of beneficials are used in greenhouses (Avilla et al., 2004). Habitat management procedures are known to enhance the activity and abundance of natural enemies in field crops. From previous work on the relative attractiveness of plant species to predators, we short listed a preliminary mixture of plants to be annually planted in order to favour the presence of predators (Alomar et al., 2006). The objective of this work was to evaluate the utility of adding plant resources into a lettuce field to ensure the presence of hoverflies and the minute pirate bug (Orius), and the biological control of aphids (Nasonovia ribisnigri) and thrips (Frankliniella occidentalis), two of its major pests. Material and methods Lettuce seedlings were planted in a 3600 m2 field in a complete randomized-block design with four replications of each of four treatments. Two insectary plant treatments were set-up in the middle of lettuce plots replacing 16 lettuce plants: (1) a simple arrangement of insectary plants with only Lobularia maritima (alyssum), and (2) a plant mixture with L. maritima, Centaurea cyanus, Vicia sativa, and Lupinus hispanicus. Two controls were included: (3) a pesticide control, with lettuces sprayed according to conventional practices; and (4) a natural control, without pesticides. The field was planted twice, both in spring (24th April) and summer (4th July). For the 2nd crop, we kept the same lay-out of the treatments to keep the
9

insectaries in situ, but replaced both legume plants with Ocimum basilicum and Achillea millefolium two weeks before transplanting the new crop.
Predator populations were non-destructively sampled in the insectary patches by shaking the plants over a white pan (33×23 cm) every week, and visually counting them. Visits to the plots by adult hoverflies were recorded by weekly visual observations (three minutes) of the centre of each plot. Lettuce sentinel plants infested with N. ribisnigri were left each week for two days in each plot, and taken to the laboratory to count the number of predators recovered. Finally, four lettuces were destructively sampled from each plot each week and taken to the laboratory in order to count the number of aphids and thrips, other major pests (e.g. Lepidoptera), and predators. Results and discussion Hoverfly establishment and aphid control Fig. 1 shows the percentage distribution in each treatment of adult hoverflies active in the centre of the plots, and of eggs and larvae that were recorded from sentinel and field lettuces during both crops. The visual observation on insectary patches or equivalent central lettuce plants confirms that hoverflies were active in the field, being attracted by the flowers. No adults were seen in the no-insectary plots. However, hoverflies did locate and oviposit on sentinel plants across all four treatments, thus indicating that adults did disperse all over the field after visiting the flower resources. In the 1st crop, hoverfly larvae and eggs were recovered from lettuces in both insectary treatments as well as from the natural control plots (average of 2.7±0.3 larvae and eggs/ plant). Neither larvae nor eggs were recovered from the pesticide control plots. As a result of hoverfly establishment in the no-pesticide plots, aphids were controlled from average peak levels of 184.9±33.4 aphids/plant down to 5±1 aphid/plant in two weeks, and to the same level as in the pesticide plots. A quality assessment at harvest showed that lettuce head weight was not affected by any treatment, nor were remains of hoverfly larvae present in marketable heads. In the 2nd crop, very few hoverflies established in the no-pesticide plots (0.1±0.05 eggs + larvae/plant), probably due to low aphid levels (0.75±0.5 aphids/plant). Orius establishment and thrips control Orius were first recovered from insectary plants from mid-may onwards, five weeks after transplant (up to 4.3±0.7 individuals/sample in the alyssum plots). Alyssum harboured higher Orius populations in the plant mixture, and did maintain Orius during the crop-free period. During the 2nd lettuce crop, Orius did build-up slowly in the insectary plants (up to 7.1±2.1 individuals/sample in the plant mixture, and 5.3±0.9 individuals/sample in the alyssum plots), but did specially increase in the newly transplanted basil that harboured almost three times as many Orius as alyssum. In the 1st crop, Orius were found on lettuce plants in all treatments, but very few did establish (up to 0.56±0.2 individuals/plant in the alyssum plots). Thrips (Frankliniella occidentalis) populations maintained at low levels (up to 5.9±1.4 thrips/plant in the alyssum plots) without differences among treatments. In the 2nd lettuce crop, Orius nymphs were already established on lettuces by the 2nd week after transplant, without significant differences among the three no-pesticide treatments (peak populations of 3.8±0.3 adults + nymphs/plant). Thrips populations on lettuce were similar to the 1st crop (peak of 6.4±0.6 thrips/plant), and not significantly different among treatments. The same level of thrips control was obtained in the pesticide control than in the other treatments. Orius also preys N. ribisnigri, and its establishment in the lettuce may also have contributed to the control of aphids.
10
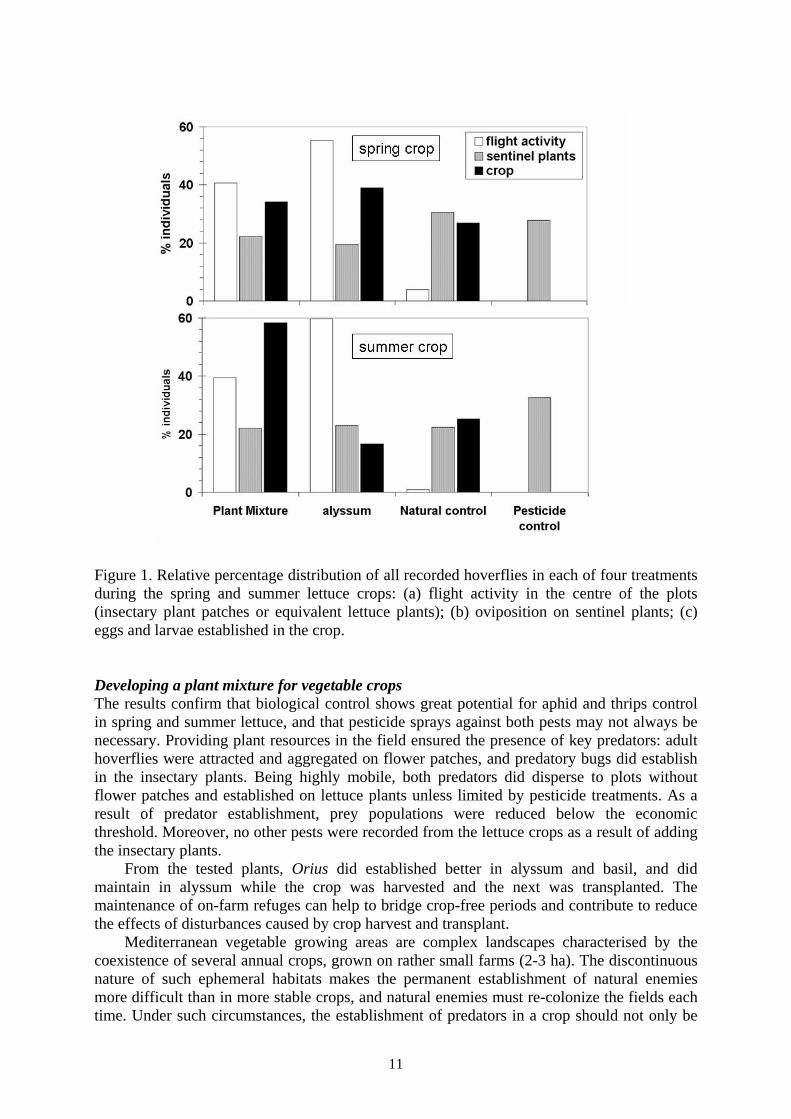
Figure 1. Relative percentage distribution of all recorded hoverflies in each of four treatments during the spring and summer lettuce crops: (a) flight activity in the centre of the plots (insectary plant patches or equivalent lettuce plants); (b) oviposition on sentinel plants; (c) eggs and larvae established in the crop. Developing a plant mixture for vegetable crops The results confirm that biological control shows great potential for aphid and thrips control in spring and summer lettuce, and that pesticide sprays against both pests may not always be necessary. Providing plant resources in the field ensured the presence of key predators: adult hoverflies were attracted and aggregated on flower patches, and predatory bugs did establish in the insectary plants. Being highly mobile, both predators did disperse to plots without flower patches and established on lettuce plants unless limited by pesticide treatments. As a result of predator establishment, prey populations were reduced below the economic threshold. Moreover, no other pests were recorded from the lettuce crops as a result of adding the insectary plants. From the tested plants, Orius did established better in alyssum and basil, and did maintain in alyssum while the crop was harvested and the next was transplanted. The maintenance of on-farm refuges can help to bridge crop-free periods and contribute to reduce the effects of disturbances caused by crop harvest and transplant. Mediterranean vegetable growing areas are complex landscapes characterised by the coexistence of several annual crops, grown on rather small farms (2-3 ha). The discontinuous nature of such ephemeral habitats makes the permanent establishment of natural enemies more difficult than in more stable crops, and natural enemies must re-colonize the fields each time. Under such circumstances, the establishment of predators in a crop should not only be
11

seen as a net benefit for a given field, but also as a net contribution to the enhancement of predator populations that will benefit other neighbouring crops (e.g. cucurbits) within the agricultural mosaic. Moreover, many of those predators are polyphagous, and will contribute to control other pests (e.g. Arnó et al., 2008). However, the abundance and diversity of natural enemies can vary according to the composition of the surrounding landscape, and it is necessary to confirm that the presence of insectary plant margins in simple landscapes is also sufficient to ensure biological control of major lettuce pests. Acknowledgements This research was supported by the Spanish Ministry of Education (AGL2006-08726/AGR), and by TRUEFOOD (“Traditional United Europe Food”, Integrated Project financed by the European Commission, 6th Framework Programme for RTD; Contract FOOD-CT-2006-016264). The information in this document reflects only the author’s views and the Community is not liable for any use that may be made of the information contained therein. Thanks to SELMAR for providing the necessary field. References Albajes, R. & Alomar, O. 1999: Current and Potential Use of Polyphagous Predators, pp:
265-275. In R. Albajes, M.L. Gullino, J.C. van Lenteren & Y. Elad (eds.), Integrated Pest and Disease Management in Greenhouse Crops. Kluwer Academic Publishers, Dordrecht, The Netherlands.
Alomar, O., Gabarra, R., González, O. & Arnó, J. 2006: Selection of insectary plants for ecological infrastructure in Mediterranean vegetable crops. IOBC wprs Bull. 20 (6): 5-8.
Alomar, O., Goula, M. & Albajes, R. 2002: Colonisation of tomato fields by predatory mirid bugs (Hemiptera: Heteroptera) in northern Spain. Agriculture Ecosystems & Environment 89 (1-2): 105-115.
Alomar, O., Gabarra, R., González, O. & Arnó, J. 2006: Selection of insectary plants for ecological infrastructure in Mediterranean vegetable crops. IOBC wprs Bull. 20 (6): 5-8.
Arnó, J., Roig, J. & Riudavets, J. 2008: Evaluation of Orius majusculus and O. laevigatus as predators of Bemisa tabaci and estimation of their prey preference. Biological Control 44: 1-6.
Avilla, J., Albajes, R., Alomar, O., Castañé, C. & Gabarra, R. 2004: Biological control of whiteflies in protected vegetable crops. In: Biocontrol in protected culture, eds. Heinz, Van Driesche and Parella. Ball Publishing, Batavia, IL: 171-184.
Castañé, C., Alomar, O., Goula, M. & Gabarra, R. 2004: Colonization of tomato greenhouses by the predatory mirid bugs Macrolophus caliginosus and Dicyphus tamaninii. Biological Control 30: 591-597.
12

Landscape Management for Functional Biodiversity IOBC wprs Bulletin Vol. 34, 2008
pp. 13-16
HOVER-WINTER: a multi-agent model to simulate the overwintering of a beneficial insect (Episyrphus balteatus, Diptera, Syrphidae) in a heterogeneous landscape Florent Arrignon1, Claude Monteil2,3, Jean-Pierre Sarthou2,3, Marc Deconchat3,2, Gérard Balent3,2
1 MAD Environnement, allée des Demoiselles, 33170 Gradignan, France ; 2 Université de Toulouse, INPT-ENSAT, UMR 1201 DYNAFOR, F-31326 Castanet Tolosan, France ; 3 INRA, UMR 1201 DYNAFOR, F-31326 Castanet Tolosan, France Abstract: Understanding how beneficial insects forage in a heterogeneous landscape is of primary importance in conservation biological control. For beneficial insect species that overwinter, survival is linked with the possibility to forage in the landscape for different resources simultaneously. We modelled the behaviour of Episyrphus balteatus (De Geer, 1776), a beneficial species of Syrphidae (Insecta, Diptera) which can overwinter as fertilized adult females and whose larvae feed on aphids occurring on both natural vegetation and crops. The "HOVER-WINTER" multi-agent model focuses on the winter dynamics of an E. balteatus population at the landscape scale. Each individual is modelled as an autonomous agent who behaves according to a set of rules for foraging in the landscape, feeding on flowers, sheltering in forest edges and dying, constrained by climate and land cover. HOVER-WINTER is the first individual based model for E. balteatus. Analysing the trajectories of insects emphasised the role played by meadows and south edges on the overall behaviour of the population. We also studied different scenarios of landscape improvements and showed that landscape configuration had less effect on overwintering success than the temperature and the foraging strategy of the individuals. In any case, landscape improvements greatly enhanced greatly the overwintering success. Key words: individual based model; Diptera Syrphidae; Episyrphus balteatus; biological control; beneficial insect; landscape; multiagent system; foraging strategy Introduction The keystone of successful conservation biological control with habitat management is to make beneficial insects be present and control the pests early enough for avoiding their exponential population growth. Some species, like E. balteatus, potentially allow this early biological control since they overwinter while having been fertilised in the fall and are thus able to lay their eggs early in the spring, if still alive, on aphid colonies in crops. How females overwinter is poorly known. In particular the role of flowers, providing the females with pollen and nectar, and how shelters, providing physical protection against the cold, is not well grasped in term of importance and spatial interactions of these parameters. In order to understand how an aphidophagous beneficial insect (Episyrphus balteatus de Geer, 1776, Diptera Syrphidae) utilises, at the female adult stage, the resources of a heterogeneous landscape to succeed in overwintering and to deal with cold and trophic resource scarcity, we built an individual based model, called HOVER-WINTER (from and for « Hoverfly » and « Overwinter »). The main objective of this model is to translate in a spatially explicit model, field data and both bibliographical and expert knowledge, to be able to simulate realistic population dynamics. One of the applications is to test the impact of various landscape structures on the
13

survival of its populations at the end of winter. These surviving females may have a major impact on crop aphids through the predation exerted by the first larval generation they beget (Tenhumberg & Poehling, 1995). Material and methods In the HOVER-WINTER model, the parameters were defined from the literature, available field data, or, when no such information was available, from experts’ knowledge on E. balteatus or similar species. Random selection of values in the model was restricted as much as possible. Each insect is an autonomous agent (class ‘Insect’) which follows decision rules to prospect the landscape, feeds on flowers, shelters at forest edges and dise. Each individual is located and performs one of the two activities: find flowers (class ‘Feed’) or find protection (class ‘Protect’) (Figure 1).
Figure 1. HOVER-WINTER UML class diagram, according to the UML symbology. At each time step, each activity may cause a move of the individual in the landscape. The choice of activity is done according to temperature and to an optimal foraging model (McNamara & Houston, 1985), adapted for the first time ever at the landscape scale, taking into account past events of prospection (‘time spent / quantity harvested’ ratio in each pixel, class ‘Memory’). Two classes (‘Trajectory’ and ‘TrajectoryElements’) save the trajectory of each individual. A software tool developed with Microsoft Excel ® allows an interactive visualization of the trajectories (Figure 2). A simulated winter has a duration of 90 days with a time step of 2 hours (1080 time steps). The pixel size is 20 by 20 meters (one cell = 400 m²). The global size of the landscape
14

Figure 2. Interactive visualization of the trajectory of each individual, through a software tool developed within Microsoft Excel ®. comprises between 640 and 670 hectares (16 000 up to 17 000 cells), depending on the scenario. 2000 insects are introduced at the start of the simulation. The model is partially based on studies realized in the Gascogne hills (southwestern France). The input maps are defined using the G.I.S. of the DYNAFOR laboratory, representing 5 types of land use (meadow, field, south forest edges, north forest edges, forest). Results The analyses performed with the model HOVER-WINTER on the basis of a real landscape of the Gascogne hills south-westwards from Toulouse confirmed the field observations made in Sarthou et al. (2005) and particularly the preferential utilization of south facing forest edges by these insects. Almost all the surviving individuals preferentially visited these latter edges and natural grasslands (harbouring some flowers such as dandelion) during winter (Figure 3). Climat and trophic resource factors had very strong effects on the winter dynamics of this beneficial insect and their respective influences were analysed hierarchically. Thus, the primacy of climatic events and of their duration was emphasized. Using the trajectory module, we explored the possibilities of spatial analyses of insect individual trajectories, in order to link them to the optimal foraging mathematical model. The interest of some potential types of landscape management were analysed through different scenarios: wildflower strips at different distances from the south edges. They showed effects on both the survival rate, which clearly increased, and the behaviour of the insects, which overwintered almost exclusively in south forest edges.The main objective of the model (translate in a spatially explicit model, field data and both bibliographical and expert knowledge) is reached and HOVER-WINTER is the first and the most comprehensive individual based model for E. balteatus. Although many parameters were taken into account in the HOVER-WINTER model, its overall behaviour was quite stable and outputs never exhibited inconsistent results with the biological and ecological knowledge about E. balteatus: surviving individuals, in model outputs as well as in field data, almost only visited south edges rather than north edges or forest centres, and the high visit rate in Meadows exhibited by the model is also consistent with field observations.
15

Figure 3. Average visit rate in winter of the different land use types, per individual. Discussion Studying population dynamics of species in different landscapes and at different spatial scales is an important issue in landscape ecology, particularly when it is applied to crop protection through conservation biological control. The model HOVER-WINTER proved to be an efficient tool to study the spatial dynamics of Episyrphus balteatus in some "experimental landscapes", what was found to be very useful to test some theoretical issues as well as practical ones in the field of conservation biological control. The first results on these “experimental landscapes” showed that improvements of forest edges in winter may greatly enhance survival in early spring. Beyond the overwintering period of this beneficial insect species, the model potentially allows investigations of its dynamics in other phases of its annual cycle. Given its generic design, it could even be used for other insects as well as for other animals that have to optimize their resource utilization and their foraging activity in a heterogeneous landscape. Acknowledgements The authors thank Sylvie Ladet and Alexandre Leray for their contribution to this study, by providing field and data implementation help. References McNamara, J.M. & Houston, A.I. 1985: Optimal foraging and learning. Journal of Theoretical
Biology 117: 231-249. Sarthou, J.P., Ouin, A., Arrignon, F., Barreau, G. & Bouyjou, B. 2005: Landscape parameters
explain the distribution and abundance of Episyrphus balteatus (Diptera: Syrphidae). European Journal of Entomology 102: 539-545.
Tenhumberg, B. & Poehling, H.M. 1995: Syrphids as natural enemies of cereal aphids in Germany: aspects of their biology and efficacy in different years and regions. Agriculture, Ecosystems & Environment 52: 39-43.
16

Landscape Management for Functional Biodiversity IOBC wprs Bulletin Vol. 34, 2008
pp. 17-20
Gis-based methodology to assess pesticide risk on biodiversity in terrestrial ecosystems Stefania Barmaz, Serenella Sala, Marco Vighi Department of Environmental Science, University of Milano Bicocca, Piazza della Scienza 1, 20126, Milano, Italy Abstract: In agricultural landscape, biodiversity is affected by several factors. The spread use of pesticides is one of the most important and needs to be assessed in order to reduce the level of impact. The potential aquatic and terrestrial ecosystems at risk are related to pesticides pathways of distribution and their environmental fate. Within the European project ALARM, a GIS-based methodology to assess the potential risk for terrestrial ecosystem at local scale was developed. The methodology takes into account hypogean and epigean terrestrial ecosystem, focusing on three different targets of impact: earthworms, pollinators and birds. Meolo watershed, in North East of Italy, was chosen as pilot area of study, being representative of intensive agricultural areas. Key words: pesticide, terrestrial ecosystems, GIS, risk assessment Introduction The Millennium Ecosystem Assessment (MEA, 2005) stated that the assessment of impacts on biodiversity was often rather descriptive and based on examples or snapshot information. A further decline in biodiversity from about 70% to 63% is projected up to 2050 (CBN, 2007), and agroecosytems are considered mainly endangered by pesticides. Although the decline in biodiversity can hardly be attributed to individual pesticides, there is sufficient evidence to support that their use can affect biodiversity. Therefore, ecotoxicological risk assessment is fundamental to assess risk to biodiversity due to pesticide use and, considering the complexity of agricultural scenarios, a site-specific assessment is crucial. The research activity presented here is performed within ALARM, one of the most important European Projects on risk assessment for biodiversity. The aim of the project is to develop an integrated large scale risk assessment for biodiversity as well as terrestrial and freshwater ecosystems as a part of environmental risk assessment. Material and methods Terrestrial Ecotoxicological site specific Risk Assessment for pesticide Exposure patterns to pesticides are different in aquatic and terrestrial ecosystems. In previous papers, a Gis-based methodology to assess risk in aquatic ecosystem was described (Verro et al., 2002; Sala & Vighi, 2008). The present study is a proposal for a site-specific risk assessment procedure accounting for the complexity of terrestrial ecosystems (both hypogean and epigean).
In most official European procedures, developed to fulfil the requirements of chemical regulations (EC, 2003; EC, 2002; EPPO, 2003), risk assessment is performed on more or less standardised scenarios, where the territory, at different scale levels (local, regional, continental), is described without taking into account the spatial variability of parameters.
17
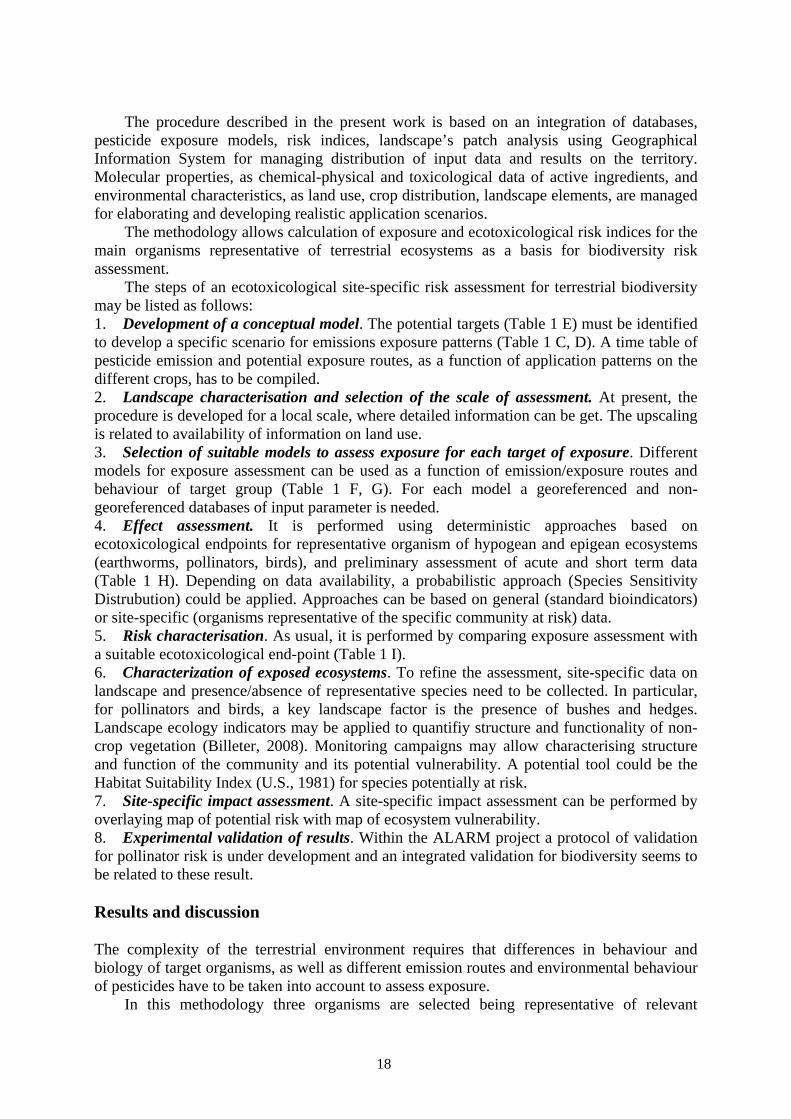
The procedure described in the present work is based on an integration of databases, pesticide exposure models, risk indices, landscape’s patch analysis using Geographical Information System for managing distribution of input data and results on the territory. Molecular properties, as chemical-physical and toxicological data of active ingredients, and environmental characteristics, as land use, crop distribution, landscape elements, are managed for elaborating and developing realistic application scenarios. The methodology allows calculation of exposure and ecotoxicological risk indices for the main organisms representative of terrestrial ecosystems as a basis for biodiversity risk assessment. The steps of an ecotoxicological site-specific risk assessment for terrestrial biodiversity may be listed as follows: 1. Development of a conceptual model. The potential targets (Table 1 E) must be identified to develop a specific scenario for emissions exposure patterns (Table 1 C, D). A time table of pesticide emission and potential exposure routes, as a function of application patterns on the different crops, has to be compiled. 2. Landscape characterisation and selection of the scale of assessment. At present, the procedure is developed for a local scale, where detailed information can be get. The upscaling is related to availability of information on land use. 3. Selection of suitable models to assess exposure for each target of exposure. Different models for exposure assessment can be used as a function of emission/exposure routes and behaviour of target group (Table 1 F, G). For each model a georeferenced and non-georeferenced databases of input parameter is needed. 4. Effect assessment. It is performed using deterministic approaches based on ecotoxicological endpoints for representative organism of hypogean and epigean ecosystems (earthworms, pollinators, birds), and preliminary assessment of acute and short term data (Table 1 H). Depending on data availability, a probabilistic approach (Species Sensitivity Distrubution) could be applied. Approaches can be based on general (standard bioindicators) or site-specific (organisms representative of the specific community at risk) data. 5. Risk characterisation. As usual, it is performed by comparing exposure assessment with a suitable ecotoxicological end-point (Table 1 I). 6. Characterization of exposed ecosystems. To refine the assessment, site-specific data on landscape and presence/absence of representative species need to be collected. In particular, for pollinators and birds, a key landscape factor is the presence of bushes and hedges. Landscape ecology indicators may be applied to quantifiy structure and functionality of non-crop vegetation (Billeter, 2008). Monitoring campaigns may allow characterising structure and function of the community and its potential vulnerability. A potential tool could be the Habitat Suitability Index (U.S., 1981) for species potentially at risk. 7. Site-specific impact assessment. A site-specific impact assessment can be performed by overlaying map of potential risk with map of ecosystem vulnerability. 8. Experimental validation of results. Within the ALARM project a protocol of validation for pollinator risk is under development and an integrated validation for biodiversity seems to be related to these result. Results and discussion The complexity of the terrestrial environment requires that differences in behaviour and biology of target organisms, as well as different emission routes and environmental behaviour of pesticides have to be taken into account to assess exposure. In this methodology three organisms are selected being representative of relevant
18

Table 1. Scheme of methodological steps for pesticide risk assessment for terrestrial ecosystems.
A -
Pest
icid
e
B –
Fo
rmul
atio
n
C –
Em
issi
on
Rou
te
D –
Exp
osur
e R
oute
E -
Tar
get
F - E
xpos
ure
asse
ssm
ent
G -
efer
enc e
fo
r m
etho
ds
H- E
ffec
t E
ndpo
ints
I - P
oten
tial
risk
Fung
icid
e
Trea
ted
seed
s Spread on soil
Die
tary
Bird DDD
EC, 2002; EPPO, 2003
LD50ETE=DDD/
LD50
Spread on soil Bird DDSD, DDD_i,
DGD EPPO, 2003 LD50
ETE= DDSD (or DDD_i or DGD)/ LD50
Gra
nula
r
Spread on soil
Die
tary
Earth worms PEC on soil
Ganzel-meyer et al., 1995
LD50ETR=PEC
on soil / LD50
Drift on soil LD50
ETE= DDDinsect /
LD50
Drift on vegetation
Bird
DDD based on calculated PEC on soil/ vegeta-tion and not on application rate
(RUD refinement considering insects and vegetation )
EC, 2002; EPPO, 2003
LD50
ETE= DDDvege
tation / LD50
Drift on soil
Earth worms PEC on soil
Ganzel-meyer et al., 1995
LC50ETR= PEC
on soil / LC50
Drift on vegetation
Die
tary
Pollinators
PEC on vegetation
Lazzaro et al., 2007 LD50
ETR= PEC on vegetation
/ LD50
Fung
icid
e –
Her
bici
de -
Inse
ctic
ide
Spra
y
Drift on vegetation
Con
tact
Pollinators
PEC on vegetation
Lazzaro et al., 2007 LD50
ETR= PEC on vegetation
/ LD5
Abbreviations: DDD: Daily dietary dose; DDSD: Daily Dietary Soil Dose for accidental ingestion; DDD_i: intentional ingestion of granules instead of food; DGD: intentional ingestion of granules instead of grit; PEC: Predicetd Environmental Concentration; RUD: Residue per Unit Dose; ETR: Exposure Toxicity Ratio, ETE: Estimated Theoretical Exposure terrestrial ecosystems: hypogean (earthworms) and epigean (birds and pollinators). These organisms may be exposed to pesticides in different way (dietary and contact) strictly linked to their physiology and biology but also to formulation (liquid, granular) and emission route of plant protection products. Furthermore these organisms and particularly pollinators are well known to provide key ecosystems services to both natural and agro-ecosystems (Potts et al.,
19

2006). This approach, taking into account all these issues, allows comparing active ingredients to draw classification of the environmental sustainability of their use, to protect ecosystems and to evaluate vulnerability related to landscape elements. The application of this methodology, and its further implementations (e.g. with meteo-climatic provisional scenarios, with temporal evolution of stressors, with socio-economic assessment), could represent a tool to combine and optimise provisional risk assessment for terrestrial biodiversity in agricultural landscape. Acknowledgements Research supported by the European Commission, Contracts No. 506675, ALARM References Billeter, R. et al. 2008: Indicators for biodiversity in agricultural landscapes: a pan-European
study. Journal of Applied Ecology 45 (1): 141-150. CBN - Secretariat of the Convention on Biological Diversity and Netherlands Environmental
Assessment Agency 2007: Cross-roads of Life on Earth - Exploring means to meet the 2010 Biodiversity Target. Solution oriented scenarios for Global Biodiversity Outlook 2. Secretariat of the Convention on Biological Diversity, Montreal, Technical Series no. 31.
European Commission 2002: Guidance document on risk assessment for birds and mammals under council directive 91/414/EEC, SANCO/4145/2000.
European Commission 2003: Technical Guidance Document on Risk Assessment in support of Commission Directive 93/67/EEC on Risk Assessment for new notified substances and the Commission Regulation (EC) 1488/94 on Risk Assessment for existing substances and Directive 98/8/EC of the European Parliament and of the Council concerning the placing of biocidal products on the market. European Commission, Joint Research Centre, European Chemical Bureau, EUR 20418 EN/4.
EPPO 2003: Environmental risk assessment scheme for plant protection products EPPO Bulletin 33 (2): 211-238.
Ganzelmeier, H., Rautmann, D., Spangenberg, R., Streloke, M., Herrmann M., Wenzelburger, H.J. & Water, H.F. 1995. Studies on the spray drift of plant protection products. Result of a test program carried out throughout the Federal Republic of Germany.
Lazzaro, L., Otto, S. & Zanin, G. 2008: Role of hedgerows in intercepting spray drift: evaluation and modelling of the effects. Agriculture, Ecosystems and Environment 123: 317-327.
MEA - Millennium Ecosystem Assessment 2005: Millennium Ecosystem Assessment, Ecosystems and human well-being: Biodiversity synthesis, Island Press, Washington, DC.
Potts, S.G., Petanidou, T., Roberts, S., O’Toole, C., Hulbert, A. & Willmer, P. 2006: Plant-pollinator biodiversity and pollination services in a complex Mediterranean landscape. Biological Conservation 129: 519-529.
Sala, S. & Vighi, M. 2008: GIS-based procedure for site-specific risk assessment of pesticides for aquatic ecosystems. Ecotoxicology and Environmental Safety 69(1): 1-12.
U.S. Fish and Wildlife Service 1981: Standards for the development of Habitat Suitability Index models for use in the Habitat Evaluation Procedures, USDI Fish and Wildife Service. Division of Ecological Services, ESM 103.
Verro, R., Calliera, M., Maffioli, G., Auteri, D., Sala, S., Finizio, A. & Vighi, M. 2002: GIS based System for surface water risk assesment of Agricultural Chemical. 1 Methodological Approach, Environ. Sci. Technol. 36: 1532-1538.
20

Landscape Management for Functional Biodiversity IOBC wprs Bulletin Vol. 34, 2008
pp. 21-23
Mapping the ecosystem service of pest control associated with forest in agricultural landscapes; a proof of concept J.M. Baveco1, F.J.J.A. Bianchi2, W. van der Werf3, P.W. Goedhart4
1Alterra Green World Research, P.O. Box 47, 6700 AA Wageningen, The Netherlands; 2CSIRO Entomology, Meiers Road 120, Indooroopilly, QLD 4068, Australia; 3Wageningen University, Plant Sciences, Crop & Weed Ecology Group, P.O. Box 430, 6700 AK Wageningen, The Netherlands; 4Biometris, Bornsesteeg 47, 6708 PD Wageningen, The Netherlands Abstract: Numerous studies have shown significant positive relationships between the area of non-crop habitat, such as forest, and the level of pest suppression in crops provided by natural enemies. Here we adopt an ecological engineering approach to predict the spatial distribution of the “public” ecosystem service of pest control in a real landscape. The map is constructed by combining geographical information on the spatial distribution of forest and a kernel which relates the pest control potential of natural enemies to the distance from the source habitat (i.e. forest). Methodological issues and potential applications are discussed. Key words: pests, parasitism, parasitoid, predator, spatial scale, integrated control Introduction The use of sentinel prey, i.e. the exposure of larvae or eggs in the field to assess parasitism and/or predation rates, is an often used approach to quantify the ecosystem services of pest control (Bianchi et al., 2006). Using logistic regression techniques parasitism and predation rates can then be related to the area or length of specific landscape elements at different spatial scales around the point of observation (e.g. Bianchi et al., 2005; Thies & Tscharntke, 1999). For example, in Bianchi et al. (2005) rings of with a diameter of 300, 1,000, 2,000 and 10,000 m have been used. Such analysis may yield significant relationships between certain landscape elements at certain spatial scales (rings) and parasitism and/or predation rates.
Although this approach is widely used, it has the drawback that it doesn’t allow to generate a continuous relationship between the pest control potential and distance from the landscape element that is associated with the pest control service. Rather, it only shows for which spatial scale (e.g. ring) a significant relationship exists. As a consequence, the results of the statistical analysis are difficult to use in a predictive way, such as the generation of a map for the pest control potential of natural enemies. The kernel approach (see van der Werf et al., this volume) addresses both of these limitations. In the following we will present a case study for southern Flevoland, The netherlands. Material and methods Plutella parasitism We used the kernel approach (see van der Werf et al., this volume) to explore the potential of natural pest control in southern Flevoland. We fitted the kernel to parasitism data of larvae of the diamondback moth, Plutella xylostella, that were released and recaptured in organic
21

Brussels sprout fields scattered over The Netherlands (Bianchi et al., 2008). In this study it was shown that parasitism rates were positively correlated with the area of forest at a scale of 1 km. Although a number of kernels and link-functions provided a satisfactory fit to the data, we used here the Gaussian kernel with the logit link-function and applied it to forest, which we assumed acted as a source habitat. Even though the method can be used to evaluate the impact of several kernels associated with different landscape elements simultaneously (i.e. a multi-kernel approach), we considered a single kernel for reasons of simplicity. GIS We constructed a raster map of forest area in The Netherlands (m2 forest within cells of 25 m by 25 m) using GIS. The kernel is projected around each grid cell with a non-zero amount of forest and multiplied by the amount of forest in the center cell, which is a measure of source strength. In technical terms this operation is a convolution of the kernel function and the forest distribution function. After the convolution we obtain a grid with in each cell the sum of contributions of all sources (i.e. forest) in the surrounding landscape. By applying the logit link-function, this sum of impact is translated into the final estimate of parasitism probability (i.e. pest control potential). Results and discussion Using the Gaussian kernel with the logit link-function, the pest control potential is highest near forest and declines at further distance from forest (Figure 1). This figure is an initial result, and provides a proof of concept. Further verification and validation of the approach is necessary. As the kernel is fitted to a single data set obtained by a two-week field experiment, it shows the probability of parasitism of diamondback moth larvae in organic cabbage fields during a short period in summer. For the extrapolation to a more generalized map for the potential of pest control several follow-up steps need to be taken. More data sets, related to other pest species in cabbage and at different times during the growing season will have to be included. If this is done, we will be able to produce a generalized map for cabbage. If one is interested in a more general map for multiple crops, data on a range of pest-natural enemy combinations in different target crops are needed. One might expect that different relationships will be found for different pest-natural enemy combinations. In that case, the design of a pest-suppressive landscape will reflect the trade-off between desired effectiveness of different species of natural enemies. Dutch policy makers are very interested to use the map (Figure 1), but care is needed for the interpretation as the map has not been verified. References Bianchi, F.J.J.A., Van Wingerden, W.K.R.E., Griffioen, A.J., Van der Veen, M., Van der
Straten, M.J.J., Wegman, R.M.A. & Meeuwsen, H.A.M. 2005: Landscape factors affecting the control of Mamestra brassicae by natural enemies in Brussels sprout. Agriculture, Ecosystems and Environment 107: 145-150.
Bianchi, F.J.J.A., Booij, C.J.H. & Tscharntke, T. 2006: Sustainable pest regulation in agricultural landscapes: a review on landscape composition, biodiversity and natural pest control. Proceedings of the Royal Society B: Biological Sciences 273: 1715-1727.
Bianchi, F.J.J.A., Goedhart, P.W. & Baveco, J.M. 2008: Enhanced pest control in cabbage crops near forest in The Netherlands. Landscape Ecology, in press.
Thies, C. & Tscharntke, T. 1999: Landscape structure and biological control in agroecosystems. Science 285: 893-895.
22

Van der Werf, W., Goedhart, P.W., Bianchi, F.J.J.A. & Baveco, J.M. 2008: Kernel approach for quantifying the spatial extent of the ecosystems service of biological pest control provided by non-crop habitats in agricultural landscapes. IOBC-WPRS Bulletin, this volume.
Figure 1. Predicted rate of parasitism in Plutella xylostella larvae on arable land in southern Flevoland, The Netherlands, indicated in red; dark-red with the highest parasitism rate. The linear and square green areas contain forest (i.e. act as source habitats); dark-green with the highest abundance of deciduous forest.
23


Landscape Management for Functional Biodiversity IOBC wprs Bulletin Vol. 34, 2008
pp. 25-28
Vegetation on field margins as a source of predatory mites (Phytoseiidae) for strawberry plantations in Poland: Preliminary observations Zbigniew T. Dabrowski, Danuta Kropczynska, Jakub Garnis Department of Applied Entomology, Warsaw University of Life Sciences – SGGW, ul. Nowoursynowska 159, 02 – 787 Warszawa, Poland Abstract: A hypothesis of the dominant role of functional biodiversity (not just flora richness) was critically analysed in the following framework: (a) flora species composition growing on field margins; (b) occurrence of phytophagous mites (Tetranychidae) as a prey for predatory mites; and (c) predatory mites of the Phytoseiidae family as the natural enemies of spider mites on vegetation of both field margins and inside strawberry plantations. Preliminary field observations carried out on 45 selected plantations in four regions of Poland showed variation in the abundance of predatory phytoseiid mites on various plant species grown in the surroundings of strawberry crop. Enhancing the role of natural enemies should fill the gap created by present restrictions in the use of pesticides in pest protection of strawberry crop. Key words: Phytoseiidae, Tetranychidae, field margin, strawberry Introduction In contrast to the intensive agriculture characterized by large monoculture fields, high external inputs and reduced vegetation biodiversity in many West European countries, the present conventional farmland in Poland is still characterized by small scale farms separated by numerous strips of heterogenous natural vegetation, including shrub hedges and woodland patches. The rich natural floral biodiversity should indicate its value in maintaining ecological stability in the agroecosystems. Long term studies carried out in western Poland demonstrated the importance of refuges mainly in midfield shelterbelts of various types to increase the diversity and abundance of fauna (Banaszak, 1983; Ryszkowski et al., 2002; Karg, 2004).
Reports on the role of surrounding vegetation of field crops as refuges for predatory mites (Phytoseiidae) is limited only to a few publications, in spite of observations of Boller et al. (1988) showing that hedges were an important source of predatory mites migrating from adjacent vegetation into vineyards. Following the field observations on densities of phytoseiid densities on various plant species in hedges around viticultures carried out by other authors in central and southern European countries allowed Boller et al. (2004) to list 24 most preferred plant species occupied by predatory mites. Tuovinen & Rokx (1991) and Tuovinen et al. (1994) stated that the vegetation adjacent to apple crops served as a reservoir of predatory mites (Phytoseiidae) as a response to nonselective pesticide treatment in orchards in Finland.
To evaluate the hypothesis of the dominant role of functional biodiversity (not just flora richness) we chose the critical analysis of following system framework: (a) flora species composition of field boundaries; (b) occurrence of phytophagous mites (Tetranychidae) as prey for predatory mites; and (c) predatory mites of the Phytoseiidae family as the natural enemies of spider mites on both field margins and inside strawberry plantations.
The system was chosen to evaluate the potential role of native species of phytoseiids in
25

sustainable production of strawberries. As in other European countries, a large number of pesticides used in the control of phytophagous mites on strawberry plantations were recently eliminated from the official recommendations in Poland. The gap created by the reduction of available synthetic pesticides may only be filled by developing alternative methods of phytophagous mite prevention and control methods. Materials and methods Five sites of commercial strawberry production were selected in the following regions of production of strawberries: (a) Puławy, (b) Płońsk, (c) Nasielsk and (d) Lubartów district.
An outline and photo picture of four margins of chosen strawberry plantations were made in July 2007, representing full growth of natural vegetation. Leaf samples of all plant species growing in these field margins, outside strawberry plantation, were collected in biweekly intervals in the 2007 growing season. Samples of strawberry leaves were taken from plants grown at the edge and centre part of plantation to evaluate the spatial scale effect. All stages of tetranychid and phytoseiid mites were counted under a stereo-microscope and adult stages of phytoseiids were collected for subsequent species identification.
Only a sample of quantitative data on Tetranychidae and Phytoseiidae abundance on selected plant species and strawberry plants is presented in this report. Results Because of the heterogenous landscape of cultivated land and small size of individual strawberry plantations in Poland, some of them were established in the vicinity of patches of “neglected” fruit trees, blackcurrants or domesticated raspberries. This type of vegetation occupied only a small portion of the field margins, but was recorded for further analysis of flora composition around strawberry plantations.
The highest density of predatory mites was recorded on wild raspberry (145.3 mites/100 leaf sample), followed by blackcurrant and elderberry (up to 82.7); stinging nettle (up to 62.0) and hazel (up to 41.3 mites/100 leaf sample) (Table 1). Other plant species observed to be a reservoir of predatory mites were: dewberry, blackthorn, wild cherry, white deadnettle and common evening primrose. The collected data on quantitative abundance of both spider mites as a prey for predatory mites did not indicate a direct correlation of the abundance of the two groups of acari on adjacent vegetation near strawberry fields (Table 1). Discussion Recent field observations on the distribution and abundance of phytoseiids on natural vegetation indicated that some plant species should be consider as resources of predatory mites. Jaworski (2000) observed in southern Poland, that all phytoseiid species collected on blackcurrant plantations inhabited adjacent vegetation. Apple and prune trees, hazel and nettle and mint, among low growing plants were good host plants for the predatory mites. A relatively higher density of predators in border rows of the plantation was a good indication of the direct effect of surrounding vegetation on phytoseiid population on blackcurrants (Jaworski, 2000). Regular collection of phytoseiid mites on various herbaceous plants showed that the following species harbour large population of predatory mites as: Urtica dioica, Geum urbanum, Fragaria vesca, Ballota nigra and Lamium album in Poland (Kropczynska & Miazga, in press).
26

Table 1. Abundance of Tetranychidae and Phytoseiidae on selected plant species of field margins and strawberry plants (the 2007 growing season).
Strawberry plantation Strawberry plants surroundings [avg. no. of mites/100 leaves] [avg. no. of mites/100 leaves]Location and Plant species (no. of field) Phytoseiidae Tetranychidae Phytoseiidae Tetranychidae
Lelewo (II) 6.0 79.0 0.5 1056.5Oenothera biennis Common evening primrose Cieksyn (III) 3.0 305.0 0.0 141.0
Cieksyn (III) 9.0 222.0 0.0 141.0Lamium album White deadnettle Serniki (II) 2.7 132.0 4.0 228.0
Serniki (I) 8.0 232.0 3.0 78.5Corylus avellana Hazel Serniki (II) 41.3 376.0 2.7 132.0
Serniki (I) 4.0 22.0 3.0 78.5Kolonia
Serniki (III) 62.0 21.0 4.0 15.0
Wola Sernicka (V) 27.0 85.0 0.6 56.0Urtica dioica
Zarzecze (II) 1.0 206.0 0.0 593.2
Stinging nettle
Dobrosławów 18.7 258.7 0.4 292.0Kowale (II) 4.0 108.0 0.0 64.8
Kolonia Serniki (III) 82.7 28.0 4.0 15.0
Wola Sernicka (V) 52.0 30.0 0.6 56.0
Sambucus nigra Elderberry
Dobrosławów 20.0 82.7 0.4 292.0Zarzecze (II) 4.0 100.0 0.0 593.2Malus
Apples Kowale (I) 2.0 32.0 0.0 421.0Serniki (II) 145.3 589.3 2.7 132.0Rubus idaeus
Raspberry Zarzecze (I) 1.0 624.0 1.0 371.0Prunus avium Serniki (II) 9.3 0.0 2.7 132.0Wild cherry
Ribes Kolonia Serniki (III) 82.7 17.3 4.0 15.0Blackcurrant
Prunus spinosa Kowale (I) 10.0 137.0 0.0 421.0Blackthorn Rubus caesius Zarzecze (I) 22.0 198.0 1.0 371.0Dewberry
Alnus Zarzecze (II) 0.0 0.0 0.0 593.2Alder
The generally low population density of predatory phytoseiids observed on strawberry plants was probably due to pesticide treatments on the majority of plantations. Preliminary field observations on predatory mites (Phytoseiidae) abundance on some wild plant species grown on field margins of various strawberry plantations in the same location and among regions of Poland showed considerable variation. In the majority of cases high abundance of phytophagous spider mites on wild plant species was reflected in higher population densities on the cultivated strawberry plants. Population density of predatory phytoseiid mites was much lower within strawberry plantation than on some plants grown on field margin, however, the ratio indicated an ecological balance between spider mite and predatory mite populations on some plantations.
27

Comparison of species composition of phytoseiid guilt occupying plants growing on field margins and strawberry plants should indicate a potential migration of the predatory mites into strawberry plantations. Species identification in presently carried out.
We expect that our future field observation and semi-field experiments will confirm that “richness” of plant species on crop field margin does not always reflect the stability of an ecological system (Van Emden & Dabrowski, 1994). More information is needed on the role of individual wild or domesticated plant species grown in field margins on population composition and abundance of predatory mites on crop plants, leading to the formulation of recommendations on management of strawberry plantation boundary strips. Acknowledgements The reported research was partially funded by the Ministry of Science and Higher Education under the PB2-MniSW-06/1/2007 grant. References Banaszak, J. 1983: Ecology of bees (Apoidea) of agricultural landscape. Pol. ecol. Stud. 9:
421-505. Boller, E.F., Remund, U. & Candolfi, M. 1988: Hedges as potential sources of Typhlodromus
pyri – the most important predatory mite in vineyards of Northern Switzerland. Entomophaga 33: 15-22.
Boller, E.F., Häni, F. & Poehling, H.-M. 2004: Ecological infrastructures. Ideabook on functional biodiversity at the farm level. Swiss Centre for Agricultural Extension and Rural Development (LBL), Lindau, Switzerland, 212 pp.
Jaworski, S. 2000: Occurrence of phytoseiid mites (Acari: Phytoseiidae) on blackcurrant plantations and in surrounding vegetation in southern Poland. IOBC/wprs Bulletin 23 (11): 57-62.
Karg, J. 2004: Importance of midfield shelterbelts for overwintering entomophauna (Turem area, west Poland. Polish Journ. Ecology 52: 421-431.
Kropczynska, D. & Miazga, M. (in press): Herbaceous plants as a potential source of phytoseiid mites. Biological Letters.
Ryszkowski, L., Karg, J., Kujawa, K., Gołdyn, H.& Arczyńska-Chudy, E. 2002: Influence of landscape mosaic structure on diversity of wild plant and animal communities in agricultural landscape in Poland. In: Landscape Ecology in Agroecosystems Management, ed. L. Ryszkowski, CRC Press, Boca Raton, New York, Washington D.C.: 185-217.
Tuovinen T. & Rokx, J.A.H. 1991: Phytoseiid mites (Acari: Phytoseiidae) on apple trees and in surrounding vegetation in southern Finland. Densities and species composition. Exp. appl. Acar. 12: 35-46.
Tuovinen T., Prokopy, R.J. & Coli, W.M. 1994: Influence of surrounding trees and bushes on the phytoseiid mite fauna on apple orchard trees in Finland. Agriculture, Ecosystem and Environment 50: 39-47.
Van Emden, H.F. & Dabrowski, Z.T. 1994: Biodiversity and habitat modification in pest management. Insect Sci. Applic. 15: 605-620.
28

Landscape Management for Functional Biodiversity IOBC wprs Bulletin Vol. 34, 2008
pp. 29-32
Green bridges over the winter: consequences for Brassica pests Eefje den Belder1, Jane Landure2, Janneke Elderson1, Marian Vlaswinkel3, Jeroen Willemse4, Frans van Alebeek3, Paul van Rijn5 & Henny van Gurp6
1 Plant Research International, Business Unit Agrosystems, P.O. Box 16, 6700 AA Wageningen, the Netherlands; 2Ecole Supérieure d’Agriculture d’Angers, France; 3Applied Plant Research (Plant Sciences Group Wageningen UR (Lelystad); 4 DLV Plant bv (Westmaas); 5 Netherlands Institute of Ecology (NIOO, Heteren),: 6LTO-Nederland (The Hague) Abstract: Crop arrangement in space and time may have an impact on the ecology and dynamics of insect pests and therefore stimulate outbreaks. We investigated the role of winter oilseed rape, a cruciferous plant species in a wildlife mixture, and green manure (white mustard) as possible refuges and sources of three pests for Brussels sprouts in the winter and spring. Seventeen locations with cruciferous crops/species were sampled in an area covering approximately 400 ha with a high proportion of arable crops (Hoeksche Waard, province South Holland). Cabbage whitefly and cabbage aphids were found on all Brassica species in high and moderate numbers respectively, while no diamondback moth was found. We conclude that green manure, field margins with wildlife mixtures containing Brassica species, but especially oilseed rape, form green bridges over the winter for Brassica pest species in Brussels sprouts. With climate change resulting in milder winters, and the increase of oilseed rape for biofuel production, the risk of more permanent green bridges for Brassica pest species is increasing. Key words: winter and spring ecology, Aleyrodes proletella, Brevicoryne brassicae, Plutella xylostella, oilseed rape, wildlife mixture, green manure, Brussels sprouts Introduction By considering various temporal, spatial and varietal features of cropping systems, Litsinger & Moody (1976) suggested a number of implications for pest occurrence and suppression of various crop management schemes. There is increasing awareness that pest regulation acts at the landscape level and that large-scale changes in landscapes are related to local ecological functioning (Roschewitz et al., 2003). Many studies have demonstrated that the establishment of diverse vegetation field margins, non-crop habitats or line features in the landscape can enhance biocontrol. Spatial crop arrangement, field aggregation and field size affect the potential for pest control (Den Belder et al., 2006, 2007). Crop arrangement in space and time may also impact on the ecology and dynamics of insect pests and stimulate outbreaks (Altieri & Nicholls, 2004). This study, set up in 2007, focused on the ecology and dynamics of cabbage aphid, Brevicoryne brassicae L. (Homoptera: Aphididae), diamondback moth, Plutella xylostella L. (Lepidoptera: Plutellidae) and cabbage whitefly, Aleyrodes proletella L. (Homoptera: Aleyrodidae) in the Hoeksche Waard region in relation to Brassica species during the winter. The main goal of the study was to investigate the role of winter oilseed rape (Brassica napus L. ssp. oleifera), cruciferous plant species in a wildlife mixture (winter rape, Brassica napus L. var. biennis, turnip Brassica rapa L. var. rapa, white mustard, Sinapsis alba L.), green manure (Sinapsis alba L.), some volunteer weeds (white mustard, Sinapsis alba L. and
29

fodder radish, Rhaphanus sativus L.) and wild weeds (charlock, Sinapsis arvensis L.) present in this region as sources of pests for Brussels sprouts fields in the winter and spring. Winter oilseed rape was recently introduced in this area. The concurrent presence of host plants of different cropping cycle/generations in close proximity may provide a so-called “green bridge” for pest establishment already in the fall of the same year. This may not only affect the yield and quality of e.g. oilseed rape, but more importantly, may provide a local source of pests for the Brussels sprouts next season at a time when no local pest population is present. A. proletella is slowly spreading from central to western Europe, and has recently become a serious pest in commercial Brassica fields in the Netherlands. Cabbage aphid is specialised on cruciferous plants and constitutes a world-wide problem with a substantial negative impact on horticulture. Plutella xylostella has become one of the most destructive lepidopteran species in cruciferous crops in the Netherlands, being capable of migrating over long distances. Material and methods
Study area: The study was conducted in 2007 in the Hoeksche Waard (province South Holland, western Netherlands). The area is characterised by cropland mosaics dominated by agricultural land-use and “blue-green” line features in the landscape, e.g. canals, ditches and dikes. The area covers approximately 400 ha with a high proportion of annual crop fields (potatoes, wheat, sugarbeet, onions and Brussels sprouts/Savoy cabbage). Seventeen sites with cruciferous crops/species were sampled. Crop field size was between 1 and 3.1 ha. Sampling: B. brassicae, A. proletella and P. xylostella populations were monitored four to seven times from February till July 2007. Plants were chosen along four 50-meter transects in four adjacent sections of each commercial field. In field margins plants were randomly selected. From each site, 10-20 plants were examined individually for the number of eggs, larvae, pupae and adult cabbage whitefly, apterous and alate cabbage aphids, or larvae and pupae of diamondback moth. Insect densities were compared using plant densities per m2. The autumn of 2006 (September, October, November 2006) and winter 2006-2007 (December 2006, January and February 2007) had an average temperature of respectively 13.6 and 6.6 °C in De Bilt, the Netherlands. Results In the study area, the growing period of winter oilseed rape fields (sowing date late August-mid October) overlapped the growing period of Brussels sprouts, which were planted in respectively May 2006 and 2007. Because Brussels sprouts fields were not always plowed immediately following harvest, the interval between successive Brussels sprouts crops was only 14 days (Fig. 1). Our observations revealed that each of the three herbivore species responded differently to the presence of the Brassicas during late winter and early spring. Diamondback moth: From February till June no larvae or pupae of P. xylostella were found in the Brassica species or weeds at the 17 locations. In June first adults were captured in pheromone traps on the dikes, and low numbers of larvae/pupae were found in two oilseed rape fields, the wildlife mixture (white mustard and winter rape) as well as in one Brussels sprouts field. Cabbage aphids: In March and April respectively, 761±235 and 59±1 apterous B. brassiciae per m2 were found in the Brussels sprouts field, while 44±13 and 1±1 apterous B. brassicae per m2 were found on Brasssicas in the wildlife mixture. During that period none of the monitored plants of the four oilseed rape fields (or volunteer and wild weeds in the margins) harboured B. brassicae. In May, three oilseed rape fields and both sites with wildlife mixture
30

harboured between 300-4000 apterous and 4-21 alatous aphids per m2. In that period, other Brassica species, including the newly planted Brussels sprouts harboured only few aphids. No B. brassicae were found in June at most Brassica sites except in three oilseed rape fields and one Brussels sprout field. Cabbage whitefly: In March all sites (including fodder radish and charlock) harboured A. proletella (Table 1). Oilseed rape harboured the highest numbers over the whole observation period. Whitefly populations increased on oilseed rape cabbage in April and remained high in May. Cabbage whitefly populations declined strongly after the ripening of oilseed rape (the same occurred on other Brassica species e.g. winter rape in the wildlife mixture). On newly germinated oilseed rape plants (June) cabbage whitefly increased rapidly.
Week no. 1 2 3 4 5 6 7 8 9 10 11 12 13 14 15 16 17 18 19 20 21 22 23 24 25 26 27Oilseed rape Plant presence x x x x x x x x
AdultsEggcirclesLarvae, pupae
▲ strong decline after ripening
Wildlife mixture S5 Plant presence x x x x x xAdultsEggcirclesLarvae, pupae
▲ strong decline after ripening stage
Green manure Plant presence x xWhite mustard Adult
EggcircleLarvae, pupae
Plant presence x x x x x x xAdultsEggcirclesLarvae, pupae
▲ new planting
Winter rape, turnip & marrow-stem kale
Brussels sprouts &Savoy cabbage
January February JuneMarch April May
Figure 1. Presence of Brassica crops/species and Aleyrodes proletella (adults, egg circles, larvae plus pupae) during winter 2006-2007 and spring 2007 in the Hoeksche Waard. X = observation date. Table 1. Densities of Aleyrodes proletella adults (A), egg circles (E) and larvae plus pupae (L+P) per m2 on Brassicas in the Hoeksche Waard. a In June newly germinated oilseed rape. b In May and June new Brussels sprouts plantings. Brassicas March April May June
A E L+P A E L+P A E L+P A E L+P
Winter oilseed rape a
364±48 343±43 0 42±20 907±220 6300±139 357±114 49±25 5932±117 44±17 270±46 658±179
Wildlife mixture
45±13 23±9 0 3±1 5±1 0 5±4 20±12 85±17 1±1 4±1 0
Green manure
80±20 20±12 0
Brussels sprouts/ Savoy b
49±13 180±39 57±15 564±61 619±66 0 2±1 6±2 0 4±1 20±4 17±12
31

Discussion The agro-environmental advantages of a good crop rotation system are widely recognised. Crop rotation is considered to be a cornerstone of ‘integrated farming’, particularly in view of its ability to maintain soil fertility and increase productivity (Leteinturier et al., 2006). In some agri-environmental schemes in Europe, farmers are compensated for sowing green manure and in some cases green manure is compulsory after certain crops (e.g. corn). At present, oilseed rape is the main agricultural crop used as raw material for biofuel production in Europe. The oilseed rape area in the Netherlands increased with 35% since 2005 to 3400 ha (statline.cbs.nl, 2007). This results in an increase of the total area of Brassica winter crops. This study demonstrated that oilseed rape is a very suitable host for cabbage whitefly and cabbage aphid. Sown in September and harvested in July/August, it forms a long “green bridge” or refuge for these pest species. Green manure (white mustard), with a lower host suitability for Brassica pests in comparison to oilseed rape, is incorporated in late winter. Therefore, this green bridge is too ‘short’ (in time) for direct infestation of the new season’s Brassica crops as Brussels sprouts. The impact of field margin flora indicates mostly beneficial effects, for instance the enhancement of natural enemies. However sometimes pest densities increase (Marshall & Moonen, 2002). Wildlife mixtures in our study area form a long, but narrow green bridge for cabbage whitefly and cabbage aphid. We conclude that green manure, field margins with wild life mixtures containing Brassica species, but especially oilseed rape, form green bridges over the winter for Brassica pest species. Furthermore, the increase in area of oilseed rape and green manure creates elevated risks for pests. This study was performed during a very mild winter, probably resulting in larger pest numbers than normal. In more severe winters one can expect less pest species to survive. However, in the most temperate areas of Europe (France, U.K.) those mild temperatures are not exceptional, and consequently oilseed rape and green manure can more frequently form a green bridge for Brassica pests. With climate change resulting in milder winters, in combination with an increase in area of especially oilseed rape, the risk of more permanent green bridges for Brassica pest species is increasing. References Altieri, A.M. & Nicholls, C.I. 2004: Biodiversity and pest management in agroecosystems.
2nd ed. Food Products Press, New York. Den Belder, E., Elderson, J. & Schelling, G. 2006: Landscape effects on the abundance of
Lepidopteran pests in Brussels sprouts. IOBC/WPRS Bulletin 29: 25-28. Den Belder, E., Elderson, J. & Schelling, G. 2007: Effect of the surrounding landscape on the
abundance of cabbage aphid in Brussels sprout fields IOBC/WPRS Bull. Vol. 30: 31-36. Leteinturier, B., Herman, J.L., De Longueville, F., Quintin, L. & Oger, R. 2006: Adaptation
of a crop sequence indicator based on a land parcel management system. Agric. Ecosys. Environ. 112: 324-334.
Litsinger, J.A. & Moody, K. 1976: Integrated pest management in multiple cropping systems. In: Multiple cropping. ASA publication. Nr 27.
Marshall, E.J.P. & Moonen, A.C. 2002: Field margins in northern Europe: their functions and interactions with agriculture. Agric. Ecosys. Environ. 89: 5-21.
Roschewitz, I., Hucker, M., Tscharntke, T. & Thies, C. 2005: The influence of landscape context and farming practices on parasitism of cereal aphids. Agric. Ecosys. Environ. 108: 218-227.
32

Landscape Management for Functional Biodiversity IOBC wprs Bulletin Vol. 34, 2008
pp. 33-36
The impact of agri-environment schemes on cereal aphid control John Holland, Heather Oaten, Steve Moreby, Sue Southway Game& Wildlife Conservation Trust, Fordingbridge, Hants SP6 1EF, UK Abstract: The impact of epigeal and flying aphid predators, in isolation and together, on cereal aphids was tested on farms with different proportions of grass margins and other uncropped land. Flying predators alone were as effective as all predators in controlling cereal aphids. Levels of parasitism were very low (≤1%) and control was attributed to predatory species. Preliminary analyses indicated that levels of aphid control achieved by flying predators improved positively with area of grass margin up to 750 m from the sampling location. There was an indication that some habitats may detract predators from cereal aphid control: grass margins within 100 m reduced control by epigeal predators and uncropped land within 500 m reduced control by flying predators. Key words: agroecology, agri-environment, generalist predators, biological control, natural enemies Introduction The introduction of agri-environment schemes is starting to change the landscape of Europe as farmers establish additional non-crop habitats. In the UK, 29,675 ha of cereal field margins (UK-BAP reporting, 2005) have been established under previous and current schemes, proving to be one of the most popular options. The majority of these were established with tussocky grasses that are known to support high densities of overwintering predatory beetles and spiders and therefore they may be expected to enhance levels of biocontrol in adjacent fields (Collins et al., 2002). Flower-rich habitats have also been established, although to a lesser extent and their pollen and nectar resources may encourage flying predatory and parasitic natural enemies. Whether levels of biocontrol will increase as a consequence of increasing the proportion of non-crop areas depends on the original structural diversity of the landscape; improvements were found in simple but not complex landscapes (Thies & Tscharntke, 1999). In 2005, an interdisciplinary project was started to investigate the impediments to the adoption of biological control in UK arable crops (www3.imperial.ac.uk/rebug). One objective is to examine the relative importance of natural enemy diversity and abundance (temporal and spatial) in pest control in cereal-based systems and to establish how the levels of biocontrol are affected by changes in the landscape. Materials and methods To compare the impact of different predatory guilds on cereal aphids, four different types of 1 m2 exclusion cages, inoculated with Sitobion avenae Fab. were used, that allowed the following guilds access to the aphids: E) epigeal predators only, through exclusion of flying predators and parasitoids; F) flying predators only, through exclusion and removal of epigeal predators A) all predators; N) no predators, through exclusion and removal of epigeal and flying predators and parasitoids. In 2006, 14 farms with different amounts of grass margins were selected. In a single field of winter wheat on each farm, two replicates of each exclusion cage were established along a transect 5 m apart at 80 m from the crop edge. To test whether inoculation with aphids was preferentially attracting aphid natural enemies, one cage of each
33

type was infested with either 250 or 500 S. avenae. In 2007, the study was repeated on 12 of the farms using one infestation rate of 500 S. avenae. In each year, the number of cereal aphids and parasitised aphids on 25 tillers per cage was assessed 14 and 28 days after inoculation. Farms were categorised according to the area of grass margin within a 750 m buffer zone radius from the field centre, determined using GIS (MapInfo v8.0); categories were: 1=<0.5 ha; 2=1-2 ha; 3=3-5 ha. The number of S. avenae on 25 tillers per cage was assessed after 14 and 28 days. The total number of S. avenae (transformed log10 x+1) for each sampling occasion was analysed using an ANOVA with type of exclusion, scale and infestation rate (2006 only) as factors. Differences between cage types were determined using contrasts in GenStat v10 (VSN International). Further preliminary analyses were conducted to identify whether there were any linear relationships between the uncropped land and the levels of cereal aphid control achieved by the flying and epigeal predators. For each field, a GLM for the aphid parameter and aerial or ground predator presence was conducted in order to obtain the slope coefficient. These values were then used in a GLM testing the effect of uncropped land for buffer zones of 100, 250, 500 and 750 m radius from the field centre. The model was also run using the area of grass and flower-rich habitat within the above buffer distances using 2006 data derived using GIS. Results and discussion In 2006, 14 days after inoculation, significant main effects were found for scale (F2,88=9.7, P<0.001) and type of exclusion cage (F3,88=29.5, P<0.001) but there were no interaction effects. The total number of S. avenae increased from scale 1 to 3. Fewest S. avenae were found in cages where all (A) and flying natural enemies (F) only had access, while there were significantly more in cages with only epigeal (E) and no natural enemies (N) (Figure 1). At 28 days after inoculation the only significant difference was between the exclusion cages (F3,88=62.1, P<0.001) with A=F<E<N. In 2007, there was no significant effect of scale. There were significant differences in the total number of S. avenae between the types of exclusion cage at both 14 (F3,84=26.3, P<0.001) and 28 days (F3,84=46.7, P<0.001) after inoculation. On the first sampling occasion the differences were A=F<E<N, but by 28 days after inoculation A=F=E<N (Figure 2). Using a similar methodology, Schmidt et al. (2003) also found that flying predators and parasitoids were more effective than epigeal predators alone, although there was some complementarity. However, in their study flying predators were not abundant and the aphid control was attributed largely to parasitism and to a lesser extent, linyphiid spiders active on the ground. Schmidt et al. (2004) attributed aphid control to dipteran larvae and ground-dwelling spiders. Overall, of the aphids recorded 28 days after inoculation parasitized aphids only represented 0.2% and 0.7% in 2006 and 2007 respectively. This is well below the rate of 32-36% under which successful classical biocontrol has never been reported (Hawkins & Cornell, 1984), therefore other flying predators were probably responsible as reported by Oaten et al. (this volume). In 2006, significant relationships were found between the slope coefficient for aerial predators (a more negative coefficient indicates a greater the level of aphid control) and the area of grass margin for buffer zones of 250 m (r2=46), 500 m (r2=43) and 750 m (r2=25). This indicated that control of aphids improved where there were more grass margins (Figure 3). For ground predators the opposite trend was found, but only for a 100 m buffer zone (r2=29). There was a significant relationship (r2=51) for flying predators coefficient and the area of uncropped land within a 500 m buffer zone in 2007. Thus the control provided by flying predators became weaker as the area of uncropped land increased. Further analysis will
34

Figure 1. Total cereal aphids (±se) for each type of exclusion cage at 14 and 28 days after inoculation in 2006. Letters indicate significant diffences between cage types for each sampling occasion.
igure 2. Total cereal aphids (±se) for each type of exclusion cage at 14 and 28 days after Finoculation in 2007. Letters indicate significant diffences between cage types for each sampling occasion.
35

igure ies and the area
e conducted on the 2007 data, but the 2006 data suggested that the extra grass margins
d
cknowledgements
ur thanks go to all farmers who provided access to their fields, to Dr N.J. Aebischer and Dr
eferences
ollins, K.L., Boatman, N.D., Wilcox, A. & Holland, J.M. 2002: The influence of beetle
Hawkins, B.A. & Cornell, H.V. 1994: Maximum parasitism rates and successful biological
Schm auf, T., Thies, C., Schaefer, M. & Tscharntke, T. 2003:
Schm Tscharntke, T. 2004: Aphid suppression by natural
Thie d biological control in
F 3. Relationship between aphid control provided by flying natural enemof grass margins for a 250 m buffer zone in 2006. bencouraged aphid control by flying predators, but may act as a sink at smaller spatial scales for epigeal predators. Flower-rich areas had no impact on aphid control but the area occupiewas relatively small (maximum 1.2% for a 750 m radius buffer zone). Given the effectiveness of flying predators, further studies are underway (Oaten, this volume) to identify the species responsible so that ultimately appropriate habitat management practices can be developed. A OB. Smith for assistance with statistics and to everyone else who helped with the study. Funding was provided through the Research Councils UK Rural Economy and Land Use programme. R C
banks on cereal aphid population predation in winter wheat. Agr. Ecosyst. Environ. 93: 337-350.
control. Science 266: 1886. idt, M.H., Lauer, A., Purt
Relative importance of predators and parasitoids for cereal aphid control. Proc. R. Soc. Lond. B Biol. Sci. 270: 1905-1909. idt, M.H., Thewes, U., Thies, C. &
enemies in mulched cereals. Entomol. Exp. Appl. 113: 87-93. s, C. & Tscharntke, T. 1999: Landscape structure anagroecosystems. Science 285: 893-895.
36

Landscape Management for Functional Biodiversity IOBC wprs Bulletin Vol. 34, 2008
pp. 37-40
Long-term set-asides and functional biodiversity Erja Huusela-Veistola MTT Agrifood Research Finland, Plant Production Research, Plant Protection, FI-31600 Jokioinen, Finland Abstract: Effects of seed mixture, mowing and age of set-aside on arthropod numbers were studied in a field experiment in southern Finland. Two ecosystem services related to arthropods were examined - natural enemies of insect pests and provision of chick-food for farmland birds. The field experiment was established in 2003 and arthropods were sampled with pitfall traps and a D-vac suction sampler in 2004-2006. Total abundance of insects in D-vac samples was highest in areas sown with a clover-timothy seed mixture. However, the effects of seed mixture varied according to insect group and year. Mowing of set-aside did not have an effect on the numbers of epigeal predators. However, for D-vac catches of Auchenorrhyncha, Heteroptera and Diptera, the numbers of individuals were lower in mown plots than in unmown plots and thus represented less food for birds. Numbers of spiders and leafhoppers increased during the three year period. The results suggest that the age of set-aside and vegetation structure are more important than seed mixture or plant species richness in supporting various invertebrate populations. Therefore, set-asides of various ages and different vegetation structures should be included in the agricultural landscape to encourage optimum functional biodiversity. Key words: insects, spiders, natural enemies, grassland, set-aside, farmland birds, functional biodiversity Introduction The areas of semi-natural grasslands and field margins have generally declined in agricultural landscapes. In addition, regional specialisation of agricultural production, increase in farm size and adoption of monocultures have decreased functional biodiversity on the farm scale.
Non-crop habitats are important landscape elements, with important functions for farmland wildlife. They can provide food sources and hibernation sites for a lot of farmland arthropods, enhance key ecosystem services, such as biological control based on natural enemies of crop pests, function as important arthropod food source for other trophic levels, particularly for farmland birds.
Even a short-term fallow sown with a simple seed mixture can encourage populations of generalist predators (Huusela-Veistola & Hyvönen, 2006), but long-term set-asides may be even more efficient in terms off plant protection (Corbet, 1995). In Finland, set-asides are usually sown with competitive grass species that can suppress the establishment of weed species and thus reduce plant species diversity (Hyvönen, 2007). Because plants are as primary producers of crucial importance for the food web, vegetation diversity plays an important role for higher trophic levels.
In this study, the effects of set-aside establishment (different seed mixtures) and management methods (mowing) on arthropod numbers were studied from the viewpoint of functional diversity. The main focus was on polyphagous predators, but abundances of other arthropod groups, representing chick-food availability for farmland birds, were also studied.
37

Material and methods Field experiment A long-term set-aside experiment was established in Ypäjä, in southern Finland in 2003. The experiment was conducted on a clay soil as a strip-plot design with four replicates. The size of each experimental plot was 0.25 ha (50 m × 50 m). Set-asides were sown with various seed mixtures: 1) Trifolium pratense - Festuca pratensis - Phleum pratense, 4-5-5 kg ha-1 (standard mixture), 2) Agrostis capillaris - Festuca ovina, 7-7 kg ha-1 (less competitive mixture) and 3) Agrostis capillaris - Festuca ovina, 7-7 kg ha-1, and meadow plants (diversified mixture). The meadow plants included four annual or biennial species (Vicia villosa, Phacelia tanacetifolia, Campanula patula, Silene latifolia ssp. alba) and eight perennial species (Centaurea jacea, Anthemis tinctoria, Lychnis viscaria, Silene vulgaris, Succisia pratensis, Leucanthemum vulgare, Knautia arvensis, Hypericum maculatum). Sowing rates for V. villosa and P. tanacetifolia were 5 and 15 kg ha-1, respectively. For meadow plants it was 10 seeds m-2, except for C. jacea, which was 5 seeds m-2 and for K. arvensis, which was 1 seed m-2. Grasses and meadow plants were sown on 28th May 2003 and 30th May 2003, respectively. Two management levels were studied: mowing and no mowing. Mowing was conducted annually late in the autumn (August/September). Arthropod sampling and statistical methods Arthropods were sampled with pitfall traps and a Dietrick D-vac suction sampler in 2004-2006. Three pitfall traps were placed in the centre of each plot and insects were collected during one week periods three times (in June, July and August) each year. The pitfall traps were plastic cups with a diameter of 9.5 cm and depth of 10 cm. The trapping liquid was concentrated NaCl solution (300 gl-1). D-vac suction samples were taken in June and July. The D-vac sample consisted of 10 subsamples, each 0.092 m-2 in area and 15 sec in duration.
Abundances of generalist predators (Carabidae, Araneae, Staphylinidae and Opiliones) were examined with pitfall traps. Arthropod food available to birds was assessed from sampligs of D-vac. From D-vac data total catch of insects and abundances of Heteroptera, Auchenorrhyncha, Aphidoidea, Thysanoptera, Lepidoptera, Diptera: Nematocera, Diptera: Brachycera/Cyclorrapha, Coleoptera and Araneae were determined. Furthermore, the composition of insect assemblages was assessed by computing group-specific diversity (Shannon H’=-∑pi lnpi where pi is the proportion of ith group) and evenness indices (Hill E’= =(∑pi
2)-1/expH’) Availability of chick-food was assessed by CFI chick food index (Potts & Aebischer 1991): CFI= 0.121x(Carabidae) + 0.120x(larvae of Lepidoptera and Symphyta) + 0.083x(Chrysomelidae and Curculionidae) + 0.006x(Heteroptera and Cicadellidae) + 0.0004x(Aphidoidea) using D-vac data for calculation.
The differences in arthropod group catches and above-mentioned indices among seed mixtures and mowing treatments were assessed using ANOVA with year as a repeated factor. Assumptions of models were checked and data were square root or log –transformed prior to analysis if necessary to satisfy conditions of normality and homogeneity of variances.
Results and discussion Natural enemies Interaction for year and seed mixture was statistically significant (P<0.05) for all epigeal predatory groups. Numbers of carabids and spiders in pitfall traps were lowest in the plots of standard seed mixture in 2004, but highest in later years (Fig. 1). Staphylinids were most
38

0
20
40
60
80
100
120
2004
2005
2006
2004
2005
2006
2004
2005
2006
Standard Lesscompetitive
Diversified
StaphylinidaeCarabidaeOpilionesAraneaeab
unda
nce
Seed mixture
a)
Figure 1. Mean numbers of arthropod groups per trap in a) pitfall trap and b) D-vac sampling in 2004-2006. Arthropod food for birds Although total D-vac catches in different years were almost equal (P>0.1), indices of diversity (H’) (P<0.001) and evenness (E’) (P<0.001) decreased over time. In 2004, D-vac samples were dominated by Diptera and Coleoptera, but later Auchenorrhyncha was the dominant group (Fig. 1). Numbers of spiders and leafhoppers increased (P<0.01) during the three year period, which is in agreement with results from previous studies (Huusela-Veistola 1998, Huusela-Veistola & Vasarainen 2000).
Total catch from D-vac was highest in the clover-timothy mixture (P<0.05). However, the species group composition of D-vac catches differed among seed mixtures and between years and therefore the effects of seed mixture varied according to arthropod group.
0
100
200
300
400
500
600
700
2004 2005 2006 2004 2005 2006 2004 2005 2006
Standard Less competitive Diversified
abun
danc
e
AraneaeHymenopteraColeopteraAuchenorrhynchaHeteropteraDiptera: NematoceraOther Diptera
Seed mixture
b)
39

Coleoptera and Diptera were the most abundant groups in the standard mixture. In the diversified mixture, the highest numbers of Heteroptera and the lowest numbers of Hymenoptera were detected. Mowing significantly reduced total D-vac catch (P= 0.058) and CFI (P=0.073), but only slightly. Furthermore, numbers of Auchenorrhyncha (P=0.075), Heteroptera (P=0.062) and Diptera (P<0.05) were lower in mown than in unmown plots. Conclusions Set-asides represent one option to increase availability of ecosystem services in agroecosystems. At the landscape level, long-term set-asides can compensate for loss of semi-natural and natural grasslands. The groups of arthropods examined in this study did not benefit from the use of diversified or less competitive seed mixtures. Contrary to what had been expected, their abundances were usually highest in standard T. pratense-F. pratensis-T. pratense green fallow. Mowing decreased abundances of some vegetation-living arthropods and thus reduced insect food available to birds. However, mowing did not affect numbers of generalist predators. Generally, age of set-aside and vegetation structure was more important for arthropods than seed mixture or plant species richness. Permanent multilayer grassland set-asides were particularly important for leafhoppers and spiders. This study was based on examination of arthropods at group level. However, species-specific differences are likely because of specific species requirements. Furthermore, other groups, such as butterflies and pollinators, require a diversity of flowering plants. According to these results landscape should contain set-sides of various ages and species compositions. Acknowledgements I thank Dr. Terho Hyvönen for valuable comments on the manuscript. References Corbet, S. 1995: Insects, plants and succession: advantages of long-term set-aside. Agr. Ecos.
Env. 53: 201-217. Huusela-Veistola, E. 1998: Effect of perennial grass strips on spiders (Araneae) in cereal
fields and impact on pesticide side effects. J. Appl. Entom. 122: 575-583. Huusela-Veistola, E. & Hyvönen, T. 2006: Rotational fallows in support of functional
biodiversity. IOBC wprs Bulletin 29: 61-64. Huusela-Veistola, E. & Vasarainen, A. 2000: Plant succession in perennial grass strips and
effects on the diversity of leafhoppers (Homoptera, Auchenorrhyncha). Agr. Ecos. Env. 80: 101-112.
Hyvönen, T. 2007: Plant species diversity and seed-food production for farmland birds on set-asides. In: Biodiversity in Farmland, eds. Salonen, Keskitalo & Segerstedt. Maa- ja elintarviketalous 10: 13-25 (In Finnish with English abstract).
Moreby, S.J. & Southwood, S. 2000: Management of stubble-set-aside for invertebrates important in the diet of breeding farmland birds. Asp. Appl. Biol. 62: 39-46.
Potts, G.R.& Aebischer, N.J. 1991: Modelling the population dynamics of the Grey Partridge: conservation and the management. In: Bird population studies: their relevance to conservation and management, eds. Lebreton & Hirons: 373-390.
40

Landscape Management for Functional Biodiversity IOBC wprs Bulletin Vol. 34, 2008
pp. 41-44
Botanical and social aspects of conservation headlands in Switzerland Katja Jacot1, Lisa Eggenschwiler1, Nina Richner1, Daniel Schaffner2
1Agroscope Reckenholz-Tänikon Research Station ART, Reckenholzstrasse 191, CH-8046 Zurich, Switzerland; 2Agrofutura AG, Ackerstrasse, CH-5070 Frick, Switzerland Abstract: Many arable plants are endangered in Switzerland and several other countries. Many of them provide food and shelter for natural enemies of crop pests. Arable plants depend on regular soil cultivation. Therefore, conservation headlands may provide an ideal habitat for such plants. However, the abundance of conservation headlands in Switzerland significantly decreased during the last few years.
The importance of different field margin strips (conservation headlands and uncropped field margins sown with three different seed mixtures of arable flora) for arable plants was studied in the Swiss midlands. Additionally, farmers were asked by a questionnaire about the reasons to establish a conservation headland or not.
There were more plant species in the conservation headlands than in the adjacent crops. Uncropped field margins sown with a seed mixture harboured more arable plant species than conservation headlands and a high level of endangered arable species. The fear of weeds is the most important argument for many farmers to avoid the establishment of a conservation headland. Farmers with a conservation headland mentioned the promotion of biodiversity as the main reason for establishing such an ecological infrastructure. To promote such ecological infrastructures agricultural advisory services have to be intensified.
Uncropped field margins sown with arable species increase the abundance of arable plant species just some of which may play an important role for biological control. This encourages further research on sown flowering strips for improved pest control in the surrounding fields. Key words: arable plants, conservation headland, natural enemies, seed mixtures, survey Introduction Intensive agricultural practices have resulted in application of efficient herbicides and fertilisers and in competitive crop varieties which have reduced the abundance and diversity of annual arable plants (Baessler & Klotz, 2006; Stoate et al., 2001). The arable flora now belongs to the most endangered groups of plant species in Switzerland (Moser et al., 2002). But many arable plant species have an important function in natural pest regulation (Bosch, 1987; Molthan & Ruppert, 1988). For example the hover flies (Syrphidae) whose larvae are efficient aphid predators feed on nectar of arable plant species. However, the way of establishing such ecological infrastructures has an important impact on the composition and density of the vegetation which is crucial for attracting pollen and nectar feeders.
In Switzerland, the installation of conservation headlands is financially supported by the government especially to preserve and promote the arable flora. These strips at the crop edge are neither fertilized with nitrogen nor treated with pesticides (Bundesrat, 1998). Specific seed mixtures are available when valuable plants are no longer present in the field.
To assess the impact of conservation headlands on plant diversity, botanical surveys were carried out in different types of field margins. The main aim was to identify the type of field margin with the highest benefit for arable plants and to study the presence of selected plant groups which are attractive for beneficial insects.
41

Although the mean return per area of conservation headlands is higher than that of cereal crops, they are still not attractive to Swiss farmers. The arable land devoted to conservation headlands in Switzerland decreased by almost 50% in five years (BLW, 2005). Therefore we asked farmers about their reasons for or against establishing a conservation headland. The aim of the survey was to determine how this type of ecological infrastructure could be adapted to become a more attractive option to the farmers.
Material and methods
In the Swiss midlands (canton Aargau) five uncropped field margins sown exclusively with arable species were chosen. Each margin was sown in spring 2006 with three different seed mixtures (Agroflor plus, Arable Flora UFA and ART mixture). The seed mixtures contained eight to 32 different arable plant species. Botanical surveys were carried out in July 2006. In each plot all phanerogam species were recorded in four quadrates of 5 m × 5 m. The percentage cover of each plant species was estimated.
Additional sampling was carried out in 22 conservation headlands in the Swiss midlands (canton Aargau, Bern, Luzern, St. Gallen, Waadt and Zurich). In these conservation headlands no arable flora was sown. Botanical surveys were carried out in June 2006 on 105 m2 (1.5 m × 70 m) in each conservation headland and the adjacent crop (cereals (17), oilseed rape (3), peas (2)) which were either farmed organically or integrated. All phanerogam species were recorded. The big plot size was chosen because of the sparse occurrence of the arable flora.
In 2006 farmers all over Switzerland without a conservation headland were asked by mail with the help of a questionnaire to rate different given reasons leading to avoid the establishment of conservation headland. 158 farmers (response rate = 23%) were willing to answer the questions. Furthermore, 14 (response rate = 45%) farmers with a conservation headland were asked by mail about the reasons to establish such an ecological infrastructure.
Factorial ANOVAs, one-way ANOVAs and Kruskal-Wallis tests were performed by using STATISTICA 7. Data were log-transformed where necessary to reach normal distribution. Tukey post-hoc tests provided information about differences between groups.
Results and discussion Uncropped sown field margins harboured more arable plant species (53±3) than unsown conservation headlands (33±2) and a high number of endangered species. The species richness of sown plants in the uncropped sown field margins differed between the seed mixtures (Table 1). In contrast, the species richness of spontaneous plants was similar in all seed mixtures. The cover of Apiaceae, Asteraceae and Centaurea cyanus - which play an Table 1. Species richness in total, of spontaneous and sown plant species, cover (%) of Apiaceae, Asteraceae and Centaurea cyanus recorded in 100 m2 sample zone in different seed mixtures. Components in the mixture: Agroflor plus: 8 species; Arable Flora: 32 species; ART mixture: 21 species. Means with same letter not significantly different (n = 5). Variable Agroflor plus ART mixture Arable flora UFA P-Value Total species richness 43.8a ± 3.8 55.0ab ± 5.6 61.2b ± 3.9 0.05 Number of spontaneous species 36.2a ± 3.7 32.0a ± 2.8 36.3a ± 4.6 0.7 n.s. Number of sown species 7.6a ± 0.2 12.4a ± 1.8 15.6b ± 3.0 <0.001 Cover of Apiaceae 2.7a ± 0.5 5.2b ± 0.6 4.9b ± 0.4 <0.001 Cover of Asteraceae 19.9a ± 2.6 15.1a ± 1.8 18.0a ± 2.4 0.3 n.s. Cover of Centaurea cyanus 12.1a ± 1.5 7.8b± 1.0 8.5ab ± 1.1 <0.05
42
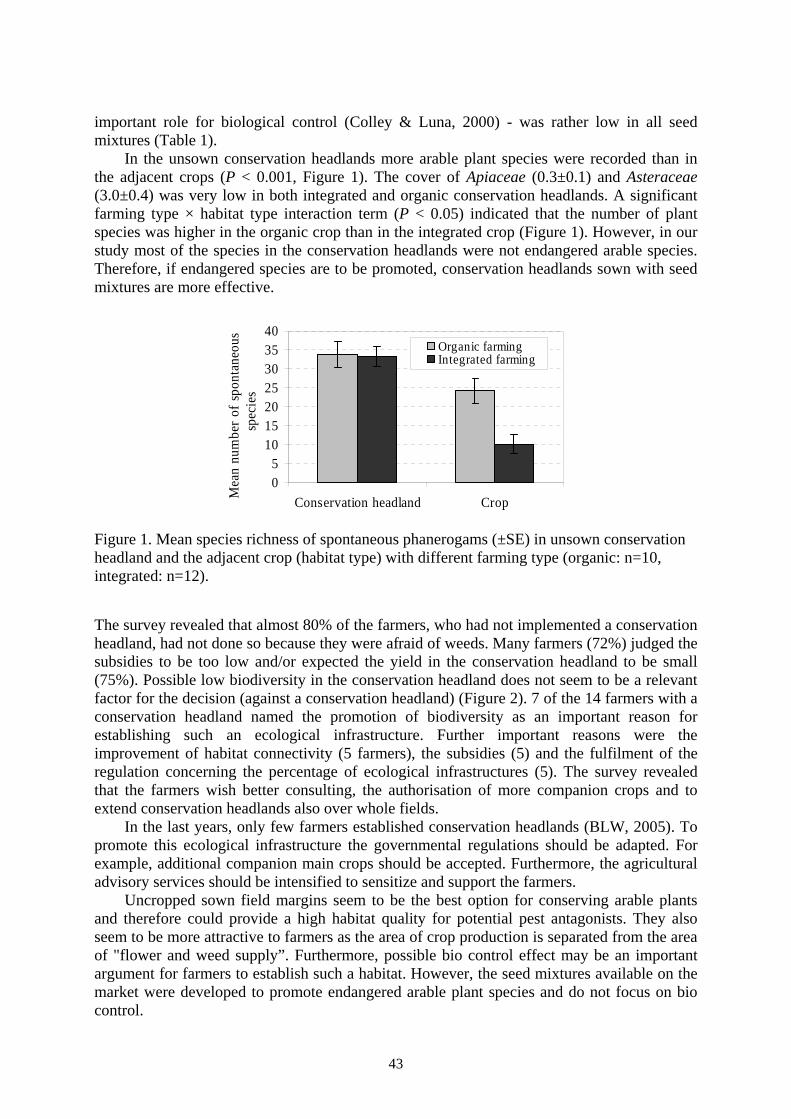
important role for biological control (Colley & Luna, 2000) - was rather low in all seed mixtures (Table 1). In the unsown conservation headlands more arable plant species were recorded than in the adjacent crops (P < 0.001, Figure 1). The cover of Apiaceae (0.3±0.1) and Asteraceae (3.0±0.4) was very low in both integrated and organic conservation headlands. A significant farming type × habitat type interaction term (P < 0.05) indicated that the number of plant species was higher in the organic crop than in the integrated crop (Figure 1). However, in our study most of the species in the conservation headlands were not endangered arable species. Therefore, if endangered species are to be promoted, conservation headlands sown with seed mixtures are more effective.
05
10152025303540
Conservation headland CropMea
n nu
mbe
r of s
pont
aneo
us
spec
ies
Organic farmingIntegrated farming
Figure 1. Mean species richness of spontaneous phanerogams (±SE) in unsown conservation headland and the adjacent crop (habitat type) with different farming type (organic: n=10, integrated: n=12). The survey revealed that almost 80% of the farmers, who had not implemented a conservation headland, had not done so because they were afraid of weeds. Many farmers (72%) judged the subsidies to be too low and/or expected the yield in the conservation headland to be small (75%). Possible low biodiversity in the conservation headland does not seem to be a relevant factor for the decision (against a conservation headland) (Figure 2). 7 of the 14 farmers with a conservation headland named the promotion of biodiversity as an important reason for establishing such an ecological infrastructure. Further important reasons were the improvement of habitat connectivity (5 farmers), the subsidies (5) and the fulfilment of the regulation concerning the percentage of ecological infrastructures (5). The survey revealed that the farmers wish better consulting, the authorisation of more companion crops and to extend conservation headlands also over whole fields.
In the last years, only few farmers established conservation headlands (BLW, 2005). To promote this ecological infrastructure the governmental regulations should be adapted. For example, additional companion main crops should be accepted. Furthermore, the agricultural advisory services should be intensified to sensitize and support the farmers.
Uncropped sown field margins seem to be the best option for conserving arable plants and therefore could provide a high habitat quality for potential pest antagonists. They also seem to be more attractive to farmers as the area of crop production is separated from the area of "flower and weed supply”. Furthermore, possible bio control effect may be an important argument for farmers to establish such a habitat. However, the seed mixtures available on the market were developed to promote endangered arable plant species and do not focus on bio control.
43

The importance of flowering strips for the reduction of pests in the crop is unclear. Therefore, we are planning to study the effectiveness of specific flowering strips attractive to cereal aphid antagonists to reduce the cereal aphids and as a consequence reduce pesticide input.
1: I don't agree at all3: undecided6: I completely agreeb
a
b bcc
1
2
3
4
5
Subsidies too low(n = 114)
Too many weeds(n = 122)
Yield too low (n = 117)
Not all cropsallowed (n = 108)
Species richnesstoo low (n = 107)
Rat
ing
Figure 2. Reasons why farmers (total 158; means and SE) forbear from establishing a conservation headland. n = number of farmers which answered the question. First three columns: significantly different from undecided. Letters above the columns indicate significant differences between columns.
Acknowledgements We thank all farmers who provided access to their field and were willing to answer the questions. Felix Herzog and Xenia Junge gave valuable comments on a draft of the manuscript.
References Baessler, C. & Klotz, S. 2006: Effects of changes in agricultural land-use on landscape
structure and arable weed vegetation over the last 50 years. Agriculture, Ecosystems and Environment 115 (1-4): 43-50.
BLW, 2005: Agrarbericht 2005. Bundesamt für Landwirtschaft, BLW, Bern, 252 pp. Bosch, J. 1987: Der Einfluss einiger dominanter Ackerunkräuter auf Nutz- und
Schadarthropoden in einem Zuckerrübenfeld. Journal of Plant Diseases and Protection 94: 398-408.
Bundesrat, 1998: Verordnung vom 7. Dezember 1998 über die Direktzahlungen an die Landwirtschaft (Direktzahlungsverordnung, DZV).
Colley, M.R. & Luna, J.M. 2000: Relative attractiveness of potential beneficial insectary plants to aphidophagous hoverflies (Diptera: Syrphidae). Environmental Entomology 29: 1054-1059.
Molthan, J. & Ruppert, V. 1988: Zur Bedeutung blühender Wildkräuter in Feldrainen und Äckern für blütenbesuchende Nutzinsekten. Mitteilungen der Biologischen Bundesanstalt für Land- und Forstwirtschaft 247: 85-99.
Moser, D.M., Gygax, A., Bäumler, B., Wyler, N., Palese, R. 2002: Rote Liste der gefährdeten Blütenpflanzen der Schweiz. BUWAL, ZDSF/CSCF, CJBG.
Stoate, C., Boatman, N.D., Borralho, R.J., Carvalho, C.R., De Snoo, G.R., Eden, P. 2001: Ecological impacts of arable intensification in Europe. Journal of Environmental Management 63 (4): 337-365.
44
Landscape Management for Functional Biodiversity IOBC wprs Bulletin Vol. 34, 2008
pp. 45-48
Combining studies on crop mosaic dynamics and pest population dynamics to foster biological control
Alexandre Joannon1*, Aude Vialatte2*, Chloé Vasseur1*, Jacques Baudry1*, Claudine Thenail1*
1INRA SAD-Paysage, 65 rue de St Brieuc, CS 84215, 35042 Rennes Cedex, France ; 2CNRS-University of Rennes 1, UMR 6553 ECOBIO, 35042 Rennes Cedex, France ; *CAREN, Campus de Beaulieu, 35042 Rennes Cedex, France Abstract: The importance of perennial landscape elements as hedgerows to control pests has been shown. But from our standpoint the role of the crop mosaic is less studied. In this paper we present 1) why farm level studies are needed to understand crop mosaic dynamics; 2) how crop mosaic dynamics could influence wheat field colonization by Sitobion avenae. The later case study shows that considering crop mosaic dynamics could help to design biological control strategies for crop pests. Key words: biological control, crop mosaic, dynamics, farm, landscape, Sitobion avenae Introduction The idea that some landscape elements may play a role as a source of predators to dampen pest populations is not new. The potential regulating role of hedgerows has been put forward since the 1970s (Van Emden &. Williams, 1974; Thresh, 1981). However, the concept of controlling pests with pesticides has offered a simple management option that has been favored by agronomists and farmers in recent decades. Advances in landscape ecology (Burel & Baudry, 2003) and the necessity to diminish the use of pesticides renew the role of landscape design as a means to combat pests. A literature survey shows that landscape ecology overstresses the role of perennial landscape elements such as hedgerows and has overlooked the role of the crop mosaic and its dynamics over the years. We define 1) the crop mosaic as the spatial organization of crops on a continuous piece of landscape; 2) its dynamics as the changes in its spatial organization over the years. The combination of landscape structure and crop mosaic is at the core of biological control (Landis et al., 2000).
Therefore, the purpose of our paper is to show the importance of considering crop mosaic dynamics and not only the permanent landscape elements when analyzing the landscape pattern’s influence on pest dynamics. We also postulate that the farm level is key in understanding landscape dynamics since the crop mosaic is the result of individual decisions mostly taken at the farm level (Joannon et al., in press). Since a farm’s fields are often scattered across the landscape, several farms are generally to be considered. However it depends on the size of the farms compared to the area of the habitat of the species studied. An example is given with the case of wheat field colonization by the grain aphid Sitobion avenae. Crop mosaic dynamics and on-farm technical management The spatio-temporal dynamics of crop mosaic are directly related to on-farm management and decision making. It has often been shown that the economic and policy environment influence farmers’ crop choices; indeed, studies often consider these factors as the main ones that
45

influence landscape structure (Kremen et al., 2007). However, the way the farmer spatially organizes the crops he chooses to cultivate is also related to technical constraints, which has been less studied (Maxime et al., 1995). Two types of technical constraints have to be considered: 1) the spatial constraints on land use allocation (Morlon & Benoit, 1990); 2) the temporal constraints of crop successions (Dogliotti et al., 2003). 1) The spatial constraints on land use allocation Two main kinds of factors constraint land use allocation on the farm at the field level: - Soil quality: this is the main factor that determines the suitability of a field to a given crop.
If a field is characterized by a soil that is stony, poorly drained, or not deep enough, some crops will not be cultivated in that field. However, irrigation and other soil improvements can allow a farmer to cultivate demanding crops in previously unsuitable fields.
- Field pattern: the shape of a field or its distance to the farm buildings will influence land use allocation, since it impacts work organization on a farm by increasing or decreasing the time spent on roads by the farmer.
Other factors can sometimes influence land use allocation as well, including: - The surrounding landscape pattern (e.g. the proximity of a forest); - Local or national regulations (e.g. land use restrictions on areas surrounding drinkable
water wells; voluntary agri-environmental schemes; etc.) 2) The temporal constraints of crop successions: an agronomic necessity On each field of the farm crops are organized over the years in order to ensure long term soil fertility, to avoid disease outbreak, to limit weed infestation, etc. This leads farmers to define three parameters for each crop: - The potential preceding crops: given the previous crop cultivated on a field some crops
cannot be cultivated the next year; - The minimum waiting period: this is the number of years the farmer waits before repeating
a crop on the same field; - The maximum repeating period: this is the maximum number of continuous years of the
same crop in the same field. The result is a crop mosaic that is highly deterministic from farmers’ point of view though it may seem spatially random from other standpoints (Thenail et al., submitted), especially for species utilizing crops for foraging or as shelter. Very few papers address the question of the spatio-temporal structures produced by the crop mosaic (Burel & Baudry, 2005); and even fewer papers address its role as a factor facilitating or impeding pest and predator population dynamics and movements. In order to understand how crop mosaic dynamics and population dynamics are interrelated, observations and analysis of population dynamics should clearly take into account the diversity of cover states created by the crop mosaic. Indeed, crop mosaic dyamics in the landscape is important regarding both the spatial and the temporal connectivity to supply resources over seasons and throughout the life cycle of the pests or predators (Baudry et al., 2003). Case study: wheat field colonization by the grain aphid Sitobion avenae in bocage landscapes in western France The grain aphid can cause severe damage in winter cereal fields in Europe. The grain aphid is a vector of the barley yellow dwarf virus disease. Host plants of S. avenae in western France include cultivated Poaceae (wheat, barley, oat, triticale and corn – which is the only one
46

present in summer) and uncultivated Poaceae (e.g. cocksfoot and Yorkshire fog, which are mainly perennial plants). A study was carried out to analyze grain aphid migration during spring and autumn, using both isotopic and genetic markers. Among all the potential plant sources, it was shown that cereal field colonization by aphids is mainly due to migration from field to field (Fig. 1): - in autumn, corn fields and cereal volunteers appear as the main reservoirs of aphids, which
colonize wheat fields after wheat emergence (Vialatte et al., 2006); - in spring, aphids colonizing winter wheat fields originate from local populations that had
over-wintered on volunteers and on early-sown cereals (Vialatte et al., 2007). Grain aphid populations inhabiting the numerous hedgerows of a bocage landscape are
genetically different from the populations found in wheat fields (Vialatte et al., 2005). Aphid populations inhabiting uncultivated patches of agricultural landscape may therefore be relatively unimportant to crop damage. Altogether, genetic and isotopic data are consistent with the hypothesis of a “cultivated biotype” in grain aphids. This biotype is able to exploit a succession of crops along the year. In particular, corn appears as the main bridge-crop during summer, and we note that this plant has recently begun to be intensively grown in western France (< 50 years).
Figure 1. Importance of the host plants (corn, wheat, cereal volunteers and uncultivated Poaceae) as sources of winged aphids colonizing wheat fields in spring and autumn. Markers used to identify aphid sources are genetic (microsatellites) and natural isotopic (carbon and nitrogen) markers. According to Vialatte et al., 2005, 2006, 2007. Conclusion and perspectives This case study shows that (i) among the numerous plant sources of S. avenae, corn, which has been intensively grown in western France since the 1960s, supplies most of the aphids that attack wheat fields in early autumn. This result illustrates how insect pests respond to land-use changes within a relatively short period of time, rapidly acquiring a new host which in turn highly affects its population dynamics by playing a key role on its annual life cycle. (ii) Crop mosaic is the main landscape pattern to take into account when managing agricultural landscapes to improve biological grain aphid control. Here management of wheat
47

and corn fields location over a landscape unit defined by aphid migration areas could decrease wheat field infestation. Agronomic studies of crop allocation to fields at the farm level are thus needed to model crop mosaic dynamics based on farmers’ decision making. We are currently working on a landscape model that will allow us to link on-farm technical decision making models and populations dynamic models. These kinds of tools will help to explore the impact of farm management on landscape and consequently on pest and predator population dynamics. References Baudry, J., Burel, F., Aviron, S., Martin, M., Ouin, A., Pain, G. & Thenail, C. 2003: Temporal
variability of connectivity in agricultural landscapes: Do farming activities help? Landscape Ecology 18(3): 303-314.
Burel, F. & Baudry, J. 2003: Landscape ecology: concepts, methods, and applications. Enfield, N.H., Science Publishers.
Burel, F. & Baudry, J. 2005: Connectivity dynamics in contemporary farming systems. Ecology at Multiple Scales/L'écologie, une question d'échelle, Montréal, Canada.
Dogliotti, S., Rossing, W.A.H. & Van Ittersum, M.K. 2003: ROTAT, a tool for systematically generating crop rotations. European Journal of Agronomy 19(2): 239-250.
Joannon, A., Bro, E., Thenail, C. & Baudry, J. (in press). Assessing the crop pattern in a cash crop area in North-central France in relation to farmland bird habitat requirements. Agronomy for Sustainable Development.
Kremen, C., Williams, N.M., Aizen, M.A., Herren, B.G., LeBuhn, G., Minckley, R. et al. 2007: Pollination and other ecosystem services produced by mobile organisms: a conceptual framework for the effects of land-use change. Ecology Letters 10: 299-314.
Landis, D.A., Wratten, S.D. & Gurr, G.M. 2000: Habitat Management to Conserve Natural Enemies of Arthropod Pests in Agriculture. Annual Review of Entomology 45(1): 175-201.
Maxime, F., Mollet, J.M. & Papy, F. 1995: Aide au raisonnement de l'assolement en grande culture, Cahiers Agricultures 4: 351-362.
Morlon, P. & Benoit, M. 1990: Etude méthodologique d'un parcellaire d'exploitation agricole en tant que système, Agronomie 6: 499-508.
Thenail, C., Joannon, A., Capitaine, M., Souchère, V., Mignolet, C., di Pietro, F., Gaucherel, C., Viaud, V., Pons, Y. & Baudry, J. (submitted). Contribution of crop rotation organization in farms to crop mosaic patterning at landscape scales. Agriculture Ecosystem and Environment.
Thresh, J.M. 1981: Pests, Pathogens and Vegetation. Boston, London, Melbourne, Pitman Advanced Publishing Program.
Van Emden, H.F. & Williams, G.F. 1974: Insect stability and diversity in agro-ecosystems. Annual Review of Entomology 19: 455-475.
Vialatte, A., Dedryver, C.A., Simon, J.C., Galman, M. & Plantegenest, M. 2005: Limited genetic exchanges between populations of an insect pest living on uncultivated and related cultivated host plants. Proceedings of the Royal Society of London, Series B, 272: 1075-82.
Vialatte, A., Plantegenest, M., Simon, J.C. & Dedryver, C.A. 2007: Farm-scale assessment of movement patterns and colonisation dynamics of the grain aphid in arable crops and hedgerows. Agricultural & Forest Entomology 9: 337-346.
Vialatte, A., Simon, J.C., Dedryver, C.A., Fabre, F. & Plantegenest, M. 2006: Tracing individual movements of aphids reveals preferential routes of population transfers in agroecosystems. Ecological Applications 16: 839-844.
48
Landscape Management for Functional Biodiversity IOBC wprs Bulletin Vol. 34, 2008
pp. 49-52
Explaining participation in multifunctional agricultural activities: an empirical analysis of the Winterswijk region in The Netherlands
Roelof A. Jongeneel1,2, Nico B.P. Polman2, Louis H.G. Slangen1,2
1Wageningen University, Wageningen, The Netherlands; 2Agricultural Economics Research Institute, The Hague, The Netherlands
Abstract: The European farm model is aimed at stimulating and facilitating multifunctional agriculture. The aim of this research was to investigate which factors determine the adoption of multifunctional activities and off-farm employment alongside traditional production. The results from 333 farms, in the Winterswijk region in the Netherlands, are used. Farmers who wish to secure the future of traditional agriculture are less likely to be involved in multifunctional activities or off-farm employment (no effect was found for only off-farm employment). Farms facing external pressure (environmental regulations etc.) were more likely to seek off-farm employment multifunctional activities. Larger farms and more specialised farms were less likely to be involved in multifunctional activities and off-farm employment. Key words: multifunctionality, nature conservation, rural policy, agri-environment
Introduction
Multifunctional land use and multiple value creation create new challenges. In order to improve our understanding of multifunctionality, this paper focuses on two main questions: (1) Why do farmers participate in multifunctional activities and what types do they prefer? and (2) What is the relation between participation in multifunctional activities and the attitude of the farmer towards farming? The paper is organised as follows. Section 2 discusses the applied methodology. Section 3 contains selected estimation results of the estimated explanatory logit models. Finally, the paper closes with a concluding section (Section 4). Methodology and data
Most of literature in the area of multifunctionality focuses on environmental measures only (e.g. Bonnieux et al., 1998; Vanslembrouck et al., 2002; Mathijs, 2004). Multifunctionality is much broader than environmental measures alone. Translating the elements in the literature relating to environmental measures to multifunctional activities is not trivial, since the characteristics and the role of the government are different for different activities. Our approach uses a more extended concept of multifunctionality, but includes some elements from the existing literature regarding farm enterprise characteristics and individual farmer characteristics. For that reason we give a short overview of the findings in this literature.
Bonnieux et al. (1998), Vanslembrouck et al. (2002), and Mathijs (2003) found that younger farmers are more likely to enter into agri-environmental schemes. Bonnieux et al. (1998) and Mathijs (2003) did not find a positive effect for farm size. In contrast, Drake et al. (1999) found a positive influence of farm size on participation. They provide several explanations such as economies of scale and savings on transaction costs. Higher agricultural education and education in general often have a positive effect for entering agri-environmental schemes (Vanslembrouck et al., 2002). Succession perspectives are also often
49

believed to have a positive effect on participation in countryside stewardship schemes. Mathijs (2003) takes general farming attitude or farming style explicitly into account. Others focus at the attitude towards the environment as an explanatory factor (Morris & Potter, 1995; Drake et al., 1999; Wynn et al., 2001).
In the following analysis a distinction will be made between various multifunctional activities, in particular between wildlife and landscape management (impure public goods), marketable non-agricultural outputs and off-farm employment. Moreover, following the expected utility maximisation framework, an explanatory model is developed which relates the probability that a farm is involved in a certain kind of (multifunctional) activity to a set of attitude-variables and structural variables (Jongeneel et al., 2008). Attitude variables are constructed that aim at approximating the farmer’s preferences, including sensitivity to risk. The structural variables comprise household characteristics (education, age) and characteristics of the farm operation (scale, specialisation, investment). The theoretical framework is used as a device for selecting the variables relevant to include in the explanatory model and the questions to be asked in a survey.
A survey based on random sampling from all the farms in the Winterswijk region in the Netherlands was conducted to obtain information about the relevant variables (response rate 25%; 333 questionnaires). The area is a small scale landscape with tree rows alongside the roads, forest patches, several brooks, peat meadows and pastures. The main farm activity is dairy farming. Nitrogen and phosphate concentrations in groundwater are high in this area.
The answers to the survey questions are analysed in a two-step procedure. Firstly, a factor analysis is applied to the answers given to the attitude statements and trust questions. Factor analytic methods are useful for extracting from a large number of variables, a smaller number of underlying dimensions that characterise the data with minimum loss of information. This allows us to reduce the information given by more than fifty questions into seven underlying factors. Secondly, multinomial regressions are estimated, which explain the probability of a farm household’s participation in a certain multifunctional activity as a function of the attitude factors and structural variables.
Results The dependent variable of the multinomial logit model considers the following exclusive choices: 1) having multifunctional activities and off-farm job, 2) having off-farm employment and no multifunctional activities, and 3) having no multifunctional activities and no off-farm employment (benchmark case). The data contained 94 (32%), 118 (40%), and 85 (28%) farms in classes 1, 2 and 3 respectively. Table 1 presents the estimation results.
Focusing on the significant explanatory variables, the probability of a farm with a combination of multifunctionality and an outside job is negatively related to the ‘future in agriculture’ attitude variable, degree of specialisation and farm scale variables. It is positively linked to the importance attached to the surroundings, the availability of a successor and the trajectory variable, which simply counts the number of investment-related changes at the farms during the last 5 years
The probability of a farm with an outside job, but no involvement in multifunctional activities depends positively on the external pressure (environmental regulations, urban pressure, etc), the attitude towards the surroundings, and the investment trajectory variable. It is negatively related to the farm scale.
The probability of a farm without an outside job and no participation in multifunctional activities is positively related to the scale variable. It depends negatively on the external pressure variable, the attitude towards surroundings and the investment related trajectory
50

variable. From the investment-related trajectory variable, it appears that the changes made at the farms during the last 5 years were in favour of creating a farm involved in multifunctionality or a farm which can be better combined with off-farm employment. It seems that it is the smaller scale farms which are more likely to adopt multifunctional activities or outside employment. With respect to outside employment in particular, the external pressure variable appears to be the discriminating factor. This suggests that in the sample region those farms which face a lot of external pressure can most easily ‘solve’ this problem by accepting outside employment. This is consistent with other studies that found it is easier to increase farm income with off-farm employment rather than with multifunctionality.
Table 1. Multinomial logit model explaining on-farm and off-farm activities. Asterisks indicate level of significance (*: 5%; **: 1%).
Multifunctional and off-farm
activities
Off-farm activities
Estimate Sig Estimate Sig Attitude characteristics
• Future -0.60 * -0.12 • Pressure 0.34 0.69 ** • Image 0.37 -0.0079 • Surroundings 0.75 ** 0.45 * • Innovation 0.0010 0.089 • Ownership 0.069 0.18 • Trust in government 0.047 0.035
Structural variables • Succession 0.76 ** 0.78 ** • Percentage rented land -0.0083 -0.0020 • Education 0.078 0.14 • Age 0.011 -0.042 • Farm scale -0.0048 * -0.0095 ** • Specialisation dairy farming -2.50 * -0.0066 • Specialisation other animal production -2.47 * 0.37 • Membership study club performance farming 0.25 -0.47 • Trajectory variable: changes at farm last five years 0.21 * 0.15 *
Constant term -0.41 1.14 Number of observations 263 Count R2 0.57Chi square 97.51 Pseudo R2 (McFadden) 0.17“Agriculture only” is comparison group
In a second step, the group of farms involved in multifunctional agriculture (with or without outside employment) is further analysed. An attempt is made to improve the insight in what explains the participation in nature conservation, as well as the supply of impure public goods (landscape contracting) and the type of contracting (parcel contracting versus integrated or ‘collective’ contracts organized via participation in a nature cooperative). The results suggest that nature and landscape management is not one homogenous service. Different factors influence participation in these activities. Of interest is the number of structural characteristics that are important for involvement in parcel contracting, which are not important for involvement in nature provision or landscape management (see Jongeneel et al. (forthcoming) for further details about the activity specific model estimates).
51

Concluding remarks In this paper a theoretical framework is developed and used as a basis for an empirical analysis of multifunctional agriculture. As the results of the survey indicate, farmers are involved in a host of multifunctionality activities. From the factor analyses it appeared that the answers to the multiple opinion or attitude questions could be ‘reduced’ to a few (stable) underlying factors. These factors were subsequently included in the explanatory model.
Farmers who wished to secure a ‘future’ for traditional agriculture were less likely to be involved in the three activities modelled. Another important variable was the attitude towards regional image. Those farmers who believed that regional image was important were more likely to participate in nature provision, landscape contracting and parcel contracting. Interestingly, this variable was not significant in the multinomial model. The importance attached to ‘regional image’ and landscape underlines that it is not only external incentives which explain the farmers behaviour, but that also the intrinsic valuation of certain activities by farmers matters. Specialisation turns out to have a negative effect on the probability of involvement in nature provision and parcel contracting, but it was not significant for landscape provision.
Finally, ‘trust’ appeared to be an important factor in explaining multifunctionality in general and the uptake of specific activities in particular (e.g. nature preservation and parcel contracting). It emphasizes that parcel contracting is different from standard buy and sell day to day market transactions, but that they include a strong relational aspect. Realizing that it is easier to destroy trust than to (re)built it, policy makers should be aware that their reputation matters, in particular when redesigning rural policies.
References Drake, L., Bergström, P. & Svedsäter, H. 1999: Farmers’ attitudes and uptake. In: Countryside
Stewardship: Farmers, Policies and Markets, eds. Van Huylenbroeck, G. & Whitby, M. Oxford, Pergamon, Elsevier Science Ltd.: 89-111.
Jongeneel, R.A. & Slangen, L.H.G. 2004: Multifunctionality in agriculture and the contestable public domain: theory and evidence about on-farm and off-farm activities in the Netherlands. In: Sustaining Agriculture and the Rural Economy. Governance, Policy and Multifunctionality, ed. Brouwer, F. Edward Elgar: 183-203.
Jongeneel, R.A., Polman, N.B.P., Slangen, L.H.G. 2008: Why are Dutch farmers going multifunctional? Land Use Policy 25: 81-94.
Jongeneel, R.A., Polman, N.B.P., Slangen, L.H.G. (forthcoming): Changing rural landscapes: Explaining multifunctionality in the Winterswijk region. In: Brouwer, F. & Heide, M. van der (eds.) (forthcoming), Multifunctional Rural Land Management: Economics and Policies. London, Earthscan.
Mathijs, E. 2003: Social capital and farmers’ willingness to adopt countryside stewardship schemes. Outlook on Agriculture 32 (1):13-16.
Morris, C. & Potter, C. 1995: Recruiting the New Conservationalists: Farmers’ Adoption of Agri-environmental schemes in the U.K. Journal of Rural Studies 11(1): 51-63.
Polman, N.B.P 2002: Institutional Economics Analysis of Contractual Arrangements; Managing Wildlife and Landscape on Dutch Farms. PhD-thesis Wageningen University.
Vanslembrouck, I., Van Huylenbroeck, G. & Verbeke, W. 2002: Determinants of the Willingness of Belgian Farmers to Participate in Agri-environmental measures. Journal of Agricultural Economics 53 (3): 489-511.
Wynn, G., Crabtree, B. & Potts, J. 2001: Modelling farmer entry into the environmentally sensitive area schemes in Scotland. Journal of Agricultural Economics 52(1): 65-82.
52

Landscape Management for Functional Biodiversity IOBC wprs Bulletin Vol. 34, 2008
pp. 53-55
Reservoirs role of some weed plants in the agroecosystem-dominated landscapes of southeastern Europe (Hymenoptera: Braconidae: Aphidiinae) Nickolas G. Kavallieratos1, Željko Tomanović2, Petr Starý3, Christos G. Athanassiou4
1Laboratory of Agricultural Entomology, Department of Entomology and Agricultural Zoology, Benaki Phytopathological Institute, 8 Stefanou Delta str., 14561, Kifissia, Attica, Greece; 2Institute of Zoology, Faculty of Biology, University of Belgrade, Studentski trg 16, 11000, Belgrade, Serbia; 3Institute of Entomology, Academy of Sciences of the Czech Republic, Branišovská 31, 37005, České Budějovice, Czech Republic; 5Laboratory of Agricultural Zoology and Entomology, Agricultural University of Athens, 75 Iera Odos str., 11855, Athens, Attica, Greece Abstract: A regional and landscape scale survey of the complex tritrophic associations (parasitoid-aphid-plant) of aphid parasitoids (Hymenoptera: Braconidae: Aphidiinae) was carried out in order to evaluate the importance of non-crop reservoirs in the maintenance of the coenotic stability within the agroecosystem-dominated landscapes in southeastern Europe. Five parasitoid species, Aphidius ervi Haliday, Aphidius colemani Viereck, Praon volucre Haliday, Lysiphlebus fabarum (Marshall), Lysiphlebus testaceipes (Cresson) and their main host aphid-plant associations were selected as representative examples from the total of 118 aphid parasitoid species known in southeastern Europe so far. The samples of aphids originated from non-crop and crop plants, and it was found that at least 80 host aphid taxa support the persistence of the five selected parasitoids in the region. Key words: reservoirs, aphids, aphid parasitoids, southeastern Europe, landscape scale Introduction Biocorridors represent an important feature of cultivated landscapes, with a profound impact on the biological control of native and exotic pest aphids. The concept of corridors (Forman & Gordon, 1986; Altieri & Nicholls, 1999), or biocorridors (Michal, 1994; Petr & Dlouhy 1992; Starý & Pike, 1999) in various landscape classifications pertains to the whole participating flora and fauna. It is desirable to have the possibility of an easy and explicit determination of the coenotic relationships both within a biocorridor and between it and the adjacent ecosystems (in our case the agroecosystems). In this respect, aphid parasitoids represent a useful model group. The aim was to explore the patterns of trophic associations in various types of habitats at regional and landscape scales. Material and methods Samples from various host plants supplying aphid colonies were collected. Plant specimens were pressed, herbarized, and identified. A few live aphids were killed and preserved in 70% ethanol for identification. The sampled aphid colonies were maintained in the laboratory until parasitoid emergence (Kavallieratos et al., 2001; Trdan, 2002).
53

Results and discussion The collected aphid samples originated from 127 non-crop plants and 70 crop plants. A total of 80 aphid host taxa were identified in this survey with 72.5% of all the parasitoid-aphid interactions being entirely (50%) or partially (22.5%) associated with non-crop habitats. Furthermore, we present some trophic relationships among five key aphid parasitoid species in the most common agroecosystems of southeastern Europe and non-pest aphid hosts.
Here we analyse some characteristic associations based on selected plant species: Rubus ulmifolius – Aphis ruborum: A. colemani, L. fabarum and L. testaceipes. The plant
grows in moist places, wastelands, banks of irrigation channels and rivers, all over the area near crops, often becoming an important weed. However, its rather positive but doubtlessly overlooked significance can be shown by the aphid-parasitoid associations. The aphid is specific to Rubus, often reaching high populations, which are heavily parasitized by A. colemani, L. testaceipes and L. fabarum; subsequently, they migrate to crops and contribute to a higher parasitization of pest aphids (Kavallieratos et al., 2002).
Ballota nigra – Aphis balloticola Szelegiewicz: L. fabarum. The plant is a very common weed in northern lowlands, near roads, crop edges and irrigation channels. The host aphid, A. balloticola, is an economically indifferent species which has no trophic connection with nearby crops. However, A. balloticola is very often heavily parasitized by L. fabarum, which is an important parasitoid of many pest aphids in different crops (Tomanović & Brajković, 2001; Kavallieratos et al., 2004).
Sonchus oleraceus – H. lactucae: P. volucre. This plant is a common weed in both the Mediterranean and northern lowland areas of southeastern Europe. H. lactucae has no trophic connection with crop plants, but it is heavily parasitized by P. volucre, an important parasitoid of pest aphids (Kavallieratos et al. 2003, 2004, 2005a, b). Acknowledgements The research was supported by the grants 405 (State Scholarships foundation of the Hellenic Republic), 143006B (The Ministry of Science and Environmental Protection of the Republic of Serbia), S5007102 (Grant Agency, Academy of Sciences of the Czech Republic) and Z50070508 (Academy of Sciences of the Czech Republic). References Altieri, M.A. & Nicholls, C.I. 1999: Biodiversity, ecosystem function, and insect pest
management in agricultural systems. In: Biodiversity in Agroecosystems, eds. Collins and Qualset: 69-84.
Forman, R.T. & Gordon, M. 1986: Landscape ecology. Wiley J., USA. Kavallieratos, N.G., Lykouressis, D.P., Sarlis, G.P., Stathas, G.J., Sanchis Segovia, A. &
Athanassiou, C.G. 2001: The Aphidiinae (Hymenoptera: Ichneumonoidea: Braconidae) of Greece. Phytoparasitica 29: 306-340.
Kavallieratos, N.G., Stathas, G.J., Athanassiou, C.G. & Papadoulis, G.T. 2002: Dittrichia viscosa and Rubus ulmifolius as reservoirs of aphid parasitoids (Hymenoptera: Braconidae: Aphidiinae) and the role of certain coccinellid species. Phytoparasitica 30: 231-242.
Kavallieratos, N.G., Athanassiou, C.G. & Tomanović, Ž. 2003: A new species and a key to Greek Praon Haliday (Hymenoptera: Braconidae: Aphidiinae). Dtsch. Entomol. Z. 50: 13-22.
54

Kavallieratos, N.G., Tomanović, Ž., Starý, P., Athanassiou, C.G., Sarlis, G.P., Petrović, O., Niketić, M. & Anagnou Veroniki, M. 2004: A survey of aphid parasitoids (Hymenoptera: Braconidae: Aphidiinae) of southeastern Europe and their aphid - plant associations. Appl. Entomol. Zool. 39: 527-563.
Kavallieratos, N.G., Tomanović, Ž., Athanassiou, C.G., Starý, P., Žikić, V., Sarlis, G.P. & Fasseas, C. 2005a: Aphid parasitoids infesting cotton, citrus, tobacco, and cereal crops in southeastern Europe: aphid-plant associations and keys. Can. Entomol. 137: 516-531.
Kavallieratos, N.G., Tomanović, Ž., Starý, P., Athanassiou, C.G., Fasseas, C, Petrović, O., Stanisavljević, L. & Anagnou Veroniki, M.: 2005b: Praon Haliday (Hymenoptera: Braconidae: Aphidiinae) of Southeastern Europe: key, host range and phylogenetic relationship. Zool. Anz. 243: 181-209.
Míchal, I. 1994: Ecological stability. Veronica Publishing House and Ministry of Environment of the Czech republic.
Petr, J. & Dlouhý, J. 1992: Ecological agriculture. Pubishing House Brázda, Czech Republic. Starý, P. & Pike, K.S. 1999: Uses of beneficial insect diversity in agroecosystem
management. In: Biodiversity in agroecosystems, eds. Collins and Qualset: 49-67. Tomanović, Ž. & Brajković, M. 2001: Aphid parasitoids (Hymenoptera: Aphidiidae) of
agroecosystems of the south part of the Pannonian area. Arch. Biol. Sci. Belgrade 53: 57-64.
Trdan, S. 2002: Evaluation of morphological and genetic variability of populations of economically important thrip species (Thysanoptera) in Slovenia. University of Ljubljana, Slovenia, Doctoral Dissertation.
55

Landscape Management for Functional Biodiversity IOBC wprs Bulletin Vol. 34, 2008
pp. 57-60
Biodiversity of spiders appearing on nettle (Urtica dioica L.) in natural stands Hanna Legutowska1, Magdalena Sitko2
1Department of Applied Entomology, Warsaw University of life Science SGGW, Nowoursynowska 159, 02-787 Warsaw; 2Bio-Cronos, Nowoursynowska 159, 02-787 Warsaw, Poland Abstract: The investigations on spiders occupying nettle (Urtica dioica L.) were carried out in two natural stands characterized by different environmental traits in north-eastern part of Poland. Using the sweep net method the presence of spider fauna on nettle was analyzed. There were differences in the number and species composition. The structure of spider domination was also determined. Key words: stinging nettle, Urtica dioica, herb, spider fauna, useful fauna Introduction Nettle (Urtica dioica L.) is a commonly growing plant of great importance in medicine as well as in pharmaceutical and cosmetic industry. Ecological farms have great expectations connected with nettle because it is a reservoir of beneficial organisms. Among natural enemies occupying nettle there are: predatory mites, hymenopteran, flies and zoophagic bugs.
The aim of the investigation was studying the spider fauna occupying nettle and determining the differences in species composition between stands.
Materials and methods The investigations on species composition occupying nettle were carried out in the north-eastern part of Poland, in Jezierzysk, Czarna Białostocka district. That region belongs to the Natural Scenic Area of Knyszyńska Forest in 2005. Observations were carried out at two stands of nettle with different environmental traits. Stand I was in aldar-willow woods. Stand II was a roadside ditch along quite busy public road, that place was overgrown also by other plant species.
Material for the investigations was collected every 14-16 days from 30th April to 28th September 2005. Spiders were collected with the help of entomological sweep net.
Fauna analysis Structure of domination, relative number, density and presence of spiders were determined. The structure of dominance was determined on the basis of classes.
D5 – eudominant (over 10% of specimens in the stand) D4 – dominant (from 5.1 to 10% of specimens in the stand) D3 – subdominant (from 2.1 to 5% of specimens in the stand) D2 – recedent (from 1.1 to 2% of specimens in the stand) D1 – subrecedent (less than 1% of specimens in the stand)
57

Results In the stand I 158 spiders were collected (Table 1). The domineering species was In Gongylidium rufipes. A large number of specimens was also characteristic for Linyphia triangularis.
Table 1. The appearance of Araneae on nettle, stand I, [number].
Dates of observations Araneae 30.04 13.05 26.05 12.06 26.06 10.07 23.07 05.08 18.08 05.09 18.09 28.09 Total %
Aculepeira ceropegia - - - - - 1 - - - - - - 1 0,6 Anyphaena accentuata - 1 - - - - - 5 - - - - 6 3,8 Araneidae - - 1 1 1 - - 1 - - - - 4 2,5 Araneus diadematus - - - - - 1 - - 1 - - - 2 1,3 Araniella opisthographa - - - - 1♀ - - - - - - - 1 0,6 Araniella sp. 1 - - 1 - - 1 2 1 - - 1 7 4,4 Centromerus sylvaticus - - - - - - - - - - 1 - 1 0,6 Clubiona sp. - - - - - - - 1 - - - 1 0,6 Cyclosa conica - - - 1♀ - - - - - - - - 1 0,6 Dictyna pusilla - - 1♂ - - - - - - - - - 1 0,6 Dictyna sp. - - 1 - - - - - - - - - 1 0,6 Enoplognatha ovata - - 1♀,2 - - - - - - - - - 3 1,9 Enoplognatha sp - - 1 - - 1 - - - - 3 - 5 3,2 Erigone atra - - - 1♀ - 1♂ - - - - - - 2 1,3 Gongylidium rufipes - 2♀,2♂ 2♀ - - - - 16 - 25 2 7 56 35,4 Lacinius ephippiatus - - - - - - - - - 1♀ 1♂ - 2 1,3 Linyphia triangularis - - - - - 5 2♀,1♂,2 1♀ 2♀,1 - - - 14 8,9 Linyphiidae - - - - - - - 1 - - - - 1 0,6 Mangora acalypha - - - 1♀ - - - - - 1 - - 2 1,3 Meta mengei - 1♀ - - - - - - - - - - 1 0,6 Meta sp. - 1 - - - - - - - - - - 1 0,6 Misumena vatia - 1♀ - - - - - 2 - - - - 3 1,9 Neriene clathrata - 1 - - - - - - - - - - 1 0,6 Neriene peltata - - 1♂ - - - - - - - - - 1 0,6 Neottiura bimaculata - - 1 - - - - - - - - - 1 0,6 Ozyptila sp. - - 1 - - - - - - - - - 1 0,6 Pachygnatha sp. - - - - - 1 1 1 - - - - 3 1,9 Philodromus sp. - - - - - - 2 2 - - - - 4 2,5 Porrhomma oblitum - - - 1♀ - - - - - - - - 1 0,6 Rilaena triangularis - - 1♀ - - - - - - - - - 1 0,6 Tetragnatha montana - - 1 1♀ - - - - - 2 - - 4 2,5 Tetragnatha pinicola - - - - - - - 1 - - - - 1 0,6 Tetragnatha sp. - 1 3 - - - - 1 - 2 - 2 9 5,7 Theridion sp. - - - 1 - - - 3 1 - 1 1 7 4,4 Trematocephalus cristatus - - 1♂,2♀ - - - - - - - - - 3 1,9
Xysticus sp. - - - 1 - 2 - - - 2 - - 5 3,2 Total 1 10 20 9 2 12 9 37 6 33 8 11 158 100
♀ – female; ♂ – male; np. 1, 3 – number of young individuals
Structure of dominance of Araneae in stand I D5 – eudominant: Gongylidium rufipes, D4 – dominant: Linyphia triangularis, Tetragnatha sp.,
58

D3 – subdominant: Anyphaena accentuata, Araneidae, Araniella sp., Philodromus sp., Tetragnatha montana, Enoplognatha sp., Theridion sp., Xysticus sp.,
D2 – recedent: Araneus diadematus, Enoplognatha ovata, Erigone atra, Lacinius ephippiatus, Mangora acalypha, Misumena vatia, Pachygnatha sp., Trematocephalus cristatus,
D1 – subrecedent: Aculepeira ceropegia, Araniella opisthographa, Centromerus sylvaticus, Clubiona sp., Cyclosa conica, Dictyna pusilla, Dictyna sp., Linyphiidae, Meta mengei, Meta sp., Neottiura bimaculata, Neriene clathrata, Neriene peltata, Ozyptila sp., Porrhomma oblitum, Rilaena triangularis, Tetragnatha pinicola.
Table 2. The appearance of Araneae on nettle, stand II, [number].
Dates of observations
Araneae
30.0
4
14.0
5
27.0
5
13.0
6
25.0
6
09.0
7
23.0
7
05.0
8
20.0
8
07.0
9
18.0
9
28.0
9
Tot
al
%
Aculepeira ceropegia - - - - - - - 2 1 1 - 1 5 8,6
Araniella cucurbitina - - - - 1♀1♂ - - - - - - - 2 3,4
Araniella sp. - - 1 - 1 - 2 1 3 1 2 - 11 19,0 Clubiona sp. - - - - - - - 1 - - - - 1 1,7 Dictyna uncinata - - 1♀ - - - - - - - - - 1 1,7 Enoplognatha sp. - - - - 1 - - 1 - - 3 - 5 8,6 Erigone atra - - - - 1♀ - - - - - - - 1 1,7 Erigone dentipalpis - - 1♂ - - - - - - - - - 1 1,7 Linyphia triangularis - - - - - - - - - - 2♀ - 2 3,4 Linyphiidae - - - - - - - - - - 4 - 4 6,9 Meta mengei - 1 - - - - - - - - - - 1 1,7 Meta sp. - - - - - - - - - - 1 - 1 1,7 Neottiura bimaculata - 1 - - - - - - - - - - 1 1,7 Pachygnatha sp. - - - - - - - - 2 - - - 2 3,4 Philodromus sp - - - - - - - 1 1 1 - - 3 5,2 Theridion impressum - - - - - - - - - - 1♂ - 1 1,7 Theridion sp. - - - - - - - 6 2 4 - 12 20,7 Xysticus sp - - - - 1 - 1 - 1 - 1 - 4 6,9 Total - 2 3 - 6 - 3 6 14 5 18 1 58 100
♀ – female; ♂ – male; np. 1, 3 – number of young individuals
Using the sweep net 58 spiders were caught in stand II (Table 2). The most numerous were Theridion sp. – 12 Araniella sp. – 11 spiders. A few spiders from the Linyphiidae family, the genus Enoplognatha sp., Xysticus sp. and species Aculepeira ceropegia.
Structure of dominance of Araneae in stand II D5 – eudominant: Araniella sp., Theridion sp.,
59

D4 – dominant: Aculepeira ceropegia, Linyphiidae, Enoplognatha sp., Philodromus sp., D3 – subdominant: Araniella cucurbitina, Linyphia triangularis, D2 – recedent: Clubiona sp., Dictyna uncinata, Erigone atra, Erigone dentipalpis,
Meta mengei, Meta sp., Neottiura bimaculata. Discussion Area I proved to be more abounding in species – 37 different species were caught. Among the collected individuals the domineering species was Gongylidium rufipes, it was eudominant. This species occurs in large numbers on river banks, in humid woods and brushwoods, such as those observed in stand I. In the woods, near Białystok, where Sielicki & Staręga (1996) carried out their investigations, Araneae were dominant. They also noted Enoplognatha latimana for the first time in that area. The presence of that species was confirmed in our own investigations both in stand I and II. Other species, which were noted (and which had already been observed in the investigations by Sielicki & Staręga, 1996), are: Enoplognatha ovata, Centromerus sylvaticus, Erigone dentipalpis, Linyphia triangularis and Cyclosa conica. In the case of marshy meadow of Antoniuk Reservation in the Białystok region, the species Gongylidium rufipes was influent (2.8%). Species, which were observed in that Reservation and in the investigated stand, were: Enoplognatha ovata, Erigone atra, Linyphia triangularis, Neriene clathrata, Neriene montana, Neriene peltata, Trematocephalus cristatus, Meta mengei, Tetragnatha montana, T. pinicola, Araneus diadematus, Araniella cucurbitina, Cyclosa conica, Mangora acalypha, Dictyna uncinata, Anyphaena accentuate and Clubiona lutescens. Out of the above mentioned Araneae a bigger number of collected individuals represented only Linyphia triangularis species, the remaining ones were more numerous in the area of Antoniuk Reservation (Chyży & Staręga, 1997). The species Porrhomma oblitum was for the first time observed in Poland in the area of the Poleski National Park (Rozwałka 1996). In our samples there was only one individual of that species. In the Jelonki Reservation which is situated near Białystok, there were 11 species, which were also observed in both the investigated stands (Staręga & Szymonowicz, 1999). Acknowledgements We would like to express our gratitude to the Department of Scientific Research in the Ministry of Science and Higher Education for allowing us performing the investigation within our own research project: PB 1003/P01/2006/30.
We would like to thank for the determination of Araneae to dr Maria Oleszczuk from the Research Station of Experimental Unit of Agricultural and Forestry Environment Polish Academy of Sciences in Turew. References Chyży, I. & Staręga, W. 1997: Pająki (Araneae) rezerwatu Antoniuk. Białowieża. Parki
Narodowe i Rezerwaty Przyrody 16 (1): 27-39. Rozwałka, R. 1996: Materiały do znajomości pająków Poleskiego Parku Narodowego i jego
okolic. Parki Narodowe i Rezerwaty Przyrody. Białowieża 15 (2): 63-73. Sielicki, M. & Staręga, W. 1996: Pająki (Araneae) ekotonu ols-łąka w okolicach
Białegostoku. Fragmenta Faunistica. Warszawa 39 (13): 169-177. Staręga, W. & Szymonowicz, B. 1999: Pająki (Araneae) rezerwatu Jelonka i jego otoczenia.
Parki Narodowe i Rezerwaty Przyrody. Białowieża 18 (2): 81-90.
60

Landscape Management for Functional Biodiversity IOBC wprs Bulletin Vol. 34, 2008
pp. 61-64
The 'Cake on the plate' syndrome ... and how specialist tansy aphids avoid extinction by hungry predators and parasitoids: insights from the use of polymorphic microsatellite markers Hugh D. Loxdale1,2, Franklin Nyabuga1,2, Wolfgang W. Weisser1
1 Institute of Ecology, Friedrich Schiller University, Dornburger Strasse 159, D–07743 Jena, Germany; 2 Department of Entomology, Max Planck Institute for Chemical Ecology, Hans-Knoell-Strasse 8, D-07745 Jena, Germany. E–mail:[email protected]; [email protected]
Key words: aphids, primary hymenopterous parasitoids, population, ecology, movement, microsatellites, molecular markers
It was initially shown from 12.2 m high suction trap aerial density data and later confirmed using polymorphic molecular markers (initially allozymes, later high resolution DNA markers, especially microsatellites), that different species of aphids (Hemiptera: Aphididae) have different migratory urges and abilities. Such population genetic differences are manifested in the different patterns obtained for different species: thus highly migratory species (e.g. the grain aphid, Sitobion avenae F.) display similar allele frequencies patterns over large geographical distances, apparently intermediate migrants (e.g. blackberry-grain aphid, S. fragariae (Walker) and damson-hop aphid, Phorodon humuli (Schrank)) show much more local heterogeneity, whilst relatively very ‘immobile’ species like specialist tansy aphids (i.e. Macrosiphoniella tanacetaria (Kaltenbach) and Metopeurum fuscoviride Stroyan), which have a metapopulation structure, show highly heterogeneous patterns, even at small spatial scales (see Loxdale & Lushai, 2007 for a review and Massonnet, 2002). If it is indeed true that different aphid species do have different levels of ‘migratoriness’ manifested as migratory range or ambit, then this may well impact on the ecology and population genetics of the predators, wasp parasitoids and pathogens that attack them.
That different aphids migrate differentially is also no doubt related to the abundance and distribution of their host plant/s (e.g. Cammel et al., 1989) and hence the ease with which the insects not only reproduce but also find new plants when undergoing inter-host migrations during the spring, summer and autumn. The latter often involves in holocyclic species (i.e. with annual sexual phase in which a cold hardy overwintering egg is produced), winged pre-sexual or sexual forms and sometimes, host alternation between a herbaceous spring-summer host and a primary woody host (Dixon, 1998). It is calculated that in the case of the bird cherry-oat aphid, Rhopalosiphum padi (L.), only about 0.6% of returning autumn winged migrants find the primary overwintering host bird cherry, Prunus padus, and hence can mate and thereby successfully overwinter to produce the next generations (Ward et al., 1998). Below the boundary level of still air, aphids home in on their hosts using visual and olfactory cues (Dixon, 1998; Irwin et al., 2007). Sexual females have been reported to use pheromones to attract the migrating autumn males (e.g. Pope et al., 2007). The wasp parasitoids (Hymenoptera: Braconidae: Aphidiidae) also use both host plant and aphid cues to find their hosts (Godfray, 1994), and presumably must therefore, where host alternating aphids are concerned, change their behaviour from actively searching on a secondary host/s
61

for suitable prey to searching a primary one.
With aphids like S. avenae which breed in countless billions on commercially-grown cereals as well as wild grasses, host abundance is hardly an issue and large numbers of the aphids leave their hosts as these senesce and become unsuitable and look for pastures new. It is perhaps not surprising then that the aphid is highly abundant and highly mobile, as inferred from both suction trap and population genetic data (Loxdale & Lushai, 2007). Such a scenario leading essentially to distribution over a wide geographical area* may also be common amongst other pest aphids e.g. cabbage aphid, Brevicoryne brassicae (L.), and non-pest species e.g. sycamore aphids, Drepanosiphum platanoidis Schrank, which have similarly abundant and widespread hosts. However, in the case of aphid species which have rare or widespread plant hosts, then the host itself acts as a kind of ‘island’, highly likely because of the difficulty winged aphids have in finding it/them, to bring about the elimination of rarer alleles and genotypes in the sample population by a process of drift, involving founder effects and bottlenecking (Loxdale & Brookes, 1988). Such a scenario must surely also impact on the population structure and ecology of the primary wasp parasitoids attacking these aphids.
Another factor is that even if a plant is apparently common and widespread, it may have locally adapted or host adapted aphid genotypes feeding upon it (Loxdale & Lushai, 2007), which may lead to population differentiation and substructuring, e.g. Ruiz-Montoya et al. (2003) in the case of B. brassicae. These adapted populations could in turn, because the emerging wasp uses the mummy case to determine the natal source of its host aphid and hence its host plant (Douloumpaka & van Emden, 2003), reinforce specialization, which may also lead to parasitoid population substructuring and speciation.
Tansy (Tanacetum vulgare L.), a member of the family Asteraceae with bright yellow flowers, is a widely distributed plant which grows in poor, well-drained soils in many parts of Europe, including along the Saale river valley in Jena, Germany. Individual plants, which are perennial, comprise numerous shoots/ramets (usually <50), supposedly ‘genetically identical’. Both M. Tanacetaria and M. fuscoviride, as earlier mentioned, form metapopulations on tansy, which includes a colonisation phase, beginning in early May and peaking in June, and an extinction phase peaking in July (Massonnet et al., 2002; Massonnet & Weisser, 2004). The former aphid species is not ant attended whereas the latter species is (Massonnet, 2002).
Because of such population structure and dynamics, including the fact that both aphids species are probably not very migratory (Massonnet et al., 2002; present study), individual aphid colonies are particularly subject to the attacks of predators (coccinelids, syrphid larvae, lacewing larvae, etc), as well as primary wasp parasitoids, and that when so attacked and destroyed (resulting in the extinction phase of the local colony if sub-colonies on all the ramets of a given plant are eliminated), plants are not readily re-colonised from adjacent or nearby plants (Nyabuga, unpublished observations). This we have termed the ‘cake on the plate’ syndrome; in effect, if there are enough predators and parasitoids available, the entire colony is extirpated without replacement and there is no ‘balance of nature’ as such. Rather, the attackers have to find new colonies to attack, which are perhaps widely dispersed and not that easy to locate, although probably the strong smell of tansy (terpenes and terpenoids) aids * Although the incidence of sexual reproduction may be influenced, and hence be more common, in colder climes so that latitudinally-based clines of asexual-sexual genotypes are found in some species such as S. avenae, e.g. Llewellyn et al. (2003).
62

such host plant/host seeking. At the same time, the primary parasitoid of M. fuscoviride, Lysiphlebus hirtocornis Mackeaur, has not only evolved chemical camouflage to avoid detection by guard ants (Liepert, 1996; see also Völkl & Mackauer, 2000), but appears to be very efficient at attacking all the available aphids in a colony and can cause 100% mortality (Weisser, 2000; Nyabuga unpublished).
Thus it is only the strange metapopulation biology of the aphids of tansy that allows them to survive the onslaught of a plethora of predators, parasitoids and pathogens and in effect, ‘live to fight another day’. We discuss this biology in the light of the aphid molecular ecological data obtained so far and suggest how the biology of the aphid host may impact on that of their parasitoids and how this knowledge can possibly assist in biological control programs to combat aphid pests. We also discuss some preliminary molecular data on the parasitoids themselves (L. hirticornis) and what this suggests about their own ecology and genetics. References Cammell, M.E., Tatchell, G.M. & Woiwod, I.P. 1989: Spatial pattern of abundance of the
black bean aphid, Aphis fabae, in Britain. J. Appl. Ecol. 26: 463-472. Dixon, A.F.G. 1998: Aphid Ecology (2nd edn.), Chapman & Hall, London, U.K., 300 pp. Douloumpaka, S. & Van Emden, H.F. 2003: A maternal influence on the conditioning to
plant cues of Aphidius colemani Viereck, parasitizing the aphid Myzus persicae Sulzer Physiol. Ent. 28: 108-113.
Godfray, H.C.J. 1994: Parasitoids: Behavioural and Evolutionary Ecology. Princeton University Press, Princeton, New Jersey: 30-38.
Irwin, M.E., Kampmeier, G.E. & Weissser, W.W. 2007: Aphid movement: process and consequences. In: Aphids as Crop Pests, eds. van Emden and Harrington. CABI, Wallingford, Oxford, U.K: 153-186.
Liepert, C. 1996: Chemische Mimikry bei Blattlausparasitoiden der Gattung Lysiphlebus (Homoptera: Aphidiidae). PhD. Thesis. University of Bayreuth.
Llewellyn, K.S., Loxdale, H.D., Harrington, R., Brookes, C.P., Clark, S.J. & Sunnucks, P. 2003: Migration and genetic structure of the grain aphid (Sitobion avenae) in Britain related to climate and clonal fluctuation as revealed using microsatellites. Mol. Ecol. 12: 21-34.
Loxdale, H.D. & Brookes, C.P. 1988: Electrophoretic study of enzymes from cereal aphid populations. V. Spatial and temporal genetic similarity between holocyclic populations of the bird-cherry oat aphid Rhopalosiphum padi (L.) (Hemiptera: Aphididae) in Britain. Bull. Ent. Res. 78: 241-249.
Loxdale, H.D. & Lushai, G. 2007: Population genetic issues: the unfolding story revealed using molecular markers. In: Aphids as Crop Pests, eds. van Emden and Harrington. CABI, Wallingford, Oxford, U.K: 31-67.
Massonnet, B. 2002: Metapopulation structure and population genetics of monophagous aphids on tansy (Tanacetum vulgare L.), PhD thesis, University of Basel.
Massonnet, B., Simon, J.-C. & Weisser, W.W. 2002: Metapopulation structure of the specialised herbivore Macrosiphoniella tanacetaria (Homoptera, Aphididae). Mol. Ecol. 11: 2511-2521.
Massonnet, B. & Weisser, W.W. 2004: Patterns of genetic differentiation between populations of the specialised herbivore Macrosiphoniella tanacetaria (Homoptera: Aphididae). Heredity 93: 577-584.
63
Pope, T.W., Campbell, C.A.M., Hardie, J., Pickett, J.A. & Wadhams, L.J. 2007: Interactions between host-plant volatiles and the sex pheromones of the bird cherry-oat aphid, Rhopalosiphum padi and the damson-hop aphid, Phorodon humuli. J. Chem. Ecol. 33: 157-165.
Ruiz-Montoya, L., Nunez-Farfan, J. & Vargas, J. 2003: Host-associated genetic structure of Mexican populations of the cabbage aphid Brevicoryne brassicae L. (Homoptera : Aphididae). Heredity 91: 415-421.
Völkl, W. & Mackauer, M. 2000: The oviposition behaviour of aphidiine wasps (Hymenoptera: Braconidae, Aphidiinae): morphological adaptations and evolutionary traits. Can. Ent. 132: 197-212.
Ward, S.A., Leather, S.R., Pickup, J. & Harrington, R. 1998: Mortality during dispersal and the cost of host specificity in parasites: how many aphids find hosts? J. Anim. Ecol. 67: 763-773.
Weisser, W.W. 2000: Metapopulation dynamics in an aphid-parasitoid system. Entomol. Exp. Appl. 97: 83-92.
64

Landscape Management for Functional Biodiversity IOBC wprs Bulletin Vol. 34, 2008
pp. 65-68
Determinants for implementing different types of conservation measures in intensive arable regions Juliane Mante*, Bärbel Gerowitt Institute for Land Use – Crop Health, University of Rostock, Satower Straße 48, D-18051 Rostock, Germany; *Current address: Institute for Rural Development Research, Zeppelinallee 31, D-60325 Frankfurt am Main, Germany, [email protected] Abstract: In intensive arable regions problems for conservation arise from the favourable conditions for agriculture, while the implementation level of conservation measures by farmers is low. A survey among 865 responding farmers in intensive arable regions in Germany was carried out in 2006 to investigate, whether different conservation measures have different determining factors for their implementation. The data were analysed by logistic regression. The results show that measures implemented on a wider area of the farm and those implemented as field strips have different determining factors for their implementation. Arable measures implemented on a broad area of the farm seem to be more challenging and risky measures in intensive arable regions. They require more effort from the subsidising institution. Field strips as the less complex measures require a lower effort to develop suitable schemes and extension strategies to increase their adoption rate. Key words: intensive arable regions, conservation measures, determinants, Germany Introduction In intensive arable regions problems for conservation arise from the favourable conditions for agriculture. In these areas, conservation measures are scarcely implemented by the farmers, especially those which radically interfere with usual farm management (Pannell et al., 2006).
In previous acceptance studies a focus on intensive arable areas is missing. It is further of interest, whether different types of conservation measures have different determinants for their implementation. Arable measures implemented on a wider area of the farm can be expected to have other determinants at farm level than field strips. To answer these questions a survey was carried out among farmers in intensive arable regions in Germany. Data and methods Regions The regions were chosen based on their high soil quality, represented by a high average yield index (Mante & Gerowitt, 2008). The following regions were included in the survey: the rural districts Hildesheim and Northeim in the federal state Lower Saxony, Heinsberg and Viersen in North Rhine-Westphalia as well as Weißenfels and Burgenland in Saxony-Anhalt. The average yield indexes of these districts are 61-81 per hectare, representing a high soil quality. The main crops are winter wheat, winter barley, winter oilseed rape and sugar beet. The questionnaire A total number of 4720 questionnaires were sent to the farmers in these regions in winter 2006. The questionnaire consisted of five main parts (Mante & Gerowitt, 2008). The participation in different types of conservation measures was enquired. Furthermore data on
65

the following thematic fields were collected: a) farm structural and farm economic features, b) socio-economic characteristics of the farm manager, c) attitudes and personality features of the farm manager, d) design of the measures in the various federal states, c) extension strategies and d) social and structural context of the farm (Mante & Gerowitt, 2008). Analysis Three logistic regressions were carried out to analyse the determining factors for an implementation of conservation measures. The dependent dichotomous variable was the implementation or non-implementation of the specific measure. Potential multicollinearities between the independent variables were prevented by undertaking a foregoing analysis of correlation and eliminating one variable of a correlative variable pair based on the criterion of the best significance of the model. The combination of these significant variables was identified that proved the best significance of the model and could explain most variability. The non-significant variables were excluded from the equation. Results and Discussion Overall, the survey response rate was 20.2 %, differing among the federal states (Mante & Gerowitt, 2008). 29.4% of the farmers in the total sample had implemented conservation measures, of which 14% had implemented field strips, 65% other arable measures implemented on a larger area of the farm and 21% grassland measures. The implemented field strips were succession strips, sown flowering or grass strips and extensified strips cultivated like the rest of the field with restrictions in herbicide and fertiliser application. Arable measures implemented on a broader area of the farm refer to mulch seeding/ no till methods, crop rotation diversification, restrictions of herbicide and fertiliser use, organic agriculture, set-aside and environmentally friendly application technologies.
Table 1 shows the results of the logistic regression analyses. The Exp(b) in Table 1 represents the ratio of probability (or Odds ratio) for an adoption of conservation measures at constancy of all other variables, if the respective independent variable increases by one unit. It is calculated from the logit coefficients by using the exponential function.
Concerning the farm structural and economic features there are only similarities between the different measure types for the variable dairy husbandry (dairy). The probability of an implementation of field strips and arable measures decreases (i.e. is <1), if the farm is a dairy farm. This is probably due to a restricted arable fodder or grassland area of these farms, which conflicts with a lower crop yield due to low-input management (Mante & Gerowitt, 2008).
A high soil quality has a negative impact on the implementation of field strips. The influence of the soil quality on the implementation of conservation measures is described e.g. by Dupraz et al. (2003). However, this impact could not be proven for arable measures. The share of farmers in the sample implementing mulch seeding methods, was high (45%). These measures are predominantly introduced by the farmers for rationalisation and cost-saving reasons independent from the soil quality of the farm (e.g. Pannell et al., 2006). Whether a farm is managed as a part time or a full time farm (time) is only relevant for arable measures, but with a very strong weight. This influence was also investigated in other studies (Lambert et al., 2007). The reason could be that arable measures require a more specific professional knowledge than less challenging field strips. This professional knowledge is probably more common among full time farmers.
The management of the farm as a mixed farm (mix) is the most relevant factor for an implementation of field strips. This could possibly be explained by an inherent management concept of mixed farms based on a low level of specialisation and intensification, which more easily provides niches for small-scaled, often unproductive nature conservation areas as field strips. With an increasing farm income (inc) the probability of an implementation of field strips also increases, while an implementation of arable measures is not significantly affected.
66

Table 1. Factors influencing the implementation of field strips and nature conservation measures on arable land and on grassland, calculated by logistic regression. Field of impact
Variable Meaning Arable measures (n=433), Exp(B)
Field strips (n=236), Exp(B)
Time 0=part-time farming, 1=full-time farming 3.325*** Dairy Dairy husbandry (0=no; 1=yes) 0.442** 0.062** Mix Farm is managed as a mixed farm (0=no; 1=yes) 5.450** Ind Average valuation index of field (soil quality) 0.957*
Farm
stru
ctur
al/
farm
eco
nom
ic
feat
ures
Inc Amount of average farm income in 1000 € (0=<10; 1=10-30; 2=31-50; 3=51-70; 4=71-100; 5=101-200; 6= >200)
1.882**
Age Age of the farm manager (0=20-40; 1=41-60; 2= >60 years) 0.639*
Soci
oeco
nom
ic
feat
ures
Educ Agricultural education level (0=Non; 1=Basic; 2=Technician; 3=University/ Technical College; 4=PhD)
1.389** 2.331*
Open Low input measures must not interfere with the usual farm management (Don’t agree at all =1 up to Agree absolutely =5)
0.600***
Risk Low input measures are an interesting and important challenge for the farm manager. (Don’t agree at all =1 up to Agree absolutely =5)
1.325**
Atti
tude
s and
pe
rson
ality
feat
ures
Int The conservation of biodiversity is an important concern for the farm manager. (Don’t agree at all =1 up to Agree absolutely =5)
2.233*
Mea
sure
/ pr
ogra
m
desi
gn NRW Farm is situated in the Federal state North Rhine-Westfalia 0.491**
Exte
nsio
n st
rate
gies
Rel Relation with subsidising institution (1=very bad up to 6=very good)
1.332*
Constant 0.122* 0.000** Hosmer-Lemeshow-Test Chi2=6.0;
df=8; Sig.=0.64
Chi2=9.2; df=8; Sig.=0.33
Nagelkerke R² 0.25 0.40 *: P<0.05; **: P<0.01; ***: P<0.001 More similarities in the influencing factors occur for the socioeconomic features of the farmer. The adoption of both kinds of measures becomes more likely if the farmer has a high agricultural education level (educ), what is in line with previous studies (Schmitzberger et al., 2005). The age of the farmer (age) negatively affects only arable measures on a wider area of the farm. Presumably these measures often require major modifications of whole farm management than field strips. Such innovations are more easily accepted by younger farmers (Schmitzberger et al., 2005).
Concerning the attitudes and personality features of the farmer arable measures and field strips have totally different adoption patterns. Farmers with an interest in enhancing or preserving the biodiversity on their farm (int) are more likely to implement field strips. In the contrary for adopting arable measures the openness of the farmer towards new and unusual production methods (open) and their willingness to carry a risk (risk) are important preconditions. The lower risk associated with field strips may be the reason for the non-significance of farmers’ openness towards new production methods and willingness to carry a risk for the adoption of these measures. Furthermore, the high share of farmers in the sample
67

implementing mulch seeding methods may have caused the non-significance of the farmers’ attitudes towards preserving biodiversity for the adoption of arable measures.
Agri-environmental program design negatively influences the decision to implement arable measures in North Rhine-Westfalia (NRW). This can be explained by the fact that the offered arable measures are often restricted to certain regions which have a special value for environment or conservation and which mainly seem to be not intensively used arable regions (Mante & Gerowitt, 2008). That the measure design had no influence on the adoption of field strips was corroborated by additional survey results: the most important reasons for non-participation in field margin measures were not the unfavourable obligations, but the too high effort for paperwork and the too low subsidy level (Mante & Gerowitt, 2008).
Factors concerning the extension strategies have an impact in that a good relation of the farmers to their subsidising institution (rel) fosters the adoption of arable measures. For field strips this factors seems to be irrelevant to the farmers. The importance of a good relation to the subsidising institution for arable measures can be explained by their relatively high associated risks for the whole farm in intensive arable areas. In comparison, the implementation of field strips as relatively simple and low-risk measures can be expected to cause not such a great demand for trusted contact persons within the subsidising institution. Conclusions A clear distinction can be made between the implementation determinants in intensively used arable regions for more and less demanding and risky conservation measures. The more challenging the measures the stronger is the influence of the design and the extension of the measure. Since arable measures implemented on a wider area of the farm seem to be more challenging and risky measures in intensive arable regions, they require a higher effort for the subsidising institution. Field strips as less complex measures seem to require a lower effort to develop suitable measure designs and extension strategies to increase their adoption rate. Acknowledgements The authors thank the Deutsche Bundesstiftung Umwelt (DBU) for funding this research through the project network "Lebensraum Börde". We also want to thank the institutions, who helped us distributing the questionnaire and the farmers for taking part in our survey. References Dupraz, P., Vermersch, D., De Frahan, B.H. & Delvaux, L. 2003: The Environmental Supply
of Farm Households: A Flexible Willingness to Accept Model. Environmental and Resource Economics 25 (2): 171-189.
Lambert, D.M., Sullivan, P., Claassen, R. & Foreman, L. 2007: Profiles of US farm households adopting conservation-compatible practices. Land Use Policy 24 (1): 72-88.
Mante, J. & Gerowitt, B. 2008: A survey of on-farm acceptance of low-input measures in intensive agriculture. Agronomy for Sustainable Development 28: 399-406.
Pannell, D.J., Marshall, G.R., Barr, N., Curtis, A., Vanclay, F. & Wilkinson, R. 2006: Understanding and promoting adoption of conservation practices by rural landholders. Australian Journal of Experimental Agriculture 46 (11): 1407-1424.
Schmitzberger, I., Wrbka, T., Steurer, B., Aschenbrenner, G., Peterseil, J. & Zechmeister, H.G. 2005: How farming styles influence biodiversity maintenance in Austrian agricultural landscapes. Agriculture, Ecosystems and Environment 108: 274-290.
68

Landscape Management for Functional Biodiversity IOBC wprs Bulletin Vol. 34, 2008
pp. 69-72
Are landscape structures important for the colonization of spinach fields by insects? Rainer Meyhöfer, Thomas Klug, Hans-Michael Poehling Institute of Plant Diseases and Plant Protection, Gottfried Wilhelm Leibniz Universität Hannover, Herrenhäuser Str. 2, D-30419 Hannover, Germany Abstract: At planting time crops are placed into a landscape mosaic. Whether crop plants are colonized by pests or not, mainly depends on the presence of source populations in off crop habitats and on insect dispersal behaviour. In the current study we evaluate the impact of different landscape elements, crop and non-crop habitats, on colonization of spinach fields by potential pest insects. Unfortunately the used modelling approaches, i.e. randomForest and multiple linear regression analysis did not show a congruent result. With randomForest models it was impossible to identify important landscape elements. In contrast multiple linear regression models point towards several crop and non-crop habitats that influenced insect abundance on the spinach fields. The specific relevance of landscape elements on insect colonisation is discussed. Key words: integrated control, landscape elements, Autographa gamma, aphids, coccinellids, randomForest, multiple linear regression Introduction Colonisation of agricultural fields by arthropods depends on various biotic and abiotic factors. Besides climatic factors and arthropod dispersal capabilities the distribution of source populations from which colonisation takes place is one of the most important parameters. Crop as well as non-crop habitats are important, since both might serve as source or sink for different arthropod species (e.g. Tscharntke et al., 2007). The impact of landscape elements on pest and natural enemy populations was already investigated in several studies. The results show for example that on leek the onion thrips, Thrips tabaci, was negatively affected by the amount of woodlot in the landscape (Den Belder et al., 2002). Moreover parasitoid activity was higher in richly structured landscapes compared to poorly structured, flowering strips as well as fallows had a positive effect on parasitation rates (reviewed by Tscharntke & Brandl, 2004), and parasitism rates of Mamestra brassicae on Brussels sprouts were positively correlated with the pasture area and negatively correlated with the horticulture area at several scales (Bianchi et al., 2005). With an increasing knowledge on the influence of landscape on colonisation of crops by insects it will be possible to adapt plant protection strategies, i.e. to identify the risk of pest incidences and/or manage landscape structures. In the current study we focus on the impact of landscape structures on colonisation of spinach by pests. We hypothesize that the abundance of insects on spinach fields is influenced by specific landscape structures in the surroundings. Material and Methods All data were collected in collaboration with contract growers in the growing seasons 2001 to 2003. The spinach fields were sown in sets from early June until August and harvested after approximately a five-week growing period. Insect population densities were estimated on 121
69

spinach fields (size ± 6 ha). 10 days before harvest insects on 200 plants per field were determined and counted. Additionally 3 pheromone traps baited with the female sex pheromone of A. gamma were placed on each field. The average number of moth caught per week was used as additional explanatory variable in the analysis.
The impact of different landscape structures on insect abundance was analysed at circular environments of 113 ha (600 m radius) and 452 ha (1200 m radius) with the spinach field in the centre. At the 113 ha environment landscape elements and crops were mapped by own inspections at time of spinach cultivation. Additionally ATKIS (Official Topographic-Cartographic Information System) based classifications were used for analysis at the 452 ha environment. At a rough level 4, at the detailed level 11, and with the original data 95 different landscape elements were included in the analysis (see Klug, 2006 for details).
Data were analysed by randomForest, i.e. an ensemble method developed for theme orientated forecasting (Breiman, 2001), and multiple linear regressions. Goodness of fit of different randomForest models was compared on basis of percent variance explained and variable importance plots. Beta-coefficients were used to interpret the relevance of the different landscape elements in multiple linear regression analysis. Analysis was done with SPSS and R-Project randomForest package. Results Impact of landscape structures on silver Y-moth, Autographa gamma, abundance Results of the randomForest analysis showed that spinach field colonisation by A. gamma was not significantly influenced by landscape structures. The highest value of explained variance, i.e. 1.88%, could be detected if A. gamma adults were considered as additional independent variable (Table 1), with cereals, adults in pheromone traps and potatoes as most important landscape elements. Similarly multiple linear regression analysis did not reveal significant results. As a general trend, streets, border strips and buildings had a positive effect on caterpillar abundance on the spinach field, while forests, pastures and farmland had a negative effect (Figure 1). Impact of landscape structures on aphid abundance Considering the number of aphid colonies on the spinach fields the statistical analysis did not allow simple conclusions. At the 113 ha environment randomForest analysis revealed that at maximum 24.26% of the variance in number of aphid colonies could be explained by Table 1. Results of randomForest analysis of impact of landscape structures on insect abundance on spinach fields. Goodness of fit was estimated on basis of mean squared residues (MSR) and percent explained variance (%VE) (see Klug (2006) for details). Radius Taxon Rough Classification
(4 elements) Detailed Classification (11 elements)
Original Data (95 landscape elements)
MSR %VE MSR %VE MSR %VE 113 ha A. gamma (+PH) 1270.73 -61.85 1340.26 -70.71 7703.36 1.88 (600 m) A. gamma(-PH) 672.33 -47.89 639.32 -40.63 615.40 -35.37 Aphid colonies 359.71 -36.45 379.27 -43.87 199.65 24.26 Coccinellids 29.82 -25.16 30.56 -28.24 27.20 -14.16 452 ha A. gamma (+PH) 1245.10 -58.59 1244.47 -58.51 140.79 -36.65 (1200 m) A. gamma(-PH) 653.49 -43.74 655.88 -44.27 657.68 -44.67 Aphid colonies 391.95 -48.68 392.74 -48.98 401.83 -52.43 Coccinellids 30.72 -28.95 30.96 -29.90 31.501 -32.18
70

-0.50
-0.25
0.00
0.25
0.50
Bet
a -C
oeff
icie
nt
agric
ultu
rebo
rder
strip
s
past
ures
gard
ens
fore
sts
sing
le b
uild
ings
deve
lope
d ar
ea
bush
es, h
edge
stra
ffic
area
lake
s, riv
ers
woo
ds
agric
ultu
rebo
rder
strip
s
past
ures
gard
ens
fore
sts
sing
le b
uild
ings
deve
lope
d ar
ea
bush
es, h
edge
stra
ffic
are
a
lake
s, riv
ers
woo
ds
agric
ultu
rebo
rder
strip
s
past
ures
gard
ens
fore
sts
sing
le b
uild
ings
deve
lope
d ar
ea
bush
es, h
edge
stra
ffic
are
a
lake
s, riv
ers
woo
ds
*
*
deta
iled
clas
sific
atio
n
cultivated areadeveloped area
forestlinear structures
-0.50
-0.25
0.00
0.25B
eta
-Coe
ffic
ient
cultivated areadeveloped area
forestlinear structures
cultivated areadeveloped area
forestlinear structures
*
roug
hcl
assi
ficat
ion
Autographa gamma aphid colonies coccinellids
112 ha (600 m)
452 ha (1200 m)
-0.50
-0.25
0.00
0.25
0.50
Bet
a -C
oeff
icie
nt
agric
ultu
rebo
rder
strip
s
past
ures
gard
ens
fore
sts
sing
le b
uild
ings
deve
lope
d ar
ea
bush
es, h
edge
stra
ffic
area
lake
s, riv
ers
woo
ds
agric
ultu
rebo
rder
strip
s
past
ures
gard
ens
fore
sts
sing
le b
uild
ings
deve
lope
d ar
ea
bush
es, h
edge
stra
ffic
are
a
lake
s, riv
ers
woo
ds
agric
ultu
rebo
rder
strip
s
past
ures
gard
ens
fore
sts
sing
le b
uild
ings
deve
lope
d ar
ea
bush
es, h
edge
stra
ffic
are
a
lake
s, riv
ers
woo
ds
*
*
deta
iled
clas
sific
atio
n
cultivated areadeveloped area
forestlinear structures
-0.50
-0.25
0.00
0.25B
eta
-Coe
ffic
ient
cultivated areadeveloped area
forestlinear structures
cultivated areadeveloped area
forestlinear structures
*
roug
hcl
assi
ficat
ion
Autographa gamma aphid colonies coccinellids
112 ha (600 m)112 ha (600 m)
452 ha (1200 m)452 ha (1200 m)
Figure 1. Impact of different landscape elements on insect abundance on spinach fields estimated by multiple linear regression analysis. (see Klug (2006) for details) (* indicates significant effects, p < 0.05). landscape structures (Table 1) with cereals and pastures growing area as the most important independent variables. None of the variables showed positive values for explained variance at the 452 ha environment (Table 1). In contrast multiple linear regressions analysis revealed a strong negative impact of forests and farmland on aphid colony abundance on the spinach fields at the 113 ha and 452 ha environment (Figure 1). Additionally at the 113 ha environment vegetation strips had a positive effect on aphid colony density (Figure 1). Impact of landscape structures on coccinellid abundance RandomForest analysis showed that the explained variance did not reach positive values at the 113 ha and 452 ha environment for all investigated classification levels of landscape structures (Table 1). In contrast multiple linear regression analysis showed strong positive effects of developed area on coccinellid abundance at the 113 ha environment (Figure 1). At the larger scale, i.e. 452 ha, the impact of most landscape structures diminished (Figure 1). Discussion The spinach growing region (Münsterland, North-Rhine-Westphalia, Northwest-Germany) can be described as a park landscape. Forests (20%) are scattered in an agriculture dominated landscape with maize as dominant culture in all three study years.
To analyse the impact of landscape on colonization of spinach plots by A. gamma, coccinellids and aphids two different statistical methods were used: randomForest analysis and multiple linear regressions. At least in a single ecological study RandomForest proved to be an important tool to design risk maps of Russian tick-borne encephalitis (Furlanello et al., 2003). Although the randomForest approach has low requirements on data distribution and
71

interdependencies the results of the current study were disappointing. None of the landscape elements was important enough to explain at least 50% of the variance, which is necessary for reliable randomForest results. Whether this modelling approach in general or the spatial and temporal restricted spinach cultivation periods are responsible for the low predictability of colonisation of spinach fields by the different arthropod species is difficult to conclude from the few studies done so far. For the highly mobile noctuid moth A. gamma only a few tendencies can be extracted from the current results. For example landscape elements that provide nectar to adults (i.e. flowering plants on developed area) seem to have positive while those with alternative host plants (i.e. agricultural area) have a negative effect on colonisation of spinach fields. The positive effect of potato fields on colonisation of spinach fields by A. gamma (Klug et al., 2003) might be attributed to attractiveness of flowers to adults instead of additional pest source populations.
Aphids on spinach fields were dominated by the black bean aphid A. fabae. While agricultural and forest areas in the neighbourhood of spinach fields showed a negative effect on aphid abundance on the spinach field, the border strips at the 600 m radius had a significant positive effect. While the former landscape elements might serve as sink the latter act as rich resources with alternative host plants from which colonisation of spinach field can take place. Future investigations should therefore focus on the spatial and temporal distribution of alternative host plants for important aphids species. Finally it was surprising that the proportion of the developed area had significant impact on the abundance of coccinellids on spinach fields. The most dominant coccinellid species on the spinach fields with more then 90% was Coccinella septempunctata. Since the landscape element "developed area" includes industrial real estates as well as farmyards it is likely that these elements provide overwintering habitats for coccinellids as well as alternative food resources, i.e. aphid infested host plants.
In summary, colonisation of spinach fields by the most important pest species is difficult to predict on the current landscape and land use data basis. In case of the highly mobile A. gamma species single landscape elements might be of minor importance, but for the other two species, i.e. coccinellids and aphids, further investigations are necessary before plant protection strategies on the basis of landscape elements can be adapted. References Bianchi, F.J.J.A., Van Wingerden, W.K.R.E., Griffioen, A.J. et al. 2005: Landscape factors
affecting the control of Mamestra brassicae by natural enemies in Brussels sprout. Agriculture Ecosystems & Environment 107: 145-150.
Breiman, L. 2001: Random Forests. Machine Learning 45: 5-32. Den Belder, E., Elderson, J., Van den Brink, W.J. et al. 2002: Effect of woodlots on thrips
density in leek fields: a landscape analysis. Agriculture, Ecosystem & Environment 91: 139-145.
Klug, T. 2006: Pest monitoring and development of sustainable plant protection strategies in spinach. PhD Thesis Leibniz Universität Hannover.
Klug, T., Gathmann, A., Poehling, H.M. & Meyhöfer, R. 2003: Area-dependent effects of landscape structure on the colonisation of spinach cultures by the silver Y moth (Autographa gamma L., Lepidoptera: Noctuidae) in Western Germany. Landscape Management for Functional Biodiversity. IOBC/WPRS. Bull. Vol. 26 (4): 77-82.
Tscharntke, T., Bommarco, R., Clough, Y. et al. 2007: Conservation biological control and enemy diversity on a landscape scale. Biological Control 43 (3): 294-309.
Tscharntke, T. & Brandl, R. 2004: Plant-insect interactions in fragmented landscapes. Annual Review of Entomology 49: 405-430.
72

Landscape Management for Functional Biodiversity IOBC wprs Bulletin Vol. 34, 2008
pp. 73-76
Does the spatial density of field margins affect aerially dispersing aphid predators, if so, at what scale? Heather Oaten1,2, John Holland1, Barbara Smith1, Simon Leather2
1Game & Wildlife Conservation Trust, Fordingbridge, Hants SP6 1EF, UK; 2Imperial College London, Silwood Park Campus, Ascot, Berks, SL5 7PY, UK Abstract: A landscape scale study was carried out investigating the effect of field margin density on aerial predators and their aphid prey. Field margins may aid biocontrol of aphid populations by acting as a source of aphid enemies, or they may act as a sink, drawing aphid enemies away from the crop to reside in a more favourable habitat. Results from 12 winter wheat fields with varying densities of surrounding field margins, showed the total number of predators and Cantharidae to exhibit a negative correlation with field margin density at local scales, but predatory Staphylinidae, especially Tachyporus spp. to show a positive correlation with field margin density at larger scales. Implications for pest control are discussed. Key words: landscape, conservation biocontrol, aphid predators, field margin, agri-environment Introduction Agri-environment schemes in the UK have been implemented with an aim, among others, to increase biodiversity throughout the landscape. One of the mostly widely adopted management options within UK agri-environment schemes is the addition of field margins, with 29,675 hectares of cereal field margins present in the UK in 2005 (UK-BAP reporting 2005). The term field margin is used in this context to mean a perennial habitat strip (typically 2 or 6 m wide) between field boundary edges and the outer edge of the cropped area within a field.
Field margins have been shown to be effective at providing a source of ground active natural enemies (Dennis & Fry, 1992; Pfiffner & Luka, 2000) but the majority of research carried out so far has been on terrestrially moving aphid predators (Holland et al., 2002). However, recent studies (Schmidt et al., 2003; Holland et al., 2006 and Holland et al., this volume) have demonstrated that flying aphid enemies provide the large majority of cereal aphid control in winter wheat fields, therefore aerially dispersing aphid predators are the focus for this study.
Field margins have been shown to increase some numbers of aphid predators at the single field scale (Oaten et al., 2007) but, as aerially dispersing predators are likely to disperse wide distances, the single field scale represents a constrained sampling unit. Recently there has been a focus on the effect of non-crop habitat at the landscape scale, which demonstrated that increasing percentages of un-cropped land can potentially enhance ecosystem services such as pollination (Steffan-Dewenter et al., 2002), pest control (Thies & Tscharntke, 1999) and biodiversity (Bergman et al., 2004). Field margins increase the area of non-crop habitats to a small extent but, additionally, situate resources for aphid predators directly adjacent to arable fields within which control is required.
The aim of this study is to determine if field margin densities affect aerially dispersing aphid predators, if so, at what scale, and what are the potential implications for aphid control?
73

Materials and methods This study was carried out in twelve fields of winter wheat located in Southern England. The fields were spaced at least 1.8 km apart except for two fields that were 0.6 km distant from each other. Each area surrounding the fields had varying densities of field margins. Field margin densities were measured using length of field margin in metres per hectare and were calculated with GIS mapping software MapInfo v8.0, using information taken from aerial photographs, farmer interviews and farm records. In each field of the twelve fields the perimeter of the cropped area was mapped using GPS and a 40 m buffer area determined inside the cropped area (hereon known as the interior perimeter) using GIS software, MapInfo v8.0. The length of the interior perimeter was calculated and this value divided by eight. Sticky traps consisting of A4 sized acetate coated in Tangletrap (The Tanglefoot Co., Grand Rapids, Michigan, USA) odourless sticky insect trapping gel wrapped around 2 litre clear plastic bottles were then positioned at eight equal intervals along the interior perimeter.
Sticky traps were run weekly for ten weeks starting at the end of April. Since trapping was carried out continuously the traps were positioned with the bottom edge 20 cm from the top of the crop so the traps did not interfere with the spray boom during crop spraying.
Total numbers of aphid predators from the groups Cantharidae, Coccinellidae, Dolichopodidae, Empidae, Linyphiidae, Neuroptera and predatory Staphylinidae were summed across all ten dates and regressed against field margin density in m per hectare for buffers of radius’s 50 m, 100 m, 250 m, 500 m, 750 m and 1000 m around the target fields. All data was loge(n+1) transformed prior to analysis. The adjusted r2 value obtained for each regression was plotted against buffer radius to determine which scale best describes the relationship observed for each group (Steffan-Dewenter et al., 2002; Van Langevelde, 2000). In the two cases where field buffers overlapped, aphid predator numbers were meaned across the two fields and plotted against field margin density for the combined buffer areas. Results and discussion Four groups of flying aphid predators exhibited significant responses to the density of field margins at one or more spatial scales from 50 m to 1000 m (Table 1), but the four groups did not demonstrate a collectively similar response. Table 1. Relationships between length of field margins and abundance of four groups of aerially dispersing aphid predators, with correlation coefficients (adjusted r2) and P values from simple linear regressions on loge(n+1) transformed data. P values greater than the 95% confidence interval are highlighted in bold.
Scale
50 m 100 m 250 m 500 m 750 m 1000 m Predator groups r2 P r2 P r2 P r2 P R2 P r2 P
All predators 0.319 0.032 0.273 0.047 0.129 0.136 0.002 0.348 0.083 0.200 0.086 0.211 Cantharidae 0.292 0.041 0.173 0.099 0.207 0.078 0.198 0.095 0.151 0.130 -0.07 0.553 Predatory
Staphylinidae 0.235 0.063 0.299 0.038 0.213 0.074 0.227 0.079 0.433 0.017 0.37 0.036
Tachyporus spp. 0.252 0.055 0.350 0.025 0.277 0.046 0.306 0.045 0.463 0.013 0.315 0.053
74

a) Cantharidae
b) Tachyporus spp.
Figure 1. Adjusted r2 coefficients plotted against buffer radius for the groups a) Cantharidae and b) Tachyporus spp. together with regression plots for the spatial scale buffer radius for the highest adjusted r2 value. Total aphid predator numbers showed a slight negative response to field margins densities, at local scales (50 m and 100 m radius’). Cantharidae exhibited a strong negative response at a buffer radius of 50 m (Figure 1a), and this may be due to the close association of Cantharidae to field boundaries (Oaten et al., unpublished). Field margins may act as sinks for Cantharidae and they may limit their searching effort where resources exist at higher densities.
Predatory Staphylinidae, however, demonstrated a positive correlation when regressed against field margin density. A high percentage of predatory Staphylinidae trapped were the larger Tachyporus spp. present in agricultural fields: T. hypnorum, T. chrysomelinus and T. obtusus and regression analysis on this group exhibited a positive correlation with field
75
margin density (Figure 1b) at multiple spatial scales (Table 1) with the greatest variation explained at buffer radius 750 m.
Biocontrol has been demonstrated to be greater in landscapes with higher percentages of non-crop habitat surrounding, but the benefit to pest can equal that of the pest natural enemy, resulting in no net effect (Thies et al., 2003). This study demonstrates a similar effect, but instead of a net effect occurring between pest and predator, there is a potential “no net” effect within the aphid predator assemblage itself due to the source and sink effect of field margins on aerially dispersing aphid predators. This study demonstrates that field margin densities can have a measurable effect on aerially dispersing aphid predators, but the scale over which they exert influence vary and they may act as both sources and sinks, depending on the ecology of the aphid predator group studied. Further work is needed to determine which predators are of greatest importance in pest control and how best they can be manipulated with non-crop habitat resources. Acknowledgements We would like to thank Freya McCall for help with fieldwork, Dr Nicholas Aebischer for statistical advice and Neville Kingdon for GIS and GPS assistance. Funding was provided through the Research Councils UK Rural Economy and Land Use programme. References Bergman, K.O., Askling, J., Ekberg, O., Ignell, H., Wahlman, H. & Milberg, P. 2004: Land-
scape effects on butterfly assemblages in an agricultural region. Ecography 27: 619-628. Dennis, P. & Fry, G.L.A. 1992: Field margins: can they enhance natural enemy population
densities and general arthropod diversity on farmland? Agriculture, Ecosystems and Environment 40: 95-115.
Holland, J., Southway, S., Birkett, T. & Moreby, S. 2006: The relative merits of field and boundary habitats for conservation biocontrol. IOBC wprs Bulletin 29: 57-60.
Holland, J.M., Frampton, G.K. & Van den Brink, P.J. 2002: Carabids as indicators within temperate arable farming systems: implications from SCARAB and LINK integrated farming systems projects, pp. 251-277. In: The Agroecology of Carabid Beetles, ed. J.M. Holland. Intercept Ltd., Andover, UK.
Oaten, H., Holland, J.M. & Smith, B.M. 2007: Attack from above: The effect of field margins on movements of aerially dispersing aphid predators. Aspects of Applied Biology 83: 89-93.
Pfiffner, L. & Luka, H. 2000: Overwintering of arthropods in soils of arable fields and adjacent seminatural habitats. Agriculture, Ecosystems and Environment 78: 215-222.
Schmidt, M., Lauer, A., Purtauf, T., Thies, C., Schaefer, M. & Tscharntke, T. 2003: Relative importance of predators and parasitoids for cereal aphid control. Proceedings of the Royal Society of London B 270: 1905-1909.
Steffan-Dewenter, I., Münzenberg, U., Bürger, C., Thies, C. & Tscharntke, T. 2002: Scale-dependent effects of landscape context on three pollinator guilds. Ecology 83: 1421-1432.
Thies, C. & Tscharntke, T. 1999: Landscape structure and biological control in agro-ecosystems. Science 285: 893-895.
Thies, C., Steffan-Dewenter, I. & Tscharntke, T. 2003: Effects of landscape context on herbivory and parasitism at different spatial scales. Oikos 101: 18-25.
Van Langevelde, F. 2000: Scale of habitat connectivity and colonization in fragmented nuthatch populations. Ecography 23: 614-622.
76

Landscape Management for Functional Biodiversity IOBC wprs Bulletin Vol. 34, 2008
pp. 77-80
Evaluating predator diversity and abundance in vineyards and the contiguous hedgerows Stefan Otto1, Filippo Maria Buzzetti2, Giuseppe Zanin2, Carlo Duso2
1Institute of Agro-Environmental and Forest Biology - CNR, Viale dell’Università 16, 35020 Agripolis, Legnaro (PD), Italy; 2Dept. of Environmental Agronomy and Crop Science, University of Padova, Viale dell’Università 16, 35020 Agripolis, Legnaro (PD), Italy Abstract: The presence of uncultivated areas in agro-ecosystems may affect crop arthropod populations. A diversity index can be a useful tool for comparing farms with varying amounts of uncultivated land and evaluating the role of different cropping systems. The aim of this study was to evaluate the abundance and diversity of predator arthropods in hedgerows and vineyards located in organic or conventional farms, utilising the classic concise indices of population structure/composition and the Quadratic Diversity (Q) Index, which is innovative but more complicated to calculate. Investigations carried out in north-eastern Italy stressed that hedgerows were populated by a higher number of predatory species than nearby vineyards. Moreover, there was a higher species richness in vineyards adjacent to hedgerows than in those farther away, independently of the type of management. If there are no objective criteria for defining dissimilarities between species, the Q index provides the same information as other indices of diversity (i.e. Shannon or Pielou). Key words: hedgerows, vineyards, biodiversity, predators, Quadratic Diversity Index Introduction It has been recognized that biodiversity is crucial to crop defenses: the diversity of plants, animals and soil-borne organisms inhabiting a farming system, is related to the community of beneficial organisms the farm can support (Altieri et al., 2005). In the past, south-European vineyard systems comprised trees, vines and annual crops. These complex vineyards were gradually converted to a monoculture system with a decrease in their biodiversity. It has been observed that this conversion has implied an increase in pest problems (Altieri & Nicholls, 2002). These authors concluded that the increased productivity of modern vineyards is counterbalanced by a loss in biodiversity and agricultural sustainability with implications for pest vulnerability.
The creation of an ecological infrastructure within and around vineyards can promote more stable ecosystems (Gurr et al., 2004). The abundance and diversity of beneficial insects within a crop can depend on the surrounding vegetation but natural enemy abundance is also determined by their capacity to disperse into the crop (Landis et al., 2000). In California, egg-parasitoids of grape leafhoppers (Anagrus spp.) are more effective when blackberry or French prune hedges are contiguous to vineyards (Doutt & Nakata, 1973; Corbett & Rosenheim, 1996). The positive role of the natural vegetation surrounding vineyards, mainly hedges, in increasing the impact of Anagrus spp. has been confirmed in Europe (e.g. Ponti et al., 2003). Hedges can represent a reservoir of predatory mites belonging to the Phytoseiidae family, the key biocontrol agents of phytophagous mites in vineyards. These small arthropods can disperse from the natural vegetation to vineyards favored by wind currents (Tixier et al., 2000). Apart from these case-studies, the role of hedgerows in promoting the diversity of beneficials in contiguous vineyards, with positive implications for pest control, requires in
77

depth studies. This capacity could depend on vineyard management, in particular on the frequency and type of pesticides used.
The aim of this research was to evaluate the influence of hedgerows in increasing predator diversity in adjacent vineyards. Therefore, we estimated the size and diversity of predator populations occurring in vineyards in organic or conventional farms and their contiguous hedgerows. We focused on those predatory groups which have a role in the biological control of grape pests. Materials and methods Site information and sampling methods The research was conducted over three years, 2003-2005, in agro-ecosystems containing hedgerows and vineyards, located in north-eastern Italy. Five farms were chosen, two of them being organic and three of them conventional farms. On two farms (one biological and one conventional), vineyards adjacent to hedgerows were singled out and compared to vineyards at a distance (2-300 m) from hedgerows. On the remaining farms all the vineyards were adjacent to hedgerows. The selected hedgerows were similar in terms of botanical structure, plant age, and role in the production system. They measured 30-40 m in length and 2-4 m in width. They consisted mostly of 10-15 m high trees, bushes and weeds typical of crop margins. The hedgerow vegetation was dense enough to just allow a person to pass through. The hedgerows mainly comprised Ulmus campestris L., Alnus glutinosa L., Acer campestre L., Sambucus nigra L., Robinia pseudoacacia L., Corylus avellana L., Prunus cerasifera L., Carpinus betulus L., Rubus sp., Cornus sanguinea L.
The abundance of predator arthropods in the hedgerows and vineyards were evaluated by sampling the vegetation every 7-15 days. Populations in the vineyards were surveyed by singling out three transects 10, 50 and 100 m from the hedgerow (or edge of the vineyard), together with a transect on the hedgerow or at the edge of the vineyard. Within each transect, three sampling areas were chosen along the transversal axis of the hedgerow or vineyard. This gave 4*3=12 nodes in the hedgerow-vineyard rectangle. Within a radius of 2-3 m of each node, 3 samples, considered as replicates, were collected. Arthropods were collected by beating the vegetation in the selected sampling sites. Additional material was taken from leaf samples removed from the same sites. Indices of biodiversity Data elaboration using indices or models is a procedure that allows a better comparison of data from different sources. As well as determining the number of specimens (N) and number of species (S), the sampling data obtained were analysed to calculate Simpson’s Dominance (D), Shannon’s Diversity (S), Pielou’s Equitability (E), Margalef’s Index (M), Quadratic Diversity Index. This latter (Izsák & Papp, 2000), is a function of both the abundance and the dissimilarities among species. If a community is considered of N species characterised by the vector of relative abundance P=(p1,p2,p3,…pN) so that 0≤pi≤1 and Σipi=1, the Quadratic Diversity Index is defined as:
N Nij i j
i=1 j=1Q= d p p∑ ∑
where dij is the difference (or dissimilarity or diversity) between the i-th and the j-th species. Therefore Q expresses the average difference (or dissimilarity or diversity) between 2 individuals chosen at random within the community. To calculate Q it is necessary to define a matrix of the differences or weights to assign to each pair of species i and j, i.e., to their “relationship” Rij. The distances on a taxonomic tree were considered in this study. Although
78

it is possible that the maximisation of Q can be obtained with a small number of species (with uniform species distribution (Izsák & Szeidl, 2002), it is generally expected that a high value of Q indicates a system with high ecological value, whereas a low value of Q may be symptomatic of a simplified or very specialised ecosystem. Analysis of the correlation among indices The indices S, M, N, D, H, E, Q were expected to be partially correlated, therefore a Factor Analysis performed with Statistica 7.1 was used to summarise them (Procedure: Extraction of Principal Components) (Statsoft Inc., 2005). Results and discussion We concentrated our study on predatory species belonging to the following orders: Acari, Araneae, Dermaptera, Orthoptera, Hemiptera, Mecoptera, Neuroptera, Coleoptera, and Diptera. A total of 36 taxa were found in the hedgerows, of whch 24 were also found in the vineyards; no species were found in the vineyards only. In some cases greater numbers of predators were found in the vineyards adjacent to hedgerows compared to vineyards at a distance, and the latter also had fewer predatory species than the former, independently of the type of farm management. Vineyards adjacent to hedgerows had higher levels of biodiversity than the vineyards farther away. This is probably due to the positive influence of hedgerows.
The full representation of the correlation among indices was summarised with a bi-plot after Factor Analysis (Figure 1). The first factor explains 51% of data variability, and can be interpreted as an “Equilibrium” factor: the further over to the right a site is, the more its flora is characterised by high diversity and is therefore generally better “equilibrated” or “balanced.” The second factor explains 39% of data variability, and can instead be interpreted as a “species richness” factor: the higher a site is, the richer it is in species. The space of the factors is therefore divisible in 4 quadrants with the four combinations Balanced-Richness.
D
H
E
-2 -1 0 1
Factor 1 (51%)
2
-2
-1
0
1
2
Fact
or 2
(39%
)
Unbalanced withhigh species richness
Unbalanced withlow species richness
high s
low s
S
NM
Balanced withpecies richness
Balanced withpecies richness
Q
Figure 1. Biplot of factor loadings (□) and factor scores (• organic farm, ○ conventional farm). S, M, N, D, H, E, Q: Indices of biodiversity (see materials and methods).
79

An examination of the Q index has shown that it can only provide additional information if an appropriate criterion of dissimilarity between the species is introduced. It is clear that one of the main difficulties lies in the attribution of the importance (intensity) of the single binary relationships in a farming context, where the actions of man are incisive and environmental changes often very rapid. Analysis of the correlations among the various Dominance and Diversity indices has demonstrated that equilibrium is a condition that can be difficult to summarise in agro-ecosystems, and that organic management techniques do not guarantee it. References Altieri, M.A. & Nicholls, C.I. 2002: The simplification of traditional vineyard based
agroforests in northwestern Portugal: some ecological implications. Agroforest. Syst. 56: 185-191.
Altieri, M.A., Ponti, L. & Nicholls, C.I. 2005: Manipulating vineyard biodiversity for improved insect pest management: case studies from northern California. Int. J. Biodiv. Sci. Man.1: 1-13.
Corbett, A. & Rosenheim, J.A. 1996: Impact of natural enemy overwintering refuge and its interaction with the surrounding landscape. Ecol. Entomol. 21: 155-164.
Doutt, R.L. & Nakata, J. 1973: The Rubus leafhopper and its egg parasitoid: an endemic biotic system useful in grape-pest management. Environ. Entomol. 2: 381-386.
Gurr, G.M., Wratten, S.D. & Altieri, M.A. 2004: Ecological engineering for pest management: advances in habitat manipulation for arthropods. Wallingford UK, CABI Publishing.
Izsák, J. & Papp, L. 2000: A link between ecological diversity indices and measures of biodiversity. Ecol. Model. 130: 151-156.
Izsák, J. & Szeidl, L. 2002: Quadratic diversity: its maximization can reduce the richness of species. Environ. Ecol. Statistics 9: 423-430.
Landis, D.A., Wratten, S.D. & Gurr, G.M. 2000: Habitat management to conserve natural enemies of arthropod pests in agriculture. Annu. Rev. Entomol. 45: 175-201.
Ponti, L., Ricci, C. & Torricelli, R. 2003: The ecological role of hedges on population dynamics of Anagrus spp. (Hymenoptera: Mymaridae) in vineyards of Central Italy. IOBC wprs Bull. 26: 117-122.
StatSoft Inc. 2005: Statistica (data analysis software system), version 7.1. www.statsoft.com. StatSoft, Inc., 2300 East 14th Street, Tulsa, OK, 74104, USA.
Tixier, M.S., Kreiter, S. & Auger, P. 2000: Colonization of vineyards by phytoseiid mites: their dispersal patterns in the plot and their fate. Exp. Appl. Acarol. 24: 191-211.
80

Landscape Management for Functional Biodiversity IOBC wprs Bulletin Vol. 34, 2008
pp. 81-84
Biodiversity and its interactions with viticulture in a wine-growing area in the west of France: case study of a local initiative in a controlled origin appellation (AOC Saumur-Champigny) Guillaume Pain, Véronique Beaujouan, Hervé Daniel, David Montembault, Joséphine Pithon, Annie Sigwalt Groupe ESA, 55 rue Rabelais, BP 30748, 49007 Angers Cedex 01, France; Institut National d’Horticulture, 2 rue le Nôtre, 49045 Angers Cedex 01, France Abstract: This poster will introduce an interdisciplinary study which, over the next three years (2007-2010), aims to examine the interactions between biodiversity (plants and birds) and viticultural activities. Our work will focus on a controlled origin appellation in which a biodiversity enhancement programme has arisen through local initiative. Currently, little is known about the general biodiversity of vineyards. The results from this work should provide advice for viticulturists for the management of ecological compensation areas and contribute to a better understanding of the interactions between general and functional biodiversity. Do species-rich areas coincide with lower pest densities? Does general enhancement of biodiversity provide functional benefits? Key words: biodiversity, viticulture, controlled origin appellation, landscape, ecological compensation areas Introduction Wild flora and fauna in agricultural systems may be studied either from the conservation standpoint or in terms of their functions with regard to agricultural production. The importance of semi-natural areas not directly used in production has been highlighted by mainly conservation-oriented ecologists (Le Coeur et al., 2002) but investigation of the interactions with adjacent crops and farming activities are scarce. Landscape ecologists have shown that studies of farmland biodiversity need to be conducted at a variety of spatial scales (Jeanneret et al., 2003). This includes recent work on functional biodiversity showing that the factors influencing the distributions of agricultural insect pests and their enemies operate at large spatial scales (Clough et al., 2007). The temporal scale should not be ignored as historical data may have a considerable impact on current observations (Petit & Burel, 1998).
Studies of vineyard biodiversity have mostly been confined to understanding the ecology of vine pests and their natural enemies and of mechanisms involved in biological control (Boller, 2006). Information on the general biodiversity of vineyards is scarce, though such permanent woody vegetation (and the green cover in between the rows of vine) may provide useful habitat compared with more frequently disturbed agricultural crops. The relationships between vine biodiversity and vine plot as well as margin management are therefore not clear.
The wine-growing area corresponding to the controlled origin appellation of Saumur-Champigny covers 5900 ha of crops, woodland and urban outskirts of which 1600 ha are devoted to vineyards belonging to just over one hundred viticulturists. The area lies in the Loire valley between the town of Saumur and the forested area of Fontevraud.
In 2004, the Saumur-Champigny viticulturists launched a biodiversity and landscape enhancement project. The aims of the project are to reintroduce biodiversity into the wine-
81

growing area through creation of ecological compensation areas, in the dual hope of encouraging natural enemies of vine pests and improving the image of their wine products. Since the project’s inception, scientists have been involved in monitoring insect pest levels in relation to landscape structure and advising on plantation strategies and a preliminary sociological study of the emergence of this collective biodiversity enhancement project has also been completed.
This study will use an interdisciplinary approach to study the interactions between agricultural activities and biodiversity at the scale of a controlled origin appellation (AOC). In particular: - to determine the ecological (local and landscape scale) and agricultural factors influencing
the plant and bird diversity of the wine-growing study area; - to study the spatial organisation of the viticulturists’ farms and the influences of their
management practices on biodiversity; - to describe the evolution of this wine-growing landscape over the last 50 years and to
assess the characteristics and uses of certain semi-natural or man-made features over time; - to understand the sociological factors that led to the emergence of this biodiversity
enhancement project and those that could enable other local parties to become involved. Material and methods Spatial scales of study A hierarchy of different scales will be used, the different disciplines sharing common “windows”, “blocks”, field margins and farms to facilitate interdisciplinary data analysis (see Figure 1). Landscape description and dynamics over 50 years Land cover from 1950, 1967 to the present day (1991 and 2002) will be analysed using aerial photograph interpretation. Landscape composition and configuration will be studied over time and the present-day composition will be spatially analysed (using moving window approaches and multivariate analysis) in order to select a set of 12 × 1 km square windows containing a minimum proportion of vineyard (around 20-25%), but situated in a variety of landscape contexts. In addition to traditional land cover categories, this study will focus particularly on those areas not directly used for agricultural production. These may be semi-natural areas such as field margins, roadsides, hedges or small woods, or man-made features such as the calcareous stone walls that are typical of the region. Such areas will be mapped and described using GIS. Biodiversity sampling We have chosen to use plants and birds as indicators of general vineyard biodiversity. Both groups are well-studied in agricultural habitats (though less so in vineyards) and have been shown in certain European farming contexts to be good indicators of overall taxonomic species richness (Sauberer et al., 2003). These two taxonomic groups may be expected to respond to environmental conditions in different ways and at rather different spatial and temporal scales and are also likely to play an important part in viticultural activities. At the “window” scale a survey of the vegetation structure and basic composition of those areas not directly used for agricultural production will be carried out and transects will be used to sample the bird communities of vineyards and their adjacent habitats in different landscape contexts. At the finer scale of the “block” of vines, it will be possible to carry out more detailed botanical surveys in field margins with different structure and management,
82

adjacent crops and habitats. Territory mapping of bird communities at this scale and finer observations of behaviour will aim to determine how birds use and interact with vineyards and their associated semi-natural habitats. Viticultural practices The study of agricultural activities in this wine-growing area will focus on two aspects. Firstly, at the “block” scale, the different management practices which may influence biodiversity both within vine plots and on adjacent areas not directly used for production (field margins, turning bays, etc.) will be investigated via on-farm interviews with viticulturists. Secondly, the spatial organisation of viticulturists’ farms situated within the blocks will be analysed and the influence of spatial considerations on vineyard management assessed. Sociological analysis The biodiversity enhancement project will be analysed from two main perspectives by sociologists. Firstly, the emergence of the project and the manner in which it has been adopted by the viticulturists will be analysed, in particular by studying the social ties within this wine-growing community. The ways in which these producers perceive biodiversity and their probability of participating actively in the biodiversity project, as a function of their farm type (organic, integrated pest management, conventional, etc.) will also be examined. Secondly, the broader question of how the project is perceived locally will be addressed, with a view to identifying the factors that might permit its adoption by the wider community (local authorities, non viticulturists, etc).
Figure 1. Hierarchy of spatial scales of study.
83

Expected results and their application The results should help to define the appropriate spatial scales for planning the implantation and management of new ecological compensation areas and provide information, at these different scales, about the importance of different semi-natural habitats for plant and bird diversity. The project currently favours hedge-planting, but other types of management may be proposed as a result of this work. The botanical and ornithological data should also enable us to identify indicators for monitoring the impacts of the viticulturists’ farming practices and of their biodiversity enhancement project. Finally, the results will contribute to a better understanding of the existing and ongoing insect pest monitoring carried out by van Helden et al. (2006). Do species-rich areas coincide with lower pest densities? Does general enhancement of biodiversity provide functional benefits? Acknowledgements This study is funded by the French Ministry for the Environment (MEDAD) as part of a national research programme on political action, agriculture and biodiversity (DIVA 2 – Action publique, agriculture & biodiversité). References Boller, E.F. 2006: Functional biodiversity: a success story in vineyards of Northern
Switzerland. Landscape management for functional biodiversity. Second working group meeting., Zürich, IOBC/WPRS.
Burel, F., Baudry, J., Butet, A., Clergeau, P., Delettre, Y., Le Coeur, D., Dubs, F., Morvan, N., Paillat, G., Petit, S., Thenail, C., Brunel, E.& Lefeuvre, J.-C. 1998: Comparative biodiversity along a gradient of agricultural landscapes. Acta Oecologica. 19(1): 47-60.
Clough, Y., Kruess, A. & Tscharntke, T. 2007: Local and landscape factors in differently managed arable fields affect the insect herbivore community of a non-crop plant species. J. of Appl. Ecol. 44: 22-28.
Jeanneret, P., Schupbach, B. & Luka, H. 2003: Quantifying the impact of landscape and habitat features on biodiversity in cultivated landscapes. Agri. Ecosyst. & Envt. 98: 311-320.
Le Coeur, D., Baudry, J., Burel, F. & Thenail, C. 2002: Why and how we should study field boundary biodiversity in an agrarian landscape context. Agri. Ecosyst. & Envt. 89: 23-40.
Petit, S. & Burel, F. 1998: Effects of landscape dynamics on the metapopulation of a ground beetle (Coleoptera, Carabidae) in a hedgerow network. Agri. Ecosyst. & Envt. 69: 243-252.
Sauberer, N., Zulka, K.P., Abensperg-Traun, M., Berg, H.M., Bieringer, G., Milasowszky, N. Moser, D., Plutzar, C., Pollheimer, M., Storch, C., Trostl, R., Zechmeister, H. & Grabherr, G. 2003: Surrogate taxa for biodiversity in agricultural landscapes of eastern Austria. Biological Conservation. 117: 181-190.
Van Helden, M., Fargeas, E., Fronzes, M., Maurice, O., Thibaud, M., Gil, F. & Pain, G. 2006: The influence of local and landscape characteristics on insect pest population levels in viticulture. Landscape management for functional biodiversity. Second working group meeting., Zürich, IOBC/WPRS.
84

Landscape Management for Functional Biodiversity IOBC wprs Bulletin Vol. 34, 2008
pp. 85-88
Expression of on-farm functional biodiversity as affected by management and multi-scale agroecosystem disturbance Souzi Rouphael1, Anna-Camilla Moonen1, Paolo Bàrberi1, Ruggero Petacchi2, Luigi Boccaccio2 1Land Lab and 2BioLabs, Scuola Superiore Sant'Anna, Piazza Martiri della Libertà 33, 56127 Pisa PI, [email protected] Abstract: The relationship between biodiversity and ecosystem functioning has emerged as one of the most controversial research areas over the last decade. Agroecosystems are per definition subjected to disturbances. The intensity and frequency of management practices representing the main disturbance in agroecosystems, affect its biodiversity. The part of the biodiversity that provides a certain ecosystem service, can be called a functional groups. Thus, management likely affects the stability and functioning of the agroecosystem through its impact on the functional biodiversity. This paper presents the first part of a PhD project which aims to contribute to the understanding of 1) how on-farm disturbance by management affects on-farm functional biodiversity and 2) how composition, structure and disturbance at various spatial scales modify this interaction. The first aspects that had to be determined were: 1) How to express disturbance in such a way that it can be compared at different spatial scales and in different agroecosystems? 2) What are the agroecosystem objectives and problems? 3) Thus, what is the functional biodiversity in the different cropping systems? 4) What measures are needed to indicate the level of functionality of the functional groups? 1) Vegetation and land use type were identified as the main indicator for disturbance level at all spatial scales. 2 and 3) Agroecosystem disturbance is mainly caused by the cropping system, with disturbance levels decreasing from annual crops to perennial trees. Within each cropping system, the chosen cultural practices determine the disturbance level. Therefore functional biodiversity in agroecosystems with different levels of disturbance, in different landscape contexts, have to be compared. Two extreme cropping systems (olive groves and annual crop rotation) were chosen, each with a low and a high crop management intensity. In the perennial olive grove ecosystem pest management was found to be the most important functional aspect of the biodiversity, whereas soil organic matter decomposition and weed control were more relevant in the annual cropping system. 4) Measures are indicated in a methodological table. Key words: spatial scale, soil organic matter decomposition, pest management, vegetation, land use, weed management. Introduction The relationship between biodiversity and ecosystem functioning has emerged as one of the most controversial research areas over the last decade (Parris, 2001). Functional biodiversity can de defined as “that part of the total biodiversity composed of clusters of elements (at the gene, species or habitat level) providing the same (agro)ecosystem service, that is driven by within-cluster diversity” (Moonen & Bàrberi, in press). Therefore that part of the biodiversity that provides a certain ecosystem services can be referred to as an agroecosystem functional groups. The specific elements of biodiversity that are functional in any situation depend on the local agroecosystem characteristics and therefore it is unlikely that any general rule or law regarding functional biodiversity can be formulated (Altieri, 1999). The concept of stability and disturbance in relation to biodiversity were the object of various studies (Loreau et al., 2006). Disturbance can originate from changes in natural
85

conditions or from management practices. The intensity and frequency of management practices representing the main disturbance in agroecosystems, affect its biodiversity. Thus, management likely affects the stability and functioning of the agroecosystem through its impact on the functional biodiversity, and this can occur across different trophic levels (Grime, 1998). The particular needs for understanding the functionality of biodiversity for ecosystem processes and services started mainly from a small scale (field). But the assessment at field scale might just give a partial picture since the behaviour of the various components of biodiversity are interconnected and relevant at different spatial scales. Eco-physiological and life traits of the organisms that are thought to provide a specific agroecosystem service can give some indication of the spatial scale which might be relevant. Species at higher trophic levels are more likely to have large home ranges and their dynamics depend on landscape composition at larger scales besides the composition and structure of local patches (Ritchie & Olff, 1999). Therefore mobile species require a control at landscape and farm level together (Holland et al., 2005). For spatially stable species it may be possible to determine their specific habitat requirements and intervene at farm scale with protective measures. However, the numerous inter-species relations can disrupt this linear correlation and disturbances or configuration at higher spatial scales might be important for sessile species or species with a low mobility as well. The type of cropping system (permanent, monoculture, polyculture, etc.) could be the first important indication for the general disturbance level, and through that, for the type of functional biodiversity that can be expected. Management intensity and frequency are imposed on the cropping system and will determine the stability of the agroecosystem services provided by the functional biodiversity. Nonetheless, descriptors of the surroundings (e.g. habitat structure, diversity and connectivity) at various spatial scales interfere with local processes through (re)colonisation or isolation. Therefore, a multi-scale perspective is needed to understand how agricultural land use can be adapted in such a way to increase the agroecosystem services provided by biodiversity. Objectives and study areas Agroecosystems are disturbed ecosystems by definition. The question is then to optimize disturbance such that it does not affect the expression of agroecosystem functions/services. This paper presents the first part of a PhD project which aims to contribute to the understanding of 1) how on-farm disturbance by management affects on-farm functional biodiversity and 2) how composition, structure and disturbance at various spatial scales modify this interaction. In order to proceed, four main aspects have to be defined: 1) How to express disturbance in such a way that it can be compared at different spatial scales
and in different agroecosystems? 2) What are the agroecosystem objectives and problems? 3) Thus, what is the functional biodiversity in the different cropping systems? 4) What measures are needed to indicate the level of functionality of the functional groups? So far, most studies on biodiversity in relation to agroecosystem functioning were performed in grassland (Schmid et al., 2002). Few data are available on annual crop rotations and even less on perennial crops. Considering the fact that olive trees are an important agricultural crop in Italy as well as in most Mediterranean countries, olive agroecosystems varying in management intensity and surrounding margins were chosen as example of a perennial agroecosystem. A standard annual crop rotation subject to different management regimes was selected to contrast the perennial olive agroecosystem.
Hypothesis: 1) The main agroecosystem functions for each cropping system (e.g. pest control, soil quality
86

improvement, soil fertility), and therefore the most important on-farm functional biodiversity, is mainly determined by the cropping system’s disturbance level.
2) Magnitude of the on-farm functional biodiversity in perennial systems is more determined by landscape characteristics at high spatial scales than at small spatial scales and on-farm management practices.
3) Magniture of on-farm functional biodiversity in annual cropping systems is more determined by on-farm management practices and/or local spatial configuration then by landscape configuration.
In the perennial cropping system two olive groves have been selected in Asciano (Monte Pisano, Tuscany, Central Italy). The extensively managed olive grove is characterised by animal manure, pruning, high tree density, narrow terraced sites of olives on the hills of Pisa region, with local target uses, surrounded by a forest from two sides and other olive orchards from the other sides. The intensively managed olive grove is market targeted, and is characterised by animal manure, pruning, synthetic insecticide application, high tree density, narrow terraced sites of olives surrounded by a forest from two sides and other olive orchards from the other sides. The annual cropping systems are part of the MASCOT (Mediterranean Arable Systems COmparison Trial) long-term experiment, San Piero di Grado, Pisa (Tuscany, Central Italy). Both systems have a rotation of corn-common wheat-sunflower-pigeon bean-durum wheat. In the organic system Vicia villosa is interseeded in wheat at the end of winter and subsequently (after ca. 12 months) used as a green manure for either sunflower or corn. Both organic and conventional fields are divided into 5 plots (based on the rotation of crops) with a rectangular shape (155 m long and 23 m wide). Hedgerows separate the organic and conventional fields. First results Step 1: Determination of an indicator for disturbance Vegetation is incapable of escape, and therefore it reflects signs of the disturbance that has been inflicted on an ecosystem. It offers a food source for the higher trophic levels and a shelter to small animals and insects. Therefore, any disturbance imposed on an ecosystem affects directly the vegetation and indirectly other organisms. Vegetation is present at all spatial scales and can be measured in various different ways, each best adapted to the relative scale and local situation. Both physical damage to the vegetation, and compositional changes can be recorded. Species which resist to the frequency and intensity of disturbance survive, whereas the other ones disappear, making place for the colonisation of new species, or the increasing abundance of existing species. Species characterisation is therefore good indicator for disturbance at the field and farm levels. On a landscape scale, the percentage of arable lands, woodlands or forest surrounding the fields, and the composition and structure of the vegetation indicate the disturbance level. Therefore, we considered that the vegetation could be useful as an indication of the disturbance level at all scales and levels. Step 2 and 3: Agroecosystem objectives, problems and functional biodiversity The main agroecosystem functions for each cropping system were determined, and from that the functional biodiversity related to those functions were determined. The olive agroecosystem is a permanent monoculture. The soil practices in such an agroecosystem are minor and therefore soil related processes are not heavily impacted. Since it provides species with a permanent habitat/refuge, pest (Bactrocera olea – olive fly) management is the main concern. Therefore the agroecosystem functional group in this system are all olive fly antagonists and elements supporting olive fly antagonists or negatively affecting olive fly. Soil processes (fertility, soil organic matter accumulation) in annual cropping systems are heavily disturbed by tillage and crop rotation. Also, weed communities compete for resources
87

with the annual crops. Therefore two functional groups can be distinguished in these systems: all elements related to soil organic matter (SOM) input and decomposition, and all elements related to weed community development. The SOM functional group comprises crops and soil fauna. The weed control functional group comprises weeds and the weed seed predators. Step 4: Measures for indication of the magnitude of functionality
Magnitude of the functional biodiversity. At the field level, indices , parameters and methodologies are different for each function. In the olive ecosystem pest and predator presence (richness, abundance, diversity) and activity will be measured during their active phase through 1) sampling olives and checking the emergence percentage of parasitioids and pest, 2) putting pitfalls in the soil to study the predation of the larvae of the studied pest, and 3) using transparent traps for the movement of parasitoids and pest. In the annual cropping system 1) richness and abundance of soil organic matter decomposers will be controlled using the soil biological quality method (QBS) and contemporary the soil microbial respiration will be determined, 2) predation and activity of predators for weed seeds will be studied using the method of sandpaper of weed seeds, and classification of weed in the field according to competition level with the crop.
Multi-scale factors influencing functional biodiversity. Vegetation sampling at field, farm and landscape scale will be done to determine the general disturbance level. At field level species abundance in quadrates adapted to the crop will be determined. At farm level vegetation composition and structure of field margins surrounding the experimental fields will be characterised and complemented with information on intensity and frequency of all farm management practices through repeated interviews and contact with farmers in both studied agroecosystems. At landscape level land use intensity will be determined based on aerial photo interpretation. From these data landscape connectivity, diversity and configuration for the species which determine the functional biodiversity can be calculated, based on their ecophysiological characteristics. Results of different components coming from each activity will be processed through different statistical analysis according the needs. References Altieri, M. 1999: The ecological role of biodiversity in agroecosystems. Agriculture,
Ecosystems and Environment 74: 19-31. De Ruiter, P.C., Griffiths, B. & Morre, J. 2006: Biodiversity and stability in soil ecosystems :
patterns, processes and the effects of disturbance. In: Biodiversity and Ecosystem Functioning synthesis and perspectives, eds. Loreau, M., Naeem, S. & Inchausti, P.: 294: 102-113.
Grime, J.P. 1998: Benefits of plant diversity to ecosystems: immediate, filter and founder effect. Journal of Ecology 86: 902-910.
Holland, J.M., Thomas, C.F.G., Birkett, T., Southway, S. & Oaten, H. 2005: Farm scale spatiotemporal dynamics of predatory beetles in arable crops. Journal of Applied Ecology 42: 1140-1152.
Loreau, M., Naeem, S. & Inchausti P. 2006: Biodiversity and Ecosystem Functioning synthesis and perspectives 294: 102-113.
Moonen, A.C. & Bàrberi, P. (in press): Functional biodiversity: an agroecosystem perspective. Agriculture, Ecosystems and Environment.
Richie, M. & Olff, H. 1999: Spatial scaling laws yield a synthetic theory of biodiversity. Nature 400: 775-560.
Schmid, B., Joshi, J. & Schlapfer, F. 2002: Empirical evidence in biodiversity-ecosystem functioning relationships. In: Functional Consequences of Biodiversity, Vol 33: 120-150.
88
Landscape Management for Functional Biodiversity IOBC wprs Bulletin Vol. 34, 2008
pp. 89-92
The effect of source habitats on arable spider communities: is proximity the most important? Ferenc Samu1, András Horváth2, Éva Szita1, Balázs Bernáth1, Erika Botos1, Kinga Fetykó1
1Plant Protection Institute, HAS, PO. Box 102, Budapest H-1525 Hungary; 2Institute of Ecology and Botany, HAS, Alkotmány Str. 2-4, Vácrátót H-2163 Hungary Abstract: We carried out a landscape experiment in eight 5x5 km quadrates in the Mezőföld region of Hungary. We studied how the proximity of grassland habitat patches, and -at a larger scale- the amount of grassland and other non-crop habitats in the landscape affect natural enemy − in this case spider − populations in arable fields. We found a strong effect of proximity: cereal fields had nearly twice the abundance and species number of spiders if they had a neighbouring grassland habitat patch, as opposed to remote fields in pure agricultural settings. On the other hand, when we compared remote fields across landscape quadrates, we could not show any significant correlation between the ratio of various non-crop habitats in the quadrates and spider community parameters. The study proves the usefulness of the inclusion of natural habitat patches in a landscape, and underlines the importance that they should be interspersed with fields. Key words: landscape ecology, grassland habitat, spiders, Araneae, cereal field, natural enemy Introduction Arable spider communities are characterised by a very specific species composition, with the overwhelming dominance of a handful of agrobiont species (Samu & Szinetár, 2002; Seyfulina, 2005). Agrobiont species can be regarded as moderate specialists of agricultural areas, which might originate typically, but not without exception, from periodically disturbed natural habitats (Szita et al., 2004), but even in those habitats do not attain as high dominances as in agricultural areas. If agrobiont species do not occur, or only with low abundances in natural habitats, then the question arises whether the inclusion of such habitat patches into the agricultural landscape will increase this group of natural enemies within the field. There are a number of case studies, which show that segregated habitat diversification had a relatively small impact on field spider communities (Samu et al., 1999). Small scale studies where various strips were established in the crop show that the penetration capability of spiders from structurally richer areas is very limited (Nentwig, 1989; Kromp & Steinberger, 1992; Huusela-Veistola, 1998; Samu, 2003). At this scale all evidence points to the conclusion that evenly distributed enrichment methods (e.g. mulching, conservation tillage) are more effective in increasing intra-field spider populations (Sunderland & Samu, 2000). Recently a number of landscape scale studies demonstrated that at larger scale the picture might be different, and the presence of various source habitats may positively influence intra-field spider populations (Clough et al., 2005; Hendrickx et al., 2007; Oberg et al., 2007). In the present study we examined whether the presence of grassland patches can influence intra-field spider populations in cereals. For this we compared cereal fields in the
89

direct neighbourhood of grassland patches (close fields) with cereal fields that were far from such source habitats (remote fields). Making comparisons between remote fields we could examine which other landscape scale factors may affect spider communities at a larger scale. Material and methods We carried out our research in the Mezőföld region, Middle-Transdanubia, Hungary. In this region the landscape structure has a widespread, repeated pattern: on the loess plateau (elevation between 100-200 m) intensive agriculture predominates, and there are incised loess valleys, where typically semi-natural and natural vegetation can be found including grassland areas. Most of these are under low-input grassland management schemes (Horváth, 2002). We selected eight 5×5 km landscape quadrates in this area, which were very similar in most respects, but had a gradient in the ratio of non-crop habitats, represented by these loess valleys. Landscape variables for the quadrates were established from own field surveys and the analysis of aerial photographs, and we selected fields and grassland patches on this basis, too. In each quadrate we selected one cereal field (winter barley or winter wheat) which had a common border to a grassland patch (close field) and another field, which was far from grasslands or other patches of natural vegetation (remote field). Management history was obtained from farmers, from which we created the continuous variable “management intensity”. The studies were done in three campaigns, each concentrating on a narrow time window (campaign A: 2006 June, 6 quadrates; B: 2007 April, 7 quadrates; C: 2007 May, 7 quadrates). During a campaign we sampled the grassland, the close and the remote cereal fields of the respective quadrate by 20 suction sampler samples (each sample constituting of 10 0.01 m2 press-downs (Samu et al., 1997). Results and discussion At local scale the proximity of the grassland proved to be the most important factor which determined both the abundance and the species richness of spiders in the fields. We tested this effect by comparing total spider density and species richness in ANOVA models which included campaign, quadrates and proximity as factors, plus management intensity. For both dependent variables proximity proved to be the most significant effect. In the case of species richness timing of the samples was another important factor (Table 1). Considering the magnitude of the effect, if least square means were calculated, then the difference was close to two fold, favouring the close fields both in the case of individuals caught (close / remote mean±SD: 14.8±1.66 / 7.3±1.65), and in the case of number of species (3.7±0.35 / 2.4±0.41). Table. 1. ANOVA analyses (with management intensity as covariate) to show the effect of grassland proximity on spider abundance and species richness. Dependent variables were log-transformed. No. individuals/sample No. of spider species Source d.f. F P F P Landscape quadrate 6 2.71 0.0323 1.49 0.2233 Sampling campaign 2 2.58 0.0932 5.73 0.0090 Management intensity (covariate) 1 3.24 0.0821 0.90 0.3515 Grassland proximity 1 14.94 0.0006 8.34 0.0079
90

It is interesting to see how the species composition of the studied fields differed. As we have pointed out, arable fields have a very distinct species composition. We could see this phenomenon in the present study, resulting in a sharp boundary between grassland and arable fields in the ordination plot (Figure 2). While arable field communities seem to be mixed, if we investigate the relative position of close and remote cereals within one quadrate, then it can be seen that remote fields are systematically below the close fields. This suggests, that although close fields retain their basic arable character, the proximity of a different habitat type exerts an influence on these spider communities, that makes them change in similar ways.
Aba_kg3Aba_losz1
Aba_tg2
Bolcs_kg2
Bolcs_losz2 Igar_kg2
Igar_losz2
Igar_tg2
Lajos_kg1
Lajos_losz1
Lajos_tg1Sarbog_kg1
Sarbog_losz1
Sarbog_tg2
Szekesf_kg1Szekesf_losz1
Szekesf_tg2
Velence_kg2
Velence_losz2
Velence_tg2
Axis 1
Axi
s 2
Treatmentgrasslandclose cerealremote cereal
Figure 1. Detrended Correspondence Analysis on the sampled fields in the space of the spider species caught. Arrows link close and remote fields within the same landscape quadrate. Landscape level comparisons between remote fields were done in order to reveal whether differences between the spider community characteristics of these fields correlate with a set of landscape variables that concern the ratio of various natural habitat types in the quadrate and the level of fragmentation (ratio of grasslands, shrubby areas, plantations, small parcel areas). We studied this relationship with multiple regression by years. None of the landscape variables showed a significant relationship with either spider abundance or species richness. We can conclude that in the present study we showed very robust positive relationship between grassland spider communities and the spiders of neighbouring arable fields. This lets us underline, that grasslands can potentially double spiders in the field, and we can also ascertain that proximity is one important factor, if we want to realize such an outcome. Thus
91

the study proves the usefulness of the inclusion of natural habitat patches in a landscape, and suggests that they should be interspersed with fields to exert the possible largest positive effect on them. Acknowledgements The research was financed by the grants NKFP-6/013/2005 and OTKA No. T04843. We thank the technical help by Zsuzsa Benedicty. References Clough, Y., Kruess, A., Kleijn, D. & Tscharntke, T. 2005: Spider diversity in cereal fields:
comparing factors at local, landscape and regional scales. J. Biogeogr. 32: 2007-2014. Hendrickx, F., Maelfait, J. P., Van Wingerden, W., Schweiger, O., Speelmans, M., Aviron, S.,
Augenstein, I., Billeter, R., Bailey, D., Bukacek, R., Burel, F., Diekotter, T., Dirksen, J., Herzog, F., Liira, J., Roubalova, M., Vandomme, V. & Bugter, R. 2007: How landscape structure, land-use intensity and habitat diversity affect components of total arthropod diversity in agricultural landscapes. J. Appl. Ecol. 44: 340-351.
Horváth, A. 2002: A mezőföldi löszvegetáció términtázati szerveződése (Organization of spatial pattern of loess vegetation in the Mezőföld region) - Synbiologica Hungarica 5. Scientia Kiadó, Budapest.
Huusela-Veistola, E. 1998: Effects of perennial grass strips on spiders (Araneae) in cereal fields and impact on pesticide side-effects. J. Appl. Entomol. 1222: 575-583.
Kromp, B. & Steinberger, K.-H. 1992: Grassy field margins and arthropod diversity: a case study on ground beetles and spiders in eastern Austria (Coleoptera: Carabidae; Arachnida: Aranei, Opiliones). Agric. Ecosyst. Environ. 40: 71-93.
Nentwig, W. 1989: Augmentation of beneficial arthropods by strip management II. Successional strips in a winter wheat field. J. Plant Diseas. Prot. 96: 89-99.
Oberg, S., Ekbom, B. & Bommarco, R. 2007: Influence of habitat type and surrounding landscape on spider diversity in Swedish agroecosystems. Agriculture Ecosystems & Environment 122: 211-219.
Samu, F., Németh, J. & Kiss, B. 1997: Assessment of the efficiency of a hand-held suction device for sampling spiders: improved density estimation or oversampling? Ann. Appl. Biol. 130: 371-378.
Samu, F., Sunderland, K.D. & Szinetar, C. 1999: Scale-dependent dispersal and distribution patterns of spiders in agricultural systems: A review. Journal of Arachnology 27: 325-332.
Samu, F. & Szinetár, C. 2002: On the nature of agrobiont spiders. Journal of Arachnology 30: 389-402.
Samu, F. 2003: Can field-scale habitat diversification enhance the biocontrol potential of spiders? Pest Management Science 59: 437-442.
Seyfulina, R.R. 2005: Epigeic spiders (Arachnida, Aranei) in agroecosystems of Moscow region (species composition, spatial distribution, and seasonal dynamics). Zool. Zhurnal 84: 330-346.
Sunderland, K.D. & Samu, F. 2000: Effects of agricultural diversification on the abundance, distribution, and pest control potential of spiders: a review. Entomol. exp. appl. 95: 1-13.
Szita, É., Samu, F., Fetykó, K. & Szirányi, A. 2004: Testing the origin of agrobiont spiders: spiders in agricultural and natural grassland habitats of the Körös-Maros National Park, Hungary. In: European Arachnology 2002, eds. Samu, F. & Szinetár, C. Budapest, Plant Protection Institute & Berzsenyi College: 319-326.
92

Landscape Management for Functional Biodiversity IOBC wprs Bulletin Vol. 34, 2008
pp. 93-96
Stable isotopes as a tool for food web analysis Stefan Scheu Darmstadt University of Technology, Institute of Zoology, Schnittspahnstr. 3, 64287 Darmstadt, Germany Abstract: Food webs are among the most complex biological structures. Analysing the trophic position of species and the links among them is a prerequisite for understanding the dynamics of food web components and therefore for manipulating their functioning. Stable isotope analysis offers a unique toolbox to get insight into the trophic structure of food webs and the flux of carbon through them. The method is particularly powerful for analysing complex trophic networks with a multitude of generalist feeders, such as food webs in soil. The combination of stable isotope analysis with the analysis of lipids using gas-chromatography-combustion-isotope-ratio-monitoring-mass-spectrometry (GC-C-IRM-MS) is particularly promising for opening the black box of decomposer food webs and for understanding the links between the belowground and aboveground subsystems of terrestrial ecosystems. Key words: food web, stable isotope analysis, lipid analysis, methods, compound specific Introduction Classical biological control employs predators with a narrow food spectrum to control pest species. Using specialist predators has the advantage that they may only or at least predominantly affect the target prey species. This approach was particularly successful to fight alien pest species by introducing specialist predators of their home country. However, the approach has the disadvantage that it is not sustainable, i.e. the predators used as biocontrol agents may not form stable populations and keep pest species below economic threshold levels continuously. A more sustainable and therefore intuitively more advantageous way of fighting herbivore pest species may be to foster predator species present in the field. This may be done by providing predator species with alternative food resources, i.e. by employing generalist predators and get them to switch to prey species if required. For manipulating generalist predator species or communities in this way detailed knowledge on the structure of the food web is necessary. In particular it is necessary to know the prey spectrum of generalist predators and its temporal variation. Knowledge on temporal variations is indispensable since management strategies have to be developed to get the fostered generalist predator species to switch to the target pest species. Food web structure Stable isotope analysis offers a unique way of getting insight into the structure of food webs. Natural variations in 14N/15N ratios provide information on the trophic structure of food webs since 15N concentrations in animal tissue increase with trophic level. Changes in stable isotope ratios are measured using the delta notation with δ15N (‰) = (Rsample – Rstandard)/(Rstandard × 1000) where Rsample and Rstandard represent the 15N-to-14N ratio in samples and standard, respectively.
93

On average, 15N concentrations increase by 3.4 δ units per trophic level (Post, 2002). However, fractionation of 15N may differ, e.g. in herbivores and carnivores (Vanderklift & Ponsard, 2003). Nevertheless, the method is an easy way to get information on the trophic structure of even complex food webs including those in soil (Scheu & Falca, 2000; Ponsard et al., 2000). Another isotope which has been shown to be particularly helpful in identifying sources of carbon in food webs is 13C. In contrast to 15N, the 13C-to-12C ratio differs little between consumers and their diet. This offers the possibility to trace the flux of carbon from food resources differing in 13C signals through food webs. Since 13C values of C3 and C4 plants differ significantly this allows to follow the flux of carbon through food webs after replacement of C3 by C4 plants or vice versa. Using this approach Albers et al. (2006) followed the flux of carbon from maize into the food web of an agricultural field. The study proved that even after more than one year the tissue of virtually all animal taxa investigated, including a number of generalist predators, still consisted to a large extend of carbon from the previous C3 crops. The results suggest that the food web of arable systems to a large extend does not rely on carbon from the current crop species. Rather, the food web substantially builds on carbon from soil organic matter suggesting that decomposer animals play a crucial role for the nutrition of higher level consumers in arable systems. Using a similar approach Oelbermann et al. (2008) found all generalist predators of a meadow to consume prey out of the decomposer system with Collembola being among the most important prey. The combined analysis of 15N-to-14N and 13C-to-12C ratios in both of these studies provided hints on trophic links, i.e. specific predator – prey interactions. However, stable isotope measurements based on bulk predator and prey signals is of limited use for identifying trophic links. The role of detritivore prey for aboveground herbivore control Functioning as alternative prey detritivores may strengthen or weaken herbivore control by generalist predators. Simultaneous presence of decomposer and herbivore species may distract predators from feeding on herbivore species. On the other hand, decomposer prey may contribute to sustain large predator populations and therefore to a continuous and effective control of pest species. Enhancing biological control via increasing the fraction of decomposer prey in generalist predators requires predators to switch to pest prey species if these start building up larger populations (Scheu, 2001).
The growth of pest populations is intricately bound to the development of plants and plant growth triggers soil moisture. Decreasing soil moisture further triggers decomposer animal species to retreat from the soil surface to deeper soil layers for survival and therefore decomposer prey is getting less available for generalist predators above the ground (Figure 1). Switching from decomposer prey to herbivore pest species therefore may be particularly effective in regions where early growth of crops is associated by low precipitation. Using stable isotope technology it has been shown that fostering decomposer prey may indeed increase the control of pest species (Halaj & Wise, 2002; Von Berg et al., 2008). This may even work for pest species of low food quality for generalist predators such as aphids. Since decomposer species are generally limited by the availability of food resources this offers the possibility of engineering the decomposer subsystem via detrital subsidies thereby strengthening biological control by generalist predators.
94

Autumn
Summer drought
WinterSummerSpring
Season
Build up of herbivore populations
Soil moisture
Relative contribution to predator diet
Retreat of decomposersDecomposers
Retreat of decomposersfrom soil surface
HerbivoresDecomposers
Net waterflux
Autumn
Summer drought
WinterSummerSpring
Season
Build up of herbivore populations
Soil moisture
Relative contribution to predator diet
Retreat of decomposersDecomposers
Retreat of decomposersfrom soil surface
HerbivoresDecomposers
Net waterflux
Figure 1. Conceptual model on moisture driven prey switching of generalist predators from decomposers in early spring to herbivores in late spring and summer, and back to prey of the decomposer system in late summer and autumn. Stable isotope analysis is particularly helpful in clarifying the extent and time course of this switching, e.g. by applying litter material from C4 plants with different 13C signal than the growing C3 vegetation. Identifying trophic links using stable isotopes For increasing the power of stable isotope analysis in delineating food web structure it can be combined with other techniques such as fatty acid analysis. This may be particularly useful for opening the decomposer food web in which resources differing in fatty acid patterns are of significant importance, such as fungi, bacteria and plant litter. Dietary fatty acids in part are incorporated into body tissue leading to a lipid pattern in the consumer that reflects the composition of its diet (dietary rooting). This may allow separating food chains based on e.g. fungi and bacteria. Combining fatty acid analysis with stable isotope analysis using gas-chromatography-combustion-isotope-ratio-monitoring-mass-spectrometry (GC-C-IRM-MS) offers a unique way to further open the structure of food webs. The approach may allow overcoming major limitations of bulk stable isotope analysis, i.e. the need in isotopic variation among food sources to assign the consumed diet, and the limitation by the number of available isotopes (when there are n food sources for the consumer, at least n-1 isotopes are necessary to resolve dietary dependencies). Due to the direct incorporation the isotopic composition of fatty acids is similar to the corresponding fatty acids in the diet. In contrast, fatty acids synthesised de novo reflect the δ13C signatures of carbon catabolized from dietary macronutrients. To monitor the trophic transfer of fatty acids biomarkers at natural 13C-to-12C abundance it is particularly tempting to investigate systems in which C3 plants have been
95

replaced by C4 plants or vice versa. Using this approach links between decomposer prey species and generalist predators were investigated in an organically managed arable system where maize has been planted for the first time (Mäder et al., 2002). The results indicated that dominant soil living collembola consume predominantly fungi whereas surface living species mainly feed on plant litter (Haubert et al., 2008). Of the investigated generalist predators only the cursorial spider Pardosa agrestis fed on collembola prey, in particular surface living species. Although results of this study may be of limited use for developing management practices to improve pest control by generalist predators, the study documents the power of new analytical tools for understanding trophic interactions, in particular the role of the decomposer system for the functioning of aboveground predator – prey interactions. Future studies need to apply these tools in agricultural systems differing in management practices and integrate experimental manipulations of predator and prey population densities. Knowledge of factors driving the population dynamics of predator species and on the role of individual prey species for predator performance is necessary to develop management practices which improve conservation biological control. References Albers, D., Schaefer, M. & Scheu, S. 2006: Incorporation of plant carbon into the soil animal
food web of an arable system. Ecology 87: 235-245. Halaj, J. & Wise, D.H. 2002: Impact of a detrital subsidy on trophic cascades in a terrestrial
grazing food web. Ecology 83: 3141-3151. Haubert, D., Birkhofer, K., Fließbach, A., Gehre, M., Scheu, S. & Ruess, L. 2008: Carbon
stable isotope ratios of fatty acids as a tool to investigate soil food webs – a field study using the natural label of C3 and C4 plants, submitted.
Mäder, P., Fließbach, A., Dubois, D., Gunst, L., Fried, P. & Niggli, U. 2002: Soil fertility and biodiversity in organic farming. Science 296: 1694-1697.
Oelbermann, K., Langel, R. & Scheu, S. 2008: The role of prey out of the decomposer system for generalist predators of grassland. Oecologia, in press.
Ponsard, S. & Arditi, R. 2000: What can stable isotopes (delta N-15 and delta C-13) tell about the food web of soil macro-invertebrates? Ecology 81: 852-864.
Post, D.M. 2002: Using stable isotopes to estimate trophic position: Models, methods, and assumptions. Ecology 83: 703-718.
Scheu, S. 2001: Plants and generalist predators as links between the below-ground and above-ground system. Basic Appl. Ecol. 2: 3-13.
Scheu, S. & Falca, M. 2000: The soil food web of two beech forests (Fagus sylvatica) of contrasting humus type: stable isotope analysis of a macro- and a mesofauna-dominated community. Oecologia 123: 285-296.
Vanderklift, M.A. & Ponsard, S. 2003: Sources of variation in consumer-diet δ15N enrichment: a meta-analysis. Oecologia 136: 169-182.
Von Berg, K., Thies, C., Tscharntke, T. & Scheu, S. 2008: Detrital subsidies increase herbivore control in cereal fields by fostering the impact of individual predator species, submitted.
96
Landscape Management for Functional Biodiversity IOBC wprs Bulletin Vol. 34, 2008
pp. 97-100
Implementation of an agri-environmental scheme providing sown boundary strips in an agricultural landscape of northern Germany Horst-Henning Steinmann, Jan Freese, Sebastian Klimek Research Centre for Agriculture and the Environment, University of Goettingen, Am Vogelsang 6, D-37075 Goettingen, Germany Abstract: An agri-environmental scheme (AES) was introduced into a rural county in northern Germany, representing an intensively used arable landscape. Major element of the scheme was the establishment of flowering strips as field boundaries. For farmers, a five years contract period and acceptance of strict contract rules were preconditions to participate. A query, carried out before the AES started, showed that farmers considered boundaries as instrument to compensate for mandatory buffers (e.g. pesticide application). In the third year of the running AES, a GIS analysis of contracted strips revealed that farmers preferentially participated in those communities of the county that where already characterised by a relatively high proportion of landscape structures. Overall, 58.1% of the total strip area was adjacent to watercourses and other structures. Key words: landscape structure, buffer strips, field boundaries, flowering plants, farmers acceptance Introduction Agri-environmental schemes (AES) are important policy measures to improve and maintain environmental quality and ecosystem services in agricultural landscapes. AES are developed and administrated on the level of member states or – in the case of Germany – on the level of federal states. Currently, a huge set of different AES measures are available for voluntary participation of farmers. Measures to improve landscape structure and biodiversity are implemented only in a small amount, whereas measures aiming at improved cropping practice (e.g. implementation of soil conservation techniques) receive more attention by both farmers and authorities (Grajewski, 2005). Hence, there is a need to improve farmers’ attention for enhancement of biodiversity.
Field margins offer a wide range of types improving landscape structures and ecosystem services (Marshall & Moonen, 2002). Sown flower strips offer habitat function for wildlife and feed for insects and herbivore animals. Additionally, they are attractive for farmers because these strips combine set aside elements with proper cropping practice (annual seeding of mixtures). To attract farmers within one of the most intensively used arable regions in Germany for participating in AES, a pilot project was started. This study analyses farmers’ attitudes to the scheme and their decisions for implementation in a landscape context. Materials and methods The project region The rural county of Wolfenbuettel in northern Germany is part of a geographical region under intensive arable use. Soils are originated by loess and allow for high crop yields and good farm profitability. About 50,000 ha utilised arable area (UAA) are cropped with rotations of sugar beet and winter wheat as crops of major importance. Traditionally, the landscape is
97

dominated by arable fields. Other landscape structures, such as grasslands, boundaries and hedgerows are rare. The scheme approach In 2003, the federal state of Niedersachsen (Lower Saxony) started an AES sub topic offering payments for the introduction of flowering stripes into arable landscapes. Purposes of the scheme as outlined by the authority (state ministry for agriculture, forestry and the rural landscape) were: • to establish additional landscape structures, • to establish and enhance ecotones, • to connect isolated biotopes, • to protect, feed and shelter wildlife .
According to detailed contract rules, farmers could participate with parts of their fields. Annual payment was € 540 ha-1. The following rules had to be agreed on: • strips of 3 – 25 m width on arable land adjacent to existing field boundaries, • annual establishment of a seed mixture according to a list of flowering plant species given
as an appendix to contract details (approved agricultural species, no wild flowers), • establishment period from May 15 until October 15, • no agricultural use, no input of fertilisers and pesticides, • no participation of fields that are already left for mandatory set-aside, • mechanical weed control could be carried out in case of heavy weed occurrence. However,
approval of nature conservation authority has to be considered, • contract period of 5 years.
Since there were no former activities within the federal state and hardly within Germany,
the scheme was first launched 2003 in the county of Wolfenbuettel. In this region intensive socio-economic monitoring was carried out and it was scheduled to keep the scheme open for adjustments and improvements. In 2004, the scheme was opened for the whole federal state. Within the project region, intensive publication on the scheme was made by an intermediate institution (a so-called landscape conservation alliance). Data gathering and data analysis The study contains an ex ante survey to analyse farmers attitude towards flowering stripes and an ex post analysis on farmers real decisions to alter landscape structure. Therefore, in 2003 a questionnaire was sent to all farmers of the county running farms of > 15 ha (n = 320) including standardised statements, queries for “school notes” to judge specific items (1: very important, statement fits, I agree; 6: less important, statement does not fit, I disagree) and free space for comments. A return of 70 (= 22 %) was analysed.
In 2006, all contracted strips were mapped and digitalised using ArcGIS (Version 9.2). Further, land cover data were obtained by state authorities. On the basis of five representative rural communities of the county, spatial analyses were carried out. Results According to the ex-ante study, the establishment of uncropped flowering strips by farmers could be motivated by several reasons. Highest ranked statement was the chance to keep buffers to natural habitats, were pesticide spraying is restricted or banned by law within a distance of 5 – 20 m (Figure 1). The purpose of nature conservation was as important as other factors, such as image building or financial reasons. Expected threats due to participation in
98

the scheme were i) weed infestation, ii) bureaucracy and iii) higher likelihood of undergoing a farm check. Some farmers stated that compensation payments were to low.
1 2
Talks to colleagues
Financal aspects
Nature conservation
Quality of surrounding
Compensation formandatory buffers
Imagebuilding
3 4 5 6
1 = very important, 6 = less important
1 2
Talks to colleagues
Financal aspects
Nature conservation
Quality of surrounding
Compensation formandatory buffers
Imagebuilding
3 4 5 6
1 = very important, 6 = less important
Figure 1. Farmers motivations to participate in flower strip schemes (ex ante statements 2003, n = 70). Table 1. Structural characteristics of five rural communities and corresponding contracted flowering strips (county of Wolfenbuettel, 2006). Com-munity
Total area
[ha]
UAA1 [%]
Grasland[%]
Length ofstructures2
[km]
Strips [n]
Total strip area [ha]
Strip area³ [%]
Mean strip area [ha]
A 5943 51 12 99.1 103 79.7 2.6 0.7 B 2543 70 3 70.3 46 9.4 0.5 0.2 C 2481 83 2 54.9 11 1.0 0.1 0.1 D 2071 33 2 21.1 8 2.1 0.3 0.3 E 459 11 0 2.1 0 0.0 0.0 0.0
1 utilised arable area; 2 water courses and hedgerows; ³ total strip area divided by UAA During 2003 and 2006, 41 farmers joined the scheme. Overall, 127 ha of arable land were rendered for flowering strips. Highest number of strips and largest area was established in community A which already has the highest amount of structural elements such as grasslands, hedgerows, water courses etc. (Table 1). Moreover, mean area of strips was highest in this community. Communities with less landscape structures received less participation by farmers. Analysis of the spatial distribution of strips revealed that 58.1% of the strip area can be seen as a buffer to structural elements (35.6% adjacent to rivers and ditches; 22.5% adjacent to other semi-natural habitats). Remaining strip area was established as new landscape structures.
99

Discussion Within Germany, the project region represents a typical intensive arable landscape. Due to high value of the soil, extensive structures are scarce. Normally, share of AES is below average in these regions. In the case of flowering strips, high acceptance by farmers was achieved by intensive publication of an intermediate association (Freese & Steinmann, 2006). Further, the authority in charge was willing to discuss single contract details and provided some changes after the first year of contracts. Following one experimental year, the scheme was applied to the whole federal state and a total of 3800 ha of flowering strips were contracted.
In the project region, farmers were only introduced to the scheme and were not recommended to locate their strips at a certain place. Therefore, spatial distribution of strips can be seen as individual preference. Obviously, those farmers situated in diverse landscapes have more sensitivity and higher acceptance for further improvements than their colleagues working in pure arable landscapes.
In less diverse regions, such as the county of Wolfenbuettel, plant protection regulation requires the compliance with specific distances to be kept from existing landscape structures for many pesticide applications. For this reason, farmers stated ex ante to be interested in laying strips to those places were spraying has to be avoided anyway. However, also a large number of strips were established for other reasons and produce new landscape structures. Thus, flower strips can be considered as an entry level instrument to gain farmers interest in AES. Based on this, further steps of ecosystem improvement can be achieved when best performing farmers are attracted to participate in more ambitious schemes. Acknowledgement The work was funded by Deutsche Bundesstiftung Umwelt, DBU. References Freese, J. & Steinmann, H.H. 2006: Improving the institutional delivery of agri-environmental
schemes via local action groups. In: Sustainable Land Use in Intensively used Agricultural Regions. Landscape Europe, ed. Meyer, B.C.: Alterra report No. 1338, Wageningen, pp. 119-126.
Grajewski, R. 2005: Aktualisierung der Halbzeitbewertung von PROLAND NIEDER-SACHSEN Programm zur Entwicklung der Landwirtschaft und des ländlichen Raumes gem. Verordnung (EG) Nr. 1257/1999. available online:
http://www1.ml.niedersachsen.de/proland/Update_Halbzeitbewertung_Textband/x01_TB_NI.pdf (online 2008, Feb. 15).
Marshall, E.J.P. & Moonen, A.C. 2002: Field margins in northern Europe: their functions and interactions with agriculture. Agriculture, Ecosystems & Environment 89: 5-21.
100

Landscape Management for Functional Biodiversity IOBC wprs Bulletin Vol. 34, 2008
pp. 101-104
Some approaches to natural enemies management Wladimir B. Tshernyshev Department of Entomology, Faculty of Biology, Moscow State University, 119991 Moscow, Russia, E-mail [email protected] Abstract: The sustainability of agroecosystem may be achieved first of all by the management of polyphagous predators and parasites. These arthropods prefer as a food the most abundant victims. Abundance of such arthropods is not depending directly on the abundance of any certain prey. As a result they can stop a pest outbreak in its very beginning. Specialized parasites affect the pest usually too late when the yield loss has already occurred. They also provoke oscillations of abundance instead of stability. The majority of carnivorous and parasitic insects and also spiders, caught in the crop, belong to the complex of pioneer species which inhabits only open places without stable grass community. Such arthropods usually use the field margins as shelters and places for reproduction and development. They are almost absent in catches made in natural stable biotopes far from the field. Thus the majority of natural biotopes can not be a real source of many natural enemies for the field. Only unstable communities are able to supply to the crops with natural enemies. The increase of natural enemies’ abundance may be achieved if some plants are sown along the field margins and on the strips crossing the field. The choice of such plants should be determined by their ability to attract a lot of phytophagans not noxious for crops but which can serve as an additional food for entomophagous insects. Special shelters (for instance, straw banks) on the margins or in the field may be useful for overwintering of natural enemies. The strips and banks also facilitate colonization of the field by the enemies. Key words: natural enemies, herpetobionts, hortobionts, biotopes, agrolandscape, insects, spiders Introduction Our general aim is to create the stable agroecosystems excluding outbursts of pests. The best way to achieve this aim is to make in an agrolandscape optimal conditions for natural enemies and to promote colonization of the crop field by them. Which natural enemies are able to keep the stability of agroecosystem? Accordingly to the ecological theory (Victorov, 1976; Tshernyshev, 1996) there are two types of natural enemies reaction to the increase of prey (host) populations. The first type is the attraction of natural enemies already present in the landscape by the aggregations of the pest (functional response). Such reaction can stop the increase of the pest population and lead to stability of the agroecosystem. The polyphagous predators obtain the control of pests in this case, because their abundance may be relatively constant due to their possibility to switch from one prey to another depending on their abundance. The typical representatives of such predators are many herpetobionts, such as carabid-beetles, ground-spiders and some staphylinid-beetles. Indeed, there is a problem because most of herpetobionts are not able to climb up plants while the majority of pests are real hortobionts. The predacious bugs (Nabidae, Anthocoridae, etc.) are also hortobionts and may be especially promising.
The specialized predators, like ladybirds, have to search actively for their preys. Usually
101

they are good migrants. Many coccinellid-beetles prefer plants where their preys – aphids - are extremely abundant. As a result they often arrive too late when yield has already been lost (Hemptinne et al., 1997).
The second type of reaction to the increase of the pest abundance takes place in the next generation of the natural enemy (numerical response). It is obvious that such a reaction can arise only when the pest population is already abundant. This reaction is normally observed for specialized parasites and the portion of infested hosts may be very high (up to 90% and over). However the reaction appears with a time lag and the yield may be lost to this moment. Moreover, the numerical reaction may result in oscillations of both the host and parasite populations. However the situation approaches the first type if the parasite can use some other hosts. For instance, the parasitic wasps Telenominae (Scelionidae), what are the main enemies of the noxious shield bug Eurygaster integriceps Put. (Scutellaridae), are able to infest the eggs of other bugs mainly from the Pentatomidae family.
Which biotopes can be sources of natural enemies for the field? The majority of predators and parasites remains for many months in the vicinity of the field, i.e. overwintering in grassy margins (Sotherton, 1985; Tshernyshev, 2001). After favourable changes (for instance the arrival of spring) the enemies again go into the field and use it as a hunting territory. It is well known that the biological productivity of arable fields is bigger than in surrounding biotopes. As a result predators and parasites can find there much more food.
Complexes of insect and spider species in arable fields and in natural biotopes are very different (Tshernyshev et al., 2007). The abundance of each species in the natural biotopes is not high and they can not be a significant source of natural enemies for the field. Many species that are very common in the field, are very rare in natural habitats. Such communities are supposed to be very common in glacial period (pleistocen) on the territories where ice had receded and empty places arouse.
Now these communities are adapted to the habitats where the plant complex has been destroyed. Such habitats may arise due to water erosion, trampling down by big animals, on the places of rodents colonies and on the.arable fields. These places are colonized by weeds (pioneer stage of geobotanical succession), phytophagous insects (potential pests) and then their predators and parasites. Only unstable communities can provide the field with a lot of natural enemies.
However open grassy biotopes may be a source of some hortobiont natural enemies for the field, for example, carnivorous bugs and ladybirds. Thus there are two types of inhabitants in the field. The first type is presented by pioneer species which prefer the field territories. The second type is presented by inhabitants of open grassy territory. Usually they can colonize the field but prefer to live in more natural biotopes.
How to create the biotopes rich by additional food for natural enemies? The number of entomophagous arthropods may increase if the populations of their non-pest phytophagous preys are increasing. It is necessary to find both the plants, suitable for such arthropods, and the optimal conditions for intensive reproduction of phytophagans. For example, unbalanced mineral fertilizers are favourable for insect reproduction (Afonina, 1970). Such plants should be sown in the vicinity of the field or around it. Herpetobiont predacious arthropods are able to find also their additional food such as many detrito- and mycophagous arthropods and worms in any rotten substrates, for instance in the banks of
102

straw (Afonina et al., 2006). Some phytophagous insects which feed on crop plants but do not cause essential damage to agricultural production may also serve as additional prey for predators and parasites in the field. There is another way to attract many enemies to the field. Alfalfa crop is rich in many different phytophagous and entomophagous arthropods. After mowing the crop most of alfalfa pests perish but their enemies pass to neighbouring fields (Nijazov, 1992).
The grassy strips crossing the crop field may be a good place for non-pest phytophagous insects. However it is a problem to select plants for such strips which can attract quickly reproducing but specialized phytophagous insects.
The question of optimal plant complex in the field margins is also very important. Bushes and trees are undesirable there. Grassy plant complex typical for the region is maximally stable and inhibits weed propagation. However such complex is not the best for the mass development of phytophagous insects, which can serve as an additional food. As a result the numbers of predators and parasites during the growing season of agricultural plants are insufficient there.
There is another aspect of influence of the field margins and strips on natural enemies. The presence of flowering plants there, as a source of nectar, may be necessary for reproduction of some parasitic wasps. However the same nectar can also positively influence on some pest populations, especially Lepidoptera (Winkler et al., 2006).
How to provide natural enemies with shelters?
The certain number of refuges, which are suitable for overwintering and surviving under other unfavourable situations, should be created. Most arthropods are not able usually to hibernate in the field. Exceptions to the rule are tiny hymenopterous parasites that can overwinter in dry plant debris in the field. Above mentioned straw banks may serve as such.. The field margins may also be used for this purpose. These shelters may be also used by many entomophagous arthropods for their reproduction and development.
It is desirable to keep the strips for many years on the same place independently of crop rotation. Such strips with a thick layer of debris will serve as shelters for natural enemies.
How to facilitate colonization of the field by entomophagous arthropods? Our observations (Tshernyshev, 2001) showed that the entomophagous arthropods are usually not able to spread into the field farther than 200 m from its edge. If the field is big it is necessary to create grassy strips crossing the field. The distance between them should not exceed 200 - 300 m. In such a situation the usual shortage of predators and parasites in the field may be counterbalanced by a large number of entomophagous arthropods spreading into the field from the strips. Mowing of grassy strips may lead to a sharp increase of the number of entomophagous arthropods in the crop. Conclusion Thus we believe that the natural enemies are able to keep the balance in agroecosystems and in the whole agrolandscape. In this case treatment by pesticides will be unnecessary. However such a system of plant protection may be elaborated only on the base of direct study of ecology of all community members in given agrolandscape.
103

References
Afonina, V.M. 1970: Attractiveness and food value of plants for aphids (in Russian). PhD abstract, Moscow State University: 22 pp.
Afonina, V.M., Tshernyshev, W.B. & Solovchenko, O.V. 2008: Can natural biotopes supply the arable field with natural enemies? IOBC wprs Bulletin. This issue.
Afonina, V.M., Tshernyshev, W.B., Timokhov, A.V., Bokhovko, E.E., Seyfulina, R.R. & Sujazov, A.V. 2006: The impact of decaying straw banks on the arthropod complex in an agroecosystem. IOBC wprs Bulletin. 29 (6): 1-4.
Hemptinne, J.-L. & Dixon, A.F.G. 1997: Are aphidophagous ladybirds (Coccinellidae) prudent predators? In: Entomological Research in Organic Agriculture, Academic publishers, eds. Kromp, Meindl & Harris: 151-169.
Nijazov, O.D. 1992: Ecological principles of cotton plant protection from pests (In Russian) Izvestia of the Turkmenian Academy of Sci. Ashhabad: 3-13.
Sotherton, N.W. 1985: The distribution and abundance of predatory Coleoptera overwintering in field boundaries. Ann. Appl. Biol. 106: 17-21.
Tshernyshev, W.B. 1996: Insect Ecology (In Russian). Moscow State University, Moscow: 300 pp.
Tshernyshev, W.B. 2001: Ecological Pest Management (EPM) (In Russian). Moscow State University, Moscow: 132 pp.
Victorov, G.A. 1976: Ecology of entomophagous parasites (In Russian). Nauka, Moscow: 152 pp.
Winkler, K., Wäckers, F. & Van Lenteren, J. 2006: Strategic use of nectar sources to boost biological control. IOBC wprs Bulletin 29 (6): 165-168.
104

Landscape Management for Functional Biodiversity IOBC wprs Bulletin Vol. 34, 2008
pp. 105-108
The dynamics of generalist predators in two different six years crop rotation systems: sources and sinks? F. van Alebeek, R. van den Broek, J.H. Kamstra, W. van den Berg, A. Visser Applied Plant Research, Plant Sciences Group Wageningen UR, P.O. Box 430, 8200 AK Lelystad, The Netherlands (www.ppo.wur.nl/UK) ([email protected]) Abstract: Results from pitfall trapping in two six years crop rotation systems (with and without field margins) were used to explore the question whether field margins act as ‘sink’ or ‘source’ for carabid beetles or (dwarf) spiders. Averages of catches over the growing season indicated that crop type (with all associated variables) is the dominant factor explaining activity-density of carabid beetles and (to a lesser extend) spiders. Results did not demonstrate a clear source or sink function of field margins for carabids, but suggest a sink function for (dwarf) spiders. Key words: Carabids, spiders, spatio-temporal dynamics, farming systems, functional biodiversity Introduction Ground dwelling generalist predators such as carabid beetles and spiders can contribute significantly to the suppression of insect pests in arable crops (Sunderland, 2002; Symondson et al., 2002). Metapopulations in agricultural landscapes are thought to consist of series of local populations, predominantly confined to individual farm fields (Sawyer & Haynes, 1985). At the field level, predator population dynamics are strongly affected by crop rotations and the associated crop management factors (e.g. Den Nijs et al., 1996). Local predator populations within fields may be reduced strongly by agricultural operations (thus become ‘sinks’), and refugia such as field margins, hedges may act as ‘sources’ from which fields are recolonized or supplemented after unfavourable periods. This may have important consequences for the natural control of pest populations (e.g. Bianchi et al., 2006). Only a few recent studies have investigated spatio-temporal dynamics of predator populations at the scale of a whole farm and several years (e.g. Holland et al., 2004, 2005).
This paper presents results of a six year study in two farming systems of 10 ha each. The main question explored here is whether field margins may act as sources or as sinks in space and/or time for different functional groups. Materials and methods Experimental system This study was carried out in Nagele (NL) in two organic farming systems of six crops and 10 ha each as described in Van Alebeek et al. (2003, 2006). We compare a system with a network of perennial field margins surrounding crop fields of different sizes (21% of total surface) with a system with few margins between fields (5%). The crop rotation comprises carrots, potato, grass-clover, Brussels sprouts and summer wheat, and a choice from peas, white cabbage, sugar beets, iceberg lettuce or spinach. Results from the choice crops do not cover all 6 years and were excluded from the analyses. Because replication of the two systems was not possible, a full crop-rotation period is used for statistical analyses.
105

Pitfall trapping During 2001-2006, pitfall traps were used to monitor soil dwelling arthropods in crops and surrounding field margins (Van Alebeek et al., 2003, 2006). Pitfall sampling took place in 70 locations distributed over both systems (3 pitfalls per location, 1.5 m apart). Pitfalls (9.5 cm diameter) were filled with a 4% formaldehyde solution and covered with a plastic lid on a support to shelter them from rain. Trapping occurred from the last week of May until the end of September, or shorter when the crop was harvested. Traps were emptied every two weeks, and catches of the three traps in each location were combined. Catches were sorted and counted in the laboratory into 20 functional groups (mostly at the order or family level). Total catch in six years comprised approx 550,000 arthropods (springtails and mites not included). Of these, carabid beetles (Col.; Carabidae) formed 42% of the catches, and spiders (Araneae; predominantly dwarf spiders, Erigonidae) formed 28% of total catch. Therefore we will focus on these two groups. Data analysis As opposed to the large studies of Holland et al. (2005, 2006) and due to budget limits, we did not use extensive spatial grid patterns of pitfalls, we did not do mark-recapture experiments to assess real population densities (in addition to activity-densities from the pitfall catches) and we did not identify catches to the species level. This strongly limits the possibilities for (spatial) analyses and the conclusions that can be drawn from our data.
Mean activity-density (as numbers caught per trapping location per 14 days, per crop, per field size, per functional group, etcetera) from fields and margins were transformed to the logarithm. Next a mixed analysis was performed on the counts averaged per field and year, with field and year as random terms and crop, location and interaction between crop and location as fixed terms. Differences between means were tested with (paired) t-tests (p=0.05) and means re-transformed for reporting. Different characters indicate significant differences. Results and discussion Given the huge dataset and the many variables involved, we can only summarize some of our results here. Mean activity-density of carabids is generally higher in crops than in the surrounding field margins (Table 1). Thus, in general, field margins (a source of carabids in early spring) do not appear to act as sources nor sinks for carabids during the summer.
Crop type (with its specific structure, coverage, microclimate, food availability and associated agronomic operations) is the most important factor for the activity-density of carabids, more than years or field size (not all data and analyses shown here). Catches of carabid beetles in the large reference fields (with only 5% surface ratio in surrounding field margins) of potatoes and carrots are significantly higher than in the large fields with 21% surrounding field margins (Table 1). Could field margins function as a sink for carabids in these crops?
During the season, about 2 times as many carabids are caught in spring wheat fields as in the surrounding field margins (Table 1). In potato, catches in June are half of the catches in the surrounding margins (seasonal data not shown here). High activity-density in potato and spring wheat seems to ‘spill over’ into the neighbouring field margins, compared to margins surrounding other crops. But high activity-density in one summer does not significantly carry over to the next growing season in the same field (data not shown here).
Results for (dwarf) spider activity-density (Table 1) differ from those of carabid beetles. In 2001 (one year after sowing of margins), mean catches of (dwarf) spiders in field margins were high (up to 350 spiders per location per 14 days) but much lower in subsequent years
106

Table 1. Mean activity-density of Carabid beetles and (dwarf) spiders in crop fields of different sizes and in neighbouring field margins, averaged over 6 years. Means followed by different characters are significantly different.
Mean activity-density (no. / location / 14 days)
Crop Location Carabid beetles (Dwarf) Spiders grass-clover field margins* 36.5 97.4
small fields 27.3 a . . . . . . . 126.6 . . . . . . g medium fields 30.6 a b . . . . . . 64.7 . . . . e f g large fields 42.5 a b c d . . . . 68.7 . . . . e f g reference large fields 47.7 a b c d . . . . 85.2 . . . . . f g
potatoes field margins* 60.3 83.1 small fields 75.2 a b c d e f . . 14.4 a b c . . . . medium fields 36.5 a b c . . . . . 7.4 a b . . . . . large fields 56.6 a b c d e . . . 16.4 a b c . . . . reference large fields 246.3 . . . . . . . h 14.3 a b c . . . .
Brussels Sprouts field margins* 31.4 54.3 small fields 65.4 a b c d e f . . 18.7 a b c d e . . medium fields 142.7 . . . . e f g h 11.2 a b c . . . . large fields 107.2 . . c d e f g h 6.9 a b . . . . . reference large fields 146.0 . . . . . f g h 14.7 a b c . . . .
Carrots field margins* 48.2 74.6 small fields 38.9 a b c d . . . . 11.3 a b c . . . . medium fields 99.7 . . c d e f g h 17.6 a b c d . . . large fields 57.4 a b c d e f . . 5.4 a . . . . . . reference large fields 136.2 . . . . e f g h 17.3 a b c . . . .
Spring wheat field margins* 70.4 79.3 small fields 229.2 . . . . . . g h 33.0 . . c d e f . medium fields 179.9 . . . . . f g h 53.3 . . . d e f g large fields 219.3 . . . . . . g h 30.3 . b c d e . . reference large fields 227.2 . . . . . . g h 52.8 . . . d e f g
Mean 118.66 29.84 Fprob crop < 0.001 < 0.001 Fprob location 0.068 0.355 Fprob crop.location 0.082 0.734
* Means of field margins were not included in the statistical analysis. (means below 100 spiders, Table 1). Catches in carrots, potato and Brussels sprouts were much lower (3x – 5x) than in the surrounding field margins (Table 1). Field size had no influence on activity-densities of (dwarf) spiders. During summer, field margins seem to act as (moderate) sinks for soil-dwelling (dwarf) spiders, probably due to their vegetation structure, microclimate and/or food availability.
Larvae of carabid beetles appear to share the same preferences as spiders for field margins (data not shown). Small staphylinids were exceptionally abundant in spring wheat compared to other crops and to the field margins (data not shown).
Earlier reports on overwintering arthropods showed that in spring, field margins act as sources of predators for the neighbouring crops and during summer, exercise a strong natural control of aphids in wheat and potato crops (Van Alebeek et al., 2006). The data from the
107

spring-summer period of sampling do not show that field margins act as source (or sink) for carabid beetles. But they may act as a sink for spiders in some crops. We will continue to analyse our dataset in search for patterns of arthropod dynamics and factors governing these. The ultimate goal is to define rules of thumb and practical, agronomic and ecological measures that farmers can take in order to stimulate generalist predators for natural suppression of pest outbreaks. Acknowledgements We like to thank our colleagues of Applied Plant Science (PPO-AGV) for their assistance and support in sampling and monitoring. This project is supported by the Ministry of Agriculture, Nature and Food quality, The Hague-NL. References Bianchi, F.J.J.A., Booij, C.J.H. & Tscharntke, T. 2006: Sustainable pest regulation in
agricultural landscapes: a review on landscape composition, biodiversity and natural pest control. Proc. Royal Soc. B 273: 1715-1727.
Den Nijs, L.J.M.F., Booij, C.J.H., Daamen, R., Lock, C.A.M. & Noorlander, J. 1996: Can pitfall trap catches inform us about survival and mortality factors? An analysis of field data for Pterostichus cupreus (Col.: Carabidae) in relation to crop rotation and crop specific husbandry practices. Acta Jutlandica 71: 41-55.
Holland, J.M., Begbie, M., Birkett, T., Southway, S., Thomas, S.R., Alexander, C.J. & Thomas, C.F.G. 2004: The spatial dynamics and movement of Pterostichus melanarius and P. madidus (Carabidae) between and within arable fields in the UK. International Journal of Ecology and Environmental Sciences 30: 35-50.
Holland, J.M., Thomas, C.F.G., Birkett, T., Southway, S. & Oaten, H. 2005: Farm-scale spatio -temporal dynamics of predatory beetles in arable crops. Journal of Applied Ecology 42 (6): 1140-1152.
Sawyer, A.J. & Haynes, D.L. 1985: Spatial-analysis of cereal leaf beetle abundance in relation to regional habitat features. Environmental Entomology 14: 92-99.
Sunderland, K.D. 2002: Invertebrate pest control by carabids. In: The Agroecology of Carabid Beetles, ed. J.M. Holland: 165-214.
Symondson, W.O.C., Sunderland, K.D. & Greenstone, M.H. 2002: Can generalist predators be effective biocontrol agents? Ann. Rev. Entomol. 47: 561-594.
Van Alebeek, F.A.N., Kamstra, J.H., Venhorst, B. & Visser, A.J., 2003: Manipulating biodiversity in arable farming for better pest suppression: which species and what scale? IOBC / WPRS Bull. 26(4): 185-190.
Van Alebeek, F.A.N., Kamstra, J.H., Van Kruistum, G. & Visser, A.J. 2006: Improving natural pest suppression in arable farming: field margins and the importance of ground dwelling predators. IOBC / WPRS Bull. 29(6): 137-140.
108
Landscape Management for Functional Biodiversity IOBC wprs Bulletin Vol. 34, 2008
pp. 109-112
Ecological infrastructure and polycultures to improve natural control of insect pests in cabbage: first year results Rob van den Broek, Frans van Alebeek, Wim van den Berg Applied Plant Research, Plant Sciences Group Wageningen UR, P.O. Box 430, 8200 AK Lelystad, The Netherlands (www.ppo.wur.nl/UK), [email protected] Abstract: Results of a field trial, to test the effects of increased biodiversity around and within fields on the natural suppression of insect pests in cabbage, are presented. We compared insect pests and natural enemies’ densities in a large scale cabbage crop in the Netherlands. Three fields with different ecological infrastructure were created. The first results of this three year project are presented. Key words: mixed cropping, intercropping, cabbage, natural pest control, ecological infrastructure Introduction Modern western agriculture is characterized by large-scale, uniform monocultures. Agro-ecosystems with increased biodiversity around and within crops sustain populations of predators and parasitoids and may contribute to a substantial degree of natural pest control (e.g. Bianchi et al., 2006). Arable fields are covered by crops only part of the year. During the rest of the year, natural enemies have to seek refuge and food in other habitats such as trees, scrubs and grassy vegetations. Organic cabbage production is seriously hampered by several pests and has relatively few remedies to control these. Is it possible to design a polyculture system which is able to suppress these pests in organic cabbage crops significantly? Material and methods Field, border, intercropping In 2007, 2 ha organic cabbage (Brussels sprouts, red, white and pointed cabbage) was planted in mid-May in the Netherlands. Three cabbage fields had different intensities of functional biodiversity. The first field had a mixed annual flower strip with a grassy field margin. Blocks (12 × 250 m each) of four different cabbage crops (Brussels sprouts, red, white and pointed cabbage) were interplanted with strips (3 × 50 m) of Trifolium sp. The second field had a mixed hedgerow (with approx. 10 woody species) and a grassy field margin on one side and was planted with white cabbage (21 × 40 m), intercropped with and without onions (sown mid-May). The third, large field (1.3 ha) was planted with white cabbage only, without intercrops, grass or flower margins. Pests and natural enemies In the Netherlands the main pests in white cabbage are: diamond back moth (Plutella xylostella), small cabbage white (Pieris rapae), cabbage root fly (Delia brassicae), thrips (Thrips tabaci) and cabbage aphid (Brevicoryne brassica). The most important natural enemies, observed on the plants are: spiders (Aranea sp.), gall midges (Cecidomyiidae sp.), lacewings (Chrysoperla sp.), hoverflies (Syrphidae sp.), parasitic wasps (Ichneumonoidae sp.) and ladybeetles (Coccinellidae sp.).
109

At three different dates (6/7, 30/7 and 17/9/2007), pests and natural enemies were counted on 30 cabbage plants/field. By September, red cabbage and pointed cabbage were already harvested. Thrips damage was determined on white cabbage only, at the end of the growing season, on four outer leaves per plant. For comparison of the different cabbage crops, only the first two observation data were used. To analyze the effects of intercropping and borders, all three data of white cabbage were used. The data were analyzed with REML using the statistical package Genstat Windows. When F-prob is smaller than 0.05 statistical differences were established with t-tests at the 5% level. Results Cabbage crops Highest cabbage aphid densities were found in Brussels sprouts, followed by white cabbage. The numbers were 2.4 and 1.0 aphids/plant respectively. In red and pointed cabbage aphids were significantly scarcer. Most caterpillars of P. xylostella were found in white cabbage. Significantly fewer were registered in Brussels sprouts and pointed cabbage (0.77, 0.36 and 0.19 caterpillars/plant respectively). In Brussels sprouts, P. xylostella pupae were significantly more abundant than in white and red cabbage. Of the different natural enemies encountered, only spiders showed significant differences. In red and white cabbage plants more spiders were found than in Brussels sprouts (0.91, 0.81 and 0.37 spiders/plant respectively). Intercropping Comparing the two intercropping systems with the monoculture of white cabbage, no significant differences in pests and natural enemies’ densities were found. Intercropping cabbage with Trifolium sp. or onions compared to monoculture resulted in 1.8, 1.1 or 1.2 pests/plant and 1.6, 1.9 and 1.1 natural enemies/plant. Spiders were the most abundant group of natural enemies encountered on the cabbage plants. Cabbage aphids, caterpillars of diamond back moth and thrips were the most important pests. Intercropping white cabbage with Trifolium sp., onions, or monoculture resulted in 4, 7 or 6% leaf damage caused by thrips. Margins In white cabbage monoculture without margins, cabbage aphids were significantly more abundant than in white cabbage with a mixed annual flower and grassy strip (Figure 1). In white cabbage along a mixed annual flower and grassy margin, significantly more caterpillars of the diamond back moth were recorded than in white cabbage along a hedgerow with a grassy field margin. More pupae of diamond black moth were found along the hedgerow than along the flower strips. Numbers of small cabbage white caterpillars and thrips were not affected by the margins. Of the different groups of natural enemies, only parasitic wasps were significantly influenced by the margins. More parasitic wasps were encountered in white cabbage without than in cabbage with field margins, possibly in response to the higher cabbage aphid densities in the former. Spiders were the most natural enemies found in all three treatments (Figure1). Discussion In 2007, cabbage crops differed in susceptibility to pests. Brussels sprouts were affected heavily, followed by white cabbage. Red and pointed cabbage (crops with a short cultivation period) had the least damage. The type of cabbage crop also affected abundance of the most
110

0.0
0.5
1.0
1.5
2.0
2.5
withoutmargins
flowers andgrassy margin
hedgerow withgrass margin
pest
num
bers
/pla
ntDiamond back moth pupaDiamond back moth caterpillarSmall cabbage white caterpillarCabbage aphid
0.0
0.5
1.0
1.5
2.0
2.5
without margins flowers andgrassy margin
hedgerow withgrass margin
No.
nat
ural
ene
mie
s /p
lant
Parasitic wasps Hover fliesLacewings Gall midgesSpiders
ab
ab
ba
a
b b bab aa a
Figure 1. Field margin effects on pests (left) and natural enemies (right) per white cabbage plant in 2007. Different characters indicate significant differences (t-test, p<0.05) between margin types. important group of natural enemies the spiders. Intercropping (Trifolium sp. or onions) had no significant effect on the pests and the natural enemies in white cabbage.
A mixed annual flower strip with a grassy field margin or a hedgerow with grassy margin reduced the numbers of cabbage aphids in white cabbage with 99 and 74%. Sunderland (2002) reviewed studies on predation impact and reported 28-86% aphid reduction in wheat and 80-88% aphid reduction in potato. In white cabbage with a mixed flower margin, the number of diamond back caterpillars was significantly higher than in cabbage bordered by a hedgerow with grassy margin. Van Alebeek et al. (2006) also found that grassy field margins resulted in higher diamond back moth damage in cabbage, compared to the control system without margins. In cabbage along a hedgerow with a grassy strip, the percentage thrips damage is lower than in cabbage without margins or a flower strip (3, 5 and 7% respectively). Den Belder et al. (2003) found a significant negative effect of the amount of woodlots (height > 2m) in the landscape and Thrips tabaci densities within leek fields. Booij (2003) suggests that when the influx and spread of Thrips tabaci is reduced e.g. by hedges patches this may play a significant role in the dynamics but there are more possibilities as overwintering place and alternative food.
These initial results suggest that populations of pests and natural enemies are influenced by both the ecological infrastructure around and within the field, but also by the cabbage crop. We plan to continue this line of research. Acknowledgements We like to thank our colleagues of Applied plant Science (PPO-AGV) for their assistance and support in sampling and monitoring. This project is supported by the Ministry of Agriculture, Nature and Food quality, The Hague-NL.
111

References Bianchi, F.J.J.A., Booij, C.J.H. & Tscharntke, T. 2006: Sustainable pest regulation in
agricultural landscapes: a review on landscape composition, biodiversity and natural pest control. Proc. Royal Soc. B 273: 1715-1727.
Booij, K. 2003: Dynamics of Thrips tabaci in diversified agro-ecosystems, modeling approach. IOBC Bulletin 26 (4): 19-24.
Den Belder, E., Elderson, J., Schelling, G. & Brink, W.J. 2003: Trips densities in organic leek fields in relation to the surrounding landscapes. IOBC Bulletin 26 (4): 31-36.
Sunderland, K.D. 2002: Invertebrate pest control by carabids. In: The Agroecology of Carabid Beetles, ed. J.M. Holland: 165-214.
Van Alebeek, F.A.N., Kamstra, J.H., Van Kruistum, G. & Visser, A.J. 2006: Improving natural pest suppression in arable farming: field margins and the importance of ground dwelling predators. IOBC/WPRS Bull. 29(6): 137-140.
112

Landscape Management for Functional Biodiversity IOBC wprs Bulletin Vol. 34, 2008
pp. 113-116
Kernel approach for quantifying the spatial extent of the ecosystem service of pest control provided by non-crop habitats in agricultural landscapes W. van der Werf1, P. Goedhart2, F.J.J.A. Bianchi3, H. Baveco4
1Wageningen University, Crop & Weed Ecology Group, P.O. Box 430, 6700 AK Wageningen, The Netherlands; 2 Wageningen University, Biometris, Bornsesteeg 47, 6708 PD Wageningen, The Netherlands; 3CSIRO Entomology, Meiers Road 120, Indooroopilly, QLD 4068, Australia; 4Alterra Green World Research, P.O. Box 47, 6700 AA Wageningen, The Netherlands Abstract: Non-crop habitats in agricultural landscapes provide ecosystem services to agriculture, such as biological pest control by natural enemies and pollination by bees. To estimate which part of existing landscapes can count on substantial services, and which parts cannot, and to design landscapes that take maximum advantage of ecosystem services, it is necessary to estimate the distance over which those services radiate out from the (re)source habitats. Here we propose using a kernel approach to characterize this spatial extent. The kernel is estimated by solving a statistical model that links data on the intensity of biocontrol services at specific target locations in known landscapes (y-variable) to landscape composition around those targets (distance-indexed x-variable). The kernel parameters can thus be estimated from the impact and landscape data. The approach is illustrated with data on biological control of Plutella xylostella in cabbage crops in the Netherlands. The estimated kernels are an indispensible tool in simulations of the spatial distribution of ecosystem services in existing and future landscapes and should help define realistic targets and expectations for landscape-based biological control in field crops. Key words: kernel approach, modelling, sentinel, calibration, prediction Introduction Natural pest regulation is an important ecosystem service with an estimated value of more than 400 billion US $ per year at a world-wide scale (Costanza et al., 1997). Due to the activity of natural enemies, the vast majority of potential arthropod pest species are controlled and do not reach outbreak levels in forest and agro-ecosystems (DeBach & Rosen, 1991). In agricultural landscapes in the temperate zone, the natural pest regulation function is often positively related with the presence of non-crop habitats (Bianchi et al., 2006). These habitats may stimulate natural enemy populations by the provision of (alternative) food sources, hibernation habitat and prey or hosts (Landis et al., 2000). As a consequence, non-crop habitats often serve as reservoirs of natural enemies, which can colonize and suppress herbivore populations in arable fields (Tscharntke et al., 2005).
There is increasing interest in the design of landscapes that maximize biological control as a free “public” ecosystem service, thus helping to make agriculture less dependent on agrochemical inputs. A growing number of empirical studies using a sentinel approach have recently been conducted to measure relationships between biological control and landscape in real landscape settings (Bianchi et al., 2006). Spatially explicit simulation models for natural enemy movement and pest control potential in artificial and real landscapes can help to elucidate how landscape characteristics affect the cost-benefit ratio with respect to the
113

provision of the ecosystem service of biological control (e.g. cost of establishment of field margins versus benefit from enhanced natural pest suppression). However, there is a shortage of reliable data on the process of natural enemy dispersal and the impact on pest populations at the landscape scale (Bianchi et al., 2003; 2004; 2007).
Here we propose a statistical approach to try and estimate the dispersal kernel of pest control potential from observations on the impact of natural enemies at sentinel targets in relation to landscape composition using geographical information systems. Materials and methods Empirical data Second and third instar larvae of the diamond back moth, Plutella xylostella, were placed on experimental Brussels sprout plants in twenty two Brussels sprout fields, dispersed throughout the Netherlands, in July 2006 (Bianchi et al., in press). After two days of exposure in the field, P. xylostella larvae were recovered, dissected and checked for the presence of parasitoid eggs.
Circular landscape sectors within a 5 km radius around each sentinel site were digitized using ArcGIS. The habitat types considered were forest, the area of forest edges, nature (all other natural terrestrial habitats), pasture, agriculture (cereal, maize, beet and potato), horticulture, orchards, nurseries, bulb cultivation, water, urban areas and roads. In addition, the length of forest edges, hedges, channels, tree lines, road verges, dikes and field edges, and the number of solitary trees were assessed. Theory In the kernel approach, the pest control potential or impact at each target is modeled as a sum of contributions from source habitats at different distances from the target. The “amount” of impact contributed by a resource habitat is assumed to be linearly related to its area, while the spatial probability distribution of impact around the source is described by a rotationally symmetric kernel function. Different shapes of kernels were considered; Normal (i.e. Gaussian), Laplace (i.e. rotated negative exponential), and a flexible distribution (Clark et al., 1999) with an extra parameter, which encompasses both the Normal and Laplace distributions, but can also model a kernel with “thick” tails (Kot et al., 1996). The Normal and Laplace kernels are characterized by a single parameter, describing the width, while the more flexible Clark kernel has an additional parameter describing the shape of the distribution. The measured proportion of parasitism at the target is a non-linear function of the total impact, such that parasitism never becomes greater than 1. We tested four different functions to link calculated impact to observed parasitism: (1) simple negative exponential; (2) negative exponential with an intercept parameter; (3) negative exponential with a ceiling parameter, and (4) logistic. The first of these link models has a single parameter; the others have two parameters.
Models were fitted to the data with Genstat, using a binomial error model and quasi-likelihood. The data were entered as number of larvae collected at each site and the number parasitized. The integral for calculating the pest control potential was approximated by employing discrete rings of 100 m width around the target. Source strength at distance r was operationally defined as the total area of forest within the ring at distance r from the target. The analysis focuses on the area of forest edge at different distances from target as explanatory variable.
114

Results Parasitism rates ranged between 4 and 94% and were related to landscape variables at all tested scales, up to 5 km. Univariate analysis using a generalized linear mixed model indicated that parasitism rates were positively related with area of forests at a scale of 0.5, 1 and 5 km, forest edges at a scale of 0.5 and 1 km and road verges at a scale of 0.5 km (Bianchi et al., in press).
The statistical model for estimation of impact kernels converged, resulting in fitted parameters for the kernel as well as for the link function, except when a flexible kernel with unknown shape parameter was used. Deviance of the fitted model was of the same order of magnitude as the deviance of univariate simple regression models fitted by Bianchi et al. (in press) using the same data. This result provides a proof of concept that, indeed, kernels can be estimated from these sentinel data. The lack of model convergence with the flexible kernel model indicates that the shape of the kernel, with thin tails as in the Normal, or thick tails as in the Clark model was not identifiable with the data at hand.
Differences in goodness of fit between models with different link functions were modest. The two models with the best goodness of fit were the negative exponential with an intercept parameter (model 2) and the logistic (model 4). The predictions of impact, resulting from combining any of the kernels with link functions 2 or 4 were similar. There was a sizeable correlation between some of the estimated parameters, e.g. between the width parameter for the kernel and the slope of the relationship between total impact and the proportion of parasitism. Therefore, these parameters are not independently identifiable with the data at hand. Their biophysical meaning should therefore be interpreted with caution. Discussion This paper provides a proof of concept that it is possible to use sentinel data to estimate kernels that characterize the spatial extent of the ecosystem service of pest control around resource habitats in agricultural landscapes. The availability of kernels enables ecological engineers to use landscape models to calculate and predict biological control potential in landscapes with different amounts and distribution of resource habitats (Bianchi & Van der Werf, 2003; 2004; Bianchi et al., 2007). The use of sentinel data to estimate kernels has the advantage that it overcomes the need to manipulate and mark natural enemies to study their dispersal (Schellhorn et al., 2000; Van der Werf et al., 2000). Data collected from sentinels could be more trustworthy because the enemies do not need to be manipulated. When sentinel data are used, it may not be known which enemy was responsible, especially if predation is measured. This is both an advantage and a disadvantage. The advantage is that all predator species are included in the estimation of impact; hence no arbitrary selection is made. The disadvantage is that it may not be found out which predator was responsible. This disadvantage does not apply to parasitoids, however, because these can be reared out and identified. We observe that published and currently ongoing empirical work on the estimation of landscape effects on biological control at sentinel plots can be used to estimate empirically realistic kernels that can then be used to assess the pest suppressiveness of existing landscapes and design pest suppressive landscapes on the computer (Bianchi & Van der Werf, 2003; Van der Werf & Bianchi, 2007; Baveco et al., this volume). References Baveco, J.M., Bianchi, F.J.J.A., Van der Werf, W. & Goedhart, P.W. 2008: Mapping bio-
115
control services provided by non-crop habitats in the agricultural landscape. IOBC-WPRS Bulletin [this volume].
Bianchi, F.J.J.A., Booij, C.J.H. & Tscharntke, T. 2006: Sustainable pest regulation in agricultural landscapes: a review on landscape composition, biodiversity and natural pest control. Proceedings of the Royal Society B: Biological Sciences 273: 1715-1727.
Bianchi, F.J.J.A., Goedhart, P.W. & Baveco, J.M. 2008: Enhanced pest control in cabbage crops near forest in The Netherlands. Landscape Ecology, in press.
Bianchi, F.J.J.A. & Van der Werf, W. 2003: The Effect of the Area and Configuration of Hibernation Sites on the Control of Aphids by Coccinella septempunctata (Coleoptera: Coccinellidae) in Agricultural Landscapes: A Simulation Study. Environmental Entomology 32(6): 1290-1304.
Bianchi, F.J.J.A. & Van der Werf, W. 2004: Model evaluation of the function of prey in non-crop habitats for biological control by ladybeetles in agricultural landscapes. Ecological modelling 171(1): 177-193.
Bianchi, F.J.J.A., Van der Werf, W. & Honĕk, A. 2007: Changes in agricultural land use can explain population decline in a ladybeetle species in the Czech Republic; evidence from a process-based spatially explicit model. Landscape Ecology 22: 1541-1554.
Clark, J.S., Silman, M., Kern, R., Macklin, E. & HilleRisLambers, J. 1999: Seed dispersal near and far: patterns across temperate and tropical forests. Ecology 80 (5): 1475-1494.
Costanza R., d'Arge, R., De Groot, R., Farber, S., Grasso, M., Hannon, B., Limburg, K., Naeem, S., O'Neill, R.V., Paruelo, J., Raskin, R.G., Sutton, P. & Van den Belt, M. 1997: The value of the world's ecosystem services and natural capital. Nature 387: 253-260.
DeBach, P. & Rosen, D. 1991: Biological control by natural enemies, 2nd edition. Cambridge University Press, Cambridge, 440 pp.
Kot, M., Lewis, M.A. & van den Driessche, P. 1996: Dispersal data and the spread of invading organisms. Ecology 77: 2027-2042.
Landis, D.A., Wratten, S.D. & Gurr, G.M. 2000: Habitat management to conserve natural enemies of arthropod pests in agriculture. Annual Review of Entomology 45: 175-201.
Schellhorn, N.A., Siekmann, G., Paull, C., Furness, G. & Baker, G. 2000: The use of dyes to mark populations of beneficial insects in the field. International Journal of Pest management 50 (3): 153-159.
Tscharntke, T., Rand, T.A. & Bianchi, F.J.J.A. 2005: The landscape context of trophic interactions: insect spillover across the crop-noncrop interface. Annales Zoologici Fennici 42: 421-432.
Van der Werf, W. & Bianchi, F.J.J.A 2007: Plaagonderdrukkende landschappen op de computer. Entomologische Berichten 67 (6): 218-222.
Van der Werf, W., Evans, E.W. & Powell, J. 2000: Measuring and modelling dispersal of Coccinella septempunctata in alfalfa fields. European Journal of Entomology 97: 487-493.
116

Landscape Management for Functional Biodiversity IOBC wprs Bulletin Vol. 34, 2008
pp. 117-120
Experimenting with landscape management to control pest populations in viticulture Maarten van Helden1, Guillaume Pain2, Josephine Pithon2, Marie-Anne Simonneau3
1UMR INRA/ENITA Santé Végétale 1065. 1 cours Gal de Gaulle 33175 Bordeaux France, [email protected]; 2Groupe ESA, 55 rue Rabelais, BP 30748, 49007 Angers cedex 01, 3Syndicat des Producteurs de Saumur-Champigny, 25 rue Beaurepaire, 49400 Saumur Abstract: Pest insect distributions were sampled at the landscape scale over three years in the French wine-growing area of Saumur-Champigny (60 km2, 1500 ha of vines) using Tri-Δnglué® traps, which monitor the adult flight periods of all major vine insect pests.
In spite of overall fluctuations in flight periods and captures, the spatial distributions of these insects were strongly correlated between years. The spatial distribution of Lobesia botrana was nearly identical between years (r ≥ 0.9) and was clearly clustered. Similarity in spatial distribution between years was lower but still highly significant for all other species, even for Empoasca vitis which does not overwinter on the vines and which can migrate long distances in summer.
Insect abundance was significantly correlated with a number of both local and landscape-scale land cover variables. The strength of these correlations increased with increasing buffer size, up to 750 m. L. botrana was more abundant in large continuous vine monocultures. E. vitis was more abundant in heterogeneous landscapes including woodlands.
The mechanisms behind these correlations are unknown. In order to see if pest abundance can be influenced experimentally we will introduce semi-natural habitats into areas of vine monoculture where pest insect abundance tends to be high. For example, hedgerow planting will aim to create barriers to pest dispersal and to increase natural enemy abundance by provision of breeding habitat and shelter in winter. Extensive farm management and planting of small patches of either scrub or species-rich grassland might provide ‘stepping stones’ for natural enemies. Such a large scale experimental approach will require the involvement of a diversity of local organisations involved in landscape management. Key words: viticulture, Empoasca vitis, Lobesia botrana, Scaphoideus titanus, Eupoecilia ambiguella, landscape, Farmscaping, France. Introduction Vine plots vary in their vulnerability to the pest insects Lobesia botrana and Eupoecilia ambiguella (Lepidoptera Tortricidae), Empoasca vitis and Scaphoideus titanus (Cicadellidae). These species have a range of different ecological traits: mono to tri-voltine, pure specialist to generalist, sedentary to highly mobile (Stockel, 2000).
Farmers wish to reduce pesticide use. They hope to be able to reduce pest insect abundance through farmscaping practices such as hedgerow planting. Such ecological compensation areas might be able to enhance the beneficial effects of natural enemies (Boller et al., 2004, Van Helden et al., 2004). However, non-vine landscape elements could also provide habitat supplementation (alternative host plants) or complementation (hibernation sites) for pest species, or act as physical barriers to dispersion of insects (Decante & Van Helden, 2006).
The relationships between pest insect relative abundance and local and landscape characteristics was studied for three years in the Saumur-Champigny area. The first year of
117
this study was presented at the 2006 IOBC Landscape workgroup (Van Helden et al., 2006). This paper reports on the 2006 and 2007 observations and the first approach to experimentally test if farmscaping can indeed reduce pest abundance. Material and methods Study sites Over three years, 29 vine plots were sampled throughout the growing season (April to September). Plot size was > 1 ha and minimum spacing between traps was 500 m. Management was entirely left to the owners but was rather homogeneous (Cabernet Franc Variety, planting density, plot age). Insect monitoring Adult insects were trap monitored and larvae were counted three weeks after peak captures as described earlier (Van Helden et al., 2006) using Tri-Δnglué® traps (a yellow delta 2 µg pheromone trap). Second generation larval abundance was not monitored because of insecticide applications. Geographical Information System Land use was defined and digitised, using high-resolution ortho-rectified aerial photographs (BDORTHO, IGN) and GIS software (ARCGIS–ESRI). Two different land cover classifications were used, composed of 3 or 12 habitats. Only the results based on the simple habitat classification are presented here. This first step enabled us to calculate the amount of each land cover type (vine, forest, others) around each trap, in a set of buffers of increasing radius (250, 500, 750, 1000 m). Data analysis Insect abundances were summed within each generation (Lobesia botrana spring adult Generation = LbaG0, first larval generation = LblG1 etc.) and for each year (Lba2005 etc.). These were compared with the plot and landscape variables using Spearman rank correlation coefficients (CC). Results and discussion Insect dynamics and distribution Insect trap samples showed ‘classic’ population dynamics (Figure 1). Insecticide treatments on second generation larvae (tortricids, E. vitis) sometimes interfered with our observations. Trapping levels and flight periods varied between years. Variations between generations within a single year As during 2005 (Van Helden et al., 2006) strong correlations appeared between successive generations and stages of L. botrana for all years (Spearman r ≅ 0.8).
E. vitis often showed significant correlations between immigrating adults (EvaG0) and subsequent larvae (EvlG1) and between G1 and G2 adults. CCs of G1 larvae and adults were nonexistent confirming the hypothesis that many G1 adults migrate (Decante & Van Helden, 2006). E. ambiguella, showed no significant CCs between G0 and G1 but trapping levels were generally low (Figure 1).
118

Insect Trappings / Week Saumur Champigny 2006
18 19 20 21 22 23 24 25 26 27 28 29 30 31 32 33 34 35 39
Week Number
L.bo
tran
a an
d E.
vitis
0
10
20
30
40
Eu.a
mbi
guel
la a
nd S
.tita
nus
L. botrana E. vitis Eu. ambiguella S. titanus120
100
80
60
40
20
0
Insect Trappings / Week Saumur Champigny 2006
18 19 20 21 22 23 24 25 26 27 28 29 30 31 32 33 34 35 39
Week Number
L.bo
tran
a an
d E.
vitis
0
10
20
30
40
Eu.a
mbi
guel
la a
nd S
.tita
nus
L. botrana E. vitis Eu. ambiguella S. titanus120
100
80
60
40
20
0
Figure 1. Example of weekly insect captures on Tri-Δnglué® trap in the Saumur-Champigny area in 2006. Means of 36 traps NB. Lobesia botrana and Empoasca vitis: left axis, Eupoecilia ambiguella and Scaphoideus titanus: right axis. Table 1. Spearman rank correlation coefficients (rs) of total insect capture (data from 29 traps) between three years. Significant values in BOLD (α=0.05, bilateral test).
Insect L. botrana Eu. ambiguella E. vitis S. titanus Year 2005 2006 2007 2005 2006 2007 2005 2006 2007 2005 2006 20072005 1 1 1 1 2006 0.90 1 0.64 1 0.50 1 0.75 1 2007 0.91 0.94 1 0.54 0.64 1 0.41 0.51 1 0.49 0.55 1
Between-year comparisons and correlation with landscape Strong to very strong correlations were found when comparing insect distributions among years expressed as summed trapping levels for each insect (L. botrana, Eu. ambiguella or S. titanus) on all of the 29 plots (Table 1). For E. vitis these correlations are slightly weaker but still significant, even though this species does not overwinter on the vines. Thus each species presents a rather comparable spatial distribution across years, in spite of differences in plot management (including insecticide use).
Since insect distributions were similar across years, correlations with landscape characteristics were the same as reported earlier (Van Helden et al., 2006). Abundance of L. botrana was always positively correlated with the % surface area planted with vines. Immigrating E. vitis (G0) and first generation (G1) adults correlate negatively with this same variable. For spring immigrants (G0), this is probably due to the proximity of hibernation sites (winter hosts) in the nearby vegetation (Decante & Van Helden, 2006). For summer adults (G1) we were unable to identify alternative summer hosts (Van Helden & Decante, 2001, 2002). Long distance passive migration, resulting in homogeneous deposition and subsequent dispersion towards vine plots can also explain higher population levels in plots surrounded by non-habitat.
Correlations in the GIS analysis increased with increasing buffer size, up to approximately 750 metres (Van Helden et al., 2007) indicating that landscape composition has an influence at this scale.
119

Conclusions for landscaping options Landscape management to reduce insect pests should be carefully planned. Since we have shown that insect distributions are influenced by landscape structure at relatively large spatial scales (up to 750 m), it would seem to be important to consider the landscape as a whole when planning new ecological compensation areas. The contradictory responses of L. botrana and E. vitis to landscape composition make it more difficult to predict where semi-natural habitats should be placed or how the should be spatially organised.
Reducing the area directly used for viticulture is clearly not a realistic option. We will therefore concentrate on the management of areas not directly used for production, which represent 5 to 10% of the total area in the Saumur-Champigny appellation. In such areas we can either focus on the creation of small islands of natural habitat or on enhancing connectivity.
Planting hedgerows across large monoculture vineyards could have several effects: (i) fragmentation of habitat patches for pest insects (most likely for L. botrana, and S. titanus) (ii) barrier effects reducing pest colonisation of vine patches (iii) corridor effects for natural enemies and (iv) source effects: hedgerows provide breeding sites or other resources to many organisms including natural enemies and ‘generalist’ pest insects (such as Eu. ambiguella and E. vitis).
Creating small ‘islands’ that might act as ‘stepping stones’ for natural enemies (function iv above) is another option but the proximity needed to avoid isolation of these stepping stones is difficult to estimate. This large scale project clearly exceeds the ‘farmscaping’ scale. Since only 25% of the total area of the Saumur-Champigny area is planted with vines wine growers are not the only land managers involved. At this scale, roadsides, waterways and other existing infrastructures could be candidate ecological compensation areas but this would require an increased awareness on the part of local organisations involved in landscape management. References Boller, E.F., Häni, F. & Poehling, H.M. (Ed). 2004: Ecological infrastructures; ideabook on
functional biodiversity at the farm level - temperate zones of Europe. IOBC/WPRS Commission on Integrated Production Guidelines and Endorsement, 212 pp.
Decante, D. & Van Helden, M. 2006: Population ecology of Empoasca vitis (Goethe) and Scaphoideus titanus (Ball) in Bordeaux vineyards: Influence of migration and landscape. Crop Protection 25 (7): 696-704.
Decante, D. & Van Helden, M. 2007: Spatial and Temporal distribution of Empoasca vitis (Göethe) inside a vineyard plot. Agricultural and Forest Entomology (in press).
Fulchin, E. & Van Helden, 2007: Development of monitoring schedules for grape diseases at regional scale. Proceedings of the IOBC/WPRS Working Group "Integrated Control in Viticulture", Italy 25-28, October, 2007. Bulletin OILB/SROP.
Stockel, J. (Ed.) 2000: Les ravageurs de la vigne. Editions Féret, Bordeaux, pp. 121-129. Van Helden, M. & Decante, D. 2001: The possibilities for conservation biocontrol as a
management strategy against Empoasca vitis. Proceedings of the IOBC/WPRS Working Group "Integrated Control in Viticulture" at Ponte de Lima, Portugal, 2-7 March, 2001. Bulletin OILB/SROP 24 (7): 291-297.
Van Helden, M. & Decante, D. 2002: Les zones écologiques réservoirs (ZER): un moyen pour gérer les ravageurs? 6e Conf. Internat.sur les ravageurs en Agric. AFPP Montpellier: 53-61.
Van Helden, M., Fargeas, E., Fronzes, M., Maurice, O., Thibaud, M., Gil, F. & Pain, G. 2006: The influence of local and landscape characteristics on insect pest population levels in viticulture. In IOBC-meeting 2006 “Working Group: landscape management for functional biodiversity”, 16-19 may. Zurich, Suisse. IOBC/WPRS Bulletin Vol. 29(6): 145-149.
Van Helden, M., Roland, A., Merignac, J.B., Rodriguez San Martin, M. & Valles Jimenez, M.D. 2004: Lutte biologique par conservation en vignoble, le rôle des haies et des zones enherbées. Progrès Agricole et Viticole 122(5): 113- 118.
Van Helden, M., Pain, G. & Pithon, J., 2007: Landscape characteristics influencing pest populations in viticulture. In: Procs. of the IOBC/WPRS Working Group meeting "Integrated Control in Viticulture", at Marsala, Italy, May 2007. Bulletin OILB/SROP (in press).
120

Landscape Management for Functional Biodiversity IOBC wprs Bulletin Vol. 34, 2008
pp. 121-124
Perspectives for functional agro biodiversity in Brussels sprouts Paul van Rijn1, Eefje den Belder2, Janneke Elderson2, Marian Vlaswinkel3, Frans van Alebeek3
1 Netherlands Institute of Ecology (NIOO, Heteren, [email protected]), 2 Plant Research International (PRI, Wageningen), 3 Applied Plant Research (PPO, Lelystad) Abstract: The commercial production of Brussels sprouts generally involves a high input of insecticides. Conservation biological control in this crop is hampered by the diversity of economic pests involved, and by the high economic losses associated with failing pest control. Within the Dutch Functional Agro Biodiversity (FAB) project, other methods of non-chemical pest control have also received attention. One of these methods is the identification and containment of local sources of winter pest propagation. Another method to prevent pests from entering the crop may be the growing trap plants in the field margins. Some possible trap plant species have been identified, but more studies are required to show the feasibility of this method. Finally, monitoring insecticide-free sprout plots with flowering field margins showed that during summer, natural enemies can contribute considerably, although not always sufficient, to the control of cabbage aphids and caterpillars. For cabbage whitefly some natural enemies have been identified, but in 2007 they arrived with too little and too late to have sufficient impact on the fast growing whitefly populations. Key words: cabbage pests, conservation biological control, field margins, trap crops, winter host plants, regional pest control, natural enemies, diamondback moth, cabbage whitefly Introduction In a regional pilot on enhancing natural control in Dutch arable and vegetable cropping, called the Functional Agro Biodiversity (FAB) project (see Van Rijn et al., this volume), the focus was on three crops: wheat, potato and Brussels sprout. In Brussels sprouts the development and adoption of biological control methods are complicated by the high crop value and the number and nature of the pest species involved. The more specific problems and approaches related to this crop are discussed in this paper.
In Brussels sprouts pest species come from a range of insect orders: in our region especially aphids and whiteflies (Brevicoryne brassicae, Myzus persicae, Aleyrodes proletella), moths (Plutella xylostella, Mamestra brassicae), and (root) flies (Delia radicum). In some years, thrips and slugs may also cause significant crop losses. To control these pests (as far as possible) the farmers used to treat the plants with Imidacloprid before planting, and spray the fields 8 or 9 times a year with other insecticides (e.g. Lambda-cyhalothrin and Dimethoate). Within the framework of FAB three approaches have been addressed that may contribute to reduce the amount of insecticides applied: (1) Reducing pest pressure from local winter refuges, (2) trap cropping, and (3) enhancing biological control of pests. Whereas the first approach is discussed in a separate paper by Den Belder et al. (this volume), the other approaches are discussed below. Trap plants for cabbage pests One method to reduce the pest pressure onto a crop is to intercept pest insects on trap plants
121

around the field before entering the crop. In order to develop and test this method, several plant species have been tested in the field as potential trap plants for diamondback moth and cabbage whitefly.
For diamondback moth (P. xylostella) two trap plant species were already known from literature: yellow rocket (Barbarea vulgare) and Indian mustard (Brassica juncea cv scimitar). Field cage studies (Badenes-Perez et al., 2004) have shown that both species are preferred as oviposition substrate over cultivated cabbage. Yellow rocket has the additional advantage of being unsuitable as host plant for the larvae, making it a rare example of a dead-end trap plant.
In the field Indian mustard appeared to be unsuitable due to its short life cycle compared to the growing season of Brussels sprouts. Yellow rocket, on the other hand, remains low during the first year and does not flower before the second year. We did find some Plutella eggs on these plants and only few small larvae, as was expected. Due to experimental problems we were unable to check the impact on pest pressure in the adjacent field, so further studies are required to confirm its suitability as trap crop.
For cabbage whitefly (A. proletella) no studies on trap plants were available yet. The selection of plants to be tested was based on a list of reported host plant species (NPAG, 2001). We selected 10 species distributed over four plant families of which seeds were available. In 2007 each of these 10 species were sown or planted in two 9 m2 meter plots adjacent to an experimental sprouts field.
The well-known host plant, Chelidonium majus, failed to germinate, as well as two other species. From the remaining 7 species the 4 non-cruciferous species and the cruciferous wallflower (Erysimum cheiri) did not attract any whiteflies, despite the high density of whiteflies in the adjacent field. Chinese cabbage, B. campestris var. chinensis, attracted some whiteflies, but only young kale plants, B. oleracea var. acephala, attracted many whiteflies. The latter plant may therefore be an effective trap crop, especially since killing off the pest on this host plant appeared to be feasible: Treating the plants with an experimental insecticide against cabbage whitefly killed 95% of the eggs. Conservation biological control Parasitoids are probably the main natural enemies of cabbage moths and butterflies, whereas (cabbage) aphids are also attacked by the larvae of hoverflies, lacewings and gall midges. As these natural enemies solely feed on sugar sources or pollen during their adult stage, they may benefit from growing suitable flowers in the field margins. Materials and methods Within the FAB project a 3 meter wide annual flower strip was sown adjacent to each target field (see Van Rijn et al., this issue). The flower species were selected for their suitability in providing (floral) food for the natural enemies and the low risk of supporting pests. The mixture included Buckwheat, Borage, Common Vetch, Coriander, Fennel, Cornflower, and Corn Marigold. To match the flowering period with the long growing period of Brussels sprouts the mixture was sown in May and supplemented with short Sunflowers.
The fields were sampled every 3 weeks in a fixed grid at various distances from the edge. At each monitoring row 20 Brussels sprouts plants were inspected, recording the pests and their natural enemies (if possible) per species and life stage. For early detection of diamondback moth, pheromone emitting delta traps were put in and around sprouts fields and checked every 2 weeks. The main results were quickly communicated with the farmers, to
122

help them with pest management decisions. In addition to commercial fields, small experimental sprouts field with field margins have been created where no chemical insecticides were applied after planting, in order to evaluate the impact of natural enemies.
Results and conclusions In the commercial fields a regular treatment with insecticides appeared to be inevitable. In the absence of selective pesticides, this left very little room to benefit from the field margins or from natural pest control in general.
In the experimental fields the numbers of natural enemies (especially hoverflies, gall midges and parasitoids) were, consequently, much higher than in the commercial fields. By the end of August, however, their numbers declined rapidly each year. In the experimental fields cabbage aphid (B. brassicae) levels remained low or at least stable during June, July and August. The numbers per plant fluctuated around 10 and 25 in 2004 and 2005 respectively. In 2007, when the plants were treated with Imidacloprid before planting, the average density was even less that one per plant. However, in all years the populations started to increase exponentially in early September, causing economic damage to the sprouts by November. The resurgence of the cabbage aphids in September when natural enemies, such as hoverflies, virtually disappear, suggests that natural enemies can play an important role in keeping the aphids under control during summer, although not always at a sufficiently low level, when Imidacloprid cannot be applied (see also Van Rijn et al., 2006).
Of all caterpillars, those from diamondback moth were the most numerous, especially in 2006 (when no experimental field was available) and 2007. In all years and months about 50% of the pupae appeared to be parasitized (mainly by Diadegma semiclausum). The experimental field was treated an few times with a Bt product, when the infection tended to surpass the action threshold. Ultimately no economic damage from this species to the sprouts has been observed.
Cabbage whitefly is a growing pest problem in the last five years in the Netherlands. This species seems unaffected by natural enemies, and by any insecticide registered for this crop. Two parasitoids have been identified so far: Encarsia tricolor, which occurred at very low percentages only, and Encarsia inaron, which have been observed in high numbers locally in Belgium only.
Laboratory studies with insects from commercial rearings (Koppert BV) confirmed that most predators are hampered by the wax on the surface the Brussels sprout plants (Eigenbrode, 2004), especially when released by the whiteflies. For the predatory mite Amblyseius swirskii and the bug Orius majusculus their movement and attachment was strongly hampered by the wax. The larvae of the green lacewing Chrysoperla carnea could cope with the wax slightly better and were able to feed on the eggs and nymphs of the whitefly. A proportion of the larvae was even able to develop into adulthood on this prey. The legless larvae of the hoverfly Episyrphus balteatus, are apparently not hampered by the wax at all. These larvae were able to kill many whitefly eggs and some nymphs each day, and to develop into pupae and adults on this diet. Moreover, adult females were triggered to oviposit on plants with whiteflies, this in contrast to clean plants.
Field observations confirm these laboratory studies. Hoverfly eggs and larvae could be found on all sprout plants with high numbers of cabbage whitefly, even when aphids were absent. When some of the larvae were reared to adulthood, they yielded both E. balteatus and Platycheirus peltatus. Eggs and larvae of green lacewings could also be found on these plants. However, their numbers were too low, compared to the fast growing numbers of whitefly, to have a notable impact on this pest.
123

Discussion When using Functional Agro Biodiversity as a means for pest control we can consider not only methods to augment natural enemies, but also methods to diminish pests directly. The reduction of pest refuges that can act as sources of reinfestation is one example at the landscape scale. Trap cropping is another example at the field level.
Implementation of the first method may be difficult as it requires concerted action of various growers in the region. The second method may be applied only after some technical issues have been solved. This require serious studies on e.g. (1) the attractiveness of trap plants relative to the crop at different stages of development, (2) the level of pest reduction within the crop that can be obtained and (3) the type of pest management needed to prevent secondary spread of the pest.
The conservation of natural enemies can only be effective when pesticides that are harmful for natural enemies are not or only incidentally applied. In a crop such as Brussels sprouts, where many pests have to be controlled at the same time, this is a challenging task. When measures at the landscape and farm level to support natural enemies and diminish pest pressure, are effective for some pests only, we may consider the efficient production and release of natural enemies against other pests, as well as the development of more predator-friendly (glossy) cultivars. Acknowledgements The FAB project was financed by the Dutch Ministry of Agriculture, Nature Management, and Food Quality (LNV), the Ministry of Housing, Spatial Planning and the Environment (VROM), the Dutch Horticultural and Agricultural Organisations (Productschap Tuinbouw and Hoofd Productschap Akkerbouw) and the Rabobank NL. References Badenes-Perez, F.R., Shelton, A.M. & Nault, B.A. 2004: Evaluating trap crops for
diamondback moth, Plutella xylostella (Lepidoptera: Plutellidae). Journal of Economic Entomology 97: 1365-1372.
Eigenbrode, S.D. 2004: The effects of plant epicuticular waxy blooms on attachment and effectiveness of predatory insects. Arthropod Structure & Development 33 (1): 91-102.
NPAG (New Pest Advisory Group) 2001: Aleyrodes proletella, brassica whitefly. NPAG Data Sheet [www.pestalert.org].
Van Rijn, P.C.J., Kooijman, J. & Wäckers, F.L. 2006: The impact of floral resources on syrphid performance and cabbage aphid biological control. IOBC/WPRS Bulletin Vol. 29(6): 149-152.
124
Landscape Management for Functional Biodiversity IOBC wprs Bulletin Vol. 34, 2008
pp. 125-128
Functional agro biodiversity in Dutch arable farming: results of a three year pilot Paul van Rijn1, Frans van Alebeek2, Eefje den Belder3, Felix Wäckers1, Jan Buurma4, Jeroen Willemse5, Henny van Gurp6
1 Netherlands Institute of Ecology (NIOO, Heteren, [email protected]), 2 Applied Plant Research (PPO), Plant Sciences Group Wageningen UR (Lelystad), 3 Plant Research International (PRI, Wageningen), 4 Agricultural Economic Institute (LEI, The Hague), 5 DLV Plant bv (Westmaas), 6 LTO-Nederland (The Hague) Abstract: A pilot on 400 ha of Dutch arable farms during 2004-2007 perennial grassy field margins and functional annual flower strips were created on potato and wheat fields. Monitoring information on pests and natural enemies was directly communicated to the farmers to support pest management decisions. Due to the increasing numbers of natural enemies and the gradually reducing peak densities of aphids, the farmers could refrain from insecticide applications against aphids in these crops. The pilot has yielded great public awareness on possibilities for functional agro biodiversity in arable crops. Key words: natural pest control, conservation biological control, field margins, sustainable agriculture, pesticides, agro economy Introduction On initiative of the Dutch farmers organization (LTO) and the two ministries responsible for agriculture and environment, a Functional Agro-Biodiversity (FAB) pilot was started in 2004 on four arable farms in the province of Zuid-Holland. The aim was to increase biological diversity, to enhance natural enemies of pests, and ultimately to reduce the use of pesticides. The pilot was intended to deliver knowledge and practical experience on how to enhance this functional biodiversity without compromising the agro economical conditions of the area (Van Alebeek et al., 2006).
To enhance functional biodiversity, the waterboard and other local institutions were asked to improve the quality and management of semi-natural vegetations on dykes, ditches, road sides and hedgerows. At the field level, project farmers created field margin strips with perennial grasses and/or an annual flower mixture. Moreover farmers were advised to restrain the use of insecticides and to preferentially use selective insecticides that have little effect on the main natural enemies. The impact of these measures on natural enemies and pests were studied during 2005, 2006 and 2007 in wheat, potato and Brussels sprouts. The latter vegetable crop required a somewhat different approach and is discussed in a separate paper (Van Rijn et al., this issue). Functional Agro Biodiversity (FAB) In this FAB pilot the emphasis was on ‘conservation biological control’. Winter habitat and adult food, two resources that are often in short supply for natural enemies in modern, large scale agricultural landscapes were specifically addressed in this large scale field study. As crops are on the field for only a part of the year, natural enemies have to seek refuge in other
125

habitats during the rest of the year. For some lacewings, hoverflies and ladybeetles trees and scrubs are important overwintering sites (Sarthou et al., 2006). The less mobile carabid and staphylinid beetles benefit more from grassy vegetation alongside fields, ditches and canals (Thomas, 2004). Although natural enemies obviously feed on prey during (part of) their life cycle, many species, including parasitoids, hoverflies and lacewings, solely feed on sugar sources or pollen during their adult stage. Field margins can provide these resources, if the right types of flowers are presented (Wäckers et al., 2005). Material and methods Landscape elements The project area consists of four arable farms (400 ha.). Woody landscape elements take up approx. 5% of the project area including Salix spp. vegetation on a river bank, some Populus spp. bushes and several smaller mixed bushes and hedgerows consisting of some 10-15 tree and shrub species. The area is crossed by several dykes, which are partly grazed by sheep or cattle, partly infrequently mown. Grass and riparian vegetations on dykes, road verges, along canals and ditches make up approx. 8% of the project area. All arable fields are largely enclosed by ditches with relatively steep ditch banks. Field margins Two types of field margin strips were created: perennial and annual strips. In spring 2005 10 km of 3 meter wide perennial field margins were created, largely along ditches and connected to the larger network of landscape elements mentioned above. These margins were sown with a mixture of 18 different grasses and forbs (1:1). Each year in April 4 to 5 km of annual flower strips were sown on 8 or 9 different fields. The species of these strips (see results) were selected for their suitability in providing (floral) food for winged natural enemies and the low risk of supporting pests (Wackers et al., 2005). Experimental design and monitoring Each year 3 experimental fields of potato and wheat were selected, if possible with a perennial field margin present. The fields were 400-600 m long and 100-300 m wide. In half of each field annual flower strips were created at one margin and on driving lanes within the field, 75-90 meters apart. In both halves of the fields crop plants were monitored 4-7 times per growing period. Monitoring took place at various distances from the field margin and the annual flowering strips within the field. The numbers of pests and natural enemies were annotated (if possible) per species and life stage. The results were directly communicated with the farmers, to inform their decision making on pest management. Vegetation and flower composition of field margins was determined by quadrate sampling. Flower visiting insects were monitored by direct visual inspection and by sweep net sampling. Ground dwelling predators were sampled by pitfall traps. Results and conclusions Vegetation development and natural enemies in field margins During the project a well balanced mixture of functional plants has been developed for the annual flower strips. It comprises Buckwheat, Coriander, Borage, Cornflower, Fennel and another 4 annual flower species. Sown in early April, it yields field margins lavishly flowering from late May until September. However, the method of sowing and the weather in spring strongly affected weed pressure, flowering time and ground coverage of different
126

species. When the location of annual strips was changed between years, emergence of reseeded plant species sometimes caused weed problems in subsequent crops.
Within the flowering field margins aphidophagous hoverflies were the most abundant natural enemies, followed by lacewings, parasitoids and ladybeetles. The variation in the amount of flowers was clearly correlated with the number of visiting natural enemies.
Carabid beetles are the most numerous ground dwelling predators in pitfall traps, with Pterostichus melanarius as the most common species. Staphylinid rove beetles and spiders each take up about one tenth of the total catch. During summer, annual (flower) margins appear to harbour even more ground beetles than perennial (grassy) margins. Pests and natural enemies in fields In wheat and potato the main pests were aphids (Macrosiphum avenae, Metopolophium dirhodum, Rhopalosiphum padi; or Aphis nasturtii and Macrosiphum euphorbiae). Aphid numbers typically showed a peak in June or July, with natural enemy peaks trailing by several weeks. Eggs and larvae of hoverflies and lacewings and mummies (parasitized aphids) could be observed shortly after the onset of flowering, with the highest numbers in the fields with annual flower strips. Predatory bugs and ladybeetles were observed in the fields at higher aphid densities only.
Aphid densities along perennial field margins tended to be lower than along flower margins or in the field centres in June, but this tendency reversed in July. In potato fields the peak aphid densities were generally lower in the part with flower margins. Excluding ground predators from enclosures resulted in higher numbers of aphids in spring (both in wheat and in potato fields), demonstrating the importance of ground dwelling predators for aphid control.
Over the three years the peak aphid levels showed a clear decline, whereas natural enemy numbers (especially hoverflies) remained stable or increased. This 3-year increase of the predator-to-prey ratio may result from the measures taken to enhance natural enemies, but unfortunately no monitoring data from other areas are available for comparison.
The low pest levels, and their documentation and communication with the farmers, have resulted in a strong reduction in the application of insecticides. In most years participating farmers applied no or very little insecticides in potato and wheat fields, whereas farmers outside the project commonly used one or two applications per year against aphids.
Socio-economic aspects The direct benefit of FAB lies in a reduced application of insecticides. The financial benefits are very limited, as the costs of these pesticides are very low (€ 4-24 per ha) and fungicides still require regular spraying. On the other hand, the 3-meter wide field margins involve costs for seeds (€ 50-60 per km) and a reduction of production area (net loss in wheat or potato: € 250-400 per km). In the absence of product labelling the market value is not affected. For the farmers, field margins are profitable only when compensated by a subsidy, as in the FAB region (i.e. €500 per km). Field margins require less labour than a crop, but a FAB strategy requires additional labour for scouting of pests and natural enemies in the field.
Within the Netherlands, the public awareness of FAB and conservation biological control have been stimulated by open days on the participating farms, by special issues of a farmer’s magazine and a monthly column by a project farmer in the same magazine. A special issue on agro biodiversity of an entomological magazine is now being used in Dutch agricultural education (Van Rijn et al., 2007).
127

Discussion This FAB pilot has yielded practical and scientific information on (1) how to create functional field margins on clay soils, (2) efficient methods of field sampling, (3) the relative importance of different natural enemies for the control of aphids in wheat and potato, and (4) the effects of field margins on natural enemies and aphids in different crops. Secondly, it has shown that FAB measures can be applied on commercial arable farms, and that they result in a reduced need to apply pesticides. Regular monitoring of the pests and natural enemies in the field, and a rapid communication of the results with farmers, are essential for this result. Thirdly, the costs and benefits of FAB measures for the farmer have been assessed. Field margins are economically feasible only when farmers can obtain higher prices for their produce through accreditation schemes or receive compensation from public sources. The communal and environmental services of field margins as part of FAB (e.g. reduction of water pollution, increased biodiversity, recreational value of rural landscapes) may justify such subsidies. Acknowledgements The project is financed by the Dutch Ministry of Agriculture, Nature Management, and Food Quality (LNV), the Ministry of Housing, Spatial Planning and the Environment (VROM), the Dutch Federation of Agricultural and Horticultural Organisations (Productschap Tuinbouw and Hoofd Productschap Akkerbouw) and the Rabobank NL. References Sarthou, J.P., Ouin, A., Arrignon, F., Barreau, G. & Bouyjou, B. 2005: Landscape parameters
explain the distribution and abundance of Episyrphus balteatus (Diptera: Syrphidae). European Journal of Entomology 102: 539-545.
Thomas, M.B. 2004: 'Beetle banks' as refuges for beneficial arthropods in farmland: longterm changes in predator communities and habitat. Agricultural and Forest Entomology 6: 147-154.
Van Alebeek, F., Wiersema, M., Van Rijn, P., Wäckers, F., Den Belder, E., Willemse, J. & Van Gurp, H. 2006: A region-wide experiment with functional agrobiodiversity (FAB) in arable farming in the Netherlands. IOBC/WPRS Bulletin 29(6): 141-144.
Van Rijn, P.C.J., Bruin, J. & Noordijk, J. (Eds.) 2007: Special issue ‘Agrobiodiversiteit - nut en natuur’. Entomologische Berichten 67(6): 1-104 (in Dutch with English summaries).
Wäckers, F.L., Van Rijn, P.C.J. & Bruin, J. (Eds.) 2005: Plant-provided Food for Carnivorous Insects: A Protective Mutualism and its Applications. Cambridge University Press, UK.
128

Landscape Management for Functional Biodiversity IOBC wprs Bulletin Vol. 34, 2008
pp. 129-132
Spatial analysis of greenhouse density in relation to western flower thrips (Frankliniella occidentalis), onion thrips (Trips tabaci) and minute pirate bug (Orius spp.) population in greenhouses Andrea Veres1, Ferenc Tóth1, Szilvia Orosz1, Daniel Kristóf2, Kinga Fetykó3
1Szent István University, Institute. of Plant Prot., Páter K. ut 1., Godollo H-2100 Hungary; 2 Institute of Geodesy, Cartography and Remote Sensing Bosnyák tér 5. Budapest H-1149 Hungary; 3Plant Prot. Institute, Hungarian Academy of Sciences, P.O. Box 102, Budapest H-1525 Hungary Abstract: The thrips species western flower thrips (WFT, Frankliniella occidentalis) and onion thrips (OT, Thrips tabaci) are the key pests of the sweet pepper production in greenhouses. While WFT is an exotic species and can overwinter only in heated greenhouses OT is endemic and is common on the open field vegetation. Surveys were conducted on sweet pepper grown under plastic tunnels in 2005-2006. All greenhouses of the territory were digitised and analysed using GIS. The F. occidentalis population was generally higher in the greenhouses at the inner municipality area, which tendency was shown by raster analysis in 2006. The abundance of WFT was higher in heated tunnels. So the risk of WFT damage is higher in those heated greenhouses, where the other greenhouses as sources are near. On the contrary the T. tabaci population was higher in the greenhouses in rural areas, as shown also by distance analysis and by raster analysis in 2005 and 2006. The onion thrips is endemic, and is common in crops and weeds in open field, so it might colonise the greenhouses from the surrounding plants. There is a competition between WFT and OT, but the data did not prove that the WFT replaces the OT. It depends rather on the initial ratio of the species. At that point the greenhouse density and the surrounding vegetation might have an effect. The Orius did not correlate significantly with the greenhouse density metrics. Key words: GIS, spatial analysis, Frankliniella occidentalis, Thrips tabaci, Orius, sweet pepper Introduction Thrips species, especially the western flower thrips (WFT, Frankliniella occidentalis) and the onion thrips (OT, Thrips tabaci) are the key pests of the sweet pepper production in greenhouses (Tommasini, 2003). While F. occidentalis is an exotic species and can overwinter only in heated greenhouses (Jenser & Tusnádi, 1989) T. tabaci is endemic and common on crops and weeds. The main risk factors of the WFT initial invasion are the heating of the greenhouses, the introduction of individuals through seedlings and the immigration from other greenhouses. On the other hand onion thrips can colonise the greenhouses directly from the surrounding vegetation (Booij, 2003; Belder et al., 2001). There are numerous risk factors which can lead to population increase of both thrips species like agrotechnical practices, treatments, surrounding habitats ect. In conventional production dichlorphos is used, while the integrated pest management allows the use of alternative pesticides (spinosad) and of biological agents (minute pirate bug Orius spp., and predatory mites Amblyseius spp.). Minute pirate bug is common on flowering plants, so it can potentially immigrate in the greenhouses (Bosco et al., 2008). It might depend on the surrounding habitats and host plants (Bosco et al., 2008; Alomar et al., 2006). We aimed to investigate if the increasing greenhouse density has an effect on the population of T. tabaci, F.
129

occidentalis and Orius spp. Material and methods Sampling in sweet paper greenhouses The surveys were conducted on sweet pepper grown under plastic tunnels in the region Jászság (five villages) during 2005-2006. Population dynamics of thrips and minute pirate bug species was observed in a total of 51 greenhouses. 50 pepper flowers were collected three times a year (in June, July, August) at each sampling site. The sites were marked by GPS coordinates. Basic information was recorded about the greenhouses: treatment (chemical, biological), heating (unheated or heated house), field location (at the territory of the village or at rural land). Mapping All the sampled and the non-sampled greenhouses at the territory of the five villages were digitised from a 0.5 m resolution colour digital orthophoto (acquisition date 2005, FÖMI archive) with Esri ArcGIS 9.2. Data Analysis The location parameter was evaluated using Welch test. The other recorded parameters (heating, treatment) were tested also for the better understanding of the interactions. The greenhouse density at the territory of the five villages was evaluated from two points of view. First we summarised the reciprocal distance (d) of each digitised greenhouse from the sampling sites. Then we modified this method by calculating with squared distance values, and weighting with the area of the digitised greenhouses (T), Sum(T*1/d2). Secondly the greenhouse density was estimated independent of the sampling sites. Interpolated surface was generated by using Kernel density. First the digitised greenhouse polygons of the territorry were converted to points (5 m resolution), then interpolated. The estimated values were matched using the spatial join tool to the sampling sites. Then the relation of the insect abundance to these variables was analysed by linear regression. Results and discussion Table 1. Correlation of the WFT and OT abundance to the greenhouse density.
Date Distance Raster F. occidentalis June T. tabaci -0.287* -0.275* F. occidentalis July T. tabaci F. occidentalis
2005
August T. tabaci -0.458*** -0.460*** F. occidentalis 0.332* June T. tabaci 0.326* 0.314* F. occidentalis 0.293* July T. tabaci -0.480*** -0.325* F. occidentalis 0.351*
2006
August T. tabaci -0.373*
* d=0.05, *** d=0.0001
130

The F. occidentalis population was generally higher in the greenhouses at the inner municipality area of the villages, but the difference was not significant (d=0.05). This tendency was shown by raster analysis in 2006 (Table 1). The fact that most of the heated greenhouses are at the inner area of the villages could influence the results. The abundance of WFT was higher in heated tunnels in 2005-2006, but the difference was not significant. So the risk of WFT damage is higher in those heated greenhouses, where the other greenhouses as sources are near. In contrary the T. tabaci population was higher in the greenhouses at the rural land. This tendency was shown also by the distance analysis and by the raster analysis in 2005 and in 2006 (Table 1). The abundance of OT was lower in heated tunnels in both years, but the difference was not significant . The onion thrips is endemic, and is common on crops and weeds in open field, so it might colonise the greenhouses from the surrounding plants. There is a competition between WFT and OT, but the data did not prove that the WFT replaces the OT (Bosco et al., 2008). The result of the competition depends rather on the initial ratio of the species. At that point the greenhouse density and the surrounding vegetation might have an effect. The data did not show any considerable differences neither in the WFT nor in the OT abundance between the chemical treated sites and the sites where commercial Orius spp. adults were released. It means that in both cases sites with low and high infection occurred.
Figure 1. Greenhouse density in two villages (Jászfelsőszentgyörgy, Szentlőrinckáta) and the abundance of F. occidentalis, and T. tabaci in sweet pepper grown in greenhouses in 2005 (June, July, August).
131

The Orius spp. population was higher in the greenhouses where commercial Orius adults were released, but the difference was only significant at the first observation (June 2005) (Mean (Chemical) 0.16; Mean (Released) 2.25, p=0.005) and at the last sampling date (Mean (Chemical) 1.4; Mean (Released) 2.5, p=0.05). Commercial Orius species usually leave the greenhouses (Bosco et al., 2008), but other native Orius species like O. niger, O. majusculus, O. minutus can colonise (Bosco et al., 2008) when no chemical treatments are made. As the data shows, in some cases this colonisation had happened, in others not. This might depend on the surrounding habitats (Bosco et al., 2008; Alomar et al., 2006). The Orius did not correlate significantly with the greenhouse density metrics. Acknowledgements I thank to the Institute of Geodesy, Cartography and Remote Sensing (FÖMI) for providing data, and I also thank to the staff Gergely Maucha, Róbert Pataki for discussing the data analysis. This project is supported by GAK ALAP-00052/2004 Research Grant. References Alomar, O., Gabarra, R., González, O. & Arnó, J. 2006: Selection of insectary plants for
ecological infrastructure in Mediterranean vegetable crops In: Landsc. Manag. For Funct. Biodiv. IOBC wprs Bulletin, Vol.29 (6): 5-8.
Den Belder, E., Elderson, J., Van den Brink, W.J. & Schelling, G. 2001: Effect of woodlots on thrips density in leek fields: a landscape analysis, Agric. Ecosyst. and Env. 91: 139-145.
Booij, K. 2003: Dynamics of Trips tabaci in diversified agro-ecosystems, a modelling approach. In: Landsc. Manag. For Funct. Biodiv. IOBC wprs Bulletin, Vol.26 (4): 19-24.
Bosco, L., Giacometto, E. & Tavella, L. 2008: Colonisation and predation of thrips (Thysanoptera: Thripidae) by Orius spp. (Heteroptera: Anthocoridae) in sweet pepper greenhouses in Northwest Italy. Biological Control 44: 331-340.
Jenser, G. & Tusnádi, C.K. 1989: A nyugati virágtripsz (Frankliniella occidentalis Pergande) megjelenése Magyarországon. Növényvédelem 25 (9): 285-292.
Tommasini, M.G. 2003: Evaluation of Orius spp. For biological control of Francliniella occidentalis (Pergande)(Thisenoptera: Thripidae). Thesis Wageningen University, 215 pp.
132

Landscape Management for Functional Biodiversity IOBC wprs Bulletin Vol. 34, 2008
pp. 133-136
Tracing food source use by nectarivorous insects Felix L. Wäckers Centre for Sustainable Agriculture, Lancaster Environment Centre, Lancaster University, LA1 4YQ, UK Abstract: Many insects depend on exogenous sugar sources, such as nectar and honeydew, as a source of energy. The availability of sugar sources can have a strong impact on spatial and temporal dynamics of nectarivorous insects. Whereas sugar feeding has been recognized as an important element in understanding plant-pollinator, plant-herbivore, and plant-carnivore interactions, we know relatively little about the sugar sources utilized by the latter two insect categories. Here we describe two methods that can be applied to study sugar feeding in insects under field conditions. While our research has primarily focused on parasitic wasps, we have also worked with other nectarivorous arthropods including predators, herbivores, pollinators and haematophagous arthropods of relevance to medical entomology.
As a first method, we investigated whether parasitoids could be durably marked through feeding on sucrose solution spiked with strontium or rubidium, or through feeding on extrafloral nectar from Vicia faba soil-drenched with aqueous trace elements. As a second method, we have developed HPLC sugar analysis to study the sugar profile of individual field collected insects. Based on this sugar profile we can draw conclusions on the individual’s nutritional state, its feeding history and the type of sugar source consumed. These studies have also revealed remarkable differences in the sugar metabolism between insects with implications on how we can read their sugar profile. Key words: nectar, honeydew, trace elements, HPLC, signature sugars Introduction Many arthropods depend on carbohydrate-rich food sources such as (extrafloral) nectar, and honeydew for their development, survival and reproduction. The list of sugar-feeders includes many keystone species such as ants, bees, herbivores and their predators/parasitoids.
The potential fitness benefits of sugar feeding for these arthropods have been established in numerous laboratory studies. Under field conditions, nectarivorous arthropods may exploit various substrates. In addition to floral nectar, their diet may include other sugar sources such as extrafloral nectar, fruits, plant sap, gall secretions, honeydew, Lycaenid dorsal gland secretions, and fungal fluids (Wäckers, 2005). These sugar sources may differ largely with respect to their nutritional suitability and we usually know little about their relative contribution to the diet of sugar feeders. Here we describe two methods that can be used to assess food source use by sugar feeders in the field. Methods for studying food source use in the field Trace elements Elemental labeling is a true internal labeling technique in which a trace element is incorporated into tissues of the labelled animals. Trace elements are often used to mark insects for subsequent release (Hagler & Jackson, 2001). This is analogous to other marking methods used in mark & release studies. An alternative application is the marking of specific
133

food sources in the field to investigate the role of these foods in the diet of insects. In this case insects mark themselves if they feed upon labeled food sources. While this approach primarily addresses food use, it can also be used to study movement and dispersal. Previous studies had shown that parasitoids can be effectively labelled with Rb when they are reared from herbivore hosts fed diets containing this trace element (Hagler & Jackson, 2001). In a subsequent study (Gu et al., 2001) we wanted to address whether we could also achieve (self-) marking through nectar feeding. Laboratory experiments were conducted to investigate the feasibility and efficiency of different methods for trace element labelling of the hymenopteran parasitoid Cotesia glomerata. We concentrated on labelling parasitoids with Strontium (Sr) or Rubidium (Rb) by: (1) feeding adults on sucrose solution spiked with either element; (2) feeding adults on extrafloral nectar from a plant (Vicia faba) soil-drenched with aqueous Sr or Rb. Adding markers to sugar solutions had no effect on the acceptance of food solutions by Cotesia glomerata. Wasps showed a similar feeding response to sucrose solution spiked with either Rb or Sr at different concentrations. Cotesia glomerata had low background levels for both markers (0.43 + 0.26 μg/g for Sr; 0.51 + 0.25 μg/g for Rb). When feeding adults on sucrose solution spiked with 1000ppm of either element, parasitoids subsequently contained 79 + 58 μg/g (Sr) or 286 + 31 μg/g (Rb) (Gu et al., 2001). Background levels of Sr and Rb in the extrafloral nectar of Vicia faba were found to be 0.1 and 0.2 μg/g respectively. The content of Rb in Rb-labelled extrafloral nectar increased to 443.6 and 633.9 μg/g as a result of a single soil-drench with this element at 5000 and 15,000 ppm. In the case of Sr, the labelled extrafloral nectar contained an average of 10.9 and 182.6 μg/g following a single soil-drench with this element at 5000 and 15,000 ppm, respectively. Irrespective of the marking method, Sr content in labelled wasps was persistent and did not decline significantly during the 16 days of the experiment. Due to the transferability of elemental labeling between trophic levels, this technique is particularly suited for studying foraging behaviour and trophic interactions in parasitoids and predators (Jackson, 1991). HPLC sugar analysis Rather than marking sugar sources with trace elements, we can also make use of the fact that sugar sources often contain source-specific compounds. If we can detect these compounds in field collected insects, this can be used to establish consumption of this particular food. One example of such food source identification is the study of honeydew feeding through the detection of honeydew-specific ‘signature sugars’. Honeydew often contains specific sugars that are not or only rarely found in other sugar sources (Heimpel et al., 2004). These di- and oligosaccharides are synthesized by the honeydew producer and are believed to have a primary function in osmotic regulation (Wilkinson et al., 1997).
Due to their high specificity, these honeydew-specific ‘signature sugars’ can be used to establish honeydew-feeding in field collected insects. The most commonly used signature sugar for honeydew is melezitose. This choice is based on the fact that melezitose occurs in substantial amounts in various types of honeydew, while being quite uncommon in other sugar sources. In some cases, the profile of honeydew sugars is specific to the honeydew producing species (Heimpel & Jervis, 2005; Hendrix & Salvucci, 2001) and can be used to distinguish between species of honeydew producers (Figure 1) (Wäckers & Steppuhn, 2003).
To obtain information on the food sources used by parasitoids in the field, we determined the sugar profile of field-collected individuals using High Performance Liquid Chromatography (HPLC). We used cabbage as a model system, focusing on the braconid parasitoids Cotesia glomerata (L.) and Microplitis mediator (Haliday), parasitoids of the large
134

cabbage white (Pieris brassicae (L.)) and the cabbage moth (Mamestra brassicae (L.)) respectively. These species were chosen as they do not engage in host-feeding and thus are strictly dependent on sugar sources for their nutrition. Parasitoids were collected in Brussels sprouts (Brassica oleracea) fields. During the period of the field collections, small populations of the cabbage aphid (Brevicoryne brassicae (L.)) and the cabbage whitefly (Aleyrodes proletella (L.) were present. Honeydew samples from both phloem feeders on B. oleracea were collected to serve as a reference for the interpretation of parasitoid sugar profiles.
Figure 1. HPLC chromatograms of honeydew collected from Brevicoryne brassicae and Aleyrodes proletella feeding on Brussels sprouts [1 - sorbitol; 2- mannitol; 3- trehalose; 4- glucose; 5 - fructose; 6 - sucrose; 7- melezitose; 8 - maltose; 9 - erlose]. B. brassicae honeydew contained significant levels of trehalose and maltose. A. proletella honeydew featured trehalose, melezitose, erlose and high levels of an unidentified sugar (retention time approximately 23 minutes) (Figure 1). The presence of these sugars enabled us to identify honeydew feeding in the Brussels sprouts system, while differences between the two honeydew profiles can even provide an indication as to which honeydew type has been consumed. 80% of all C. glomerata parasitoids and 55% of M. mediator contained sugars that are rarely or never found in nectar, while being prominently present in honeydew of cabbage aphids or cabbage whiteflies (Wäckers & Steppuhn, 2003).
To use signature sugars as an indicator of honeydew feeding, three criteria need to be met: 1) The honeydew in question has to contain one or more phloem-feeder synthesized sugars. 2) The ‘signature sugar’ should not occur in other sugar sources available to the sugar feeder. 3) The insects analysed for honeydew consumption should not be able to produce the signature sugars themselves or carry traces of these compounds from larval stages. These conditions were all controlled for in the above study. However, in subsequent studies using the identical methodology we have found that some other parasitoids, including Diadegma spp. and Aphidius ervi as well as the predators Chrysoperla carnea and Episyrphus balteatus
135

synthesize the trisaccharides melezitose and erlose themselves (Hogervorst et al., 2007; Wäckers et al., 2006). While the parasitoid Binodoxys communis was shown to transfer the trisaccharide raffinose from its host larvae to the adult stage (Wyckhuys et al., 2008). In these instances where the presence of honeydew ‘signature sugars’ as such is not a reliable indicator of honeydew feeding, the latter can often still be reliable detected based on specific sugar ratios (Hogervorst et al., 2007). References Gu, H., Wäckers, F.L., Steindl, P., Günther, D. & Dorn, S. 2001: Different approaches to
labelling parasitoids using strontium. Entomologia Experimentalis et Applicata 99: 173-181.
Hagler, J.R. & Jackson, C.G. 2001: Methods for marking insects: current techniques and future prospects. Annual Review of Entomology 46: 511-543.
Heimpel, G.E. & Jervis, M.A. 2005: An evaluation of the hypothesis that floral nectar improves biological control by parasitoids, In: Plant-Provided Food for Carnivorous Insects: a protective mutualism and its applications, eds. Wäckers, F.L., Van Rijn, P.C.J. & Bruin, J. Cambridge University Press, Cambridge: 267-304.
Heimpel, G.E., Lee, J.C., Wu, Z., Weisser, L., Wäckers, F.L. & Jervis, M.A. 2004: Gut sugar analysis in field-caught parasitoids: adapting methods originally developed for biting flies. International Journal of Pest Management 50: 193-198.
Hendrix, D.L. & Salvucci, M.E. 2001: Isobemisiose: an unusual trisaccharide abundant in the silverleaf whitefly, Bemisia argentifolii. Journal of Insect Physiology 47: 423-432.
Hogervorst, P.A.M., Wäckers, F.L. & Romeis, J. 2007: Detecting nutritional state and food source use in field-collected insects that synthesize honeydew oligosaccharides. Functional Ecology 21: 936-946.
Jackson, C.G. 1991: Elemental markers for entomophagous insects. Southwestern Entomologist Supplement 14: 65-70.
Wäckers, F.L. 2005: Suitability of (extra-) floral nectar, pollen, and honeydew as insect food sources. In: Plant-Provided Food for Carnivorous Insects: a protective mutualism and its applications, eds. Wäckers, F.L., Van Rijn, P.C.J. & Bruin, J. Cambridge University Press, Cambridge.
Wäckers, F.L. & Steppuhn, A. 2003: Characterizing nutritional state and food source use of parasitoids collected in fields with high and low nectar availability. IOBC WPRS Bulletin 26: 203-208.
Wäckers, F.L., Lee, J.C., Heimpel, G.E., Winkler, K. & Wagenaar, R. 2006: Hymenopteran parasitoids synthesize ‘honeydew-specific’ oligosaccharides. Functional Ecology 20: 790-798.
Wilkinson, T.L., Ashford, D.A., Pritchard, J. & Douglas, A.E. 1997: Honeydew sugars and osmoregulation in the pea aphid Acyrthosiphon pisum. Journal of Experimental Biology 200: 2137-2143.
Wyckhuys, K.A.G., Strange-George, J.E., Kulhanek, C.A., Wäckers, F.L. & Heimpel, G.E. 2008: Comparing sucrose, honey and soybean aphid honeydew diets on longevity, gustatory responses, and carbohydrate profiles of Binodoxys communis. Journal of Insect Physiology 54: 481-491.
136