iom #iraq displacement tracking matrix report round ix (25 november 2014)
DESCRIPTION
This report presents an update on the displacement situation in Iraq and provides details of IOM's humanitarian response in the area.TRANSCRIPT
RESPONSE TO THE IDP
CRISIS IN IRAQ 2014
DISPLACEMENT TRACKING MATRIX | DTM
Round IX December 2014
The Displacement Tracking Matrix (DTM) is an International Organization for Migration (IOM) information management tool
that gathers specific information regarding the status and location of internally displaced persons (IDPs) across the country.
DTM data in Iraq is published and disseminated every two weeks.
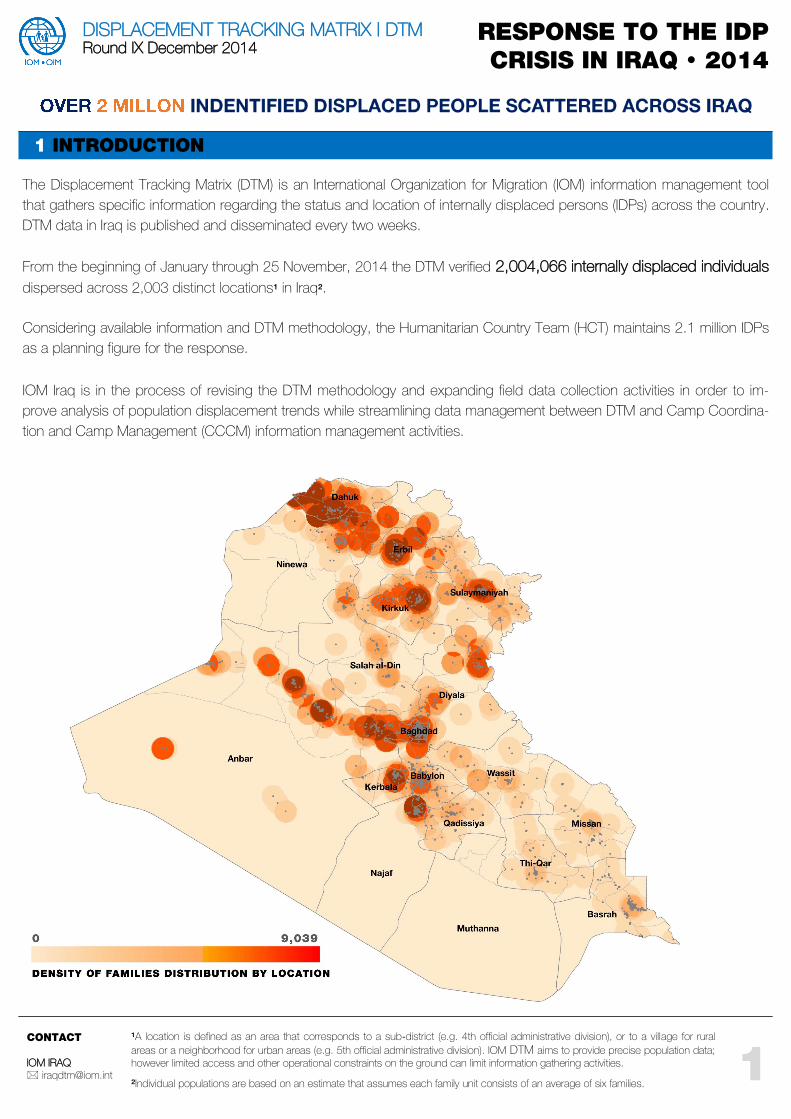
From the beginning of January through 25 November, 2014 the DTM verified 2,004,066 internally displaced individuals
dispersed across 2,003 distinct locations¹ in Iraq².
Considering available information and DTM methodology, the Humanitarian Country Team (HCT) maintains 2.1 million IDPs
as a planning figure for the response.
IOM Iraq is in the process of revising the DTM methodology and expanding field data collection activities in order to im-
prove analysis of population displacement trends while streamlining data management between DTM and Camp Coordina-
tion and Camp Management (CCCM) information management activities.
1 INTRODUCTION
1
CONTACT
IOM IRAQ
¹A location is defined as an area that corresponds to a sub‐district (e.g. 4th official administrative division), or to a village for rural
areas or a neighborhood for urban areas (e.g. 5th official administrative division). IOM DTM aims to provide precise population data;
however limited access and other operational constraints on the ground can limit information gathering activities.
²Individual populations are based on an estimate that assumes each family unit consists of an average of six families.

2
CONTACT
IOM IRAQ
DISPLACEMENT HIGHLIGHTS
IOM Response to the IDP Crisis in Iraq 2014 December 2014
Since the beginning of the year over 2 million individuals have been displaced, fleeing their homes from the
ongoing violence across Iraq.
Several events causing distinct small to medium sized population displacements were observed in the Central North
of Iraq since the beginning of September, resulting from the continued conflict between Iraqi forces and armed
groups (AGs). DTM tracked 36,661 families (estimated 219,966 individuals) being displaced from September 1 to
date throughout seven governorates.
Since the beginning of November, an escalation of violence within Salah al-Din in the sub district of Al Alam has led
to the displacement of thousands of individuals; at least 6,300 individuals are identified to have sought refuge in the
neighboring governorate of Kirkuk (71%), and Samarra district of Salah al Din (29%).
Displacement Timeline IDP Locations IDP Families IDP Individuals
Pre June 2014 783 79,610 477,660
June / July 918 79,106 474,636
August to present 982 175,295 1,051,770
Total Displacement 2014 2,002 334,011 2,004,066
Table 1: Displacement through the year 2014 disaggregated by the dates of three distinct waves
(total individuals are based on a standard household size of six).
Variance in the pre-June, June-July, August, and post 1 September figures may occur between successive reports. Influ-
encing factors include: increased accuracy of displacement tracking, continued identification of previously displaced
groups, and inclusion of data regarding secondary displacements within Iraq.
Displaced populations are methodically identified through a process of assessment, verification and triangulation of data.
IOM continues to closely coordinate with regional and local authorities to maintain a shared, accurate understanding of dis-
placement figures across Iraq.
2 DISPLACEMENT OVERVIEW
The current DTM data identify three major waves of displacement in Iraq in 2014, corresponding to the main conflict offen-
sives which have occurred in the country. These are conventionally categorized by date: pre June, June-July, August 1 to
present, as indicated in Figure 1. Each successive crisis has unique and identifiable displacement dynamics characterized
by the size of the displaced populations, geographical coverage, and frequency of the displacement events.

3
IOM Response to the IDP Crisis in Iraq 2014 December 2014
CONTACT
IOM IRAQ
PRE JUNE CRISIS JUNE - JULY CRISIS
AUGUST TO PRESENT CRISIS
Figure 1 (above): Displacement population trends trough 2014 (IDP individuals).
As indicated in Figure 1, displacement has drastically increased in recent months: from August 1 to present 52% of the
total displaced population has been recorded (175,295 families, estimated 1,051,770 individuals). In order to enhance the
analysis of these displacement movements, Figure 2 below includes another observation period by separating the dis-
placement after August 1 in two components: the first from 1 to 31 August; and the second from September 1 to date.
This analysis supports capturing the impacts of the latest displacements (e.g. after 1 September) across Iraq and does not
intend to categorize a new major wave across the country as it occurred over a larger timespan (e.g. three-month period).
Figure 2 provides a different visual interpretation of the four displacement periods identified namely: pre June; June / July;
August; and September 1 to present. The graph relates these four displacement periods with the governorates of dis-
placement, as well as the latter with the governorate of origin of the displaced populations.
Figure 2 (above): Displaced populations disaggregated by period of displacement, area of displacement and area of origin.³
³ The category of Southern region among the governorate of displacement includes Basrah, Thi Qar, Missan,
Najaf, Wassit, and Qadissiya.

4
IOM Response to the IDP Crisis in Iraq 2014 December 2014
CONTACT
IOM IRAQ
THE FOLLOWING FINDINGS CAN BE INFERRED:
During the pre-June period, 79,610 families (estimated 477,660 individuals) were displaced, 97% (463,603 individu-
als) from Anbar, and 1.8% from Diyala (8,574 individuals). The main governorates of displacement are within Anbar
(66% or 313,536 individuals), to Baghdad (12% or 56,736 individuals), and the Kurdistan Region of Iraq (15% or
72,804 individuals). Anbar was the main governorate affected by the hostilities thus reporting the highest rates of dis-
placement.
Between June and July, the conflict expanded to the governorates of Ninewa, Salah al-Din, and Diyala causing the
displacement of 183,864 (39%), 175,578 (37%), and 48,756 (10%) individuals respectively, out of the total 474,636
individuals displaced during this period. The majority of the population fled to Erbil (17% or 82,668 individuals), Kirkuk
(16% or 73,944 individuals), Najaf (15% or 70,674 individuals), and Sulaymaniyah (11% or 51,300 individuals). The
impacts of these displacement movements were widespread, affecting an even greater number of governorates.
During the month of August, 138,634 families (831,804 individuals) fled as AGs expanded their operations into the
Sinjar area of Ninewa governorate. In fact, 85% of this population (708,054 individuals) were displaced from Ninewa
and 6% (46,632 individuals) from Salah al-Din. The main receiving governorates where Dahuk, hosting 407,526 indi-
viduals (49%), and Erbil (10% or 79,356 individuals). Also, 18% (145,602 individuals) of this population were dis-
placed within Ninewa. This phase of the crisis was the shortest and the most intense, drastically influencing the entire
humanitarian response strategy.
From September 1 to date, 36,661 families (219,966 individuals) have been displaced. While this figure is compara-
tively smaller than other major waves and took place over a three-month period, it is noteworthy to highlight that
these displacements were provoked by a series of distinct but concurrent crises that have broken out in several gov-
ernorates. In particular, the majority of IDPs originated from Ninewa (23% or 51,156 individuals), Kirkuk (22% or
47,562 individuals), Anbar (20% or 44,268 individuals), and Diyala (18% or 39,096 individuals).The displaced popula-
tions fled to a greater number of governorates, including Sulaymaniyah (14% or 30,096 individuals) and Baghdad
(13% or 28,590 individuals). To note that, in some cases, restriction of movements impacted the freedom to seek
protection in third governorates, thus enlarging the proportion of intra-governorate displacement (Kirkuk: 23% or
51,630 individuals; and Anbar: 17% or 38,226 individuals).
Table 2 reports the governorate of origin and of current displacement of the 219,966 individuals verified from Septem-
ber 1 to date. The orange highlights represent populations that have been displaced within their governorate of origin.

5
IOM Response to the IDP Crisis in Iraq 2014 December 2014
CONTACT
IOM IRAQ
Governorate of Origin
Anbar Babylon Baghdad Diyala Erbil Kirkuk Ninewa
Salah al –
Din Total
Govte
of D
isp
lacem
ent
Anbar 38,226 - - - - - - - 38,226
Babylon 276 108 - - - - - - 384
Baghdad 4,878 1,638 3,342 3,750 - 1,440 9,732 3,810 28,590
Basrah 6 - - - - - 24 18 48
Diyala - - - 22,692 - - 24 174 22,890
Kerbala 90 - - - - - - - 90
Kirkuk 150 - - 2,100 - 44,790 - 4,590 51,630
Missan 48 - 42 420 - 90 534 174 1,308
Najaf - - - 66 - 438 3,210 60 3,774
Ninewa - - - - - - 20,778 540 21,318
Qadissiya 534 90 42 312 - 558 2,346 - 3,882
Salah al0Din - - - - 90 - - 14,310 14,400
Sulaymaniyah - 660 858 9,756 - - 11,658 7,164 30,096
Thi0Qar 60 12 - - - 246 750 6 1,074
Wassit - - - - - - 2,100 156 2,256
Total 44,268 2,508 4,284 39,096 90 47,562 51,156 31,002 219,966
Table 2: Total displaced individuals (average family size of 6 members) by governorate of origin
and current governorate of displacement, September 1 to present.
Table 3 shows the total displaced population by governorate of origin and current governorate of displacement from
January to present, 2014.
Governorate of Origin
Anbar Babylon Baghdad Diyala Erbil Kirkuk Ninewa
Salah al-
Din Total
Govern
ora
te o
f D
ispla
cem
ent
Anbar 360,552 90 3,246 132 - - 2,532 7,602 374,154
Babylon 3,282 4,092 954 222 - 18 25,176 894 34,638
Baghdad 62,484 1,920 26,340 9,810 - 1,764 26,586 5,598 134,502
Basrah 1,368 210 384 690 - 1,146 4,128 2,070 9,996
Dahuk 3,630 - - - - - 426,318 - 429,948
Diyala 720 - - 81,828 - - 24 198 82,770
Erbil 42,144 - - 150 28,896 - 74,472 49,962 195,624
Kerbala 4,212 918 360 162 - 120 59,082 660 65,514
Kirkuk 20,658 - 264 3,786 - 57,270 5,484 95,490 182,952
Missan 204 24 192 636 - 948 4,944 774 7,722
Najaf 954 - - 66 - 438 79,830 126 81,414
Ninewa 2,190 - - - - - 170,802 1,272 174,264
Qadissiya 1,038 138 390 684 - 2,226 12,978 360 17,814
Salah al-Din 3,234 - 48 - 90 - - 44,580 47,952
Sulaymaniyah 32,748 660 858 24,900 - - 21,588 47,364 128,118
Thi-Qar 858 108 378 66 - 1,158 5,700 402 8,670
Wassit 456 - 54 702 - 2,100 24,318 384 28,014
Total 540,732 8,160 33,468 123,834 28,986 67,188 943,962 257,736 2,004,066
Table 3: Total displaced individuals (average family size of 6 members) by governorate of origin and current
governorate of displacement, January to present 2014.

6
IOM Response to the IDP Crisis in Iraq 2014 December 2014
CONTACT
The largest displaced population has been received in the governorate of Dahuk with 429,948 displaced individuals seek-
ing refuge in the four districts of Amedi, Zarko, Sumel and Dahuk. The Ninewa governorate districts of Akre and Al Shikhan
received 136,068 individuals. These six districts in Northern Iraq now host 28% of the overall displaced individuals. The
western governorate of Anbar hosts the second largest population (19%) of displaced with 374,154 individuals.
From a regional perspective4, the entire Kurdistan Region of Iraq (including the districts of Akre, Al Shikhan, in Ninewa gov-
ernorate; and Kifri and Khanaqin, in Diyala governorate) hosts 47% of the total displaced populations, an estimated
946,266 individuals; 45% are reported in the Central region, estimated 904,170 individuals5; while 8% of the overall caseload
have sought refuge in the south, 153,630 individuals.
The governorates with the greatest population fleeing their homes continue to be Ninewa with 943,962 individuals and
Anbar with 540,732 individuals.
4The Kurdistan Region includes the governorates of: Dahuk, Sulaymaniyah, and Erbil. The South Region includes: Basrah;
Qadissiya; Missan, Najaf, Thi‐Qar, and Wassit. The Central Region includes the remaining governorates.
5This data excludes the before mentioned districts of Akre and Al Shikhan, Ninewa governorate, and Kifri and Khanaqin in
Diyala governorate, hence differing from the figures reported in Table 3 which indicate the official governorates’ boundaries.
Figure 3: Displacement by Governorate of Origin.
The majority of observed displacement was from one governorate to another, as opposed to displacement within the same
governorate. As many as 1,229,706 individuals, 61% of the overall caseload, fled outside of their governorate of origin.
Figure 4 shows the comparison of intra-governorate displacement and inter-governorate displacement in the 2014 dis-
placed populations.
Figure 4: Comparison of intra-governorate displacement and inter-governorate displacement in 2014.

7
IOM Response to the IDP Crisis in Iraq 2014 December 2014
3 DISPLACEMENT THROUGH THE REPORTING PERIOD
4 SHELTER TYPES
CONTACT
IOM IRAQ
As highlighted above, different displacement trends are observed among the conflict-affected governorates. High rates of
intra-governorate displacements are reported as a consequence to restricted movements and tight border regulations
between governorates, or following localized conflict that caused populations to displace to neighboring districts. Family
and tribal connections coupled with broader ethnic and religious affiliations are also factors that are reported to determine
whether IDPs displace within their original governorates or seek protection in other governorates.
Through the reporting period (9 to 25 November) DTM field staff recorded an additional 35,550 displaced individuals.
Central Region
Through November, ongoing clashes in the area of Al Alam in the district of Tikrit, Salah al-Din, have caused many fami-
lies to flee the area, adding further fluidity to the displacement movements in the region. To date, DTM identified that a
large portion of this group have fled to the neighboring governorate of Kirkuk, with more than 4,500 IDP individuals in the
sub-district of Kirkuk Centre. In Salah al-Din, decreasing IDP figures were monitored in the districts of Tikrit (2,142 individ-
uals) and Baiji (624 individuals), while an increase of 1,800 individuals was observed in the district of Samarra. However,
the size of the displaced populations is believed to be larger in Kirkuk, Salah al-Din, Baghdad and Babylon. DTM will con-
tinue to track and monitor the IDP movement from Al Alam which is not yet fully identified due to access limitations and
the difficultly of tracking families who have not yet been registered.
The governorate of Diyala has witnessed an increase of 4,434 individuals in the area of Ba’quba as clashes persist and
people continue to move within the governorate in search of safer areas.
South Region
Displacement to the southern governorates of Iraq continues, although the number of displaced remains relatively small,
with an additional 2,244 individuals seeking refuge predominantly in the governorates of Basrah (40%), and Najaf (32%).
This group originates from Ninewa (72% of the increase in the south), followed by Anbar (10%), Salah Al-din (10) and Kir-
kuk (9%).
The displaced populations across Iraq have sought refuge within a range of shelter types. Many areas have become bur-
dened with large displaced populations and the increased demand for shelter. As a result, a large number of families are
housed in inadequate and short-term shelter arrangements that are unsuitable for winter weather conditions. This be-
comes particularly concerning in the governorates hosting the largest displaced populations.
People of concern are those who have found refuge in more vulnerable shelter arrangements and are not hosted or living
in hotels or rented accommodations. Figure 5 shows the total population by governorate currently housed in critical shel-
ter arrangements (such as informal settlements, religious buildings, schools, and unfinished buildings) in comparison to
the population staying in camps and in private settings (rented houses, hotels, and with host community).

8
IOM Response to the IDP Crisis in Iraq 2014 December 2014
CONTACT
IOM IRAQ
Figure 5: Shelter arrangement of IDP families in 2014.
Staying with host families or within hotels remains the most common arrangement for IDPs across Iraq as 1,162,644 indi-
viduals (58%) are currently housed within these shelter types; however, a significant proportion of the overall IDP case-
load, 34% (an estimated 674,376 individuals), have sought refuge in critical shelter arrangements.
From the critical shelter types occupied, unfinished buildings are the most common with 302,316 individuals (15%). Fig-
ure 6 shows the percentage breakdown by host governorate for this shelter arrangement.
Figure 6: Occupied unfinished buildings by governorate .

ANNEX 1: DISPLACEMENT TRACKING MATRIX | PRODUCTS
3
IOM Response to the IDP Crisis in Iraq 2014 December 2014
9 http://iomiraq.net/dtm-page
DTM Master Plus Dataset
DTM Dataset 25112014: The excel document provides IDP data on place level; which is the smallest administrative level
(Neighborhood, Hai, Village).Each record represents IDP Families data broken down by Governorate of Origin, Shelter
type and the wave of displacement.
The Excel document also includes a data sheet with summarizing tables for easier reference.
DTM Dynamic Displacement Map
This interactive map reads directly from the DTM, and will be updated every data collection round (i.e. every 2 weeks). In
particular:
Number of IDP families is presented at the national, governorates, districts and location levels;
Different colors represent the density of the IDP population;
Charts on the right side of the map show further analysis on displacement by governorate of origin and
the percentage of IDP families hosted by the different identified shelter types for each of the mentioned geographic
level;
All current and previous DTM results can be found on http://iomiraq.net/dtm-page

3
IOM Response to the IDP Crisis in Iraq 2014 December 2014
ANNEX 2: How Does DTM Work?
10 http://iomiraq.net/dtm-page
The Displacement Tracking Matrix (DTM) tracks and monitors displacement across Iraq. The DTM is adaptable. The
tool provides a continual, up to date snapshot of displacement sites and populations; however, location access and
security limitations must be considered alongside the massive, complex and fluid nature of the current displacement
observed in Iraq.
The DTM methodology is two-fold and contained within a continual cycle that ensures a frequent, up to date snap shot
of displacement:
Stage I: IOM field monitors identify the location of displaced populations through an established network of com-
munity-level key informants.
Stage II: A second more detailed key informant assessment is conducted to gain a better understanding of the sit-
uation at the community level.
IOM key informants include: community leaders, mukhtars, local authorities, and security forces. Additional information
is gathered from government registration data and partner agencies. The two stage process is cyclical, and designed
to effectively track the continued movement trends of displaced populations at the location, district, governorate and
national level as the situation evolves.
When Access is limited
When IOM’s Rapid Assessment and Response Teams (RART) are unable to access a community, the first stage of
DTM is extended while the second stage is put on hold. This is called DTM Stage 1 Plus.
Stage 1 Plus continues to identify the location of displaced populations, and in addition, the assessment collects spe-
cific key information. This includes shelter type occupied, access to services, needs and assistance received. This
method was first deployed in Anbar in early 2014 and later in the central governorates of Iraq as the security situation
rapidly deteriorated in June. Then, it was deployed again in the Kurdish Region of Iraq to address the large displace-
ment caseload.
When Stage 1 Plus is activated the standard procedure of DTM Stage I and Stage II continues throughout the rest of
Iraq where the security situation permits.
The limitations and barriers affecting DTM operations include:
Restrictions of movement
Poor access to certain locations
A sudden massive wave of displacement
Intermittent internet and telephone services
Difficulties in communication with key informants due to prevailing insecurities