iosr page 1 of 8 -...
TRANSCRIPT

For Authors (IOSR-JBM)
Governing Board (IOSR-JBM)
Contents (IOSR-JBM)
Downloads
Contact Us
IOSR Journal of Business and Management
(IOSR-JBM)
IOSR Journal of Computer Engineering
(IOSR-JCE)
IOSR Journal of Electrical and Electronics
Engineering (IOSR-JEEE)
IOSR Journal of Mechanical and Civil
Engineering (IOSR-JMCE)
IOSR Journal of Electronics and
Communication Engineering (IOSR-JECE)
IOSR Journal of VLSI and Signal Processing
(IOSR-JVSP)
IOSR Journal of Environmental Science,
Toxicology and Food Technology (JESTFT)
IOSR Journal of Humanities and Social
Science (IOSR-JHSS)
IOSR Journal of Applied Chemistry (IOSR-
JAC)
IOSR Journal of Applied Physics (IOSR-JAP)
IOSR Journal of Mathematics (IOSR-JM)
IOSR Journal of Pharmacy and Biological
Sciences (IOSR-JPBS)
IOSR Journal of Dental and Medical Sciences
(IOSR-JDMS)
IOSR Journal of Agriculture and veterinary
Science (IOSR-JAVS)
IOSR Journal of Nursing and Health Science
(IOSR-JNHS)
IOSR Journal of Research & Method in
Education (IOSR-JRME)
Other Useful Journals
About IOSR-JBM List of Topics Submit an Article Publication Charges
Volume 8 - Issue 1
Paper Type : Research Paper
Title :Analysis Strategy for Small and Medium Business Development Policy Gresik
District in East Java
Country : Indonesia
Authors : Dr. Rahayu Puji Suci. MS
: 10.9790/487X-0810109
Abstract: The objectives of this research study is the preparation of Policy Development Small and Medium Enterprises (SMEs) Gresik
regency, East Java. The expected outcome of this activity is the completion of SME Development Policy Gresik regency, East Java.
This research included in this type of survey research (survey research). To identify and determine the priority of a number of SMEs are
included in the classification of SMEs seed using Location Quotient (LQ). To identify aspects of strategic management of internal and
external environmental factors using a matrix of external strategy (External Strategic Factors Analysis Summary / EFAS) and internal
strategy matrix factor (Internal Strategic Factors Analysis Summary / IFAS). To analyze the position of SME business unit using the
analysis-Market Growth Matrix (BCG's Growth-Share Matrix) and the Industry Life Cycle Matrix analysis (ADL Matrix) to eliminate
the weaknesses that exist in the analysis-Market Growth Matrix. Furthermore, the synthesis of the above calculation is used to
determine policy formulation and development of SMEs. So from a strategic management analysis results show the development of
small and medium enterprises in Gresik is located in Quadrant I, or should do or Aggressive Growth Strategy supports an aggressive
growth policy (growth oriented strategy).
Keywords: strategy, policy development, SME.
[1] Suwarsono, 1994. Strategic Management: Concepts and Context Analysis Tool, Academy of Management Company UPP YKPN,
Yogyakarta.
[2] Day, George S., 1990, Market Driven Strategy. New York: The Free Press.
[3] Pearce and Robinson, 2007, Strategic Management formulation, emplementation, and control. Mc Graw Hill, Company Inc. New
York.
[4] Erez, M. and F . Kanfer, 1983, " T he R ol e of G oal Accepta nce in Goal S etti ng and T ask P er forma nce", Academy of
Management Journal 8, no.3 (Juli) : 457.
[5] Idrus, M.S. 1997. Strategi : Sebagai Upaya Untuk Meningkatkan Kinerja Organisasi dan Keunggulan Bersaing, Universitas
Brawijaya, Malang.
[6] Singarimbun, Masri dan Sofian Effendi, 1995, Metode Penelit ian Survai , PT. Pustaka LP3ES Indonesia, Jakarta .
[7] Jauch, R. Lawrence and Will iam F. Glueck, 1988, Strategic Management and Business Policy, McGraw-Hill , Inc.
[8] Philip kotler, 1992, Manajemen pemasaran (terjemahan), Prenhallindo, Jakarta.
Paper Type : Research Paper
Title : A Study on Customer Perception towards DTH Services in Coimbatore City
Country : India
Authors : J.Jayashree, A.Sivakumar
: 10.9790/487X-0811014
Abstract: In the buyer's market today, business concerns have to make a lot of efforts to sell their product and establish their survival. It
may be basically due to changes in attitude of consumers towards buying products and changing business world. Every human being is
changing time to time according to the changing trends in every day's life. The biggest changes occurred in consumer products, new and
innovative technology has used to satisfy the consumers. In this content the study is taken up with the various DTH services which have
considerable share in the market. This paper reveals the customer perception towards DTH services in Coimbatore city and it also helps
to analyze the competition exist in the market regarding DTH services. The study is focused on the four kinds of DTH services namely,
Sun direct, TATA sky, Dish TV, Big TV. The task of the study is to know the preference of the users in Coimbatore city among these
various services. Various tools used to analyse the data. The present study reveals that the majority of the respondents prefer to buy sun
IOSR Journal of Business and Management (IOSR-JBM)
WELCOME ABOUT IOSR IOSR JOURNALS CONTACT US
IOSR JOURNALS FOR AUTHORS QUALITY REPORT SPECIAL ISSUE SUBSCRIBE JOURNALS
Citation
Abstract
Reference
Full PDF
Citation
Abstract
Reference
Full PDF
Page 1 of 8IOSR
19/02/2018http://www.iosrjournals.org/iosr-jbm/pages/v8i1.html
direct because of its best picture quality, reasonable price, various kinds of packages and more channels. So the DTH service providers
must pay attention on Customer Service, picture quality, reasonable price rather than other factors to make their business more
successful and satisfy the consumers
Keywords: Awareness, Customer service, DTH channels, schemes etc.,
[1] Dr. S. P. Gupta, Statistical Methods, Sultan Chand & Sons Educational Publishers, New Delhi -2006.
[2] C. R. Kothari. Research Methodology Methods and Techniques. New Age International (P) Ltd. , publishing New Delhi. Ed-2004.
[3] Philip Kotler, Marketing Management The Millennium Edition, Prentice-Hall of India private limited, New Delhi, Ed -2000.
[4] Marketing Managers Handbook-Britt Guess Second Revised Edition-UBS Publishers Distributors Ltd,New Delhi
[5] Indian Journal of marketing
[6] Journal of consumer behavior
[7] Marketing Mastermind
[8] The IUP Journal of Service Marketing
[9] COLLEGE SADHANA Journal for Bloomers of Research
[10] Www. sun direct. com
Paper Type : Research Paper
Title : Corporate Governance in Banking Sector: A Case study of State Bank of India
Country : India
Authors : Dr. Srinivasa Rao Chilumuri
: 10.9790/487X-0811520
Abstract: The issue of corporate governance has come up mainly in the wake up economic reforms characterized by liberalization and
deregulation. Corporate governance has at its backbone a set of transparent relationships between an institution's management its board,
shareholders and other stakeholders. The objective of the research paper is to evaluate the corporate governance practice in banking
sector particularly in the State Bank of India. For evaluation purpose, this research paper is divided into two parts. With the help of
secondary data, this work was analyzed and based on different elements of the practice of corporate governance evaluated in State Bank
of India.
Key terms: Corporate Governance, Banking Sector, State Bank of India.
[1] State Bank of India Annual Reports
[2] Websites : www.onlinesbi.com
[3] V.Leeladhar "Corporate governance in banks" RBI Bulletin December 2004
[4] Dr. Meghashree Agarwal Dadhich : "‟Online banking services: an empirical study of banker‟s and customer‟s awareness about obs
"
ICFAI University, An overview of Banking," Nagarjuna Hills Publication, 2006.
[5] Krishna Lal Pandey, "Development of Banking in India since 1949," Scientific Book Agency, 1968.
Paper Type : Research Paper
Title :The Power Of CSR Strategy To Enhance Marketing Performance (An Empirical
Study on Print-Off Events by Jawa Pos Daily Newspaper)
Country : Indonesia
Authors : Arif Jauhar Tontowi, Djumilah Hadiwidjojo, Surachman, Siti Aisjah
: 10.9790/487X-0812837
Abstract: A distint phenomenon has been found from Jawa Pos daily newspaper as the one with the highest amount of oplaag and
readers (over 1.4 millions) in Indonesia. The company has implemented a CSR (Corporate Social Responsibility) stratety partaking its
marketing strategies. The actual implementation of the strategy, known as "Print-Off Events" which, as the name suggests, means non-
printing activities, consists of being the initiator of the following events: Development Basket Ball League (DBL) Indonesia, Untukmu
Guruku, Smart Riding, Surabaya Green and Clean, NBA Madness by Jawa Pos, and many more.
Keywords: CSR Strategy, Value Creation, Relational Reward, Marketing Performance.
[1] Husted W Bryan and Allen B. David. 2007. Strategic Corporate Social Responsibilty and Value Creation among Large Firms
Lessons from the Spanish Experience, Long Rang Planning, 40, 594-610
[2] Du Shuili, Bhattacharya C. B., Sen Sankar, 2007, Reaping Relational Rewards From Corporate Socisal Responsibility: The Role of
Competitive Positioning, International Journal Of Research in Marketing, 24, 224-241.
[3] Falck Oliver and Heblich Stephan. 2007. Corporate Social Responsibility: Doing Well by Doing Good, Business Horizons, 50, 247-
254.
[4] Henderson C. Joan. 2007. Corporate Social Responsibility and Tourism: Hotel Companies in Phuket, Thailand, after The Indian
Ocean Tsunami, International Journal of Hospitality Management, 26, 228-239.
[5] Malovics Gyorgy, Nagypal Noemi, Sascha Kraus. 2007. The Role of Corporate Social Responsibility in Strong Sustainability, The
Journal of Socio Economics, xxx, xxx-xxx.
[6] Levis Julien. 2006. Adoption of Corporate Social Responsibility Codes by Mulitinational Companies, Journal of Asian Economic,
17, 50-55.
[7] Olsen-Becker L. Karen, Cudmore Andrew B., Hill Paul Ronald. 2005. The Impact of Perceived Corporate Social Responsibility on
Customer Behavior, Journal of Business Research, 59, 46-53
[8] Lako, Andreas. 2008. Kewajiban CSR dan Reformasi Paradigma Bisnis dan Akuntansi, Usahawan Manajemen Indonesia, No. 06
Th XXXVII, Jakarta.
[9] Indarti Sri. 2010. Pengaruh Tanggungjawab Sosial (Corporate Social Responsibility) dan Budaya Organissi Terhadap Kepuasan
Kerja dan Kinerja Bisnis: Studi Pada BUMN dan BUMD di Provinsi Riau, Disertasi Program Doktor Ilmu Ekonomi, Kekhususan
Citation
Abstract
Reference
Full PDF
Citation
Abstract
Reference
Full PDF
Page 2 of 8IOSR
19/02/2018http://www.iosrjournals.org/iosr-jbm/pages/v8i1.html
Manajemen PPS Univ. Brawijaya, Malang
[10] Kottler, Philip. 2003. Marketing Management, Pearson Education Inc, Upper Saddle River, New Jersey, USA.
Paper Type : Research Paper
Title : Analysis Of Traditional Market Development Strategy In The District Sidoarjo.
Country : Indonesia
Authors : Dr. PRIYONO, MM.
: 10.9790/487X-0813845
Abstract: The purpose of this study was to identify potential products - products and find local internal and external factors that
influence the development and design tradicional market system development and structuring tradicional market in Sidoarjo. The
method used is descriptive analyzes of trend analysis by the method of least squares linear least square. SWOT analysis results indicate
uncontrolled parties are not relevant to the activities in the urban market, while the SMART analysis shows the effectiveness of
diversity is far below the average rate comparable institutions close to 40% below. So externally tradicional market under pressure from
the modern market growth started to besiege the city.
Keywords: Development, Market Traditional
[1] Agro Bulletin of Economics I (3), 2001, Frame Strengthening Food Security System in National Economic Recovery Period.
Discussion, Round Table, Food Policy and Nutrition for the Future, Office Menpangan and Horticulture, June 23, 1999, Jakarta.
[2] Djamhari, Choirul, (2004), Orientasi Pengembangan Agroindustri Skala Kecil dan Menengah : Rangkuman Pemikiran, Infokop
Nomor 25 Tahun XX, 2004.
[3] TEMPO, 2003, It is difficult to limit the expansion of large retail because there is no zoning law, Jakarta.
[4] Pearce and Robinson, 2007, Strategic Management formulation, emplementation, and control. Mc Graw Hill, Company Inc. New
York.
[5] Idrus, M.S. 1997. Strategi : Sebagai Upaya Untuk Meningkatkan Kinerja Organisasi dan Keunggulan Bersaing, Universitas
Brawijaya, Malang
[6] Tempo, 2004, Lindungi UKM, Depperindag Godok Draf Keppres Ritel, Jakarta.
[7] Investorindonesia.com, 2004, Zona Ritel Picu Persaingan tak Sehat, Jakarta.
[8] Nasir, 1983, Research Methods, Ghalia Indonesia, Jakarta.
[9] Samsubar , 1990, inductive statistics, UPP AMP YKPN, Yogyakarta.
[10] Saaty, 1980, The Analitic Hierarchi Process, Mcgraw Hill, New York.
Paper Type : Research Paper
Title :Indonesian Bank's Efficiency Under Intermediation, Operating and Value Added
Approach
Country : Indonesia
Authors : Nurafni Eltivia
: 10.9790/487X-0814648
Abstract: The aim of this research is to know how different approach can give different impact to Indonesian bank's efficiency. The
efficiency of bank measured by non parametric analysis, using Data Envelopment Analysis. This research will employ three approach,
Intermediation, Operating and Value Added to define the inputs-outputs used in Data Envelopment Analysis. There are 30 banks that
used as samples in this research, consist of 4 government banks, 9 Go Public Banks, 11 Joint Venture Banks, and 6 Foreign Banks. The
results show that using Value Added approach give highest score in efficiency. Based on the result, the Indonesian banks concern so far
is how to increase the deposit, loans and the investments.
Keywords – bank efficiency, DEA, Intermediation Approach, Operating Approach, Value Added Approach
[1] Hadad, Muliaman D., Santoso, W., dan Mardanugraha, E., Illyas, D. 2003. Analisis Efisiensi Industri Perbankan Indonesia:
Penggunaan Metode Non Parametrik Data Envelopment Analysis. Buletin Ekonomi Moneter Perbankan.
[2] Farrel, M.J. The measurement of productive efficiency, Journal of the Royal Statistical Society, 1998, 253-290.
[3] Coelli T, D S Prasada Rao, and G E Batese, An introduction to efficiency and productivity analysis (Boston: Springer, 1997).
[4] Fiorentino E, Karmann A, and Koetter M, The cost efficiency of German banks: a comparison of SFA and DEA, Discussion Paper
Series 2: Banking and Financial Studies, 10,2006, Deutsche Bundesbank.
[5] Leightner J E, and Lovell C A K, The impact of financial liberalization on the performance of Thai bank, J. Econ. Business 50,
1998,
115–131.
[6] Drake L, Hall M J B, Simper R., The impact of macroeconomic and regulatory factors on bank efficiency: a non-parametric analysis
of Hong Kong's banking system, J. Bank. Finan. 30 (5), 2006,1443–1466.
Paper Type : Research Paper
Title : The Effect Of Entrepreneurship Orientation On The Small Business Performance
With Government Role As The Moderator Variable And Managerial Competence
As The Mediating Variable On The Small Business of Apparel Industry In Cipulir
Market, South Jakarta
Citation
Abstract
Reference
Full PDF
Citation
Abstract
Reference
Full PDF
Citation
Abstract
Reference
Full PDF
Page 3 of 8IOSR
19/02/2018http://www.iosrjournals.org/iosr-jbm/pages/v8i1.html

Country : Indonesia
Authors : Syahrul Effendi*, Djumilah Hadiwidjojo, Solimun, Noermijati
: 10.9790/487X-0814955
Abstract: This research is conducted based on the phenomenon of the apparel industry at Cipulir Market, South Jakarta in small
business context. The production rate drastically decreased since the tight competition with the apparel product from China occurred
when the free-trade policy was applied. Based on the literature review, small business sector decreased because of the lack of role from
the entrepreneur, government, and managerial competence aspects. The purpose of this study was to quantify andexplain the effect
ofentrepreneurial orientation on business performance and the moderating influence factors and the role of governmentas well as the
factors mediating influence managerial competencies of entrepreneurial orientationon business performance. The method applied in this
research was quantitative method. The location of the research was at Cipulir Market, South Jakarta. The research sample consisted of
255 people from the group of apparel industry in small business sector. Data analysis utilized PLS (Partial Least Square) technique. The
result demonstrated that entrepreneurship orientation did not have any influence on the small business performance. The government
role was not yet influential to strengthen the relationship between entrepreneurship orientation and business performance; yet,
entrepreneurship orientation affected managerial competence. Managerial competence influenced small business performance;
Managerial competence a requirement that entrepreneurial orientation capable of improving the small business performance.
Keywords: entrepreneurship orientation, managerial competence, government role, business performance
[1] Karjantoro, (2010). Usaha Kecil dan Problem Peniberdayaarinya. Jakarta,Usahawan, No.04.
[2] Sanchez, AM. and Marin, G.S. 2005. Strategic Orientation, Management Characteristics and Performance: A study of Spanish
SMEs. Journal of Sniaii Business Management. Vol. 43. No. 43, pp. 287-308
[3] Glaiser, KW and P.J. Buckley. (1996). Strategic Motives for International Alliances Formation. Journal of Management Studies.
Vol. 33, pp. 301-332
[4] James dan Timathy L Pett, (2006) High Performing Smes—Human Resource Practices And The Organizational Learning Process
Journal of Management, 27: 755-775.
[5] Dutta, Jim Burns, R. Jain, Henning Schulzrinne, Ken Young, ―A Multi-layered Mobility Management Scheme for Survivable
Network, IEEE Milcom 2001, Vienna, VA
[6] Stam, Kashifa Suddle S. Jolanda A. Hessels Jena Economic Research Paper (2007)-019
[7] Lee, L. Y., & Badri, M. S. (2007). The Effects of Expatriate Personality and Cultural Intelligence on the Expatriate Adjustment: The
Moderating Role of Expatriate. Asia Pacific Management Conference. 13, pp. 922-931.
[8] ovin J. G., Green, K. M., & Slevin, D. P. (2006). Strategic process effects on the entrepreneurial orientation-sales growth rate
relationships. Entrepreneurship: Theory &Practice, 30 (1), 57-81.
Paper Type : Research Paper
Title :A Review Article on Prescription Behavior of Doctors, Influenced By The Medical
Representative In Rajasthan, India
Country : India
Authors : Ravindra Goyal1,, Pranav Pareek
: 10.9790/487X-0815660
Abstract: The World Health Organization defines drug promotion as all informational and persuasive activities by manufacturers and
distributors, the effect of which is to influence the prescription, supply, purchase or use of medicinal drugs but misleading information,
incentives and unethical trade practices were identified as methods to increase the prescription and sale of drugs. Medical
representatives provide incomplete medical information to influence prescribing practices; they also offer incentives including
conference, Seminars, national and aboard sponsorship. Doctors also demand for gifts and other incentives, they look to every medical
representative as a blank cheque for themselves, as when doctors' associations threaten to boycott companies that do not comply with
their demands for sponsorship. Manufacturers, chemists and medical representatives use various unethical trade practices of particular
interest was the finding that chemists are major players in this system, providing drug information directly to patients.
Keywords: Advertising Marketing, Drug Industry, Drug Information Services, Ethics, Medical, Forecasting, Gift & Sponsorship, India,
Inter-professional Relations
[1] Bhatt AD. Drugs - for use or misuse? J Gen Med 1992; 4:31-36
[2] Health and Public Policy Committee of the American College of Physicians: Improving medical education in therapeutics. Ann
Intern Med 1988; 108: 145-147.
[3] Editorial. Drug promotion: stealth, wealth and safety. Lancet 1993; 341:1507-1508.
[4] Chren MM, Landefeld S, Murray TH. Doctors, drug companies and gifts. JAMA 1989; 262:3448-3451
[5] Smith R. Doctors and drug industry: too close for comfort. Br Med J 1986; 293:905-906.
[6] Waud GR. Pharmaceutical promotions - a free lunch? New Engl J Med 1992; 327:351-353
[7] American College of Physicians: Physicians and the pharmaceutical industry. Ann Int Med 1990; 112:624-626
[8] Patel JC. The gifts and trinkets to doctors: current practice in India and global trends in pharmaceutical industry. Bombay Hosp J
1992; 34:1177-1184
[9] Walker G. Code of practice for the pharmaceutical Industry. In: ABPI Data Sheet Compendium. Association of British
Pharmaceutical Industry. London: Datapharm Publications; 1993, VI-XIII.
[10] Kessler DA. Drug promotion and scientific exchange. The role of the clinical investigator. New EngI J Med 1991: 325:201-203
Paper Type : Research Paper
Title :Assessing Service Attitude: Service Quality Measures Taken by Islamic Banks in
Pakistan
Country : Pakistan
Authors : Agha Tahir Ijaz, Asghar Ali
:10.9790/487X-0816168
Citation
Abstract
Reference
Full PDF
Citation
Abstract
Reference
Full PDF
Page 4 of 8IOSR
19/02/2018http://www.iosrjournals.org/iosr-jbm/pages/v8i1.html

Abstract: In the past few years there has been an enormous change in the perception of owning customers for life by the local and
multi-national companies in Pakistan. This could be possible when foreign companies entered into Pakistani market especially in the
banking sector. Quality Customer Services is considered most important tool to have positive image in the mind of customers and to get
positioned in their hearts by owning their greater concerns beyond their expectations. The purpose of this study was to assess service
attitude and service quality measures of Islamic Banks in Pakistan. Population of the study is all five Islamic Banks listed with State
Bank of Pakistan (2012). Total 250 customers, 100 Management Trainee Officers and 25 Branch Managers constituted the sample using
convenience sampling technique and an adapted SERVQUAL instrument of service quality containing five dimensions of service
quality; tangibles; reliability; assurance; responsiveness and empathy was used to assess the service quality measures which was found
reliable at 0.86 Cronbach's alpha. Mean scores and One-way ANOVA were used for significance and variance analysis. Results
revealed that Islamic banks managers showed greater satisfaction about service quality followed by MTOs but customers were not
satisfied with the service quality of Islamic banks and significance difference of opinion found among customers, management trainee
officers and managers which showed true image of service attitude. Islamic Banks customer service measures needs urgent
improvement in order to ultimate survival in the banking sector.
Keywords: Service attitude; Service quality; Islamic Banks
[1] Ahmad, A., Rehman, u. K., & Safwan, N., Comparative study of Islamic and conventional banking in Pakistan based on customer
satisfaction. African Journal of Business Management, 5(5), 2011, 1769-1773.
[2] Ahmad, A., Rehman, u. K., & Saif, M. I., Islamic Banking Experience of Pakistan: Comparison between Islamic and Conventional
[3] Ahmad, A., Rehman, u. k., Saif, I., & Safwan, N., An empirical investigation of Islamic banking in Pakistan based on perception of
service quality. African Journal of Business Management, 4(6), 2010, 1185-1193.
[4] Ahmed, S., & Rehman, u. H., An Empirical Analysis of the Determinants of Banks selection in Pakistan: A Customer View.
Pakistan Economic and Social Review, 46(2), 2008, 147-160.
[5] Al-Eisa, A. S., & Alhemoud, A. M., Using a multiple attribute approach for measuring customer satisfaction with retail banking
services in Kuwait. International Journal of Bank Marketing, 2009, 294-314.
[6] Arasli, H., & Katircioglu, S. T., A comparison of service quality in the banking industry: some evidence from Turkish-Greek-
Speaking areas in Cyprus. Journal of Bank Marketing, 23(7), 2005, 508-526.
[7] Caruana, A., Service loyalty: The effects of service quality and the mediating role of customer satisfaction. European Journal of
Marketing, 36(7/8), 2002, 811-828.
[8] Cohen, D., Gan, C., Yong, H. H., & Choong, E.,Customer Satisfaction: A Study Of Bank Customer Retention In New Zealand.
Commerce Division, Discussion Paper No. 109, 2006, Lincoln University, Canterbury .
[9] Cronin, J., & Taylor, S., Measuring Service Quality: a re-examination and extension. Journal of Marketing, 56(3), 1992, 55-68.
[10] Curry, A., & Penman, S., The relative importance of technology in enhancing customer relationships in banking – a Scottish
perspective. Managing Service Quality, 14(4), 2004, 331-341.
Paper Type : Research Paper
Title :The necessity of establishing a strategic fit between consumer demand and supply
chain
Country : Pakistan
Authors : Adeel Ashfaq, Miss. Nain Tara Sarfaraz Raja
: 10.9790/487X-0816976
Abstract: The paper's main objective is to analyze the relationship of integration of supply chain functions and customer satisfaction.
The paper also focuses on the importance of strategic fit of supply chain in the Pakistan's environment. This kind of research has not
been done in Pakistani market. In today's consumer products environment, consumers rule over the market. If they do not find a product
from one store, they will buy it from another mall or internet at their desirable price. The explosion of consumer demand has created the
complexity and increased cost into the supply chain. Data collected through questionnaire suggested that most of the big stores had the
capability to manage demand forecast in time through their supply chains thus bringing customer satisfaction.
Keywords – supply chain, consumer demand, price
[1] Babbar, S., Prasad, S., 1998. International purchasing, inventory management and logistics research: an assessment and agenda.
International Journal of Operations and Production Management 18 (1), 636
[2] Barbieri, P. and Mahapatra, S. 2009. Buyer-supplier relationship in supply network: implications of tier-II supplier management
practices, Proceedings of the 2009 European Operation Management Association Conference, Götenburg
[3] Chopra, S. and Meindl, P. 2007. Supply Chain Management: Strategy, Planning, and Operation. 3rd Ed., Upper Saddle River, New
Jersey: Pearson Education, Inc.
[4] Cox, A.; Chicksand, D. Yang, T. 2007. The proactive alignment of sourcing with marketing and branding strategies: a food service
case. Supply Chain Management: An International Journal. Volume: 12 Issue: 5
[5] Correa, L. H. 2001. The VW Resende (Brazil) plant modular consortium SCM model after 5 years of operation, Proceedings of the
2001 Annual Conference of the Production and Operations Management Society, Orlando.
[6] Christopher, M. 2000, The agile supply chain: competing in volatile markets, Industrial Marketing Management, Vol. 29, pp. 37 -44
[7] Choi, T. Y. and Wu, Z. 2009. Triads in supply networks: Theorizing buyer-supplier- relationships, Journal of Supply Chain
Management, Vol. 45 No. 1, pp. 8-25.
[8] Cox, A. 2004. Business relationship alignment: on the commensurability of value capture and mutuality in buyer and supplier
exchange. Supply Chain Management: An International Journal. Volume: 9 Issue: 5
Paper Type : Research Paper
Title : Investor Overconfidence and Stock Returns: Evidence from Pakistan
Country : Pakistan
Authors : Beenish Tariq, Naeem Ullah
:10.9790/487X-0817784
Citation
Abstract
Reference
Full PDF
Citation
Abstract
Reference
Full PDF
Page 5 of 8IOSR
19/02/2018http://www.iosrjournals.org/iosr-jbm/pages/v8i1.html

Abstract: The study investigates investor overconfidence in Pakistan stock market. By taking daily stock prices of 27 leading
companies representing all sectors of Karachi stock exchange we found that return of the securities have impact on securities' trading
volumes. While trading volumes failed to impact returns in short term horizon. Further returns volatility had impact on the returns but
failed to impact trading volume. This indicates that despite return volatility, overconfident Pakistani investor continue to trade in the
security. Impulse response analysis exhibits that trading are impacted by one standard deviation of security return but they still remain
positive and mostly stay above zero. The study was conducted in vector auto regressive environment.
Key words: Investor overconfidence, Returns, Volatility, Vector Auto regression
[1] Barber, B.M. & Odean, T. (2001). Boys Will Be Boys: Gender, Overconfidence and Common Stock Investment. The Quarterly
Journal of Economics, 116 (1), 261-292.
[2] Benos, A. (1998). Aggressiveness and Survival of Overconfident Traders. J Financ Market, 1, 353-383.
[3] Black, F. (1972). Capital Market Equilibrium with Restricted Borrowing. Journal of Business, 45, 444-455.
[4] Chordia, T. & Swaminathan, B. (2000). Trading Volume and Cross-Autocorrelation in Stock Returns. The Journal of Finance, 55,
913-935.
[5] Constantinos,K., Ektor,L.A. & Dimitrios,M. (2010). Oil Price And Stock Market Linkages In A Small And Oil Dependent
Economy: The Case Of Greece, The Journal of Applied Business Research, 26, 56-63.
[6] Cooper, M. (1999). Filter Rules Based on Price and Volume in Individual Security Overreaction. The Review of Financial Studies,
12, 901-935.
[7] Daniel, K. Hirshleifer, D. & Subrahmanyam, A. (1998). Investor Psychology and Security Market Under and Overreactions."
Journal of Finance, 53(6), 1839-85.
[8] De Bondt, W., & Thaler, R.(1985). Does the Stock Market Overreact?. Journal of Finance, 60(3), 793-805.
[9] García, D., Sangiorgi, F. & Urosevic, B. (2007). Overconfidence and Market Efficiency with Heterogeneous Agents. Economic
Theory, 30(2), 313-336
[10] Gervais, S. & Odean, T. (2001). Learning to be Overconfident. The Review of Financial Studies, 14, 1-27.
Paper Type : Research Paper
Title : Impact of Cashflow Volatility on Cash-Cash Flow Sensitivity of Pakistani Firms
Country : Pakistan
Authors : Sehrish Ahsan, Naeem Ullah
: 10.9790/487X-0818597
Abstract: This study is conducted to observe the impact of cash flow volatility (CVCF) on cash-cash flow sensitivity of Pakistani
Manufacturing Firms by taking a panel data of 377 manufacturing firms listed on Karachi Stock Exchange. The test revealed that cash
flow volatility had significant impact on cash-cash flow sensitivity. This sensitivity was due to the precautionary motive of Pakistani
Manufacturing Firms. Further, cash-cash flow sensitivity was studied by classifying firms into constrained and unconstrained categories
by using cash flow volatility (CVCF) and size. The results for the classification based on cash flow volatility (CVCF) reveals that cash-
cash flow sensitivity is more due to long-term debt for constrained firms and due to sales growth for unconstrained firms. The results
for the classification based on size reveals that cash-cash flow sensitivity is present in both constrained and unconstrained firms.
However, in constrained firms this sensitivity is mainly due to growth opportunities available to those firms. While in unconstrained
firms this sensitivity can be attributed to increase leverage and resultant increased in cash flow volatility (CVCF) due to leverage.
[1] Acharya, V., Almeida, H.,& Campello, M. (2006).Is cash negative debt? A hedging perspective on corporate financial
policies.London Business School working paper, London, England.
[2] Almeida, H., Campello, M., & Weisbach, M.S. (2004). Cash flow sensitivity of cash, forthcoming. Journal of Finance, 59, 1777-
1804.
[3] Autore, D., &Kovacs, T. (2005). The pecking order theory and time-varying adverse selection costs.Working paper, Virginia Tech,
Department of Finance.
[4] Chang, K., & Noorbakhsh, A. (2006). Corporate cash holdings, foreign direct investment and corporate governance. Global Finance
Journal, 16, 302-316.
[5] Cleary & Sean (2006). International corporate investment and the relationships between financial constraint measures,
forthcoming. Journal of Banking and Finance.
[6] Dittmar, A., Mahrt-Smith, J., & Servaes, H. (2003). International corporate governance and corporate cash holdings.Journal of
Financial and Quantitative Analysis, 38, 111-133.
[7] Duchin, R. (2007). Cash holdings and corporate diversification.Job Market Paper, University of Southern California, Marshall
School of Business, Los Angeles, California. (90089-0311)
[8] Fazzari, S., Hubbard, R.G., &Petersen, B.C. (1988). Financing constraints and corporate investment. Brookings Papers on
Economic Activity, 141-195.
[9] Ferreira, M.A., & Vilela, A.S. (2004). Why do firms hold cash? Evidence from EMU countries. European Financial Management,
10, 295-319.
[10] Han, S., & Qiu, J. (2007). Corporate precautionary cash holdings. Journal of Corporate Finance, 13, 43-57.
Paper Type : Research Paper
Title :
The Influence of Role Conflict and Role Ambiguity on The Employee's
Performance Through Commitment and Self- Efficacy (Study on the Nurses at
Public Health Service Center of Kabupaten Kediri, East Java)
Country : Indonesia
Authors : DjonyHarijanto, Prof. Umar Nimran, Prof. AchmadSudiro, Dr. MintartiRahayu
: 10.9790/487X-08198105
Citation
Abstract
Reference
Full PDF
Citation
Abstract
Reference
Full PDF
Page 6 of 8IOSR
19/02/2018http://www.iosrjournals.org/iosr-jbm/pages/v8i1.html

Abstract: The objective of this study is to examine the effect of role conflict and role ambiguity on the organizational commitment,
self-efficacy, and employee's performance of nurses at public health service centers (Puskesmas/PusatKesehatanMasyarakat). The data
were obtained from 145 nurses as government officers from 35 public health service centers at KabupatenKediri, East Java. The
gathered data were then analyzed by using Partial Least Square method; the research result demonstrates that, among the overall
proposed hypotheses, role conflict does not influence organizational commitment and nurse's performance so that there is no mediating
function of organizational commitment on the relationship between role conflict and performance. The limitation of this research is
described on the latest part of this article.
Keywords: Role Conflict, Role Ambiguity, Organizational Commitment, Self-Efficacy, Performance, Nurse.
[1] Abernethy, M.A.; Stoelwinder, J.U. 1995.The Role of Professional Control in the Management of complex organizations .
Accounting, Organization and Society ; 20, 1 -77.
[2] Agustina, Lidya. 2009. PengaruhKonflikPeran, KetidakjelasanPeran, danKelebihanPeranterhadapKepuasanKerjadanKinerja
Auditor (Penelitianpada Kantor AkuntanPublik yang BermitraDengan Kantor AkuntanPublikBig Four di Wilayah DKI Jakarta).
JurnalAkuntansi Vol.1 No.1 Mei 2009: 40-69.
[3] Allen, Natalie J., John P. Meyer. 1990. The Measurement and Antecedents of Affective, Continuance and Normative Commitment
to the Organization. The British Psychological Society :Journal of Occupational Psychology Vol 63, No 1-18.
[4] Allen, Natalie J., John P. Meyer. 1991. A Three Component Conceptualization of Organizational Commitment.Human Resource
Management Review, Vol 1 No 1 pp 61 - 89 .
[5] Banduras, Albert . 1977. Self-efficacy: Toward a Unifying Theory of Behavioral Change. Psychological Review 1977, Vol. 84, No.
2,
191-215.
[6] Bandura, Albert. 1986. Social Foundations of Thought and Action: A Social Cognitive Theory. Englewood Cliffs, NJ: Prentice-Hall.
[7] Bandura, Albert; Edwin A. Locke. 2003. Negative Self-Efficacy and Goal Effects Revisited. Journal of Applied Psychology 2003,
Vol. 88, No. 1, 87–99.
[8] Bandura, Albert. 1989. Social cognitive theory.In R. Vasta (Ed.), Annals of child development.Vol. 6.Six theories of child
development (pp. 1-60). Greenwich, CT: JAI Press.
[9] Bandura, Albert; Nancy E. Adams. 1977. Analysis of Self-Efficacy Theory of Behavioral Change. Cognitive Therapy and Research,
VoL 1, No. 4, 1977, pp. 287-310.
[10] Cervoni, Annemarie. 2007. Role Conflict, Role Ambiguity, and ASCA Functions as Predictors of School Counselor Job
Satisfaction. ProQuest Information and Learning Company : Dissertation Faculty of the Graduate School of the State University of New
York at Buffalo.
Paper Type : Research Paper
Title :Economic Reforms and World Economic Crisis: Changing Indian Life Insurance
market place.
Country : India
Authors : Dr. Yogesh Jain
: 10.9790/487X-081106115
Abstract: Insurance sector in India is one of the booming sectors of the economy and is growing at a very speedy rate. This sector in
India was liberalized in 2000. The opening up of the insurance for private players has led to rapid growth of the sector. This paper
analysis past and present status of the insurance sector in life insurance sector in particular. The paper also discusses about the future
strategies of the Indian Insurance sector. The present descriptive and analytical secondary based study was conducted with an objective
to analyze the condition of life insurance industry and to study the impact of post 2008 economic crisis on insurance industry in India,
also an attempt to study the opportunities and challenges for life Insurance in post liberalization area. In the post liberalization period,
the life insurance industry of India witnessed a marvelous growth but this growth was declined after economic crisis are some of the
major findings of study. The research will be extremely useful for life insurers in the business of life insurance and its penetration.
Keywords: Economy, Economic Crisis, Liberalization, Life insurance, Penetration.
[1] C. Barathi, D. Balaji and Ch. Ibohal Meitei (2011), "Innovative Strategies To Catalyse Growth Of Indian Life Insurance Sector -An
Analytical Review", Indian Journal of Commerce and Management Studies, Vol. Ii, Issue IV, May 2011.
[2] Chatterjee. P (2009) In Her Article Titled "Private Insurers Command Majority Share Of Life Insurance Market".
[3] Krishnamurthy. S, Jhaveri. Nani, Bakshi. S (July-Sept 2005), Insurance Industry in India: Structure, Performance and Future
Challenges, Vikalpa, Iima Volume 30, No. 3, Pg No. 93-95.
[4] Kundu. S (2003), "What‟s Next In India‟s Insurance Market", Knowledge Digest Com., May 12.
[5] Murthy.T.N (2009), "Performance Evaluation of Lic", Icfai Journal of Risk & Insurance, Jan- April 2009, Vol. II.
[6] Rastogi. S and Sarkar.R (2006), "Enhancing Competitiveness: The Case Of The Indian Life Insurance Industry", Conference O n
Global Competition & Competitiveness of Indian Corporate", IIMK, September 2006.
[7] Sumninder Kaur Bawa (2007), "Life Insurance Corporation of India: Impact of Privatization And Performance‟, Regal
Publication, New Delhi.
[8] Tripathi.S (2009), "A Comparative Analysis of Life Insurance Corporation and Private Insurance Company" Disse rtation Fms
Banaras
[9] Goswami, P. (2007), "Customer Satisfaction with Service Quality in the Life Insurance Industry in India," Icfai Journal of
Management Research, vol.2, pg-331-342,
[10] Goyal, K. (2004), "Growth of Private Insurance companies," journal of economics, vol.3, pg No.233-
241,http://business.highbeam.com/436091/article-1G1-197342226/private-insurancecompanies-shows-continued-strong
Paper Type : Research Paper
Title :Exchange Rate and Economic Performance - A Comparative Study of Developed
and Developing Countries
Country : Pakistan
Citation
Abstract
Reference
Full PDF
Citation
Abstract
Reference
Full PDF
Page 7 of 8IOSR
19/02/2018http://www.iosrjournals.org/iosr-jbm/pages/v8i1.html

Authors : Zohaib Aslam, Qaisar Ali Malik
: 10.9790/487X-081116121
Abstract: The most significant and crucial goal of the developing and developed countries is to attain continued economic and financial
growth and stability through stock market performance. The aim of the present research is to analyze the impact of the changes in
foreign exchange rates on economic performance of developed and developing economies measured by the changes in the stock market
returns. The study is focused to explore whether and to what extent foreign exchange rates affect the economic performance as
measured by the stock market returns. The significance of the study is evident from the fact that the portfolio managers and investors
are usually interested in making prudent investment decisions so as to maximize their returns through keeping an eye on various
domestic and international factors affecting their returns. Moreover developed and developing countries are also interested in stabilizing
and enhancing the economic growth by monitoring and controlling the factors affecting such growth. The study considered the variables
from Pakistani and Japanese markets to see whether the studied variables have any explanatory relationship that may help in
formulating policies to enhance and stabilize economic growth. The study took 10 years monthly data related to stock prices of KSE
100 index and NIKKEI 225 index as dependent variable, whereas monthly data of foreign exchange rates of Pakistan and Japan are
taken as independent variable. The study used descriptive and inferential statistics to identify and measure the relationship between
foreign exchange rates and economic performance. The results depicted that foreign exchange rate is negatively associated to stock
market returns and that the exchange rate is an insignificant predictor of stock market returns in case of Pakistani market hence the
changes in foreign exchange rate were found to have no effect on economic performance as measured by the stock market returns. In
case of Japan foreign exchange rate was found significantly and positively affecting stock market returns and that the changes in foreign
exchange rate will also cause changes in stock market returns with an increase in exchange rate causing an increase in economic
performance and a decrease in exchange rate causing a decrease in economic performance.
Keywords: Stock Returns, Economic Performance, NIKKEI 225, KSE 100
[1] Aggarwal (1981), Exchange rates and stock prices, a study of United States capital market floating exchange rates, Akron Business
&
Economic Review, pp7-12.
[2] Aziz (2003), Macro economic variables and the Malaysian equity market of Asia, Journal of Economic Studies, pp 5-28.
[3] Fok (2007), Dynamic linkages between exchange rates and stock prices, International Review of Economics and Finance, pp 502-
521.
[4] Gujarati (2003), Basic Econometrics, McGraw Hill, India.
[5] He, J (1998), The foreign exchange exposure of Japan multinational corporations, Journal of Finance, pp 732-754.
[6] Henery (2000), Do market liberalization cause investment booms, Journal of Finance & Economics, pp 301-333.
[7] Hogan (1998), The pricing of country funds obtained from emerging markets, International Journal of Applied Finance, pp 110-144.
[8] International Monetary Fund, www.IMF.com.pk
[9] Johasen (1988), The statistical analysis of co-integration vectors, The Journal of Economic and Dynamic Control, pp 230-255.
[10] Keurihara (2006), The relationship between exchange rate and stock prices of Japan, International Journal of Business and
Economics, pp 374-385.
Paper Type : Research Paper
Title :Impact of Corporate Governance on Corporate Cash Holding: Evidence from Non-
Financial Firms in Pakistan
Country : Pakistan
Authors : Raza Zia-ul-Hannan1 , Ms. Nadia Asghar
: 10.9790/487X-081122125
Abstract: In this paper the researcher tired to study that how corporate governance effects corporate cash holdings in non-financial
firms in Pakistan. For this purpose the researcher on the basis of convenient sampling studied the 22 non financial companies listed on
KSE-100 Index from the time period of 2005 to 2010. The researcher took the cash as dependent variable while cash flow, liquidity,
leverage, bank debt, market book, size, variability, dividend and others are independent variables. The researcher applied the multiple
regression model after checking the data Heterosadacity and with the help of common effect model in STATA SE 10, researcher
concluded that the relation between the corporate governance as well as the cash holdings from non financial firms in Pakistan will be
negative.
Keywords: Cash Holding, Heterosadacity, KSE-100 Index, Non Financial Companies
[1] Amy and Jan (2007). "Corporate governance and the value of cash holdings.US
[2] Amy, Jan and Henri (2003). "International Corporate Governance and Corporate Cash holding" Journal and Financial and
Quantitative Analysis, 38 (2003), 111- 133.
[3] Arellano M., Bond S., 1991. Some tests of specification for panel data: Monte Carlo evidence and an application to employment
equations. The Review of Economics Studies 58, 277–297.
[4] Baskin J., 1987. Corporate liquidity in games of monopoly power. Review of Economics and Statistics 69, 312–319.
[5] Benjamin and Yuanjian "The Effect of Corporate Governance Structure on Corporate Cash Holdings: An Empirical Analysis of
Nigerian Listed Firms."
[6] Berlin M., Loeys J., 1988. Bond covenants and delegated monitoring. Journal of Finance 43, 397–412.
[7] Black B.S., Coffee J.C., 1994. Hail Britannia, Institutional investor behaviour under limited regulation. Michigan Law Review 92,
1997–2087.
[8] Deqiu, Sifei, Jason, Hong (2005). "The Effects of Government Quality on Corporate Cash Holdings."
[9] Faccio M., Lang H.P., 2002. The ultimate ownership of western European corporations. Journal of Financial Economics 65, 365–
395.
[10] Jarrad, Sattar and William (2007). "Corporate governance and firm cash holdings in the US."
IOSR Journal Publish Online and Print Version Both
Home | Submit an Article | IOSR Journals | Contact usCopyright © iosrjournals.org
Citation
Abstract
Reference
Full PDF
Page 8 of 8IOSR
19/02/2018http://www.iosrjournals.org/iosr-jbm/pages/v8i1.html

IOSR Journal of Business and Management (IOSR-JBM)
e-ISSN: 2278-487X. Volume 8, Issue 1 (Jan. - Feb. 2013), PP 01-09 www.iosrjournals.org
Analysis Strategy for Small and Medium Business Development
Policy Gresik District in East Java
Dr. Rahayu Puji Suci. MS.
Management Department, Economic Faculty, University Widyagama Malang, East Java of Indonesia.
Abstract: The objectives of this research study is the preparation of Policy Development Small and Medium
Enterprises (SMEs) Gresik regency, East Java. The expected outcome of this activity is the completion of SME
Development Policy Gresik regency, East Java. This research included in this type of survey research (survey
research). To identify and determine the priority of a number of SMEs are included in the classification of SMEs
seed using Location Quotient (LQ). To identify aspects of strategic management of internal and external
environmental factors using a matrix of external strategy (External Strategic Factors Analysis Summary /
EFAS) and internal strategy matrix factor (Internal Strategic Factors Analysis Summary / IFAS). To analyze the
position of SME business unit using the analysis-Market Growth Matrix (BCG's Growth-Share Matrix) and the
Industry Life Cycle Matrix analysis (ADL Matrix) to eliminate the weaknesses that exist in the analysis-Market
Growth Matrix. Furthermore, the synthesis of the above calculation is used to determine policy formulation and
development of SMEs. So from a strategic management analysis results show the development of small and
medium enterprises in Gresik is located in Quadrant I, or should do or Aggressive Growth Strategy supports an aggressive growth policy (growth oriented strategy).
Keywords: strategy, policy development, SME.
I. Introduction During the past 3 years, Gresik regency economy slowly improved. Economic growth in 2003
amounted to 4.41% and increased to 6.91% in 2005. When compared with 2004, the growth is faster by a
margin of 1.45%, and when compared to growth in 2003 there were difference of 1.05% growth rate. These
conditions clearly indicate a trend of improvement in the economy especially inflation at the same idea also
tended to decrease. These conditions suggest that the economy Gresik city moving towards a situation as it was
before the 1997 financial crisis in which economic growth Gresik regency had reached 13%. During this time,
the industrial sector dominates economic structure by over 45% so it determines a good or bad area. If the
industrial sector collapsed, the other sectors will be affected, and vice versa if the industry improves, the other sectors will also experience growth.
Conditions of SMEs in Gresik regency has diverse characteristics. This diversity can be seen from the
number and types of small and medium industries located in the small, medium and large average recorded a
significant increase in the last 5-year period. During this period, small scale industries small increase over 1000
units.
Suwarsono (1994: 22) [1] said that the analysis of the external environment should not be until fall to
try to analyze as many variables as possible. Therefore, the external environment will only cover variable
variable analyzed government, competitors, and suppliers. In addition to the analysis of external environmental
factors, companies also need to conduct an analysis of the internal environment
Based on the phenomenon of SME business Gresik has been said, the research studies with outcomes
such as SME development policy Gresik regency, East Java province would be sufficient to immediately
formulated strategic. Formulation and determination of SME development policy Gresik is very important in order to be able to release the SMEs of komplektisitas basic problems associated with the realization of business
development. On the other hand, research studies focusing on the formulation and development of policy-
intensive SMEs so far have not worked, so the results of the discussion to solve these problems, and the
development of policy implications that need to be implemented has not been developed (Day, George S., 1990)
[2], .
For that it is important to analyze the environment will inevitably affect the business's bags and
luggage. According to Pearce and Robinson (2007, 84) [3], A host of external factors influence a form's choice
of direction and action and, ultimately, its organizational structure and internal processes. These factors, wich
extend constitute the environment, can be dividend in to three interrelated Subcategories: factors in the remote
environment, factors in the industry environment and factors in the operating environment. The remote
environment comprices factors that originate beyond. , And Usually irrespective of, any single firm's operating situation: (1) economic, (2) social, (3) political, (4) technological, and (5) ecological factors (Erez, M. and F.
Kanfer, 1983) [4],.

Analysis Strategy For Small And Medium Business Development Policy Gresik District In East Java
www.iosrjournals.org 2 | Page
Further Pierce Robinson (2007, 92) [3] defines environment as the general industry conditions for
competition that influence all business that provide products and services Similar. The operating environment
also called the competitive or task environment, comprises factors in the competitive situation that Affect a firms success in acquiry needed resourches or profitability in marketing its goods and service. Among the most
important of these factors are the firm's competitive position, the composition of its costumers, its reputation
among suppliers of its, and its ability to attract capable employers (Pearce and Robinson, 2007, 106) [3].
The aim of this activity is the preparation of Policy Development Small and Medium Enterprises (SMEs) Gresik
regency, East Java. The expected outcome of this activity is the completion of SME Development Policy Gresik
regency, East Java.
According to Idrus (1997, 18-19) [5] planner (strategist) should also be able to measure the strategic
advantage (SA)-organizations of the strengths and weaknesses and SBUnya portfolio. SA can be used as a
'Flagship' of the organization compared to rivals. Furthermore Idrus said the strategic plan, should be able to
take into account changes in the external environment that provides 'opportunities-opportunities' and 'threats-
treat' in the organization.
II. Methods This research study included in this type of survey research (survey research) and use the questionnaire
as a data collection tool that subject in the field (Singarimbun and Effendi, 1995:5). [6]
To identify and determine the priority of a number of SMEs are included in the classification of SMEs
featured in Gresik using the Location Quotient (LQ). To identify aspects of strategic management of internal
and external environment into force (strength), weakness (Weakness), opportunities (opportunity) and threats
(threat) for the development of SMEs using the matrix factors external strategy (External Strategic Factors
Analysis Summary / EFAS) and matrix factors internal strategies (Strategic Internal Factors Analysis Summary / IFAS).
To analyze the position of SME business unit using the analysis-Market Growth Matrix (BCG's
Growth-Share Matrix) and the Industry Life Cycle Matrix analysis (ADL Matrix) to eliminate the weaknesses
that exist in the analysis-Market Growth Matrix. Furthermore, the synthesis of the above calculation is used to
formulate and determine policy SME Gresik regency, East Java.
By using strategic factors external and internal, as described in the EFAS and IFAS above, then transfer
opportunities and threats from EFAS and add the strengths and weaknesses of the IFAS into the appropriate cell
in the SWOT matrix (Figure 2). Based on this approach, it can be formulated an alternative strategy, that
strategy SO, ST, WO, and WT.
IFAS
EFAS
STRENGTH (S) 5-10 Determine the internal
power factor
Weakness (W) 5-10 Determining factors
internal weaknesses
OPPORTUNITY (O) 5-10 Determining factors of
external opportunities
SO STRATEGY
Creating strategies to use force to take advantage of
opportunities
STRATEGIES WO
Creating strategies that minimize your weaknesses to
capitalize on opportunities
Threat (T) 5-10 Determining factors
external threats
ST STRATEGY Create a strategy to address the
threat to use force
STRATEGIES WT Creating strategies that
minimize weaknesses and
overcome threats
Figure 2. SWOT Matrix Diagrams
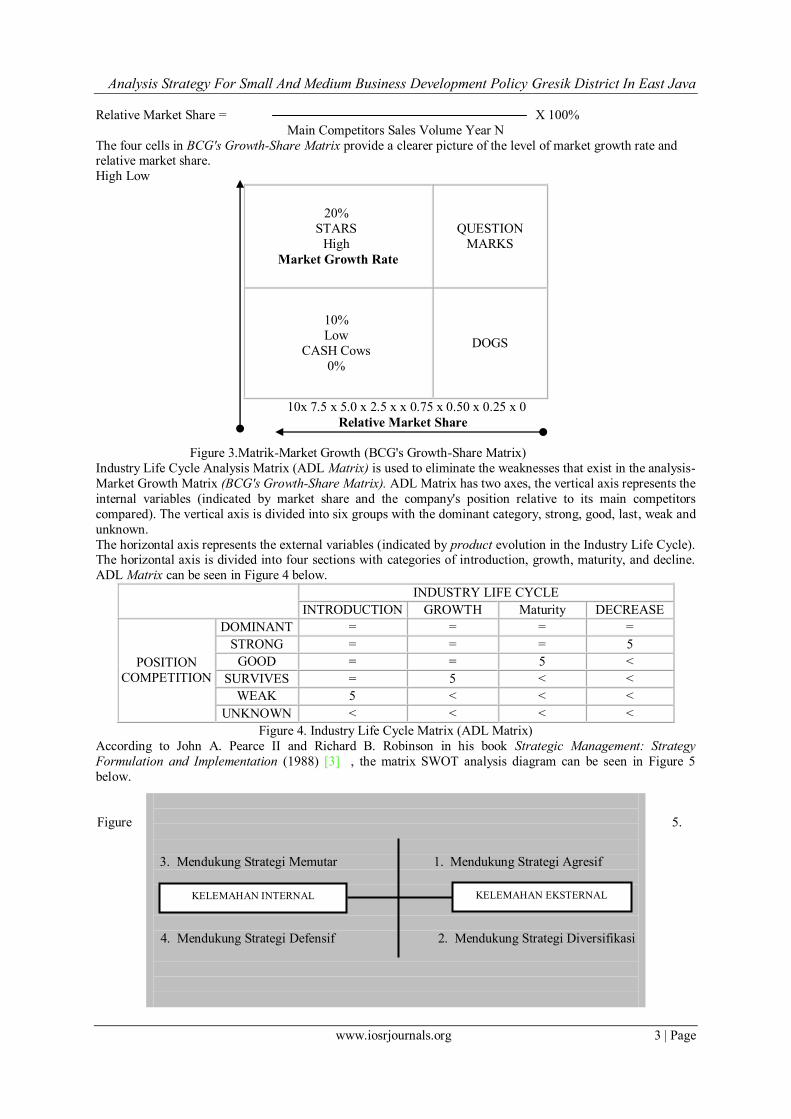
Analysis-Market Growth Matrix (BCG's Growth-Share Matrix) is based on the use of Market Growth Rate
(Market Growth Rate) and Market Share Relative (Relative Market Share). The market growth rate presented by
the vertical axis, while the Relative Market Share represented by the horizontal axis (Figure 3).
The market growth rate can be calculated by the formula: Industry Sales Volume - Volume Industrial Sales
Year N Year N - 1
Market Growth Rate =
Industry Sales Volume Year N - 1
Relative market share can be calculated by the formula:
Industry Sales Volume Year N
Analysis Strategy For Small And Medium Business Development Policy Gresik District In East Java
www.iosrjournals.org 3 | Page
Relative Market Share = X 100%
Main Competitors Sales Volume Year N
The four cells in BCG's Growth-Share Matrix provide a clearer picture of the level of market growth rate and relative market share.
High Low
20%
STARS
High
Market Growth Rate
QUESTION
MARKS
10%
Low
CASH Cows
0%
DOGS
10x 7.5 x 5.0 x 2.5 x x 0.75 x 0.50 x 0.25 x 0
Relative Market Share
Figure 3.Matrik-Market Growth (BCG's Growth-Share Matrix)
Industry Life Cycle Analysis Matrix (ADL Matrix) is used to eliminate the weaknesses that exist in the analysis-
Market Growth Matrix (BCG's Growth-Share Matrix). ADL Matrix has two axes, the vertical axis represents the
internal variables (indicated by market share and the company's position relative to its main competitors
compared). The vertical axis is divided into six groups with the dominant category, strong, good, last, weak and
unknown.
The horizontal axis represents the external variables (indicated by product evolution in the Industry Life Cycle). The horizontal axis is divided into four sections with categories of introduction, growth, maturity, and decline.
ADL Matrix can be seen in Figure 4 below.
INDUSTRY LIFE CYCLE
INTRODUCTION GROWTH Maturity DECREASE
POSITION
COMPETITION
DOMINANT = = = =
STRONG = = = 5
GOOD = = 5 <
SURVIVES = 5 < <
WEAK 5 < < <
UNKNOWN < < < <
Figure 4. Industry Life Cycle Matrix (ADL Matrix)
According to John A. Pearce II and Richard B. Robinson in his book Strategic Management: Strategy
Formulation and Implementation (1988) [3] , the matrix SWOT analysis diagram can be seen in Figure 5
below.
Figure 5.
3. Mendukung Strategi Memutar 1. Mendukung Strategi Agresif
4. Mendukung Strategi Defensif 2. Mendukung Strategi Diversifikasi
KELEMAHAN EKSTERNAL KELEMAHAN INTERNAL
Analysis Strategy For Small And Medium Business Development Policy Gresik District In East Java
www.iosrjournals.org 4 | Page
SWOT Analysis Diagram Matrix
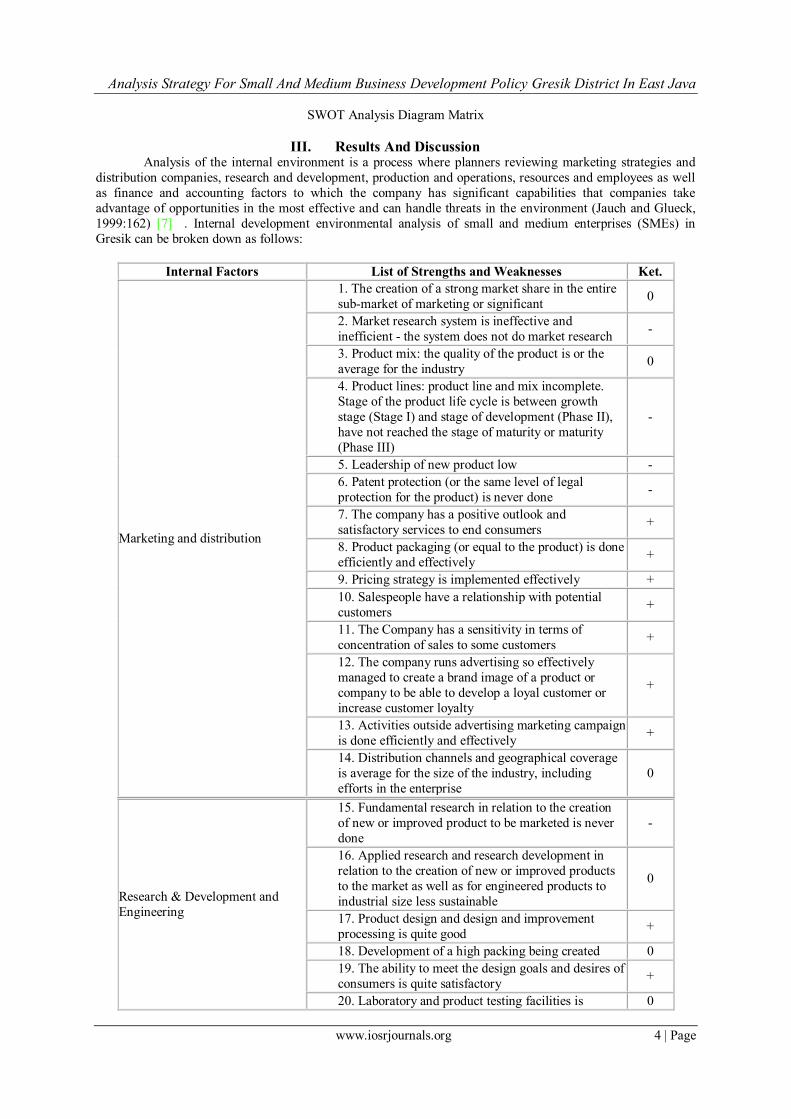
III. Results And Discussion Analysis of the internal environment is a process where planners reviewing marketing strategies and
distribution companies, research and development, production and operations, resources and employees as well
as finance and accounting factors to which the company has significant capabilities that companies take
advantage of opportunities in the most effective and can handle threats in the environment (Jauch and Glueck,
1999:162) [7] . Internal development environmental analysis of small and medium enterprises (SMEs) in
Gresik can be broken down as follows:
Internal Factors List of Strengths and Weaknesses Ket.
Marketing and distribution
1. The creation of a strong market share in the entire
sub-market of marketing or significant 0
2. Market research system is ineffective and
inefficient - the system does not do market research -
3. Product mix: the quality of the product is or the
average for the industry 0
4. Product lines: product line and mix incomplete.
Stage of the product life cycle is between growth
stage (Stage I) and stage of development (Phase II),
have not reached the stage of maturity or maturity
(Phase III)
-
5. Leadership of new product low -
6. Patent protection (or the same level of legal
protection for the product) is never done -
7. The company has a positive outlook and
satisfactory services to end consumers +
8. Product packaging (or equal to the product) is done
efficiently and effectively +
9. Pricing strategy is implemented effectively +
10. Salespeople have a relationship with potential
customers +
11. The Company has a sensitivity in terms of
concentration of sales to some customers +
12. The company runs advertising so effectively
managed to create a brand image of a product or
company to be able to develop a loyal customer or
increase customer loyalty
+
13. Activities outside advertising marketing campaign
is done efficiently and effectively +
14. Distribution channels and geographical coverage
is average for the size of the industry, including
efforts in the enterprise
0
Research & Development and
Engineering
15. Fundamental research in relation to the creation
of new or improved product to be marketed is never
done
-
16. Applied research and research development in
relation to the creation of new or improved products
to the market as well as for engineered products to
industrial size less sustainable
0
17. Product design and design and improvement
processing is quite good +
18. Development of a high packing being created 0
19. The ability to meet the design goals and desires of
consumers is quite satisfactory +
20. Laboratory and product testing facilities is 0

Analysis Strategy For Small And Medium Business Development Policy Gresik District In East Java
www.iosrjournals.org 5 | Page
incomplete and inadequate
21. Technicians and experts who are trained and
experienced quite adequate for the size of the industry +
22. Inadequate working environment / fit for
creativity and invention of new products -
23. The manager can explain the target to researchers
and research results to higher manajeer +
24. Management companies are less able (for the size
of the industry) to carry out an effective forecasting
technology
-
Production and Operations
Management
25. Total operating cost on average is lower than the
total cost competitors +
26. Capacity to meet market demand in accordance +
27. Average facilities are old and outdated for the size of the industry
-
28. Raw materials and sub-assembly cost control +
29. Availability of raw materials and sub-assembly of
sufficient +
30. What facilities and offices strategically pretty
average for the size of the industry 0
31. Inventory control system is efficient and effective +
32. Average procedure is efficient and effective for
the size of the industry: the design, scheduling,
quality control
0
33. Vertical integration and supplier relationships
effectively carried +
Resources and Employees
34. The size of the company in conjunction with the
industry (barriers to entry) is to measure industry 0
35. The support system is quite effective corporate staff implemented
+
36. Work experience and achievements balanced top management: top managers can work well together as
a team
+
37. Policy efficient and effective working relationship: the appointment of staff, assessment and
promotion of training and development and reward
and benefits
+
38. The average labor cost low for the size of the
industry (according to the size of the compensation,
reimbursement and absenteeism)
-
39. Information management and computer systems
are not effective -
Finance and Accounting
40. Profit consistent but average for industrial size 0
41. Balance Sheet shows the ability to obtain
necessary capital, the equity ratio low-receivables,
working capital position is high and stock prices quite fun
+
Note:
1. Sign (+) declared force; signs (0) declared neutral; dash (-) state weakness 2. Strength has a value of (+) 19; weakness has value (-) 10.
Analysis of the external environment is a strategic planning process that is used to monitor the environmental
sector in determining opportunities and threats to the company (Jauch and Glueck, 1999:88). Jauch and Glueck
(1999:89) [7] adds that the company's management needs to systematically analyze and diagnose the external
environment due to environmental factors is a major influence to change strategy. Analysis of the external
environment and middle development of small businesses (SMEs) in Gresik can be broken down as follows:
External Factors List of Opportunities and Acaman Ket.

Analysis Strategy For Small And Medium Business Development Policy Gresik District In East Java
www.iosrjournals.org 6 | Page
General Environment
Socio-economic
Economic factors:
1. Symptoms of inflation in the prices of goods tend
to be high and the symptoms of deflation in the prices
of goods tend to be low = there should be controls on
wages and prices
-
2. Financial policy, interest rates, currency
devaluation or revaluation of foreign currencies in
relation to quite conducive
+
3. Fiscal policy: tax rates for corporations and
individuals on average are not quite conducive 0
4. Balance of payments in connection with foreign
trade is quite conducive +
5. Climatic and ecological factors: strategic planners
with insight sufficient climatic and ecological +
6. Social factors: strategic planners followed the
changes in the level of education and social values to
assess their impact on the strategy implemented
Technology
7. Less effective strategic planners researching the
technology to look for changes that may affect raw
materials, operations, products and services. Changes
in technology can provide great opportunities for
improving outcomes, goals, or otherwise threaten the
company.
-
8. Technological changes affecting current products
in terms of the production process is never done -
Government
9. The government is a major buyer for industrial
products +
10. The government provides subsidies to the
company and the industry, which means helping their
survival to be able to continue to grow
+
11. The government protects domestic producers
against foreign competitors 'unfair' +
12. Changes in government policy to increase the
opportunities and the emergence of new business for
the company
+
13. Anti-monopoly legislation and policies restricting
mergers +
14. Government regulations that significantly affect
the strategic choices of the whole industry 0
15. Government policies are changing the economic
conditions that may pose a threat to the company -
Industry Environment
Markets and Consumers 16. Size (percent and potential), growth and
siklisalitas (product life cycle), overseas opportunities +
Supplier 17. Availability of inputs required, the cost of inputs,
power supplier +
Competition 18. Foreign competitors, the availability and cost of
replacement of other industries -
International Environmental 19. Opportunities for international activities +
20. Threats to international activities -
Note: 1. Sign (+) states opportunities; signs (0) declared neutral; dash (-) state threat
2. Opportunity has a value of (+) 11; Threat has a value (-) 6.

Analysis Strategy For Small And Medium Business Development Policy Gresik District In East Java
www.iosrjournals.org 7 | Page
Based on the results of the scoring of the factors internal and external environments above, it can be noted: (1)
power value (+) 19, (2) weakness has a value of (-) 10, (3) opportunities have value (+ ) 11, and (4) the threat
value (-) 6. Based on the results of the scoring of the factors internal and external environments above, it can be argued that
the point of intersection of each value strengths, weaknesses, opportunities and threats are located at point X as
shown in Figure 6 below.
Opportunity
III
Playing Strategies
I
Aggressive Strategy
Weakness Defensive Strategies
IV
Strength Diversification Strategy
II
Threat Figure 6. SWOT Analysis Diagram Matrix BUSINESS DEVELOPMENT small and medium enterprises (SMEs) in Gresik, East Java Province
Source: Results of Data Analysis Research, 2007; Processed.
From Figure 6 it can be argued that the point X (SWOT matrix analysis charts the development of small and
medium enterprises (SMEs) in Gresik, East Java lies in Quadrant I. This means generally small and medium
enterprises (SMEs) in Gresik in developing a business are in the most favorable conditions. Small and medium
enterprises (SMEs) in Gresik regency has many strengths that can be used to take advantage of opportunities to
achieve the goal. At these conditions, small and medium enterprises (SMEs) in Gresik should perform Strategy
Aggressive Growth. This is in accordance with the opinion of Jauch and Glueck (1999:286) [7] that the
strategy should be applied in this condition is to support aggressive growth policy (growth oriented strategy).
Analysis-Market Growth Matrix (BCG's Growth-Share Matrix) is based on the use of Market Growth Rate (Market Growth Rate) and Market Share Relative (Relative Market Share). The market growth rate presented by
the vertical axis, while the Relative Market Share represented by the horizontal axis.
The market growth rate can be calculated by the formula:
Industry Sales Volume - Volume Industrial Sales
Market Growth Rate = Year N Year N - 1
Industry Sales Volume Year N - 1
Relative market share can be calculated by the formula:
Industry Sales Volume Year N
Relative Market Share = x 100%
Main Competitors Sales Volume Year N Furthermore, the volume of sales of small and medium enterprises (SMEs) from Gresik and sales volume of
small and medium enterprises (SMEs) from BAKORWIL III Malang (competitors) can be seen in Table 1.
Table 1. Sales Volume of Small and Medium Enterprises (SMEs) from Gresik and BAKORWIL III Malang
(Competitor) Year 2004-2006
No Year Sales Volume of Small and Medium Enterprises (SMEs) (Euro / year)
Gresik BAKORWIL III Malang
1. 2004 283 500 250 648 750 250
2. 2005 315 million 720 million
3. 2006 356 500 500 792 250 500
Source: Results of Data Analysis Research, 2007; Processed
Based on Table 1, it can be calculated rate of market growth and relative market share, namely:
Market Growth Rate = 356500500-315000000 = 0.13 = 13%
315 million
Relative Market section = 356 500 500 x 100% = 45% = 0.45 792 250 500
Based on the calculation above, the rate of market growth of small and medium enterprises (SMEs) from Gresik
is 0.13 or 13%. Market growth rate of 13% categorized as high, since the measurement is greater than the

Analysis Strategy For Small And Medium Business Development Policy Gresik District In East Java
www.iosrjournals.org 8 | Page
standard market growth rate, ie 10% (Philip Kotler, 1992:169) [8] . The ratio between the volume of sales of
small and medium enterprises (SMEs) from Gresik regency with small and medium enterprises (SMEs) from
BAKORWIL III Malang in 2006 was 0.45. Relative market share of 0.45 considered low, because it is smaller than a standard measurement of the relative market share, which is 1.00 (Philip Kotler, 1992:169) [8] .
Furthermore, analysis of the matrix diagram Growth-Market Parts of Boston Consulting Group; BCG (BCG's
Growth-Share Matrix) small and medium enterprises (SMEs) in Gresik can be seen in Figure 7 below.
High Low
20%
STARS
High
Market Growth Rate
QUESTION MARKS
10%
Low
CASH COWS
0%
DOGS
10x 7,5x 5,0x 2,5x x 0,75x 0,50x 0,25x 0
Relative Market Share
Figure 7. Growth-Market Matrix (BCG's Growth-Share Matrix) ukm Kabupaten Gresik
Source: Results of Data Analysis Research, 2007; Processed
IV. Conclusion 1. Based on the results of the scoring of the internal and external environment that influence the development of
small and medium enterprises (SMEs) in Gresik which then formulated the matrix SWOT analysis diagram, the
strategic management of small and medium enterprise development in Gresik is located in Quadrant I, or
Aggressive Growth Strategy should perform or support an aggressive policy of growth (growth oriented
strategy).
2. Based on the results of the calculation of the growth rate of the market and the market is relatively businesses
of small and medium enterprises (SMEs) in Gresik which then formulated on the diagram analysis matrix Growth-The Market of the Boston Consulting Group; BCG (BCG's Growth-Share Matrix), the industrial
enterprises small and medium enterprises in Gresik in the position of Question Marks, or in other words, small
businesses and medium-sized industrial enterprises in Gresik regency has a chance to grow and develop, but
needed cash flow (cash flow) are sufficient in order to increase their relative market share.
3. Based on the results of the analysis of strategic management aspects of the external and internal environment
is formulated in matrix SWOT analysis diagram, calculating the market growth rate and relative market share is
formulated in matrix analysis diagram Growth - The Market of the Boston Consulting Group; BCG, and con-
fundamental consideration in order to determine the strategy, the strategic management model is offered for the
development of small and medium industrial enterprises in Gresik is doing Aggressive Growth Strategy to
Increase Market Section Relative (Relative Market Share).
4. Based on the results of the analysis of aspects of strategic management of the external and internal
environment is formulated in the diagram analysis matrix, SWOT, calculation of market growth and market share relative is formulated in the diagram analysis matrix Growth - The Market of the Boston Consulting
Group; BCG (BCG's Growth- Share Matrix), and basic considerations for establishing the strategy, the strategic
management model is offered for the development of small and medium industrial enterprises in Gresik are
doing Strategy Playing with Improved Growth Market (Market Growth Rate) and The Market Relative (Relative
Market Share ).
Recommendation

Analysis Strategy For Small And Medium Business Development Policy Gresik District In East Java
www.iosrjournals.org 9 | Page
1. In an effort to increase market share relative, while maintaining its aggressive growth strategy, the small and
medium industrial enterprises in Gresik advised to apply and develop the following strategies:
a. Generic Strategies, by one and / or more of the following strategies: (1) Increase market opportunities by producing the same cost as the main competitor or back regularly and get
in on a niche market that is not entered into the main competition.
(2) Build market share with lower prices (cost leadership), or differentiation strategy on quality, technology,
service, and innovation.
b. Focused strategy, by doing one and / or more strategies that focus on something different, as follows:
(1) Strategy to fill a gap - entered the market and focus on a narrow slit or the final consumer is ignored by
major competitors or market leader.
(2) Strategy specialist, specializing to establish the relative market share and competitive advantage through
specific capabilities to meet specific market segment, buyers with special needs.
(3) strategies targeting the premium market on the basis of which focus on product differentiation fancy or
unique. (4) The strategy that looks different, that take different positions with major competitors or market leader.
(5) acquisition strategy, ie joining or buying weaker competitors to form a new company that had a market share
larger or stronger competitive advantage.
2. In an effort to increase the rate of market growth and market share relative to support its aggressive growth
strategy, the small and medium industrial enterprises in Gresik also advised to development strategies as
follows:
a. Revise the old strategy: (1) to make changes to the approach of the new competition to rebuild the market
growth rate and relative market share, (2) improving internal operational activities and strategic to provide better
support to the company's overall strategy, (3) merger with another company to form synergies, (4) withdraw or
reduce activity not in accordance with the company's core business.
b. Make efforts to boost sales - lower prices, increase promotion, increase customer service, and improve the
performance of the product as soon as possible. c. Encourage reduction in costs through cost structure and flexibility of the company's value chain, including the
cost savings in general.
d. Selling assets that do not need to raise cash and save the effort.
e. Consider supplements steps as follows: (1) (assumed to still have the financial resources) to run an offensive
strategy based rotating low cost and differentiation, (2) maintain the offensive its market share, sales levels, and
competitive position at current levels and (3) Harv est strategy - trying to keep costs to a minimum outlay of
cash and trying to survive while out of the market as soon as possible on a regular basis.
References [1] Suwarsono, 1994. Strategic Management: Concepts and Context Analysis Tool, Academy of Management Company UPP YKPN,
Yogyakarta.
[2] Day, George S., 1990, Market Driven Strategy . New York: The Free Press.
[3] Pearce and Robinson, 2007, Strategic Management formulation, emplementation, and control. Mc Graw Hill, Company Inc. New
York.
[4] Erez, M. and F. Kanfer, 1983, “ The Role of Goal Acceptance in Goal Setting and Task Performance”, Academy of
Management Journal 8, no.3 (Juli): 457.
[5] Idrus, M.S. 1997. Strategi : Sebagai Upaya Untuk Meningkatkan Kinerja Organisasi dan Keunggulan Bersaing, Universitas
Brawijaya, Malang.
[6] Singarimbun, Masri dan Sofian Effendi, 1995, Metode Penelitian Survai , PT. Pustaka LP3ES Indonesia, Jakarta .
[7] Jauch, R. Lawrence and William F. Glueck, 1988, Strategic Management and Business Policy , McGraw-Hill , Inc.
[8] Philip kotler, 1992, Manajemen pemasaran (terjemahan), Prenhallindo, Jakarta.