ip2learn manual - isda.ncsa.uiuc.edu
TRANSCRIPT
IP2Learn Manual

Version 0.1
IP2Learn (Image Provenance to Learn) was created at the National Center for Supercomputing Applications, University of Illinois at Urbana-Champaign. We would like to acknowledge NARA and NCSA for the support. The main creators of IP2Learn are Rob Kooper and Peter Bajcsy. This document represents a current description of multiple on-going research and development efforts and hence it is updated on a regular basis.
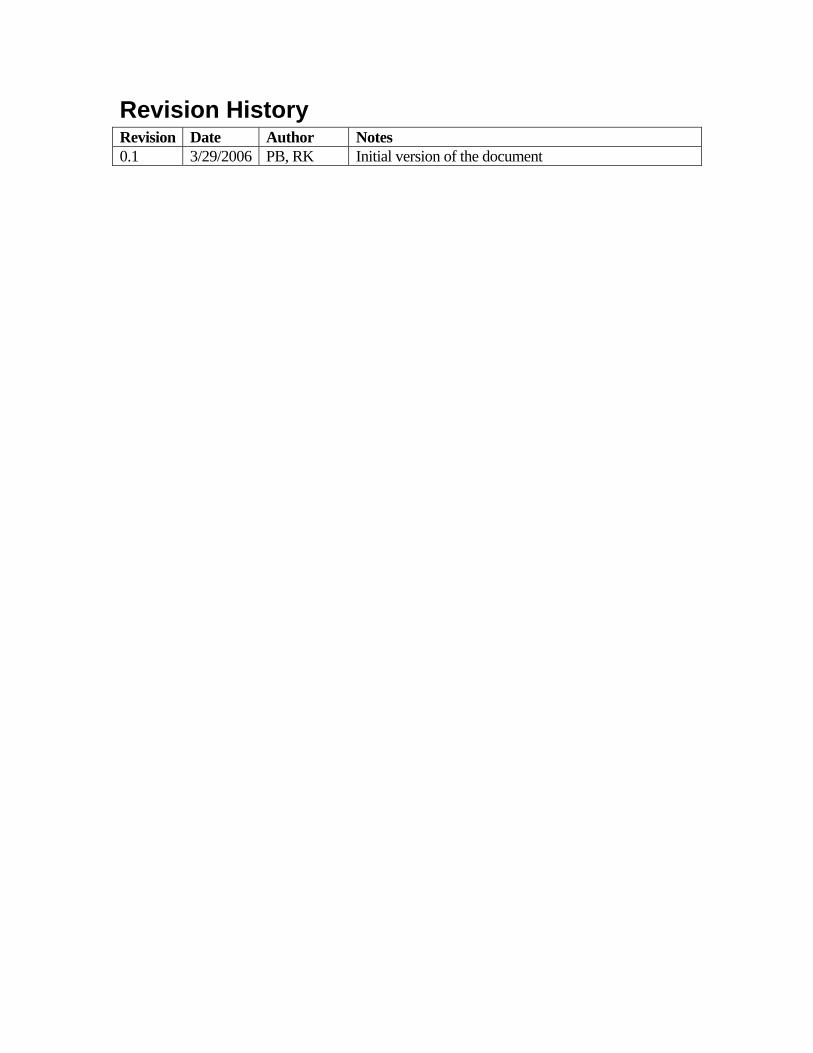
Revision History Revision Date Author Notes 0.1 3/29/2006 PB, RK Initial version of the document

i
Table of Contents
IP2Learn Manual ................................................................................................................ 1
Revision History ................................................................................................................. 3
Table of Contents................................................................................................................. i
Chapter 1 Introduction ........................................................................................................ 2 1.1 IP2Learn Overview.................................................................................................... 2 1.2 IP2Learn Execution ................................................................................................... 4 1.3 How to Use IP2Learn................................................................................................. 5
Chapter 2 IP2Learn Functionality Description ................................................................... 9 2.1 Image Inspection Tool ............................................................................................... 9 2.2 Provenance Information Tool .................................................................................. 13
Appendix A Software License .......................................................................................... 20
Introduction
2
Chapter 1 Introduction The motivation for developing IP2Learn (Image Provenance to Learn) comes from academic, government and industrial collaborations that involve development of new computer methods and solutions for provenance information gathering. The main driver behind the IP2Learn development was information gathering about decision processes using geospatial electronic records and the need to perform quantitative evaluations of computational cost versus information granularity tradeoffs of information gathering. We envision the use of IP2Learn for not only evaluations of cost versus information granularity tradeoffs of information gathering but also for auditing and quality control purposes as well as for education and training purposes. The goal of this document is to explain how to use IP2Learn.
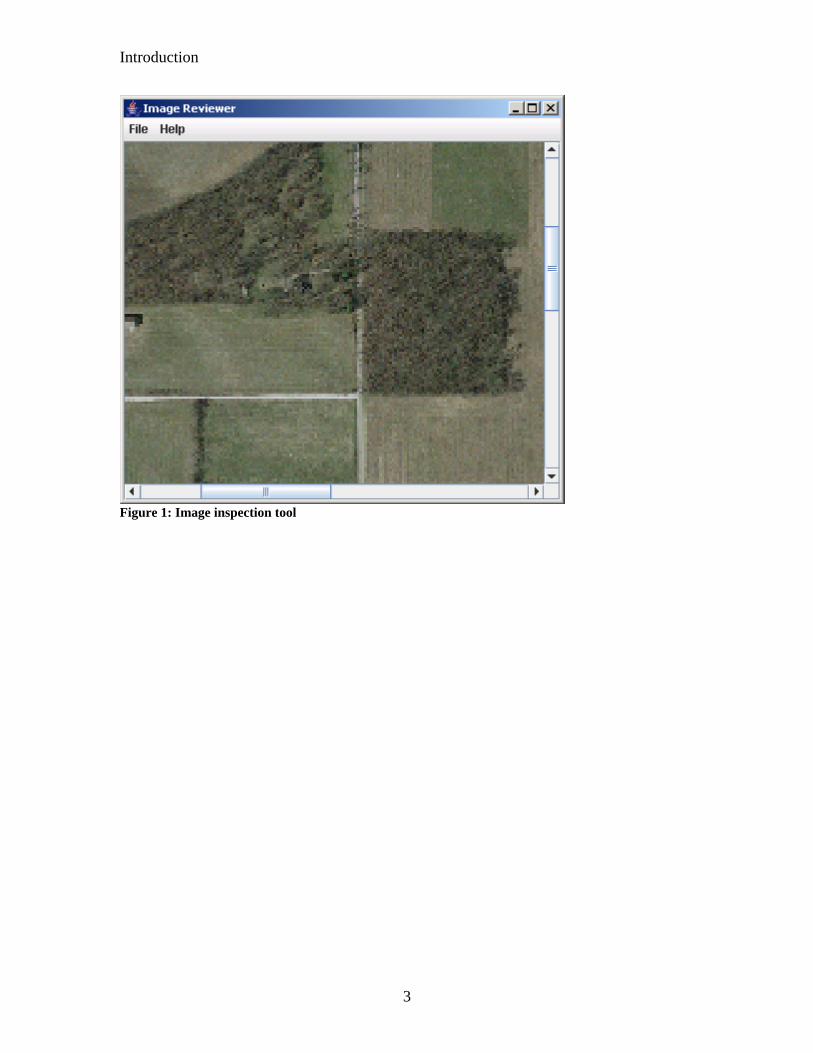
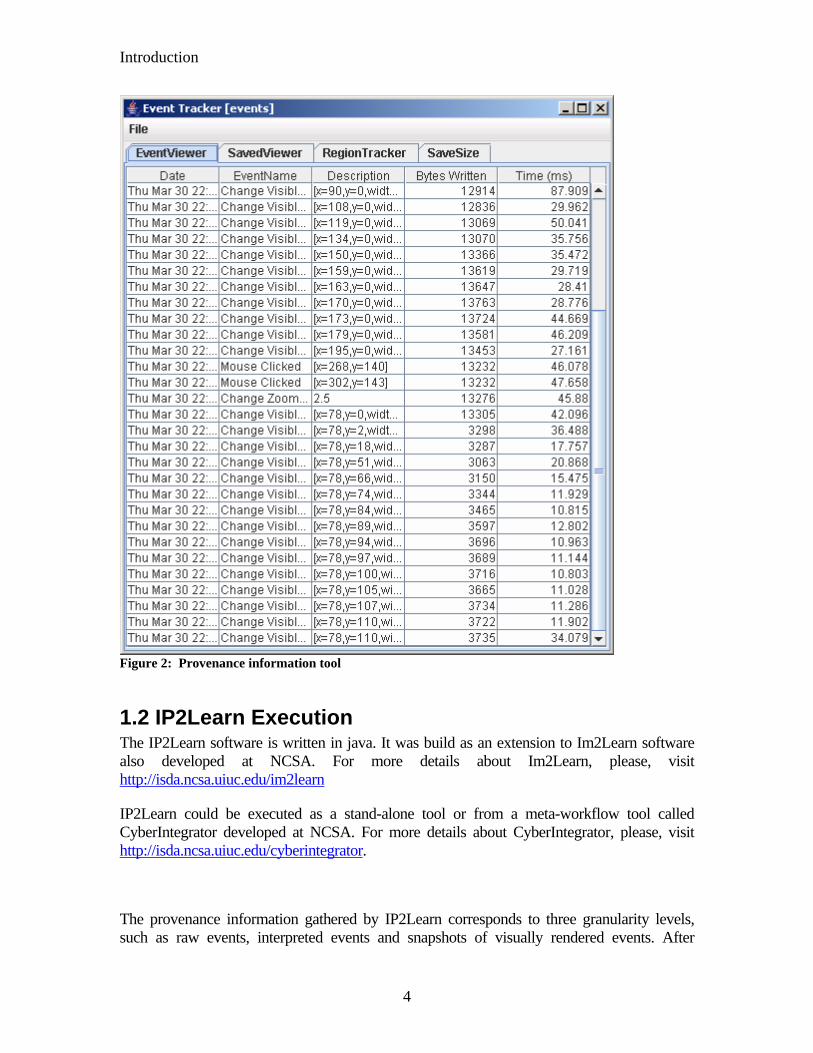
1.1 IP2Learn Overview IP2Learn consists of two main parts. The first part is the image inspection tool represented by a frame with a simple menu and its content represented by an image panel. The image inspection tool allows users to load and manipulate images (zoom, crop, sub-area view, band selection, image information, annotation, grayscale view, and gamma adjustment). These software functionality features form a basic set of image inspection operations that are frequently used during image inspection. Section 2.1 describes functionalities in more details. The second part is the tool that gathers image provenance information, provides real-time visualization of gathered information, and allows changing the provenance gathering settings. Section 2.2 explains information provided by the provenance information tool in more details.
Introduction
3
Figure 1: Image inspection tool
Introduction
4
Figure 2: Provenance information tool
1.2 IP2Learn Execution The IP2Learn software is written in java. It was build as an extension to Im2Learn software also developed at NCSA. For more details about Im2Learn, please, visit http://isda.ncsa.uiuc.edu/im2learn
IP2Learn could be executed as a stand-alone tool or from a meta-workflow tool called CyberIntegrator developed at NCSA. For more details about CyberIntegrator, please, visit http://isda.ncsa.uiuc.edu/cyberintegrator.
The provenance information gathered by IP2Learn corresponds to three granularity levels, such as raw events, interpreted events and snapshots of visually rendered events. After
Introduction
5
finishing a session with IP2Learn, the provenance information will be stored in three zip files named onlyInterpreted.zip, onlyRawEvent.zip and onlyVisSnapshot.zip. These three files will be located in the directory from where IP2Learn was launched.
Hardware requirements: For information gathering about large size images, it is recommended to have at least 1GB of RAM. The execution duration depends on the hardware specification and the algorithmic computational needs.
Software requirements: IP2Learn will run on any operating system with an installation of Java 1.5. Once all hardware and software requirements are met, ip2learn.zip should be extracted to an installation directory. IP2Learn is then executed by double clicking on the ip2learn.bat file.
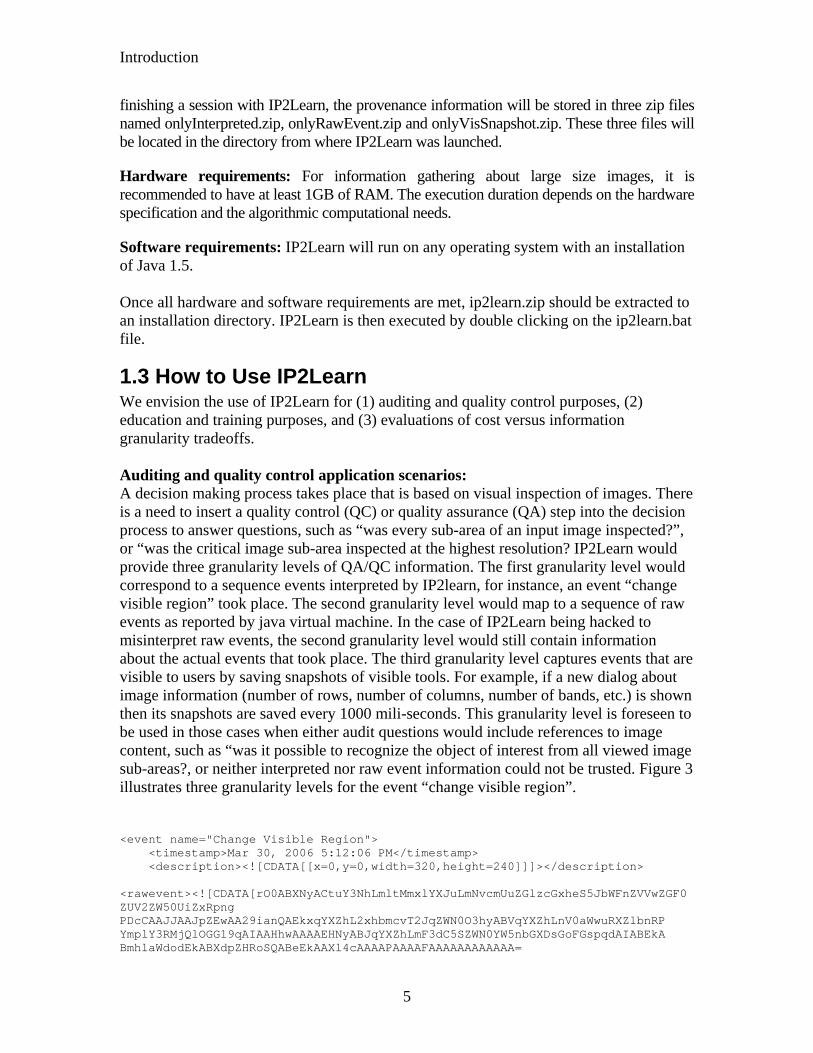
1.3 How to Use IP2Learn We envision the use of IP2Learn for (1) auditing and quality control purposes, (2) education and training purposes, and (3) evaluations of cost versus information granularity tradeoffs. Auditing and quality control application scenarios: A decision making process takes place that is based on visual inspection of images. There is a need to insert a quality control (QC) or quality assurance (QA) step into the decision process to answer questions, such as “was every sub-area of an input image inspected?”, or “was the critical image sub-area inspected at the highest resolution? IP2Learn would provide three granularity levels of QA/QC information. The first granularity level would correspond to a sequence events interpreted by IP2learn, for instance, an event “change visible region” took place. The second granularity level would map to a sequence of raw events as reported by java virtual machine. In the case of IP2Learn being hacked to misinterpret raw events, the second granularity level would still contain information about the actual events that took place. The third granularity level captures events that are visible to users by saving snapshots of visible tools. For example, if a new dialog about image information (number of rows, number of columns, number of bands, etc.) is shown then its snapshots are saved every 1000 mili-seconds. This granularity level is foreseen to be used in those cases when either audit questions would include references to image content, such as “was it possible to recognize the object of interest from all viewed image sub-areas?, or neither interpreted nor raw event information could not be trusted. Figure 3 illustrates three granularity levels for the event “change visible region”. <event name="Change Visible Region"> <timestamp>Mar 30, 2006 5:12:06 PM</timestamp> <description><![CDATA[[x=0,y=0,width=320,height=240]]]></description> <rawevent><
Introduction
6
]]></rawevent> <snapshot file="Change Visible Region/00000000.jpg"</snapshot> </event> Figure 3: Three granularity levels of provenance information about the event “change visible region” using a scroll bar. The interpreted event is delimited by the “description” tags. The raw event is denoted by the “rawevent” tags. Finally, the snapshot of the visible region is delimited by the “snapshot” tags and refers to a jpg image of the visible region. Education and training application scenario: In this case, IP2Learn would collect snapshots of all visible events during image inspections by either experts or novices. A movie could be created from the temporally stamped snapshots. The movie replay would be then used for education if inspections were conducted by experts or for training if inspections were performed by novices. The events themselves can also be replayed to reconstruct the sequence of events occurring during the use of IP2Learn. It is also possible to gather information about all interpreted events and use the information for grading students if additional software would be developed for this purpose. Evaluations of cost versus information granularity tradeoffs: The IP2Learn prototype allows studying the n-dimensional space of parameters associated with (a) tool components (windows and window content such image panel), (b) event types (e.g., new image, change zoom, change gamma, …), and (c) event information granularity (raw events, interpreted events, snapshots of visible events). The metric for evaluating computational costs of provenance information gathering is currently the disk space and time it takes to write out provenance information to a local hard drive. The use of IP2Learn in this case is illustrated in Figure 4 and Figure 5 with a detailed description in the associated captions. IP2Learn enables not only to select the preferences about information granularity and to save the provenance information but also to provide real-time summaries and plots of information gathering costs (memory and time).
Introduction
7
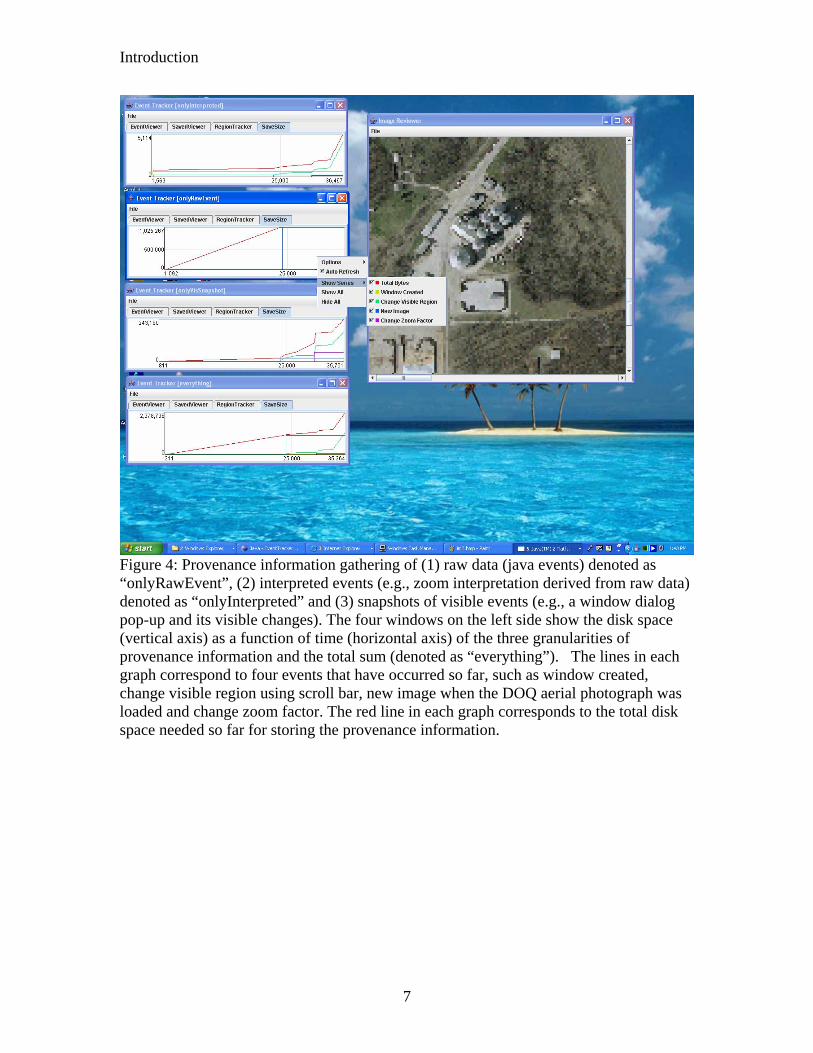
Figure 4: Provenance information gathering of (1) raw data (java events) denoted as “onlyRawEvent”, (2) interpreted events (e.g., zoom interpretation derived from raw data) denoted as “onlyInterpreted” and (3) snapshots of visible events (e.g., a window dialog pop-up and its visible changes). The four windows on the left side show the disk space (vertical axis) as a function of time (horizontal axis) of the three granularities of provenance information and the total sum (denoted as “everything”). The lines in each graph correspond to four events that have occurred so far, such as window created, change visible region using scroll bar, new image when the DOQ aerial photograph was loaded and change zoom factor. The red line in each graph corresponds to the total disk space needed so far for storing the provenance information.
Introduction
8
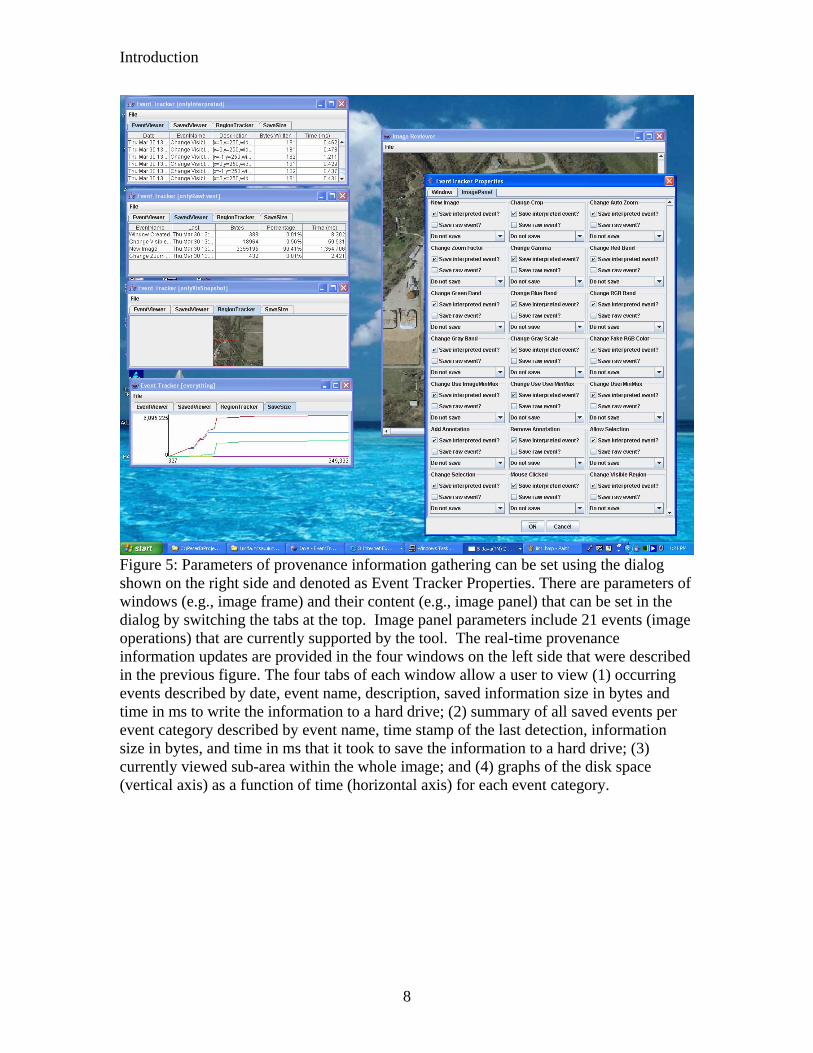
Figure 5: Parameters of provenance information gathering can be set using the dialog shown on the right side and denoted as Event Tracker Properties. There are parameters of windows (e.g., image frame) and their content (e.g., image panel) that can be set in the dialog by switching the tabs at the top. Image panel parameters include 21 events (image operations) that are currently supported by the tool. The real-time provenance information updates are provided in the four windows on the left side that were described in the previous figure. The four tabs of each window allow a user to view (1) occurring events described by date, event name, description, saved information size in bytes and time in ms to write the information to a hard drive; (2) summary of all saved events per event category described by event name, time stamp of the last detection, information size in bytes, and time in ms that it took to save the information to a hard drive; (3) currently viewed sub-area within the whole image; and (4) graphs of the disk space (vertical axis) as a function of time (horizontal axis) for each event category.
IP2Learn Functionality Description
9
Chapter 2 IP2Learn Functionality Description
2.1 Image Inspection Tool This section describes the image inspection tool and image operations that a user would want to use during image inspection.
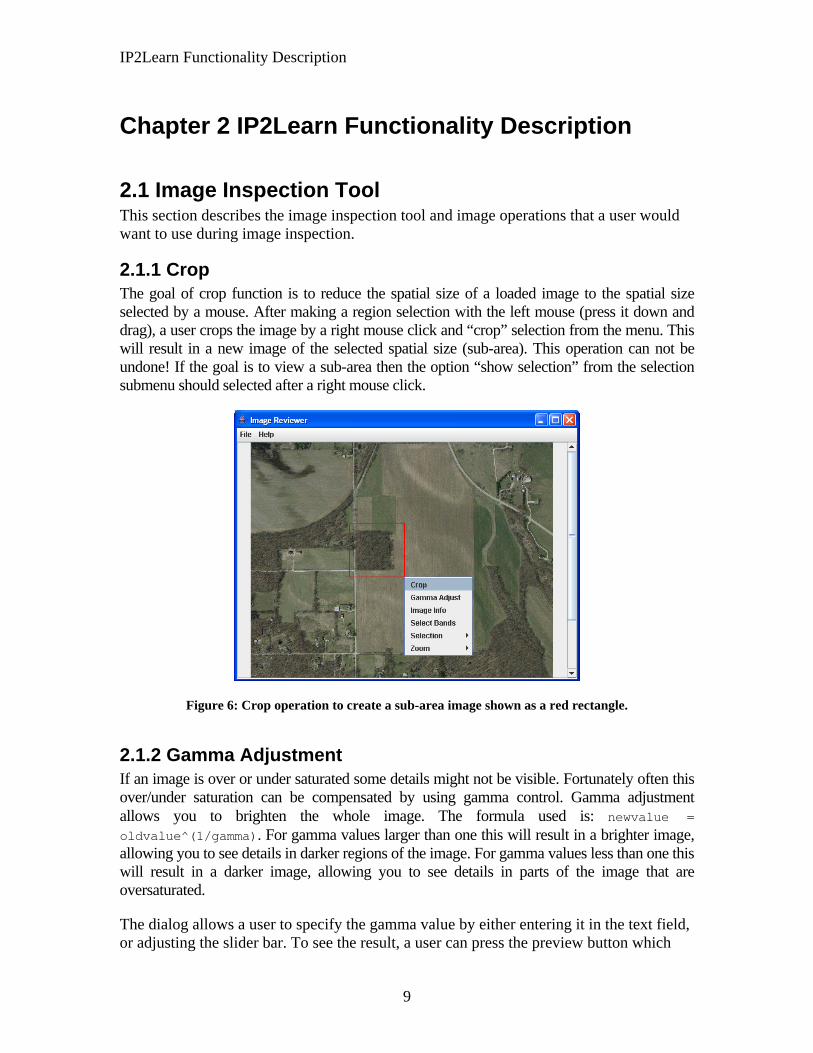
2.1.1 Crop The goal of crop function is to reduce the spatial size of a loaded image to the spatial size selected by a mouse. After making a region selection with the left mouse (press it down and drag), a user crops the image by a right mouse click and “crop” selection from the menu. This will result in a new image of the selected spatial size (sub-area). This operation can not be undone! If the goal is to view a sub-area then the option “show selection” from the selection submenu should selected after a right mouse click.
Figure 6: Crop operation to create a sub-area image shown as a red rectangle.
2.1.2 Gamma Adjustment If an image is over or under saturated some details might not be visible. Fortunately often this over/under saturation can be compensated by using gamma control. Gamma adjustment allows you to brighten the whole image. The formula used is: newvalue = oldvalue^(1/gamma). For gamma values larger than one this will result in a brighter image, allowing you to see details in darker regions of the image. For gamma values less than one this will result in a darker image, allowing you to see details in parts of the image that are oversaturated.
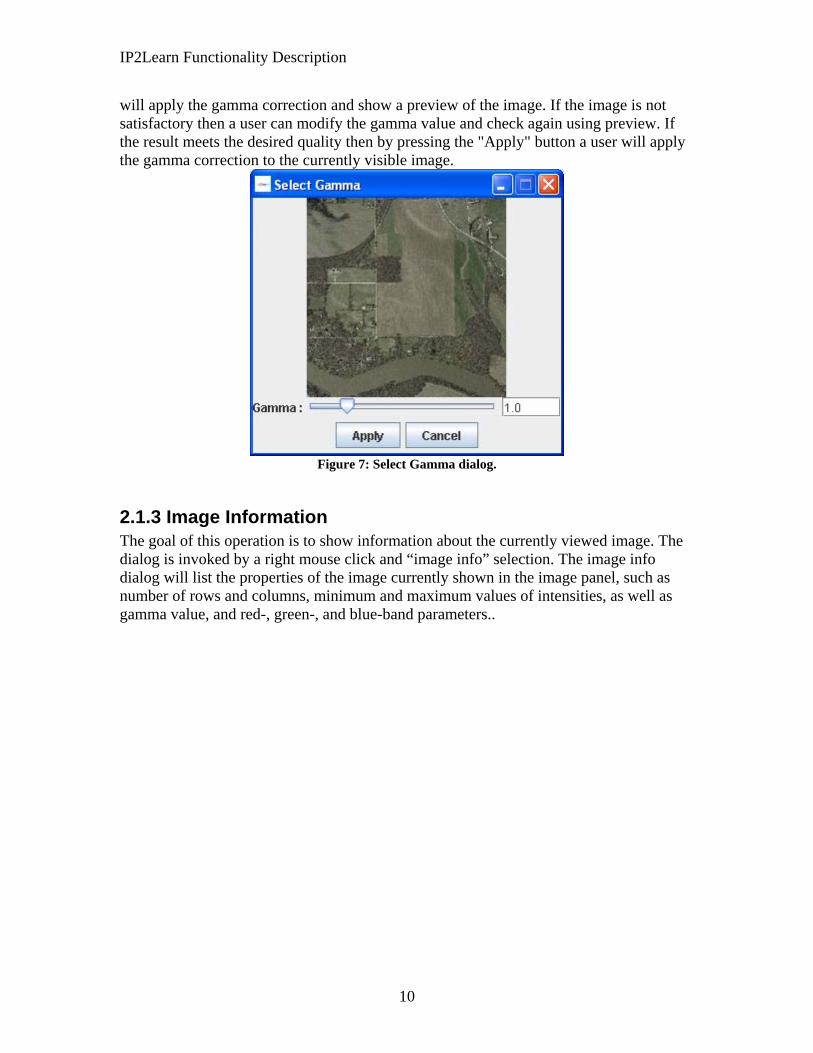
The dialog allows a user to specify the gamma value by either entering it in the text field, or adjusting the slider bar. To see the result, a user can press the preview button which
IP2Learn Functionality Description
10
will apply the gamma correction and show a preview of the image. If the image is not satisfactory then a user can modify the gamma value and check again using preview. If the result meets the desired quality then by pressing the "Apply" button a user will apply the gamma correction to the currently visible image.
Figure 7: Select Gamma dialog.
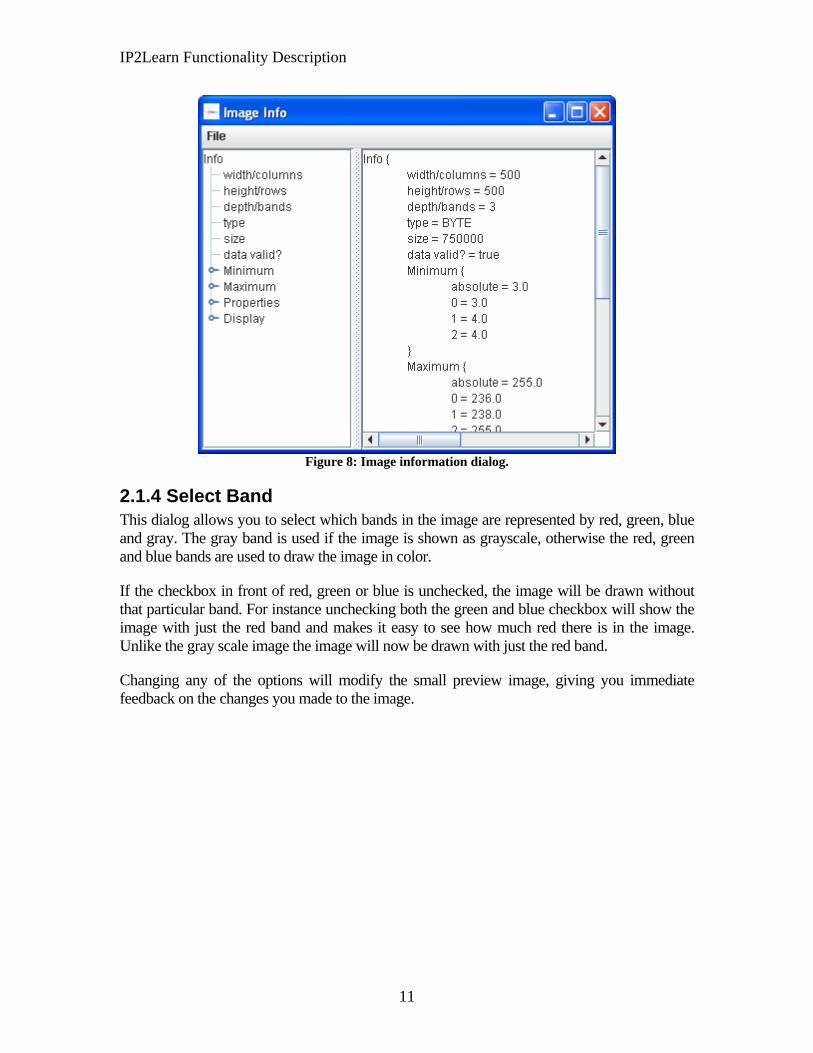
2.1.3 Image Information The goal of this operation is to show information about the currently viewed image. The dialog is invoked by a right mouse click and “image info” selection. The image info dialog will list the properties of the image currently shown in the image panel, such as number of rows and columns, minimum and maximum values of intensities, as well as gamma value, and red-, green-, and blue-band parameters..
IP2Learn Functionality Description
11
Figure 8: Image information dialog.
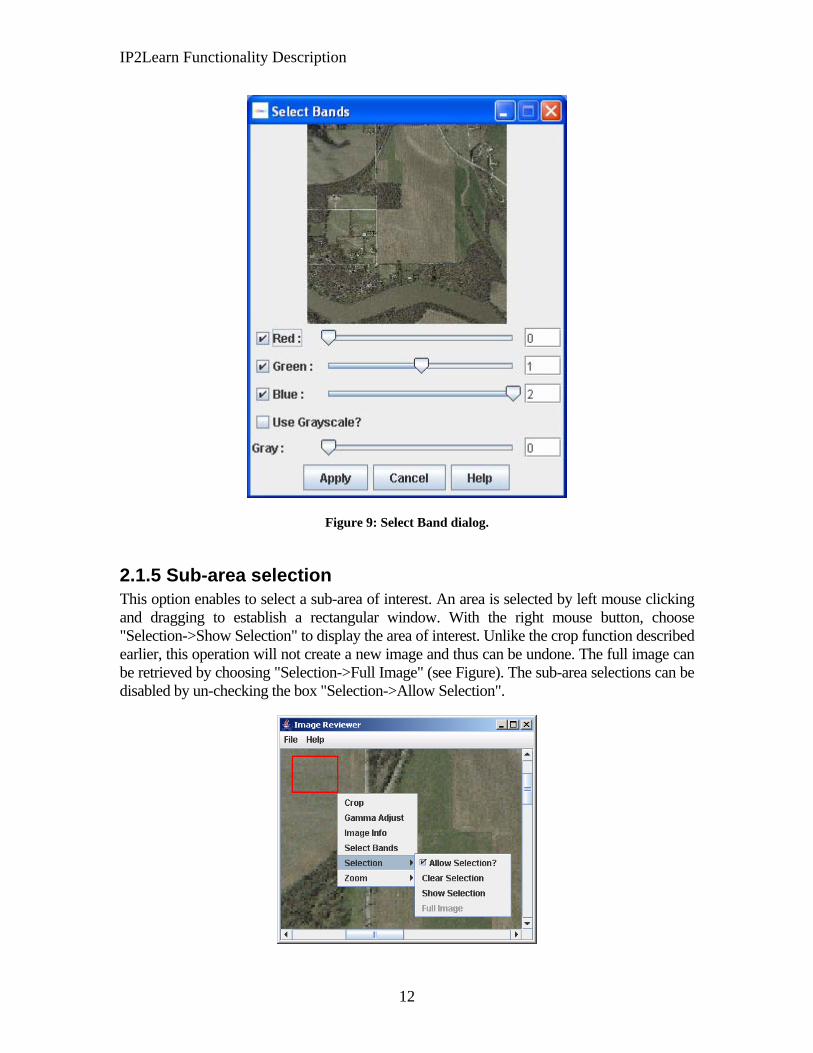
2.1.4 Select Band This dialog allows you to select which bands in the image are represented by red, green, blue and gray. The gray band is used if the image is shown as grayscale, otherwise the red, green and blue bands are used to draw the image in color.
If the checkbox in front of red, green or blue is unchecked, the image will be drawn without that particular band. For instance unchecking both the green and blue checkbox will show the image with just the red band and makes it easy to see how much red there is in the image. Unlike the gray scale image the image will now be drawn with just the red band.
Changing any of the options will modify the small preview image, giving you immediate feedback on the changes you made to the image.
IP2Learn Functionality Description
12
Figure 9: Select Band dialog.
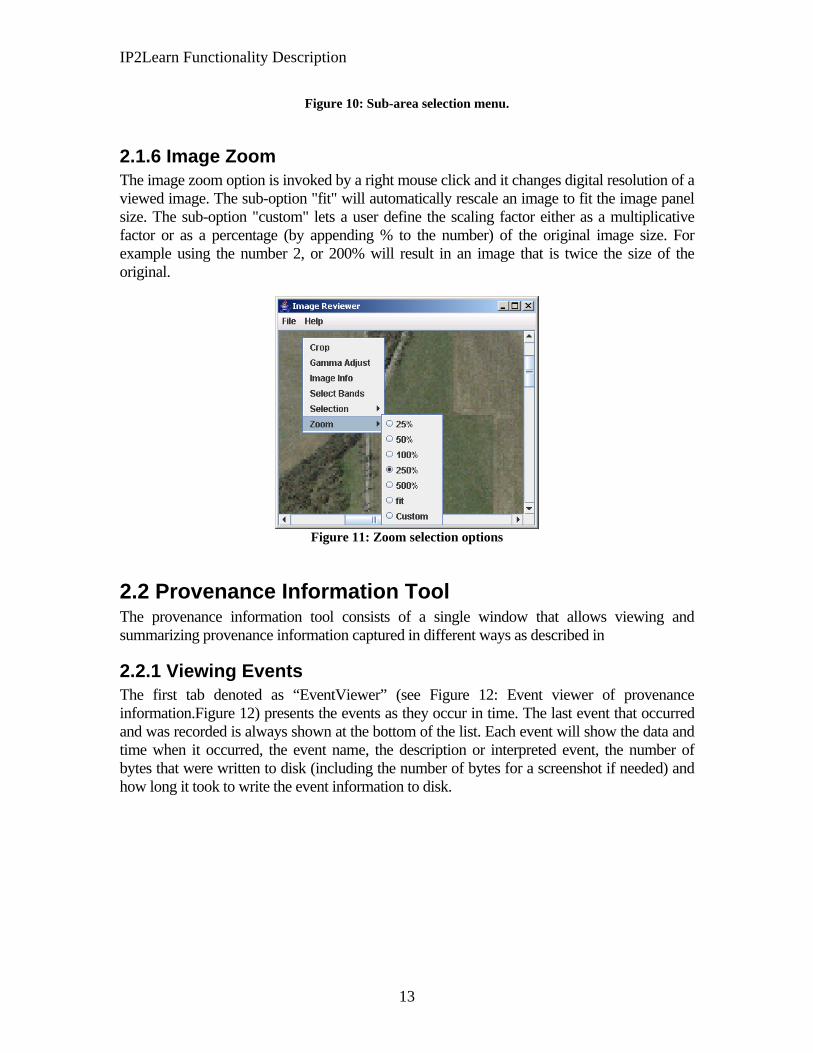
2.1.5 Sub-area selection This option enables to select a sub-area of interest. An area is selected by left mouse clicking and dragging to establish a rectangular window. With the right mouse button, choose "Selection->Show Selection" to display the area of interest. Unlike the crop function described earlier, this operation will not create a new image and thus can be undone. The full image can be retrieved by choosing "Selection->Full Image" (see Figure). The sub-area selections can be disabled by un-checking the box "Selection->Allow Selection".
IP2Learn Functionality Description
13
Figure 10: Sub-area selection menu.
2.1.6 Image Zoom The image zoom option is invoked by a right mouse click and it changes digital resolution of a viewed image. The sub-option "fit" will automatically rescale an image to fit the image panel size. The sub-option "custom" lets a user define the scaling factor either as a multiplicative factor or as a percentage (by appending % to the number) of the original image size. For example using the number 2, or 200% will result in an image that is twice the size of the original.
Figure 11: Zoom selection options
2.2 Provenance Information Tool The provenance information tool consists of a single window that allows viewing and summarizing provenance information captured in different ways as described in
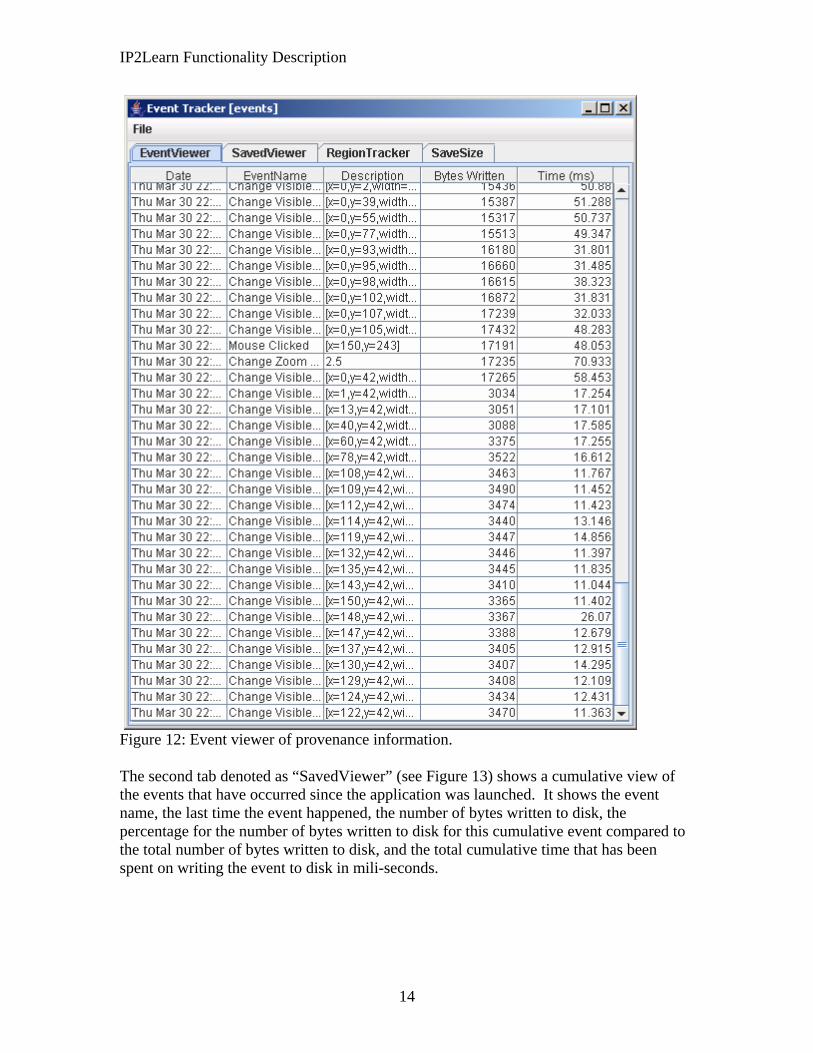
2.2.1 Viewing Events The first tab denoted as “EventViewer” (see Figure 12: Event viewer of provenance information.Figure 12) presents the events as they occur in time. The last event that occurred and was recorded is always shown at the bottom of the list. Each event will show the data and time when it occurred, the event name, the description or interpreted event, the number of bytes that were written to disk (including the number of bytes for a screenshot if needed) and how long it took to write the event information to disk.
IP2Learn Functionality Description
14
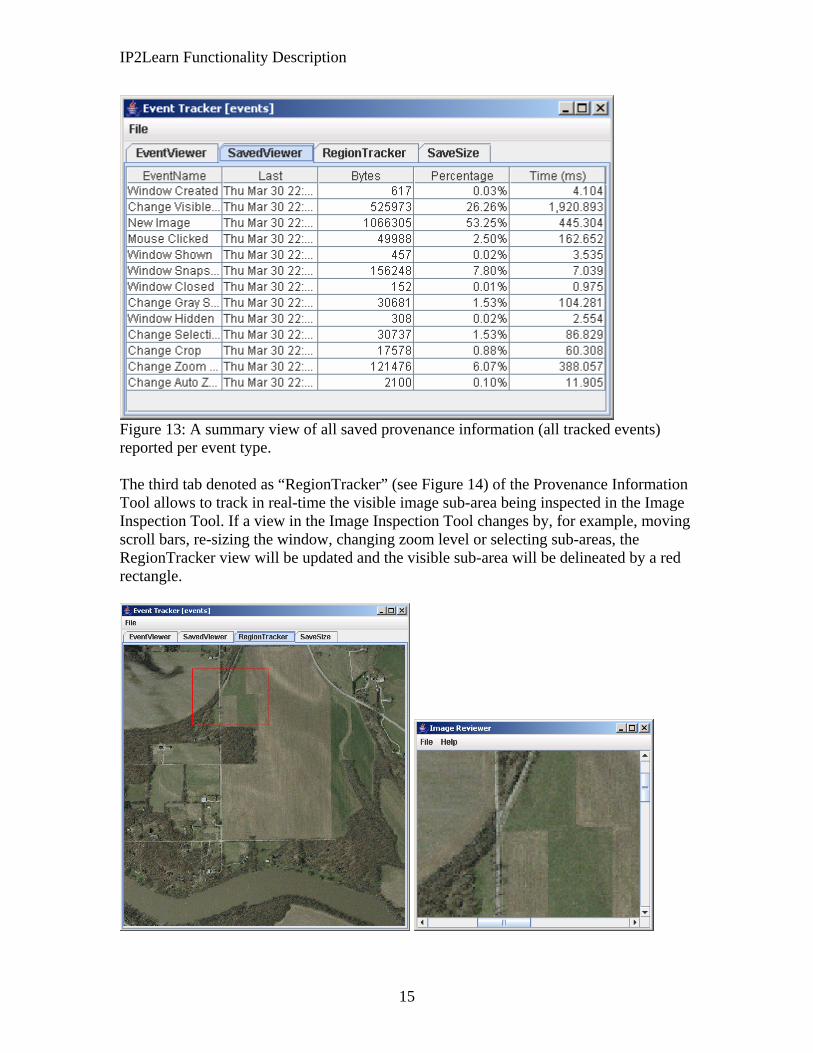
Figure 12: Event viewer of provenance information. The second tab denoted as “SavedViewer” (see Figure 13) shows a cumulative view of the events that have occurred since the application was launched. It shows the event name, the last time the event happened, the number of bytes written to disk, the percentage for the number of bytes written to disk for this cumulative event compared to the total number of bytes written to disk, and the total cumulative time that has been spent on writing the event to disk in mili-seconds.
IP2Learn Functionality Description
15
Figure 13: A summary view of all saved provenance information (all tracked events) reported per event type. The third tab denoted as “RegionTracker” (see Figure 14) of the Provenance Information Tool allows to track in real-time the visible image sub-area being inspected in the Image Inspection Tool. If a view in the Image Inspection Tool changes by, for example, moving scroll bars, re-sizing the window, changing zoom level or selecting sub-areas, the RegionTracker view will be updated and the visible sub-area will be delineated by a red rectangle.
IP2Learn Functionality Description
16
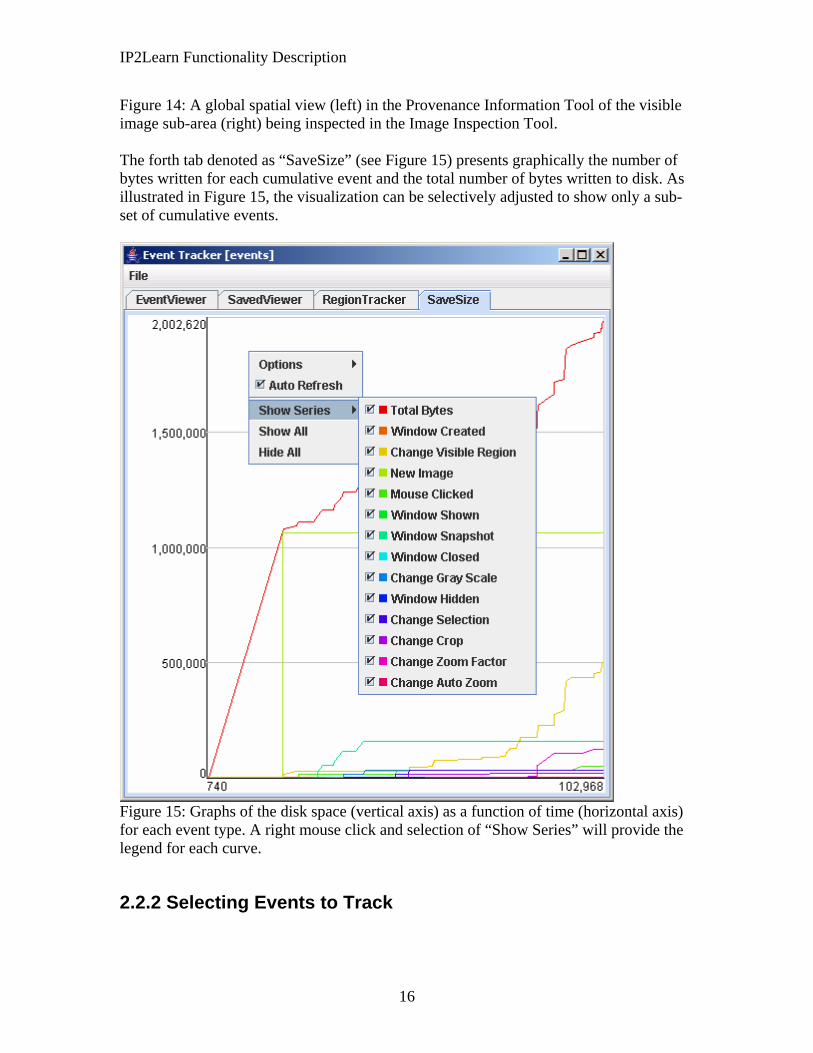
Figure 14: A global spatial view (left) in the Provenance Information Tool of the visible image sub-area (right) being inspected in the Image Inspection Tool. The forth tab denoted as “SaveSize” (see Figure 15) presents graphically the number of bytes written for each cumulative event and the total number of bytes written to disk. As illustrated in Figure 15, the visualization can be selectively adjusted to show only a sub-set of cumulative events.
Figure 15: Graphs of the disk space (vertical axis) as a function of time (horizontal axis) for each event type. A right mouse click and selection of “Show Series” will provide the legend for each curve.
2.2.2 Selecting Events to Track
IP2Learn Functionality Description
17
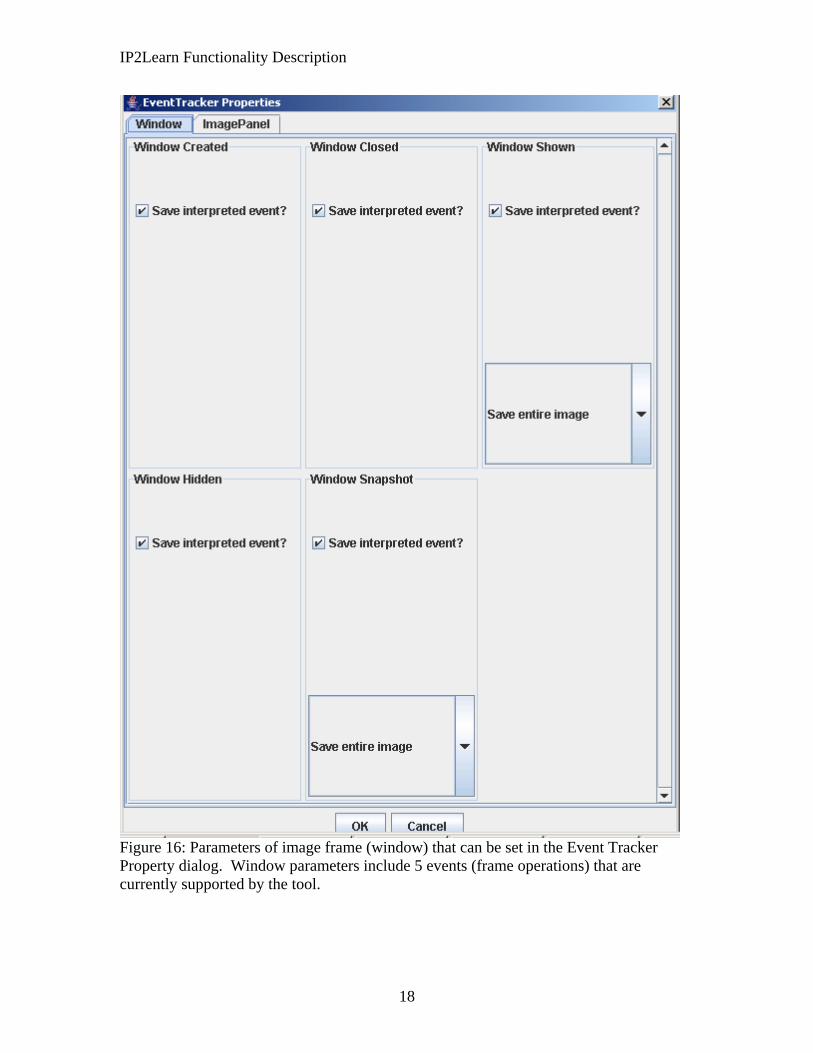
A user can select what event types would be tracked and saved to disk by invoking a dialog under the “File” menu of the Provenance Information Tool. The name of the dialog is “EventTracker Properties”. The first tab will allow selecting those events that are specifics to windows, for instance, events of windows being created, shown and closed (or hidden). The second tab enables selections of those events that are specific to the image panel, e.g., new image was loaded, visible region changed, or gamma value changed. A user can select what provenance information granularity should to be saved from the options, such as interpreted event, raw event, or frequent screen shots of screen visible events.
IP2Learn Functionality Description
18
Figure 16: Parameters of image frame (window) that can be set in the Event Tracker Property dialog. Window parameters include 5 events (frame operations) that are currently supported by the tool.
IP2Learn Functionality Description
19
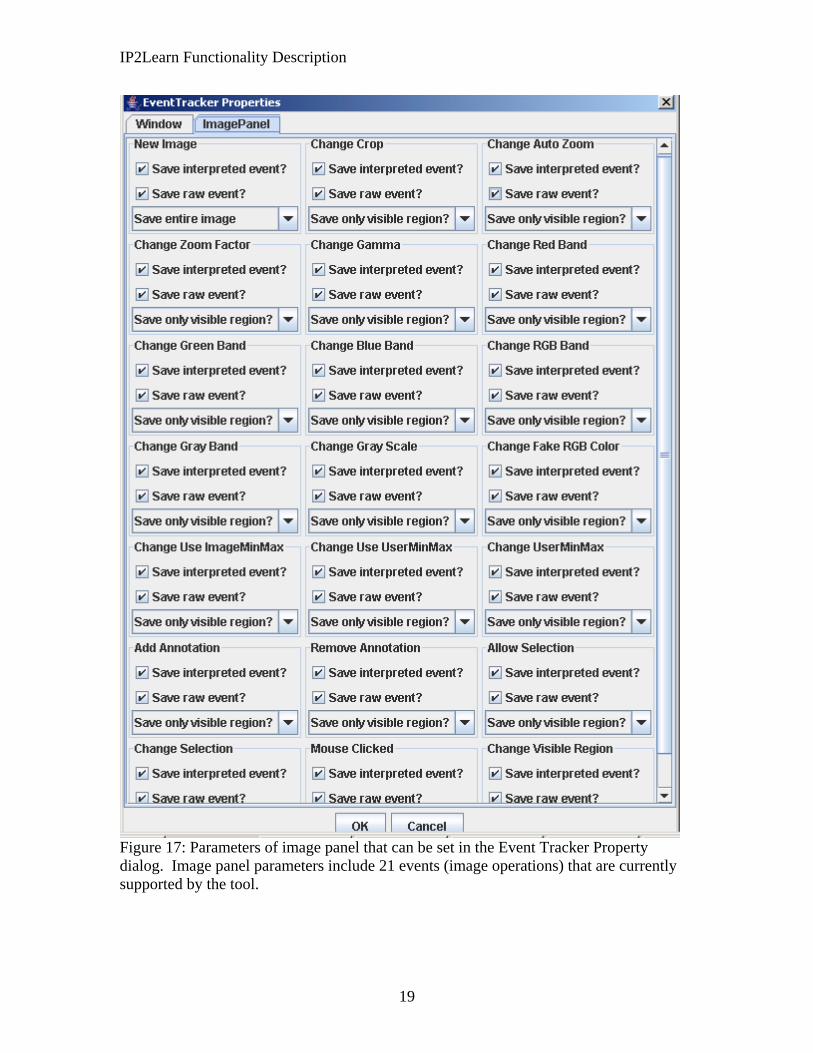
Figure 17: Parameters of image panel that can be set in the Event Tracker Property dialog. Image panel parameters include 21 events (image operations) that are currently supported by the tool.

Software License
20
Software License
The software is owned by the University of Illinois at Urbana-Champaign.