ipo underpricing can it be predicted? - simple search531502/fulltext01.pdf · ipo underpricing –...
TRANSCRIPT

IPO Underpricing – Can it be
predicted? - A quantitative research study of Swedish IPOs 1997-2011
Master Thesis within: International Finance
Authors: Markus Sandsjö
Jakob Westgren
Tutor: Urban Österlund
Jönköping, Sweden May 2012

i
Acknowledgements
Both of us would like to express our honest gratitude to all the people who have made this thesis possible to accomplish.
First of all we would like to send many thanks to our tutor ass. Prof. Urban Österlund who have encouraged us and given us imperative feedback throughout our work.
We would also like to give a special thank you to Viktor Tingström at Bank of America Meryll Lynch and Anita Sandström at Swedish Financial Supervisory Authority who helped us in the data collection stage.
Last but not least we would like to thank our fellow students at JIBS for their positive encouragement and the constructive feedback during the seminars.
……………………………….
Markus Sandsjö
……………………………….
Jakob Westgren
Jönköping International Business School, May 2012

ii
Master Thesis within International Finance
Title: IPO Underpricing – Can it be predicted?
Year of Publication: 2012
Authors: Markus Sandsjö and Jakob Westgren
Tutor: Urban Österlund
Keywords: Initial Public Offering, IPO, IPO Underpricing, Corporate Finance,
Stock Offer Price, Ownership Retention, Operating Cash Flow
Abstract Background: When a company sells shares of their business to the public for the first time, it is called an Initial Public Offering, IPO. The IPO is usually conducted by the issuing firm to raise capital for their future growth. Before the IPO the information about the issuing company is often limited and the investment in an IPO is associated with risks. The investors who choose to invest in an IPO are therefore usually compensated with a discount on the shares and often experience a first day positive return. This first day positive return is the definition of underpricing. If the majority of the IPOs are underpriced it should be of interest for an investor to take part of this opportunity and use it as an investment strategy. This thesis investigates if there is a way to predict which IPOs that will generate a positive first day return based on the information in the IPO prospect.
Purpose: The purpose of this thesis is to describe and examine how the underpricing of IPOs is influenced by Offer Price, Ownership Retention and Operating Cash Flow on the Swedish Stock Exchange, NASDAQ OMX Nordic Stockholm between 1997 and 2011.
Method: This is solely a quantitative study. We first created a database of the IPOs conducted on the OMX Stockholm within our sample period. The database consisted of each IPO’s Offer Price, Ownership Retention and Operating Cash Flow. This was followed by statistical calculations in order to confirm or reject a relationship.
Conclusion: The result of this study shows that it is hard for investors to rely solely on information from the IPO prospect when predicting which IPOs that will generate a first day positive return. The variable that generated the strongest relationship with underpricing was the Offer Price. However, the relationship was not linear, but we found a trading range in where investors find the most attractive prices of the stocks. The range was found to be most frequently underpriced and ranged between 47-69 SEK. We draw the conclusion that investors are irrational and that they many times overlook financial fundamentals such as Operating Cash Flow, and rather trust the market’s hype when choosing the IPOs to invest in.

iii
Magisteruppsats i Internationell Finans
Titel: Underprissättning av IPO – Går det att förutspå?
Publiceringsår: 2012
Författare: Markus Sandsjö and Jakob Westgren
Handledare: Urban Österlund
Nyckelord: Börsintroduktion, IPO, IPO Underprissättning, Finansiell Ekonomi,
Aktiepris, Ägarandel efter IPO, Operativt Kassaflöde
Abstrakt Bakgrund: En IPO är det första erbjudandet av företagets aktier till den publika marknaden. En IPO genomförs ofta i samband med att företaget behöver ta in nytt kapital för framtida investeringar. Innan ett företag blir publikt är informationsinsynen begränsad vilket medför en risk för den som vill investera i det initiala erbjudandet. Investerarna som väljer att investera i erbjudandet är ofta kompenserade med en rabatt på aktierna och får då ofta en positiv avkastning på första handelsdagen. Denna initiala avkastning definieras som underprissättningen av erbjudandet. Om en majoritet av börsnoteringarna är underprissatta skulle det vara av stort intresse för investerare att upprepande investera i IPOs och ha detta som investeringsstrategi. Den här uppsatsen undersöker om det går att förutspå vilka IPOs som genererar en positiv avkastning första handelsdagen baserat på den informationen som finns att tillgå i IPO prospektet.
Syfte: Syftet med denna uppsats är att beskriva och utreda hur underprissättning vid börsintroduktioner på Stockholmsbörsen är påverkade av aktiepriset, ägarbehållande och operativt kassaflöde mellan 1997 och 2011.
Metod: Det här är uteslutande en kvantitativ studie. Initialt byggde vi en databas med alla genomförda IPOs på stockholmsbörsen under urvalsperioden. Databasen innehöll bland annat information om varje IPOs aktiepris, ägarbehållningen och dess operativa kassaflöde. Vidare genomfördes statiska tester för att acceptera alternativt att förkasta våra hypoteser om förhållanden mellan variablerna och underprissättningen.
Slutsats: Resultatet av denna studie visar att det är svårt för investerare att uteslutande förlita sig på IPO prospektet för att förutspå vilka IPOs som kommer generera en positiv avkastning första handelsdagen. Variabeln som genererade det starkaste förhållandet med underprissättning var aktiepriset. Relationen var inte fullt linjär men vi hittade ett prisintervall som var mest attraktivt för investerare. Detta intervall låg mellan 47-69 SEK. Vi drar slutsatsen att investerare är irrationella och att de ofta förbiser fundamental finansiell data så som operativt kassaflöde och istället litar på marknadens ”hype” när de väljer vilka IPOs att investera i.
iv
Glossary
Aftermarket Trading on the open market. Often high
liquidity and volume the first days after an IPO.
Alpha-level (α) or
Significance-level
The probability of committing a type I error,
rejecting a true hypothesis. (1 – α) is referred
to as the confidence level.
Chi-Square Test (Χ2) Statistical hypothesis test of equally
proportions among groups.
Initial Public Offering (IPO) The first sale of a stock to the public by a
private company. Often issued to raise capital
for future growth.
IPO Prospect Compiling document with information to the
investors about the issuing firm. Value, Offer,
Risk and key figures are often covered.
Linear Regression Statistical approach for modelling the
relationship between one dependent and one
independent variable.
Money left on the table Lost capital by the issuing firm that could have
been raised if the offer price would have been
higher.
Operating Cash Flow (OCF) The cash flow generated by adding
depreciation and previously deducted tax back
to the net income.
Ownership Retention Part of the company retained by the pre-IPO
owners after the IPO is conducted.
Premarket Period before the stock is introduced and
traded publicly on the open market.
Standard Deviation Statistical measure of variability. Shows the
dispersion from the mean.
Stock Offer Price Initial price for the new stock issue. Can be
found in the IPO prospect.
Underpricing Pricing of IPO below its market value. When
the offer price is below the closing price the
first day of trade at the stock market.

v
Table of Contents
1 Introduction ............................................................................... 1
1.1 Background ............................................................................................ 1 1.1.1 Initial Public Offering ............................................................................... 1 1.1.2 IPO Underpricing .................................................................................... 1 1.2 Problem Discussion ................................................................................ 3
1.3 Research Questions ............................................................................... 4 1.4 Purpose .................................................................................................. 4 1.5 Delimitations ........................................................................................... 4 1.6 Methodology ........................................................................................... 5
2 Theoretical Framework ............................................................. 7
2.1 IPO Process ........................................................................................... 7
2.2 NASDAQ OMX Nordic Stockholm .......................................................... 9 2.3 IPO Underpricing .................................................................................. 10 2.3.1 The Winner’s Curse Hypothesis ........................................................... 11 2.3.2 Market Feedback .................................................................................. 11
2.3.3 Hot Issue Markets................................................................................. 12
2.4 Stock Offer Price .................................................................................. 12 2.4.1 Stock Price ........................................................................................... 12 2.4.2 Behavioural Finance ............................................................................. 13
2.4.3 Informational Cascades ........................................................................ 14 2.5 Ownership Retention ............................................................................ 14
2.5.1 Asymmetric Information ........................................................................ 14 2.5.2 Signaling Theory................................................................................... 14 2.5.3 Entrenchment Hypothesis .................................................................... 15
2.6 Operating Cash Flow ............................................................................ 16
2.6.1 Operating Cash Flow as a Valuation Method ....................................... 16
2.7 Leaving money on the table – Only a bad thing? ................................. 16
3 Method ..................................................................................... 18
3.1 Research Approach .............................................................................. 18
3.2 Research Design .................................................................................. 18 3.2.1 Research Strategy ................................................................................ 19 3.3 Evaluation of Research Approach and Methods .................................. 19 3.4 T-test .................................................................................................... 20 3.5 Linear Regression Analysis .................................................................. 21
3.5.1 The Fit of the Regression Model .......................................................... 22 3.5.2 Research Hypothesis ........................................................................... 22 3.6 Pearson Chi-Square Test for Differences Between Proportions ........... 23 3.7 Type I and Type II Error ........................................................................ 24
3.8 Data Collection ..................................................................................... 24 3.9 Data Sampling ...................................................................................... 26 3.10 Validity and Reliability ........................................................................... 27
4 Empirical Result ...................................................................... 29
4.1 Characteristics of Data Sample ............................................................ 29 4.2 Summary of Statistical Procedures....................................................... 32

vi
4.3 Sample T-test ....................................................................................... 33
4.4 Stock Price ........................................................................................... 34 4.5 Ownership Retention ............................................................................ 38
4.6 Operating Cash Flow ............................................................................ 42 4.7 Summary of Empirical Result ............................................................... 46
5 Analysis ................................................................................... 47
5.1 IPO Underpricing .................................................................................. 47 5.2 Stock Price ........................................................................................... 50 5.3 Ownership Retention ............................................................................ 51 5.4 Operating Cash Flow ............................................................................ 52
6 Conclusion .............................................................................. 53
6.1 Discussion ............................................................................................ 54
6.2 Suggestions for Future Studies ............................................................ 55
References ................................................................................... 56
Appendix A – Final sample ......................................................... 60
Appendix B – Sample, Deleted companies ................................ 66
Appendix C – Industry Sectors ................................................... 66
Appendix D – Sample, T-test Price Deviation ............................ 68
Appendix E – Offer Price, Linear Regression ............................ 68
Appendix F – Offer Price, Chi-Square Test ................................ 69
Appendix G – Ownership Retention, Linear Regression .......... 70
Appendix H – Ownership Retention, Chi-Square Test .............. 71
Appendix I – OCF, Linear Regression ........................................ 72
Appendix J – OCF, Chi-Square Test ........................................... 73

vii
Tables & Figures Index
Table 1 Sources .............................................................................................. 26 Table 2 Number of IPOs in sample ................................................................. 27 Table 3 Sample T-Test Result ......................................................................... 34 Table 4 Regression Model Summary Offer Price ............................................ 35 Table 5 Regression Coefficients Offer Price ................................................... 36 Table 6 Offer Price Dummy, Cross tabulation ................................................. 37 Table 7 Offer Price Dummy, Chi-Square Tests ............................................... 38 Table 8 Regression Model Summary Ownership Retention ............................ 39 Table 9 Regression Coefficients Ownership Retention ................................... 40 Table 10 Ownership Retention Dummy, Cross tabulation ............................... 42 Table 11 Ownership Retention Dummy, Chi-Square Tests ............................. 42 Table 12 Regression Model Summary OCF ................................................... 43 Table 13 Regression Coefficients OCF ........................................................... 44 Table 14 OCF Dummy, Cross tabulation ........................................................ 45 Table 15 OCF Dummy, Chi-Square Tests ...................................................... 45 Table 16 Summary of Empirical Work ............................................................. 46 Figure 1 Average First Day Returns .................................................................. 2 Figure 2 NASDAQ OMX Nordic Stockholm, Return 1997-2011 ...................... 10 Figure 3 Number of IPOs per year .................................................................. 29 Figure 4 Mean Price Deviation per year .......................................................... 30 Figure 5 Sample Industry Sectors ................................................................... 31 Figure 6 Industry Sectors and Price Deviation ................................................ 32 Figure 7 Sample Distribution ........................................................................... 33 Figure 8 Offer Price, Distribution ..................................................................... 35 Figure 9 Offer Price, Scatterplot ...................................................................... 36 Figure 10 Offer Price Dummy, Histogram ....................................................... 37 Figure 11 Ownership Retention, Distribution ................................................... 39 Figure 12 Ownership Retention, Scatterplot ................................................... 40 Figure 13 Ownership Retention Dummy, Histogram ....................................... 41 Figure 14 OCF, Distribution............................................................................. 43 Figure 15 OCF, Scatter Plot ............................................................................ 44 Figure 16 OCF, Histogram .............................................................................. 45 Figure 17 OMX Stockholm Movement and Number of IPOs ........................... 47 Figure 18 OMX Stockholm Movement and Mean Price Deviation................... 49

1
1 Introduction
This first chapter of this thesis will explain and describe the main features of the study. Along with background information the chapter will discuss the problem and culminate in the main research questions. Furthermore, delimitations, methodology and the main findings will be presented here.
1.1 Background
1.1.1 Initial Public Offering
An Initial Public Offering (IPO) is when a company, the issuing firm, offers to sell shares of their business to the public for the first time, with expectations to develop a liquid market (Ritter, 1998). The main reason for listing a company on the stock market is according to Espinasse (2011) to raise equity capital. Furthermore, since an IPO often is followed by an increase in media coverage the public attention the firm gets when “going public”, is considered, however as a secondary but positive aspect (Ritter, 1998).
The advantages of raising capital by selling shares to a large amount of diversified investors come from the development of a liquid market. Before the IPO the company raised capital from a small amount of investors who suffered from an illiquid market if they wished to sell their stocks. Once the liquid market has been developed through an IPO the company can raise capital on more favourable terms from a large number of diversified investors. One big advantage of going public is that the issuing firm no longer need to compensate the investors from investing in a market that is lacking liquidity. The compensation the investors get from investing in an illiquid asset is usually a lower stock price (Bank, Larch, & Peter, 2010). The investors can now sell their stocks in open-market transactions (Ritter, 1998). However, these benefits come with costs. There are for example certain on-going costs of supplying the public and regulators with information on a regular basis (Loughran & Ritter, 2002).
The issuing firm most often employ an investment bank to help them carry out the IPO process. The investment bank takes care of tasks like handling of subscriptions, payment administration and distribution of the stocks. The most important task for the investment bank is although, with help of a company valuation, to advice on an initial stock offer price to the issuing firm. When selling a stock for the first time on the public stock exchange the investment bank creates a document, the IPO Prospect, with a digest of all important information for potential investors. This document specifies the offer, information and risk analysis about the company and other important aspects for the investor in his investment decision (D'Agostino, Fröderberg, & Hellgren, 2007).
The fees to the investment bank are a substantial part of all the direct onetime costs of an IPO for the issuing firm. Legal fees also counts for a big part of the expenditures during the IPO process. An example of indirect cost is management’s time and effort (Ritter, 1998). Many theories however suggest that one substantial cost of an IPO is the cost of underpricing.
1.1.2 IPO Underpricing
The phenomenon of IPO underpricing is a well debated topic within the field of finance. Underpricing is defined as when a stock generates a higher closing price the first day of
2
trade then the initial offer price. Generally, the issuing firm set the offer price at a level so that the first-day return is positive (Berk & DeMarzo, 2011). The reason for underpricing a new issue can be related to the topic of behavioural finance, which uses models where investors and agents are not fully rational in their decisions (Ritter, 2003). So by setting a lower price and hence, “assuring” a first day positive return, investors belief in the issuing firm might be strengthen.
Another way of convincing the potential investors about the quality of an IPO is the use of an underwriter. The underwriter, often a well-respected investment bank or stock broker, sends out a signal to the market that they believe in the company and the IPO. If a well-respected investment bank are willing to invest in the IPO the market will probably react positively. The underwriter can either sign up for a specific amount of stocks or sign an agreement to buy stocks if the IPO isn’t fully subscribed (D'Agostino et al., 2007). This is another reason for underpricing an issue. The underwriting bank wants to control their risk taken by first purchasing all the shares before selling them on the open market for the first time (Berk & DeMarzo, 2011). By setting a lower price, the risk of not being able to sell all the shares, obviously becomes smaller.
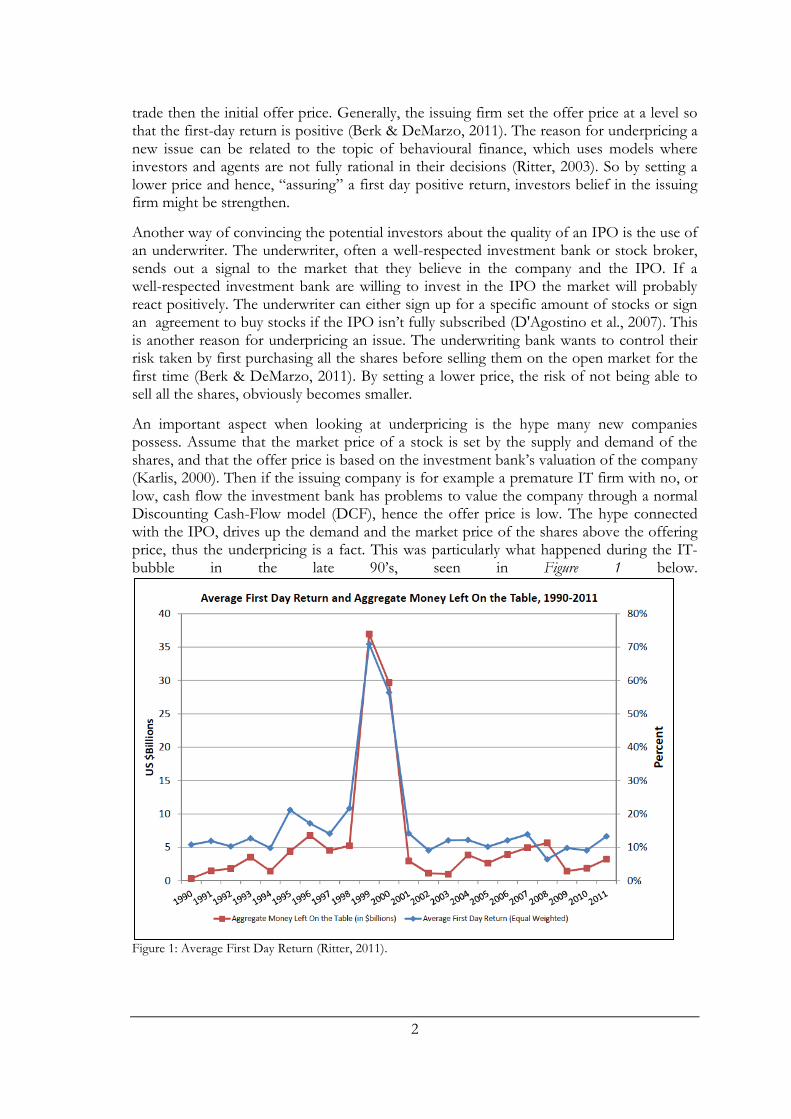
An important aspect when looking at underpricing is the hype many new companies possess. Assume that the market price of a stock is set by the supply and demand of the shares, and that the offer price is based on the investment bank’s valuation of the company (Karlis, 2000). Then if the issuing company is for example a premature IT firm with no, or low, cash flow the investment bank has problems to value the company through a normal Discounting Cash-Flow model (DCF), hence the offer price is low. The hype connected with the IPO, drives up the demand and the market price of the shares above the offering price, thus the underpricing is a fact. This was particularly what happened during the IT-bubble in the late 90’s, seen in Figure 1 below.
Figure 1: Average First Day Return (Ritter, 2011).

3
So far underpricing does not seem to be a very bad thing, who would suffer from a high return? Who bears the cost of the underpriced IPO? The answer is the pre-IPO shareholders. When a stock is increasing in price during the first trading day money is left on the table for the issuing firm. They could have sold their shares for more than they did in the premarket and hence received more money (Berk & DeMarzo, 2011). The money left on the table is the difference between the offer price and the first day closing price of the stock multiplied with the number of stocks sold (Loughran & Ritter, 2002). In other words, the money that the issuing firm misses out on.
Some people see this as a failure in the financial auditing made by the investment bank, after all the bank is working as an agent for the firm and ideally the stock market price should match the per share present value of the company’s future earnings.
Historically the average first day return was 14,1% (Karlis, 2000). When we know the phenomena and existence of underpricing why don’t we use this as an investment strategy? If the average return is 14,1% and you could invest in, let’s say one IPO per month, you would by buying at the beginning of the day and sell the same share at the end of that day, experience a cumulative annual return of (1,141)12= 487%. Why do not all investors do this then? Simply because they cannot due to scarce subscription rights. The amount of shares offered in the IPO is limited, consequently high demand IPOs often get fully subscribed. This means that many investors, who are wishing to invest their money in the new listing, get rejected.
This is where the thesis takes its beginning. There are many studies that try to explain why abnormal returns occur and the psychology behind it (Karlis, 2000; Ritter, 1998; Melancon, Mingsheng, & Zheng, 2005). The thesis does not intend to investigate underpricing as a phenomena but rather if certain factors are influencing the occurrence of underpricing. We will although go through the basic theories behind underpricing to help the reader to earn a greater understanding of the overall subject.
1.2 Problem Discussion
The problem discussion originated from the media circus about the social media network LinkedIn’s IPO on the New York Stock Exchange in 2011. On the first trading day the LinkedIn stock skyrocketed from the offering price $45 to the peak of $122 (CNET News, 2011; Reuters, 2011). Many people became millionaires over one day and the interest in the pattern of first day returns and how you can use it to make lucrative investments was born.
Underpricing is partly a result from a conflict of interest. On one side the issuing firm wants to maximize the proceeds, with a high offer price, and raise as much capital as possible. On the opposite side the investor wants to make a lucrative investment. The investor would prefer to pay a low price and then capitalize on an increase in stock price when the stock is traded publicly. In the middle of these two the investment bank has an important role to satisfy both parties’ interest. As mentioned before, underpricing has occurred frequently in the past. The issuing firms have although accepted this to some degree due to the positive publicity in media when the stock is oversubscribed (D'Agostino et al., 2007).

4
Moreover, previous studies have showed that there are factors that can influence the stock movement on the first day of trade. A lot of the movements are due to the market hype, information asymmetries, ownership structure of the issuing firms etc. (Rock, 1986; Ritter & Welch, 2002; Espinasse, 2011). Are there specific factors influencing the investor to commit to invest in an IPO?
When a company is about to go public the information available is often limited and the investors’ main source of information is the IPO prospect. The prospect contains a variety of data and information that can be useful for the potential investor. Based on the information contained in the prospect we want to investigate if there are possibilities to predict which IPOs that are likely to generate a positive first day return.
Previous research about the value of IPOs has come down to three potential value drivers: Various firm & issue attributes, financial fundamentals and non-financial fundamentals (Guo, Lev, & Zhou, 2005). Based on this research we have chosen what factors to test in our attempt to find how they influence the underpricing of an IPO. The firm and issue attribute we will consider is the amount of shares retained by the pre-IPO shareholders, the financial fundamental will be represented by the Operating Cash Flow of the issuing firm. When trying to find a non-financial measure for a large sample we realised that it would have been problematic to find one common variable for all firms. We therefore looked at behavioural finance and psychology behind the investment decision. We looked at investors and their relationship to the stock offer price set by each firm, to see if the price will affect the attractiveness of an IPO and consequently it’s degree of underpricing. The three factors, all available from the IPO prospect, will be investigated to see what effect they have on the potential investor’s investment decision and by that also the initial stock closing price the first day of trade. The study will be conducted from an investor perspective.
1.3 Research Questions
In this thesis we will try to answer the research questions below.
- Is IPO underpricing influenced by the Stock Offer Price? - Is IPO underpricing influenced by the Ownership Retention? - Is IPO underpricing influenced by the Operating Cash Flow?
Moreover, the underlying reasons and theories behind the results will be researched.
1.4 Purpose
The purpose of this thesis is to describe and examine how the underpricing of IPOs is influenced by Offer Price, Ownership Retention and Operating Cash Flow on the Swedish Stock Exchange, NASDAQ OMX Nordic Stockholm between 1997 and 2011.
1.5 Delimitations
This thesis will investigate initial public offerings on the NASDAQ OMX Nordic Stockholm Stock Exchange. The Stockholm Stock Exchange was founded in 1863 and has since then been the biggest platform for publicly traded securities in Sweden (NASDAQ OMX Nordic, 2012). In this thesis we will although only focus on stocks that have been introduced from year 1997 to 2011. The study is limited to this time period because it is a

5
representative time range and due to limited possibilities to access IPO-prospects from years earlier than 1997.
We will not consider any other Swedish stock exchanges i.e. Aktietorget, NGM or Burgundy. The reason for only consider stocks at OMX Stockholm is that the data is convenient accessible and the historical data is sufficient enough to conduct this study. By only investigating Swedish IPOs we make the data collection easier and at the same time make a research not previously made on the Swedish stock market.
A common phenomenon is to first introduce a stock on a smaller stock exchange and then transfer it to the OMX Stockholm. This way of entering OMX Stockholm will not be concerned in this thesis. We will only consider pure IPOs straight to the OMX Stockholm market. In other words we will only consider firms that go public for the first time and then straight to the OMX listing. The motive for not including stocks that transfer from one list to another is because their prices already reflect the market’s opinion and expectations.
As the acronym IPO reveals, it is about public offerings. Often firms choose to enter the public market but initially only with a targeted offer to specific investors. This thesis only considers offerings to the public. Mergers and public listings often occur as a single event, this type of transaction will not be considered either. In the case of targeted IPOs the information is not necessarily asymmetric, hence the prices might be based on “hidden” information.
A spin-off is when a parent company chooses to distribute 100% of the company to the existing shareholders. This can be seen as a dividend pay-out to the shareholders, performed in a subsided operation. After the spin-off the two entities are traded as two different companies. This way of new entry to the stock market will be excluded from the thesis since they previously have been indirectly listed.
1.6 Methodology
The research philosophy undertaken reflects the assumptions about the way in which we view the world and interpret information. These assumptions will support the research strategy. This thesis’ research philosophy reflects the philosophy of positivism. In positivism the authors work is based only on phenomena that is observed in an objective point of view that will lead to the production of data. The research of this data is then supported by existing theories and facts rather than impressions, in our attempt to develop hypotheses. The hypotheses will then be tested and eventually confirmed or rejected. (Lewis, Saunders, & Thornhill, 2009). The opposite of positivism is often referred to “hermeneutism”. The hermeneutics scientific approach allows the researcher to apply a more subjective point of view and the authors’ personal values to reflect the study (Davidsson & Patel, 2011).
Furthermore Lewis et al. (2009) states that studies under the positivistic approach are usually quantifiable observable and are likely to use an organised approach to facilitate replication. In order to answer our research questions we needed to build our own database to see if our sample showed an underpricing of the IPOs. The potential underpricing was then regressed towards the data that explains Offer price, Ownership Retention and Operating Cash Flow in order to find out if any of these had a significant effect on the underpricing. The significance was tested with the help of hypotheses, these are connected

6
to financial theories and previous studies. The research is based upon quantitative data which strengthen the statement that this study’s research philosophy follows a positivistic approach (Lewis et al., 2009).
Parts from our quantitative data and our theory have been collected from different databases and references. The University library, JSTOR, ScienceDirect and Google Scholar have been our main resources. Previous research and data have been examined and evaluated with no consideration to age or geographical origin.
Common keywords used to find articles and literatures are: IPO, Underpricing, IPO Underpricing, IPO Aftermarket, IPO Factors, IPO Retention, Information asymmetry etc.
The analysis and conclusion is based on our empirical findings and further connected to the theoretical framework and previous research’s findings in order to find similarities with our results.

7
2 Theoretical Framework
In this chapter we will present the theories, earlier empirical findings behind an IPO and the process of going public. Theories dealing with stock price ownership retention, operating cash flow and will also be further explained. The theories explained are intended to help the reader to understand the empirical result as well as the analysis in later chapters.
The theories are divided into four parts. One part examines IPO underpricing and the underlying theories and previous written articles about it. The three other parts aim to explain the theories and previous studies behind the three test-variables in this study namely; Stock Price, Ownership Retention and Operating Cash Flow.
2.1 IPO Process
To carry out an IPO is a comprising and challenging task in many ways. Apart from the issuing firm’s corporate finance department there are many external stakeholder and players involved in the process. It is also a challenging task for the investor who not only needs to focus on the financial situation of the target firm but also on the execution of the IPO. The way the execution of the IPO proceeds can have large impact on the investment’s short run return in today’s extreme market conditions (D'Agostino et al., 2007).
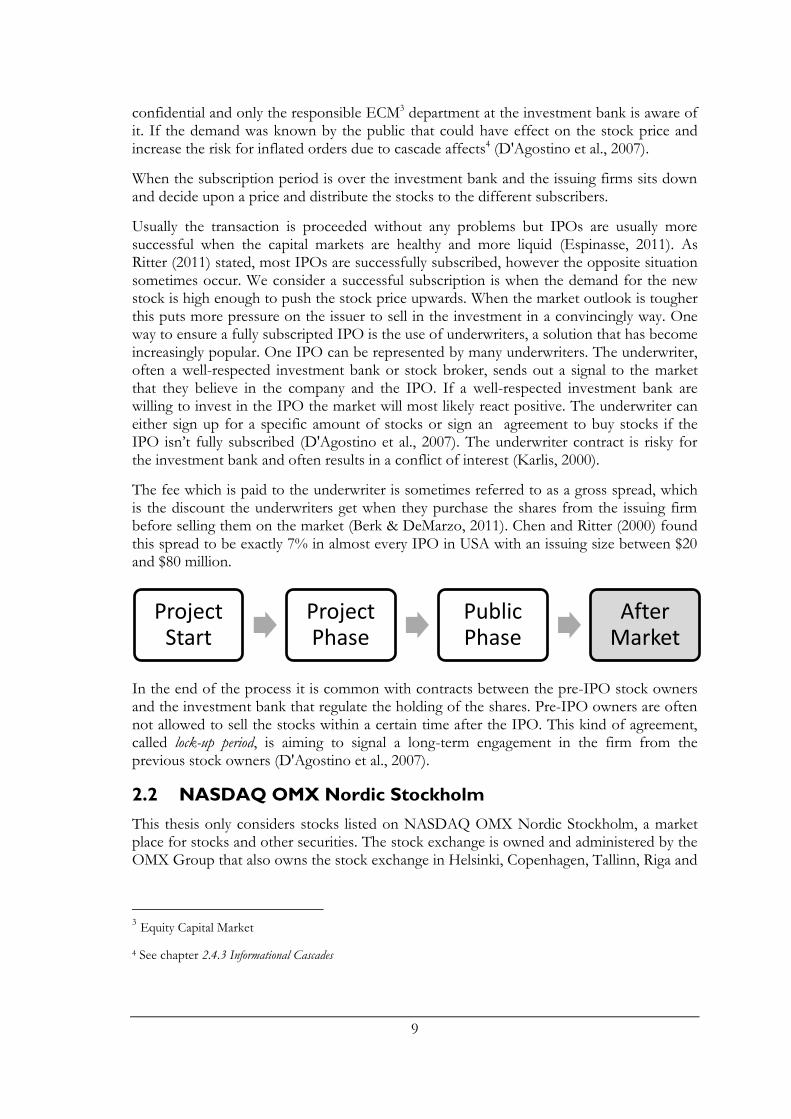
The IPO process can be divided into four parts, graphically explained above. Usually a company uses an investment bank in the process of going public and this is where the project starts. The investment bank, which is authorised by the government, helps the issuing firm with specific parts in the IPO. The investment bank often also acts as an advisor to the issuing firm. As an advisor and coordinator of the IPO, the investment bank is responsible for a variety of tasks throughout the transaction. Examining the issuing firm through a financial, legal and business due diligence, produce analytical material and writing prospects are all tasks that the investment bank handles in the IPO.
The investment bank often represents different interests and must therefore be careful so that any interests are not aggrieved. On one hand they represent the issuing firm and their interest to have a successful IPO. On the other hand the investment bank often has other related businesses fields and clients that might be subject to the offer. The conflict of interests is although regulated and the investment bank should try to avoid those (D'Agostino et al., 2007).
When the issuing firm and the investment bank have agreed on a contract the next phase takes its beginning.
Project Start
Project Phase
Public Phase
After Market
Project Start
Project Phase
Public Phase
After Market

8
After the investment bank have received and agreed upon the duty the work takes its beginning and one of the most important tasks is to set a value on the issuing firm and, with the valuation as a keystone, set a stock price. Furthermore, there are plenty of other practical issues that have to be solved for the IPO to proceed as smooth as possible.
Since the issuer is not previously known to the market the investment bank must do substantial research to make a fair market valuation of the firm. Everything from personal background of the board of directors to accounting standards is subject to screening. Even if the investment bank do the research, it is important to emphasize that the investment bank only acts advisory and the final stock price is set by the issuing firm themselves.
It is the investment bank who together with the issuing firm prepares the IPO-prospect. The prospect is a legal document that consists of, and provides, financial and additional information about the issuing company and its history, on-going business and its future (Berk & DeMarzo, 2011). The prospect is crucial for the potential investor in order to give him an as fair picture about the company as possible, without being too optimistic about its future. In Sweden the Swedish Financial Supervisory Authority, SFSA1 requires all new introductions to prepare a prospect2 (Grundvall, Melin Jakobsson, & Thorell, 2004). The SFSA reviews the suggested prospect before the final prospect is finalized and used during the marketing campaign which takes place before the introduction. The marketing campaign (often called “road show”) is usually a set of meetings between investors that the investment bank and the issuing firm think is of importance to have “on board” in the subscription of the new stocks (D'Agostino et al., 2007).
When SFSA have approved the prospect the registration period starts. The investor shall in this period assess the information in the prospect and accept the offer by sending the subscription to the right institution. The handling of the subscriptions differs from IPO to IPO but the investment bank is often managing the subscriptions (D'Agostino et al., 2007).
When dealing with larger and more uncertain IPOs the investment bank together with the issuing firm can decide upon using a book building strategy instead of a fixed price for the stock. Book building enables the investor to make a bid on a number of stocks to a specific price within the pre-set price range in the prospect, one can say that a demand curve is constructed. When the subscription is full the investment bank together with the issuing firm chose a final price depending on the “bids” registered during the subscription period (D'Agostino et al., 2007). The demand for the IPO during the subscription period is
1 Finansinspektionen
2 Lag (1991:980) om handel med finansiella instrument, 2 kap.
Kommissionens förordning (EG) nr809/2004 avseende informationsgivning i prospekt.
Project Start
Project Phase
Public Phase
After Market
9
confidential and only the responsible ECM3 department at the investment bank is aware of it. If the demand was known by the public that could have effect on the stock price and increase the risk for inflated orders due to cascade affects4 (D'Agostino et al., 2007).
When the subscription period is over the investment bank and the issuing firms sits down and decide upon a price and distribute the stocks to the different subscribers.
Usually the transaction is proceeded without any problems but IPOs are usually more successful when the capital markets are healthy and more liquid (Espinasse, 2011). As Ritter (2011) stated, most IPOs are successfully subscribed, however the opposite situation sometimes occur. We consider a successful subscription is when the demand for the new stock is high enough to push the stock price upwards. When the market outlook is tougher this puts more pressure on the issuer to sell in the investment in a convincingly way. One way to ensure a fully subscripted IPO is the use of underwriters, a solution that has become increasingly popular. One IPO can be represented by many underwriters. The underwriter, often a well-respected investment bank or stock broker, sends out a signal to the market that they believe in the company and the IPO. If a well-respected investment bank are willing to invest in the IPO the market will most likely react positive. The underwriter can either sign up for a specific amount of stocks or sign an agreement to buy stocks if the IPO isn’t fully subscribed (D'Agostino et al., 2007). The underwriter contract is risky for the investment bank and often results in a conflict of interest (Karlis, 2000).
The fee which is paid to the underwriter is sometimes referred to as a gross spread, which is the discount the underwriters get when they purchase the shares from the issuing firm before selling them on the market (Berk & DeMarzo, 2011). Chen and Ritter (2000) found this spread to be exactly 7% in almost every IPO in USA with an issuing size between $20 and $80 million.
In the end of the process it is common with contracts between the pre-IPO stock owners and the investment bank that regulate the holding of the shares. Pre-IPO owners are often not allowed to sell the stocks within a certain time after the IPO. This kind of agreement, called lock-up period, is aiming to signal a long-term engagement in the firm from the previous stock owners (D'Agostino et al., 2007).
2.2 NASDAQ OMX Nordic Stockholm
This thesis only considers stocks listed on NASDAQ OMX Nordic Stockholm, a market place for stocks and other securities. The stock exchange is owned and administered by the OMX Group that also owns the stock exchange in Helsinki, Copenhagen, Tallinn, Riga and
3 Equity Capital Market
4 See chapter 2.4.3 Informational Cascades
Project Start
Project Phase
Public Phase
After Market

10
Vilnius (NASDAQ OMX Nordic, 2012). The average annual return of the NASDAQ OMX Nordic Stockholm Exchange can be seen in Figure 2 below.
Figure 2: NASDAQ OMX Nordic Stockholm, Return 1997-2011 (Ekonomifakta, 2012).
As can be observed in Figure 2 the OMX Stockholm has been fluctuating a lot in the sample period 1997-2011. The market performed very well during the first years until the beginning of year 1999. These were the years when the IT-bubble was at its peak and the confidence for the future was on high levels within the financial world. Many small and risky IT-companies conducted IPOs during these years. The boom in year 2000 was although followed by some tougher years. The technology companies with high risk performed worse when the bubble burst and that affected the market as a whole for the upcoming years (De Ridder, Kågerman, & Lohmander, 2008).
In 2003 the economic situation turned around and the forthcoming years until 2008 was characterised by growth and an increase in the market value. In 2008 the financial crisis hit the US and spread to a substantial part of the world economies. OMX Stockholm was of course also effected (Konjunkturinstitutet, 2010). The recovery started in 2009 and is still (May 2012) on-going.
2.3 IPO Underpricing
In theory, valuating an IPO is not different from valuating other stocks. The usual approach of discounted cash flow analysis can be used. This is however, not as straightforward in practice since many IPOs are young growth firms and the future cash

11
flow is difficult to predict (Ritter, 1998). As we earlier discussed this difficulty in estimating a true value brings a risk for the investment bank to set a too high price and not sell all the stocks. It is therefore not a surprise that IPOs often experience some degree of underpricing. The following theories are focusing on different aspects of the relationship between investors, issuers and the investment bank and the phenomena of IPO underpricing.
2.3.1 The Winner’s Curse Hypothesis
As previously stated; underpricing is a frequent phenomenon. The theories and discussions behind it are many and diversified. One of them, the Winner’s Curse Hypothesis, was first introduced by Rock (1986) who later also linked it to the IPO market (1990). When underpricing occurs the issuer sells stocks at a lower price than they would be able to do in the aftermarket. If an investor was rational she could in that case earn a profit by frequently keep investing in IPOs. However the Winner’s Curse Hypothesis suggests that this is not for certain.
The idea behind the hypothesis works like this; let’s say there is an auction and the true value of the asset being auctioned is unknown. It is then up to the bidders to estimate what they think is the true value of the asset today. Even though the asset’s actual value is worth as much for all bidders, so called a common value auction, the values estimated will vary a lot. Some bids will be far below the true value of the asset but some might be far too high. The bids that are too high will win the auction and the winner will overpay for the asset. The winner is said to be “cursed” (Thaler, 1988). The hypothesis suggests that when an IPO is lucrative, the demand for the stock goes up and exceeds the supply. This results in an overprice (the closing price is higher than the offering price) of the stock and the stocks are rationed. On the opposite, when the stock demand is low all the initial orders are filled and one “wins” all the available stocks due to the low demand. In other words, the Winner’s Curse Hypothesis states that it is difficult to earn an excess return on good IPOs (Levis, 1990).
2.3.2 Market Feedback
Another theory, based on the theory about asymmetric information, further explained in chapter 2.5.1 Asymmetric Information, is the theory about market feedback. The theory is applicable where book building5 is used. When the investment bank wants the investors to reveal their information about the company, they compensate them by underpricing the stock. This is done during the pre-selling period in order to find out whether the price in the primary prospect is accurate. If the price has to be revised it will affect the degree of underpricing for that stock. In case of an upward revising of the share price the underpricing will be larger because the investment bank will not have to worry that they cannot sell the shares for the first price. However, if the first price has to be revised downward it is in the interest of the investment bank to lower the price as little as possible so that the difference between the first offer and the final price will be as small as possible. If the price is revised downwards it results in a smaller degree of underpricing (Ritter, 1998).
5 Previously explained in chapter 2.1 IPO Process

12
2.3.3 Hot Issue Markets
Between January 1980 and the following 15 months the mean return on all IPOs in America was 48,4%. This can be put in contrast to the average return between 1977 and 1982 of “only” 16,3% (Ibbotson & Jaffe, 1975). The 15 months period is an example of a period called Hot Issue Market. Ibbotson and Jaffe (1975, p. 1027) defined the Hot Issue Markets as “Periods in which the average first month performance (or aftermarket performance) of new issues are abnormally high”.
The period around 1980 is not an isolated event; plenty of periods like the one described above have occurred during the last decades (Ritter, 2011). The IT-boom during 1990’s can also be described as a hot issue market where the IPOs showed abnormal returns during the first trading days (See Figure 1 in chapter 1.1.2 IPO Underpricing). If you can earn a profit by just investing in IPOs you can now earn an even bigger profit by investing in IPOs during the right period. It is therefore important to take into consideration, when looking at the degree of underpricing, how the market in general was performing.
The sample period in this thesis is between 1997 and 2011. During this period a sub period can be highlighted as an hot issue period, 1999-2000 when the IT-bubble was blown up and then burst as seen in chapter 2.2 NASDAQ OMX Nordic Stockholm. In December 1999 the Stockholm OMX index closed the year at a 66,5% up and 25 IPOs was conducted (Ekonomifakta, 2012).
2.4 Stock Offer Price
There is a saying that goes “don’t judge a book by its cover”. For an investor this saying could be “don’t judge a stock by its share price”. Despite the big supply of information for investors, many people incorrectly assume that a stock with a low (high) offer price is cheap (expensive). This misconceived belief can lead investors to make bad investment decisions (Olsen, 1998).
2.4.1 Stock Price
The pricing of an IPO is a difficult and complex procedure. Since this is the first time the company will be traded publicly a financial investigation must be done to set a correct price. Since the company can be more or less known there are many risk factors that affects the market price of the company after the IPO (D'Agostino et al., 2007). The pricing is extra difficult due to the uncertainty about future cash flows in the company. Therefore many institutions use multiple variables to determine the value of the firm. Common multiples used and compared with companies in the same industry are P/E and EV/EBITDA6 (Ritter, 2003).
When dealing with larger IPOs and more uncertainty the issuing firm advised by the investment bank sometimes choose the book building strategy, to set the price in a certain range. This strategy allows the investor to bid on a number of stocks within the pre-set price range. The final price is then set after discussions between the underwriter and the issuing firm. The selection process depends on how the firm wants to spread the
6 Enterprise value / Earnings before interest, taxes, depreciation and amortization.

13
ownership among the investors that signed up for the subscription (D'Agostino et al., 2007).
If markets are efficient and without friction, the stock price alone should not matter at all when determining a firm’s value. However, firms often undertake actions such as stock splits and stock dividends in order to drive the stock price into a desirable level (Abrahamsson, De Ridder, & Råsbrant, 2011). Several studies confirms this and show that an announcement of a stock split, which should have no effect of a company’s cash flow, is usually followed by an abnormal increase in the stock price (Byun & Rozeff, 2003; Chern, Tandon, Yu, & Webb, 2008).
2.4.2 Behavioural Finance
Behavioural Finance is the study of how the behaviour of the financial practitioners is influenced by psychology and the following effect on the market (Sewell, 2007). Behavioural Finance has two major blocks; cognitive psychology and the limits to arbitrage. In this thesis we will not consider the limits to arbitrage since it goes more into the theory of efficient market which is built upon the development of the share prices after the IPO. Cognitive psychology however refers to how people are thinking and is more interesting for us in our study about how attractive an IPO is. There is a lot written within the field of psychology, documenting that people are making systematic errors in the way they are thinking. One example of systematic errors is that people are overconfident, and they put too much emphasis on recent experiences. These preferences and strategies may create distortions (Ritter, 2003).
The theories about behavioural finance differs from the theory about the efficient markets, which assumes that the markets are rational and that every stock price fully reflects the markets opinion based on available information (Fama E. F., 1970). The models around behavioural finance on the other hand assume that in some cases financial markets are informally inefficient (Ritter, 2003). The theory is using models where some players are not fully rational, neither in their preferences nor because of mistaken beliefs. An example would be the value function which is defined on divergences from a reference point; the function is normally steeper for losses than gains (Kahneman & Tversky, 1979). This means that people are loss averse and that a $2 gain makes people feel better by as much as a $1 loss make them feel worse.
Cognitive biases are patterns of how people behave; one of these is how they choose investment objects. When small investors are choosing what shares to buy, they generally make a common mistake. They are valuing the company and its shares based on the actual price. Previous research has proven that a high price is perceived expensive and the stock as overpriced while the opposite is considered cheap (Angel, 1997). What is considered cheap varies between countries and markets but each country has a psychological trading price range and when prices deviates from it, people make irrational decisions (Angel, 1997).
Another example of irrational behaviour from investors is that people many times tend to be overconfident about their own abilities. Overconfidence can be displayed in a number of ways, one way is too little diversification, which comes from the tendency of investing too much in a company one is familiar with. This is especially common among entrepreneurs (Ritter, 2003).

14
2.4.3 Informational Cascades
Informational cascades, or bandwagon effect as it is also addressed sometimes, is a theory based on observational learning theory. This is a theory used when investors do not only take in their personal experiences but also consider how other investors act when they make investment decision. There are almost infinite situations where the informational cascade is apparent and people are influenced by others; consumer decision, opinion formation, political position and activities participation (Bikhchandani, Hirshleifer, & Welch, 1992). An example can be when investor A rejects the IPO, investor B then also rejects the IPO based on the action taken by investor A even when investor B have information that signals a good IPO. To avoid this situation the issuing firm can underprice the stock and attract investors and if the cascade effect works the ripples will spread on the water and many more investors will be attracted to the IPO (Ritter, 2003). On the other hand a low initial price can scare the market and signal that the stock is not worth investing in.
2.5 Ownership Retention
The financial markets are characterised by information asymmetry between insiders and investors. The insiders can choose what information to reveal to the market and its investors about the quality of their projects. The stakes retained by the pre IPO-owner has been showed to be an important value driver of the IPO and also a good indicator of the belief the company has in their future operations (Guo et al., 2005).
2.5.1 Asymmetric Information
Most of the IPO underpricing theories are based on asymmetric information. In the model where the issuers leave the pricing decision to the underwriter the investment bank finds it less costly to market an IPO which is underpriced (Baron, 1982). Another reason behind IPO underpricing comes from the field of behavioural finance. Ritter (2003) claims that under prospect theory managers care less about their stock being underpriced, if they simultaneously receive good news about their personal wealth increase. In these cases the asymmetry in knowledge about the capital markets between the investment bank and the issuing firm is usually visible through an underpriced IPO. Providing research coverage and expertise is expensive for the investment bank. The larger American banks each spend around $1 billion annually in equity research and to cover these costs they need to charge the issuer (Loughran & Ritter, Why Has IPO Underpricing Changed Over Time?, 2004). According to Loughran and Ritter the more the issuing firm are prepared for using the expertise from the analysts at the investment bank the more they are willing to pay in explicit costs, such as the gross spread, and in the implicit cost of underpricing. Although some degree of underpricing due to asymmetric information is to be expected, it is however proved that the average sum of money left on the table is way too high to compensate for the costs the investment bank needs to cover for their research projects (Loughran & Ritter, Why Has IPO Underpricing Changed Over Time?, 2004). In order to compensate for the information asymmetry on the capital markets, theories have been developed with the purpose of helping investors to make rational decisions.
2.5.2 Signaling Theory
As mentioned above, most markets are characterized with a difference in information between counterparties. This goes for financial markets in particular; ex. entrepreneurs

15
often provide potential investors with inside information. Leland and Pyle (1977) argue in their paper about signaling theory that without information transfer, financial markets will perform poorly. Consider IPOs and the variation in quality. The entrepreneur knows the quality of their projects or firms while the investor cannot distinguish among them. Because of this, market value must reflect an average quality of the projects or firms. If the average market value was higher than the average cost on projects, the supply of low quality projects would be high. This since entrepreneurs could impose upon a uniformed market, retaining little or no equity, and make sure a profit. With this said the average quality is likely to be low and adversely affect the financing of the projects that really merit financing. The high quality projects may therefore not be undertaken due to high cost of capital resulting from low average project quality. Thus, venture capital markets fail to exist in business environments with substantial asymmetric information. For projects with good quality to gain financing information transfer must occur (Leland & Pyle, 1977).
In order to transfer the information one can refer to the old saying that action speaks louder than words. This goes for financial psychology as well. Information on project quality can be transferred with words but also with actions from the entrepreneur. One action, observable due to disclosure laws, is the willingness of the entrepreneur to invest in his own business. This willingness to invest may signal to the market the true value of the project; lenders will then place a value on the project based on the information transferred through the signals (Leland & Pyle, 1977). Previous studies by 2001 Nobel Prize winners Akerlof (1970) and Spence (1973) show that equilibrium properties in markets with asymmetric information and information transfer differs from markets with no or costly information transfer.
Leland and Pyle developed a model of capital structure and financial equilibrium in which the entrepreneurs, who knows the quality of the project, seeks financing. They showed through their model that the entrepreneur’s willingness to invest in his own project could serve as a signal of quality in the project. Their results differed significantly from models that ignored informational asymmetries; the value of the firm increased with the shared retained by the entrepreneur (Leland & Pyle, 1977).
In contrast to Modigliani and Miller’s (1958) article The Cost of Capital, Corporation Finance, and the Theory of Investment Leland and Pyle argued that the financial structure of the firm will relate to firm value, even when taxes are not taken into consideration. They also showed that firms with riskier returns will have lower level of debt in their balance sheets even when bankruptcy costs are ignored. Leland and Pyle (1977) also suggested that financial intermediaries are a natural response to asymmetric information.
2.5.3 Entrenchment Hypothesis
So far the relationship between retained equity and firm value has been explained as a positive signal to the investors about the management’s strong believes in their own operations. Furthermore this has been explained as a factor helping investors making rational decisions. It is also important to look at the opposite of this signal. Fama and Jensen (1983) suggest, contrary to the signaling theory, that managerial entrenchment can have both positive and negative effects on the firm’s value. Managerial entrenchment occurs when the management has so much power that they use the firm to further their own interest instead of the shareholders’ interest (Hermalin & Weisbach, 1988). This theory’s hypothesis is confirmed by Bebchuk (1999) who discuss the issue of how the

16
company’s initial owner wants to maintain a large share of control after an IPO. Hence, by selling off less they can still pursue private benefits.
2.6 Operating Cash Flow
The third value driver for an IPO, described by Guo et al. (2005) is the financial fundamentals of the firm. These fundamentals can be the company’s turnovers, earnings, profits or cash flows. Among these we choose to focus on the cash flow. A company’s cash flow is considered as one of the most important pieces of financial information that can be achieved from the financial statement. It is simply a measure of how much cash that comes into the company and how much that goes out (Jordan, Ross, & Westerfield, 2004). We want to see if the company is generating cash in their daily operations and the best measure to use then is the operating cash flow. The OCF is defined as the cash generated from the firm’s normal business activity (Ross et al., 2004).
2.6.1 Operating Cash Flow as a Valuation Method
One often measures the condition of a company on their profit or loss. This way of evaluating the performance of the company is although associated with some flaws. A common misunderstanding is that the profit on the bottom line of the income statement is the actual cash a company generates every year. This is although wrong in many ways but mainly due to different accounting dispositions, which is why it is often called accounting profit (Tracy, 2004). Hence the company profit, or loss, can differ a lot from the actual cash flow generated by the firm. One example of one accounting dispositions is the consideration to non-cash expenses like depreciation. Depreciation is an accounting measure that is designed to reflect the life time value of an asset in the income statement and by that decrease the profit and taxes in the financial reporting (Tracy, 2004). Consequently, this thesis will focus on the cash flow instead of the profit stated in the income statement. The cash flow gives a clear picture of how well the business is doing and what funds it actually generates; even though it does not tell the investor anything about the profit or the long term financial situation of the firm.
There are three main types of calculations when talking about cash flow. Operating cash flow, Investment cash flow and financing cash flow. Operating cash flow is the cash flow generated by the operational business activities. OCF is unlike the other two methods for cash flow calculations a good indicator of how well the core daily operations in the firm work. Investment cash flow and financing cash flow focus more on rarely common business events ex. a disposal of a long-life asset (Bettner, Carcello, Haka, & Williams, 2008).
2.7 Leaving money on the table – Only a bad thing?
If underpricing is occurring repeatedly, which substantial research confirm (Ritter, 2011), that must imply that money is left on the table on the same repeatedly basis. The money left on the table is the difference between closing price and the offer price multiplied with the size of the stock offering. If the shares would have been sold to the closing price instead of the offering price the proceeds to the issuing firms would have been higher equal the amount of money left on the table (Loughran & Ritter, 2002). When the investor earns a profit the first day of trade he is literally taking money from the issuer and putting them in his own pocket. The issuing firm could in other words have released fewer stocks and

17
loosed less control over the company for the same amount of equity increase if the offer price would have been more adapted to the market conditions.
If the investment bank together with the issuing firm would have set a higher initial price from the beginning a bigger part of the capitalization from the first day trade would accrue to the issuing firm (Espinasse, 2011). Ritter and Loughran (2002) showed that the average IPO leaves $9,1 million on the table and only during the period of 1990-1998 $27 billion were left to the investors in the U.S. A reasonable question to ask would then be; why don’t issuers get upset about constantly leaving money on the table?
The average money left on the table is almost twice as much as the average fees paid to the investment bank, a substantial indirect cost for the issuing firm in other words. The investment bank fees are huge and the money left on the table can often be many years of aggregated profits. In 1995 the IT-company, Netscape’s IPO was conducted with help of Morgan Stanley investment bank. 5 million shares were sold at $28 per share. The stock rocketed up to $58,25 the first day of trade and more than $151 million7 was left on the table. A huge wealth transfer occurred between the issuing firm, Netscape, and the investors. Despite this, Netscape retained Morgan Stanley as the underwriter in the follow-on offerings and this reaction is not uncommon (Loughran & Ritter, 2002).
Krigman, Shaw, and Womack (2001) showed in their report “Why do firms switch underwriters?” that issuing firms do not consider money left on the table as an important aspect when choosing which investment bank to work with. They reported that of 15 IPOs that all had a first day returns above 60% that conducted a follow-on IPO, 15 retained the same underwriter from the IPO.
Loughran and Ritter (2002) proposed a prospect theory to answer the title question. The theory assumes that the issuing firm considers the change in wealth rather than the level of wealth. When the issuing firm evaluate the IPO they sum the wealth loss in leaving money on the table with the gains from a high price deviation the first day of trade. The net gain produces an increase in wealth to the pre-IPO shareholders. Loughran and Ritter (2002) also showed that the most money left on the table came from issuing firms that revised the offer price upwards from what have been anticipated from the preliminary prospectus. The offer price was increased due to high demand and could apparently been increased even more. The underpricing is diluting the pre-issue shareholder but their wealth is much higher than they anticipated. This is in line with the Market Feedback theory.
Ljungqvist and Wilhelm (2003) explained the peak of underpricing in 1999-2000 with lack of incentives for management in the IT business to reduce the underpricing. The companies that conducted an IPO during these years differed from IPOs conducted in other periods in terms of level of sales, ownership structure and net income. This may have lowered the incentives to reduce underpricing since many of the pre-IPO stockholders could make fast money due to a first trading day rally on the stock.
7 ($58,25 – $28) * 5.000.000 = $151.125.000

18
3 Method
In this chapter the chosen research method will be presented. Firstly, the research design and approach as a quantitative explanatory research will be explained. This is followed by a part discussing our statistical methods and techniques used, conducting this research. The next part is about the data collection and the selections that are made in order to form our sample. The chapter is summed up by discussing the reliability of the thesis and its method.
3.1 Research Approach
Method is according to Lewis et al. (2009) the process to obtain and analyse data. The process can be defined by identifying the research approach. This thesis’ research approach can be labelled as a deductive research. The deductive research is drawn from previous research and facts. The deductive approach, which is usually connected to the positivistic research philosophy (recall from chapter 1.6 Methodology that this thesis reflects the philosophy of positivism), starts with collection of data from previous studies before creating the hypothesis about a certain relationship between two or more variables. The hypothesis was tested and the outcome was examined before the relationship was confirmed or rejected prior the analysis of the result of the initial research questions (Lewis et al., 2009). This deductive, quantitative research will question the theoretical framework by data collection and hypotheses in order to accept or reject correlation between Stock Price, Ownership Retention and Operating Cash Flow with the occurrence of underpricing.
3.2 Research Design
According to Lewis et al. (2009) a research can be conducted as exploratory, descriptive or explanatory. The purpose of an exploratory research is to become more familiar with an area or problem. A descriptive research has the aim to describe a specific situation or problem, whereas an explanatory is devoted of finding a relationship between variables from theory based expectations (Malhotra & Grover, 1998). Nevertheless, a research question can have more than one purpose and hence a mix of any of the three (Lewis et al., 2009). The purpose of this research is to answer our research questions. Recall from chapter 1.3 Research Questions our stated research questions;
- Is IPO underpricing influenced by the Stock Offer Price? - Is IPO underpricing influenced by the Ownership Retention? - Is IPO underpricing influenced by the Operating Cash Flow?
To study a situation, or a problem, and explain the relationship between variables is the purpose of an explanatory research. This kind of research is usually used together with quantitative data collection (Lewis et al., 2009). Quantitative research method is defined by Aliaga and Gunderson (2002) as “Quantitative research is explaining phenomena by collecting numerical data that are analysed using mathematically based methods (in particular statistics)”. Since we want to find the relationship between the initial stock price, ownership retention and operating cash flow with the occurrence of underpricing the answer to these questions are of explanatory nature with a quantitative research method. By a qualitative study we would have missed the objectivity from the investor’s actions and it would be problematic to draw statistical conclusions. In this thesis the situation we are studying is the occurrence of underpricing and first day returns, explained by the initial stock price, ownership retention and operating cash flow from analysing quantitative data.
19
3.2.1 Research Strategy
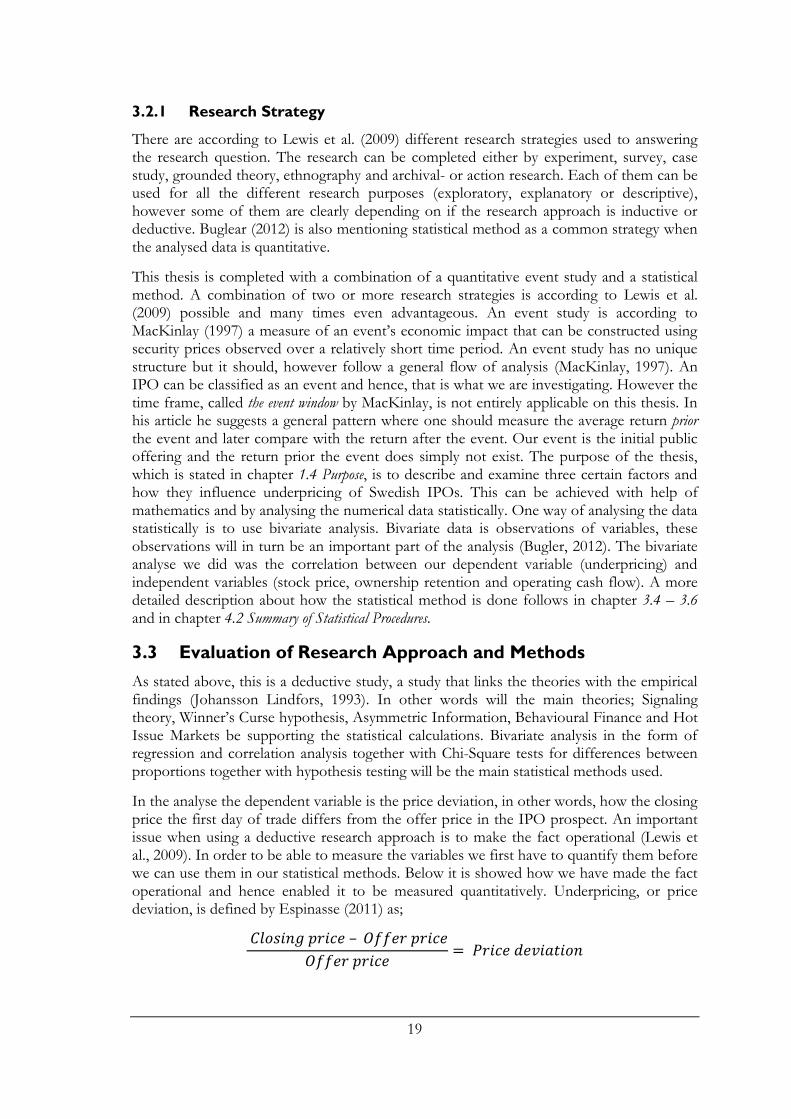
There are according to Lewis et al. (2009) different research strategies used to answering the research question. The research can be completed either by experiment, survey, case study, grounded theory, ethnography and archival- or action research. Each of them can be used for all the different research purposes (exploratory, explanatory or descriptive), however some of them are clearly depending on if the research approach is inductive or deductive. Buglear (2012) is also mentioning statistical method as a common strategy when the analysed data is quantitative.
This thesis is completed with a combination of a quantitative event study and a statistical method. A combination of two or more research strategies is according to Lewis et al. (2009) possible and many times even advantageous. An event study is according to MacKinlay (1997) a measure of an event’s economic impact that can be constructed using security prices observed over a relatively short time period. An event study has no unique structure but it should, however follow a general flow of analysis (MacKinlay, 1997). An IPO can be classified as an event and hence, that is what we are investigating. However the time frame, called the event window by MacKinlay, is not entirely applicable on this thesis. In his article he suggests a general pattern where one should measure the average return prior the event and later compare with the return after the event. Our event is the initial public offering and the return prior the event does simply not exist. The purpose of the thesis, which is stated in chapter 1.4 Purpose, is to describe and examine three certain factors and how they influence underpricing of Swedish IPOs. This can be achieved with help of mathematics and by analysing the numerical data statistically. One way of analysing the data statistically is to use bivariate analysis. Bivariate data is observations of variables, these observations will in turn be an important part of the analysis (Bugler, 2012). The bivariate analyse we did was the correlation between our dependent variable (underpricing) and independent variables (stock price, ownership retention and operating cash flow). A more detailed description about how the statistical method is done follows in chapter 3.4 – 3.6 and in chapter 4.2 Summary of Statistical Procedures.
3.3 Evaluation of Research Approach and Methods
As stated above, this is a deductive study, a study that links the theories with the empirical findings (Johansson Lindfors, 1993). In other words will the main theories; Signaling theory, Winner’s Curse hypothesis, Asymmetric Information, Behavioural Finance and Hot Issue Markets be supporting the statistical calculations. Bivariate analysis in the form of regression and correlation analysis together with Chi-Square tests for differences between proportions together with hypothesis testing will be the main statistical methods used.
In the analyse the dependent variable is the price deviation, in other words, how the closing price the first day of trade differs from the offer price in the IPO prospect. An important issue when using a deductive research approach is to make the fact operational (Lewis et al., 2009). In order to be able to measure the variables we first have to quantify them before we can use them in our statistical methods. Below it is showed how we have made the fact operational and hence enabled it to be measured quantitatively. Underpricing, or price deviation, is defined by Espinasse (2011) as;

20
The three independent variables that we run in the tests will be taken from the financial statements in the IPO prospects. The share retained by pre-IPO owners is explained in percentage and tells the investor how large proportion of the stocks that will be sold in the offer. 60% share retention declares that 60% of the stocks will be retained by the pre-IPO stock holders even after the IPO.
To measure how ownership retention affects the demand of the new stock is interesting due to several reasons. High share retention sends positive signals to the market and signals a high trust and value to the potential investors (Fan, 2006). Retention is also interesting since it affects how liquid the new market gets. If the share retention is low and many stocks are offered to the public, the market will be less liquid and by that less attractive then if high retention occurs (Melancon et al., 2005).
The stock offer price was divided into three equally sized segments. The three price groups in the study are 12-46 SEK, 47-69 SEK and 70-200 SEK. Investigating how offer price effect the investment decision is interesting in a psychological manner. Most IPOs enter the market around 65 SEK per share8. Many companies frequently conduct splits or reverse stock split to stay around this price. This is done due to psychological reasons that affect the investor (Ritter, 1998).
Operating cash flow is calculated from the financial statements in the IPO prospect. The operating cash flow is the best measure, describing how well the business operates in the short run. It is the cash you end up with when adding depreciation and previously deducted tax back to the net income (Berk & DeMarzo, 2011). Differences in currency will be handled and calculated with the average exchange rate for the fiscal year.
3.4 T-test
The first thing when conducting the statistical tests to determine a relationship between our dependent and independent variables was to confirm that our sample showed a degree of underpricing. Therefore, we conducted a confidence interval estimating the mean, μ, of the population’s price deviation the first day of trade. We tested whether the mean of the sample is larger than a certain test value and used that as an estimate for the population (Berenson, Krehbiel, & Levine, 2010). The test value was set to zero and the null hypothesis was stated;
μ ≤ 0
μ > 0
If the null-hypothesis is rejected, the sample mean is above zero, which in this case means that the sample’s average first day return is positive and that there is an occurrence of underpricing. One assumption for conducting t-tests is that the distribution of the population is normal. T-tests can however be performed even if the population’s distribution is not known, as long as the sample is larger than 30 due to the central limit theorem, CLT (Aczel & Sounderpandian, 2006). The CLT can be applicable when the sample size is sufficiently large. A sample larger than 30 observations is usually considered
8 10$ (2012-02-24)

21
large (Aczel & Sounderpandian, 2006). Our random sample consists of 100 observations and consequently we can apply the result from the t-test on the population (Berenson et al., 2010). The results also show the confidence interval where we are likely to find the population’s mean.
3.5 Linear Regression Analysis
Linear regression is a statistical method used to measure connections in bivariate data (Bugler, 2012). It is also the statistical technique of modelling the relationship between variables. As we have mentioned earlier, the variable being predicted is underpricing, which is called the dependent variable. The variable used for prediction of the dependent variable is called the independent variable (Aczel & Sounderpandian, 2006). In this thesis the independent variables are initial stock price, ownership share retention and operating cash flow. The linear regression analysis is framed as;
(Equation 1)
represents the intercept of the regression line, hence the value of the dependent variable
(Y) when the independent variable’s value is zero. is the slope of the regression line and
represents the error term. When X and Y have no linear relationship the slope of the
population regression line, , is equal to zero (Aczel & Sounderpandian, 2006). Since our sample is larger than 30 we can conclude that the central limit theory holds and that the sample reflects the population (Bugler, 2012).
The problem with using statistical models in explaining a real situation is the uncertainty in all real world settings. According to Ando (2010) a statistical model is a simplification of a complex reality. It is because of this uncertainty, unlikely that our model explain everything and the information most probably contain some errors. These errors origin from external factors that the model cannot take into consideration. Therefore we need to make assumptions about the context in order to be able to use the regression model and assuming linear relationship. These assumptions are explained by Ando (2010) as;
The error terms, , are independent and a random variable that are normally
distributed with a mean or expected value of 0, .
The variance of is constant and denoted and is the same for all error terms.
According to the central limit theorem we can assume that these assumptions hold.
In this thesis we assume a linear relationship between the level of underpricing ( ) and the
independent variables stock price ( ), ownership retention ( ) and operating cash flow
( ). Hence the regression analyses have been framed as;
(Equation 2)
(Equation 3)
(Equation 4)
Recall that the slope of the regression line is equal to zero if the relationship between our variables is equal to zero. In the regression analysis above it means that if there is no
relationship between underpricing and the initial stock price the would be equal to

22
zero. Therefore, we will perform simple linear regression analysis to test whether the slope
of the parameter is equal to zero. If we can reject (accept) that the regression slope is equal to zero, this means that there exist a (none) linear relationship between the two independent variables.
3.5.1 The Fit of the Regression Model
After we determined whether there existed a linear relationship or not between the two variables we wanted to see how strong the relationship was. From IBM SPSS Statistics we retrieved R2, this is a measure that explains the strength of the regression relationship. R2
estimates the corresponding population parameter which is the square of the correlation between the two variables. As correlation can only take values between -1 and +1, that is the value our correlation coefficient R can take. And since we square it, the number will be between 0 and 1. The interpretation of R2 is the percentage of the change in the dependent variable (Y) that is explained by the regression.
When R2 is 1, 100% of the variation in Y is explained by X. The other extreme value of R2 is 0, this means that the changes in Y is only explained by the error term and there is most likely no linear relationship between X and Y. These two extreme values are usually not occurring but are used for explanatory purposes. Since R2 is only an estimator of the
population we can not be sure that the linear relationship does not exist but we can use confidence intervals and by that draw conclusions with a certain probability that our findings reflects the whole population. To sum up, the higher R2 the better fit and higher confidence in the model. The confidence level used throughout this thesis is 95% (Aczel & Sounderpandian, 2006).
3.5.2 Research Hypothesis
The hypothesis is an assumption about the population which we use in our sample to evaluate the validity of this assumption (Bugler, 2012). In this thesis we want to see if the occurrence of underpricing can be predicted from information available from the IPO prospects. The hypothesis for testing if the initial stock price has an impact on the occurrence of underpricing is formulated and numbered as;
There is no correlation between the initial stock price and the occurrence of
underpricing.
There is a correlation between the initial stock price and the occurrence of
underpricing.
When we conduct the simple linear analysis but using ownership retention as the independent variable, the hypothesis was stated as;
There is no correlation between the retention rate of pre-IPO shareholders and the
occurrence of underpricing.
There is a correlation between the retention rate of pre-IPO shareholders and the
occurrence of underpricing.
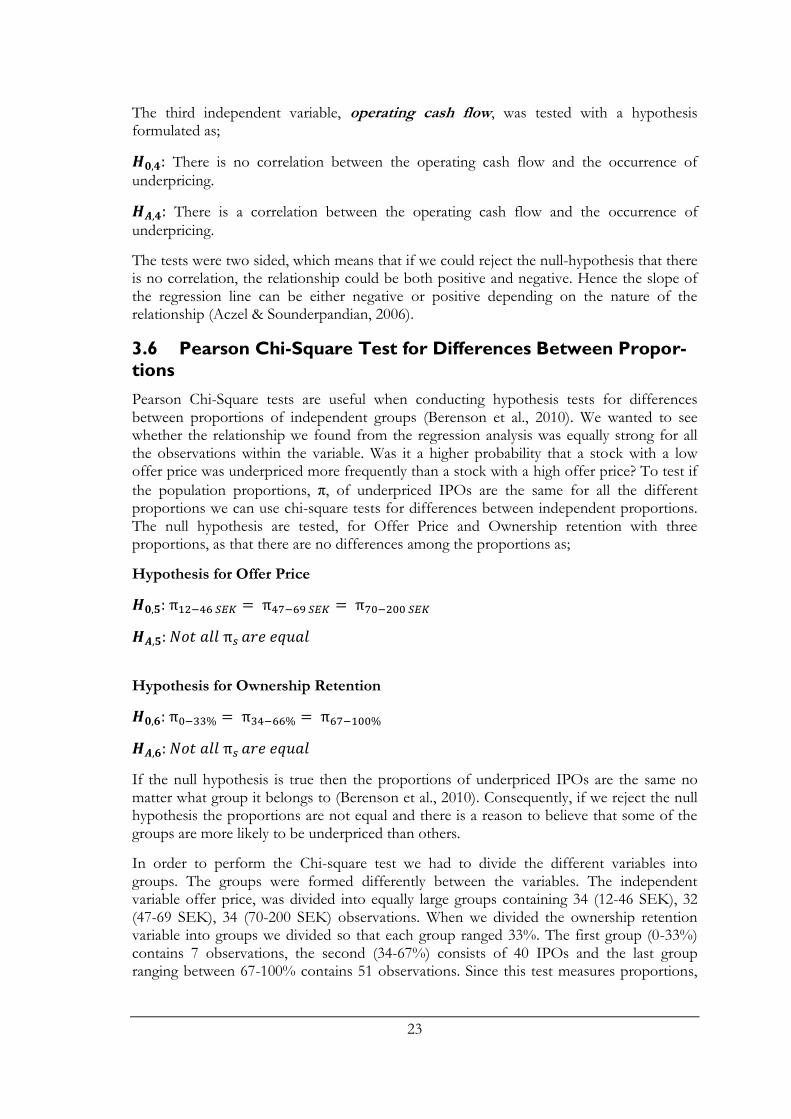
23
The third independent variable, operating cash flow, was tested with a hypothesis formulated as;
There is no correlation between the operating cash flow and the occurrence of
underpricing.
There is a correlation between the operating cash flow and the occurrence of
underpricing.
The tests were two sided, which means that if we could reject the null-hypothesis that there is no correlation, the relationship could be both positive and negative. Hence the slope of the regression line can be either negative or positive depending on the nature of the relationship (Aczel & Sounderpandian, 2006).
3.6 Pearson Chi-Square Test for Differences Between Propor-
tions
Pearson Chi-Square tests are useful when conducting hypothesis tests for differences between proportions of independent groups (Berenson et al., 2010). We wanted to see whether the relationship we found from the regression analysis was equally strong for all the observations within the variable. Was it a higher probability that a stock with a low offer price was underpriced more frequently than a stock with a high offer price? To test if
the population proportions, π, of underpriced IPOs are the same for all the different proportions we can use chi-square tests for differences between independent proportions. The null hypothesis are tested, for Offer Price and Ownership retention with three proportions, as that there are no differences among the proportions as;
Hypothesis for Offer Price
Hypothesis for Ownership Retention
If the null hypothesis is true then the proportions of underpriced IPOs are the same no matter what group it belongs to (Berenson et al., 2010). Consequently, if we reject the null hypothesis the proportions are not equal and there is a reason to believe that some of the groups are more likely to be underpriced than others.
In order to perform the Chi-square test we had to divide the different variables into groups. The groups were formed differently between the variables. The independent variable offer price, was divided into equally large groups containing 34 (12-46 SEK), 32 (47-69 SEK), 34 (70-200 SEK) observations. When we divided the ownership retention variable into groups we divided so that each group ranged 33%. The first group (0-33%) contains 7 observations, the second (34-67%) consists of 40 IPOs and the last group ranging between 67-100% contains 51 observations. Since this test measures proportions,

24
the test can be completed even with different group sizes. The operating cash flow variable was simply divided into groups where the IPOs stating positive OCF in their prospects were in one group and the ones with negative OCF in the other. The sample size was reduced to 86 in the test. The 14 IPOs we left out were excluded because they did not state their operating cash flow in their IPO prospect. The group with positive OCF consists of 56 IPOs and the group with negative values are 30. This test was a good way of eliminating the large dispersion our data showed. The null hypothesis for testing the differences between positive and negative OCF, that there is no differences between the two proportions, was formulated;
Hypothesis for Operating Cash Flow
After we divided the variables into groups and assigned each group a number, we used cross tabulation to measure the frequency each number occurred with another number. Cross tabulation is the process of creating a contingency table from the frequency distribution of statistical variables (Berenson et al., 2010). It was useful for us since we could then conclude if there was a higher probability that an IPO was underpriced if it was from a certain group within the variable. The dependent variable, price deviation, was assigned 0, 1 or 2 depending on if it was overpriced, underpriced or unchanged. Please note that the test does not say anything about the relationship between the two variables, which was however already tested in the regression analysis. Since our results from the regressions show some degree of relationship between Offer price and Ownership Retention with the occurrence of underpricing we wanted to test further whether there are groups within the variables that are more frequently underpriced.
3.7 Type I and Type II Error
When using a sample to make conclusions about the population, there is always a risk that you make the wrong decision when accepting or rejecting the null hypothesis. The two errors are called Type I and Type II error;
Type I Error occurs when you reject a null hypothesis that is true and should be accepted.
Type 2 Error occurs when you accept a null hypothesis that is false and should be rejected.
The probability of committing a Type I Error is denoted by the Greek letter alpha, α. The alpha is referred to as the level of significance in the different statistical tests in this thesis.
One can control the Type I Error by deciding the risk level that one is willing to accept. The level of risk acceptance is dependent on how expensive the error is. In this thesis we will use alpha 5% as our risk-acceptance level. Other common risk levels are 1% and 10% (Berenson et al., 2010).
3.8 Data Collection
When collecting data one can use primary and/or secondary data. These two methods differ from each other in the way they are collected and by whom. Primary data, also referred to as raw data, are data collected for the specific purpose of the research. The

25
primary data have not been subject for processing by a third party. Examples of primary or raw data can be the information that a cash register in a supermarket register during a normal day of business. The data in the register is the raw data. When the data has been subject to processing, extracted and compiled, a database is created with secondary data. Another characteristics of secondary data is that it is collected from someone else than the end user. Secondary data has both pros and cons. The main advantage of secondary data is the time saving aspect of the analysis. A large dataset of primary data can be impossible to collect for an individual researcher when time is limited (Lewis et al., 2009).
Our study is based on data from all IPOs on NASDAQ OMX Stockholm Stock Exchange between 1997 and 2011. The study is solely based on secondary data from different sources explained in this chapter.
We started with a list of all changes to the NASDAQ OMX Stockholm in the sample period, a list with over 1000 different entries. From this list we eliminated all the entries that were not a pure IPO. Entries were deleted due to;
Name changes, after IPO events are not of interest in this study.
Transfer between NASDAQ OMX lists.
Secondary listings, transfers from other stock exchanges in Sweden.
Spin-offs.
Offers targeted to certain investors.
De-listings.
Merger & Acquisitions.
After these eliminations we had our population, all the IPOs on NASDAQ OMX Stockholm between 1997 and 2011. This list consisted of approximate 195 IPOs. From here we took a sample of 103 stocks (Read more in chapter 3.9 Data Sampling). This became our final sample for this study. The reason for exclusively consider stocks at OMX Stockholm is that the stocks listed on the smaller lists are being traded less frequent, thus the historical data is not enough to conduct this study.
When the sample was finalized we started to collect our data. The data we collected for our empirical work was;
1st trading day Offer Price
Closing Price Ownership Retention rate
Operating Cash Flow Industry sector
The data was compiled in a spread sheet with columns for each factor and source of information. See Appendix A.

26
The table below aim to present the different sources to the different factors in a convenient way.
Table 1: Sources.
The first trading day was retrieved from the NASDAQ OMX Stockholm database. This parameter was important so we knew which date to look at when finding the stock quotes.
In order to calculate the underpricing of each stock we needed the offer price and the closing price the first day of trade. Offering prices have been collected from multiple sources; IPO Prospects, the Swedish Tax Agency9 and press releases from the Cisionwire database. Closing prices have also been collected from multiple sources, mostly from the Bloomberg database and from NASDAQ OMX database on their website. Random cases of data sampling from Cisionwire have occurred here as well.
The NASDAQ OMX industry categorisation is based on GICS, Global Industry Classification Standard and contains ten different industry segments. Retention and OCF were both collected from the prospect of the IPO.
The IPO Prospects have been ordered from the Swedish Financial Supervisory Authority, the authority who examines and publish the prospects.
3.9 Data Sampling
The population of 195 firms might not seem to be that large of a population. The research is although comprising and a lot of the information that needs to be collected has to be done manually and with a time constraint. Therefore we early on decided that we wanted to perform our tests on a sample of the population. This way we could ensure that the data sampling would be done in a correct and careful way.
As stated in chapter 2.2.3 Hot Issue Markets the occurrence of underpricing is more frequent during boom periods than recessions. Therefore, we needed a sampling method that took these differences into consideration in our sample. We wanted our sample to reflect the number of IPOs each year in the population. The use of a stratified random sampling method would allow us to do this and avoid the risk for one strata/year to be over represented in the sample. Hence, we divided our population into 15 strata, one for each
9 Skatteverket
Data Source/s Primary / Secondary
1st trading day NASDAQ OMX Stockholm Secondary
Offer Price IPO Prospect, Press, STA Secondary
Closing Price Bloomberg, OMX Stockholm, Press Secondary
Retention IPO Prospect Secondary
OCF IPO Prospect Secondary
Industry Sector OMX Stockholm/GICS Secondary

27
year. From each stratum we then draw a random sample of stocks. Each stock within each stratum was assigned a number, thereafter a random number generator in SPSS helped us generate stocks for each stratum.
We wanted a sample of 100 firms but due to round off reasons that was not possible so our first sample consisted of 103 instead of 100 as planned from the beginning. The sample of 103 companies was although decreased later to 100 due to missing figures for three companies (See Appendix B).
Year Population Weightings Sample Rounded Sample 1997 47 0,24103 24,103 24 1998 29 0,14872 14,872 15 1999 50 0,25641 25,641 26 2000 25 0,12821 12,821 13 2001 7 0,03590 3,590 4 2002 4 0,02051 2,051 2 2003 0 0,00000 0,000 0 2004 3 0,01538 1,538 2 2005 5 0,02564 2,564 3 2006 9 0,04615 4,615 5 2007 6 0,03077 3,077 3 2008 2 0,01026 1,026 1 2009 0 0,00000 0,000 0 2010 3 0,01538 1,538 2 2011 5 0,02564 2,564 3
195 1,000 100,000 103
Table 2: Number of IPOs in sample.
Bulger (2012) describes, in general terms, that if the sample size is larger than 30 one can assume that the central limit theorem can be applied. The central limit theorem allows us to make the same assumptions about the sample data that we would have done on the population. One advantage of the central limit theorem is that we do not need to have a normally distributed sample. That assumption can be disregarded due to the fact that a relatively large sample is supposed to reflect the population. The advantage of using a stratified random sample is that it produces a sample that yield unbiased estimators of the population while ensuring that all different strata (years) of the population is represented (Bugler, 2012).
3.10 Validity and Reliability
In order to reduce the possibility of getting the answer wrong Lewis et al. (2009) suggest that attention has to be paid on the reliability and the validity of the research. Reliability refers to if the research has yielded consistent findings through the data collection techniques and analysis process. Our data, collected in order to determine if there has been an underpricing, is collected from well-known databases which are reliable and updated such as Bloomberg and NASDAQ OMX. The independent variables have been collected, as previous stated, from the prospect of each IPO. The figures retrieved from each prospect are documented following the same systematic procedure. How we gathered the prospects is explained in chapter 3.9 Data Sampling. The data is then systematically documented in Excel. Furthermore, to secure a high qualitative sample, only reports signed by authorized auditors have been used.

28
We conclude this study to be reliable as we believe that the result of this study would be achieved if the study was repeated using the same methodology and sample described above.
Validity is about whether the findings are really about what they appear to be about, e.g. the extent to which the research result is generalisable. If the purpose of a research is to generalise the result over a population, is the sample used appropriate? (Lewis et al., 2009). The validity of this research result is assured due to the large sample. As earlier stated, according to the central limit theorem a result from a large sample can be concluded as a representative result for the whole population (Berk & DeMarzo, 2011). Our final sample consists of 100 IPOs, the result therefore has to be reliable and valid since it well exceeds the required amount for applying the CLT.
Moreover, it is reasonable to believe that the general market movements will affect the degree of underpricing of each single stock. Nevertheless, over a longer time period, the general market movements will not affect the occurrence of underpricing. It is rational to believe that the sample size and the assumptions about normal distribution should exclude the impact the market movement has had on individual stocks’ first day return. Therefore the stocks have not been filtered from market movements which can be seen in some previously published work in the field.
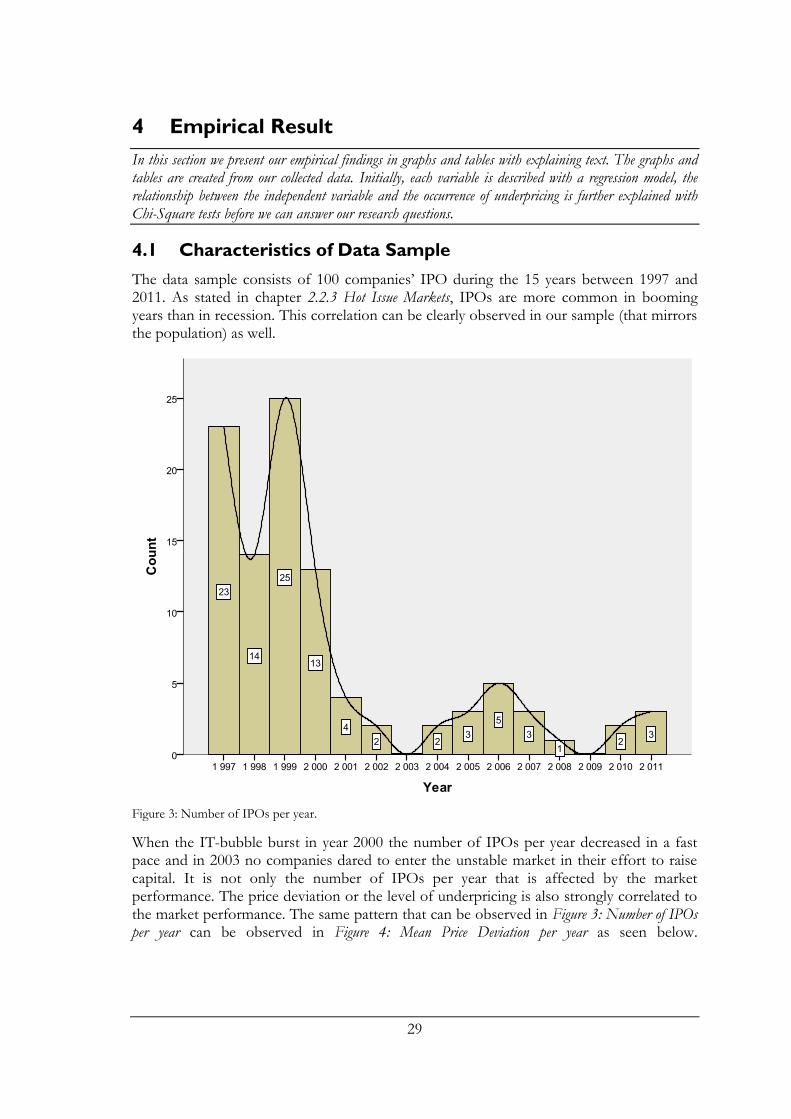
29
4 Empirical Result
In this section we present our empirical findings in graphs and tables with explaining text. The graphs and tables are created from our collected data. Initially, each variable is described with a regression model, the relationship between the independent variable and the occurrence of underpricing is further explained with Chi-Square tests before we can answer our research questions.
4.1 Characteristics of Data Sample
The data sample consists of 100 companies’ IPO during the 15 years between 1997 and 2011. As stated in chapter 2.2.3 Hot Issue Markets, IPOs are more common in booming years than in recession. This correlation can be clearly observed in our sample (that mirrors the population) as well.
Figure 3: Number of IPOs per year.
When the IT-bubble burst in year 2000 the number of IPOs per year decreased in a fast pace and in 2003 no companies dared to enter the unstable market in their effort to raise capital. It is not only the number of IPOs per year that is affected by the market performance. The price deviation or the level of underpricing is also strongly correlated to the market performance. The same pattern that can be observed in Figure 3: Number of IPOs per year can be observed in Figure 4: Mean Price Deviation per year as seen below.

30
Figure 4: Mean Price Deviation per year.
Recall the OMX Stockholm Exchange development in our sample period described in chapter 2.2 NASDAQ OMX Nordic Stockholm. When the bubble was at its’ peak in 1999 the average stock price increased with approximately 23% on the first day of trade. In 2010 when the markets were still unstable the average IPO only generated approximately 2% underpricing.
The sample has been divided into GICS ten different industry sectors. The sample is distributed over these ten sectors as can be seen in Figure 5: Sample Industry Sectors below.

31
Figure 5: Sample Industry Sectors.
The largest group and most frequently occurring industry sector in the sample is without doubt Technology. This can be partly explained by the fact that the many IPOs from the IT boom in 1999 are represented in our sample. Our purpose of this thesis was to test if underpricing was influenced by the Offer Price, Ownership Retention and OCF, but since we in our database had the data in which industry sector each stock was in, we also looked into industry sector and underpricing. The histogram in Figure 6: Industry Sectors and Price Deviation aim to briefly show possible correlation between industry sector and price deviation. The subject is not going to be investigated further and the histogram below aim to give a brief overview of the relationship.

32
Figure 6: Industry Sectors and Price Deviation.
The histogram shows how many IPOs in each industry sector that are underpriced, overpriced or unchanged in total during the sample period. The technology bar that is the widest does in other words not show a greater occurrence of underpricing but rather that the most IPOs are conducted within this sector. The interesting thing to look at here is the ratio between underpricing and overpricing. One cannot observe any significant difference between the sectors with the naked eye and the subject is with that left to future studies. The full table with the proportions for each industry sector can be found in Appendix C.
4.2 Summary of Statistical Procedures
The empirical results presented in this chapter are gathered from statistical analysis in form of hypothesis testing of the data collected. The hypothesis testing had to be forgone by some adjustments of the data in order to make the result representative for the majority of the IPOs between 1997 and 2011. The sample size differs depending on whether we are using Offer Price, Ownership Retention or Operating Cash Flow, as the independent variable. If an IPO had to be removed from a test that is because their IPO prospect did not contain the information required for conducting that particular test. The outliers were not removed from the sample but the extreme values have been adjusted in order to avoid a distorting effect on the sample. The value of the outlier was simply transformed to the second highest/lowest value (Ramsey, 2009). By that we could maintain the number of observations in our sample.

33
The statistical analyse has been initially conducted with regression analysis. When conducting the regressions we got a first picture of the relationship between the variables. The research questions and consequently the hypothesis formulated are investigating the occurrence of underpricing and not the actual level of underpricing. However, when conducting the regression analysis to test for the occurrence of underpricing the dependent variable has to be denoted as the level of underpricing.
Furthermore we wanted to see if the relationship perceived from the regression analysis differed within each variable. We divided the variables into groups and assigned each group a number. We then used cross tabulation to measure with what frequency each number occurred together with another number. We could then conclude if there was a higher probability that an IPO was underpriced if it belonged to a certain group within the independent variable. These results can be found later in this chapter and will be elaborated around in chapter 5 Analysis.
4.3 Sample T-test
The following picture represents the sample distribution of the firms’ first day return. There is a fairly large standard deviation, meaning that our sample shows dispersion among the observations.
Figure 7: Sample Distribution.
We wanted to test if our sample showed an underpricing the first day of trade. If our sample mean price deviation was larger than zero, we could conclude the occurrence of underpricing. Recall the hypothesis stated in chapter 3.4 T-Test;
μ ≤ 0
μ > 0
The mean price deviation on the first day of trade is 14,33%. It can be observed in Table 3
that we have a lower significance value, α, than 5% (0,000) and that there is sufficient

34
evidence to believe that the population mean is larger than zero10. We can therefore reject
the null hypothesis, and state that underpricing is occurring in our sample.
One-Sample Test
Test Value = 0
t df Sig. (2-tailed) Mean Difference
95% Confidence Interval of the Difference
Lower Upper
Price deviation 5,977 99 ,000 14,32830% 9,5720% 19,0846%
Table 3 Sample T-Test Result.
The complete result of the T-test can be found in Appendix D.
4.4 Stock Price
Recall the second hypothesis shown below, we wanted to test if the initial stock offer price was correlated to the occurrence of underpricing.
There is no correlation between the stock offer price and the occurrence of
underpricing.
There is a correlation between the stock offer price and the occurrence of
underpricing.
The histogram in Figure 8: Offer Price Distribution shows the distribution of the offer prices in the sample period. The mean offer price is 64,42 SEK and the sample data’s distribution around the mean can be seen in the figure below.
10 The significance value (Sig. (2-tailed)) represents a two-tailed test. However this is a one-tailed test but
SPSS does not allow us to make this test. Thus, we will have to multiple 0,000 with 2 in order to get the correct significance value. 0,000 times 2 is although still smaller than our alpha-level 5%.

35
Figure 8: Offer Price, Distribution.
To test whether offer price and price deviation had a correlation we started off by conducting a linear regression analysis, further explained in chapter 3.5 Linear Regression Analysis. The complete result can be found in Appendix E.
Model Summary
Model R R Square Adjusted R Square Std. Error of the Esti-
mate
1 ,189a ,036 ,026 23,65935%
a. Predictors: (Constant), Offer Price
Table 4: Model Summary, Linear Regression Offer Price.
In Table 4 the value R2 (R Square) 0,036 explains that 3,6% of the variation in the dependent variable (price deviation) is explained by the initial stock offer price. The Std Error of the Estimate 23,6% is the mean distance from the regression line shown in Figure 9: Offer Price, Scatterplot.
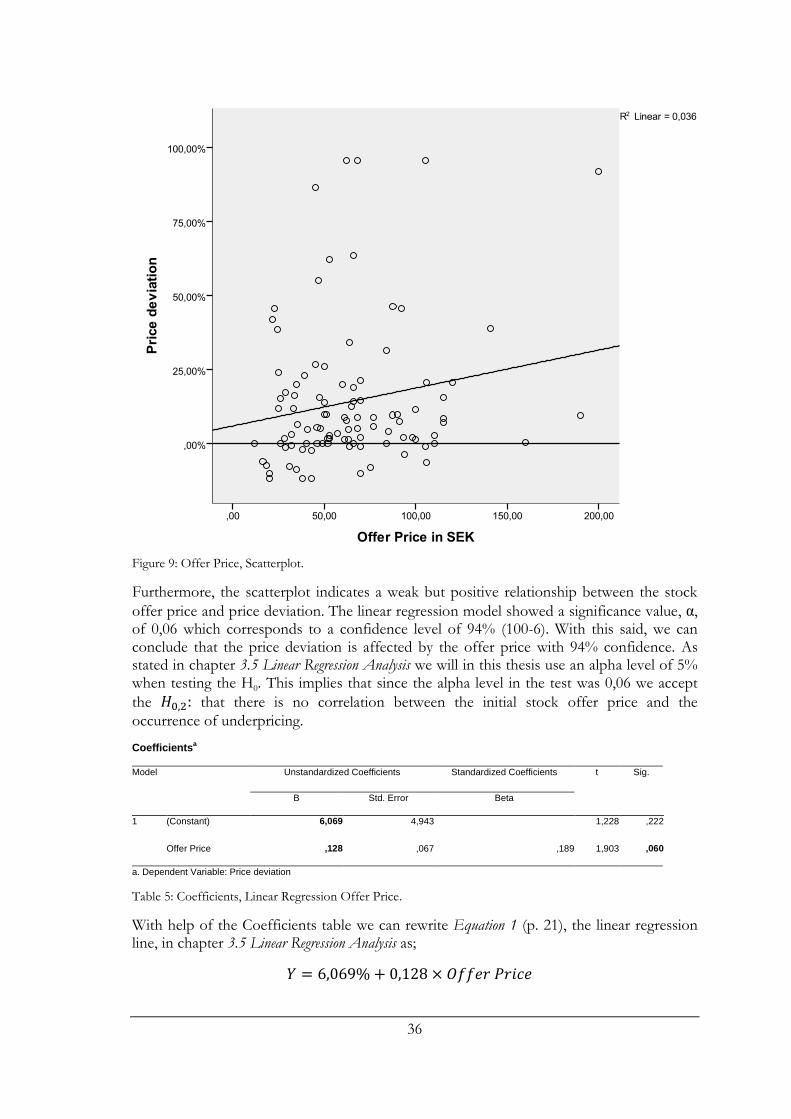
36
Figure 9: Offer Price, Scatterplot.
Furthermore, the scatterplot indicates a weak but positive relationship between the stock
offer price and price deviation. The linear regression model showed a significance value, α, of 0,06 which corresponds to a confidence level of 94% (100-6). With this said, we can conclude that the price deviation is affected by the offer price with 94% confidence. As stated in chapter 3.5 Linear Regression Analysis we will in this thesis use an alpha level of 5% when testing the H0. This implies that since the alpha level in the test was 0,06 we accept
the that there is no correlation between the initial stock offer price and the
occurrence of underpricing.
Coefficientsa
Model Unstandardized Coefficients Standardized Coefficients t Sig.
B Std. Error Beta
1 (Constant) 6,069 4,943 1,228 ,222
Offer Price ,128 ,067 ,189 1,903 ,060
a. Dependent Variable: Price deviation
Table 5: Coefficients, Linear Regression Offer Price.
With help of the Coefficients table we can rewrite Equation 1 (p. 21), the linear regression line, in chapter 3.5 Linear Regression Analysis as;

37
We were although close to reject the and if we would have choose 10% as our
significance level we would have rejected the and stated that we could not accept the
null hypothesis that no relationship was occurring between the two variables.
We now divided the sample of 100 stocks into three equally sized groups according to chapter 3.6 Chi-Square Test for Differences Between Proportions. The result of the group segmentation can be overviewed in Figure 10: Offer Price Dummy, Histogram and the full result from the Chi-Square test can be found in Appendix F.
Figure 10: Offer Price Dummy, Histogram.
One can observe that the price group 47-69 SEK has the highest underpriced/overpriced ratio and that there is a difference in this ratio between the three groups. This was tested in a Chi-Square test for equality proportions, further explained in chapter 3.6 Chi-Square Test for Differences Between Proportions.
Price Group * Price Deviation Cross tabulation
Count
Price Deviation
Total Overpriced Underpriced Unchanged
Price Group
12-46 SEK 12 18 4 34
47-69 SEK 1 28 3 32
70-200 SEK 6 26 2 34
Total 19 72 9 100
Table 6: Offer Price Dummy, Cross tabulation.

38
Recall the hypothesis for the Chi-Square test;
The test was conducted with the purpose to see if the three different groups’ proportions
differed from each other. Our Chi-Square Test allow us to reject the with 95%
confidence level. The rejection is done based on two conclusions. The α-value (0,014) is lower than 0,05 and the risk for committing a type I error is therefore low. This together with the fact that the test value 12,567 is above 11,0705 is evidence enough to reject the null hypothesis. 11,0705 is the critical value for a Chi-Square test with 4 degrees of freedom and 95% confidence (Aczel & Sounderpandian, 2006).
We have sufficient evidence to reject and believe that there are more frequently
underpriced IPOs in some of the price range groups. The group that is most frequently underpriced is ranging between 47-69 SEK.
Chi-Square Tests
Value df
Asymp. Sig. (2-sided)
Exact Sig. (2-sided)
Exact Sig. (1-sided) Point Probability
Pearson Chi-Square 12,567a 4 ,014 ,002
Likelihood Ratio 14,035 4 ,007 ,002 Fisher's Exact Test 12,968
1,000
Linear-by-Linear Asso-ciation ,863
b 1 ,353 ,419 ,209 ,060
N of Valid Cases 100 a. 3 cells (33,3%) have expected count less than 5. The minimum expected count is 2,88. b. The standardized statistic is ,929.
Table 7: Offer Price Dummy, Chi-Square Tests.
4.5 Ownership Retention
To test whether the amount of shares retained by the pre-IPO shareholders are correlated with the occurrence of underpricing we formed in chapter 3.5.2 Research Hypothesis the following hypothesis;
There is no correlation between the retention rate of pre-IPO shareholders and the
occurrence of underpricing.
There is a correlation between the retention rate of pre-IPO shareholders and the
occurrence of underpricing.
The figure below shows the distribution of the retention rate in our sample with an average retention rate of 64,56%. The sample size is reduced to 98 observations due to two IPOs’ lack of information regarding the retention rate in their IPO prospect.

39
Figure 11: Ownership Retention, Distribution.
In order to answer our research question and test the null hypothesis if there is a correlation between the retention rate and price deviation we, once again, started off with a regression analysis. The complete result from the regression analysis can be found in Appendix G.
Model Summary
Model R R Square Adjusted R Square Std. Error of the Estimate
1 ,140a ,020 ,009 24,10072%
a. Predictors: (Constant), Retention
Table 8: Model Summary, Linear Regression Ownership Retention.
From Table 8 we retrieve the R2 value of 2%. This means that Ownership Retention explains 2% of the changes in underpricing. The mean distance from the regression line is 24,1%. This is explained graphically in the scatterplot below.

40
Figure 12: Ownership Retention, Scatterplot.
The scatterplot indicates a weak but yet positive relationship. However the relationship is
not sufficient enough to reject on a significance level of 95%. Table 9 below shows
the test statistics of the regression analysis. The regression analysis yielded a significance value of 0,169 which is larger than 0,05 and hence we cannot reject the null hypothesis. We can conclude that there is no significant correlation between ownership retention and price deviation.
Coefficientsa
Model
Unstandardized Coefficients Standardized Coefficients
t Sig. B Std. Error Beta
1 (Constant) 3,183 8,409 ,379 ,706
Retention ,174 ,125 ,140 1,386 ,169
a. Dependent Variable: Price deviation
Table 9: Coefficients, Linear Regression Ownership Retention.
The equation of the linear regression line can be written;
Once again, the null hypothesis could not be rejected. However if we would have lowered our significance level to 83,1% the alternative hypothesis would have been favoured. Conversely, it means that is 16,9% probability we are wrong and committing a type I error
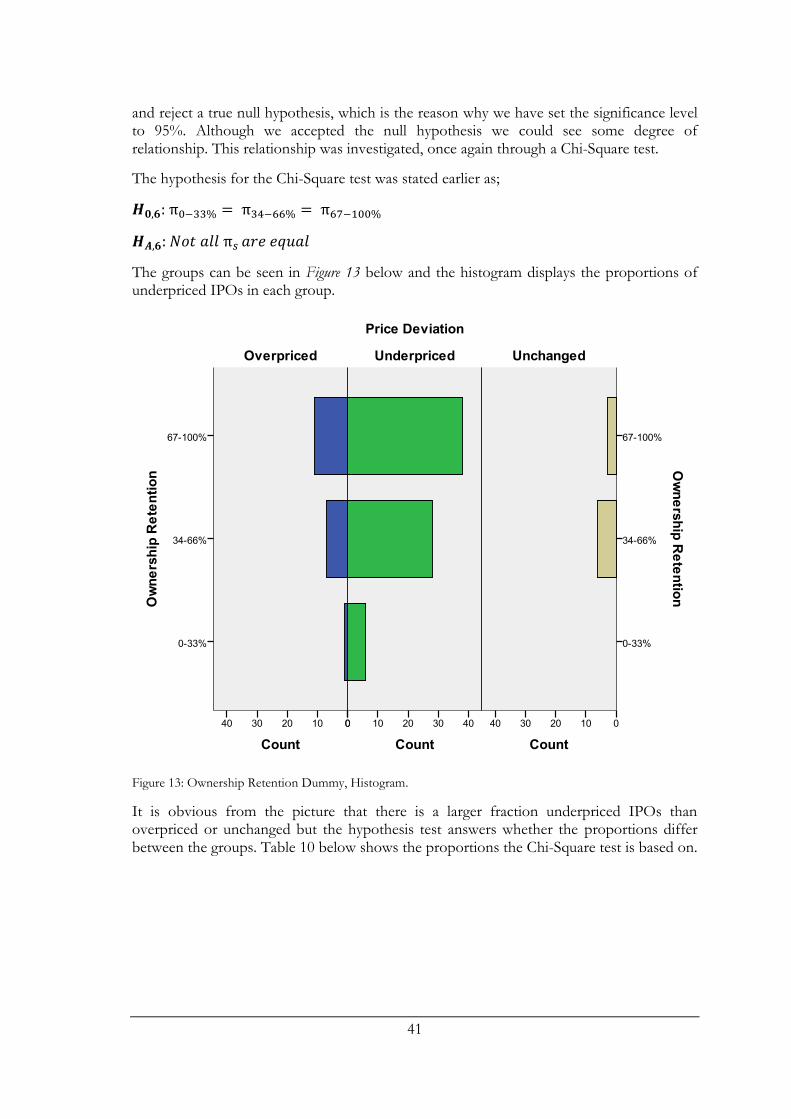
41
and reject a true null hypothesis, which is the reason why we have set the significance level to 95%. Although we accepted the null hypothesis we could see some degree of relationship. This relationship was investigated, once again through a Chi-Square test.
The hypothesis for the Chi-Square test was stated earlier as;
The groups can be seen in Figure 13 below and the histogram displays the proportions of underpriced IPOs in each group.
Figure 13: Ownership Retention Dummy, Histogram.
It is obvious from the picture that there is a larger fraction underpriced IPOs than overpriced or unchanged but the hypothesis test answers whether the proportions differ between the groups. Table 10 below shows the proportions the Chi-Square test is based on.

42
Retention * Price Deviation Crosstabulation
Count
Price Deviation
Total Over-priced Underpriced Unchanged
Retention 0-33% 1 6 0 7
34-66% 7 27 6 40
67-100% 11 37 3 51
Total 19 70 9 98
Table 10: Ownership Retention Dummy, Cross tabulation.
The result from the Chi-Square test, which is showed in Table 11, is clear that there is no significant difference between the proportions. The significance value of 0.541 is much larger than 0.05 which is our rejection level. The high significance value indicates a low risk of committing a type II error, to accept a false null hypothesis. Consequently there is no sufficient evidence to believe that different retention rates are more frequently underpriced
than others. Hence we accept .
Chi-Square Tests
Value df
Asymp. Sig. (2-sided)
Exact Sig. (2-sided)
Exact Sig. (1-sided) Point Probability
Pearson Chi-Square 3,100a 4 ,541 ,264
Likelihood Ratio 3,604 4 ,462 ,159 Fisher's Exact Test 2,378
1,000
Linear-by-Linear Asso-ciation ,641
b 1 ,423 ,446 ,260 ,089
N of Valid Cases 98 a. 4 cells (44,4%) have expected count less than 5. The minimum expected count is ,63. b. The standardized statistic is -,801.
Table 11: Ownership Retention Dummy, Chi-Square Tests.
The complete result of the Chi-Square test of ownership retention can be found in Appendix H.
4.6 Operating Cash Flow
The procedure of testing the correlation between the OCF and underpricing is the same as with the two previously tested variables, Stock Price and Ownership Retention. We are now testing our fourth hypothesis;
There is no correlation between the operating cash flow and the occurrence of
underpricing.
There is a correlation between the operating cash flow and the occurrence of
underpricing.
The sample in this test is reduced from 100 to 86 due to missing figures for 14 companies. The distribution of the data can be seen below and the mean operating cash flow for these companies is 33 742 053 SEK.

43
Figure 14: OCF, Distribution.
The linear regression analysis was performed in the same manner as earlier and can be fully viewed in Appendix I. The test result was interpreted and we can determine the R2 value in the model to be 0,003. A very low value and one can conclude that only 0,3% of the change in price deviation can be explained by the operating cash flow. The standard error of the estimate is 25,08% in the model and the standard deviation is 101 969 251,80 SEK.
Model Summary
Model R R Square Adjusted R Square Std. Error of the Es-timate
1 ,051a ,003 -,009 25,07981%
a. Predictors: (Constant), Operating Cash Flow
Table 12: Model Summary, Linear Regression OCF.
The regression line in the scatterplot is very flat, again indicating a very low relationship between OCF and price deviation. The slope of the regression line, the beta value, is low and when rounded off to three decimals -0,000. In the Table 13 we find the intercept 15,311. These two values create the linear regression equation;

44
Figure 15: OCF, Scatterplot.
The α-level 0,638 in the Coefficients table is very far away from our desired value of 0,05.
The low t-value together with the high significance value clearly tells us to accept the
that there is no correlation between OCF and price deviation.
Coefficientsa
Model
Unstandardized Coefficients Standardized Coeffi-
cients
t Sig. B Std. Error Beta
1 (Constant) 15,311 2,850 5,372 ,000
Operating Cash Flow ,000 ,000 -,051 -,472 ,638
a. Dependent Variable: Price deviation
Table 13: Coefficients, Linear Regression OCF.
Even if we stated that there is no relation between OCF and price deviation we wanted to make the same Chi-Square test as in the previous two sub-chapters. We therefore divided all our companies into two different subgroups. The ones with positive OCF created one group and the ones with negative OCF created a second group. We then used the Chi-Square test to see if there was a difference in the proportions of underpricing between the two groups.
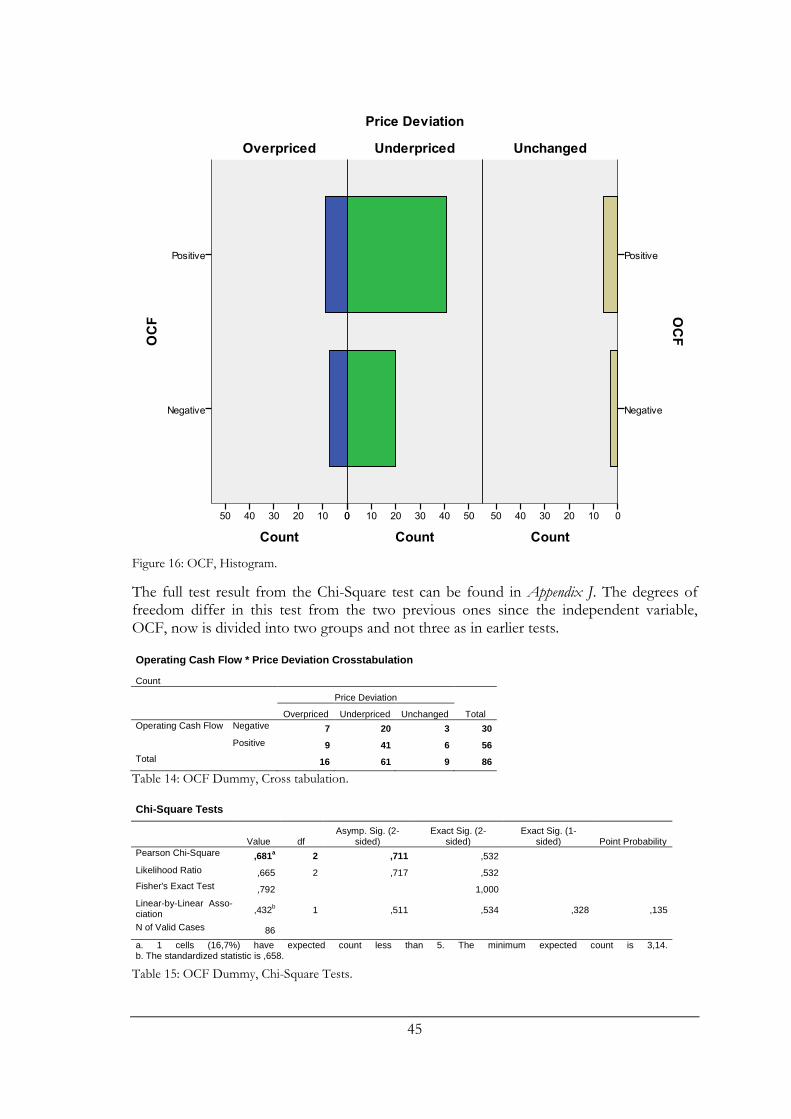
45
Figure 16: OCF, Histogram.
The full test result from the Chi-Square test can be found in Appendix J. The degrees of freedom differ in this test from the two previous ones since the independent variable, OCF, now is divided into two groups and not three as in earlier tests.
Operating Cash Flow * Price Deviation Crosstabulation
Count
Price Deviation
Total Overpriced Underpriced Unchanged
Operating Cash Flow Negative 7 20 3 30
Positive 9 41 6 56
Total 16 61 9 86
Table 14: OCF Dummy, Cross tabulation.
Chi-Square Tests
Value df
Asymp. Sig. (2-sided)
Exact Sig. (2-sided)
Exact Sig. (1-sided) Point Probability
Pearson Chi-Square ,681a 2 ,711 ,532
Likelihood Ratio ,665 2 ,717 ,532 Fisher's Exact Test ,792
1,000
Linear-by-Linear Asso-ciation ,432
b 1 ,511 ,534 ,328 ,135
N of Valid Cases 86 a. 1 cells (16,7%) have expected count less than 5. The minimum expected count is 3,14. b. The standardized statistic is ,658.
Table 15: OCF Dummy, Chi-Square Tests.

46
As seen in the Chi-Square Test above we do not have sufficient evidence to reject the that the two groups proportions equal each other. The alpha-level is significantly far away from 0,05. An alpha of 0,711 indicates that there is a risk of 71,1% of making a type I error, rejecting a true hypothesis.
With this said we accept both and . There is not enough evidence in our empirical
work to prove that there is a relationship between OCF and price deviation. Neither is there a difference in the proportions between the two OCF groups, hence an IPO with a positive OCF was not more likely to be underpriced than an IPO with a negative OCF.
4.7 Summary of Empirical Result
We have now examined the three different variables and their relationship to IPO underpricing. The first hypothesis tested if underpricing was occurring in our sample or not. This was the test that showed the most significant result and we could conclude that underpricing was occurring and reject the null hypothesis. In previous chapters we mentioned that Karlis (2000) stated that the average IPO underpricing in the US was 14,1%. This figure was confirmed in our statistical tests and our sample averaged 14,33%.
Hypotheses Result μ ≤ 0 Reject
There is no correlation between the initial stock price and the
occurrence of underpricing.
Accept
There is no correlation between the retention rate of pre-IPO
shareholders and the occurrence of underpricing.
Accept
There is no correlation between the operating cash flow and the
occurrence of underpricing.
Accept
Reject
Accept
Accept
Table 16: Summary of Empirical Result.
The first hypothesis was followed by three hypotheses that aimed to test the linear relationship between the three different factors and IPO underpricing. None of these tests showed any significant relationship. We were although close to find significant evidence to reject the 2nd hypothesis. Stock price and underpricing showed a relationship with 94% confidence, just under our confidence level 95%.
The statistical procedure was after the linear regression analysis brought forward and we now tested proportions according to a Pearson Chi-Square test. Hypothesis 5-7 examined differences in the proportions between different dummy groups among the factors tested. The empirical part of this thesis locates one significant relationship and that was in the Chi-square testing. Hypothesis 5 showed a strong relationship and we stated that there is a difference in the occurrence of underpricing between the three different price groups. The Chi-Square test result for the two other variables, Ownership Retention and OCF, did not show any statistical significance.

47
5 Analysis
The analyse chapter has the aim of providing the reader with thoughts and comments about our empirical findings. The theoretical framework that was introduced in chapter two will be applied when understanding the empirical data. Comparisons between our empirical findings and theories will be made in order to complete the analysis.
5.1 IPO Underpricing
The empirical result of our study shows that the IPOs conducted between 1997 and 2011
had a mean price deviation the first day of trade of 14,33%, and we could reject and
conclude an occurrence of underpricing. This confirmed Ritter’s (1998) reasoning that underpricing IPOs is a frequent phenomenon and Berk and DeMarzo’s (2011) idea that most IPOs are priced to give a first day positive return.
As can be seen in our sample most of the IPOs took place in the first part of the sample period. This can be explained by the hot market that was present in the years between 1997 and 1999 due to the IT bubble. In the figure below we have put Figure 3, showing the number of IPOs each year with a solid line, on top of the graph with the spotted line representing the development of the OMX Stockholm movement from Figure 2.
Figure 17: OMX Stockholm Movement and Number of IPOs.

48
From the figure above we can tell that the state of the market has an impact on the willingness of going public. When the market is going up so does the number of IPOs. According to Arkebauer and Schultz (1998) the time it takes to conduct an IPO is up to 12 months. It is therefore reason to believe that the decision to go public is based partly on the development of the market climate the previous period. The lines are because of that offset from each other by a few months. This effect is illustrated by the fact that 13 companies was introduced on the OMX Stockholm in year 2000 after that the market’s return 1999 was up by 66,5%. The following three years through 2003, the market fell by more than 56% and no IPOs took place during 2003.
To go public is mainly about raising capital. To raise as much capital as possible the issuing firm needs to work hard to get the offer fully subscribed to the highest possible stock price. The investors’ willingness to invest in new IPOs is of course dependent on the market climate and the market outlook. In a bad climate with a poor performing stock market many investors draw cold feet and do not invest in any IPOs. Hence, one can state that the market climate strongly reflects the IPO climate and when the IPO climate is bad no firms takes the decision to go public. The market sensitivity of the IPO transaction can often be a stress-factor to the entrepreneur or the issuing firm (Ritter, 1998). Furthermore, the hot market is not only affecting the number of IPOs but also the degree of underpricing. When the demand is high it is not only affecting the number of IPOs conducted but also the actual stock performance on the first day of trade (Observe the similarities between Figure 3 and 4). This is in line with the Winner’s Curse Hypothesis, where high demand drives up the prices (Rock, 1986). Consequently, stocks introduced in worse market condition faces a tougher first day on the public market. In the graph below we have laid Figure 2 above Figure 4 to explain this relationship graphically. Ibbotson and Jaffe’s (1975) theory about hot issue markets is confirmed by the fact that the solid line, showing the mean price deviation, clearly follows the market performance.

49
Figure 18: OMX Stockholm Movement and Mean Price Deviation.
From the graph above it can be observed that the degree of underpricing was larger and the correlation with the market higher in the earlier years of the sample period. This can be partly explained by the use of different pricing strategies over the years. In recent years a book building strategy has been increasingly popular (Espinasse, 2011). Since this strategy adjusts the prices after the market’s demand for the stock offering before it goes public, the degree of underpricing is expected to be smaller. One can say that some degree of the price movements takes place before the stock is introduced to the public market. This is one of the major differences from using a fixed pricing strategy. With the fixed pricing strategy, which was more frequently used in the late 90’s, the asymmetric information was more prominent. With high levels of asymmetric information the Winner’s Curse hypothesis hits harder. Recall that under the Winner’s Curse hypothesis, uniformed investors pay an overprice for shares after “winning” an auction over informed investors who are not willing to pay the high price. The risk of Winner’s Curse should thereby decrease when the book building strategy primary is used. When the investors’ expectations are included in the offer price the information is less asymmetric and the stock offer price is closer to the market price. Consequently, the degree of underpricing should be smaller. This price adjustment is explained by the market feedback theory first introduced by Ritter (1998).
50
5.2 Stock Price
The offer price should, according to financial foundations, not have any impact on the investors’ valuation of a single stock. The stock price itself states nothing about if a stock is over- or undervalued. However, Abrahamsson et al. (2011) claimed that companies strive towards having their stock price in a desirable level. Our mean offer price also confirms Ritter’s (1998) predicted price level of 65,50 SEK for IPOs. We found the test result from
the regression model, accepting that the offer price was not correlated with the
occurrence of underpricing, interesting. The risk of committing a Type II error by accepting the null hypothesis with an alpha value as low as 0,06 is although high. Hence, one could suspect some degree of correlation between the offer price and the occurrence of underpricing.
The result from the Chi-Square test for equality between proportions showed that there was a difference in the proportion of underpriced stocks between the three price groups.
We could therefore reject the and conclude that the most frequent price group to be
underpriced was the one ranging between 47-69 SEK.
Since the stock performance is usually measured in per cent, an increase of 5% is the same for 1 stock á 100 SEK as 10 stocks á 10 SEK. In other words, the investor receives the same payoff when buying one “expensive” stock as when purchasing 10 “cheap” ones.
Nevertheless, the price does have an impact and people tend to make irrational investment decisions according to the theories about behavioural finance. People seem to have preferences for stocks that are not perceived as expensive. As Angel (1997) stated there is usually a specific trading range in the market, this range differs from country to country. We believe this range to be reflected in our sample mean of 64,42 SEK. Our sample mean further lies within the most frequently underpriced group. Hence, the issuing firms successfully set the price at a level that is attractive to investors which drives up the demand and create a positive first day return.
As some stocks can be perceived too expensive, stocks can also be overlooked due to a too low price. Stocks with a very low offer price are, incorrectly, commonly associated with scepticism and investors perceive them to be flawed in different ways (Abrahamsson et al., 2011). This is also confirmed by our empirical results where the group with the lowest offer prices are least frequently underpriced. Another reason for low priced stocks being less underpriced than high priced stocks are the type of investor who invest in the company. Abrahamsson et al. (2011) found in their report that high offer prices tend to attract institutional investors rather than retail investors, whereas retail investors attracts by lower prices. They link this to underpricing, claiming that institutional investors hold superior information over retail investors and usually find the IPOs which generates a high initial return.
Our result is however contradicting with Abrahamsson et al. (2011) in one way. They found a U-shaped relationship between offer prices and initial return, when the offer price increased the initial return decreased and eventually the return went up with the offer price. Our findings show the opposite, where the frequency of underpriced IPOs increases when offer price increases before it decreases when the offer price gets too high.
The bandwagon effect, also called informational cascades, enhance one investors irrational decision. When one investor rejects an opportunity to invest in an IPO his decision affects

51
the next investor’s decision whether to invest or not. Even if the second investor has information supporting an investment he might refuse the IPO due to the informational cascade from the previous investor’s decision. When many investors make the same decision it reflects the stock price and enhances the price deviation. Consequently, in those situations where informational cascades are present, the potential underpricing can many times be explained by hype over the IPO.
5.3 Ownership Retention
The amount of shares retained by the owners before an IPO has historically been seen as a signal of an IPOs quality (Fan, 2006). We therefore expected to find a relationship between the percentage of retained shares by the pre-IPO shareholders and the occurrence of underpricing. The result however, showed a relatively weak but positive relationship and
we could not reject our , that there is a correlation between the retention rate and the
occurrence of underpricing. If we would have rejected the null hypothesis, we could only
be 83,1% (100-α) sure that it was the correct decision, hence the risk of committing a Type I error was too large. When choosing Ownership Retention as one of our factors we wanted to see how strong the signaling of the retention rate was in the IPO. The Signaling Theory, first introduced by Leland and Pyle (1977), has been developed with the purpose to help investors make rational decisions by reducing information asymmetries. Our study shows, inconsistent with Karlis study from 2000, that the retention rate is not a signal to the investors of the IPO’s initial performance and the true value of the firm. The test for differences between proportions showed no significant result. The IPO that sold of more than 2/3 of the shares were as likely to be underpriced as the IPOs selling of less than 1/3 of the company. This again, contradicts with the signalling theory that the retention rate should be a signal for investors that the company who retained a lot have a strong trust in their future operations. By analysing the result and state that the positive relationship between ownership retention and occurrence of underpricing did not exist, we also saw that the entrenchment hypothesis did not hold in this study. Recall from chapter 2.5.3 Entrenchment hypothesis that the theory suggests a negative signal from the retention rate and that issuers would pursue private benefits with the investors invested capital (Hermalin & Weisbach, 1988). However the result is equal among the proportions and nothing that supports the entrenchment hypothesis and that the relationship should be negative was discovered. One interesting aspect when looking at our groups divided after how much each IPO retains (See Table 10), is that the most of the issuing firms retain more than 33%. By looking at the histogram in Figure 11 it can be seen, from the skewed distribution, that most of the IPOs retain more than 50% of the shares. One way of looking at this can be to consider the overconfidence about the own operations. Ritter (2003) referred this phenomenon to be specifically common among entrepreneurs. Since many firms that goes public are relatively young companies (Karlis, 2000), it should be common that the entrepreneurs still hold influential positions. It should therefore not be surprising if they intend to retain as much as possible and ignore the Signaling Theory.

52
5.4 Operating Cash Flow
The weakest relationship in this study was found in the last of the three tested variables.
The relationship between OCF and IPO underpricing, tested in , was not significant
and generated the lowest test result. With an alpha of 0,638 we faced a probability of almost 65% to commit a Type I error if we would have rejected the null hypothesis. With this said we strongly accepted the null hypothesis and stated that there was no evidence of correlation between OCF and the occurrence of underpricing.
The Operating Cash Flow variable differs from the other two variables in the sense of the degree of dispersion it allows. The Retention Rate can only take values between 0-100% and Stock Offer Prices are naturally controlled not to take extreme values. Company specific attributes are not directly reflected in these two variables. Operating Cash Flow on the other hand, shows significant differences between large and small companies who are in different stages in their business life cycle. This wide dispersion can be seen in the large standard deviation observed in Figure 14 – OCF, Distribution. The standard deviation is three times larger than the mean in contrast with the other two variables that have a smaller standard deviation than mean.
The high dispersion effect was by nature eliminated in the Chi-Square test. Now all the negative cash flows were bundled into one group and the positive into another. As the test result revealed, no significant differences between the two groups existed and we
accepted . After thoroughly research, the authors have not taken part of any previous
studies concerning the link between OCF and IPO underpricing. Consequently, the result from our findings cannot be supported nor rejected by previous studies. We although expected OCF to be a good indicator of the companies’ performance. Thus, we believed that it would be a good signal for the potential investors indicating the quality of the IPO in line with the Signaling Theory (Leland & Pyle, 1977). There is however several considerations supporting our rejection of the assumed relationship.
First of all, since the companies are from different industries and are in different stages in the business life cycle, the OCF is expected to vary with the firms. According to Karlis (2000) many firms conduct an IPO in their early years. Our sample consists of a majority of IPOs conducted within the technology sector (See Figure 6). Karlis further states that this sector consists of many firms that make an IPO before they have significant financial data in which the investors can find investment support.
Furthermore, another reason for a low OCF can be that firms many times need the capital raised from the IPO in order to start generate revenues and get their cash started to flow. In these cases it makes the valuation of the firm more complex. The investment bank would need to consider other aspects than the cash flow when they value the firm. When the financial track record is less proven the stock generally enter the market on a lower price. As we have earlier mentioned the issuing firm and the investment bank’s risk of not get a fully subscribed IPO increases together with this uncertainty. Therefore the valuation of technology companies during the IT-bubble was likely to be based on expectations about the future instead of financial fundamentals. Thus, high initial returns occurred frequently due to the differences between the markets valuation and the book valuation.
One can conclude that the market’s expectation and hype, is too strong and overlook financial fundamentals such as the operating cash flow, as a contributing factor for driving up the first day return.

53
6 Conclusion
Chapter 6 will answer and discuss the research questions. A conclusion of each of the independent variables and their relationship with IPO underpricing will be conducted together with suggestions for future studies.
The purpose of this thesis was to describe and examine how the underpricing of IPOs is influenced by Stock Offer Price, Ownership Retention and Operating Cash Flow on OMX Stockholm between 1997 and 2011. The occurrence of underpricing was confirmed in our study. This is in line with several previous studies who discussed the reoccurring phenomena of underpricing. We further found that the degree of underpricing had a diminishing trend. The confirmed underpricing was subject for statistical testing in order to answer our three research questions. To answer these questions, two tests were undertaken for each independent variable, Simple Linear Regression and Pearson Chi-Square Test for Differences Between Proportions.
- Is IPO underpricing influenced by the Stock Offer Price? The regression analysis yielded a positive relationship, but yet not significant, between the offer price and the underpricing. The relationship was, however, too weak in order to statistically conclude that the IPO underpricing was influenced by the stock offer price. Furthermore the test for differences between proportions showed that IPOs in the price range 47-69 SEK was more frequently underpriced than the IPOs in the two other price groups (12-46 SEK and 70-200 SEK). Previous studies by Angel (1997) and Abrahamsson et al. (2011) showed that stocks can be perceived as both too cheap and too expensive. Our result supports these findings and we have evidence to believe that our middle price range is the most attractive one to invest in, and hence most frequently underpriced.
- Is IPO underpricing influenced by the Ownership Retention? We can with our empirical result conclude that ownership retention do not influence the occurrence of underpricing. In this case, the regression analysis showed a weaker result than the test for the stock price. The Chi-Square test did not show any significant differences between the groups and we state that an IPO wwriterith high retention rate is as likely to be underpriced as an IPO with low retention rate. The rejection of ownership retention as a factor influencing the occurrence of IPO underpricing, contradicts to the signaling theory by Leland and Pyle (1977) and entrenchment hypothesis by Hermalin and Weisbach (1988). Both these theories suggest that some relationship exists, either positive or negative. Our findings however, show no kind of relationship between the retention rate and the occurrence of underpricing.
- Is IPO underpricing influenced by the Operating Cash Flow? OCF was the variable that generated the weakest test results. What was most staggering was that this key figure, revealing if the issuing firm’s core operations were generating cash flow, was of such a low importance for the investors. Consequently, we conclude that the firm’s financial fundamentals are of minor importance for investors who rather value an IPO based on expectations about the future.

54
6.1 Discussion
The IPOs on the Swedish market have experienced a decrease in the degree of underpricing in later years. We believe this trend to be partly explained by the more dynamic pricing strategy, book building, more frequently used by the investment banks and the issuing firms in the later part of our sample period. One can also debate that the decrease in the degree of underpricing in late years is due to the lesson learned after the IT-bubble in 1999. Investors might still be affected by the hit they took and due to that, are resistant to invest in IPOs. The average investment strategy might now emphasize more on safe investment alternatives.
We could however see that the majority of the IPOs are still underpriced with a mean initial return of 14,33% throughout this sample. Even though the results from this study were not as significant as we predicted them to be, we think it is necessary to elaborate around them further.
We found price to be the variable influencing the underpricing most. This was in line with our expectations that many of the investors are irrational, and it is clear that there is a certain trading range which attract the investors most. Price should only be of the investors’ concern when it is compared with the issuing firm’s earnings, i.e. P/E ratio.
In the previous chapter we stated that the Signaling Theory and the Entrenchment Hypothesis was not supported by our findings. We believe the reason for these theories to not be applicable is due to the subjective view of the IPO from the entrepreneur. This subjectivism is according to Ritter (2003) reflected in an overconfidence in their own performance which makes the entrepreneur sell off as little as possible. We think this overconfidence holds for many new start-ups who are afraid of the dilution effect, to get less power and influence within their firms due to a dilute ownership. We therefore believe that the retention rate is a too precious factor for the entrepreneur to use in order to raise as much capital as possible in the short term. Hence, the retention rate is hard for investors to use as a signal for a good IPO.
We tested the operating cash flow because we wanted a variable that gave a picture about the operating performance of the issuing firm. Therefore we got surprised when the tests showed no significance. A reasonable explanation to this is that our sample consists of many technology firms. In our opinion there is a higher acceptance for low, or negative, OCF for the technology companies than for firms within, i.e. basic material or production sectors. We believe this is because of the hype many new technology companies possess. The market hype makes investors disregard the weak financial fundamentals and just go with the public opinion. It is therefore difficult to conduct a valuation of a company from their books when the stock price rather seems to be driven by the market’s, many times groundless, hype. Are we in a time where investors are buying users instead of revenue?
One weakness in this study is the limited sample period. During the sample period the stock market has been characterized by high volatility, which has affected the IPOs and the price deviation. A more stable market would have allowed us to make a more certain estimate of the population. The size of the sample is large enough to represent the population in a statistical secured way. One can although question if the inclusion of other Swedish stock exchanges would have had impact on the result.
55
6.2 Suggestions for Future Studies
Throughout the empirical work we have tested how IPO underpricing is influenced by different factors. During this work we have come across several interesting subtopics that we have not emphasised on and that we believe could be subject for future studies. In our analysis and discussion we mention that the technology sector differs from other industry sectors in the sample. This is a topic that we would suggest future studies within. Are technology firms more volatile during the first day of trade than other industry sectors? Technology firms are often young when they enter the public market, is this the reason for the underpricing and can this age effect be peeled off and yield the same result?
Another effect that is not visible in this thesis is the differences in business type among the companies. A family owned business is probably managed in a different way than a large international corporation. This topic would have been interesting to study further under the topic i.e. “Does business type matter when it comes to IPO underpricing?”
As we write in chapter 6.1 Discussion we think the investor should emphasise on the price, only when it is in relation to the companies’ earnings. Hence, it would be of interest to study if IPO underpricing is influenced by the P/E ratio.
This study is a solely quantitative one. We have many times during the completion of this study discussed that it would be of great interest to interview potential investors. A qualitative study with investors would give a deeper understanding of what they think is important when investing in an IPO. This is although together with above suggestions left for future studies.
56
References
Abrahamsson, M., De Ridder, A., & Råsbrant, J. (2011). Information Asymmetries among European Investors: Evidence from Swedish IPOs. Stockholm: Royal Institute of Technology.
Aczel, A. D., & Sounderpandian, J. (2006). Complete Business Statistics (Vol. 6). New York: Mc Graw Hill.
Akerlof, A. G. (1970, August). The Market for 'Lemons': Qualitative Uncertainty and the Market Mechanism. Quarterly Jornal of Economics, 89, 488-500.
Aliaga, M., & Gunderson, B. (2002). Interactive Statistics. Las Vegas: Castle Rock.
Ando, T. (2010). Bayesian Model Selection and Statistical Modeling. Kanagawa, Japan: Chapman & Hall/CRC.
Angel, J. (1997, June). Tick Size, Share Prices, and Stock Splits. Journal of Finance, 52(2), 655-681.
Arkebauer, J. B., & Schultz, R. (1998). Going Public - Everything You Need to Know to Take Your Company Public. Chicago: Dearborn.
Bank, M., Larch, M., & Peter, G. (2010). Investors' Compensation for Illiquidity - Evidence from the German Stock Market. Banking and Finance. Innsbruck: University of Innsbruck.
Baron, D. (1982, September). A Model of the Demand for Investment Banking Advising and Distribution Services for New Issues. Journal of Finance, 37(4), 955-976.
Bebchuk, L. (1999). A Rent-Protection Theory of Corporate Ownership and Control. Cambridge: Harvard Law School; National Bureau of Economic Research (NBER); European Corporate Governance Institute (ECGI).
Berenson, M. L., Krehbiel, T. C., & Levine, D. M. (2010). Business Statistics A First Course (Vol. 5). New Jersey: Pearson.
Berk, J., & DeMarzo, P. (2011). Corporate Finance (Vol. 2). Boston: Pearson Education.
Bettner, M. S., Carcello, J. V., Haka, S. F., & Williams, J. R. (2008). Financial & Manegerial Accounting. New York: McGraw-Hill.
Bikhchandani, S., Hirshleifer, D., & Welch, I. (1992). A Theory of Fads, Fashion, Custom, and Cultural Change as Informational Cascades. Journal of Political Economy, 100(5), 992-1026.
Bugler, J. (2012). Quantitative Methods for Business and Management. Harlow: Pearson Education Limited.
Byun, J., & Rozeff, M. (2003, May). Long-run Performance after Stock Splits: 1927 to 1996. The Journal of Finance, 58(3), 1063-1086.
Carter, R. B., & Manaster, S. (1990). Initial public offerings and under-writer reputation. The Journal of Finance(45), 1045-1067.
57
Chen, H.-C., & Ritter, J. R. (2000, June). The Seven Percent Solution. Journal of Finance(55), 1105-1132.
Chern, K.-Y., Tandon, K., Yu, S., & Webb, G. (2008, June). The information content of stock split announcements: Do options matter? Journal of Banking & Finance, 32(6), 930-946.
CNET News. (2011, May 19). LinkedIn soars in first day of trading. Retrieved Feb 09, 2012, from CNET News: http://news.cnet.com/8301-13506_3-20064312-17.html
D'Agostino, R., Fröderberg, V., & Hellgren, P. (2007). Processen vid nyintroduktioner och emissioner. Stockholm: Finansinspektionen.
Davidsson, B., & Patel, R. (2011). Forskningsmetodikens grunder: Att planera, genomföra och rapportera en undersökning (Vol. 4). Lund: Studentlitteratur.
De Ridder, A., Kågerman, P., & Lohmander, C. (2008). Etik, regler och värdering på kapitalmarknaden. Stockholm: Norstedts juridik.
Ekonomifakta. (2012, 03 15). Börsutveckling i Sverige och USA. Retrieved 13 15, 2012, from Ekonomifakta: http://www.ekonomifakta.se/sv/Fakta/Ekonomi/Finansiell-utveckling/Borsutveckling-i-Sverige-och-USA/
Espinasse, P. (2011). IPO - A Global guide (Vol. 1). Hong Kong: Hong Kong University Press.
Fama, E. F. (1970, May). Efficient Capital Markets: A review of theory and empirical work. Journal of Finance, 25(2), 383-417.
Fama, E. F., & Jensen, M. C. (1983). Separation of Ownership and Control. Journal of Law and Economics, 26(2), 301-325.
Fan, Q. (2006). Earnings Management and Ownership Retention for Initial Public Offering Firms: Theory and Evidence. University of California, Berkeley. California: University of California, Berkeley.
Grundvall, B., Melin Jakobsson, A., & Thorell, P. (2004). Vägvisare till börsen. Malmö: Liber Ekonomi.
Guo, R., Lev, B., & Zhou, N. (2005). The Valuation of Biotech IPOs. Journal of Accounting, Auditing and Financ, 20(4), 423-459.
Hermalin, B., & Weisbach, M. (1988). The Determinants of Board Composition. The RAND Journal of Economics, 19(4), 589-606.
Ibbotson, R. G., & Jaffe, J. F. (1975, September). "Hot Issue" Markets. The Journal Of Finance, 1027-1042.
Johansson Lindfors, M.-B. (1993). Att utveckla kunskap : om metodologiska och andra vägval vid samhällsvetenskaplig kunskapsbildning. Lund: Studentlitteratur.
Jordan, B., Ross, S., & Westerfield, R. (2004). Essentials of Corporate Finance (Vol. 4). New York: McGraw-Hill Companies.
58
Kahneman, D., & Tversky, A. (1979, March). Prospect Theory: An Analysis of Decision Under Risk. Econometrica, 47(2), 263-292.
Karlis, P. L. (2000). IPO Underpricing. The Park Place Economist, 8, 81-89.
Konjunkturinstitutet. (2010, June). http://www.konj.se/statistik. Retrieved April 17, 2012, from Konjunkturinstitutet: http://www.konj.se/download/18.51e628ae12a5d9c60e180003053/Juni2010_Smf.pdf
Krigman, L., Shaw, W. H., & Womack, K. L. (2001, May). Why do firms switch underwriters? Journal of Financial Economics, 60(2-3), 245-284.
Leland, H. E., & Pyle, D. H. (1977, May). Informational Asymmetries, Financial Structure, and Financial Intermediation. Journal of Finance, 32(2), 371-387.
Levis, M. (1990, Mars). The Winner's Curse Problem, Interest Costs and the Underpricing of Initial Public Offerings. The Economic Journal, 100(399), 76-89.
Lewis, P., Saunders, M., & Thornhill, A. (2009). Research methods for business students (Vol. 5). Essex: Pearson Education Limited.
Ljungqvist, A., & William, W. J. (2003, April). IPO Pricing in the Dot-com Bubble. The Journal Of Finance, 58(2), 723-752.
Loughran, T., & Ritter, J. (2004). Why Has IPO Underpricing Changed Over Time? Financial Management, 5-37.
Loughran, T., & Ritter, J. R. (2002). Why Don't Issuers Get Upset About Leaving Money on the Table in IPOs? The Review Of Financial Studies.
MacKinlay, C. A. (1997, March). Event Studies in Economics and Finance. Journal of Economic Literature, 35, 13-39.
Malhotra, M. K., & Grover, V. (1998). An Assessment of Survey Research in POM:from constructs to theory. Journal of Operations Management, 16(4), 407-425.
Melancon, M. V., Mingsheng, M., & Zheng, S. X. (2005). Underpricing, share retention, and the IPO aftermarket liquidity. Monroe: University of Louisiana at Monroe.
Modigliani, F., & Miller, M. (1958, June). The Cost of Capital, Corporation Finance, and the Theory of Investment. American Economic Review, 48, 261-297.
NASDAQ OMX Nordic. (2012, 03 16). Om NASDAQ OMX Nordic Stockholm. Retrieved 03 16, 2012, from NASDAQ OMX Nordic Stockholm: http://www.nasdaqomxnordic.com/omoss/
Olsen, R. (1998). Behavioral Finance and Its Implications for Stock-Price Volatility. Financial Analysts Journal , 54(2), 10-18.
Ramsey, B. C. (2009). Dealing with Outliers and Offsets in Radiocarbon Dating. Radiocarbon, 51(3), 1023-1045.
59
Reuters. (2011, May 19). LinkedIn share price more than doubles in NYSE debut. Retrieved Feb 08, 2012, from Reuters.com: http://www.reuters.com/article/2011/05/19/us-linkedin-ipo-risks-idUSTRE74H0TL20110519
Ritter, J. R. (1984, April). The "Hot Issue" Market of 1980. The Journal Of Business, 215-240.
Ritter, J. R. (1998). Initial Public Offerings. Warren Gorham & Lamont Handbook of Modern Finance, 2(1), 5-30.
Ritter, J. R. (2003). Behavioral Finance. Gainesville: University of Florida.
Ritter, J. R. (2003). Investment banking and securities issuance. In G. Constantinides, Handbook of the Economics of Finance (pp. 255-306). Amsterdam: Elsevier Science.
Ritter, J. R. (2011, Dec 31). Initial Public Offerings: Underpricing Statistics Through 2011. Retrieved Feb 20, 2012, from IPO Data: http://bear.warrington.ufl.edu/ritter/
Ritter, J. R., & Welch, I. (2002). A Review of IPO Activity, Pricing, and Allocations. Yale ICF Working Paper(02-01).
Rock, K. (1986). Why new issues are underpriced. Journal of Financial Economics, 187-212.
Sewell, M. (2007). Behavioural Finance. Department of Computer Science. London: University Collage London.
Spence, M. A. (1973, August). Job Market Signaling. Quarterly Journal of Economics, 87(3), 355-374.
Thaler, R. (1988). Anomalies: The Winner's Curse. The Journal of Economic Perspectives, 2(1), 191-202.
Tracy, J. A. (2004). How to Read a Financial Report: Wringing Vital Signs Out of the Numbers. New Jersey: John Wiley & Sons.

60
Appendix A – Final sample R
ete
nti
on
78,8
0%
42,9
0%
78,3
0%
61,3
0%
62,8
0%
40,7
0%
50,3
0%
76,9
0%
65,2
0%
69,0
0%
87,6
0%
50,0
0%
69,0
0%
52,0
0%
82,0
0%
OC
F
52 7
77 0
00 k
r
-8 2
78 0
00 k
r
-84 8
00 0
00 k
r
1 9
98 7
00 0
00 k
r
11 9
00 0
00 k
r
18 5
06 0
00 k
r
45 9
50 0
00 k
r
-27 9
95 0
00 k
r
48 5
00 0
00 k
r
63 0
00 0
00 k
r
-26 4
00 0
00 k
r
-506 5
00 0
00 k
r
-5 3
15 0
00 k
r
Pri
ce d
evi
ati
on
1,6
4%
63,6
4%
0,6
3%
12,0
0%
14,3
9%
7,6
9%
21,4
3%
-11,6
3%
26,6
7%
15,7
9%
4,7
6%
-50,0
0%
-0,7
8%
20,0
0%
11,5
0%
23,0
8%
Off
er
Pri
ce
61,0
0 k
r
66,0
0 k
r
160,0
0 k
r
25,0
0 k
r
66,0
0 k
r
91,0
0 k
r
70,0
0 k
r
43,0
0 k
r
45,0
0 k
r
47,5
0 k
r
63,0
0 k
r
20,0
0 k
r
64,0
0 k
r
60,0
0 k
r
100,0
0 k
r
39,0
0 k
r
Year
1997
1997
1999
2007
1998
2002
1997
1998
1997
2000
2000
1998
2002
1997
2006
1999
Ind
ust
ry
Co
mm
erci
al &
Pro
fess
ion
al S
ervic
es
IT
IT
Hea
lth
Car
e
Fin
ance
Ind
ust
rial
s
IT
IT
Hea
lth
Car
e
IT
IT
IT
Co
nsu
mer
Dis
cret
ion
ary
Ind
ust
rial
s
Hea
lth
Car
e
Co
mm
erci
al &
Pro
fess
ion
al S
ervic
es
Co
mp
an
y
AB
Fag
erh
ult
AD
B-G
rup
pen
Man
dat
or
AB
Ad
era
AB
Aer
ocr
ine
AB
Aff
ärss
trat
eger
na
i Sver
ige
AB
Alf
a L
aval
AB
Alf
asko
p A
B
All
Car
ds
Ser
vic
e C
ente
r -
AC
SC
AB
Art
imp
lan
t D
evel
op
men
t A
rtD
ev A
B
AU
-Sys
tem
AB
Aud
ioD
ev A
B
Auto
fill
AB
Bal
lings
löv A
B
Bio
ra A
B
Bio
vit
rum
AB
BO
SS M
ED
IA A
B

61
80,0
0%
66,5
0%
57,3
0%
82,4
0%
40,0
0%
62,3
0%
73,7
0%
76,0
0%
80,0
0%
87,0
0%
81,5
0%
62,3
0%
55,6
0%
97,0
0%
0,0
0%
49,9
0%
12 0
00 0
00 k
r
11 4
00 0
00 k
r
162 5
00 0
00 k
r
-1 6
58 0
00 0
00 k
r
14 4
23 0
00 k
r
62 9
59 0
00 k
r
47 1
45 0
00 k
r
-2 8
00 0
00 k
r
27 6
00 0
00 k
r
15 9
00 0
00 k
r
51 2
00 0
00 k
r
544 0
00 0
00 k
r
-8,5
7%
3,5
1%
5,4
3%
15,6
5%
9,8
0%
5,1
5%
20,7
5%
105,8
8%
14,0
0%
243,5
5%
12,1
2%
8,8
2%
9,0
2%
-7,7
4%
1,5
0%
0,0
0%
35,0
0 k
r
57,0
0 k
r
46,0
0 k
r
115,0
0 k
r
51,0
0 k
r
68,0
0 k
r
106,0
0 k
r
68,0
0 k
r
50,0
0 k
r
62,0
0 k
r
33,0
0 k
r
68,0
0 k
r
61,0
0 k
r
31,0
0 k
r
100,0
0 k
r
84,0
0 k
r
1998
2001
2010
2001
1997
1998
1999
1999
1999
1999
2008
1999
2001
2006
2007
2000
Ind
ust
rial
s
Co
mm
erci
al &
Pro
fess
ion
al S
ervic
es
Co
nsu
mer
Dis
cret
ion
ary
Fin
ance
Fin
ance
Co
mm
erci
al &
Pro
fess
ion
al S
ervic
es
Co
nsu
mer
Dis
cret
ion
ary
IT
IT
IT
IT
IT
IT
Fin
ance
Fin
ance
Co
mm
erci
al &
Pro
fess
ion
al S
ervic
es
Bro
strö
m V
an O
mm
eren
Sh
ipp
ing
AB
BT
S G
roup
AB
Byg
gmax
Gro
up
AB
Car
neg
ie &
Co
AB
D
Cas
tellu
m A
B
Cit
yMai
l Sw
eden
AB
Cla
s O
hls
on
AB
Co
nn
ecta
AB
CT
T S
yste
ms
AB
Cyb
er C
om
Co
nsu
ltin
g G
roup
Sca
nd
inav
ia A
B
DG
C O
ne
AB
Dig
ital
Vis
ion
Sw
eden
Dim
ensi
on
AB
Diö
s F
asti
ghet
er A
B
Eas
t C
apit
al E
xplo
rer
AB
En
iro
AB

62
79,0
0%
74,5
0%
46,0
0%
71,6
0%
39,5
0%
82,5
0%
87,5
0%
92,7
0%
50,0
0%
45,0
0%
94,2
0%
64,2
0%
72,7
0%
61,1
0%
75,5
0%
40,0
0%
35 9
45 0
00 k
r
19 2
02 0
00 k
r
71 0
00 0
00 k
r
6 3
44 0
00 k
r
-10 2
51 0
00 k
r
-70 7
91 0
00 k
r
-324 0
00 0
00 k
r
2 4
00 0
00 k
r
267 0
00 0
00 k
r
252 1
00 0
00 k
r
-464 0
00 k
r
-133 8
23 0
00 k
r
-7 9
41 0
00 k
r
-32 6
00 0
00 k
r
3 0
00 0
00 k
r
14 3
95 0
00 k
r
-0,9
5%
6,5
3%
0,0
0%
8,0
6%
39,0
1%
46,2
9%
0,0
0%
5,8
4%
-6,1
3%
12,6
9%
-3,5
6%
0,0
0%
-10,0
0%
15,3
8%
2,1
5%
45,6
5%
2,0
4%
105,0
0 k
r
35,2
0 k
r
49,0
0 k
r
62,0
0 k
r
141,0
0 k
r
87,5
0 k
r
12,0
0 k
r
77,0
0 k
r
106,0
0 k
r
65,0
0 k
r
94,0
0 k
r
40,0
0 k
r
70,0
0 k
r
26,0
0 k
r
93,0
0 k
r
92,0
0 k
r
98,0
0 k
r
1999
1997
2011
1999
2006
1998
1997
2005
1999
2005
1997
1999
2000
1998
1997
1998
1998
IT
Ind
ust
rial
s
Ind
ust
rial
s
IT
Co
nsu
mer
Dis
cret
ion
ary
IT
Co
nsu
mer
Dis
cret
ion
ary
Co
nsu
mer
Dis
cret
ion
ary
IT
Tra
din
g C
om
pan
ies
& D
istr
ibu
tors
IT
IT
Co
mm
erci
al &
Pro
fess
ion
al S
ervic
es
Ind
ust
rial
s
Ind
ust
rial
s
Hea
lth
Car
e
Ind
ust
rial
s
En
ligh
t In
tera
ctiv
e A
B
FB
In
dust
ri H
old
ing
AB
Fin
nved
en B
ult
en A
B
Fra
ngo
AB
Gan
t C
om
pan
y A
B
Guid
e K
on
sult
AB
Gyl
ling
Op
tim
a B
atte
ries
AB
Hak
on
In
ves
t A
B
HiQ
In
tern
atio
nal
AB
Ind
utr
ade
AB
Jaak
ko
Pö
yry
Gro
up
Oyj
Jeev
es I
nfo
rmat
ion
Sys
tem
s A
B
Job
lin
e In
tern
atio
nal
AB
Joh
nso
n P
um
p I
nte
rnat
ion
al A
B
Kar
lsh
amn
s A
B
Kar
o B
io A
B
Kar
olin
Mac
hin
e T
oo
l A
B

63
69,0
0%
33,9
0%
89,0
0%
57,2
0%
59,8
0%
83,3
0%
72,0
0%
64,0
0%
61,8
0%
76,9
0%
57,1
4%
9,2
0%
37,9
0%
29,7
0%
80,3
0%
73,8
0%
78,3
0%
103 9
19 0
00 k
r
-17 7
68 0
00 k
r
9 1
93 0
00 k
r
52 1
55 0
00 k
r
-4 0
33 3
34 k
r
-22 0
94 0
00 k
r
-25 2
58 0
00 k
r
122 0
00 0
00 k
r
-5 4
59 9
52 k
r
130 7
45 0
00 k
r
5 3
52 0
00 k
r
61 0
75 0
00 k
r
-1 7
17 0
00 k
r
-3 3
84 0
00 k
r
20 5
99 4
48 k
r
0,0
0%
-0,7
1%
16,4
2%
4,8
8%
2,7
3%
95,7
1%
-1,8
4%
-1,0
3%
-0,6
2%
1,5
9%
41,8
6%
14,6
1%
0,0
0%
9,7
7%
-10,0
0%
2,1
4%
8,7
0%
66,0
0 k
r
70,0
0 k
r
33,5
0 k
r
41,0
0 k
r
110,0
0 k
r
105,0
0 k
r
38,0
0 k
r
29,0
0 k
r
32,0
0 k
r
63,0
0 k
r
21,5
0 k
r
69,8
0 k
r
46,0
0 k
r
87,0
0 k
r
20,0
0 k
r
70,0
0 k
r
115,0
0 k
r
1999
2006
1999
1999
2000
2000
2000
2011
2010
1997
1999
1997
1999
2007
2000
1997
1998
Fin
ance
Fin
ance
IT
Co
nsu
mer
Dis
cret
ion
ary
Co
nsu
mer
Dis
cret
ion
ary
IT
IT
Hea
lth
Car
e
Co
nsu
mer
Dis
cret
ion
ary
Co
mm
erci
al &
Pro
fess
ion
al S
ervic
es
IT
Ind
ust
rial
s
Co
nsu
mer
Dis
cret
ion
ary
Ind
ust
rial
s
IT
Ind
ust
rial
s
Ind
ust
rial
s
Kun
gsle
den
AB
Lin
kM
ed A
B
M2S S
ver
ige
AB
Mal
mb
ergs
Ele
ktr
iska
AB
Mek
on
om
en A
B
Mic
ron
ic L
aser
Sys
tem
s A
B
Min
d A
B
Mo
ber
g D
erm
a A
B
MQ
Ho
ldin
g A
B
MT
V P
rod
ukti
on
AB
Mult
iQ I
nte
rnat
ion
al A
B
Mun
ters
AB
Nat
urk
om
pan
iet
AB
Ned
erm
an H
old
ing
AB
Neo
Net
AB
NIB
E I
nd
ust
rier
AB
Nilö
rngr
up
pen
AB

64
78,2
0%
75,0
5%
78,7
0%
36,0
0%
59,7
0%
70,2
0%
20,0
0%
30,0
0%
72,0
0%
58,7
0%
73,1
0%
64,0
0%
85,2
4%
87,0
0%
43,5
0%
62,4
0%
51,2
0%
3 2
97 0
00 k
r
-12 1
37 0
00 k
r
12 3
31 0
00 k
r
37 6
00 0
00 k
r
411 9
00 0
00 k
r
91 6
73 0
00 k
r
-4 0
15 0
00 k
r
10 3
43 0
00 k
r
93 0
00 0
00 k
r
39 5
00 0
00 k
r
27 6
00 0
00 k
r
-18 7
74 0
00 k
r
139 0
00 0
00 k
r
-2,3
3%
-7,1
0%
-8,0
0%
1,7
9%
20,8
3%
9,7
4%
1,9
2%
1,8
9%
55,3
2%
5,2
1%
31,5
5%
10,0
0%
45,6
5%
24,0
0%
0,0
0%
-22,8
9%
86,6
7%
43,0
0 k
r
18,3
0 k
r
75,0
0 k
r
28,0
0 k
r
120,0
0 k
r
190,0
0 k
r
52,0
0 k
r
53,0
0 k
r
47,0
0 k
r
48,0
0 k
r
84,0
0 k
r
50,0
0 k
r
23,0
0 k
r
25,0
0 k
r
52,0
0 k
r
38,0
0 k
r
45,0
0 k
r
1999
1997
2004
1998
2000
2004
1997
1997
1998
1999
1999
1997
1999
1999
2006
2001
1998
IT
Ind
ust
rial
s
Ind
ust
rial
s
Co
nsu
mer
Dis
cret
ion
ary
IT
Co
nsu
mer
Dis
cret
ion
ary
Fin
ance
Tel
eco
m
IT
IT
Co
mm
erci
al &
Pro
fess
ion
al S
ervic
es
Ind
ust
rial
s
Co
mm
erci
al &
Pro
fess
ion
al S
ervic
es
IT
Co
mm
erci
al &
Pro
fess
ion
al S
ervic
es
Co
nsu
mer
Dis
cret
ion
ary
Ind
ust
rial
s
NO
CO
M A
B
No
rth
Atl
anti
c N
atura
l R
eso
urc
es A
B
NO
TE
AB
Op
con
AB
OR
C S
oft
war
e A
B
Ori
flam
e C
osm
etic
s S.A
.
Pan
do
x H
ote
llfas
tigh
eter
AB
Par
tner
Tec
h A
B
Pre
vas
AB
Pro
Act
IT
Gro
up
AB
Pro
ffic
e A
B
Pro
filG
rup
pen
AB
Pro
nyx
AB
Rea
dSo
ft A
B
Rez
ido
r H
ote
l G
roup
AB
rnb
Ret
ail an
d B
ran
ds
AB
SA
AB
AB

65
50,0
0%
82,4
0%
88,6
0%
25,0
0%
74,5
0%
92,5
0%
50,0
0%
25,0
0%
69,7
0%
80,0
0%
79,1
0%
73,0
0%
46,4
0%
60,0
0%
71,7
0%
84,0
0%
72,0
0%
-52 4
18 0
00 k
r
-50 4
31 0
00 k
r
12 3
00 0
00 k
r
34 0
34 0
00 k
r
10 1
73 0
00 k
r
12 2
19 0
00 k
r
40 5
03 0
00 k
r
89 2
00 0
00 k
r
-41 0
87 0
00 k
r
297 0
00 k
r
10 3
98 0
00 k
r
-25 0
00 0
00 k
r
28 4
13 0
00 k
r
91 2
10 0
00 k
r
40 8
00 0
00 k
r
-11 3
92 9
95 k
r
9 4
00 0
00 k
r
38,7
8%
7,3
9%
20,0
0%
3,1
3%
62,2
6%
34,3
8%
18,9
4%
-6,0
6%
92,0
0%
26,0
0%
4,1
2%
0,0
0%
9,0
9%
0,0
0%
2,8
3%
10,0
0%
17,2
4%
24,5
0 k
r
115,0
0 k
r
35,0
0 k
r
32,0
0 k
r
53,0
0 k
r
64,0
0 k
r
66,0
0 k
r
16,5
0 k
r
200,0
0 k
r
50,0
0 k
r
85,0
0 k
r
26,0
0 k
r
77,0
0 k
r
110,0
0 k
r
53,0
0 k
r
90,0
0 k
r
29,0
0 k
r
1997
2000
1999
1997
1997
1998
1997
1997
1999
1999
2000
1999
1997
2005
2011
2000
2000
Fin
ance
IT
Hea
lth
Car
e
Ind
ust
rial
s
IT
IT
Co
nsu
mer
Dis
cret
ion
ary
Co
mm
erci
al &
Pro
fess
ion
al S
ervic
es
Tel
eco
m
IT
Tel
eco
m
Tel
eco
m
Co
mm
erci
al &
Pro
fess
ion
al S
ervic
es
IT
IT
Hea
lth
Car
e
Tel
eco
m
Sal
us
Ho
ldin
g A
B
Sca
nd
inav
ia O
nlin
e A
B
SE
CT
RA
AB
Sem
con
AB
Sig
ma
AB
So
ftro
nic
AB
Sved
ber
gs i D
alst
orp
AB
Sven
ska
Ori
ent
Lin
ien
AB
Sw
itch
Co
re A
B
Tel
elo
gic
AB
Tel
ia A
B
Tel
igen
t A
B
Tic
ket
Tra
vel
Gro
up
AB
Tra
deD
oub
ler
AB
Tra
nsm
od
e H
old
ing
AB
Tri
pep
AB
Vik
ing
Tel
eco
m A
B

66
Appendix B – Sample, Deleted companies
Company Industry Year
BioGaia Biologics AB Health Care 1998
A-Com AB Commercial & Professional Services 1999
Wedins Norden AB Consumer Discretionary 1997
Appendix C – Industry Sectors
Statistics
Basic Materials N Valid 1
Missing 0
Consumer Goods N Valid 15
Missing 0
Consumer Services N Valid 12
Missing 0
Financials N Valid 9
Missing 0
Health Care N Valid 8
Missing 0
Industrials N Valid 13
Missing 0
Oil & Gas N Valid 2
Missing 0
Technology N Valid 35
Missing 0
Telecom N Valid 5
Missing 0
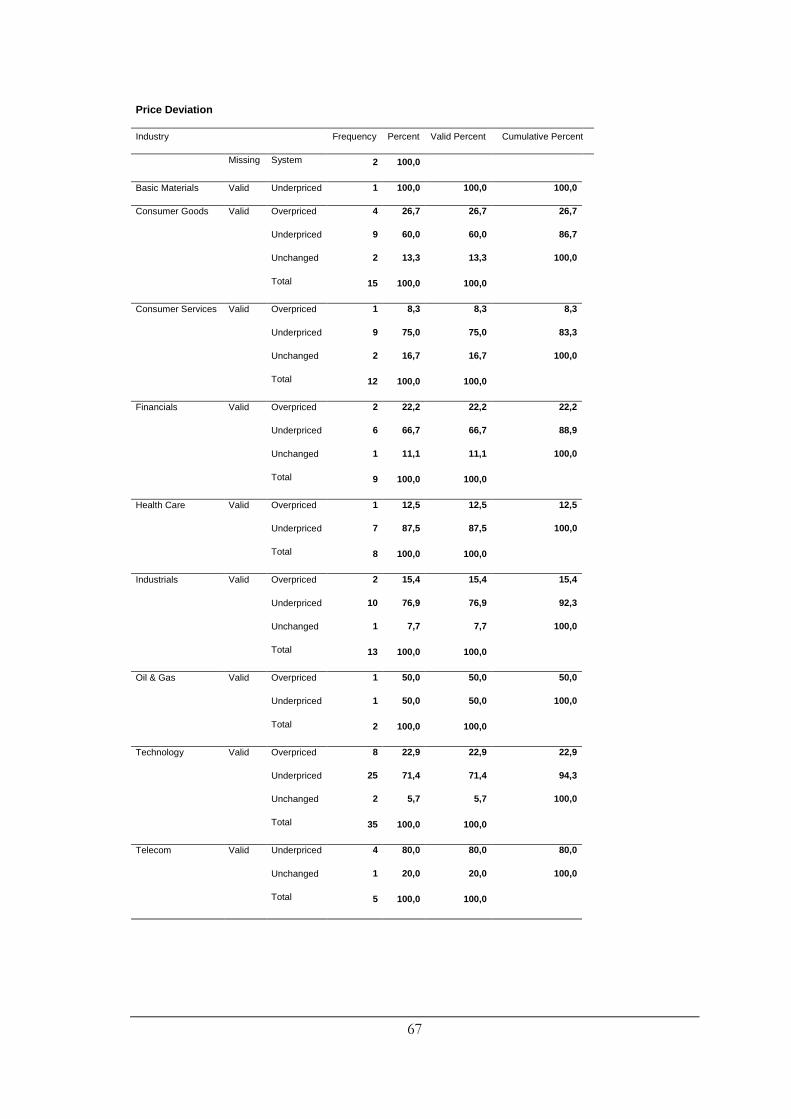
67
Price Deviation
Industry Frequency Percent Valid Percent Cumulative Percent
Missing System 2 100,0
Basic Materials Valid Underpriced 1 100,0 100,0 100,0
Consumer Goods Valid Overpriced 4 26,7 26,7 26,7
Underpriced 9 60,0 60,0 86,7
Unchanged 2 13,3 13,3 100,0
Total 15 100,0 100,0
Consumer Services Valid Overpriced 1 8,3 8,3 8,3
Underpriced 9 75,0 75,0 83,3
Unchanged 2 16,7 16,7 100,0
Total 12 100,0 100,0
Financials Valid Overpriced 2 22,2 22,2 22,2
Underpriced 6 66,7 66,7 88,9
Unchanged 1 11,1 11,1 100,0
Total 9 100,0 100,0
Health Care Valid Overpriced 1 12,5 12,5 12,5
Underpriced 7 87,5 87,5 100,0
Total 8 100,0 100,0
Industrials Valid Overpriced 2 15,4 15,4 15,4
Underpriced 10 76,9 76,9 92,3
Unchanged 1 7,7 7,7 100,0
Total 13 100,0 100,0
Oil & Gas Valid Overpriced 1 50,0 50,0 50,0
Underpriced 1 50,0 50,0 100,0
Total 2 100,0 100,0
Technology Valid Overpriced 8 22,9 22,9 22,9
Underpriced 25 71,4 71,4 94,3
Unchanged 2 5,7 5,7 100,0
Total 35 100,0 100,0
Telecom Valid Underpriced 4 80,0 80,0 80,0
Unchanged 1 20,0 20,0 100,0
Total 5 100,0 100,0

68
Appendix D – Sample, T-test Price Deviation
One-Sample Statistics
N Mean Std. Deviation Std. Error Mean
Price deviation 100 14,3283% 23,97051% 2,39705%
One-Sample Test
Test Value = 0
t df Sig. (2-tailed) Mean Difference
95% Confidence Interval of the Difference
Lower Upper
Price deviation 5,977 99 ,000 14,32830% 9,5720% 19,0846%
Appendix E – Offer Price, Linear Regression
Variables Entered/Removedb
Model Variables Entered
Variables Re-moved Method
1 Offer Pricea . Enter
a. All requested variables entered. b. Dependent Variable: Price deviation
Model Summary
Model R R Square Adjusted R Square
Std. Error of the Estimate
1 ,189a ,036 ,026 23,65935%
a. Predictors: (Constant), Offer Price
ANOVAb
Model Sum of Squares df Mean Square F Sig.
1 Regression 2026,985 1 2026,985 3,621 ,060a
Residual 54856,962 98 559,765
Total 56883,947 99
a. Predictors: (Constant), Offer Price b. Dependent Variable: Price deviation
Coefficientsa
Model
Unstandardized Coefficients Standardized Coef-
ficients
t Sig. B Std. Error Beta
1 (Constant) 6,069 4,943 1,228 ,222
Offer Price ,128 ,067 ,189 1,903 ,060
a. Dependent Variable: Price deviation

69
Appendix F – Offer Price, Chi-Square Test
Case Processing Summary
Cases
Valid Missing Total
N Percent N Percent N Percent
Price Group * Price Deviation 100 100,0% 0 ,0% 100 100,0%
Price Group * Price Deviation Crosstabulation
Count
Price Deviation
Total Overpriced Underpriced Unchanged
Price Group
12-46 SEK 12 18 4 34
47-69 SEK 1 28 3 32
70-200 SEK 6 26 2 34
Total 19 72 9 100
Chi-Square Tests
Value df
Asymp. Sig. (2-sided)
Exact Sig. (2-sided)
Exact Sig. (1-sided) Point Probability
Pearson Chi-Square 12,567a 4 ,014 ,002
Likelihood Ratio 14,035 4 ,007 ,002 Fisher's Exact Test 12,968
1,000
Linear-by-Linear Asso-ciation ,863
b 1 ,353 ,419 ,209 ,060
N of Valid Cases 100 a. 3 cells (33,3%) have Reuten expected count less than 5. The minimum expected count is 2,88. b. The standardized statistic is ,929.

70
Appendix G – Ownership Retention, Linear Regression
Variables Entered/Removedb
Model Variables Entered Variables Removed Method
1 Retentiona . Enter
a. All requested variables entered. b. Dependent Variable: Price deviation
Model Summary
Model R R Square Adjusted R Square Std. Error of the Estimate
1 ,140a ,020 ,009 24,10072%
a. Predictors: (Constant), Retention
ANOVAb Model Sum of Squares df Mean Square F Sig.
1 Regression 1116,306 1 1116,306 1,922 ,169a
Residual 55761,088 96 580,845 Total 56877,394 97
a. Predictors: (Constant), Retention b. Dependent Variable: Price deviation
Coefficientsa
Model
Unstandardized Coefficients Standardized Coef-
ficients
t Sig. B Std. Error Beta
1 (Constant) 3,183 8,409 ,379 ,706
Retention ,174 ,125 ,140 1,386 ,169
a. Dependent Variable: Price deviation

71
Appendix H – Ownership Retention, Chi-Square Test
Case Processing Summary
Cases
Valid Missing Total
N Percent N Percent N Percent
Retention * Price Devi-ation 98 100,0% 0 ,0% 98 100,0%
Retention * Price Deviation Crosstabulation
Count
Price Deviation
Total Over-priced Underpriced Unchanged
Retention 0-33% 1 6 0 7
34-66% 7 27 6 40
67-100% 11 37 3 51
Total 19 70 9 98
Chi-Square Tests
Value df
Asymp. Sig. (2-sided)
Exact Sig. (2-sided)
Exact Sig. (1-sided) Point Probability
Pearson Chi-Square 3,100a 4 ,541 ,264
Likelihood Ratio 3,604 4 ,462 ,159 Fisher's Exact Test 2,378
1,000
Linear-by-Linear Asso-ciation ,641
b 1 ,423 ,446 ,260 ,089
N of Valid Cases 98 a. 4 cells (44,4%) have expected count less than 5. The minimum expected count is ,63. b. The standardized statistic is -,801.

72
Appendix I – OCF, Linear Regression
Variables Entered/Removedb
Model Variables Entered Variables Removed Method
1 Operating Cash Flow . Enter
a. All requested variables entered. b. Dependent Variable: Price deviation
Model Summary
Model R R Square Adjusted R Square
Std. Error of the Es-timate
1 ,051a ,003 -,009 25,07981%
a. Predictors: (Constant), Operating Cash Flow
ANOVAb
Model Sum of Squares df Mean Square F Sig.
1 Regression 140,052 1 140,052 ,223 ,638a
Residual 52835,742 84 628,997
Total 52975,794 85 a. Predictors: (Constant), Operating Cash Flow b. Dependent Variable: Price deviation
Coefficientsa
Model
Unstandardized Coefficients Standardized Coeffi-
cients
t Sig. B Std. Error Beta
1 (Constant) 15,311 2,850 5,372 ,000
Operating Cash Flow ,000 ,000 -,051 -,472 ,638
a. Dependent Variable: Price deviation

73
Appendix J – OCF, Chi-Square Test
Case Processing Summary
Cases
Valid Missing Total
N Percent N Percent N Percent
Operating Cash Flow * Price Deviation 86 86,0% 14 14,0% 100 100,0%
Operating Cash Flow * Price Deviation Crosstabulation
Count
Price Deviation
Total Overpriced Underpriced Unchanged
Operating Cash Flow Negative 7 20 3 30
Positive 9 41 6 56
Total 16 61 9 86
Chi-Square Tests
Value df
Asymp. Sig. (2-sided)
Exact Sig. (2-sided)
Exact Sig. (1-sided) Point Probability
Pearson Chi-Square ,681a 2 ,711 ,532
Likelihood Ratio ,665 2 ,717 ,532 Fisher's Exact Test ,792
1,000
Linear-by-Linear Asso-ciation ,432
b 1 ,511 ,534 ,328 ,135
N of Valid Cases 86 a. 1 cells (16,7%) have expected count less than 5. The minimum expected count is 3,14. b. The standardized statistic is ,658.