irish attitudes to immigration during and after the boom€¦ · irish attitudes to immigration...
TRANSCRIPT

UCD GEARY INSTITUTE
DISCUSSION PAPER SERIES
Irish attitudes to immigration during and after
the boom
Kevin Denny
UCD Geary Institute and School of Economics,
University College Dublin
Cormac Ó Gráda School of Economics,
University College Dublin
Geary WP2013/22
December 2013
UCD Geary Institute Discussion Papers often represent preliminary work and are circulated to encourage
discussion. Citation of such a paper should account for its provisional character. A revised version may be
available directly from the author.
Any opinions expressed here are those of the author(s) and not those of UCD Geary Institute. Research
published in this series may include views on policy, but the institute itself takes no institutional policy
positions.
1
IRISH ATTITUDES TO IMMIGRATION DURING AND AFTER THE BOOM
Kevin Denny1
and
Cormac Ó Gráda2
University College Dublin
1 School of Economics & Geary Institute, University College Dublin, Belfield, Dublin 4, Ireland. Email: [email protected]. 2 School of Economics, University College Dublin, Belfield, Dublin 4, Ireland. Email: [email protected]. Our thanks to David Madden for helpful suggestions.

2
ABSTRACT
Given the huge size, relatively speaking, of the human influx into Ireland over the past
decade or so, the evolution of Irish attitudes to immigration is of more than parochial
interest. In this paper we use the six rounds of the European Social Survey (2002-2012)
in seeking to account for those attitudes and chart their evolution. We also employ
standard Blinder-Oaxaca decompositions in order to identify the relative importance of
shifts in ‘tastes’ and of changes in underlying economic conditions in accounting for
changes before and after the collapse of the Celtic Tiger.
Keywords: public opinion, immigration, xenophobia

3
1. Introduction:
Mass immigration into Ireland is a new phenomenon. As recently as 1991,
residents of Ireland who were born elsewhere numbered 228,725, or six per cent of the
total population, but only 40,341 of those had been born outside the UK or the US. Two
decades later the foreign-born numbered 766,770, or 17 per cent of the total, and three-
fifths of those (or 10.6 per cent of the total) were from outside the UK. The big rise in the
numbers of residents of east European origin— and especially the influx from Poland—
are often highlighted, but between 2002 and 2011 the number of African-born residents
doubled (from 26,515 to 54,419) and that of Asian-born residents almost trebled (from
28,132 to 79,021). Not only was the immigration unprecedented for Ireland; it was also
very big—in relative, not in absolute terms—by present-day European standards (Figure
1). The economic context for the influx was the Celtic Tiger—rapid economic growth
fuelled at first by sound and innovative policies, but in its later stages by property and
credit bubbles. Unwarranted growth was followed, inevitably, by economic collapse in
2008.3
Source: Eurostat
3 Two useful analyses of the economic background are Kinsella and Leddin (2011) and Donovan and Murphy (2013).

4
At first sight the impact of immigration on Irish attitudes is curious and ambivalent.
On the one hand, so far at least, Ireland has been spared the xenophobic brand of politics
currently in the ascendant across much of Europe. On the other hand, successive opinion
polls also point to significant anti-immigrant feeling. A September 2008 poll4 found that
two-thirds of respondents were in favour of more restrictive immigration laws, whereas
only seven per cent favoured less restrictive laws.5 Another poll just over a year later6
reported a big majority (72 per cent) wanting to see a reduction in the number of
immigrants. Over two-fifths declared that they would like to see some, but not all,
immigrants leave, while 29 per cent would like to see most leave, and just over one in
four was happy to leave the number as it was.
Further insight into attitudes to immigration may be gained from the Irish
National Election Study [INES], a panel survey carried out by the ESRI between 2002 and
2007. The main focus of INES was voting behavior in two general elections, but it
included some questions that bear on immigration. Three of the relevant variables
required responses on a scale of 1 (strongly disagree) to 7 (strongly agree) to specific
statements about Irish travellers7 and immigrants. The first stipulated that people
should not have to put up with halting sites in their area; the second that there should be
strict limits on immigration; and the third that immigrants should adapt to Irish customs.
The other two refer to age and educational level attained. Table 1 describes the raw
correlations between these five variables. The high correlations between the first three
variables show that hostility to immigrants was strongly correlated with hostility to
travellers, implying that apart from any economic threat they presented, immigrants
were perceived by some as undesirables as ‘others’ or ‘different’. Age was not a good
predictor of attitudes, but the level of education was. More educated people tended to be
more tolerant of difference but perhaps this was because they did not live cheek by jowl
with either travellers or immigrants.
4 Conducted by Amárach Research.
5 This provoked the Irish Examiner (10 September 2008) to editorialize, that ‘our attitude towards immigrants maybe about to face a sterner test than before. Let us hope we pass it.’
6 Irish Times, November 11 2009.
7 Irish travellers are distinct group within Ireland, traditionally itinerant and with their own set of traditions and customs.

5
Table 1. Irish Attitudes to Immigration in the 2000s
AntiTrav YOB EducLvl ProRights Limits
AntiTrav 1.000
YOB -0.064 1.000
EducLvl -0.179 0.406 1.000
ProRights -0.140 -0.037 0.129 1.000
Limits 0.270 -0.064 -0.235 -0.343 1.000
Source: INES N=3,844 KEY to variables used:
Limits: Strict limits on number of immigrants
AntiTrav: Anti-traveler halting sites
ProRights: Pro rights for asylum seekers
YOB: Year of birth
EducLvl: Educational level
Since 2003 Eurobarometer pollsters have asked citizens the question: What do
you think are the two most important issues facing (country X) at the moment?
Respondents were asked to choose two of fourteen possible answers (unemployment, the
economy, terrorism, crime, housing, healthcare, immigration, inflation, pensions,
taxation, education, the environment, public transport, other).8 If we focus on the
importance of three factors—immigration, unemployment, and the state of the
economy—before the collapse of the Celtic Tiger in Ireland none of these issues mattered
very much, but in recent years people have begun to worry a lot about unemployment
and the economy. However, the proportion of people listing immigration as one their top
two concerns has remained small. In Ireland immigration featured among the top two
concerns only in a small minority of cases, less than almost anywhere else. Thus while
other evidence shows that the Irish are unhappy with the recent and current high levels
of immigration, this Eurobarometer poll suggests that it is not their main preoccupation.
Nor, if this poll is any guide, has the economic downturn had a huge impact on attitudes,
so far anyway.
According to Eurobarometer 66 [2006], 56 per cent of Irish people still believed in
8 For the most recent data see http://ec.europa.eu/public_opinion/archives/eb/eb78/eb78_anx_en.pdf.
6
2006 that ‘immigrants contribute a lot’ to the country. This represented a much more
positive view of immigration than the European average (40 per cent). In that poll
Swedes were most pro-immigration (79 per cent), followed by the Portuguese (66 per
cent), and then the Irish. Most hostile were Estonians, Latvians, and Slovaks. A very
recent (June 2012) Eurobarometer survey asked for an opinion on the statement
‘Immigration enriches (our country) economically and culturally’. A majority of Irish
respondents still expressed a positive opinion (Table 2) but they were further down the
pro-European pecking order than in 2006.
In this paper, we invoke the European Social Survey (ESS), which has already
been widely used for insights into popular attitudes to immigration (e.g. Card, Dustmann,
and Preston 2005, 2012; O’Rourke and Sinnott 2006; Meuleman, Davidov, and Billiet
2009)9. We compare the Irish response to immigration in the six ESS rounds so far (2002
to 2012). The period coincides with the big rise in Irish immigration and also with the
last years of the Celtic Tiger (2002-2007) and its demise.
2. Data and methods
The European Social Survey (ESS) is a population-representative academically driven
cross-national survey that has been conducted every two years across Europe since 2002.
Over thirty countries currently participate in it. Typically data collection occurred over a
period of about eight months spanning two calendar years. The analysis here looks at
wave 1 (2002/03), wave 3 (2006/07) and wave 6 (2012/13). For convenience we refer
to the data by the first year of each pair.
The ESS contains six questions about immigrants, three about how many
immigrants should be allowed in (depending on race, country of origin etc.) and three
more general questions about whether the respondents thought immigration were good
for the country in different domains10. Using principal component analysis, we use these
six questions to generate ATTIM, a synthetic measure of whether people were for or
against immigrants and immigration generally11. This ignores variation between
questions, of course, but the idea is that there is some underlying latent variable driving
the answers to these questions. Normalized to μ = 0 and σ2 = 1 over the three waves,
ATTIM can be used to analyze the trend in Irish attitudes to immigrants and what sort of
9 For more on the ESS see: http://www.europeansocialsurvey.org/ . Compare Mayda 2006, 2010; Facchini and Mayda 2009; Callens, Valentova, and Meuleman 2012; Malchow-Møller et al. 2008; Sides and Citrin 2007. 10 The appendix has details of the six questions. 11 Specifically, we extract the first principal component of the six questions treating them as continuous. This accounts for 65 per cent of the variation. The factor loadings all have the expected sign.
7
people are more or less sympathetic to immigrants. We also generate a second variable, Z
(for xenophobia), which is an attempt to capture particular hostility reserved for
immigrants who differ ethnically/racially from the host population. Respondents were
about asked their attitude to immigrants from the same race/ethnic country as the
majority in the country. They were asked the same question about immigration from
different race/ethnic groups than the majority. The possible responses to both questions
were “Allow many to come and live here”, “Allow some”, “Allow a few” and “Allow none”.
We code Z=1 if respondents want to allow fewer from the non-majority race/ethnic
group than from the majority and Z=0 otherwise. In the Irish context, which is our sole
focus here, Z may be interpreted as a measure of a respondent’s preference for returning
Irish immigrants and for immigrants from the United Kingdom and the United States over
immigrants from elsewhere. In the case of other economies, where return migration is
unimportant, it might indicate instead a preference for Caucasian over black or Muslim
immigrants—or, in the case of Israel, for Jewish over all other immigrants.
In addition to OLS models of the predictors of these attitudinal variables for three
of the waves we calculate Blinder-Oaxaca decompositions between the first pair (2002 &
2006) and the second pair (2006 & 2012)12. This decomposes the changes in the mean
into the sum of three components. The first is that due to the changes in the explanatory
variables. In models of earnings gaps this is referred to as the “endowment effect”. The
second component is due to changes in the parameters. In models of earnings gaps this is
sometimes interpreted as discrimination although other interpretations are possible. The
final component is simply an interaction between the first two. In this application the
regression coefficients measure how a particular covariate translates into a particular
attitude so changes in the coefficients correspond to changes in “tastes”. The
decomposition is invariant to the normalization of the dependent variable although the
regression coefficients are not.
3. Results
Before considering an econometric analysis of the data it is useful to view the broad
trends in the data. Figure 2 describes the shifts in ATTIM and Z between 2002 (Round 1)
and 2012 (Round 6). Between 2002 and 2006, as immigration rose rapidly, ATTIM rose
in tandem i.e. Irish people became better disposed towards immigrants. The sharp fall in
the wake of economic collapse—Irish GDP fell by 13 per cent between 2007 and 2010
and the unemployment rate rose from 4.8 to 13.9 per cent—is perhaps not so surprising,
12 See Firpo, Fortin, and Lemieux (2011) for a detailed discussion of this and other decomposition methods.

8
but the reversal to 2012 is. The value of Z has gradually fallen over the period: i.e.,
xenophobia, as defined here, has declined, albeit at a declining rate towards of the period.
For example, at the start of the period, over 25 per cent of Irish people were more averse
to immigrants who were not Irish than immigrants who were Irish but this had fallen to
15 per cent by 2012/13.
The values of ATTIM and Z are calculated over the entire sample, which means
that they include the foreign born who might be expected to think differently. However
removing the latter (ATTIMIR and ZIR respectively) does not change the overall trends
although the gap between the Irish born and the entire population widens over time in
Figure 2a, suggesting a growing polarization of attitudes between natives and immigrants
over time. This pattern does not apply to our measure of xenophobia, Z, however.
Source: ESS (see text)
3.1 Explaining the levels of anti-immigrant feeling
This poses the question: why have attitudes in Ireland changed? Table 2
describes the results of regressing ATTIM on a number of potentially relevant variables
included in the ESS dataset. It focuses on 2002 (just as mass immigration was beginning),
in 2006 (just before the bubble burst), and 2012 (when the Irish economy was still in
deep crisis). The first four explanatory variables refer to gender (Female=1), age,
whether foreign born (Foreign=1), and years of education (Eduyrs). The next three refer
to perceived state of the economy (Stfeco), feeling about household income (Hincfel), and
attitude to gay and lesbian rights (Freehms)13. These three variables are all categorical.
For reasons of parsimony, they are treated here as continuous. The broad picture is the
same if we create sets of dummy variables instead. High values of Stfeco (which ranges
from 1 to 10) mean an individual is satisfied with the state of the economy. High values of
13 Denny (2011) analyses the effect of education on this variable.
9
Hincfel mean an individual is finding it difficult to cope given their household income (the
four categories are, in order, “living comfortably”, “coping”, “difficult” and “very
difficult”). Freehms specifically asks whether “Gays and lesbians should be free to live life
as they wish” with five possible answers “Agree strongly”, “Agree”, “Neither agree nor
disagree”, “Disagree” and “Disagree strongly”. Freehms is included as a measure of a
broader non-economic hostility against ‘others’ so high values correspond to greater
aversion to “others”. While these three variables are subject to the critique that they are
not entirely ‘objective’ (Bertrand and Mullainathan 2001), they are nevertheless useful
descriptors. Finally the Bigcity dummy variable corresponds to Dublin, and Town to
smaller cities and towns, with villages and the countryside as the omitted category.
Some consistent patterns emerge. Women and rural dwellers are more hostile to
immigration (particularly in the latter two waves); the educated and the foreign-born
less so. One can think of two distinct effects of education. The first is that education
generally makes people more liberal or tolerant of others (Denny 2011). The second is
that it proxies people’s place in the labour market: higher educated people are less likely
to be competing with, or living next to, low skilled immigrants and more likely to be
consuming their services (O’Rourke and Sinnott 2006). It seems plausible that the first
effect is relatively invariant to macroeconomic conditions, while the latter is not.
Specifically, one might expect manual workers, who have borne the brunt of the
recession, to grow less sympathetic to immigrants as unemployment rises. We find no
evidence of this. The coefficient on Foreign suggests that the difference in attitudes
between Irish and foreign-born residents towards immigration has grown steadily over
the period (as also implied by Figure 2a).
The negative coefficient on Hincfel means that individuals finding it difficult to
cope financially are less sympathetic to immigration, as one would expect. Similarly
people who are more dissatisfied with the state of the economy are likewise less
sympathetic to immigration14. Both of these economic determinants had larger effects at
the end of the period than at the beginning. This change could be due to changing
macroeconomic circumstances but it may also reflect a higher presence of immigrants at
the end of the period.15 Those who held liberal views on gay and lesbian rights were
more pro-immigrant throughout. This correlation is not interpreted causally.
Nonetheless it is very useful to know that people’s attitudes lie along, to some extent, on
broadly liberal/conservative lines.
14 It is possible that people’s attitudes to the economy in general and their views of their own circumstances are related as indeed the correlation between the two (-0.33) would suggest.
15 Compare Ó Gráda (2013).
10
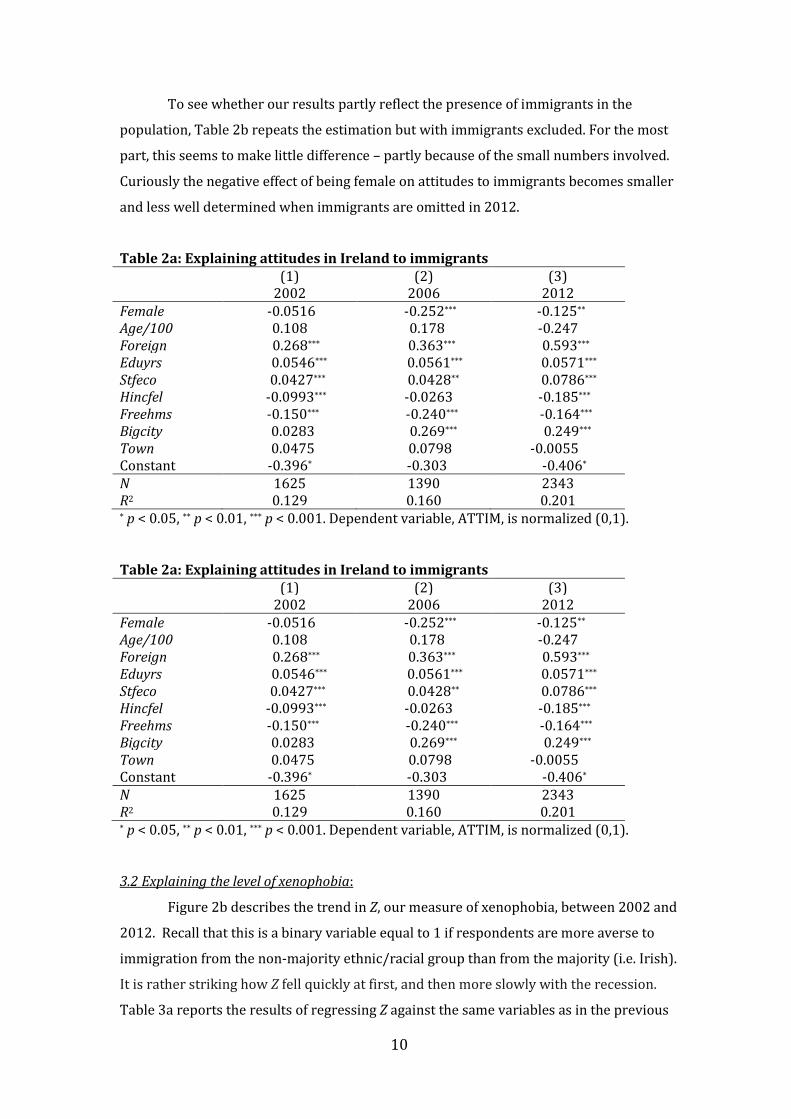
To see whether our results partly reflect the presence of immigrants in the
population, Table 2b repeats the estimation but with immigrants excluded. For the most
part, this seems to make little difference – partly because of the small numbers involved.
Curiously the negative effect of being female on attitudes to immigrants becomes smaller
and less well determined when immigrants are omitted in 2012.
Table 2a: Explaining attitudes in Ireland to immigrants (1) (2) (3) 2002 2006 2012 Female -0.0516 -0.252*** -0.125** Age/100 0.108 0.178 -0.247 Foreign 0.268*** 0.363*** 0.593*** Eduyrs 0.0546*** 0.0561*** 0.0571*** Stfeco 0.0427*** 0.0428** 0.0786*** Hincfel -0.0993*** -0.0263 -0.185*** Freehms -0.150*** -0.240*** -0.164*** Bigcity 0.0283 0.269*** 0.249*** Town 0.0475 0.0798 -0.0055 Constant -0.396* -0.303 -0.406* N 1625 1390 2343 R2 0.129 0.160 0.201 * p < 0.05, ** p < 0.01, *** p < 0.001. Dependent variable, ATTIM, is normalized (0,1). Table 2a: Explaining attitudes in Ireland to immigrants (1) (2) (3) 2002 2006 2012 Female -0.0516 -0.252*** -0.125** Age/100 0.108 0.178 -0.247 Foreign 0.268*** 0.363*** 0.593*** Eduyrs 0.0546*** 0.0561*** 0.0571*** Stfeco 0.0427*** 0.0428** 0.0786*** Hincfel -0.0993*** -0.0263 -0.185*** Freehms -0.150*** -0.240*** -0.164*** Bigcity 0.0283 0.269*** 0.249*** Town 0.0475 0.0798 -0.0055 Constant -0.396* -0.303 -0.406* N 1625 1390 2343 R2 0.129 0.160 0.201 * p < 0.05, ** p < 0.01, *** p < 0.001. Dependent variable, ATTIM, is normalized (0,1). 3.2 Explaining the level of xenophobia:
Figure 2b describes the trend in Z, our measure of xenophobia, between 2002 and
2012. Recall that this is a binary variable equal to 1 if respondents are more averse to
immigration from the non-majority ethnic/racial group than from the majority (i.e. Irish).
It is rather striking how Z fell quickly at first, and then more slowly with the recession.
Table 3a reports the results of regressing Z against the same variables as in the previous
11
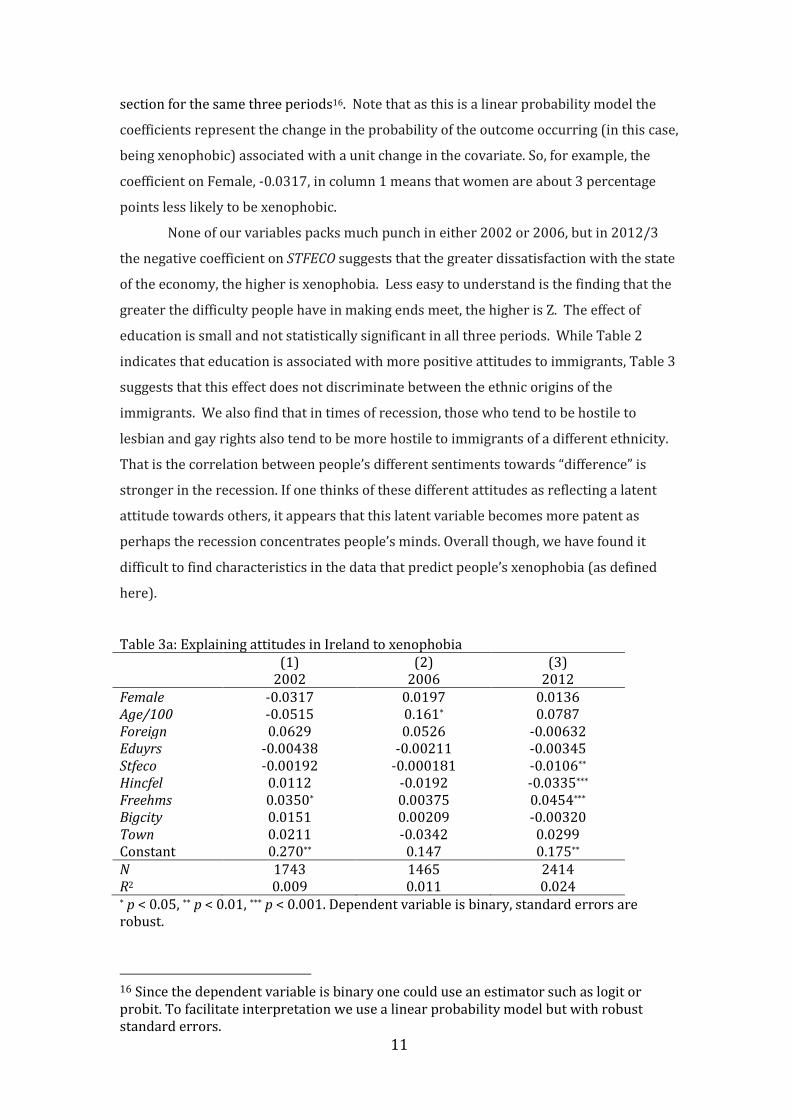
section for the same three periods16. Note that as this is a linear probability model the
coefficients represent the change in the probability of the outcome occurring (in this case,
being xenophobic) associated with a unit change in the covariate. So, for example, the
coefficient on Female, -0.0317, in column 1 means that women are about 3 percentage
points less likely to be xenophobic.
None of our variables packs much punch in either 2002 or 2006, but in 2012/3
the negative coefficient on STFECO suggests that the greater dissatisfaction with the state
of the economy, the higher is xenophobia. Less easy to understand is the finding that the
greater the difficulty people have in making ends meet, the higher is Z. The effect of
education is small and not statistically significant in all three periods. While Table 2
indicates that education is associated with more positive attitudes to immigrants, Table 3
suggests that this effect does not discriminate between the ethnic origins of the
immigrants. We also find that in times of recession, those who tend to be hostile to
lesbian and gay rights also tend to be more hostile to immigrants of a different ethnicity.
That is the correlation between people’s different sentiments towards “difference” is
stronger in the recession. If one thinks of these different attitudes as reflecting a latent
attitude towards others, it appears that this latent variable becomes more patent as
perhaps the recession concentrates people’s minds. Overall though, we have found it
difficult to find characteristics in the data that predict people’s xenophobia (as defined
here).
Table 3a: Explaining attitudes in Ireland to xenophobia (1) (2) (3) 2002 2006 2012 Female -0.0317 0.0197 0.0136 Age/100 -0.0515 0.161* 0.0787 Foreign 0.0629 0.0526 -0.00632 Eduyrs -0.00438 -0.00211 -0.00345 Stfeco -0.00192 -0.000181 -0.0106** Hincfel 0.0112 -0.0192 -0.0335*** Freehms 0.0350* 0.00375 0.0454*** Bigcity 0.0151 0.00209 -0.00320 Town 0.0211 -0.0342 0.0299 Constant 0.270** 0.147 0.175** N 1743 1465 2414 R2 0.009 0.011 0.024 * p < 0.05, ** p < 0.01, *** p < 0.001. Dependent variable is binary, standard errors are robust.
16 Since the dependent variable is binary one could use an estimator such as logit or probit. To facilitate interpretation we use a linear probability model but with robust standard errors.

12
Table 3b: Explaining attitudes in Ireland to immigrants (Irish born only) (1) (2) (3) 2002 2006 2012 Female -0.0323 0.0079 0.0063 Age/100 -0.0735 0.158* 0.0957 Eduyrs -0.0033 -0.0017 -0.00218 Stfeco -0.0039 -0.00057 -0.0127** Hincfel 0.0095 -0.0274 -0.0360*** Freehms 0.0370* 0.00672 0.0429*** Bigcity 0.0217 0.0137 -0.0018 Town 0.0174 -0.0463 0.0194 Constant 0.273** 0.159 0.172* N 1617 1276 2071 R2 0.008 0.013 0.023 * p < 0.05, ** p < 0.01, *** p < 0.001. Dependent variable is binary, standard errors are robust.
3.3 Decomposing changes in attitudes
Irish attitudes to immigration hardened with the economic downturn, but not in a
straightforward way. To what extent is that hardening explained by changes in economic
wellbeing? We end with Blinder-Oaxaca decompositions of the change in the levels of our
two outcomes between each of the consecutive pairs of ESS waves (2002 & 2006, and
2006 & 2012)17. Looking at the first column in Table 3a one can see that the mean of
ATTIM rose from 0.102 in 2002 to 0.255 in 2006 – about 15 per cent of one standard
deviation. So the negative term on Difference for the 2002-06 period implies that
attitudes became less hostile to immigration, while the positive sign for the 2006-12
period means the opposite: as we have seen in Figure 2a the recession has taken its toll
on Irish people’s welcoming attitude to immigrants The decomposition into the
endowment and ‘taste’ parameters suggest that in the first comparison both were equally
responsible for the change in ATTIM (with the interaction between the two negligible),
while in the second comparison all three components had a significant role to play. So
between 2002 and 2006, the positive signs on the endowment and taste components
indicates that both changing characteristics and changing people’s tastes were about
equally responsible for the more less pro-immigrant attitude but this was partly offset by
the interaction between the two.
Since demographic characteristics, like age, gender, education tend not to change
much over a short period of time one might surmise that it is the economic variables that
will be primarily responsible for the first, endowment, component. The detailed statistics
further down allow us to examine this. Under the endowments column for 2002/2006,
17 The calculations in Tables 4 and 5 are based on Stata code from Jann(2008).

13
one can see that the largest item (which more than accounts for the endowment effect of
0.0705) is that of Stfeco—so people’s increasing satisfaction with the economy largely
accounts for a more positive attitude to immigrants. The increasing number of
immigrants over that period strengthened this effect.
Turning to changes associated with changing tastes, (which arises from the
differences in coefficients across columns in Table 3a) one can see that females have
become significantly more anti-immigrant between 2002 and 2006 (i.e. the +0.1051
coefficient). It is also the case that the association between attitudes to gays and to
immigrants has strengthened. Since these two effects go against the overall effect of
changing tastes (=-0.0715) other changes in tastes are having the opposite effect. One
example of this here is the effect of living in a big city (i.e. Dublin), which increased its
effect on attitudes to immigrants between 2002 and 2006.
Turning to the decomposition between 2006 and 2012, one can see that people’s
falling satisfaction with the economy explains most of the hardening of attitudes towards
immigrants as well as people’s own more difficult economic circumstances (0.281, 0.097
respectively). Rising education levels do something to stem the tide (-0.073). In the
coefficients component, reflecting changes in people’s tastes, it is interesting that there
has been a changing effect of age: with a higher age switching from being a sympathetic
factor towards immigrants in 2006 to having the opposite in 2012. Why this change
occurred is unclear to us. Since younger people have suffered the consequences of the
recession more, one might have expected the opposite outcome, if anything. The
interaction effects do not admit of a simple explanation since each consists of the product
of a change in coefficient and a change in the endowment. For the most part they are
small and not statistically significant.
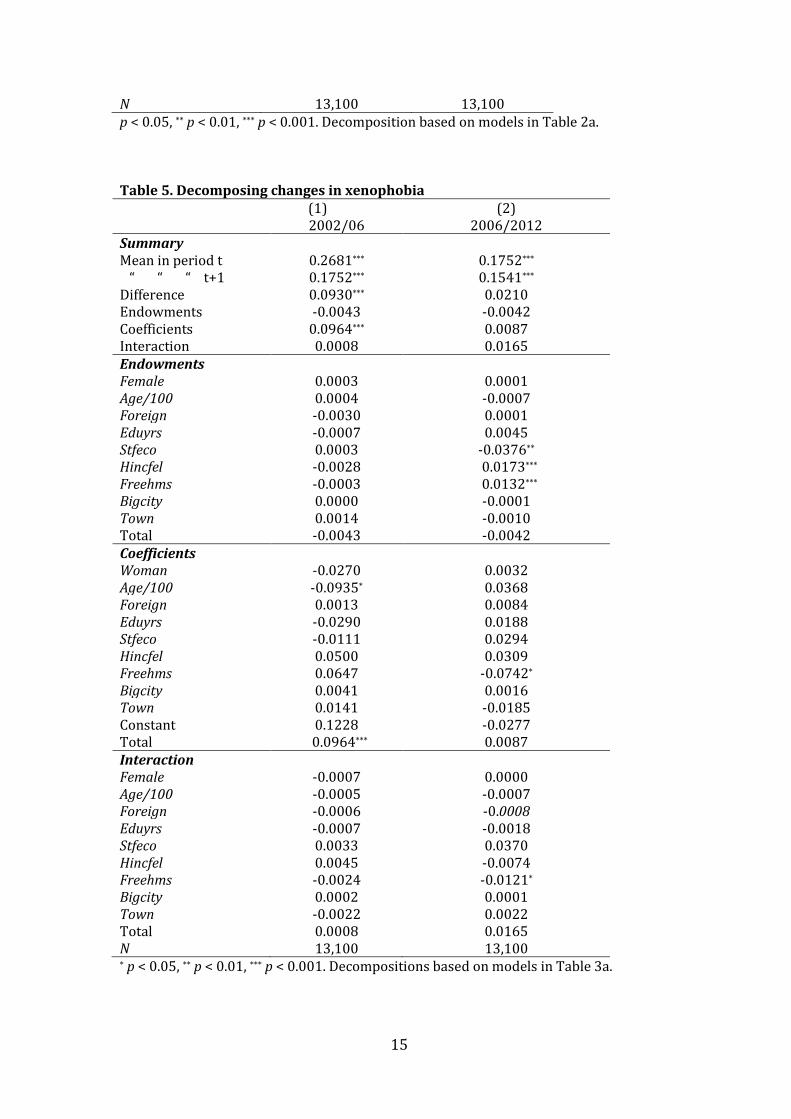
Table 5 carries out the same decomposition with regard to the models of
xenophobia, Z, reported in Table 3a. Here the challenge is to explain a large and then a
small reduction in xenophobia. Since Table 3a did not reveal very much, it is perhaps not
surprising that the decomposition does not help much either. However, it is noticeable
that changing endowments, the characteristics of people, explain none of the decline in
xenophobia between 2002 and 2006. Instead it is the taste effect: how people respond to
these characteristics. Even there however the only individually significant in coefficients
is on age, which goes the “wrong way”: it predicts higher xenophobia. The overall
coefficient effect (=0.0964) is from a combination of changing economic circumstances
and levels of satisfaction with the economy. As pointed out earlier, these effects are not
well determined so we do not read too much into them. Paradoxically the smaller fall in
xenophobia between 2006 and 2012 is somewhat easier to explain. None of the three

14
components is big and even then they cancel each other out to some extent. But within
the endowment effect there are opposing forces: falling levels of satisfaction with the
economy is increasing xenophobia (=-0.0376), but this is partly cancelled out by
individuals’ greater financial difficulties. As already noted above, the two economic
variables somewhat surprisingly work in opposite directions when it comes to
xenophobia.
Table 4: Decomposing changes in attitude towards immigration (1) (2) 2002/2006 2006/2012 Summary Mean in period t 0.102*** 0.255*** “ “ “ t+1 0.255*** -0.0870*** Difference Endowment Coefficients Interaction
-0.153***
-0.0701* -0.0715 -0.0114
0.342***
0.260*** 0.319*** -0.237***
Endowments Female -0.00334 -0.00054 Age/100 0.000403 0.00282 Foreign -0.0208*** -0.00720 Eduyrs 0.0180* -0.0730*** Stfeco -0.0787** 0.281*** Hincfel -0.00343 0.0970*** Freehms 0.0147 -0.0464*** Bigcity 0.00574 0.00638 Town -0.00267 0.000246 Total -0.0701* 0.260*** Coefficients Female 0.1051** -0.0661 Age/100 -0.0304 0.191* Foreign -0.0123 -0.0325* Eduyrs -0.0197 -0.0148 Stfeco -0.000665 -0.101* Hincfel -0.120 0.343** Freehms 0.185* -0.134 Bigcity -0.0780** 0.00617 Town -0.00796 0.0248 Constant -0.0927 0.103 Total -0.0715 0.319*** Interaction Female 0.00266 -0.000558 Age/100 -0.000157 -0.00485 Foreign 0.00544 0.00279 Eduyrs -0.000491 0.00134 Stfeco 0.000191 -0.128* Hincfel -0.00952 -0.0832** Freehms -0.00552 -0.0215 Bigcity -0.00514 0.000532 Town 0.00108 -0.00380 Total -0.0114 -0.237***
15
N 13,100 13,100 p < 0.05, ** p < 0.01, *** p < 0.001. Decomposition based on models in Table 2a. Table 5. Decomposing changes in xenophobia (1) (2) 2002/06 2006/2012 Summary Mean in period t 0.2681*** 0.1752*** “ “ “ t+1 0.1752*** 0.1541*** Difference Endowments Coefficients Interaction
0.0930***
-0.0043 0.0964***
0.0008
0.0210 -0.0042 0.0087 0.0165
Endowments Female 0.0003 0.0001 Age/100 0.0004 -0.0007 Foreign -0.0030 0.0001 Eduyrs -0.0007 0.0045 Stfeco 0.0003 -0.0376** Hincfel -0.0028 0.0173*** Freehms -0.0003 0.0132*** Bigcity 0.0000 -0.0001 Town 0.0014 -0.0010 Total -0.0043 -0.0042 Coefficients Woman -0.0270 0.0032 Age/100 -0.0935* 0.0368 Foreign 0.0013 0.0084 Eduyrs -0.0290 0.0188 Stfeco -0.0111 0.0294 Hincfel 0.0500 0.0309 Freehms 0.0647 -0.0742* Bigcity 0.0041 0.0016 Town 0.0141 -0.0185 Constant 0.1228 -0.0277 Total 0.0964*** 0.0087 Interaction Female -0.0007 0.0000 Age/100 -0.0005 -0.0007 Foreign -0.0006 -0.0008 Eduyrs -0.0007 -0.0018 Stfeco 0.0033 0.0370 Hincfel 0.0045 -0.0074 Freehms -0.0024 -0.0121* Bigcity 0.0002 0.0001 Town -0.0022 0.0022 Total 0.0008 0.0165 N 13,100 13,100 * p < 0.05, ** p < 0.01, *** p < 0.001. Decompositions based on models in Table 3a.

16
4. Conclusions
Over the past decade or so, Ireland has been transformed from a place where immigrants
were few to one where one resident in six is born outside the country. The impact of this
change on public opinion is of considerable interest. In this paper we have sought to
identify that impact and the factors that influence it. Not surprisingly, the economic
downturn after 2007 had a negative impact on attitudes to immigration. At the same
time there is evidence that the Irish have become more accepting of people from very
different backgrounds. How the trends in Irish opinion have diverged from those of other
European countries is an interesting question, which we will address in future work.
WORKS CITED:
Card, David, Christian Dustman, and Ian Preston. 2012. Immigration, wages, and
compositional amenities, Journal of the European Economic Association, 10(1), 78-119.
O'Rourke, Kevin H. and Richard Sinnott. 2006. The determinants of individual attitudes
towards immigration, European Journal of Political Economy 22[4]: 838-61.
Bertrand, Marianne and Sendhil Mullainathan. 2001. Do people mean what they say?
Implications for subjective survey data. American Economic Review 91: 67–72.
Callens, Marie-Sophie, Marie Valentova, and Bart Meuleman. 2012. Do attitudes toward
integration of immigrants change over time? A comparative study of natives, second-
generation immigrants and foreign-born residents in Luxembourg, CEPS-INSTEAD
Working Paper [http://www.statistiques.public.lu/catalogue-publications/working-
papers-CEPS/2012/14-2012.pdf].
Card, David, Christian Dustman, and Ian Preston. 2005. Understanding attitudes to
immigration: the migration and minority module of the first ESS. CDP No 03/05.
Card, D, Christian Dustman, and Ian Preston. 2012. Immigration, wages and
compositional amenities. Journal of the European Economic Association, forthcoming.
Denny, Kevin. 2011. Civic Returns to Education: its Effect on Homophobia. University
College Dublin Centre for Economic Research Working Paper 11/08.
Donovan, Donal and Antoin Murphy. 2013. The Fall of the Celtic Tiger: Ireland the Euro
Debt Crisis. Oxford: Oxford University Press.

17
Firpo, Sergio, Nicole Fortin, and Thomas Lemieux. 2011. Decomposition methods in
economics. In Orley Ashenfelter and David Card, eds. Handbook of Labor Economics (vol.
4A) Amsterdam: Elsevier, pp. 1-102.
Facchini, Giovanni and Anna Maria Mayda. 2009. Individual attitudes towards
immigrations: welfare-state determinants across countries. Review of Economics and
Statistics 91[2]: 295-314.
Gomellini, Matteo and Cormac Ó Gráda. 2012. Outward and inward migrations in Italy: a
historical perspective. In Gianni Toniolo, ed., The Oxford Handbook of the Italian Economy
since Unification. Oxford: OUP.
Hainmueller, Jens and Michael J Hiscox. 2007. Educated preferences: explaining attitudes
toward immigration in Europe. International Organization, 61: 399-442.
Jann, Ben. 2008. The Blinder–Oaxaca decomposition for linear regression models. Stata
Journal, 8(4): 453-479.
Kinsella, Stephen and Tony Leddin. 2011. Understanding Ireland's Economic Crisis:
Prospects for Recovery. Dublin: Blackhall Publishing.
Malchow-Møller, Nikolaj Jakob Roland Munch, Sanne Schroll, Jan Rose Skaksen. 2008.
Attitudes towards immigration: perceived consequences and economic self-interest.
Economic Letters, 100: 254-57.
Meuleman, Bart, Eldad Davidov, and Jaak Billiet. 2009. Changing attitudes toward
immigration in Europe, 2002-2007: A dynamic group conflict theory approach. Social
Science Research, 38: 352-365.
Mayda, Anna Maria. 2010. International migration: a panel data analysis of the
determinants of bilateral flows, Journal of Population Economics, 23(4): 1249-1274.
Mayda, Anna Maria. 2006. Who is against immigration? A cross-country investigation of
individual attitudes towards immigration, Review of Economics and Statistics, 88[3]: 510-
30.
Meuleman B, E Davidov, and J Billiet. 2009. Changing attitudes toward immigration in
Europe, 2002-2007: A dynamic group conflict theory approach. Social Science Research,
38: 352-365.

18
Ó Gráda, Cormac. 2013. Because she didn’t let them in’: Irish immigration a century ago
and today. Working Paper.
O'Rourke, Kevin H. and Richard Sinnott. 2006. The determinants of individual attitudes
towards immigration, European Journal of Political Economy 22[4]: 838-61.
Semyonov, M, R Raijman, and A Gorodzeisky. 2006. The rise of anti-foreigner sentiment
in European societies, 1988-2000. American Sociological Review, 71: 426-449.
Sides, John and Jack Citrin. 2007. European Opinion About Immigration: The Role of
Identities, Interests and Information, British Journal of Political Science 37: 477-504.
19
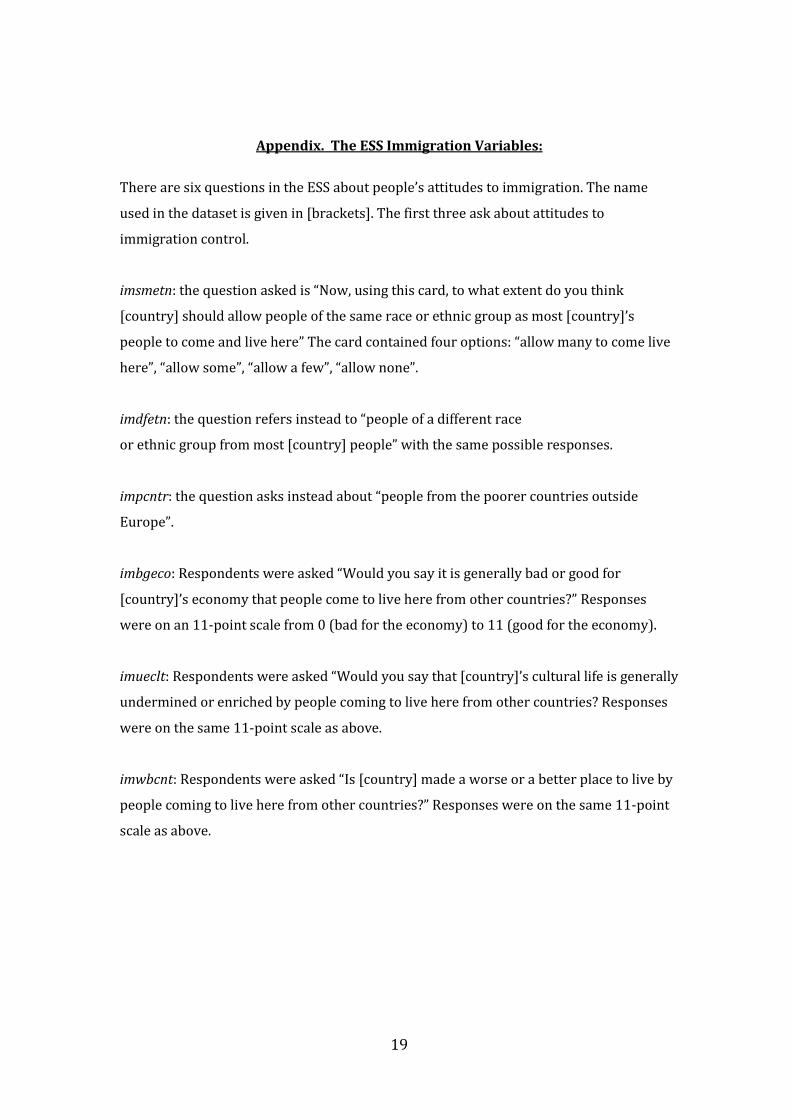
Appendix. The ESS Immigration Variables:
There are six questions in the ESS about people’s attitudes to immigration. The name
used in the dataset is given in [brackets]. The first three ask about attitudes to
immigration control.
imsmetn: the question asked is “Now, using this card, to what extent do you think
[country] should allow people of the same race or ethnic group as most [country]’s
people to come and live here” The card contained four options: “allow many to come live
here”, “allow some”, “allow a few”, “allow none”.
imdfetn: the question refers instead to “people of a different race
or ethnic group from most [country] people” with the same possible responses.
impcntr: the question asks instead about “people from the poorer countries outside
Europe”.
imbgeco: Respondents were asked “Would you say it is generally bad or good for
[country]’s economy that people come to live here from other countries?” Responses
were on an 11-point scale from 0 (bad for the economy) to 11 (good for the economy).
imueclt: Respondents were asked “Would you say that [country]’s cultural life is generally
undermined or enriched by people coming to live here from other countries? Responses
were on the same 11-point scale as above.
imwbcnt: Respondents were asked “Is [country] made a worse or a better place to live by
people coming to live here from other countries?” Responses were on the same 11-point
scale as above.