irq_assessment_report_entry_point_monitoring_september_to_october_2014
TRANSCRIPT
IRAQ ASSESSMENT REPORT NOVEMBER 2014
ENTRY POINT MONITORING OF INTERNALLY DISPLACED
PERSONS IN NORTHERN IRAQ: SEPTEMBER – OCTOBER 2014
ENTRY POINT MONITORING OF INTERNALLY DISPLACED
PERSONS IN NORTHERN IRAQ: SEPTEMBER – OCTOBER 2014
IRAQ ASSESSMENT REPORT NOVEMBER 2014

Entry Point Monitoring of Internally Displaced Persons in Northern Iraq: September to October 2014
1
CONTENTS
Summary ................................................................................................................................................................ 2
Abbreviations and Acronyms .................................................................................................................................. 3
Geographical Classifications ................................................................................................................................... 3
List of figures, Maps and Tables ............................................................................................................................. 3
Introduction ........................................................................................................................................................... 4
Methodology .......................................................................................................................................................... 5
Household Surveys ................................................................................................................................................. 5
Data Analysis and Limitations ................................................................................................................................. 5
Key Findings ......................................................................................................................................................... 6
Area of Origin .......................................................................................................................................................... 6
Access to Areas of Refuge ...................................................................................................................................... 7
Mode of transport ........................................................................................................................................... 7
Family contacts / sponsors ........................................................................................................................... 10
Documentation provided .............................................................................................................................. 11
Intentions .............................................................................................................................................................. 13
Planned alternative if unable to enter the KRI .............................................................................................. 13
Planned location ........................................................................................................................................... 14
Planned Accommodation ............................................................................................................................. 15
Forms of support ................................................................................................................................................... 16
Availability of support ................................................................................................................................... 16
Sustainability of support ............................................................................................................................... 18
Conclusion .......................................................................................................................................................... 20
About REACH Initiative REACH was created in 2010 to facilitate the development of information tools and products that enhance the capacity of aid actors to make evidence-based decisions in emergency, recovery and development contexts. All REACH activities are conducted in support to and within the framework of inter-agency aid coordination mechanisms. For more information, you can write to our Iraq office: [email protected] or to our global team in Geneva [email protected]. Visit our website at www.reach-intiative.org and follow us @REACH_info.

Entry Point Monitoring of Internally Displaced Persons in Northern Iraq: September to October 2014
2
SUMMARY The subject of this study is to establish the profiles of the different households attempting to enter the Kurdistan Region of Iraq (KRI) in September and October 2014: their area of origin, intentions once inside the KRI and means of supporting the household during their displacement. This bi-monthly assessment report complements weekly factsheets1 and daily reports (made directly to UNHCR). The report attempts to present indicative answers to these main questions:
1. What intentions do IDP households have once they have entered the KRI? 2. What are the socioeconomic profiles of IDP households coming to the KRI? 3. How do IDP households intend to support themselves during their displacement and how long do they
think this strategy will be sustainable? Therefore this study aims to highlight issues and geographic areas for further in depth and on-going assessments of the displacement crisis in Iraq. Violence broke out in Iraq in Anbar in December 2013 and has intensified since the sudden advance of Armed Groups (AGs) to Mosul city, sparking a mass displacement across Ninewa and into the KRI in late June and throughout July. In early August AGs advanced to Sinjar, triggering another wave of displacement. Findings from the months of July and August can be found in the previous bi-monthly report to this one: Entry Point Monitoring of Internally Displaced Persons in Northern Iraq: July to August 20142. The primary push factor of the displacement crisis in Iraq is the on-going conflict between armed groups in Northern Iraq. The primary pull factor to the KRI is the perception of finding greater security from violence there, followed by better access to accommodation compared to other areas in Iraq.3 Accommodation is of particular importance to this study as an indication of where IDPs intend to go once inside the KRI; however, tracking the flow of this large amount of displaced people is a huge challenge. The key findings of this report are the following:
Overall, the primary governorates of origin of assessed IDPs coming to the KRI were Ninewa (40%) and Anbar (20%) almost exclusively across the reporting period.
IDPs may have had to use much needed resources on transport to the KRI, particularly by taxi
which increased in price across the reporting period - from 131,089 IQD to 429,000 IQD (113
to 369 USD). This is an expense that they may or may not have planned for, therefore affecting
their ability to support the household during displacement.
There was a clear reduction in the instances of a ‘leave to remain’ letter being issued and an
increase in residency cards being issued towards the end of October.
77% of households planned to retry the same entry point if they were refused entry, indicating
there were limited alternative options.
Assessed households overwhelmingly intended to rent an apartment or house inside the KRI
(52%). This is an indication of the financial resources available to IDPs travelling to the KRI.
The most reported means of supporting the household were savings (53%). This is in contrast
to July-August when the largest proportion of IDPs said that they had no form of support4.
However, assessed households were largely uncertain about how long their means of
supporting the household would be sustainable (37% said that they did not know). If we
compare to the previous months, the most commonly reported answers were ‘less than one
week’ in July and ‘3-4 weeks’ in August5.
1 These factsheets are available online: http://www.humanitarianresponse.info/operations/iraq/search?search=entry+point+monitoring
2 REACH Initiative, Entry Point Monitoring of Internally Displaced Persons in Northern Iraq: July to August 2014 (Iraq, September 2014)
3 International Organization for Migration, Ongoing Displacement: A Profile of Iraq 2013 / 2014 (Iraq, September 2014) p.8.
4 REACH Initiative, note 2 supra, p.18
5 Ibid., p.20

Entry Point Monitoring of Internally Displaced Persons in Northern Iraq: September to October 2014
3
ABBREVIATIONS AND ACRONYMS
GEOGRAPHICAL CLASSIFICATIONS
Governorate The highest administrative boundary below the national level. District Governorates are divided into districts.
LIST OF FIGURES, MAPS AND TABLES
Figure 1: Governorate of origin of IDPs - August to October 2014. ........................................................................ 6
Figure 2: Governorate of origin of assessed IDP households by governorate of entry to the KRI. ......................... 7
Figure 3: Mode of transport as reported by IDPs – by governorate ........................................................................ 7
Figure 4: Mode of transport to the KRI - September to October 2014..................................................................... 8
Figure 5: Mode of transport to the KRI, by area of origin ........................................................................................ 9
Figure 6: Cost of renting a taxi to the KRI - September to October 2014 ................................................................ 9
Figure 7: Proportion of IDP households with a family contact or sponsor in the KRI – Sep to Oct 2014 .............. 10
Figure 8: Proportion of IDP households reporting having a sponsor within the KRI - by governorate................... 10
Figure 9: Proportion of IDP households reporting being given each type of documentation. ................................ 11
Figure 10: Types of official documentation provided at entry points – September to October 2014 ..................... 12
Figure 11: Proportion of IDP households being given each document type, by governorate. ............................... 12
Figure 12: Substitute plans reported by IDPs if rejected from current entry point – by main governorates of origin
.............................................................................................................................................................................. 13
Figure 13: Proportion of IDP households reporting alternative plans if denied entry to the KRI - September to
October 2014. ....................................................................................................................................................... 14
Figure 14: Accommodation arrangements intended by assessed IDPs - September to October 2014 ................ 15
Figure 15: Accommodation arrangements intended by IDPs - by governorate ..................................................... 15
Figure 16: Intended accommodation arrangements as reported by IDPs – September to October 2014 ............. 16
Figure 17: Forms of support – September to October 2014 .................................................................................. 16
Figure 18: Forms of support used by Governorate – September to October 2014 ............................................... 17
Figure 19: Sustainability of support reported by IDPs by governorate – September to October 2014 .................. 18
Figure 20: Sustainability of support - September to October 2014 ....................................................................... 19
Table 1: Samples per week per governorate. ......................................................................................................... 5
AG Armed Group AoO Area of Origin IDP Internally Displaced Person KRG Kurdistan Regional Government KRI Kurdistan Region of Iraq

Entry Point Monitoring of Internally Displaced Persons in Northern Iraq: September to October 2014
4
INTRODUCTION
Confrontations that occurred in Mosul City (belonging to Ninewa Governate) and surrounding areas at the start of June 2014 produced an immediate and sizeable wave of IDPs, primarily towards the neighbouring borders of Erbil and Duhok governorates in the Kurdistan Region of Iraq (KRI). Influxes have continued since then, and their magnitude are a direct reflection of events occurring in Ninewa Governorate and other areas affected by the ongoing conflict - such as Anbar, Salah Al Din and Diyala -, from where many internally displaced persons (IDPs) have also sought refuge in Sulaymaniyah Governorate. The rapid displacement of more than 500,000 people since the start of June 2014 has posed a serious challenge for the humanitarian response. There was an estimated 1.8 million displaced persons in Iraq in September 2014 – with 862,000 IDPs being located in the KRI.6 At the end of October, the overall number of IDPs in Iraq reached 1.9 million, comprising 316,474 families in 1,928 locations.7 Locating IDPs and providing immediate, life-saving assistance has been hampered by difficulties in tracking their movement from their area of origin and within the KRI. In many locations, needs vary on a daily basis as IDPs come and go, posing enormous difficulties for the delivery of effective services by the Kurdistan Regional Government (KRG) and humanitarian actors. In response to this information gap, REACH Initiative has been monitoring key entry points used to enter the KRI on a daily basis to understand the movement and intentions of IDPs. On arriving in the KRI, information was gathered from the IDPs about demographics, means of transport, documentation provided, and availability of economic resources. The report attempts to present indicative answers to these main questions:
1. What intentions do IDP households have once they have entered the KRI?
2. What are the socioeconomic profiles of IDP households coming to the KRI?
3. How do IDP households intend to support themselves during their displacement and how long do they think this strategy will be sustainable?
The analysis is composed of data collected at each entry point into the governorates of Erbil and Sulaymaniyah during September and October 2014 and complements weekly factsheets and daily reports.8 Findings from the first two months can be found in the previous report: Entry Point Monitoring of Internally Displaced Persons in Northern Iraq: July to August 2014.9 Duhok is not included in the analysis in this report as the sample size was not large enough; indeed some entry points were not accessible due to proximity of AGs. The assessment was conducted between the 1st of September 2014 and the 30th of October 2014, covering a total of 1,273 households (6,937 individuals) attempting to cross 10 different entry points into the KRI.
6 UN OCHA, Immediate Response Plan (IRP) for the IDPs crisis in the KR-I: 15 Sept - 15 Nov 2014 (27 Sep 2014) p. 3.
7 International Organization for Migration, Displacement Tracking Matrix, Report II of Round VII (October 2014) p. 1.
8 These and all other REACH products are available on the Humanitarian Response Portal: https://www.humanitarianresponse.info/fr/operations/iraq.
9 REACH Initiative, note 2 supra

Entry Point Monitoring of Internally Displaced Persons in Northern Iraq: September to October 2014
5
METHODOLOGY
Data was collected on a daily basis at all accessible, key entry points into the KRI, with REACH teams spending on average two hours at each entry point, interviewing heads of household using a convenience sample approach.
HOUSEHOLD SURVEYS
For household surveys, the REACH team interviewed 1,273 heads of household. Convenience sampling was used at the entry points, interviewing households after being granted entry to the KRI and also whilst in the transit area between the initial check and being granted entry. The questionnaires were closed-ended and took approximately one minute to complete. Due to varying degrees of accessibility at certain entry points – therefore affecting the total sample size collected at each entry point -, findings are indicative at governorate level.
DATA ANALYSIS AND LIMITATIONS
Assessing households in the transit area of the entry point had the advantage of being able to assess a household’s intentions, should they be refused entry. However, this method was disadvantaged by the fact that entry had not yet been granted so respondents may have felt pressure to participate or that their responses might affect their chance of gaining entry to the KRI. To mitigate this, enumerators received training on interview and community engagement skills. In accordance with weekly feedback on the interview process, additional questions were added to the questionnaire following the onset of data collection. As a result, the information available at different periods during the nine weeks of data collection varies slightly, with some information not being available for all weeks.
Table 1: Samples per week per governorate.
Week Erbil Sulaymaniyah Total
01 - 04 Sep 20 60 80
07 - 11 Sep 59 60 119
14 - 18 Sep 136 65 201
21 - 15 Sep 84 108 192
28 Sep - 02 Oct 39 95 134
08 - 16 Oct 47 124 171
19 - 23 Oct 86 170 256
27 - 30 Oct 38 82 120
Total 509 764 1273

Entry Point Monitoring of Internally Displaced Persons in Northern Iraq: September to October 2014
6
KEY FINDINGS
This section discusses the main findings of this assessment, which are disaggregated by week and governorate (where relevant) to give a chronological and geographical analysis for each area. The sub-sections of the report are focus on area of origin, crossing the entry points, intentions and forms of support.
AREA OF ORIGIN
Overall, the primary area of origin of assessed IDPs in September and October was Ninewa (40%) followed by Anbar (20%). Other areas of origin included Salah Al Din (12%), Baghdad (11%), Kirkuk (11%) and Diyala (4%). 1.5% of assessed households were from Basra, Babylon, Kerbala and Wassit. The high proportion from Ninewa reflects the high levels of conflict in that governorate. The proportion of IDPs coming from Ninewa fell from 58% in the second week of September (58%) to 26% in the third week of October, before rising again in the last two weeks of the reporting period (see Figure 1 below). The proportion of IDPs coming from Anbar increased across the same weeks to reach 31% in the third week of October, before falling again at the end of the month. According to the Displacement Tracking Matrix - published by IOM - the total number of families displaced from Anbar governorate since the start of the crisis was 87,160 in October, compared to 156,246 for families coming from Ninewa.10
Figure 1: Governorate of origin of IDPs - August to October 2014.
10 International Organization for Migration, note 7 supra, p. 2.

Entry Point Monitoring of Internally Displaced Persons in Northern Iraq: September to October 2014
7
Therefore, sustained violence across the Northern governorates during these months led to a steady stream of displacement. Figure 2 below disaggregates the results by governorate of entry to the KRI level. In Erbil entry points, 87% of assessed IDPs were from Ninewa. In comparison, the sample taken at Sulaymaniyah entry points indicate that the primary governorate of origin was Anbar (31%) followed by other governorates including Baghdad (16%), Ninewa (15%), Salah Al Din (15%) and Kirkuk (14%). While a high proportion came from neighbouring governorates of Ninewa, Kirkuk and Diyala, many also travelled long distances to reach the KRI from Anbar and Baghdad, clearly showing that the KRI is an attractive destination for many households after becoming displaced.
Figure 2: Governorate of origin of assessed IDP households by governorate of entry to the KRI.
ACCESS TO AREAS OF REFUGE
Mode of transport
The most popular mode of transport used by assessed IDP households to travel to the KRI was by car, closely followed by taxi in both Erbil and Sulaymaniyah. A minibus was taken by 8% and 10.1% of assessed households in Erbil and Sulaymaniyah respectively. Assessing the mode of transport used gives us an indication of the socio-economic profile of households travelling to the KRI, as well as indicates whether IDPs were travelling as a family or in larger groups (see Figure 3 below).
Figure 3: Mode of transport as reported by IDPs – by governorate

Entry Point Monitoring of Internally Displaced Persons in Northern Iraq: September to October 2014
8
Over the reporting period, car and taxi remained the most popular mode of transport to the KRI amongst assessed households (see Figure 4 below). The proportion of IDPs arriving by car rose over the reporting period to reach a peak of 61% in the second week of October, thereafter returning to 36% (on par with 35% at the end of August). The proportion of IDPs travelling by taxi fell slightly over the period from 43% at the end of August to 38% by the end of October. Car and taxi were also the most popular modes of transport in July and August. Households often travel to the KRI not only because of a perceived greater level of security but also to rent accommodation.11 This would suggest that better off families can afford to travel to the KRI and that when they do so, they have planned it in advance and have been able to gather assets. However this is not the case for all, especially in the case of sudden displacements from Mosul and Sinjar in Ninewa Governorate.
Figure 4: Mode of transport to the KRI - September to October 2014
When disaggregated by governorate of origin, it is clear that car and taxi were the most popular modes of transport across all governorates of origin amongst assessed households (see Figure 5).
11 International Organization for Migration, Ongoing Displacement: A Profile of Iraq 2013 / 2014 (Iraq, September 2014) p.8.

Entry Point Monitoring of Internally Displaced Persons in Northern Iraq: September to October 2014
9
Figure 5: Mode of transport to the KRI, by area of origin
Demand for taxis to Sulaymaniyah entry points to the KRI was highly price elastic during the reporting period. Indeed, the cost of renting a taxi to the KRI increased a lot from 184,667 IQD (154 USD) in the second week of September to 571,250 IQD (476 USD) in the last week of October: a 300% increase (see Figure 6 below). At some entry points - particularly on the roads from Kirkuk -, IDP households had been told to leave their car behind as a security measure, and to travel into the KRI by taxi, therefore leaving them no choice but to pay the fare. This might explain the high elasticity of price.
Figure 6: Cost of renting a taxi to the KRI - September to October 2014
One key finding is that IDPs may have had to use much needed resources to reach the KRI, an expense they may or may not have planned for. Sustainability of resources is subject to shocks and unexpected costs such as the high taxi fare, which limits an IDP household’s ability to plan accurately for the long term.
131,089
429,000
23,933 78,846
184,667
571,250
0
100,000
200,000
300,000
400,000
500,000
600,000
700,000
800,000
11-Sep 18-Sep 25-Sep 2-Oct 9-Oct 16-Oct 23-Oct 30-Oct
KRI Erbil Sulaymaniyah
Co
st:
IQD
Week Ending [2014]
% a
sses
sed
IDP
ho
use
ho
lds
Entry Point Monitoring of Internally Displaced Persons in Northern Iraq: September to October 2014
10
Figure 8: Proportion of IDP households reporting having a sponsor within the KRI - by governorate
The research also shows that the majority of IDP households had fairly good transport options. However, it might also indicate that only better off households can afford to reach the KRI, especially if travelling from more distant areas of origin. A recently published REACH Situation Overview on the city of Falluja found that the cost of travelling from Falluja to Erbil for a family of six was two million IQD (1,700 USD) in December. 12
Family contacts / sponsors
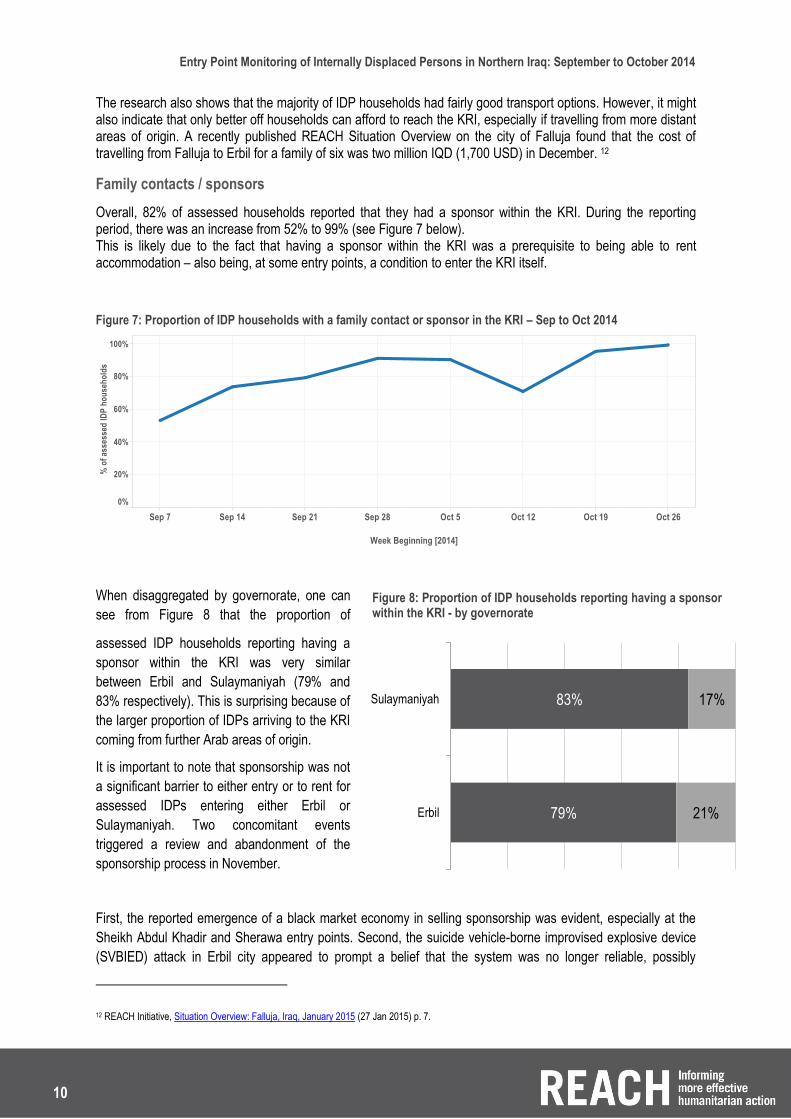
Overall, 82% of assessed households reported that they had a sponsor within the KRI. During the reporting period, there was an increase from 52% to 99% (see Figure 7 below). This is likely due to the fact that having a sponsor within the KRI was a prerequisite to being able to rent accommodation – also being, at some entry points, a condition to enter the KRI itself.
Figure 7: Proportion of IDP households with a family contact or sponsor in the KRI – Sep to Oct 2014
When disaggregated by governorate, one can
see from Figure 8 that the proportion of
assessed IDP households reporting having a
sponsor within the KRI was very similar
between Erbil and Sulaymaniyah (79% and
83% respectively). This is surprising because of
the larger proportion of IDPs arriving to the KRI
coming from further Arab areas of origin.
It is important to note that sponsorship was not
a significant barrier to either entry or to rent for
assessed IDPs entering either Erbil or
Sulaymaniyah. Two concomitant events
triggered a review and abandonment of the
sponsorship process in November.
First, the reported emergence of a black market economy in selling sponsorship was evident, especially at the
Sheikh Abdul Khadir and Sherawa entry points. Second, the suicide vehicle-borne improvised explosive device
(SVBIED) attack in Erbil city appeared to prompt a belief that the system was no longer reliable, possibly
12 REACH Initiative, Situation Overview: Falluja, Iraq, January 2015 (27 Jan 2015) p. 7.
79%
83%
21%
17%
Erbil
Sulaymaniyah
Entry Point Monitoring of Internally Displaced Persons in Northern Iraq: September to October 2014
11
because of the monetization of the process. Therefore, the system that has emerged since late November has
shown heavy restriction of travel, regardless of contacts in the KRI.
Documentation provided
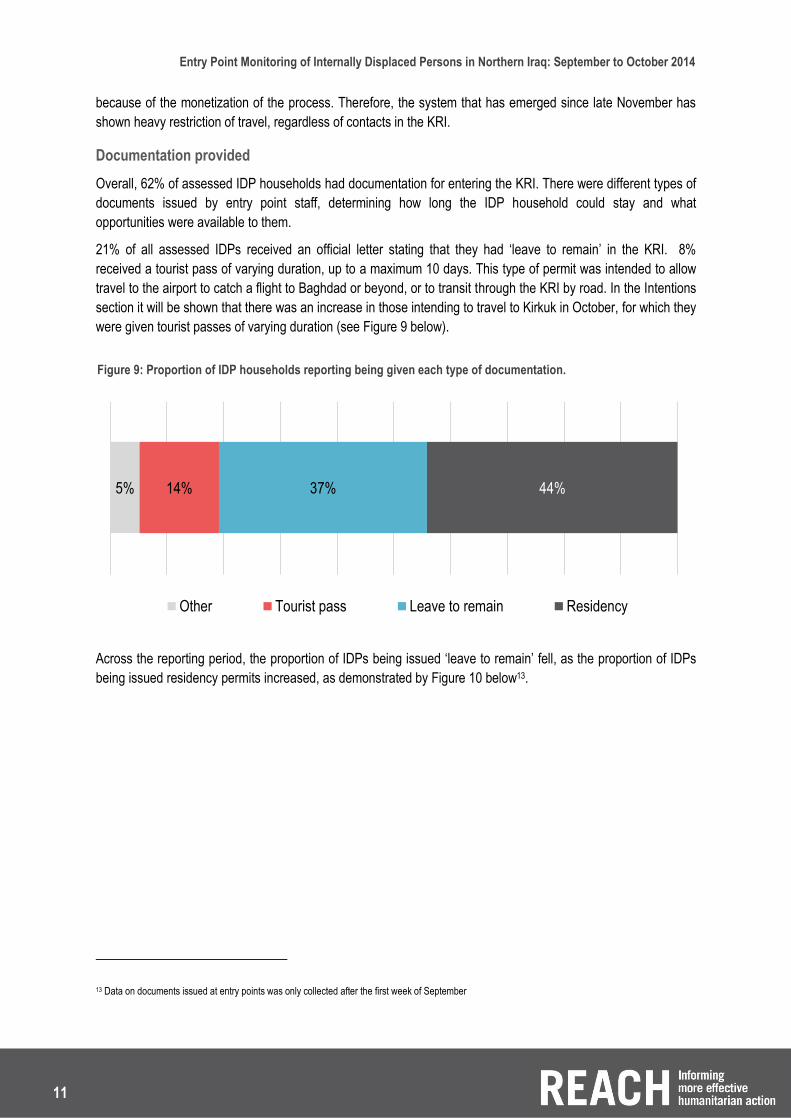
Overall, 62% of assessed IDP households had documentation for entering the KRI. There were different types of
documents issued by entry point staff, determining how long the IDP household could stay and what
opportunities were available to them.
21% of all assessed IDPs received an official letter stating that they had ‘leave to remain’ in the KRI. 8%
received a tourist pass of varying duration, up to a maximum 10 days. This type of permit was intended to allow
travel to the airport to catch a flight to Baghdad or beyond, or to transit through the KRI by road. In the Intentions
section it will be shown that there was an increase in those intending to travel to Kirkuk in October, for which they
were given tourist passes of varying duration (see Figure 9 below).
Across the reporting period, the proportion of IDPs being issued ‘leave to remain’ fell, as the proportion of IDPs
being issued residency permits increased, as demonstrated by Figure 10 below13.
13 Data on documents issued at entry points was only collected after the first week of September
5% 14% 37% 44%
Other Tourist pass Leave to remain Residency
Figure 9: Proportion of IDP households reporting being given each type of documentation.
Entry Point Monitoring of Internally Displaced Persons in Northern Iraq: September to October 2014
12
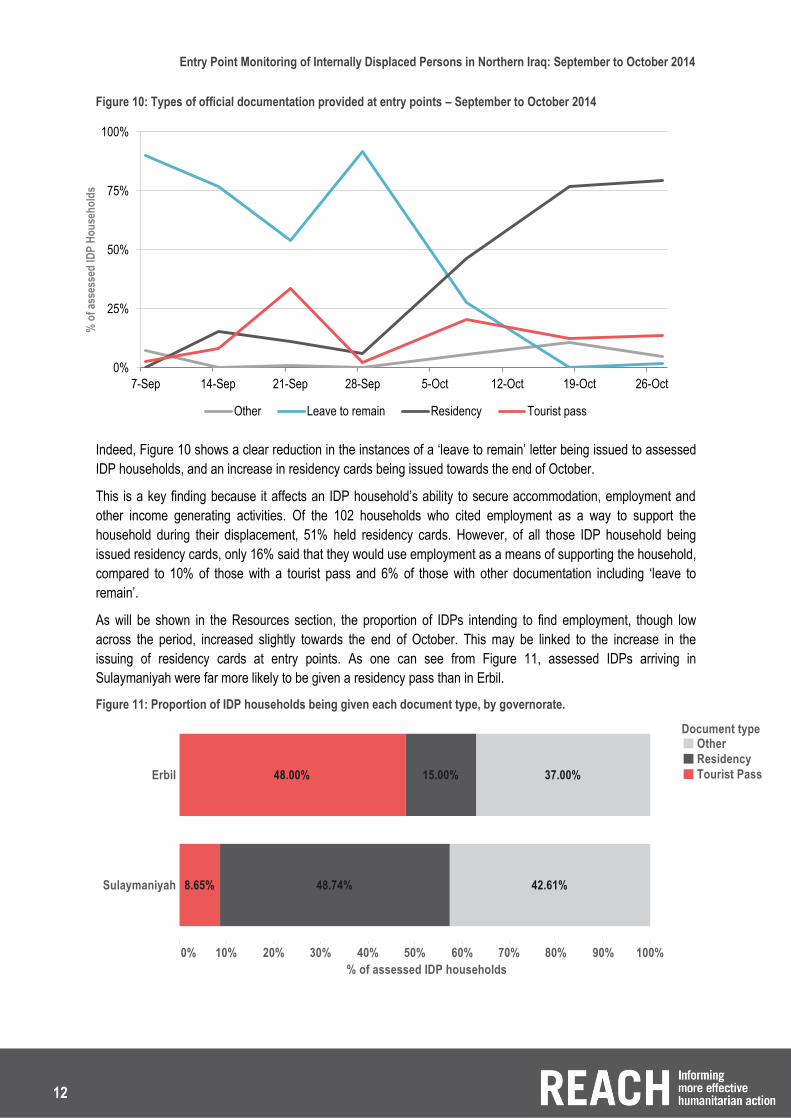
Figure 10: Types of official documentation provided at entry points – September to October 2014
Indeed, Figure 10 shows a clear reduction in the instances of a ‘leave to remain’ letter being issued to assessed
IDP households, and an increase in residency cards being issued towards the end of October.
This is a key finding because it affects an IDP household’s ability to secure accommodation, employment and
other income generating activities. Of the 102 households who cited employment as a way to support the
household during their displacement, 51% held residency cards. However, of all those IDP household being
issued residency cards, only 16% said that they would use employment as a means of supporting the household,
compared to 10% of those with a tourist pass and 6% of those with other documentation including ‘leave to
remain’.
As will be shown in the Resources section, the proportion of IDPs intending to find employment, though low
across the period, increased slightly towards the end of October. This may be linked to the increase in the
issuing of residency cards at entry points. As one can see from Figure 11, assessed IDPs arriving in
Sulaymaniyah were far more likely to be given a residency pass than in Erbil.
Figure 11: Proportion of IDP households being given each document type, by governorate.
0%
25%
50%
75%
100%
7-Sep 14-Sep 21-Sep 28-Sep 5-Oct 12-Oct 19-Oct 26-Oct
Other Leave to remain Residency Tourist pass
% o
f as
sess
ed ID
P H
ou
seh
old
s
Entry Point Monitoring of Internally Displaced Persons in Northern Iraq: September to October 2014
13
INTENTIONS
Planned alternative if unable to enter the KRI
One of the key research objectives was to understand what different IDP households’ alternative plans were in
the event that they were denied entry to the KRI.
The key finding of this assessment was that the vast majority of households (77% overall, compared to 35% in
July-August) planned to retry the same entry point. In July and August, the highest proportion of assessed IDPs
had said that they did not know where they would go (36%).14 This evolution is in line with more restrictive
policies regarding entry to the KRI for IDPs, implying that there are limited options available. As was seen in late
September, IDPs were ‘pooling’ around Sherawa entry point for 10 days.
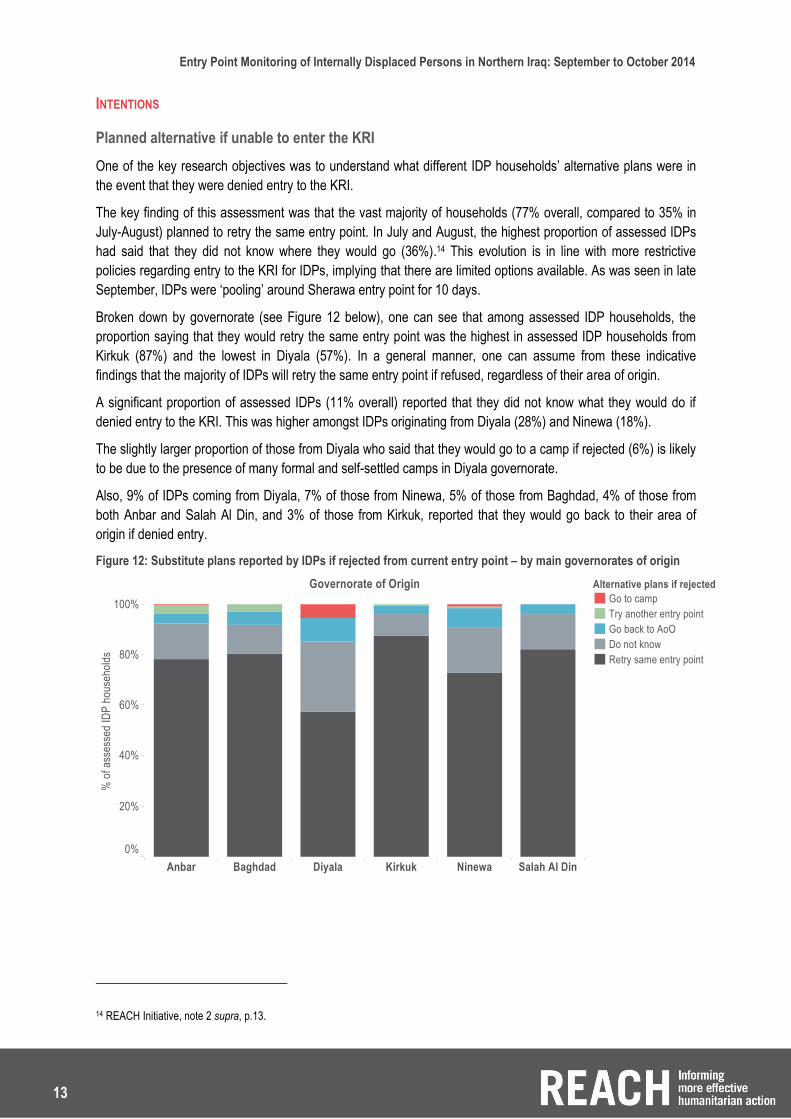
Broken down by governorate (see Figure 12 below), one can see that among assessed IDP households, the
proportion saying that they would retry the same entry point was the highest in assessed IDP households from
Kirkuk (87%) and the lowest in Diyala (57%). In a general manner, one can assume from these indicative
findings that the majority of IDPs will retry the same entry point if refused, regardless of their area of origin.
A significant proportion of assessed IDPs (11% overall) reported that they did not know what they would do if
denied entry to the KRI. This was higher amongst IDPs originating from Diyala (28%) and Ninewa (18%).
The slightly larger proportion of those from Diyala who said that they would go to a camp if rejected (6%) is likely
to be due to the presence of many formal and self-settled camps in Diyala governorate.
Also, 9% of IDPs coming from Diyala, 7% of those from Ninewa, 5% of those from Baghdad, 4% of those from
both Anbar and Salah Al Din, and 3% of those from Kirkuk, reported that they would go back to their area of
origin if denied entry.
Figure 12: Substitute plans reported by IDPs if rejected from current entry point – by main governorates of origin
14 REACH Initiative, note 2 supra, p.13.

Entry Point Monitoring of Internally Displaced Persons in Northern Iraq: September to October 2014
14
Those reporting that they would go back to their area of origin if denied entry dropped from 21% to 3% across the
nine weeks of data collection (see Figure 13 below). This contrasts highly with the previous months. Indeed,
across the reporting period of July to August, the proportion of assessed IDPs reporting that they would return to
their area of origin had increased from none in the first week of July to 53% at the end of August.15
This evolution may be due to the intensity of the conflict in Anbar increasing during September and October. The
sectarian nature of the conflict may be ruling out immediate return as an option for more and more households
from there.
Figure 13: Proportion of IDP households reporting alternative plans if denied entry to the KRI - September to October 2014.
Figure 13 also shows that across the reporting period, those reporting going to a camp as a planned alternative
dropped to none, while those intending to retry the same entry point increased from 36% at the end of August to
69% at the end of the October. Another key finding was the decline in those saying that they did not know, from
39% in the first week of the reporting period to 2% in the last week of October.
Therefore, the large proportion of assessed IDPs reporting that they would retry the same entry point indicates
the lack of options available to those travelling to the KRI due to the conflict – as well as the increased
awareness of this reality amongst IDPs.
Planned location
69% of those assessed at Erbil entry points were intending to travel to Erbil city and 22% to the outskirts of the
city. The vast majority (95%) of those assessed at Sulaymaniyah entry points did not have an intended
destination, compared to the 91% of those at Erbil entry points who did have a planned destination. This is likely
to be due to the closer ties between Erbil and the primary area of origin of assessed IDPs arriving there, which
was Ninewa. The fact that most assessed IDP households with an intended destination cited the city or its
outskirts tells us that more in depth assessments would be of use in urban non-camp settings.16
21 households were intending to travel to Kirkuk district in Kirkuk governorate. They all came from Mosul and
were assessed at Sheikh Abdul Qadir entry point in Erbil. 53% intended to rent accommodation and 38% to stay
with family and friends. The remainder did not know. 90% were given a tourist pass to transit through the KRI,
while 10% were issued a residency pass.
15 REACH Initiative, note 2 supra, p.14.
16 See forthcoming report: REACH Initiative, Multi Cluster Needs Assessment (forthcoming).

Entry Point Monitoring of Internally Displaced Persons in Northern Iraq: September to October 2014
15
Planned Accommodation
Overall, more than half of assessed IDP households (52%) intended to stay in a rented apartment or house, 17%
intended to stay with family and 16% did not know. Only 6% intended to stay in a hotel, 5% said that they would
stay in a collective centre such as a park or mosque and 1% in the open air (see Figure 14 below).
Figure 14: Accommodation arrangements intended by assessed IDPs - September to October 2014
Figure 15 below shows that a large majority of those assessed in Sulaymaniyah (70%) intended to rent,
compared to Erbil where the largest proportion (37%) intended to stay with family and only 16% intended to rent.
The Multi Cluster Needs Assessment conducted by REACH Initiative found that:
Half (50%) of the renting population do not have a written rental contract, placing them at risk of immediate
eviction. Moreover, the average rent reportedly paid amounts to nearly 400,000 IQD (344 USD), while many
families do not have a regular income to sustain this level of expenditure in the long run.17
Figure 15: Accommodation arrangements intended by IDPs - by governorate
At the KRI level, Figure 16 shows that throughout the nine weeks of data collection, the largest proportion of
assessed IDP households intended to rent an apartment or house, reaching a peak of 73% in the second week
of October. A key finding from the nine weeks of data collection was how few intended to stay in a collective
shelter or in the open air, from which we can say further assessments should focus on IDPs in urban non-camp
and non-collective shelter settings.
17 REACH Initiative, note 16 supra, p.11.
52% 17% 16% 6%
5%
4%
1%
0% 20% 40% 60% 80% 100%
Rent
Stay with family
Do not know
Stay in hotel
Collective shelter
Other
Open air
Entry Point Monitoring of Internally Displaced Persons in Northern Iraq: September to October 2014
16
0%
10%
20%
30%
40%
50%
60%
70%
80%
4-Sep 11-Sep 18-Sep 25-Sep 2-Oct 15-Oct 23-Oct 30-Oct
Own savings Employment Support from friends
Charitable donations No support
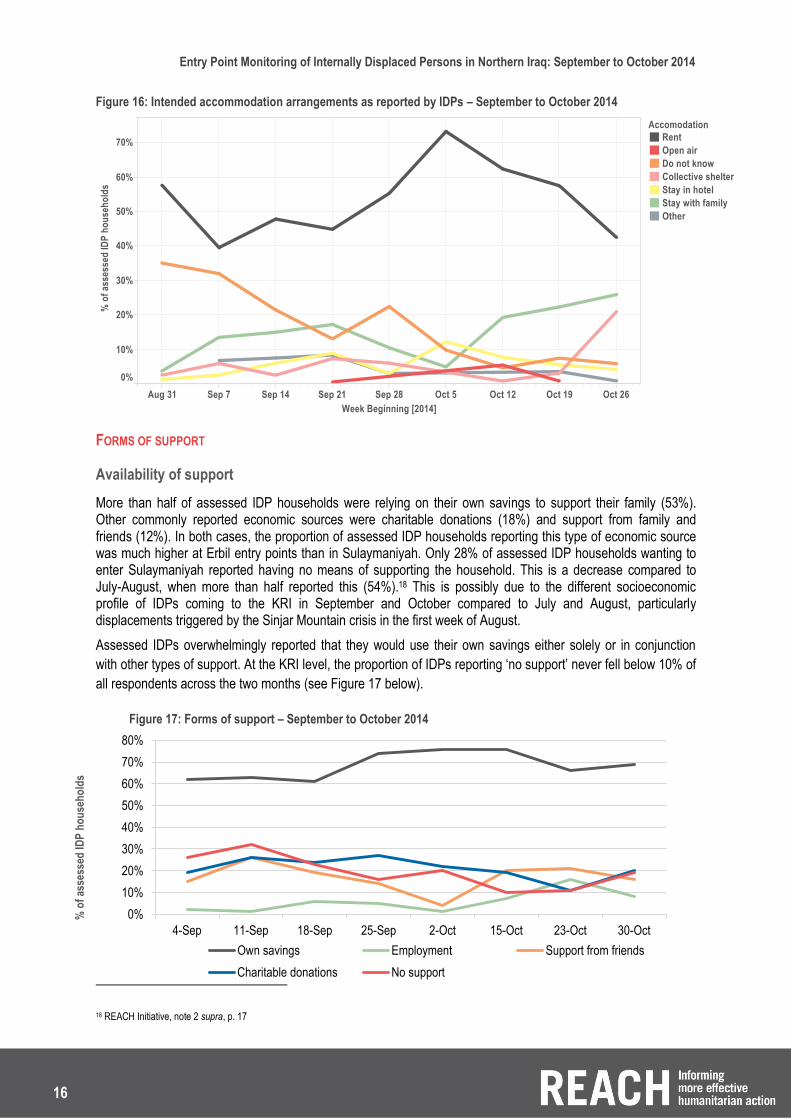
Figure 16: Intended accommodation arrangements as reported by IDPs – September to October 2014
FORMS OF SUPPORT
Availability of support
More than half of assessed IDP households were relying on their own savings to support their family (53%). Other commonly reported economic sources were charitable donations (18%) and support from family and friends (12%). In both cases, the proportion of assessed IDP households reporting this type of economic source was much higher at Erbil entry points than in Sulaymaniyah. Only 28% of assessed IDP households wanting to enter Sulaymaniyah reported having no means of supporting the household. This is a decrease compared to July-August, when more than half reported this (54%).18 This is possibly due to the different socioeconomic profile of IDPs coming to the KRI in September and October compared to July and August, particularly displacements triggered by the Sinjar Mountain crisis in the first week of August.
Assessed IDPs overwhelmingly reported that they would use their own savings either solely or in conjunction
with other types of support. At the KRI level, the proportion of IDPs reporting ‘no support’ never fell below 10% of
all respondents across the two months (see Figure 17 below).
18 REACH Initiative, note 2 supra, p. 17
% o
f as
sess
ed ID
P h
ou
seh
old
s
Figure 17: Forms of support – September to October 2014

Entry Point Monitoring of Internally Displaced Persons in Northern Iraq: September to October 2014
17
Figure 18 below - presenting the different types of support strategy that assessed IDP households reported they
would be using across the two months - shows that a different picture emerges at the governorate level.
Indeed, a far smaller proportion in Erbil reported ‘no support’, compared to a large proportion of those assessed
in Sulaymaniyah. Of those citing employment as a strategy for supporting the household, 50% had a residency
permit.
In every week, own savings were the most commonly reported means of supporting the household, with the
exception of the last week in October when, in Sulaymaniyah, this was exceeded by those replying ‘no support’
(45% compared to 27%).
Figure 18: Forms of support used by Governorate – September to October 2014
In the first week of September the types of support strategies reported by those in Sulaymaniyah were almost
exclusively either savings or that there was no support (50% and 48% respectively). This was contrasted in Erbil
where over 30% reported ‘support from family and friends’ and ‘charitable donations’ and none reported that they
had no support.
While this picture was very similar at the end of October in Erbil, in Sulaymaniyah we saw an increase in the
types of support reported by assessed IDPs, moving essentially from either ‘no support’ or using own savings to
a spread of different support strategies, where no single type of support was reported by more than 45%.
Livelihoods opportunities are essential for IDPs to prevent knock on effects such as eviction from rented
accommodation and negative coping strategies, as their reported means of supporting the household may not be
sustainable in the long run.
% o
f as
sess
ed ID
P h
ou
seh
old
s
% o
f as
sess
ed ID
P h
ou
seh
old
s
Entry Point Monitoring of Internally Displaced Persons in Northern Iraq: September to October 2014
18
Sustainability of support
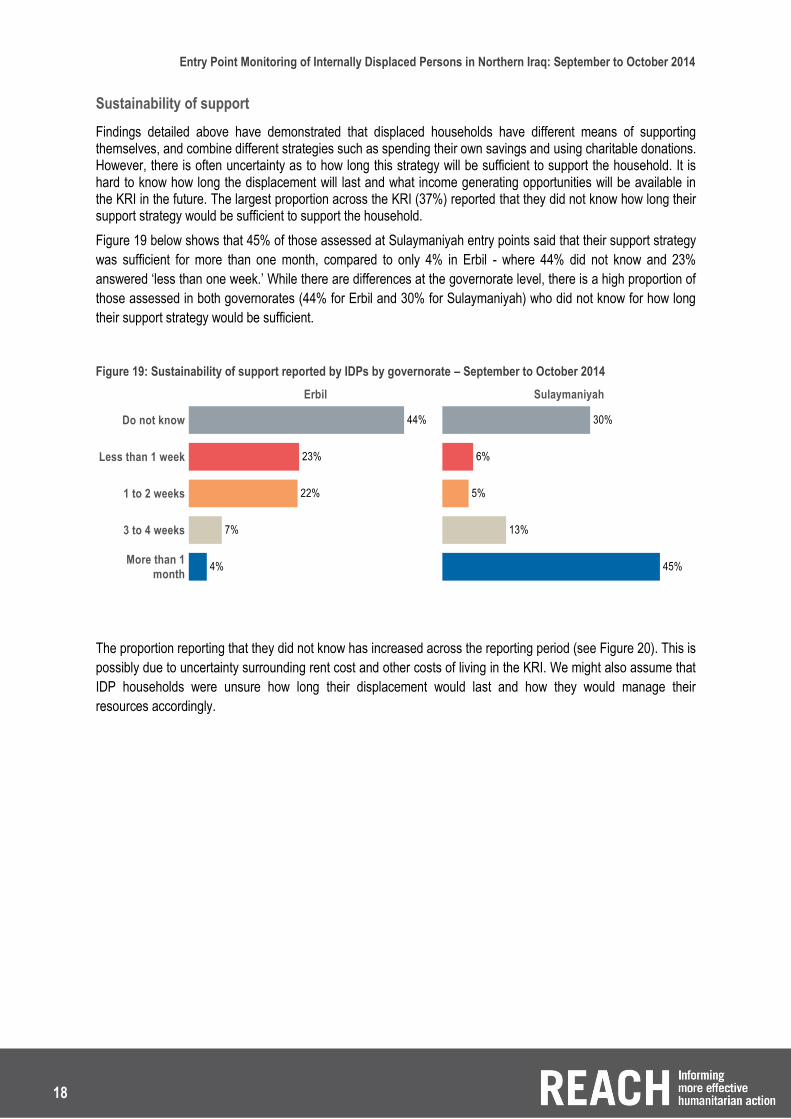
Findings detailed above have demonstrated that displaced households have different means of supporting themselves, and combine different strategies such as spending their own savings and using charitable donations. However, there is often uncertainty as to how long this strategy will be sufficient to support the household. It is hard to know how long the displacement will last and what income generating opportunities will be available in the KRI in the future. The largest proportion across the KRI (37%) reported that they did not know how long their support strategy would be sufficient to support the household.
Figure 19 below shows that 45% of those assessed at Sulaymaniyah entry points said that their support strategy
was sufficient for more than one month, compared to only 4% in Erbil - where 44% did not know and 23%
answered ‘less than one week.’ While there are differences at the governorate level, there is a high proportion of
those assessed in both governorates (44% for Erbil and 30% for Sulaymaniyah) who did not know for how long
their support strategy would be sufficient.
Figure 19: Sustainability of support reported by IDPs by governorate – September to October 2014
The proportion reporting that they did not know has increased across the reporting period (see Figure 20). This is
possibly due to uncertainty surrounding rent cost and other costs of living in the KRI. We might also assume that
IDP households were unsure how long their displacement would last and how they would manage their
resources accordingly.

Entry Point Monitoring of Internally Displaced Persons in Northern Iraq: September to October 2014
19
Figure 20: Sustainability of support - September to October 2014
Without sustainable income generating activities, it is very likely that many of the 52% of assessed IDP
households planning to rent an apartment or house in the KRI could face eviction if their support strategy is no
longer sufficient to afford the rent.
Entry Point Monitoring of Internally Displaced Persons in Northern Iraq: September to October 2014
20
CONCLUSION
IDP households seeking refuge in the Kurdistan Region of Iraq face uncertainty over many factors of their
displacement: how long it will last, what their options will be, how they will support the household and for how
long they will be able to do so.
While many households come to the KRI for its perceived greater security, they also largely intend to rent
accommodation there. This is unfortunately unsustainable in the long term if the household is unable to find
sufficient income generating activities. There will be a point in the mid to long term when many of the assessed
households who said that they planned to rent - and were largely using their own savings to support this - could
face eviction. This will not only be distressing for the household but will also contribute to rising social tensions
between IDPs and host communities.
Shocks and unexpected costs are a feature of displacement which can often be costly; we have seen one
example in this study of the extortionate price of travelling to Sulaymaniyah by taxi (300% increase across the
reporting period). This increases the factors about which households are uncertain during their displacement.
This report has seen a difference between profiles of assessed IDP households coming to Erbil and
Sulaymaniyah. Those coming to Sulaymaniyah largely planned to rent, using their own savings to support their
household but did not, on the whole, have a planned destination. Those travelling to Erbil were almost all from
Ninewa (Figure 2) and more likely to report that they would stay with friends and family, who would also be a
source of support for their household. This leads us to conclude that more assessed IDPs arriving in
Sulaymaniyah may face uncertainty as to where to go once inside the KRI and which community to live in.
It is essential to promote social cohesion between the host communities in the KRI and IDPs, particularly in the
area of sustainable livelihoods. Planned activities to meet this need include the provision of vocational and
business training for the host community and IDPs, as well as other activities including microfinance, grants,
cash assistance and market assessments.19
Further assessments can take key findings from this report as a basis for more in depth and on-going
assessments, particularly focusing on the needs of IDP households in urban non-camp settings within the KRI,
as well as IDPs who have been denied entry to the KRI and returned to their area of origin or have gone
elsewhere. Monitoring of entry points should continue on an ad hoc basis in case of sudden influxes of IDPs, but
also to assess numbers of returnees leaving the KRI in the mid to long term.
19 UN OCHA, Iraq: Strategic Response Plan 2014 / 2015 (28 Oct 2014) p. 48 - 49.