is the design of bonus-malus systems influenced by insurance maturity … · 2019-12-12 · is the...
TRANSCRIPT

Is the Design of Bonus-Malus Systems Influenced by
Insurance Maturity or National Culture?—Evidence
from Asia
Sojung C. Parka, Jean Lemaireb and Choong Tze ChuacaDepartment of Finance, Mihaylo College of Business and Economics, California State University,
P.O. Box 6848 Fullerton, CA 92834-6848, U.S.A.
E-mail: [email protected] of Insurance & Risk Management, Wharton School, University of Pennsylvania, 3620 Locust
Walk, 3404 Steinberg Hall-Dietrich Hall, Philadelphia, PA 19104-6218, U.S.A.
E-mail: [email protected] Kong Chian School of Business, Singapore Management University, 50 Stamford Road, #04-045,
178899 Singapore.
E-mail: [email protected]
Most Asian countries have adopted bonus-malus systems (BMS) in automobile insurance. Weevaluate the toughness towards consumers of 16 Asian BMS and its correlation with culturaland economic variables. We use principal components analysis to define a Maturity Index ofinsurance markets and find supporting evidence for a conjecture that, as markets becomemore mature and policy-holders more sophisticated, countries adopt tougher BMS. In addi-tion, we find, using regression analysis, that using a Common Law legal system is a crucialfactor in BMS design. Cultural variables, such as uncertainty avoidance, also influence BMS.The Geneva Papers (2010) 35, S7–S27. doi:10.1057/gpp.2010.37;published online 1 December 2010
Keywords: bonus-malus system; cultural impact; insurance market maturity
Background
Lemaire and Zi1 analysed 30 bonus-malus systems (BMS) from all over the world andused principal components analysis to create an Index of Toughness of BMS. Theyconcluded that the following two conjectures were valid for their sample:
(1) Conjecture #1: The design of a BMS is influenced by economic development. Moreadvanced countries tend to enforce tougher BMS. As insurance markets becomemore mature and policy-holders become more sophisticated, countries switch tomore severe BMS. BMS in developing countries are often embryonic, with just afew classes and very simple transition rules.
(2) Conjecture #2: Culture also seems to influence BMS design, as countries with similarGDP per capita may adopt very different BMS. Strong geographical patternsemerge from the ranking of BMS. Countries from Northern and Central Europe usethe toughest BMS. Asian countries for the most part adopt fairly mild BMS.
1 Lemaire and Zi (1994).
The Geneva Papers, 2010, 35, (S7–S27)r 2010 The International Association for the Study of Insurance Economics 1018-5895/10
www.genevaassociation.org

In this article we revisit these two conjectures, with particular emphasis on East andSouth Asia. This region of the world is of much interest, as it includes countrieswith strong and mature insurance markets (Japan, Singapore), markets expandingat a rapid pace (China, India), as well as emerging markets (Malaysia, Sri Lanka).Also, Asia is the only continent where national BMS are enforced in all countries.In other continents, individual insurers are able to devise their own BMS inseveral countries. The BMS and insurance markets of the following 16 Asian countriesare analysed: Bangladesh, China, Hong Kong, India, Indonesia, Japan, Kazakhstan,South Korea, Malaysia, Pakistan, Philippines, Singapore, Sri Lanka, Taiwan,Thailand and Vietnam. Principal components analysis and regression models arebuilt to explain the toughness of BMS by means of a set of economic andcultural variables to check whether, as conjectured by Lemaire and Zi, the designof BMS is related to the degree of maturity of markets and national culture. Inseveral countries (Philippines, Kazakhstan) insurers are considering implementinga BMS. In other countries (India, China) changes to the existing BMS arecontemplated. Results should help practitioners involved in BMS design to developsystems that correspond to their country’s level of development and cultural approachto insurance.
The coefficient of variation (CV) as measure of toughness of BMS
BMS need to have simple transition rules, easily understood by policy-holders.Certificates issued in case of an insurance company switch also need to be easy toestablish: they should not require the current insurer to collect the entire claims historyof the policy-holder. This explains why all BMS in force around the world can becharacterised as discrete Markov Chains. The first published treatment of BMSthrough Markov Chain theory is due to Franckx.2 A large set of references on theMarkov Chain analysis of BMS can be found in Lemaire.3
BMS can be studied from the insurer’s or the policy-holder’s perspective. MixedPoisson distributions have traditionally been used to model the insurer’s claim countprobabilities; mixing distributions that have been proposed include the Gamma,4 atwo-point discrete distribution,5 the Inverse Gaussian, Beta, Uniform, Pareto6 and theWeibull, Bessel, w2 and truncated Normal.7 The Poisson distribution has been usedexclusively to model individual policy-holder’s claim counts; it is used in this research.
Dozens of observed claim number distributions have been presented in the actuarialliterature. Articles that compare the goodness-of-fit of different models using severalobserved distributions include Denuit8 and Gossiaux and Lemaire.9 For claims
2 Franckx (1960).3 Lemaire (2004).4 Bichsel (1960).5 Derron (1963).6 Willmot (1986).7 Albrecht (1982).8 Denuit (1997).9 Gossiaux and Lemaire (1981).
The Geneva Papers on Risk and Insurance—Issues and Practice
S8

distributions pre-dating the first 1974 oil shock, observed means range between0.10 and 0.20. More recent distributions exhibit observed means between 0.07 and0.12, averaging 0.10. Therefore, in this article, we assume that the number of claims ofeach policy-holder follows a Poisson distribution with mean 0.10.
We evaluate the toughness of BMS by the CV of a policy-holder’s BMS premium,once the Markov Chain has reached stationary state. The CV, sometimes also called theUnitized Risk, is a normalised measure of risk, defined as the standard deviation (STD)divided by the mean of a random variable. Insurance researchers commonly use thismeasure to compare risk across lines of business. For instance, Buhlmann and Gisler10
find that claim size CVs for various lines range between 2.0 for household and motorhull insurance to 9.0 for motor liability and Workers’ Compensation (in case of accident)insurance. AON11 quantifies the systemic risk or volatility associated with each line ofbusiness for 17 countries comprising over 75 per cent of the world’s global premium.Risk is defined as the CV of the loss ratio of each book of business. CVs range between0.14 for private passenger auto insurance to 3.51 for financial guaranty insurance.
The CV is an appropriate measure to evaluate the toughness of BMS. It is adimension-less parameter, suitable for international comparisons as it is independent ofcurrency conversions. Without any form of BMS or experience rating, the variability ofthe annual premiums paid by a given policy-holder is zero (perfect solidarity). Withoutany kind of insurance, drivers need to pay all claims out-of-pocket, and the variabilityof payments, the variability of the claims process, attains its maximum value (nosolidarity). A BMS represents an intermediate situation, as annual premiums become arandom variable and personalised premiums vary according to claims history. The CVof the stationary annual premium consequently measures solidarity across policy-holders: the tougher the BMS, the higher the CV.
More importantly, the CV was found to be the best measure of toughness inLemaire and Zi.1 In that study the authors introduced four measures of toughness,summarised in an Index of Toughness using principal components analysis. The CVwas found to be by far the best single measure of toughness, with a correlation of 0.97with the composite Index of Toughness.
The BMS in force (as of June 2008) in all 16 Asian countries are summarised inAppendix B. Table 1 ranks these countries according to CV. Note that Kazakhstanand the Philippines do not currently use a BMS.
This ranking is certainly surprising. Few would expect that Bangladesh and SriLanka, two of the poorest countries in our database, would adopt the toughest BMSin Asia. Bangladesh and Sri Lanka both have very severe penalties in case of a singleclaim. In Bangladesh, the transition rules of the BMS send any policy-holder withone claim to premium level 130, irrespectively of the current class; the premium levelfrom a best-class driver will increase from 50 to 130, a 160 per cent increase, after justone claim. Sri Lankan transition rules are hardly more lenient: drivers from thebottom three classes, at premium levels 30, 35 and 40, move up three classes afterone claim. Drivers in all other bonus classes, at premium levels 45–95, lose their entire
10 Buhlmann and Gisler (2005).11 AON (2008).
Sojung C. Park et alIs the Design of BMS Influenced by Insurance Maturity or National Culture?
S9

accumulated bonus after one claim and are sent back to the starting class, at level 100.This initial result appears to contradict Lemaire and Zi’s conjecture #1, that tougherBMS are found in the most developed countries, but we explore further statisticalstudies, based on principal components and regression analyses.
Factors influencing the toughness of BMS
According to Lemaire and Zi, BMS design is linked to insurance “maturity”, anabstract, qualitative concept, that we approach by defining several variables that areintuitively related. Insurance markets are probably more mature in richer countries, incountries where a large fraction of the GDP is devoted to insurance, in countries wherea large number of companies compete. Sophisticated BMS are in force in countrieswith developed insurance markets; development can be slowed by political, financialand economic risk: nations with little risk are more attractive to foreign investment.Also, it is likely that some cultures are more prone to the development of insurancethan others; in some countries, there are alternative ways than insurance to reducelife’s uncertainties, for instance, a developed family kin system.12 This leads to thedefinition of several variables that are probably correlated with the maturity ofinsurance markets—hence to the severity of BMS. The study uses 2005 data, the latestavailable for some variables.
The non-life insurance density, at Purchasing Power Parity (PPP)
In its annual study of world insurance markets, the Swiss Reinsurance Company13
ranks 88 countries according to Non-Life Insurance Density, defined as the premium
Table 1 CV for all 16 Asian countries
Country CV
Bangladesh 0.5053
Sri Lanka 0.4041
Malaysia 0.3092
Hong Kong 0.2950
Taiwan 0.2805
Singapore 0.2298
Korea 0.2032
India 0.1480
China 0.1322
Japan 0.0831
Indonesia 0.0824
Pakistan 0.0808
Thailand 0.0779
Vietnam 0.0748
Kazakhstan 0.0000
Philippines 0.0000
12 Chui and Kwok (2008).13 Swiss Reinsurance Company (2006).
The Geneva Papers on Risk and Insurance—Issues and Practice
S10
per capita, in U.S. dollars. To better reflect differences in purchasing power, a PPPcorrection has been applied to the non-life insurance premium density. Premiumsper capita can be converted to U.S. dollars either using market currency exchangerates, or at PPP. The use of market rates can lead to misleading conclusions whencomparing per-capita living conditions across countries. Economists prefer to correctthe data by a PPP factor that attempts to reflect the differences in prices and servicesbetween a country and the United States. The PPP correction can be significant; forinstance, the uncorrected Gross Domestic Product (GDP) per capita in Chinatranslates, at the official exchange rate, to US$1,708. A PPP correction factor of3.9816 increases the GDP to US$6,800, a better indication of standards of living inChina. (Source: CIA World Factbook, www.cia.gov)
The non-life insurance penetration
This measure also comes from the Swiss Reinsurance Company annual study: non-lifeinsurance premiums, as a percentage of GDP.
Market concentration
A mature insurance market is expected to have many insurers freely competing forcustomers, thus a low market concentration. We measure concentration with amodified Herfindahl Index, defined as the sum of the squared market shares of the tenlargest non-life insurers (Source: Axco Insurance Markets Report14 and InternationalFact Book: www.internationalinsurance.org/international/toc/).
The number of actuaries per 100,000 inhabitants
A large number of actuaries in a country is indicative of insurance sophistication anddevelopment. In addition, actuaries are instrumental to the design of BMS (Source:International Actuarial Association, www.actuaries.org, for number of actuaries andU.S. Census Bureau, www.census.gov/ipc/www/idb/ranks.html, for population data).
The GDP per capita, at PPP
More affluent countries, as measured by GDP per capita at PPP, are likely to havemore mature insurance market (Source: CIA World Factbook, www.cia.gov).
The political risk index
Nations where there is little political and investment risk are more likely to havemature insurance markets, as the financial environment is more conducive to foreigninvestment, and financial contracts such as insurance policies are easier to enforce. ThePolitical Risk Services Group publishes an International Country Risk Guide, rating
14 Axco Insurance Markets Report (2007).
Sojung C. Park et alIs the Design of BMS Influenced by Insurance Maturity or National Culture?
S11

most nations around the world according to political, financial and economic risk. ThePolitical Risk Index (that could also be called the Risk Index for InternationalBusiness) is the outcome of a statistical risk model that analyses the potential risks ofinternational business operations. Countries receive scores on 12 risk components:
� Government stability (government unity, legislative strength, popular support);� Socioeconomic conditions (unemployment, consumer confidence, poverty);� Investment profile (contract viability, expropriation risk, profit repatriation,
payment delays);� Internal conflict (civil war threat, political violence, civil disorder);� External conflict (war, cross-border conflict, foreign pressures);� Corruption;� Military in politics;� Religious tensions;� Law and order (strength and impartiality of judicial system, popular observance of
the law);� Ethnic tensions;� Democratic accountability;� Bureaucratic quality.
Total scores range between 0 and 100, with 100 representing a very low degree ofpolitical risk (Source: www.prsgroup.com).
Not only the maturity of the insurance industry, but also other factors such asculture and history, may impact BMS design. Hence we introduce two non-economicvariables that may influence BMS.
Uncertainty avoidance
In a celebrated study, Hofstede15 analysed the answers of 117,000 cultural surveyquestionnaires collected within subsidiaries of a large multinational businessorganisation, in 66 countries. Four cultural dimensions of national culture emergedfrom the study:
� Power distance: measures how societies react to human inequality;� Individualism: describes the relationship between the individual and the collectivity
prevailing in a given culture;� Masculinity: evaluates whether biological gender differences impact roles in social
activities;� Uncertainty avoidance: scores tolerance for uncertainty.
Different societies, and business organisations within societies, react differently touncertainties about the future and the resulting anxiety and need for security. Theytry to cope with risk by introducing laws, rules, regulations, religion and technology.Uncertainty-avoiding societies promote employment stability, select managers on the
15 Hofstede (2001).
The Geneva Papers on Risk and Insurance—Issues and Practice
S12
basis of seniority, are suspicious towards foreigners as managers, and rely excessivelyon external consultants. Uncertainty-avoiding individuals purchase more mineralwater and fresh fruits, buy their cars new, avoid “do-it-yourself” large projects athome, and prefer skill and strategic games over games of chance.
There is some evidence that uncertainty avoidance impacts financial markets.De Mooij16 finds that individuals residing in high uncertainty avoidance countriesinvest less in stocks and more in goods. Kwok and Tadesse17 show that financialsystems are more likely to be bank-based in high uncertainty avoidance countries, andmarket-based (relying on stockmarkets) in low uncertainty avoidance countries.
While the management concept of uncertainty avoidance is not identical toinsurance researchers’ notion of risk aversion, it is certainly correlated. It representsthe best available international measure of attitudes towards risk across countries, andis used in our analysis to explore the possible impact of cultural attitudes in thetoughness of BMS. High uncertainty avoidance countries are likely to have milderBMS because tough BMS means more risk in future premiums.
A high score on this measure characterises uncertainty-avoiding societies, suchas Japan and Korea. China, Hong Kong and Singapore receive the lowest scores inAsia.
Commonwealth countries
While every country has its own specific legal rules, scholars broadly subdivideall legal systems of the world in two families. Civil Law systems originated withRoman Law and the Napoleonic Code, and were spread around the world byFrance through conquest, colonisation, cultural dominance and imitation. CommonLaw systems are based on British law, and are in force in the countries that werecolonised or heavily influenced by the British. Seven of the 16 Asian countriesunder study are former British colonies, and are members of the Commonwealthof Nations. Their legal system is based on Common Law. The other countriesuse Civil Law. The classification used in this research is based on Reynolds andFlores.18 Out of the 16 Asian countries included in our database, eight use a Civil Lawsystem.
The legal system in force in a country may impact the development of insurance, asit specifies the liabilities of those responsible of damage, and defines the businessenvironment of insurance companies.19 For instance, the United States leads the worldin per capita consumption of liability insurance. The American legal system may bea contributing factor, by encouraging Americans to over-consume property-liabilityinsurance.20
16 De Mooij (1998).17 Kwok and Tadesse (2006).18 Reynolds and Flores (1998).19 Browne et al. (2000).20 Syverud et al., 1994).
Sojung C. Park et alIs the Design of BMS Influenced by Insurance Maturity or National Culture?
S13

An index of insurance maturity
Due to the fairly low number of observations and high correlations between somevariables, to avoid possible multicollinearity problems we construct an Index ofInsurance Maturity using principal components analysis based on our first fourmeasures, the insurance industry-oriented variables: insurance density and penetra-tion, market concentration, and number of actuaries (GDP and Political RiskIndex will be used as alternative measures of insurance market maturity later in theanalysis).
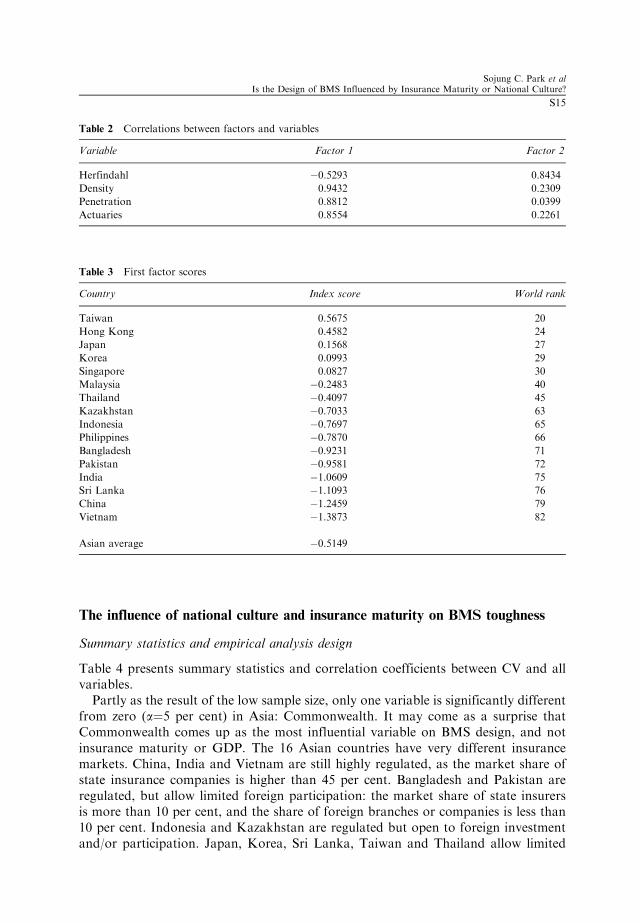
We do not need to limit our sample to Asian countries to construct our InsuranceMaturity Index: a larger sample will improve the efficiency of the principal componentanalysis and improve the significance of explanatory variables. Furthermore, a largersample will enable us to compare the insurance market maturity of Asia to markets inother continents. Therefore, we use worldwide data (82 countries)21 to construct theInsurance Maturity Index. The first principal component, providing an excellentsummary of the four variables by explaining 66.95 per cent of the total variance, is ourIndex of Insurance Maturity.22 Table 2 presents the correlation coefficients betweenthe first two factors and the four selected variables.
Where do Asian countries rank in the world? Table 3 presents the factor score of all16 Asian countries, in decreasing order, and their worldwide rank.
Taiwan ranks highest among Asian countries on this Index. Taiwan has enjoyedan open, competitive market for many years, as 31 non-life insurance offices operatedin the country in the colonial period. In 1995, restrictions on foreign investment injoint ventures were eliminated, and the market opened to insurers from allnationalities. Privatisation was fully completed in 2002 with the revocation of theCentral Reinsurance Act. Competition is intense, as Taiwan is a closed market withlittle new business, and more capacity available than is required to support theneeds of the domestic industry. Further examples of insurance maturity include aResidential Earthquake Insurance Pool and a Nuclear Pool. This open market hasmade Taiwan the 13th largest market in the world, quite a performance given that itspopulation is only 23 million.14 With 16.2 per cent, Taiwan ranks first in the worldin overall insurance penetration, well ahead of the other mature Asian markets:South Korea (5th), Hong Kong (6th), Japan (9th) and Singapore (17th).
The average of the 16 Asian scores is �0.5149. As worldwide scores have a mean of0 and a STD of 1, we reach a first conclusion:
Conclusion 1: Asia mostly ranks low on the Index of Maturity. Only five out of 16Asian countries receive a positive score. The most mature Asian market, Taiwan, onlyranks 20th. Six Asian countries rank in the bottom 12.
21 Swiss Re’s density and penetration data was available for those 88 countries that registered premium
volumes of at least US$ 347m in 2006. Data for six of those countries was not available from the Axco
International Fact Book, resulting in 82 countries included in our sample.22 The second component explains about 20.44 per cent of the variation and it is highly correlated with
market concentration. It appears to be uncorrelated with insurance maturity.
The Geneva Papers on Risk and Insurance—Issues and Practice
S14
The influence of national culture and insurance maturity on BMS toughness
Summary statistics and empirical analysis design
Table 4 presents summary statistics and correlation coefficients between CV and allvariables.
Partly as the result of the low sample size, only one variable is significantly differentfrom zero (a¼5 per cent) in Asia: Commonwealth. It may come as a surprise thatCommonwealth comes up as the most influential variable on BMS design, and notinsurance maturity or GDP. The 16 Asian countries have very different insurancemarkets. China, India and Vietnam are still highly regulated, as the market share ofstate insurance companies is higher than 45 per cent. Bangladesh and Pakistan areregulated, but allow limited foreign participation: the market share of state insurersis more than 10 per cent, and the share of foreign branches or companies is less than10 per cent. Indonesia and Kazakhstan are regulated but open to foreign investmentand/or participation. Japan, Korea, Sri Lanka, Taiwan and Thailand allow limited
Table 2 Correlations between factors and variables
Variable Factor 1 Factor 2
Herfindahl �0.5293 0.8434
Density 0.9432 0.2309
Penetration 0.8812 0.0399
Actuaries 0.8554 0.2261
Table 3 First factor scores
Country Index score World rank
Taiwan 0.5675 20
Hong Kong 0.4582 24
Japan 0.1568 27
Korea 0.0993 29
Singapore 0.0827 30
Malaysia �0.2483 40
Thailand �0.4097 45
Kazakhstan �0.7033 63
Indonesia �0.7697 65
Philippines �0.7870 66
Bangladesh �0.9231 71
Pakistan �0.9581 72
India �1.0609 75
Sri Lanka �1.1093 76
China �1.2459 79
Vietnam �1.3873 82
Asian average �0.5149
Sojung C. Park et alIs the Design of BMS Influenced by Insurance Maturity or National Culture?
S15

Table
4Summary
statistics;correlationsbetweenCV
andmain
variables
Variable
Mean
Mean
STD
STD
MIN
MIN
MAX
MAX
Corr
Corr
Asia
Europe
Asia
Europe
Asia
Europe
Asia
Europe
Asia
Europe
Density
231.02
531.99
282.31
190.17
3.8553
253.34
871.27
839.23
0.1542
0.3365
Penetration
1.26
3.08
0.8549
0.5767
0.2
2.2
2.98
40.0729
0.2538
Herfindahl
0.1167
0.0592
0.1014
0.0488
0.0367
0.0034
0.3382
0.1612
�0.0885
0.1352
Actuaries
0.71
4.57
1.6268
2.9819
0.0013
0.3973
6.1601
10.86
0.2412
0.2291
Maturity
index
�0.8426
1.9679
1.0238
1.2438
�2.2704
0.0803
0.9288
4.2697
0.1855
0.3405
GDP
12,469
20,368
11,459.54
5,618.44
2,100
12,568.5
32,900
35,687.79
0.1481
0.0488
Politicalrisk
65.92
85.34
12.60
6.1088
44.71
70.08
83.75
93
�0.0983
0.6551
Uncertainty
avoidance
52.50
63.36
25.05
24.41
823
95
104
�0.2484
�0.5292
Commonwealth
0.4375
0.0714
0.2673
0.5123
00
11
0.6268
�0.0533
The Geneva Papers on Risk and Insurance—Issues and Practice
S16

foreign participation. Hong Kong, Malaysia, Philippines and Singapore have totallyopened their markets. It is then unexpected that a single factor—participation in theCommonwealth of Nations—drives the toughness of BMS.
We conjecture that there could be two possible explanations for this. The first isthat, according to legal research, Common Law is more conducive to economicdevelopment, with the consequence that Commonwealth countries may implementmore efficient and more severe BMS. The second explanation is that BMS wereintroduced much earlier in Britain than in Continental Europe; upon achievingindependence, former British colonies had well-established BMS in place, while formercolonies of Continental European powers had no BMS (or embryonic BMS) and hadother priorities in developing their insurance markets than devising tough BMS. In theDiscussion section, we discuss these two possible explanations in more detail.
In order to investigate whether the strong correlation between CV andCommonwealth is due to their legal system or a historical reason, we introduce aninteraction variable (Insurance Maturity�Commonwealth) in our regression ana-lyses. If the historical explanation is true (British BMS were in place at independence),we should find a stronger Commonwealth effect among countries with less matureinsurance market. Advanced countries modify their BMS now and then to adapt tochanging driving conditions, while developing countries do not consider BMS ratingto be a crucial part of their insurance system. Consequently, we expect the poorerformer colonies of Britain to have left their BMS mostly unchanged, while Britain0sinfluence on BMS should have progressively dissipated in Asia’s mature markets. Onthe other hand, if a Common Law system is the reason for the strong correlation, itsimpact will be similar for all countries, advanced or not, and we do not expect to find asignificant effect on this interaction variable.
Results of regression analyses for Asian countries
In this section, regression analyses are presented to help us understand the factors drivingthe design of a BMS. First, we run a regression model with CV as dependent variable andthe Insurance Maturity Index, Uncertainty Avoidance, Commonwealth, and theinteraction term as explanatory variables (regression 1 in Table 5). Alternatively, we alsorun models with GDP and Political Risk Index, respectively, as economic developmentmeasures instead of Insurance Maturity Index (regressions 2 and 3 in Table 5). We do notinclude these three variables simultaneously due to their high correlations. As ourdependent variable, CV, cannot take negative values, we run Tobit models.23
The regression coefficients of Insurance Maturity Index, GDP and Political Risk,are all positive: the Lemaire and Zi conjecture that more mature insurance markethave tougher BMS receives ample support. Noteworthy is the result that the mainfactor impacting the design of a BMS is the legal system: positive regressioncoefficients in all specifications imply that Commonwealth countries tend to use
23 We also run the same model using OLS, and a model treating Kazakhstan and Philippines as missing
countries, rather than countries with a CV equal to zero. Alternative regression models are presented in
Appendix A.
Sojung C. Park et alIs the Design of BMS Influenced by Insurance Maturity or National Culture?
S17

tougher BMS. The joint test F-statistic for Commonwealth and the interaction termshows significance in all models; the negative regression coefficient suggest that theimpact of Commonwealth membership is weak in mature insurance markets, andmostly impacts poorer countries. This supports the historic hypothesis of theCommonwealth’s impact on BMS.
Conclusion 2: As markets become more mature and policy-holders more sophisticated,countries adopt tougher BMS. BMS should evolve over time, to properly reflectchanging economic conditions. Economic development leads to increased traffic, anda decrease in accident claim frequencies. Insurers should respond to thesedevelopments by enforcing tougher BMS, penalizing more claims at-fault, whichwould enable them to provide higher discounts to better drivers.
Conclusion 3: Common Law legal systems, in force in former British colonies, appearto be a major contributing force to BMS design, especially in poorer countries.
Results of regression analyses for expanded data set
In Table 5, the cultural variable, uncertainty avoidance, has the predicted sign, but isnot significant. This may be due to the limited sample size. In order to achieve a better
Table 5 Regression results: Asian countries
Regression variable (1) (2) (3)
Maturity index GDP Political risk
Commonwealth 0.0205 0.3157*** 0.2813
(0.18) (3.50) (0.73)
Uncertainty avoidance �0.0027 �0.0027 �0.0002(�1.37) (�1.36) (�0.12)
Maturity index 0.1032*
(2.10)
GDP 0.0101*
(2.10)
Political risk 0.0004
(0.10)
Interaction �0.1422 �0.0142* �0.0014(�1.74) (�1.87) (�0.23)
Constant 0.3348** 0.1214 0.0720
(2.21) (1.24) (0.25)
Number of observation 16 16 16
LR chi2 11.88 12.02 7.79
Prob>chi2 0.0183 0.0172 0.0995
Joint test F-value for commonwealth and interaction 6.23** 6.61** 3.73*
Note: t-statistics are in parentheses. *** significant at 1 per cent, ** significant at 5 per cent, * significant at
10 per cent.
The Geneva Papers on Risk and Insurance—Issues and Practice
S18
significance of variables, we pool our Asian data with the European data fromLemaire and Zi1. So, in this section, our models incorporate 16 Asian BMS in force in2008, and the 14 European BMS in force in 1992.24
We understand that there could be systematic differences between Asia and Europe(continent effect), as well as between 2008 and 1992 (year effect). However, since all2008 data is from Asian countries and all 1992 data is from European countries,a single dummy variable is sufficient to capture both continent and year effects. Withthe inclusion of this dummy variable, we are able to control for the systematicdifferences between Europe in 1992 and Asia in 2008, if any. This enables us to poolthe two data sets and enhance the explanatory power of other variables of interest.
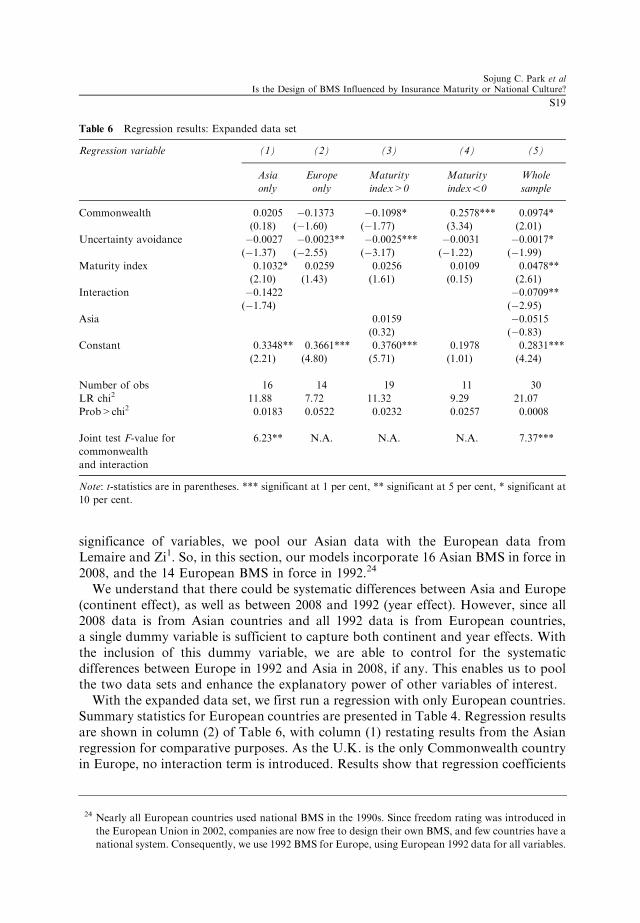
With the expanded data set, we first run a regression with only European countries.Summary statistics for European countries are presented in Table 4. Regression resultsare shown in column (2) of Table 6, with column (1) restating results from the Asianregression for comparative purposes. As the U.K. is the only Commonwealth countryin Europe, no interaction term is introduced. Results show that regression coefficients
Table 6 Regression results: Expanded data set
Regression variable (1) (2) (3) (4) (5)
Asia
only
Europe
only
Maturity
index>0
Maturity
indexo0
Whole
sample
Commonwealth 0.0205 �0.1373 �0.1098* 0.2578*** 0.0974*
(0.18) (�1.60) (�1.77) (3.34) (2.01)
Uncertainty avoidance �0.0027 �0.0023** �0.0025*** �0.0031 �0.0017*(�1.37) (�2.55) (�3.17) (�1.22) (�1.99)
Maturity index 0.1032* 0.0259 0.0256 0.0109 0.0478**
(2.10) (1.43) (1.61) (0.15) (2.61)
Interaction �0.1422 �0.0709**(�1.74) (�2.95)
Asia 0.0159 �0.0515(0.32) (�0.83)
Constant 0.3348** 0.3661*** 0.3760*** 0.1978 0.2831***
(2.21) (4.80) (5.71) (1.01) (4.24)
Number of obs 16 14 19 11 30
LR chi2 11.88 7.72 11.32 9.29 21.07
Prob>chi2 0.0183 0.0522 0.0232 0.0257 0.0008
Joint test F-value for
commonwealth
and interaction
6.23** N.A. N.A. N.A. 7.37***
Note: t-statistics are in parentheses. *** significant at 1 per cent, ** significant at 5 per cent, * significant at
10 per cent.
24 Nearly all European countries used national BMS in the 1990s. Since freedom rating was introduced in
the European Union in 2002, companies are now free to design their own BMS, and few countries have a
national system. Consequently, we use 1992 BMS for Europe, using European 1992 data for all variables.
Sojung C. Park et alIs the Design of BMS Influenced by Insurance Maturity or National Culture?
S19

of Asian and European countries are somewhat different. First, Commonwealth is notan important factor in Europe; even the sign of the Commonwealth variable isdifferent in the two models. Second, while the regression coefficients for uncertaintyavoidance in the Asian and European models are similar, the variable is onlystatistically significant in Europe. That is, countries with higher uncertainty avoidancehave significantly milder BMS in Europe.
The different results for Asia and Europe may simply be due to the fact thatEuropean markets are generally more mature. To explore this possibility, we run aregression for countries with a positive Maturity Index (regression 3, Table 6). Thisamounts to adding five Asian countries (Hong Kong, Japan, South Korea, Singaporeand Taiwan) to the European group. Regression coefficients hardly change andbecome more significant, adding robustness to our conclusions. The dummy variableAsia, added to capture the year and continent effect, has no significant effect.Uncertainty avoidance remains a highly significant explanatory variable, furtherdemonstrating the importance of cultural aspects in BMS design in mature markets.
Another regression for countries with a negative Maturity Index (regression 4,Table 6) markets further demonstrates the importance of Commonwealth for poorercountries, supporting the historic influence hypothesis that poor Commonwealthcountries inherited a BMS that they hardly changed since independence.
Finally, another regression for all 30 countries is presented (regression 5, Table 6), thatincludes an interaction term (Commonwealth�Maturity Index) to capture the differen-tial effect of Commonwealth on more and less mature markets. Results are consistentwith previous findings: BMS toughness is associated with Commonwealth, uncertaintyavoidance and insurance market maturity. A strong Commonwealth effect only appearsamong less mature markets, further supporting the historic influence hypothesis.
Discussion
The main conclusion of the previous section is that—perhaps surprisingly—a legalsystem based on Common Law, characteristic of Commonwealth countries, is a maincontributor to the enactment of tougher BMS. We provide two possible explanations,based on insurance history and characteristics of legal systems. Our regressionanalyses support the historical explanation.
Possible superiority of common law legal systems
In Civil Law countries, legislation is the primary source of law. Civil Law is based on acode that specifies main principles, and on new statutes passed by legislature to amendthe existing code. Courts base their decisions on the provisions of codes and statutes.Judicial precedent is given little weight. By contrast, individual cases are the primarysource of Common Law. Laws develop through court decisions rather than throughstatutes. Judges create and refine the law: when a new situation arises, judges havethe authority to make law, and so create a precedent that binds future decisions.Proponents of Civil Law claim that systematic codification is conducive to certaintyand unity. Opponents fear that codification results in the ossification of the law. They
The Geneva Papers on Risk and Insurance—Issues and Practice
S20

claim that Common Law is more adaptable to new trends because it responds, case bycase, to the changing needs of society; judges progressively reinterpret the law thatevolves through a series of progressive steps.
Some legal research claims that Common Law is more conducive to economicdevelopment than Civil Law. La Porta et al.25 uses regression analysis to show thatCommon Law countries generally have higher law enforcement quality and strongerlegal protections of creditors and investors. Min26 argues that Common Law’s relianceon judicial opinion may contribute to commercial growth. Precedents providereasonable guidance on issues and more certainty of outcome in case of a dispute,so parties can predict whether a proposed action is likely to be lawful. By contrast, inCivil Law countries, consistency is not guaranteed, judges must rule anew on eachissue; parties cannot rely on a large body of precedents. As a result Common Lawcountries adapt more rapidly to changing conditions and new opportunities.27
Insurance may be a textbook example of the ossification of laws in Civil Lawcountries and adaptability in Common Law systems. Until the 2002 rating freedommandated by EU directives, insurers in most Continental European countries operatedunder a system of compulsory premiums approved by governmental authorities, withlittle room for creativity and competition. By contrast, British insurers have alwaysenjoyed full rating freedom and little supervision from the Department of Trade andIndustry.28 British policy-holders have always been offered a considerable diversity ofmotor insurance products, with each insurer free to decide on its own rating structuresand on premium relativities within these structures.
The creativity and adaptability allowed by Common Law systems is also evident inBMS design. Continental European insurers have tried to maintain uniform nationalBMS as long as possible after the 2002 laws. France and Luxembourg even won courtcases allowing them to keep a common BMS for all companies. British insurers havetaken advantage of the flexibility allowed by Common Law to offer different BMS;their policy-holders at one point were able to choose among more than 50 differentsets of transition rules and premium levels. British insurers were also the first tointroduce a “protection clause” in their BMS, allowing partial or total forgiveness ofthe first accident at-fault.
Historical development of BMS
In a summary of the development through time of BMS, Lemaire3 mentions thatBritish insurers introduced simple merit-rating systems in auto insurance as early asthe 1910s, while Continental European companies mostly developed their BMS in the1960s, following early ASTIN work (among others see Bichsel4, Buhlmann29 andDelaporte30). Consequently, when they became independent after World War II, it is
25 La Porta et al. (1998).26 Min (2006).27 Posner (2004).28 Johnson (1985).29 Buhlmann (1964).30 Delaporte (1965).
Sojung C. Park et alIs the Design of BMS Influenced by Insurance Maturity or National Culture?
S21

likely that Commonwealth countries had well-established, fairly severe BMS in place.Former colonies of Continental European countries, on the other hand, probably hadno BMS in place at independence, given that their colonial power had yet toimplement such systems (or only used embryonic systems).
Any change in BMS is usually strongly impacted by the existing situation: it israrely the case that a completely new BMS is introduced, without any considerationto the previous system. More often than not, the change is evolutionary: strongertransition rules are enacted, super-discount bonus classes are added, a protectionscheme is introduced. Consequently, it is probable that current BMS in someAsian Commonwealth countries do not deviate very much from the systems inforce at independence. On the other hand, non-Commonwealth countries, thatlikely had no BMS in place at independence, needed to devise their own system.Since BMS design in these emerging insurance markets was not a high-priority task,it is not surprising that non-Commonwealth countries implemented fairly mildBMS.
Our results offer support to the historical explanation. Affluent countries, whetherin Europe or Asia, belonging to the Commonwealth or not, regularly change theirBMS to end up with a system that corresponds to their insurance maturity and culturalapproach to insurance. Poorer countries do not consider BMS design as an importantrating tool and keep their existing system; former British colonies inherited toughBMS that they hardly changed. Former colonies of Continental European powers didnot inherit a BMS tradition, and implemented no BMS or a mild BMS. Examplesabound: the Lemaire and Zi study mentions nine affluent countries that changed theirBMS in the early 1990s. Japan changed its BMS three times in the 1980s, three times inthe 1990s, and then again in 2004. In 1992, Singapore and Malaysia shared the sameBMS; the richer of these two countries, Singapore, has changed its BMS since, whileMalaysia has not.
Acknowledgements
This research was funded in whole by the Wharton-SMU Research Center at Singapore Management
University. Many thanks to Axco and the many colleagues—too numerous to be cited individually—who
helped us build the database for this project.
References
Albrecht, P. (1982) ‘On some statistical methods connected with the mixed Poisson distribution’,
Scandinavian Actuarial Journal, 1–14.
AON (2008) ‘Aon Insurance Risk Study: Risk Quantification in a Connected World’, www.aon.com/
attachments/insurance-risk-study-aon-benfield.pdf.
Axco Insurance Markets Report (2007) Axco Insurance Markets Report, Taiwan: Non-Life (P&C).
Bichsel, F. (1960) ‘Une methode pour calculer une ristourne adequate pour annees sans sinistres’, ASTIN
Bulletin 1: 106–112.
Browne, M.J., Chung, J.W. and Frees, E.W. (2000) ‘International property-liability insurance consumption’,
Journal of Risk and Insurance 67(1): 73–90.
Buhlmann, H. (1964) ‘Optimale Pramienstufensysteme’, Mitteilungen der Vereinigung Schweizerischer
Versicherungsmathematiker 64: 193–213.
The Geneva Papers on Risk and Insurance—Issues and Practice
S22

Buhlmann, H. and Gisler, A. (2005) A Course in Credibility Theory and its Applications, Berlin: Springer-
Verlag.
Chui, A and Kwok, C. (2008) ‘National culture and life insurance consumption’, Journal of International
Business Studies 39(1): 88–101.
De Mooij, M. (1998) ‘Masculinity/feminity and consumer behaviour’, in G. Hofstede and Associates Editors
(eds.) Masculinity and Feminity, the Taboo Dimension of National Cultures, Thousand Oaks, CA: Sage
Publications, pp. 55–73.
Delaporte, P. (1965) ‘Tarification du risque individuel d’accidents d’automobiles par la prime modelee sur le
risque’, ASTIN Bulletin 3: 251–271.
Denuit, M. (1997) ‘A new distribution of Poisson-type for the number of claims’, ASTIN Bulletin 27:
229–242.
Derron, M. (1963) ‘A theoretical study of the no-claim bonus problem’, ASTIN Bulletin 3: 62–74.
Franckx, E. (1960) ‘Theorie du bonus’, ASTIN Bulletin 3: 113–122.
Gossiaux, A.-M. and Lemaire, J. (1981) ‘Methodes d’ajustement de distributions de sinistres’, Mitteilungen
der Vereinigung Schweizerischer Versicherungsmathematiker, 81: 87–95.
Hofstede, G. (2001) Culture’s Consequences: Comparing Values, Behaviors, Institutions, and Organizations
across Nations, 2nd edition, Thousand Oaks, CA: Sage Publications.
Johnson, P. (1985) ‘United Kingdom’, in J. Lemaire (ed.) Automobile Insurance: Actuarial Models, Boston,
MA: Kluwer Publishing, pp. 22–28.
Kwok, C.Y. and Tadesse, S. (2006) ‘National culture and financial systems’, Journal of International Business
Studies 37(2): 227–247.
La Porta, R., Lopez-de-Silanes, F., Schleifer, A. and Vishny, R.W. (1998) ‘Law and finance’, Journal of
Political Economy 106(6): 1113–1155.
Lemaire, J. (2004) ‘Bonus-malus systems’, in J. Teugels and B. Sundt (eds.) Encyclopedia of Actuarial
Science, Vol. 1, Chichester, West Sussex, UK: John Wiley and Sons, pp. 184–191.
Lemaire, J. and Zi, H. (1994) ‘A comparative analysis of 30 bonus-malus systems’, ASTIN Bulletin 24:
287–309.
Min, Y.T. (2006) A Note on Some Differences in English Law, New York Law, and Singapore Law, Singapore:
Singapore Academy of Law.
Posner, R. (2004) ‘Law and economics in common-law, civil-law, and developing nations’, Ratio Juris 17:
66–79.
Reynolds, T.H. and Flores, A.A. (1998) Foreign Law: Current Sources of Codes and Basic Legislation in
Jurisdictions of the World, Littleton, CO: Rothman.
Swiss Reinsurance Company (2006) ‘World insurance in 2005: Moderate premium growth, attractive
profitability’, Sigma 5: 1–40.
Syverud, K.D., Bovbjerg, R.R., Pottier, S.W. and Will, R.W. (1994) ‘On the demand for liability insurance:
Comments’, Texas Law Review 72: 1629–1702.
Willmot, G. (1986) ‘Mixed compound Poisson distributions’, ASTIN Bulletin 16-S: 59–79.
About the Authors
Sojung Carol Park is an Assistant Professor of Finance at California State University,Fullerton. She received her BA and MS in Industrial Engineering from Seoul NationalUniversity and PhD degree in RiskManagement and Insurance from theWharton School,University of Pennsylvania in 2009. Her current research interests focus on the areas ofcultural effect on insurance market, risk management in insurance industry, securitisedbonds, insurance company rating and market discipline, and insurance economics. She isan advisor for Gamma lota Sigma, the insurance student association, at CSUF.
Jean Lemaire is the Harry J. Loman Professor of Insurance and Actuarial Science andDirector of the Actuarial Science program at the Wharton School of the University of
Sojung C. Park et alIs the Design of BMS Influenced by Insurance Maturity or National Culture?
S23

Pennsylvania. He obtained his PhD in Applied Mathematics at the Free University ofBrussels. An Honorary Chairman of ASTIN, he is mostly known for his books onBonus-Malus Systems in Automobile Insurance, voted insurance book-of-the-yearboth in Europe and the USA.
Choong Tze Chua is an assistant professor of finance at Singapore ManagementUniversity. He obtained his PhD from The Wharton School at the University ofPennsylvania. His research interest includes yield curve models, empirical asset pricingand insurance. His work have appeared in publications such as Review of FinancialStudies, Journal of Financial and Quantitative Analysis, Journal of Banking and Finance,Journal of Financial Research and Journal of Fixed Income.
Appendix A
Alternate models
In this section we provide two alternative regression models: a model that excludesthe two countries (Kazakhstan and Philippines) with no BMS, and an OLS regressionusing the robust error option in Stata. The results demonstrate the robustness of ourconclusions. Countries with mature insurance market and low uncertainty avoidance,and Commonwealth countries, have tougher BMS. The effect of Commonwealth isstronger in less developed markets (Table A1).
Table A1 Alternative models
Variable (1) (2)
Without Kazakhstan and Philippines OLS model
Commonwealth 0.0742 0.0901
(1.57) (1.53)
Uncertainty avoidance �0.0015* �0.0015**(�1.85) (�2.20)
Maturity index 0.0421** 0.0455**
(2.40) (2.39)
(Maturity index�Commonwealth) �0.0615** �0.0668***(�2.64) (�3.26)
Asia �0.0319 �0.0437(�0.54) (�0.61)
Constant 0.2852*** 0.2791***
(4.39) (4.04)
Number of obs 28 30
LR chi2 14.63 11.98
Prob>chi2 0.0121 0.0000
R-square 0.4956
Joint test F-value for commonwealth and interaction 5.24** 6.03***
Note: t-statistics are in parentheses. *** significant at 1 per cent, ** significant at 5 per cent, * significant at
10 per cent.
The Geneva Papers on Risk and Insurance—Issues and Practice
S24

Hofstede’s other cultural variables
Hofstede15 provide four dimensions of national culture: individualism, uncertaintyavoidance, power distance and masculinity. We only included uncertainty avoidancein our models to test the hypothesis that milder BMS are preferred by high uncertaintyavoidance consumers, other things being equal. Indeed uncertainty avoidance is theonly measure introduced by Hofstede that relates to an insurance concern: riskaversion. However, it is possible that other cultural variables may influence BMSdesign, and omitted variable may bias estimates. Therefore, we run the same regressionmodels including Hofstede’s other cultural measures.
Table A2 demonstrates the robustness of our conclusions: the other culturalvariables are all statistically insignificant in all models; regression coefficients hardlychange after inclusion of other cultural variables. Therefore we conclude that only theuncertainty avoidance measure is associated with the toughness of bonus-malussystem. Omitting other cultural variables does not cause bias.
Table A2 Regression results with Hofstede’s other cultural variables
Regression variable (1) (2) (3) (4)
UA only UA and IND UA and MAS UA and PDI
Commonwealth 0.0974* 0.1051** 0.1072** 0.1054**
(2.01) (2.17) (2.16) (2.12)
Uncertainty avoidance �0.0017* �0.0018** �0.0014 �0.0015(�1.99) (�2.17) (�1.61) (�1.67)
Individualism �0.0015(�1.06)
Masculinity �0.0008(�0.77)
Power distance �0.0009(�0.66)
Maturity index 0.0478** 0.0509** 0.0499** 0.0434**
(2.61) (2.78) (2.72) (2.23)
(Maturity index� commonwealth) �0.0709** �0.0715*** �0.0676*** �0.0688***(�2.95) (�3.01) (�2.81) (�2.85)
Asia �0.0515 �0.1105 �0.0345 �0.0349(�0.83) (�1.33) (�0.53) (�0.53)
Constant 0.2831*** 0.3897*** 0.2941*** 0.3179***
(4.24) (3.23) (4.36) (3.74)
Number of obs 30 30 30 30
LR chi2 21.07 22.18 21.65 21.51
Prob>chi2 0.0008 0.0011 0.0014 0.0015
Note: t-statistics are in parentheses. *** significant at 1 per cent, ** significant at 5 per cent, * significant at
10 per cent.
Sojung C. Park et alIs the Design of BMS Influenced by Insurance Maturity or National Culture?
S25

Appendix B
See Table B1.
Table B1 Summary description of all BMSa
Country Levels Claim-free year Claim penalties
Bangladesh 50, 60, 70, 100, 130, 140,
150
To level 70 if in malus
zone; one-class discount
o.w.
To level 130 with one claim, 140
with two claims, 150 with three
claims
China 70, 80, 90, 100, 110, 120,
130
To level 90 if at 100 or
above; �1 in bonus zone
Independent of current level; to
level 100 if one or two claims, 110 if
three claims, 120 if four claims, 130
if five plus claims
Hong Kong 40, 50, 60, 70, 80, 100 One-class discount Three-class penalty with each claim
India 35, 50, 65, 80, 100, 110,
130, 150
One-class discount One-class penalty with any number
of claims
Indonesia 80, 85, 90, 95, 100 One-class discount Back to level 100 with any claim
Japan 40, 40, 40, 42, 42, 45, 45,
50, 50, 55, 60, 60, 70, 80,
90, 90, 100, 120, 130, 160
One-class discount Three-class penalty with each claim
Korea 40, 45, 50, 60, 70, 80, 90,
100, 110, 120, 130, 140,
150, 160, 170, 180, 190,
200
Discount given after
three consecutive claim-
free years; one-class
discount if at100 or
below, to 100 o.w.
Complicated system penalizing
accidents with points depending on
cost of accident, degree of injury,
and severity of traffic offense
Malaysia 45, 55, 61.68, 70, 75, 100 One-class discount Back to level 100 with any claim
Pakistan 66.67, 75, 80, 85, 90,
100, 110, 120, 130, 140
One-class discount if at
level 100 or below; to
level 100 if in malus zone
One claim: two-class penalty if in
bonus zone; to level 100 if at 90; to
110 o.w. two claims: to 90 if in best
class; to 100 if in bonus zone; to
120 o.w. three claims: to 100 if in
bonus zone; to 130 o.w. four
claims: to 100 if in bonus zone; to
140 o.w.
Singapore 50, 60, 70, 80, 90, 100 One-class discount Three-class penalty with each claim
Sri Lanka 30, 35, 40, 45, 55, 65, 75,
85, 100
One-class discount Three-class penalty if at level 30,
35, or 40; to 100 o.w.
Taiwan 40, 60, 80, 100, 120, 140,
160, 180, 200, 220, 240,
260
On the basis of total number of claims in past three years. Each
year without a claim: �1 point. One claim in past three years:
0 point; each claim thereafter: +1 point. Each negative point
decreases the premium by 20%, each positive point increases
the premium by 20%
The Geneva Papers on Risk and Insurance—Issues and Practice
S26

Table B1 (continued )
Country Levels Claim-free year Claim penalties
Thailand 50, 60, 70, 80, 100, 120,
130, 140, 150
One-class discount if
at 100 or below; to
100 o.w.
First claim: varying, one- or two-
class discount if in bonus zone; no
change o.w. Second claim: varying,
generally one additional class
penalty
Vietnam 80, 85, 90, 100 One-class discount Back to level 100 with any claim
aFor some complicated systems, this summary description is not sufficient to perform a Markov analysis.
Sojung C. Park et alIs the Design of BMS Influenced by Insurance Maturity or National Culture?
S27